Embed Size (px)
Citation preview

Monkfish Fishery Management Plan Annual Specifications for the
2006 Fishing Year
Incorporating Stock Assessment and Fishery Evaluation (SAFE) Report
for the 2004 Fishing Year and the
Environmental Assessment and Regulatory Impact Review
Prepared by New England Fishery Management Council
and Mid-Atlantic Fishery Management Council
in consultation with NOAA Fisheries Service
February 13, 2006 Rev. 3/10/06


TABLE OF ACRONYMS
A Adult life stage A13 Amendment 13 to the Multispecies FMP ALWTRP Atlantic Large Whale Take Reduction Plan APA Administrative Procedures Act ASMFC Atlantic States Marine Fisheries Commission CA I Closed Area I under the Multispecies FMP CA II Closed Area II under the Multispecies FMP DAM Dynamic Area Management DAS days-at-sea DMF Division of Marine Fisheries (Massachusetts) DMR Department of Marine Resources (Maine) DSEIS Draft Supplemental Environmental Impact Statement E Egg life stage EA Environmental Assessment EEZ exclusive economic zone EFH essential fish habitat EIS Environmental Impact Statement EPA Environmental Protection Agency ESA Endangered Species Act FMP fishery management plan FVTR Fishing vessel trip report FW Framework FW 13 Framework 13 to the Scallop FMP FY fishing year GB Georges Bank GOM Gulf of Maine GRT gross registered tons/tonnage HAPC habitat area of particular concern HCA Habitat Closed Area HPTRP Harbor Porpoise Take Reduction Plan IFQ individual fishing quota IWC International Whaling Commission J Juvenile life stage LOA letter of authorization MA Mid-Atlantic MAFMC Mid-Atlantic Fishery Management Council MMC Monkfish Monitoring Committee MMPA Marine Mammal Protection Act MPA marine protected area MSFCMA Magnuson-Stevens Fishery Conservation and Management Act MSMC Multispecies Monitoring Committee MSY maximum sustainable yield NAAA Northwest Atlantic Analysis Area NEFMC New England Fishery Management Council

NEFSC Northeast Fisheries Science Center NEPA National Environmental Policy Act NERO Northeast Regional Office NFMA Northern Fishery Management Area NLCA Nantucket Lightship Closed Area NMFS National Marine Fisheries Service NOAA National Oceanic and Atmospheric Administration OY optimum yield PBR Potential Biological Removal PRA Paperwork Reduction Act PREE Preliminary Regulatory Economic Evaluation RFA Regulatory Flexibility Act RMA Regulated Mesh Area RPA Reasonable and Prudent Alternatives SAFE Stock Assessment and Fishery Evaluation SARC Stock Assessment Review Committee SAW Stock Assessment Workshop SBNMS Stellwagen Bank National Marine Sanctuary SEIS Supplemental Environmental Impact Statement SFA Sustainable Fisheries Act SFMA Southern Fishery Management Area SIA Social Impact Assessment SMAST U. Mass. Dartmouth School of Marine Science and Technology SNE southern New England SNE/MA southern New England-Mid-Atlantic SSB spawning stock biomass TAC total allowable catch TED turtle excluder device USCG United States Coast Guard USFWS United States Fish and Wildlife Service USGS United States Geological Survey VMS vessel monitoring system VPA virtual population analysis VTR vessel trip report YPR yield per recruit
2006 Annual Adjustment and 2004 SAFE Report Monkfish FMP
i
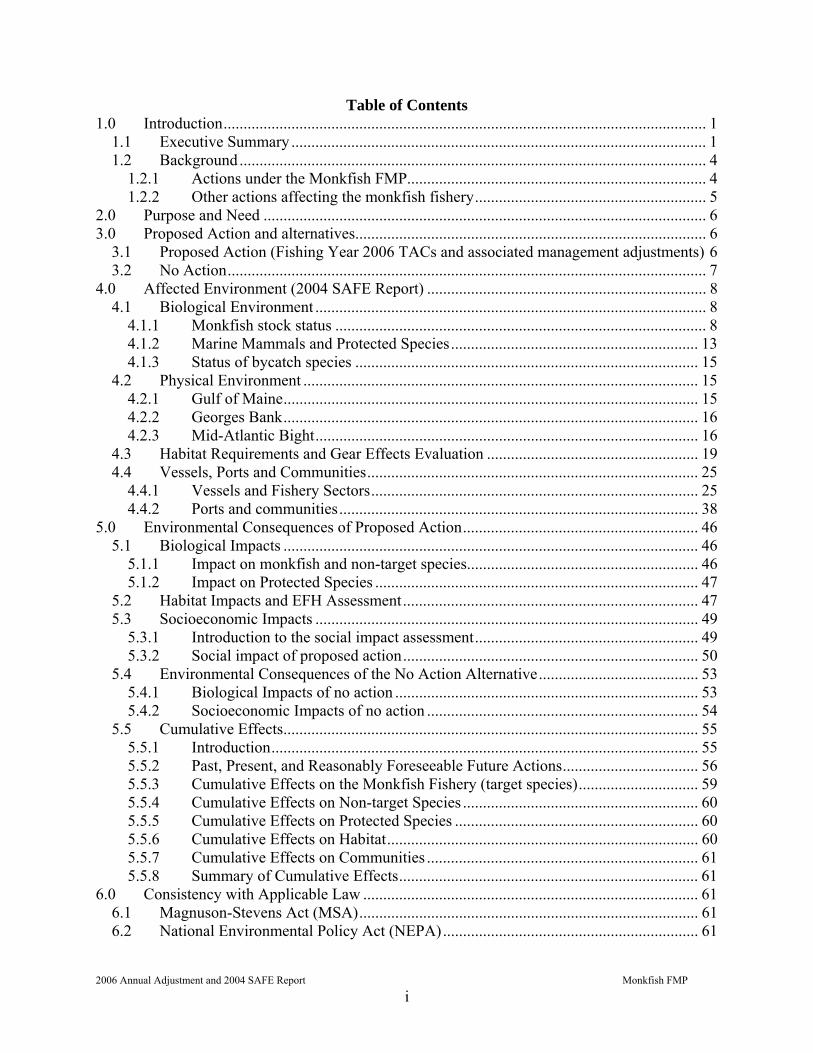
Table of Contents 1.0 Introduction......................................................................................................................... 1
1.1 Executive Summary ........................................................................................................ 1 1.2 Background..................................................................................................................... 4
1.2.1 Actions under the Monkfish FMP........................................................................... 4 1.2.2 Other actions affecting the monkfish fishery.......................................................... 5
2.0 Purpose and Need ............................................................................................................... 6 3.0 Proposed Action and alternatives........................................................................................ 6
3.1 Proposed Action (Fishing Year 2006 TACs and associated management adjustments) 6 3.2 No Action........................................................................................................................ 7
4.0 Affected Environment (2004 SAFE Report) ...................................................................... 8 4.1 Biological Environment .................................................................................................. 8
4.1.1 Monkfish stock status ............................................................................................. 8 4.1.2 Marine Mammals and Protected Species.............................................................. 13 4.1.3 Status of bycatch species ...................................................................................... 15
4.2 Physical Environment ................................................................................................... 15 4.2.1 Gulf of Maine........................................................................................................ 15 4.2.2 Georges Bank........................................................................................................ 16 4.2.3 Mid-Atlantic Bight................................................................................................ 16
4.3 Habitat Requirements and Gear Effects Evaluation ..................................................... 19 4.4 Vessels, Ports and Communities................................................................................... 25
4.4.1 Vessels and Fishery Sectors.................................................................................. 25 4.4.2 Ports and communities.......................................................................................... 38
5.0 Environmental Consequences of Proposed Action........................................................... 46 5.1 Biological Impacts ........................................................................................................ 46
5.1.1 Impact on monkfish and non-target species.......................................................... 46 5.1.2 Impact on Protected Species ................................................................................. 47
5.2 Habitat Impacts and EFH Assessment.......................................................................... 47 5.3 Socioeconomic Impacts ................................................................................................ 49
5.3.1 Introduction to the social impact assessment........................................................ 49 5.3.2 Social impact of proposed action.......................................................................... 50
5.4 Environmental Consequences of the No Action Alternative........................................ 53 5.4.1 Biological Impacts of no action ............................................................................ 53 5.4.2 Socioeconomic Impacts of no action .................................................................... 54
5.5 Cumulative Effects........................................................................................................ 55 5.5.1 Introduction........................................................................................................... 55 5.5.2 Past, Present, and Reasonably Foreseeable Future Actions.................................. 56 5.5.3 Cumulative Effects on the Monkfish Fishery (target species).............................. 59 5.5.4 Cumulative Effects on Non-target Species ........................................................... 60 5.5.5 Cumulative Effects on Protected Species ............................................................. 60 5.5.6 Cumulative Effects on Habitat.............................................................................. 60 5.5.7 Cumulative Effects on Communities .................................................................... 61 5.5.8 Summary of Cumulative Effects........................................................................... 61
6.0 Consistency with Applicable Law .................................................................................... 61 6.1 Magnuson-Stevens Act (MSA)..................................................................................... 61 6.2 National Environmental Policy Act (NEPA)................................................................ 61

2006 Annual Adjustment and 2004 SAFE Report Monkfish FMP
ii
6.2.1 Finding of No Significant Impact (FONSI Statement) ......................................... 61 6.3 Regulatory Impact Review and Initial Regulatory Flexibility Analysis (EO 12866 and RFA) 66
6.3.1 Determination of significance under E.O. 12866 ................................................. 66 6.3.2 Initial Regulatory Flexibility Analysis (IRFA)..................................................... 67
6.4 Endangered Species Act (ESA) .................................................................................... 72 6.5 Marine Mammal Protection Act (MMPA) ................................................................... 72 6.6 Paperwork Reduction Act (PRA).................................................................................. 73 6.7 Coastal Zone Management Act (CZMA) ..................................................................... 73 6.8 Data Quality Act (DQA)............................................................................................... 73 6.8 E.O. 13132 (Federalism)............................................................................................... 75 6.9 Administrative Procedure Act (APA)........................................................................... 76
7.0 References......................................................................................................................... 76 8.0 List of Preparers and Persons Consulted .......................................................................... 77
Appendix I Summary Report of the 40th Stock Assessment Workshop (SAW) Appendix II Description of listed Marine Mammals and Protected Species

2006 Annual Adjustment and 2004 SAFE Report Monkfish FMP
iii
Table of Figures Figure 1 Monkfish management areas and three-digit statistical areas .......................................... 3 Figure 2 - NFMA biomass index (2005 three-year running average) relative to annual rebuilding
targets.................................................................................................................................... 10 Figure 3 - SFMA biomass index (2005 three-year running average) relative to annual rebuilding
targets.................................................................................................................................... 10 Figure 4 NFMA Fall Survey Biomass indices 1963-2005............................................................ 11 Figure 5 NFMA Fall Survey Abundance indices 1963-2005 ....................................................... 11 Figure 6 SFMA Fall Survey Biomass indices 1963-2005 ............................................................ 12 Figure 7 SFMA Fall Survey Abundance indices 1963-2005........................................................ 12 Figure 8. Overlap of sediment types and fishery management areas in Monkfish FMP (Poppe et
al. 1989a and b)..................................................................................................................... 18 Figure 9 – EFH Designation for Juvenile Monkfish is highlighted in the shaded ten-minute
squares................................................................................................................................... 21 Figure 10 – EFH Designations for Adult Monkfish is highlighted in the shaded ten-minute
squares................................................................................................................................... 22 Figure 11 – EFH Designation for both Juvenile and Adult Monkfish combined is highlighted in
the shaded ten-minute squares .............................................................................................. 23 Figure 12 – Monkfish landings by management area, FY 1999 – 2003....................................... 29 Figure 13 Calendar year monkfish landings and revenues, 1982-2004........................................ 30 Figure 14 – FY2004 NFMA (a) and SFMA (b) monkfish landings by gear and month .............. 31 Figure 15 - NFMA (a) and SFMA (b) monkfish landings by gear, FY1999 – 2004.................... 32 Figure 16 - DAS used by permit category, FY 2001 – 2004. ...................................................... 38

2006 Annual Adjustment and 2004 SAFE Report Monkfish FMP
iv
Table of Tables Table 1 Calculation of 2006 target TACs. ...................................................................................... 6 Table 2 – Proposed action. FY 2006 target TACs, and SFMA trip limits and DAS adjustments.*7 Table 3 – No action. FY 2005 target TACs, SFMA trip limits and DAS (adjusted for research
DAS set-aside) carried over to FY 2006................................................................................. 7 Table 4 2000 – 2005 NMFS autumn bottom trawl survey indices of monkfish abundance and
biomass reference points......................................................................................................... 9 Table 5 Turtle Interactions in Gillnet Gear Targeting Monkfish, 2003-Sept 2005. ..................... 14 Table 6 – Number and Percent of monkfish limited access vessels also issued a limited access
permit in other fisheries in 2004, by permit category........................................................... 25 Table 7 – Monkfish open-access (Category E) permits issued each year since implementation of
the FMP in 1999.................................................................................................................... 26 Table 8 – Monkfish landings by area, gear and month for FY 2004 (converted to live weight).. 28 Table 9 – FY2004 monkfish landings from dealer reports, showing live weight and landed
weights. ................................................................................................................................. 29 Table 10 – Fishing year landings (in landed weights) and revenues, 1995 – 2004 ...................... 30 Table 11 – Monkfish landings by state (landed weight), FY 1995-2004 ..................................... 33 Table 12 – Monkfish landings as a percent of total landings by permit category, 1995-2004..... 34 Table 13 - Monkfish revenues as a percent of total revenues by permit category, 1995-2004. ... 34 Table 14 – Monkfish landings as a percent of total landings by vessel length category, 1995 -
2004....................................................................................................................................... 35 Table 15– Monkfish revenues as a percent of total revenues by vessel length category, 1995 –
2004....................................................................................................................................... 35 Table 16 – FY 1995-2004 Landings of monkfish and other species as a percent of total landings,
on vessels with a monkfish permit in 2001 – 2004............................................................... 36 Table 17 – FY 1995-2004 Revenues of monkfish and other species as a percent of total landings,
on vessels with a monkfish permit in 2001-2004. ................................................................ 36 Table 18 – Monkfish DAS usage, FY 2004.................................................................................. 37 Table 19 - Monkfish-only, Monkfish/Multispecies and Monkfish/Scallop DAS Usage by call-in
vessels (vessels fishing in the SFMA), FY 2004. ................................................................. 37 Table 20 – Monkfish permits by port, FY 2000 – 2004. .............................................................. 41 Table 21 – Preliminary FY2004 monkfish landings by primary port (excluding Long
Beach/Barnegat Light, NJ) and State, by gear...................................................................... 42 Table 22 – Monkfish landings and revenues for monkfish primary ports, FY 1995 – 2004, and
principal port, FY 2004......................................................................................................... 43 Table 23 - Monkfish landings and revenues for monkfish secondary and other ports, FY 1995 –
2004, and principal port, FY 2004. ....................................................................................... 44 Table 24 - Monkfish Revenues, FY 1995-2004, as a Percentage of Total Revenues by Port...... 45 Table 25 – Proposed action. FY 2006 target TACs, and SFMA trip limits and DAS adjustments.
............................................................................................................................................... 48 Table 26 - No action. FY 2005 target TACs, SFMA trip limits and DAS (adjusted for research
DAS set-aside) carried over to FY 2006............................................................................... 48 Table 27 Vessels Landing Monkfish Exclusively from the SFMA by Homeport........................ 51 Table 28 Vessels Landing Monkfish from Both Management Areas by Homeport .................... 52 Table 29 Average per Trip Return to Vessels by Home Port (60/40 Lay System) ...................... 52

2006 Annual Adjustment and 2004 SAFE Report Monkfish FMP
v
Table 30 Average per Trip Net Pay per Crew Member by Home Port (60/40 Lay System)........ 53 Table 31 Average Per Trip Return to Vessels by Home Port State (60/40 Lay System) ............. 70 Table 32 Average Per Trip Net Pay per Crew Member by Home Port State (60/40 Lay System)
............................................................................................................................................... 70 Table 33 Relative Change in Vessel Net Return and Change in Average Net Pay to Crew for
Vessels Landing Monkfish from Both Management Areas.................................................. 72 Table 34 Relative Change in Vessel Net Return and Change in Average Net Pay to Crew for
Vessels Landing Monkfish Exclusively from the SFMA..................................................... 72

2006 Annual Adjustment and 2004 SAFE Report Monkfish FMP
vi

2006 Annual Adjustment and 2004 SAFE Report Monkfish FMP
1
1.0 Introduction
1.1 Executive Summary The monkfish fishery is jointly managed by the New England Fishery Management Council (NEFMC) and the Mid-Atlantic Fishery Management Council (MAFMC), with the NEFMC having the administrative lead. The fishery extends from Maine to North Carolina out to the continental margin. The Councils manage the fishery as two stocks, with the Northern Fishery Management Area (NFMA) covering the Gulf of Maine and northern part of Georges Bank, and the Southern Fishery Management Area (SFMA) extending from the southern flank of Georges Bank through the Mid-Atlantic Bight to North Carolina (see Figure 1). The Councils adopted a rebuilding plan for monkfish in 1999, subsequently modified and amended to include an annual measure of the status of the stocks and adjustment to management measures as needed to maintain a 10-year rebuilding schedule. This Environmental Assessment (EA) presents the analysis of impacts of the annual adjustment to the monkfish fishery management measures for the 2006 fishing year (FY) (May 1, 2006, through April 30, 2007) under the stock-rebuilding program implemented in Framework Adjustment 2 to the Monkfish Fishery Management Plan (FMP). The adjustment method adopted in Framework 2 (see Section 1.2.1.1, below) is based on a calculation of annual catch targets and associated trip limits and days-at-sea (DAS) allocations. No formal action is required by the Councils, since the calculations are prescribed in the FMP regulations. The proposed action would set target total allowable catch levels (TACs) at 7,737 mt and 3,667 mt for the NFMA and SFMA, respectively, and make the calculated adjustments to SFMA trip limits and DAS (see Section 3.1). The non-preferred, no-action alternative, pursuant to the regulations would be to continue the current TACs and associated management measures (see Section 3.2). There are no other non-preferred alternatives. This action does not propose any changes to the management measures for limited access monkfish vessels fishing in the NFMA to achieve the proposed target TAC for FY 2006. Currently, limited access monkfish vessels fishing exclusively in the NFMA are not subject to a monkfish trip limit when fishing under either a monkfish or a Northeast (NE) multispecies DAS. It is unlikely that vessels fishing in the NFMA would exceed the proposed target TAC given the three-year declining trend in monkfish landings and recent reduction in NE multispecies DAS allocations under Amendment 13, and measures proposed in Framework 42 to the NE Multispecies FMP which are expected to further constrain monkfish landings. If changes to the management measures were required for the NFMA to prevent the target TAC for that area from being exceeded, a separate regulatory action would be required since changes to management measures in the NFMA are currently not authorized under the annual adjustment procedures specified under 50 CFR 648.96(b). If such changes become necessary, the NEFMC will take action in Monkfish Framework 4, proposed and in development for the start of the 2007 fishing year. For the SFMA, this action proposes to reduce the monkfish trip limit for vessels fishing on a monkfish DAS to 550 or 450 lbs. (tail weight) per DAS, depending on a vessel’s permit

2006 Annual Adjustment and 2004 SAFE Report Monkfish FMP
2
category. Additionally, the number of monkfish DAS that limited access monkfish vessels can use in the SFMA would be reduced from 40 to 12, plus up to 10 carry-over DAS (unused DAS from the previous year). Framework 2 included a provision that states if the target TAC for the SFMA is below a target TAC that would result in trip limits below 550 lb tail weight per DAS for Category A, C and G vessels, and 450 lb tail weight per DAS for Category B, D and H vessels (approximately 8,000 mt), then the trip limits would be fixed at those levels and the DAS available for vessels fishing in the SFMA would be reduced based upon the method outlined in the regulations at § 648.96(b)(2)(iii). This provision was included in Framework 2 to address the concern that, if the target TAC dropped below the 8,000 mt level, which is approximately the same target TAC established for FY 2002, the resulting trip limits would be comparable to the incidental catch limits on some vessels, effectively eliminating the directed monkfish fishery. The proposed action, which would implement a reduction in directed monkfish fishing effort for FY2006 will have positive impact on the monkfish resource, and reduce incidental catch of other species in the monkfish fishery. Furthermore, the reduced level of monkfish effort is likely to have a neutral or slightly positive impact on habitat and reduce the likelihood of interactions with protected species. On the other hand, the reduction in monkfish fishing opportunity during FY2006 is likely to have a negative effect on vessels, their crew and communities due to the reduced revenues derived from the monkfish fishery. The degree of socioeconomic impact is proportional to the level of dependence on the monkfish fishery relative to the overall annual income from all fisheries in which such vessels or communities depend. Over the long term, however, vessels and communities with greater dependence on the directed monkfish fishery will realize the greatest benefit from the rebuilding of the stocks and the increase in annual yield. The environmental consequences of the proposed action, as well as the no-action alternative are analyzed and discussed in Section 5.0.

2006 Annual Adjustment and 2004 SAFE Report Monkfish FMP
3
Figure 1 Monkfish management areas and three-digit statistical areas

2006 Annual Adjustment and 2004 SAFE Report Monkfish FMP
4
1.2 Background
1.2.1 Actions under the Monkfish FMP
1.2.1.1 Framework 2 – annual adjustment procedure The proposed annual adjustment is based on a procedure adopted in Framework 2. Framework 2, which became effective on May 1, 2003 (68 FR 22325, April 28, 2003), implemented a target total allowable catch (TAC) setting method that is based upon the relationship between the 3-year running average of the National Marine Fisheries Service’s (NOAA Fisheries) fall trawl survey biomass index (3-year average biomass index) and established annual biomass index targets (annual index target). The annual index targets are based on 10 equal increments between the 1999 biomass index (the start of the rebuilding program) and the biomass target (Btarget), which is to be achieved by 2009 according the rebuilding plan established in the FMP. According to this target TAC setting method, annual target TACs are set based on the ratio of the observed biomass index to the annual index target applied to the monkfish landings for the previous fishing year. Framework 2 also adopted a simulation method for calculating SFMA trip limits and DAS restrictions based on the target TAC and the observed monkfish catch by vessels fishing in that area. To estimate landings in the SFMA by permit categories AC and BD, the distribution of reported landings from fishing vessel trip reports (FVTR’s) in the previous year in the SFMA is modified under a series of proposed daily landing limits. Total landings are recalculated based upon each new distribution. To estimate the landings under a given daily limit, all trips with a daily average below the simulated limit are assumed to have remained static, while all trips with a daily landings average greater than the simulated new limit have their average daily landings scaled down to the proposed limit. For example, to estimate the landings under a 700 lb. tail weight per DAS limit, all trips with a daily average for a given trip below 700 lbs. are assumed unchanged, while all trips with a daily average greater than 700 lbs. have that average scaled down to 700 lbs. Framework 2 removed the original FMP provisions that would have resulted in default measures for Year 4 of the rebuilding program eliminating the directed fishery. The framework replaced that provision with a set of rules stating that if the SFMA TAC needed to be reduced below 8,000 mt, the trip limits on directed monkfish trips would be fixed at 550 and 450 lbs. (tail weight) per monkfish DAS, and any further effort reductions would be taken from the DAS available to vessels for fishing in the SFMA. Since the FY2006 TAC for the SFMA is below that threshold, the regulations require DAS available to vessels fishing in that area be reduced. The number of days at sea spent on a trip was calculated by subtracting the date sailed from the date landed on the FVTR and rounding any fractional days up to the next integer. In FY2004 the DAS allocation was 28 DAS plus any carryover. In this analysis, landings were assumed to be at a constant rate per day. The landings at any DAS level for each vessel were calculated by either including all landings if the vessel used fewer days than the proposed DAS level, or reducing the landings by an amount proportionate to the days exceeding the DAS level. For example, if a
2006 Annual Adjustment and 2004 SAFE Report Monkfish FMP
5
vessel landed 1,000 in 30 days of fishing, the calculated landings for 15 days would be 500 pounds. The resulting range of estimated landings was fit with a loglinear function. This empirical function was then used to solve for the target DAS limit that would result in the desired target TAC. The analysis is reported in greater detail in Appendix I.
1.2.1.2 Amendment 2 to the Monkfish FMP The Councils adopted Amendment 2 to the Monkfish FMP in 2005 (70 Federal Register 21927, April 28, 2005). Amendment 2 contained a number of measures that the Councils developed to address essential fish habitat (EFH) and bycatch issues, as well as several issues raised during the public scoping process. Amendment 2 did not modify the stock rebuilding program adopted in Framework 2, nor did it modify the effort control program except for the effect of the Research DAS set-aside program. This program reduced each permitted vessel’s DAS allocation by 0.7 DAS to create a pool of 500 DAS that can be used to help defray the costs of cooperative monkfish research projects. Therefore, the actual number of baseline DAS (unless modified by the annual adjustment procedure) is 39.3 DAS, rather than the 40 DAS established by the FMP. Other than this modification, the rebuilding program remains as established by Framework 2. Amendment 2 also created three new permit categories. Category F permits are issued in any year a vessel enrolls in the Offshore Fishery Program. Such vessels are allocated monkfish DAS based on the number of DAS available to limited access monkfish vessels fishing in the SFMA multiplied by the ratio of the applicable trip limit over 1,600 lb. (tail weight) per DAS. Category G and H permits are issued for vessels that qualified under Amendment 2 for a limited access permit allowing such vessels to fish only south of 38°20’. Categories G and H vessels are given the same trip limits and DAS as Category A and B vessels, respectively.
1.2.2 Other actions affecting the monkfish fishery Both Multispecies and Sea Scallop fisheries have undergone a series of major actions since 1994 to reduce fishing effort and rebuild overfished stocks. Most recently, Multispecies Amendment 13, and Frameworks 40A, 40B, and 41 have resulted in substantial reductions in overall multispecies effort, including effort on those multispecies vessels targeting monkfish. Most recently, the NEFMC has approved Multispecies Framework 42 which could impose additional restrictions on multispecies fishing effort and incorporates Monkfish Framework 3 which will prohibit Monkfish Category C and D vessels from targeting monkfish on a Multispecies B-regular DAS. While some multispecies stocks, such as haddock, redfish and witch flounder have responded positively, other stocks, particularly cod and yellowtail flounder remain species of concern, in need of additional conservation restrictions. The scallop resource has responded positively to management measures adopted over the past decade. In particular, Amendment 10 to the Scallop FMP introduced rotational area management and adopted several measures to minimize impacts of the fishery on EFH. Subsequent framework adjustments have modified the management program to improve administration, increase yield-per-recruit, promote safety and minimize bycatch, as well as set the rotational management program measures through the 2007 fishing year. In large part due to the success of the scallop FMP and the profitability of the fishery, scallop vessels that also have monkfish limited access permits (and would be required to use a scallop DAS to target monkfish) elect to use their allocated effort to target scallops rather than monkfish. As a result, a substantial portion

2006 Annual Adjustment and 2004 SAFE Report Monkfish FMP
6
of the allocated monkfish effort is not used. Cumulatively, these actions, in both multispecies and scallop fisheries have likely had a positive effect on reducing effort in monkfish fisheries.
2.0 Purpose and Need As described in Section 1.0, Framework 2 established a streamlined annual target TAC setting process that is based on the ratio of the current 3-year average biomass index to the annual index target applied to monkfish landings for the previous fishing year. Once the target TACs are determined, trip limits and DAS are adjusted as necessary based upon a standard set of procedures that were established in Framework 2. Since the stock rebuilding program implemented in Framework 2 is based on established formulas for calculating TACs, trip limits and DAS restrictions, the Councils had no discretion to evaluate alternatives relative to this program for FY 2006. The purpose of the proposed action is to establish target monkfish TACs, and associated trip limits and DAS restrictions for the 2006 fishing year in accordance with the annual target TAC setting, and trip limit and DAS adjustment methods established in Framework Adjustment 2. The proposed action is needed to comply with the rebuilding plan established in the FMP and modified in Framework 2 to the FMP. The plan is necessary to eliminate overfishing and rebuild the monkfish resource in accordance with Magnuson-Stevens Fishery Conservation and Management Act requirements.
3.0 Proposed Action and alternatives The following describes the proposed action and the no action alternative.
3.1 Proposed Action (Fishing Year 2006 TACs and associated management adjustments) The Monkfish Monitoring Committee reviewed the 2005 fall trawl survey biomass indices and monkfish landings for FY 2004, and calculated the target TACs for FY 2006 in accordance with the procedures established in the regulations (50 CFR 648.96(b)(1)), see Section 1.2.1.1. According to these procedures, if the current 3-year average biomass index is below the annual index target, then the target TAC for the upcoming fishing year is set equal to the monkfish landings for the previous fishing year, minus the percentage difference between the 3-year average biomass index and the annual index target. Thus, based on the information presented in Table 1, the proposed FY 2006 target TAC for the Northern Fishery Management Area (NFMA) is 7,737 mt, and the proposed FY 2005 target TAC for the Southern Fishery Management Area (SFMA) is 3,667 mt. A map of these management areas is provided in Figure 1.
Manageme
nt Area
FY 2004
Landings (mt)
2005
3-year Ave. (kg/tow)
2005
Biomass Target
(kg/tow)
% Reduction (Target - Avg)/Target
Landings Reduction
(mt)
2006
Target TAC (mt)
NFMA
11,666
1.214
1.83 0.337 3,929 7,737
SFMA
6,078
0.778
1.29 0.397 2,411 3,667
Table 1 Calculation of 2006 target TACs.

2006 Annual Adjustment and 2004 SAFE Report Monkfish FMP
7
The MMC also calculated the corresponding SFMA trip limits and DAS based on the procedure prescribed in the regulations and described above in Section 1.2.1.1. The NFMA is not included in this calculation because, according the to the FMP, vessels fishing on a monkfish DAS, and Category C and D vessels on a multispecies DAS do not have a monkfish trip limit. The proposed action would set SFMA DAS and trip limits as described below in Table 2. Note that allocated monkfish DAS are reduced by 0.7 DAS from the amount calculated to achieve the target TAC because of the contribution each vessel makes to the research DAS set-aside program adopted in Amendment 2 establishing a pool of 500 monkfish DAS for cooperative research. The report on the calculation of SFMA DAS and trip limits is provided in Appendix I.
Management
Area
2006 Target
TAC (mt)
Trip Limits
(lb. tail wt./DAS) DAS
NFMA 7,737
NA 39.3
SFMA 3,667
Permit Categories A, C & G: 550 Permit Categories B, D & H: 450
Permit Category F: 1,600
1212
4.1 or 3.4
Table 2 – Proposed action. FY 2006 target TACs, and SFMA trip limits and DAS adjustments.* * (Permit Categories G, H and F were added in FY2005 through Amendment 2. G & H vessels fish only south of 38°20’N, and Category F vessels are enrolled in the SFMA Offshore Fishery Program and receive a DAS allocation based on the ratio of the 1,600 lb. to the trip limit for their standard permit, Category A & C, or B & D.)
3.2 No Action The regulations at §648.96 (b)(1) state that “If the action is submitted after January 7, then the target TACs and associated management measures for the prior fishing year shall remain in place until new target TACs are implemented.” Thus, if no revisions to the TACs, trip limits or DAS are submitted, the FY 2005 measures would be as shown below in Table 3. Note that allocated monkfish DAS are 0.7 less than the baseline because of the contribution each vessel makes to the research DAS set-aside program adopted in Amendment 2 establishing a pool of 500 monkfish DAS for cooperative research.
Management
Area
2005 Target
TAC (mt)
Trip Limits
(lb. tail wt./DAS) DAS
NFMA
13,160
NA 39.3
SFMA
9,673
Permit Categories A, C & G: 700 Permit Categories B, D & H: 600
Permit Category F: 1,600
39.3 39.3
17.2 or 14.7
Table 3 – No action. FY 2005 target TACs, SFMA trip limits and DAS (adjusted for research DAS set-aside) carried over to FY 2006.
2006 Annual Adjustment and 2004 SAFE Report Monkfish FMP
8
4.0 Affected Environment (2004 SAFE Report) A map showing the area covered by the monkfish FMP, including the NFMA and SFMA boundary and three-digit statistical areas is provided in Figure 1 for reference. The Council prepares annually a Stock Assessment and Fishery Evaluation (SAFE) Report that contains updated information on the resource status and human environment. Since this section of the annual adjustment also contains the same information, it will serve as the SAFE Report for the 2004 fishing year. The 2004 fishing year is the most recent year for which complete information is available.
4.1 Biological Environment This section supplements and updates the biological environment described in the FSEIS for Amendment 2.
4.1.1 Monkfish stock status
4.1.1.1 Stock Assessment (SAW 40) The Northeast Fisheries Science Center (NEFSC) held a monkfish stock assessment in the fall of 2004 (SAW 40). The data used in the 2004 assessment included NEFSC research survey data, data from the 2001 and 2004 Cooperative Monkfish Surveys, commercial fishery data from vessel trip reports, dealer landings records, and observer data. In summary, the Stock Assessment Review Committee concluded:
Based on existing reference points, the resource is not overfished in either stock management area (north or south). Fishing mortality rates (F) estimated from NEFSC and Cooperative survey data are currently not sufficiently reliable for evaluation of F with respect to the reference points.
With respect to recruitment, the report noted evidence of increased recruitment in the NFMA during the 1990s, particularly for the 1999 year class. Conversely, the SAW 40 report noted that in the SFMA, recruitment appears to have fluctuated without trend during the 1990s. However, there are some indications that the 2002 year class in the SFMA may be above average. In regards to estimates of stock biomass, the SAW 40 report noted that the 3-year moving average (2001-2003) of the survey index was above Bthreshold in the NFMA and equivalent to Bthreshold in the SFMA. Due to the timing of data availability, the assessment was not able to use 2004 cooperative survey trawl efficiency analysis to calculate swept area biomass estimates. Assuming intermediate trawl efficiencies from the 2001 cooperative survey, however, and 2004 nominal tow distances, swept area biomass estimates for the NFMA from the 2004 cooperative survey were 25-percent less than the 2001 cooperative swept area biomass estimates for this survey, while swept area biomass estimates for the SFMA from the 2004 cooperative survey were 66-percent higher than the 2001 estimates.

2006 Annual Adjustment and 2004 SAFE Report Monkfish FMP
9
4.1.1.2 2005 Fall Survey Results The FMP uses the NMFS fall bottom trawl survey to determine monkfish stock status (biomass) relative to management reference points. To smooth out year-to-year variability in the survey, a three-year running average is used to evaluate the stock against the MSY proxy target, and minimum biomass reference points. As shown in Table 4 both northern and southern stock components are below the minimum biomass threshold, and are, therefore, overfished. This is a change of status from 2004 when both stocks were not overfished.
kg/tow 2000 2001 2002 2003 2004 2005 3-yr. Ave. Bthreshold Btarget
NFMA 2.495 2.052 2.103 1.925 0.638 1.078 1.214 1.25 2.5SFMA 0.477 0.708 1.253 0.828 0.742 0.765 0.778 0.93 1.86
Table 4 2000 – 2005 NMFS autumn bottom trawl survey indices of monkfish abundance and biomass reference points. Framework 2, adopted in 2003, established a method for evaluating on an annual basis the rebuilding progress of the fishery. That method compares the three-year running average of the biomass index to annual biomass targets which are ten equal increments between the 1999 observed value (at the start of the 10-year rebuilding program) and the 2009 target (Btarget). The relationship of the observed 3-year average to the annual target value is applied to the previous year’s landings to set target TACs for the upcoming year. The annual targets and the 1999-2005 observed values are shown in Figure 2 and Figure 3 for the NFMA and SFMA, respectively. The northern and southern stocks are approximately 34% and 40% below their 2005 targets.

2006 Annual Adjustment and 2004 SAFE Report Monkfish FMP
10
NFMA Biomass Rebuilding
0.820.99
1.161.33
1.491.66
1.832.00
2.162.33
2.50
0.000
0.500
1.000
1.500
2.000
2.500
3.000
1999 2000 2001 2002 2003 2004 2005 2006 2007 2008 2009
Kg.
/Tow
Annual B Target
Btarget
Bthreshold
Observed 3-yr. Ave.
Figure 2 - NFMA biomass index (2005 three-year running average) relative to annual rebuilding targets.
SFMA Biomass Rebuilding
0.47
0.60
0.74
0.88
1.02
1.15
1.29
1.43
1.57
1.71
1.85
0.000
0.200
0.400
0.600
0.800
1.000
1.200
1.400
1.600
1.800
2.000
1999 2000 2001 2002 2003 2004 2005 2006 2007 2008 2009
Kg.
/Tow
Annual B TargetBtargetBthresholdObserved 3-yr. Ave.
Figure 3 - SFMA biomass index (2005 three-year running average) relative to annual rebuilding targets.
2006 Annual Adjustment and 2004 SAFE Report Monkfish FMP
11
Year
1960 1965 1970 1975 1980 1985 1990 1995 2000 2005
Stra
tifie
d M
ean
Wei
ght p
er T
ow (k
g)
0
2
4
6
8
10
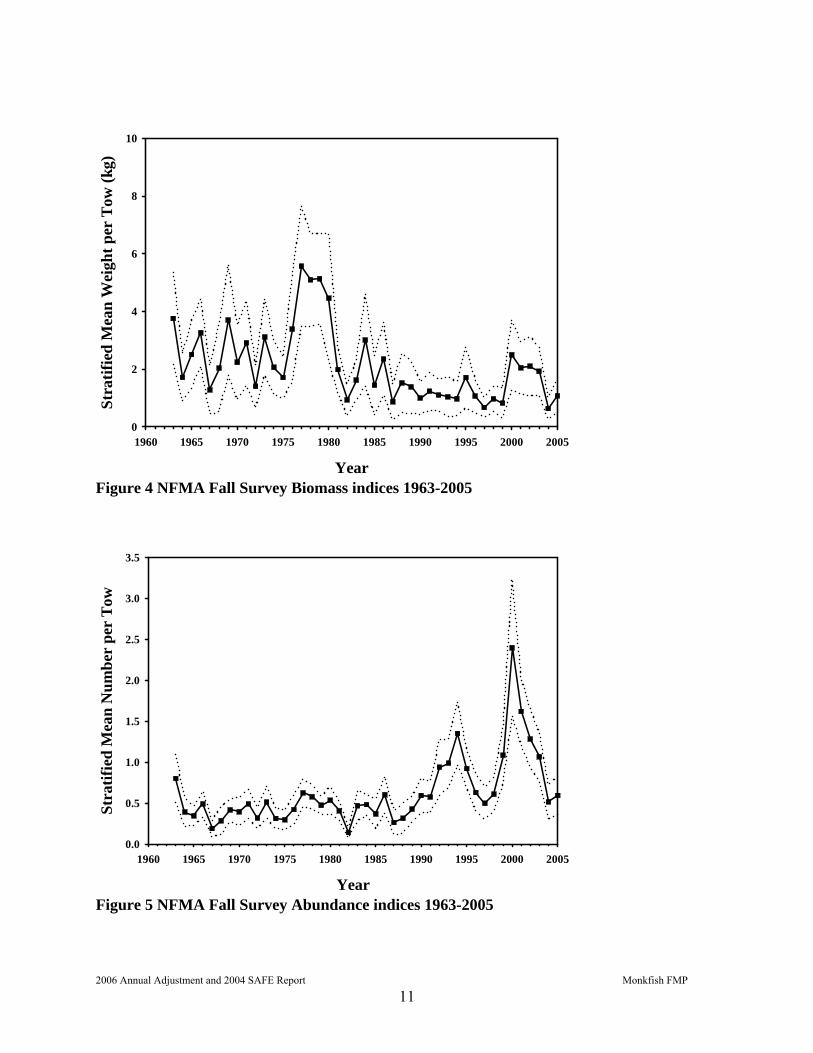
Figure 4 NFMA Fall Survey Biomass indices 1963-2005
Year
1960 1965 1970 1975 1980 1985 1990 1995 2000 2005
Stra
tifie
d M
ean
Num
ber
per
Tow
0.0
0.5
1.0
1.5
2.0
2.5
3.0
3.5
Figure 5 NFMA Fall Survey Abundance indices 1963-2005

2006 Annual Adjustment and 2004 SAFE Report Monkfish FMP
12
Year
1960 1965 1970 1975 1980 1985 1990 1995 2000 2005
Stra
tifie
d M
ean
Wei
ght p
er T
ow (k
g)
0
2
4
6
8
10
Figure 6 SFMA Fall Survey Biomass indices 1963-2005
Year
1960 1965 1970 1975 1980 1985 1990 1995 2000 2005
Stra
tifie
d M
ean
Num
ber
per
Tow
0
1
2
3
4
5
6
7
Figure 7 SFMA Fall Survey Abundance indices 1963-2005

2006 Annual Adjustment and 2004 SAFE Report Monkfish FMP
13
4.1.2 Marine Mammals and Protected Species The following protected species are found in the environment utilized by the monkfish fishery. A number of them are listed under the Endangered Species Act of 1973 (ESA) as endangered or threatened, while others are identified as protected under the Marine Mammal Protection Act of 1972 (MMPA). Two right whale critical habitat designations are located in the area in which the monkfish fishery is prosecuted. While a list of the species is included in this document, the information provided here is summary of the full descriptions provided in the Amendment 2 Final Supplemental Environmental Impact Statement. Cetaceans Status Northern right whale (Eubalaena glacialis) Endangered Humpback whale (Megaptera novaeangliae) Endangered Fin whale (Balaenoptera physalus) Endangered Blue whale (Balaenoptera musculus) Endangered Sei whale (Balaenoptera borealis) Endangered Sperm whale (Physeter macrocephalus) Endangered Minke whale (Balaenoptera acutorostrata) Protected Harbor porpoise (Phocoena phocoena) Protected Risso’s dolphin (Grampus griseus) Protected Pilot whale (Globicephala spp.) Protected White-sided dolphin (Lagenorhynchus acutus) Protected Common dolphin (Delphinus delphis) Protected Bottlenose dolphin: coastal stocks (Tursiops truncatus) Protected Seals Harbor seal (Phoca vitulina) Protected Gray seal (Halichoerus grypus) Protected Harp seal (Phoca groenlandica) Protected Sea Turtles Leatherback sea turtle (Dermochelys coriacea) Endangered Kemp’s ridley sea turtle (Lepidochelys kempii) Endangered Green sea turtle (Chelonia mydas) Endangered Hawksbill sea turtle (Eretmochelys imbricata) Endangered Loggerhead sea turtle (Caretta caretta) Threatened Fish Shortnose sturgeon (Acipenser brevirostrum) Endangered Atlantic salmon (Salmo salar) Endangered Critical Habitat Designations Right whale Cape Cod Bay Great South Channel

2006 Annual Adjustment and 2004 SAFE Report Monkfish FMP
14
Although all of the protected species listed above may be found in the general geographical area covered by the Monkfish FMP, not all are affected by the fishery. Some species may inhabit areas other than those in which the fishery is prosecuted, prefer a different depth or temperature zone, or may migrate through the area at times when the fishery is not in operation. In addition, certain protected species may not be vulnerable to capture or entanglement with the gear used in the fishery. Therefore, protected species are divided into two groups, one of which contains those species not likely to be affected by the monkfish fishery while the second group is the subject of a more detailed assessment in Amendment 2. The updated status of the marine mammals on this list is discussed in U.S. Atlantic and Gulf of Mexico marine mammal stock assessments - 2003 (Waring, et al., 2003). Since completion of the FSEIS for Amendment 2, NOAA Fisheries has proposed modifying the rules protecting sea turtles in the large-mesh gillnet fishery off the North Carolina/Virginia coast. Gillnet gear is the most prevalent gear used in the SFMA monkfish fishery. On December 3, 2002, the agency published a final rule (67 Federal Register 71895) establishing seasonally adjusted gear restrictions by closing portions of the mid-Atlantic EEZ waters to fishing with large-mesh (>8”) to protect migrating sea turtles, following an interim final rule published March 21 that year. The basis of this rule was that sea turtles migrate northward as water temperatures warmed. At the time the interim and final rules were published, there was no evidence that the primary fishery involved – monkfish – was being prosecuted in state waters. In 2002, when most monkfish fishermen were not permitted under the FMP to fish in the EEZ and the rest were faced with the sea turtle closures, the proportion of North Carolina monkfish landings from state waters increased five-fold to 92%, posing an unforeseen risk to migrating sea turtles since they were not protected in state waters. In response, NOAA Fisheries is currently proposing to extend the closures into North Carolina state waters (proposed rule published 69 Federal Register 65127, November 10, 2004, comment period ended February 8, 2005), and a final rule is under agency review. The following table, Table 5, provides the most recent information on observed turtle interactions with the monkfish fishery for the period 2003 – Sept. 2005. The data has not been analyzed with respect to trends or impact of effort controls and/or sea turtle closures. Year Month Species Statistical
Area Gear Type
2003 August Unknown 537 Sink gillnet 2003 August Unknown 537 Sink gillnet 2003 August Unknown 537 Sink gillnet 2004 May Loggerhead 621 Sink gillnet 2004 June Loggerhead 612 Sink gillnet 2004 October Leatherback 615 Sink gillnet 2004 November Leatherback 613 Sink gillnet Table 5 Turtle Interactions in Gillnet Gear Targeting Monkfish, 2003-Sept 2005. Source: NEFSC Observer Data Other than the sea turtle closure expansion described above, there have been no significant changes to the rules governing protected species interactions. Any future changes, such as

2006 Annual Adjustment and 2004 SAFE Report Monkfish FMP
15
modifications to the Atlantic Large Whale Take Reduction Plan (ALWTRP), will be discussed in any subsequent monkfish management action or future SAFE Report.
4.1.3 Status of bycatch species Information about the absolute level of bycatch species in the directed monkfish fishery is not available, according to the EIS for Amendment 2. Nevertheless, Amendment 2 stated that winter skates and dogfish are the predominant species discarded in the NFMA monkfish fisheries, while winter and thorny skates, as well as dogfish are discarded in the SFMA. The status of these three species is summarized below based on the Q4 2005 Status of Stocks Report (NOAA/NMFS):
• Winter skate – not overfished, overfishing not occurring • Thorny skate – overfished, overfishing is not occurring, rebuilding • Spiny dogfish – no minimum biomass threshold adopted in the FMP but based on
NMFS’ recommended threshold, the stock would be considered overfished; overfishing is not occurring.
4.2 Physical Environment The following sections summarize the physical environment of the monkfish fishery. A full description of the physical environment is provided in Section 5.2 of the FSEIS prepared for Amendment 2 to the FMP. The NFMA comprises the Gulf of Maine and most of Georges Bank, while the SFMA extends from the southern edge of Georges Bank through the Mid-Atlantic Bight (see Figure 1). As noted in the following discussion, the NFMA has a diverse physical geography consisting of shoal areas on Georges Bank and numerous rocky banks and basins of the Gulf of Maine, reflecting the influence of glaciation and post-glacial rise of sea level. The SFMA is characterized by the predominantly sandy continental shelf, and 12 deep-water canyons along the edge of the shelf. Figure 8 shows the sediment types in the Northeast, overlayed with the monkfish management areas.
4.2.1 Gulf of Maine The Gulf of Maine (GOM) is characterized by a system of deep basins, moraines and rocky protrusions with limited access to the open ocean. The GOM is topographically unlike any other part of the continental border along the U.S. Atlantic coast. The GOM’s geologic features, when coupled with the vertical variation in water properties, result in a great diversity of habitat types. It contains twenty-one distinct basins separated by ridges, banks, and swells. Bedrock is the predominant substrate along the western edge of the GOM north of Cape Cod in a narrow band out to a depth of about 60 m. Rocky areas become less common with increasing depth, but some rock outcrops poke through the mud covering the deeper sea floor. Mud is the second most common substrate on the inner continental shelf. Mud predominates in coastal valleys and basins that often abruptly border rocky substrates. Many of these basins extend without interruption into deeper water. Gravel, often mixed with shell, is common adjacent to bedrock outcrops and in fractures in the rock. Large expanses of gravel are not common, but do occur near reworked glacial moraines and in areas where the seabed has been scoured by bottom currents. Gravel is most abundant at depths of 20 - 40 m, except in eastern Maine where a gravel-covered plain exists to depths of at least 100 m. Bottom currents are stronger in eastern

2006 Annual Adjustment and 2004 SAFE Report Monkfish FMP
16
Maine where the mean tidal range exceeds 5 m. Sandy areas are relatively rare along the inner shelf of the western GOM, but are more common south of Casco Bay, especially offshore of sandy beaches. An intense seasonal cycle of winter cooling and turnover, springtime freshwater runoff, and summer warming influences oceanographic and biologic processes in the GOM. The Gulf has a general counterclockwise nontidal surface current that flows around its coastal margin that is primarily driven by fresh, cold Scotian Shelf water that enters over the Scotian Shelf and through the Northeast Channel, and freshwater river runoff, which is particularly important in the spring. GOM circulation and water properties can vary significantly from year to year. Notable episodic events include shelf-slope interactions such as the entrainment of shelf water by Gulf Stream rings and strong winds that can create currents as high as 1.1 m/s over Georges Bank. Warm core Gulf Stream rings can also influence upwelling and nutrient exchange on the Scotian shelf, and affect the water masses entering the GOM.
4.2.2 Georges Bank Georges Bank is a shallow (3 - 150 m depth), elongate (161 km wide by 322 km long) extension of the continental shelf that is characterized by a steep slope on its northern edge and a broad, flat, gently sloping southern flank. The Great South Channel lies to the west. Bottom topography on eastern Georges Bank is characterized by linear ridges in the western shoal areas; a relatively smooth, gently dipping sea floor on the deeper, easternmost part; a highly energetic peak in the north with sand ridges up to 30 m high and extensive gravel pavement; and steeper and smoother topography incised by submarine canyons on the southeastern margin. The central region of the Bank is shallow, and the bottom is characterized by shoals and troughs, with sand dunes superimposed upon them. The area west of the Great South Channel, known as Nantucket Shoals, is similar in nature to the central region of the Bank. The Great South Channel separates the main part of Georges Bank from Nantucket Shoals. Sediments in this region include gravel pavement and mounds, some scattered boulders, sand with storm generated ripples, and scattered shell and mussel beds. Oceanographic frontal systems separate water masses of the GOM and Georges Bank from oceanic waters south of the Bank. These water masses differ in temperature, salinity, nutrient concentration, and planktonic communities, which influence productivity and may influence fish abundance and distribution. Currents on Georges Bank include a weak, persistent clockwise gyre around the Bank, a strong semidiurnal tidal flow predominantly northwest and southeast, and very strong, intermittent storm induced currents, which all can occur simultaneously. Tidal currents over the shallow top of Georges Bank can be very strong, and keep the waters over the Bank well mixed vertically.
4.2.3 Mid-Atlantic Bight The Mid-Atlantic Bight includes the shelf and slope waters from Georges Bank south to Cape Hatteras, and east to the Gulf Stream. In this region, the shelf slopes gently from shore out to between 100 and 200 km offshore where it transforms to the slope (100 - 200 m water depth) at the shelf break. In both the Mid-Atlantic and on Georges Bank, numerous canyons incise the slope, and some cut up onto the shelf itself. The primary morphological features of the shelf

2006 Annual Adjustment and 2004 SAFE Report Monkfish FMP
17
include shelf valleys and channels, shoal massifs, scarps, and sand ridges and swales. The sediment type covering most of the shelf in the Mid-Atlantic Bight is sand, with some relatively small, localized areas of sand-shell and sand-gravel. On the slope, silty sand, silt, and clay predominate. Sediments are uniformly distributed over the shelf in this region. A sheet of sand and gravel varying in thickness from 0 - 10 m covers most of the shelf. The sands are mostly medium to coarse grains, with finer sand in the Hudson Shelf Valley and on the outer shelf. Mud is rare over most of the shelf, but is common in the Hudson Shelf Valley. Occasionally relic estuarine mud deposits are re-exposed in the swales between sand ridges. Fine sediment content increases rapidly at the shelf break, which is sometimes called the “mud line,” and sediments are 70 - 100% fines on the slope. The northern portion of the Mid-Atlantic Bight is sometimes referred to as southern New England. Most of this area was discussed under Georges Bank; however, one other formation of this region deserves note. The mud patch is located just southwest of Nantucket Shoals and southeast of Long Island and Rhode Island. Tidal currents in this area slow significantly, which allows silts and clays to settle out. The mud is mixed with sand, and is occasionally re-suspended by large storms. This habitat is an anomaly of the outer continental shelf. Shelf and slope waters of the Mid-Atlantic Bight have a slow southwestward flow that is occasionally interrupted by warm core rings or meanders from the Gulf Stream. On average, shelf water moves parallel to bathymetry isobars at speeds of 5 - 10 cm/s at the surface and 2 cm/s or less at the bottom. Storm events can cause much more energetic variations in flow. Tidal currents on the inner shelf have a higher flow rate of 20 cm/s that increases to 100 cm/s near inlets. Slope water tends to be warmer than shelf water because of its proximity to the Gulf Stream, and tends to be more saline. The abrupt gradient where these two water masses meet is called the shelf-slope front. The position of the front is highly variable, and can be influenced by many physical factors. Vertical structure of temperature and salinity within the front can develop complex patterns because of the interleaving of shelf and slope waters; e.g., cold shelf waters can protrude offshore, or warmer slope water can intrude up onto the shelf. The seasonal effects of warming and cooling increase in shallower, nearshore waters. Stratification of the water column occurs over the shelf and the top layer of slope water during the spring-summer and is usually established by early June. Fall mixing results in homogenous shelf and upper slope waters by October in most years. A permanent thermocline exists in slope waters from 200 - 600 m deep where temperatures decrease at the rate of about 0.02ºC per meter and remain relatively constant except for occasional incursions of Gulf stream eddies or meanders. A warm, mixed layer approximately 40 m thick resides above the permanent thermocline.

2006 Annual Adjustment and 2004 SAFE Report Monkfish FMP
18
SedimentsBedrockGravel/RockGravelly SandSandMuddy SandMud
NFMA
SFMA100 m
200 m
EEZ
Can
US
36° 36°
38° 38°
40° 40°
42° 42°
44° 44°
76°
76°
74°
74°
72°
72°
70°
70°
68°
68°
66°
66°
Figure 8. Overlap of sediment types and fishery management areas in Monkfish FMP (Poppe et al. 1989a and b).

2006 Annual Adjustment and 2004 SAFE Report Monkfish FMP
19
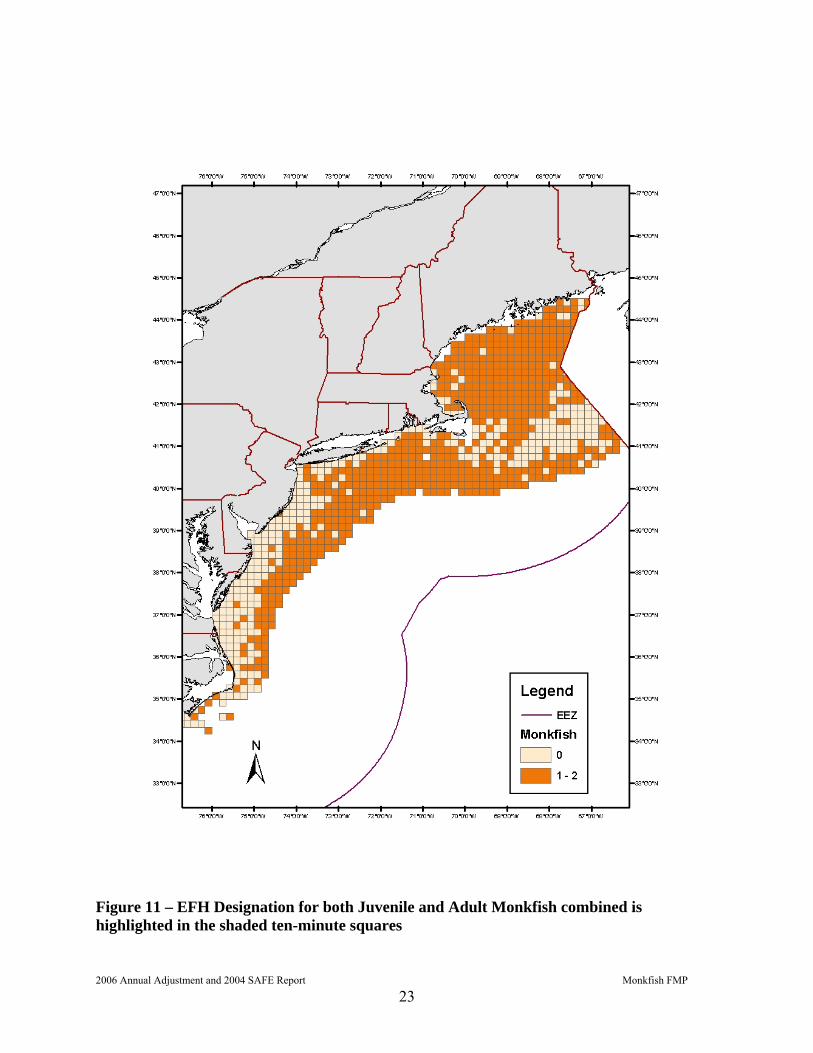
4.3 Habitat Requirements and Gear Effects Evaluation Section 5.1 of the FSEIS to Amendment 2 described benthic habitats that exist within the range of the monkfish fishery biological characteristics of regional systems, and assemblages of fish and benthic organisms. It also included a description of canyon habitats on the edge of the continental shelf. The EFH text descriptions and map designations for the various life stages of monkfish were defined in the Habitat Omnibus Amendment (1998). The following paragraphs and maps, excerpted from the Habitat Omnibus Amendment, describe the environmental needs and natural distribution of Monkfish. For more information on Monkfish EFH refer the Habitat Omnibus Amendment (1998). Note that figures 4.1 and 4.2 (EFH for eggs and larvae) referenced in the following excerpt are not shown, and an additional figure is added, showing combined adult and juvenile monkfish EFH designations. Figure 9 shows the areas designated as EFH for juvenile monkfish (corresponding to Figure 4.3 in the excerpt), Figure 10 shows EFH designated for adult monkfish (Figure 4.4), and Figure 11 shows the combined areas designated as monkfish EFH.

2006 Annual Adjustment and 2004 SAFE Report Monkfish FMP
20
Essential Fish Habitat Description
Monkfish (Lophius americanus)
In its Report to Congress: Status of the Fisheries of the United States (September 1997), NMFS determined monkfish is currently overfished. This determination is based on an assessment of stock size. Essential Fish Habitat for monkfish is described as those areas of the coastal and offshore waters (out to the offshore U.S. boundary of the exclusive economic zone) that are designated on Figures 4.1 - 4.4 and meet the following conditions: Eggs: Surface waters of the Gulf of Maine, Georges Bank, southern New England, and the middle Atlantic south to Cape Hatteras, North Carolina as depicted in Figure 4.1. Generally, the following conditions exist where monkfish egg veils are found: sea surface temperatures below 18° C and water depths from 15 - 1000 meters. Monkfish egg veils are most often observed during the months from March to September.
Larvae: Pelagic waters of the Gulf of Maine, Georges Bank, southern New England and the middle Atlantic south to Cape Hatteras, North Carolina as depicted in Figure 4.2. Generally, the following conditions exist where monkfish larvae are found: water temperatures 15° C and water depths from 25 - 1000 meters. Monkfish larvae are most often observed during the months from March to September.
Juveniles: Bottom habitats with substrates of a sand-shell mix, algae covered rocks, hard sand, pebbly gravel, or mud along the outer continental shelf in the middle Atlantic, the mid-shelf off southern New England, and all areas of the Gulf of Maine as depicted in Figure 4.3. Generally, the following conditions exist where monkfish juveniles are found: water temperatures below 13° C, depths from 25 - 200 meters, and a salinity range from 29.9 - 36.7‰.
Adults: Bottom habitats with substrates of a sand-shell mix, algae covered rocks, hard sand, pebbly gravel, or mud along the outer continental shelf in the middle Atlantic, the mid-shelf off southern New England, along the outer perimeter of Georges Bank and all areas of the Gulf of Maine as depicted in Figure 4.4. Generally, the following conditions exist where monkfish adults are found: water temperatures below 15° C, depths from 25 - 200 meters, and a salinity range from 29.9 - 36.7‰.
Spawning Adults: Bottom habitats with substrates of a sand-shell mix, algae covered rocks, hard sand, pebbly gravel, or mud along the outer continental shelf in the middle Atlantic, the mid-shelf off southern New England, along the outer perimeter of Georges Bank and all areas of the Gulf of Maine as depicted in Figure 4.4. Generally, the following conditions exist where spawning monkfish adults are found: water temperatures below 13° C, depths from 25 - 200 meters, and a salinity range from 29.9 - 36.7‰. Monkfish are observed spawning most often during the months from February to August. The Council acknowledges potential seasonal and spatial variability of the conditions generally associated with this species.

2006 Annual Adjustment and 2004 SAFE Report Monkfish FMP
21
Figure 9 – EFH Designation for Juvenile Monkfish is highlighted in the shaded ten-minute squares

2006 Annual Adjustment and 2004 SAFE Report Monkfish FMP
22
Figure 10 – EFH Designations for Adult Monkfish is highlighted in the shaded ten-minute squares
2006 Annual Adjustment and 2004 SAFE Report Monkfish FMP
23
Figure 11 – EFH Designation for both Juvenile and Adult Monkfish combined is highlighted in the shaded ten-minute squares
2006 Annual Adjustment and 2004 SAFE Report Monkfish FMP
24
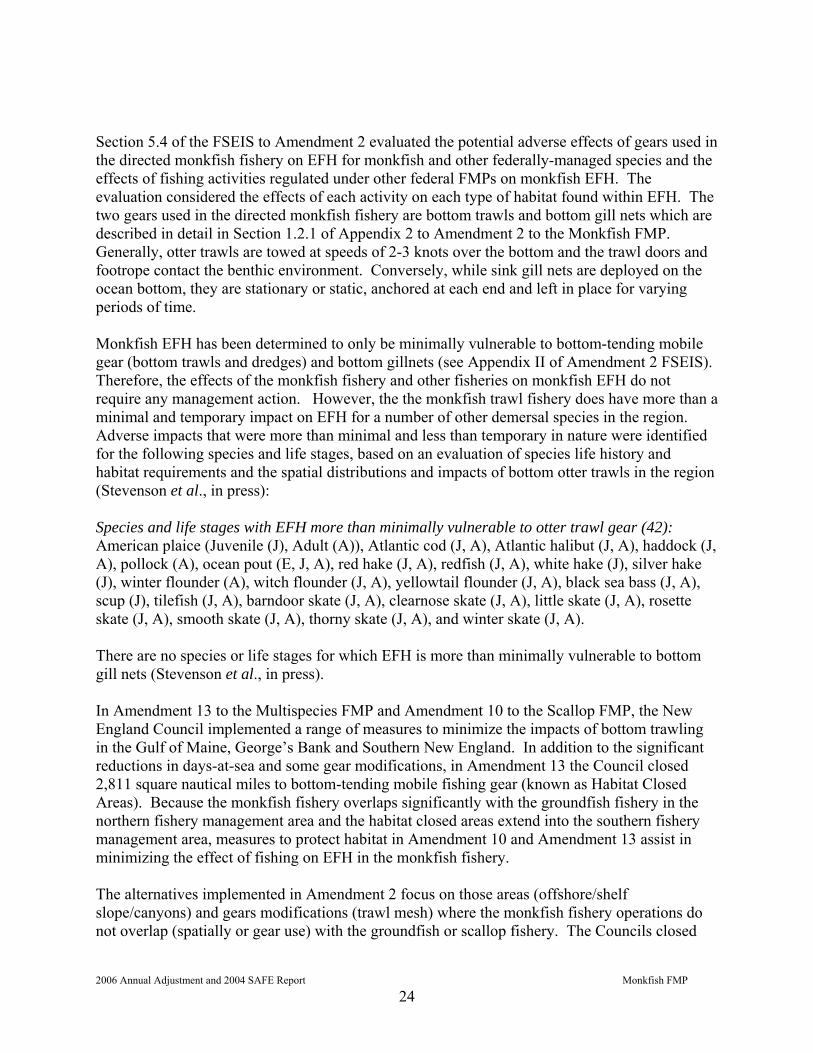
Section 5.4 of the FSEIS to Amendment 2 evaluated the potential adverse effects of gears used in the directed monkfish fishery on EFH for monkfish and other federally-managed species and the effects of fishing activities regulated under other federal FMPs on monkfish EFH. The evaluation considered the effects of each activity on each type of habitat found within EFH. The two gears used in the directed monkfish fishery are bottom trawls and bottom gill nets which are described in detail in Section 1.2.1 of Appendix 2 to Amendment 2 to the Monkfish FMP. Generally, otter trawls are towed at speeds of 2-3 knots over the bottom and the trawl doors and footrope contact the benthic environment. Conversely, while sink gill nets are deployed on the ocean bottom, they are stationary or static, anchored at each end and left in place for varying periods of time. Monkfish EFH has been determined to only be minimally vulnerable to bottom-tending mobile gear (bottom trawls and dredges) and bottom gillnets (see Appendix II of Amendment 2 FSEIS). Therefore, the effects of the monkfish fishery and other fisheries on monkfish EFH do not require any management action. However, the the monkfish trawl fishery does have more than a minimal and temporary impact on EFH for a number of other demersal species in the region. Adverse impacts that were more than minimal and less than temporary in nature were identified for the following species and life stages, based on an evaluation of species life history and habitat requirements and the spatial distributions and impacts of bottom otter trawls in the region (Stevenson et al., in press): Species and life stages with EFH more than minimally vulnerable to otter trawl gear (42): American plaice (Juvenile (J), Adult (A)), Atlantic cod (J, A), Atlantic halibut (J, A), haddock (J, A), pollock (A), ocean pout (E, J, A), red hake (J, A), redfish (J, A), white hake (J), silver hake (J), winter flounder (A), witch flounder (J, A), yellowtail flounder (J, A), black sea bass (J, A), scup (J), tilefish (J, A), barndoor skate (J, A), clearnose skate (J, A), little skate (J, A), rosette skate (J, A), smooth skate (J, A), thorny skate (J, A), and winter skate (J, A). There are no species or life stages for which EFH is more than minimally vulnerable to bottom gill nets (Stevenson et al., in press). In Amendment 13 to the Multispecies FMP and Amendment 10 to the Scallop FMP, the New England Council implemented a range of measures to minimize the impacts of bottom trawling in the Gulf of Maine, George’s Bank and Southern New England. In addition to the significant reductions in days-at-sea and some gear modifications, in Amendment 13 the Council closed 2,811 square nautical miles to bottom-tending mobile fishing gear (known as Habitat Closed Areas). Because the monkfish fishery overlaps significantly with the groundfish fishery in the northern fishery management area and the habitat closed areas extend into the southern fishery management area, measures to protect habitat in Amendment 10 and Amendment 13 assist in minimizing the effect of fishing on EFH in the monkfish fishery. The alternatives implemented in Amendment 2 focus on those areas (offshore/shelf slope/canyons) and gears modifications (trawl mesh) where the monkfish fishery operations do not overlap (spatially or gear use) with the groundfish or scallop fishery. The Councils closed

2006 Annual Adjustment and 2004 SAFE Report Monkfish FMP
25
Oceanographer and Lydonia Canyons deeper than 200 meters, a total closure of 116 square nautical miles, to vessels on a monkfish DAS to minimize the impacts of the directed monkfish fishery on deepwater canyon, hard bottom communities. These two canyon areas are outside the range of the multispecies and scallop fisheries, but could be areas in which, or adjacent to where deep-water monkfish fisheries occur.
4.4 Vessels, Ports and Communities This section updates information provided in the annual SAFE Report for the Monkfish FMP, adding data for the 2004 fishing year.
4.4.1 Vessels and Fishery Sectors The following sections show the distribution of effort and landings by permit category, area and gear type.
4.4.1.1 Permits In 2004, there were 752 monkfish limited access vessels, of which 343 were Category C permits holding limited access permits in either a Multispecies (61%) or Scallop (48%) fisheries, and 355 were Category D permits, primarily (98%) holding limited access Multispecies permits. Overall, 74% of monkfish limited access permit holders also hold multispecies limited access permits. Vessels in all four monkfish permit categories also hold limited access permits in a number of New England and Mid-Atlantic fisheries.
BLACK SEA
BASS
SUMMER FLOUNDER LOBSTER MULTI-
SPECIESOCEAN
QUAHOGRED
CRAB SCALLOP SCUPSQUID/
MACKEREL/ BUTTERFISH
TILEFISH
A 13 7 3 8 0 0 0 0 5 2 1B 41 20 5 17 1 0 0 0 12 0 3C 343 129 257 281 209 0 0 163 145 109 1D 355 123 202 311 349 0 0 20 154 106 6
TOTAL 752 279 467 617 559 0 0 183 316 217 11
BLACK SEA
BASS
SUMMER FLOUNDER LOBSTER MULTI-
SPECIESOCEAN
QUAHOGRED
CRAB SCALLOP SCUPSQUID/
MACKEREL/ BUTTERFISH
TILEFISH
A 13 54% 23% 62% 0% 0% 0% 0% 38% 15% 8%B 41 49% 12% 41% 2% 0% 0% 0% 29% 0% 7%C 343 38% 75% 82% 61% 0% 0% 48% 42% 32% 0%D 355 35% 57% 88% 98% 0% 0% 6% 43% 30% 2%
TOTAL 752 37% 62% 82% 74% 0% 0% 24% 42% 29% 1%
MONKFISH PERMIT
CATEGORY
NUMBER OF MONKFISH PERMITS
PERCENT OF MONKFISH VESSELS ALSO ISSUED A LIMITED ACCESS PERMIT FOR:
MONKFISH PERMIT
CATEGORY
NUMBER OF MONKFISH PERMITS
NUMBER OF MONKFISH VESSELS ALSO ISSUED A LIMITED ACCESS PERMIT FOR:
Table 6 – Number and Percent of monkfish limited access vessels also issued a limited access permit in other fisheries in 2004, by permit category The FMP also provides an open-access permit (Category E) for vessels that did not qualify for a limited access permit so those vessels can land monkfish caught incidentally in other fisheries. Table 7 shows that the number of category E permits increased during the first few years of the FMP but has remained relatively steady since 2001. Note that information on permit categories F, G, and H is not included since these permits were not adopted until FY2005. They will be added to next year’s SAFE Report.

2006 Annual Adjustment and 2004 SAFE Report Monkfish FMP
26
Fishing Year Number of permits1999 14662000 18822001 19912002 21422003 21202004 22562005 2258
TOTAL 3501 Table 7 – Monkfish open-access (Category E) permits issued each year since implementation of the FMP in 1999. The total is the number of unique Category E permits issued since inception of the plan.
4.4.1.2 Landings and Revenues Table 8 shows monthly landings for FY 2004 by area and gear, as well as total monthly landings since FY 2000. Monkfish landings increased about 9.8 million pounds, or 20 percent between FY 2002 and FY 2003, principally due to the increase trip limits in the SFMA but declined in FY2004 by 18.4 million pounds, or 32%. As in FY2002, nearly two-thirds of the total FY2004 landings were from the NFMA due to the restrictive measures in the south, Figure 12, while in FY 2000, 2001 and 2003, the NFMA accounted for 60%, 57% and 54% of the total, respectively. In FY 1999, before the FMP measures took effect, the NFMA accounted for only 40% of the total. Table 9 shows monthly landings by gear from the dealer reports for FY 2004, both as reported (landed weight) and converted to live weight. The lower landed weights reflect the fact that monkfish are landed as tails only, and as whole fish. The lower ratio of landed weight to live weight for otter trawls (0.34), compared to gillnets (0.73), is the result of a greater proportion of tails being landed by otter trawls, while gillnets land mostly whole fish. Figure 13 shows the long-term trend in landings (live weight equivalent) and revenues based on a calendar year. For the four-year period prior to 2000, when the FMP took effect and the five-years since the FMP, landings averaged 58.7 and 50.4 million pounds, respectively, while revenues averaged $37.0 and $41.5 million. In FY2004, landings in both areas declined, but whether that is due to effort controls in monkfish and multispecies fisheries or to monkfish abundance, or both, is unknown. Excluding the most recent year, post-FMP landings and revenues averaged 51.2 million pounds and $43.5 million. When landed weights (as opposed to live weights) are examined a similar trend is evident for the pre- and post-FMP period, but landed weights actually increased over that time, reflecting a shift in demand toward more whole fish (Table 10, note this table is based on fishing year, not calendar year as Figure 13). Figure 14 illustrates the seasonal pattern of monkfish landings in FY 2004, and the distinct difference between NFMA and SFMA fisheries, not only in terms of seasonality, but also in terms of the predominant gear. In the NFMA, trawl gear is the primary gear landing monkfish, and gillnet gear landings are a small proportion during the winter months. In the SFMA, on the other hand, gillnet gear accounts for the majority of monkfish landings, with a somewhat bimodal pattern peaking in the spring and fall months, and showing less of a winter effect. Figure

2006 Annual Adjustment and 2004 SAFE Report Monkfish FMP
27
15 shows the annual distribution of landings by gear for each area since FY 1999. While the NFMA pattern is fairly consistent over that period, the proportion of landings accounted for by trawl vessels has declined in the SFMA.

2006 Annual Adjustment and 2004 SAFE Report Monkfish FMP
28
1000 Lbs 1000 Lbs 1000 Lbs 1000 Lbs 1000 Lbs 1000 Lbs 1000 Lbs 1000 Lbs 1000 Lbs 1000 Lbs 1000 Lbs 1000 Lbs 1000 Lbs Percent 1000 Lbs
NORTHERN 1,479 2,156 2,432 2,429 2,490 2,128 2,611 2,448 1,830 1,938 1,986 1,876 25,802 65% 69% 37,408OTTER TRAWL 1,008 1,139 1,194 1,393 1,469 1,468 1,863 1,806 1,682 1,771 1,837 1,711 18,340 46% 49%
GILLNET 471 994 1,215 1,028 1,021 658 746 637 105 167 148 165 7,354 19% 20%HOOK 0 0 0 0 0 0 1 2 0 0 0 0 4 0% 0%
OTHER GEARS 0 23 23 7 0 1 2 2 44 0 1 0 104 0% 0%
SOUTHERN 2,503 2,208 1,053 613 383 614 1,364 1,259 956 648 736 1,383 13,719 35% 92% 14,930OTTER TRAWL 133 445 407 351 233 149 154 297 244 255 343 256 3,268 8% 22%
GILLNET 2,149 1,578 475 106 7 248 1,026 856 665 311 311 1,004 8,736 22% 59%HOOK 0 0 0 0 0 0 0 0 4 0 0 0 4 0% 0%
OTHER GEARS 221 184 170 156 143 216 184 105 43 82 82 123 1,711 4% 11%
ALL AREAS 3,982 4,363 3,485 3,042 2,874 2,741 3,975 3,706 2,786 2,586 2,722 3,258 39,521 100% 76% 52,338OTTER TRAWL 1,141 1,584 1,601 1,744 1,701 1,617 2,018 2,103 1,926 2,026 2,180 1,967 21,608 55% 41%
GILLNET 2,620 2,572 1,690 1,135 1,028 906 1,772 1,493 769 477 459 1,169 16,091 41% 31%HOOK 0 0 0 0 0 0 1 3 4 0 0 0 8 0% 0%
OTHER GEARS 221 207 194 163 144 218 186 108 87 82 83 123 1,814 5% 3%LANDINGS - ALL AREAS
Fishing Year 2004 3,982 4,363 3,485 3,042 2,874 2,741 3,975 3,706 2,786 2,586 2,722 3,258 39,521Fishing Year 2003 5,910 7,053 4,218 3,849 3,130 4,967 6,223 4,204 4,356 5,261 4,788 3,962 57,921Fishing Year 2002 3,470 4,614 3,284 3,047 3,360 3,623 4,270 4,858 4,443 3,885 5,801 3,423 48,077Fishing Year 2001 4,500 5,415 3,727 3,316 3,296 4,467 5,853 6,580 5,392 4,269 4,457 5,876 57,148
1. The three digit statistical areas defined below are for statistical and management purposes and may not be consistent with stock area delineation used for biological assessment (see the attached statistical chart).
Monkfish Stock Areas: Northern: 464-465, 467, 511-515, 521-522, 561-562 Southern: 525-526, 533-534, 537-539, 541-543, 611-639
2. Landings in live weight.3. Gear data are based on vessel trip reports.* Fishing Year is May 1 through April 30.
APR - 2005FEB - 2005 MAR - 2005AUG - 2004 SEP - 2004MAY - 2004 JUN - 2004 JUL - 2004 MAY 04 - APR 052004/2005*
May04-Apr05 as a % of
Target TAC
Target TAC
OCT - 2004 JAN - 2005NOV - 2004 DEC - 2004
Table 8 – Monkfish landings by area, gear and month for FY 2004 (converted to live weight).

2006 Annual Adjustment and 2004 SAFE Report Monkfish FMP
29
Monkfish Landings by Area 1999-2004 Fishing Year
0
10000
20000
30000
40000
50000
60000
FY1999 FY2000 FY2001 FY2002 FY2003 FY2004
1,00
0 lb
s.
NFMASFMA
Figure 12 – Monkfish landings by management area, FY 1999 – 2003 E WEIGHT for FY 2004
May 1,068,000 39,050 2,166,741 14 708,561 3,982,366June 1,508,254 34,019 2,201,794 785 618,535 4,363,387July 1,546,646 46,646 1,413,155 7,822 470,494 3,484,763August 1,611,153 59,513 949,156 520 421,226 3,041,568September 1,532,950 32,081 806,697 4,994 497,165 2,873,887October 1,524,122 69,011 778,843 8,393 362,744 2,743,113November 1,939,292 40,010 1,495,881 9,449 503,746 3,988,378December 1,938,508 39,958 1,253,616 27,460 460,328 3,719,870January 1,649,613 25,144 692,340 103,418 318,326 2,788,841February 1,641,220 45,279 234,918 305,315 361,334 2,588,066March 1,711,080 50,866 321,767 186,138 506,264 2,776,115April 1,452,751 70,892 1,011,766 259,351 504,132 3,298,892TOTAL 19,123,589 552,469 13,326,674 913,659 5,732,855 39,649,246Source: NMFS Statistics Office, dealer weighout database* May include data from CT vessels without a 2004 Monkfish permit
LANDED WEIGHT for FY 2004
May 356,907 13,759 1,788,309 9 342,928 2,501,912June 484,225 12,031 1,618,085 242 287,876 2,402,459July 495,099 15,884 859,094 4,638 201,218 1,575,933August 529,684 19,078 587,843 199 156,238 1,293,042September 532,360 9,737 495,177 4,018 186,021 1,227,313October 530,864 21,564 541,238 6,400 132,821 1,232,887November 662,063 13,221 1,152,914 6,775 214,326 2,049,299December 665,347 12,733 886,587 18,978 230,054 1,813,699January 572,113 8,465 577,656 45,007 144,507 1,347,748February 563,055 15,690 209,870 148,896 164,480 1,101,991March 577,038 16,934 280,141 69,523 204,708 1,148,344April 495,113 21,723 856,413 99,582 210,386 1,683,217TOTAL 6,463,868 180,819 9,853,327 404,267 2,475,563 19,377,844
Hook Other Total PoundsMonth Otter Trawl Scallop Dredge Gillnet
Month Otter Trawl Scallop Dredge Gillnet Hook Other Total Pounds
Table 9 – FY2004 monkfish landings from dealer reports, showing live weight and landed weights.

2006 Annual Adjustment and 2004 SAFE Report Monkfish FMP
30
0
10
20
30
40
50
60
70
1982 1984 1986 1988 1990 1992 1994 1996 1998 2000 2002 2004
Year
Land
ings
(mill
ion
lbs.
live
wt.
0
10
20
30
40
50
60
Valu
e ($
mill
ions
)
Landings (live wt. millions lbs.) Value ($ millions)
Figure 13 Calendar year monkfish landings and revenues, 1982-2004.
* May include data from CT vessels without a 2001, 2002, 2003, or 2004 Monkfish permit
19961995
1995-2001 data based on vessels that were issued a monkfish permit during the 2001 fishing year. 2002-2004 fishing year data are based on vessels issued a monkfish permit during the 2002-2004 fishing years, respectively.
1997199819992000
$24,758.8($1,000)
Fishing Year (May 1 - April 30)
Landings* Revenues*(1,000 lbs. landed wt.)
26,077.223,422.8
25,312.029,287.6
18,415.620,732.621,774.324,156.0
$26,188.5$30,127.0$34,682.0
$37,414.3
$48,713.7$46,122.9
$35,256.4$42,353.5
$30,304.1
2001 30,519.6
2004 17,975.3
20022003
Table 10 – Fishing year landings (in landed weights) and revenues, 1995 – 2004

2006 Annual Adjustment and 2004 SAFE Report Monkfish FMP
31
(a)
FY 2004 NFMA Monkfish landings by gear and month
0
500
1,000
1,500
2,000
2,500
3,000
MAY -2004
JUN -2004
JUL -2004
AUG -2004
SEP -2004
OCT -2004
NOV -2004
DEC -2004
JAN -2005
FEB -2005
MAR -2005
APR -2005
1,00
0 lb
s. OTHER GEARS HOOK GILLNET OTTER TRAWL
(b)
FY 2004 SFMA Monkfish landings by gear and month
0
500
1,000
1,500
2,000
2,500
3,000
MAY -2004
JUN -2004
JUL -2004
AUG -2004
SEP -2004
OCT -2004
NOV -2004
DEC -2004
JAN -2005
FEB -2005
MAR -2005
APR -2005
1,00
0 lb
s. OTHER GEARS HOOK GILLNET OTTER TRAWL
Figure 14 – FY2004 NFMA (a) and SFMA (b) monkfish landings by gear and month
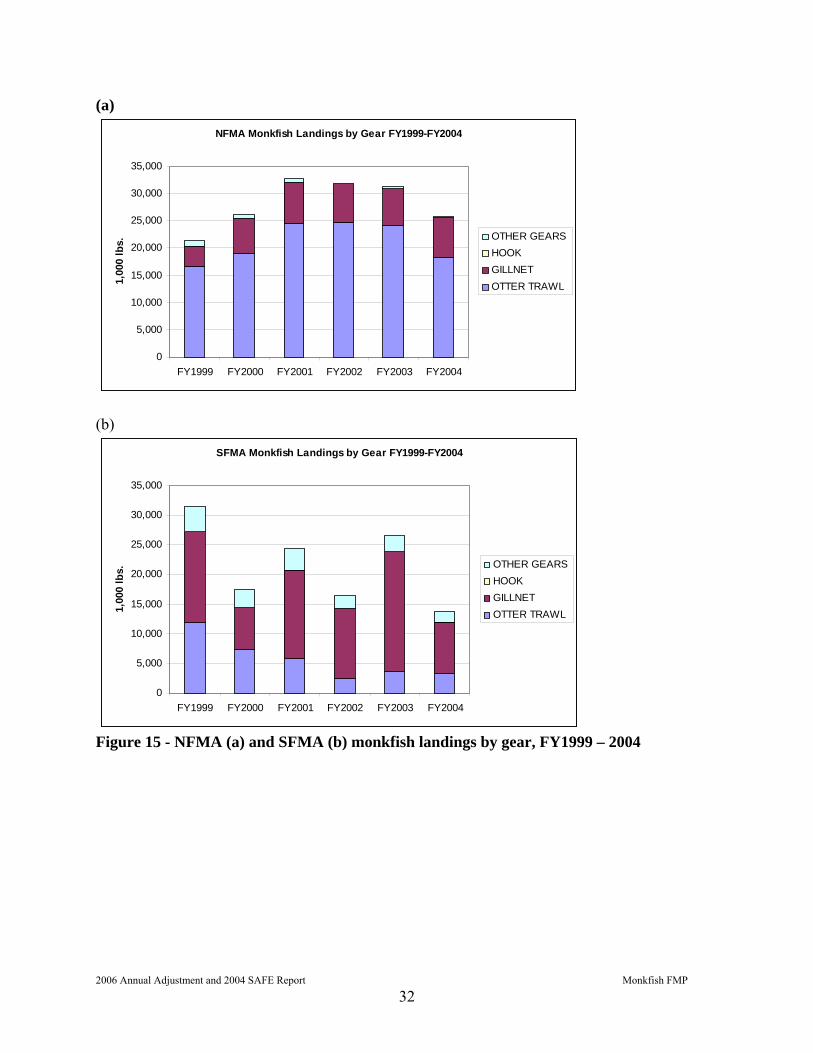
2006 Annual Adjustment and 2004 SAFE Report Monkfish FMP
32
(a)
NFMA Monkfish Landings by Gear FY1999-FY2004
0
5,000
10,000
15,000
20,000
25,000
30,000
35,000
FY1999 FY2000 FY2001 FY2002 FY2003 FY2004
1,00
0 lb
s. OTHER GEARS HOOK GILLNET OTTER TRAWL
(b)
SFMA Monkfish Landings by Gear FY1999-FY2004
0
5,000
10,000
15,000
20,000
25,000
30,000
35,000
FY1999 FY2000 FY2001 FY2002 FY2003 FY2004
1,00
0 lb
s. OTHER GEARS HOOK GILLNET OTTER TRAWL
Figure 15 - NFMA (a) and SFMA (b) monkfish landings by gear, FY1999 – 2004

2006 Annual Adjustment and 2004 SAFE Report Monkfish FMP
33
Massachusetts continues to account for the greatest proportion (nearly half) of all monkfish landings, followed by Maine, New Jersey and Rhode Island (Table 11).
FY 1995 FY 1996 FY 1997 FY 1998 FY 1999 FY 2000 FY 2001 FY 2002 FY 2003 FY 2004CT* 1,029 733 592 574 557 603 787 455 585 340 MA 10,023 8,955 9,893 11,353 11,167 10,643 12,298 10,684 12,043 8,352 MD 178 524 382 322 341 107 158 38 119 55 ME 1,815 1,932 2,102 1,986 3,193 3,993 5,012 4,971 3,711 2,900 NC 0 431 445 395 432 166 167 112 187 48 NH 329 401 523 452 801 1,477 1,928 1,233 906 1,087 NJ 1,414 2,321 2,680 3,903 4,371 2,825 5,261 3,886 5,349 2,194 NY 248 513 654 775 573 435 707 694 1,047 541 RI 2,829 4,080 3,732 3,597 3,969 2,720 3,519 2,808 4,584 2,082 VA 550 841 773 799 671 455 683 431 758 379 TOTAL 18,416 20,733 21,774 24,156 26,077 23,423 30,520 25,312 29,287 17,975
Source: NMFS Statistics Office, dealer weighout database & permit database* May include data from CT vessels without a 2001, 2002, 2003, or 2004 Monkfish permit
1995-2001 data based on vessels that were issued a monkfish permit during the 2001 fishing year. 2002 and 2003 fishing year data are based on vessels issued a monkfish permit during the 2002 and 2003 fishing years, respectively.
STATE Thousands of Pounds of Monkfish
Table 11 – Monkfish landings by state (landed weight), FY 1995-2004 The following tables, Table 12 and Table 13 show monkfish landings and revenues as a percentage of total landings and revenues by permit categories for FY 1995 – 2004. For the years prior to 2001, the data is based on vessels that held a monkfish permit in 2001. For subsequent years, the data is based on vessels that held a permit in those years. Data for Connecticut is shown separately because there may have been landings by vessels that did not have a federal permit in 2001 – 2004 due to the way that state’s landings are reported to NMFS. In the first few years after implementation of the FMP, vessels with Category B and D permits showed an increased reliance on monkfish revenues, although this trend reversed somewhat in FY2004 as a result of lower monkfish landings. Category A vessels dependence on monkfish revenues peaked in FY1999, and has since returned to pre-FMP levels. Category C vessels, of which 48% also hold scallop limited access permits have seen their dependence on monkfish revenues decline steadily as revenues from scallops have increased in the past five years. When monkfish landings and revenues are shown by vessel length category (Table 14 and Table 15), a decreased reliance on monkfish is evident for the larger size classes, while an increased reliance is evident for vessels in the 30-49 ft. and 50-69 ft. classes, with the 30-49 ft. vessels being the most reliant on monkfish throughout the period. As overall FY2004 monkfish landings declined, however, all size classes of vessels showed a decline in dependence on monkfish compared to prior years.

2006 Annual Adjustment and 2004 SAFE Report Monkfish FMP
34
FY 1995 FY 1996 FY 1997 FY 1998 FY 1999 FY 2000 FY 2001 FY 2002 FY 2003 FY 2004A 453 817 563 1,093 1,277 845 1,152 1,072 1,375 727% of Total A Landings 49.1% 54.1% 13.4% 10.0% 20.5% 6.5% 6.8% 4.6% 4.9% 14.1%B 322 583 479 992 1,474 1,050 2,084 1,594 1,932 916% of Total B Landings 14.0% 18.2% 23.4% 24.1% 36.9% 30.2% 46.4% 40.1% 48.9% 28.7%C 11,504 12,322 12,364 12,144 11,876 10,583 12,708 10,359 10,982 6,840% of Total C Landings 10.4% 9.3% 7.5% 8.2% 8.5% 6.9% 6.4% 7.9% 8.7% 5.3%D 4,094 5,020 6,139 7,509 8,982 8,905 11,974 10,388 12,930 8,084% of Total D Landings 4.6% 5.3% 5.8% 6.7% 11.1% 9.7% 11.7% 9.9% 13.1% 8.1%E (Open Access) 1,014 1,257 1,637 1,845 1,911 1,459 1,816 1,452 1,486 1,127% of Total E Landings 0.5% 0.6% 0.5% 0.6% 0.8% 0.6% 0.7% 0.6% 0.4% 0.3%CT 1,029 733 592 574 557 580 787 448 583 283% of Total CT Landings 5.7% 4.0% 3.3% 3.5% 2.9% 3.3% 4.5% 2.9% 3.8% 2.2%TOTAL MONK LANDED 18,416 20,733 21,774 24,156 26,077 23,423 30,520 25,312 29,288 17,977Source: NMFS Statistics Office, dealer weighout database* CT data may include landings from vessels without a 2001, 2002, 2003, or 2004 Monkfish permit
Monkfish Permit Category
1995-2001 data based on vessels that were issued a monkfish permit during the 2001 fishing year. 2002-2004 fishing year data are based on vessels issued a monkfish permit during the 2002-2004 fishing years, respectively.
1,000 pounds, landed weight
Table 12 – Monkfish landings as a percent of total landings by permit category, 1995-2004.
FY 1995 FY 1996 FY 1997 FY 1998 FY 1999 FY 2000 FY 2001 FY 2002 FY 2003 FY 2004A $582 $849 $663 $1,262 $2,011 $1,428 $1,615 $1,439 $1,432 $899% of Total A Revenues 36.9% 41.4% 35.7% 51.2% 63.5% 46.6% 50.6% 42.5% 35.9% 38.9%B $391 $583 $552 $1,183 $2,528 $1,699 $2,828 $2,099 $1,998 $1,094% of Total B Revenues 24.6% 33.5% 38.7% 49.6% 62.2% 48.1% 60.3% 53.3% 54.2% 31.5%C $16,014 $16,423 $18,091 $18,501 $23,250 $22,380 $17,503 $14,713 $15,525 $12,930% of Total C Revenues 13.0% 12.0% 13.3% 14.0% 13.5% 11.5% 9.2% 7.4% 7.2% 5.0%D $4,736 $5,649 $7,514 $10,076 $16,043 $16,620 $16,836 $14,434 $15,695 $13,103% of Total D Revenues 8.2% 9.3% 11.2% 14.9% 20.4% 19.9% 20.2% 17.3% 18.6% 14.5%E (Open Access) $1,263 $1,452 $2,270 $2,642 $3,471 $2,848 $2,504 $1,970 $1,993 $1,881% of Total E Revenues 1.1% 1.2% 1.7% 2.1% 2.4% 1.9% 1.6% 1.2% 1.0% 0.8%CT $1,772 $1,233 $1,036 $1,018 $1,410 $1,148 $1,067 $603 $772 $400% of Total CT Revenues 4.1% 2.5% 3.1% 3.0% 3.6% 3.8% 3.5% 2.2% 2.5% 1.5%TOTAL MONK REVENUE $24,759 $26,188 $30,127 $34,682 $48,714 $46,123 $42,354 $35,256 $37,414 $30,307Source: NMFS Statistics Office, dealer weighout database* CT data may include landings from vessels without a 2001, 2002, 2003, or 2004 Monkfish permit
1995-2001 data based on vessels that were issued a monkfish permit during the 2001 fishing year. 2002-2004 fishing year data are based on vessels issued a monkfish permit during the 2002-2004 fishing years, respectively.
Monkfish Permit Category $1,000, nominal (not discounted)
Table 13 - Monkfish revenues as a percent of total revenues by permit category, 1995-2004.

2006 Annual Adjustment and 2004 SAFE Report Monkfish FMP
35
FY 1995 FY 1996 FY 1997 FY 1998 FY 1999 FY 2000 FY 2001 FY 2002 FY 2003 FY 20040-29 Feet 70 61 21 20 50 62 73 54 55 42% of Total 0-29 Landings 11.7% 10.5% 3.1% 2.5% 6.9% 7.1% 6.8% 6.5% 8.5% 4.9%30-49 Feet 5,303 6,317 6,415 8,458 10,537 9,291 13,067 11,384 14,779 9,161% of Total 30-49 Landings 8.7% 10.3% 10.7% 13.3% 18.5% 17.0% 24.0% 23.7% 28.4% 17.9%50-69 Feet 2,675 3,771 3,398 4,057 4,550 4,983 7,056 5,919 6,331 3,275% of Total 50-69 Landings 3.5% 4.7% 3.2% 4.7% 5.5% 5.9% 8.7% 7.6% 8.5% 3.7%70-89 Feet 7,228 8,208 9,629 9,217 8,904 7,469 8,250 6,846 6,735 4,600% of Total 70-89 Landings 4.0% 4.4% 3.6% 3.8% 4.0% 3.4% 3.5% 3.1% 2.9% 1.9%90+ Feet 2,109 1,643 1,718 1,830 1,480 1,038 1,285 661 805 616% of Total 90+ Landings 2.1% 1.3% 1.2% 1.1% 1.2% 0.7% 0.6% 0.4% 0.3% 0.3%CT 1,029 733 592 574 557 580 787 448 583 283% of Total CT Landings 5.7% 4.0% 3.3% 3.5% 2.9% 3.3% 4.5% 2.9% 3.8% 2.2%TOTAL MONK LANDED 18,416 20,733 21,774 24,156 26,077 23,423 30,520 25,312 29,288 17,977Source: NMFS Statistics Office, dealer weighout database* CT data may include landings from vessels without a 2001, 2002, 2003, or 2004 Monkfish permit
Vessel Length Category 1,000 pounds, landed weight
1995-2001 data based on vessels that were issued a monkfish permit during the 2001 fishing year. 2002-2004 fishing year data are based on vessels issued a monkfish permit during the 2002-2004 fishing years, respectively. Table 14 – Monkfish landings as a percent of total landings by vessel length category, 1995 - 2004
FY 1995 FY 1996 FY 1997 FY 1998 FY 1999 FY 2000 FY 2001 FY 2002 FY 2003 FY 20040-29 Feet $72 $60 $34 $25 $99 $98 $98 $66 $61 $57% of Total 0-29 Revenues 8.3% 8.3% 3.3% 2.4% 8.9% 9.4% 8.4% 6.3% 6.4% 5.4%30-49 Feet $5,657 $6,474 $7,049 $9,933 $16,887 $16,199 $18,410 $15,353 $15,814 $11,989% of Total 30-49 Revenues 13.1% 15.1% 15.4% 20.2% 29.3% 29.3% 31.0% 27.9% 28.2% 20.0%50-69 Feet $3,524 $4,530 $4,488 $5,718 $8,669 $9,963 $9,931 $8,460 $8,541 $6,317% of Total 50-69 Revenues 7.2% 8.4% 7.7% 10.3% 13.0% 13.6% 13.5% 11.3% 11.1% 7.4%70-89 Feet $10,548 $11,509 $14,712 $14,957 $18,420 $16,034 $11,161 $9,894 $11,000 $10,187% of Total 70-89 Revenues 7.1% 7.2% 8.6% 8.8% 8.7% 6.8% 4.8% 4.0% 3.9% 3.0%90+ Feet $3,186 $2,383 $2,808 $3,031 $3,228 $2,682 $1,687 $880 $1,227 $1,357% of Total 90+ Revenues 5.6% 3.8% 4.7% 5.4% 4.9% 3.8% 2.3% 1.2% 1.4% 1.2%CT $1,772 $1,233 $1,036 $1,018 $1,410 $1,148 $1,067 $603 $772 $400% of Total CT Revenues 4.1% 2.5% 3.1% 3.0% 3.6% 3.8% 3.5% 2.2% 2.5% 1.5%TOTAL MONK REVENUE $24,759 $26,188 $30,127 $34,682 $48,714 $46,123 $42,354 $35,256 $37,414 $30,307Source: NMFS Statistics Office, dealer weighout database* CT data may include landings from vessels without a 2001, 2002, 2003, or 2004 Monkfish permit
1995-2001 data based on vessels that were issued a monkfish permit during the 2001 fishing year. 2002-2004 fishing year data are based on vessels issued a monkfish permit during the 2002-2004 fishing years, respectively.
Vessel Length Category $1,000, nominal (not discounted)
Table 15– Monkfish revenues as a percent of total revenues by vessel length category, 1995 – 2004
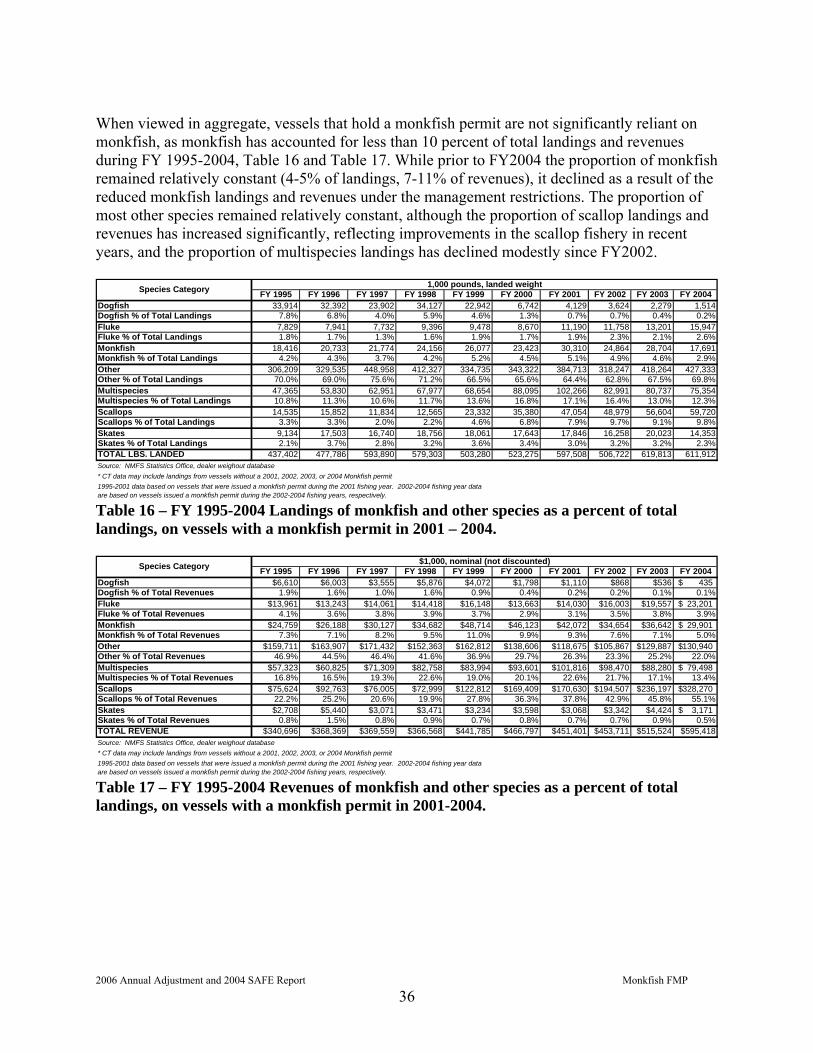
2006 Annual Adjustment and 2004 SAFE Report Monkfish FMP
36
When viewed in aggregate, vessels that hold a monkfish permit are not significantly reliant on monkfish, as monkfish has accounted for less than 10 percent of total landings and revenues during FY 1995-2004, Table 16 and Table 17. While prior to FY2004 the proportion of monkfish remained relatively constant (4-5% of landings, 7-11% of revenues), it declined as a result of the reduced monkfish landings and revenues under the management restrictions. The proportion of most other species remained relatively constant, although the proportion of scallop landings and revenues has increased significantly, reflecting improvements in the scallop fishery in recent years, and the proportion of multispecies landings has declined modestly since FY2002.
FY 1995 FY 1996 FY 1997 FY 1998 FY 1999 FY 2000 FY 2001 FY 2002 FY 2003 FY 2004Dogfish 33,914 32,392 23,902 34,127 22,942 6,742 4,129 3,624 2,279 1,514Dogfish % of Total Landings 7.8% 6.8% 4.0% 5.9% 4.6% 1.3% 0.7% 0.7% 0.4% 0.2%Fluke 7,829 7,941 7,732 9,396 9,478 8,670 11,190 11,758 13,201 15,947Fluke % of Total Landings 1.8% 1.7% 1.3% 1.6% 1.9% 1.7% 1.9% 2.3% 2.1% 2.6%Monkfish 18,416 20,733 21,774 24,156 26,077 23,423 30,310 24,864 28,704 17,691Monkfish % of Total Landings 4.2% 4.3% 3.7% 4.2% 5.2% 4.5% 5.1% 4.9% 4.6% 2.9%Other 306,209 329,535 448,958 412,327 334,735 343,322 384,713 318,247 418,264 427,333Other % of Total Landings 70.0% 69.0% 75.6% 71.2% 66.5% 65.6% 64.4% 62.8% 67.5% 69.8%Multispecies 47,365 53,830 62,951 67,977 68,654 88,095 102,266 82,991 80,737 75,354Multispecies % of Total Landings 10.8% 11.3% 10.6% 11.7% 13.6% 16.8% 17.1% 16.4% 13.0% 12.3%Scallops 14,535 15,852 11,834 12,565 23,332 35,380 47,054 48,979 56,604 59,720Scallops % of Total Landings 3.3% 3.3% 2.0% 2.2% 4.6% 6.8% 7.9% 9.7% 9.1% 9.8%Skates 9,134 17,503 16,740 18,756 18,061 17,643 17,846 16,258 20,023 14,353Skates % of Total Landings 2.1% 3.7% 2.8% 3.2% 3.6% 3.4% 3.0% 3.2% 3.2% 2.3%TOTAL LBS. LANDED 437,402 477,786 593,890 579,303 503,280 523,275 597,508 506,722 619,813 611,912Source: NMFS Statistics Office, dealer weighout database* CT data may include landings from vessels without a 2001, 2002, 2003, or 2004 Monkfish permit1995-2001 data based on vessels that were issued a monkfish permit during the 2001 fishing year. 2002-2004 fishing year data are based on vessels issued a monkfish permit during the 2002-2004 fishing years, respectively.
Species Category 1,000 pounds, landed weight
Table 16 – FY 1995-2004 Landings of monkfish and other species as a percent of total landings, on vessels with a monkfish permit in 2001 – 2004.
FY 1995 FY 1996 FY 1997 FY 1998 FY 1999 FY 2000 FY 2001 FY 2002 FY 2003 FY 2004Dogfish $6,610 $6,003 $3,555 $5,876 $4,072 $1,798 $1,110 $868 $536 435$ Dogfish % of Total Revenues 1.9% 1.6% 1.0% 1.6% 0.9% 0.4% 0.2% 0.2% 0.1% 0.1%Fluke $13,961 $13,243 $14,061 $14,418 $16,148 $13,663 $14,030 $16,003 $19,557 23,201$ Fluke % of Total Revenues 4.1% 3.6% 3.8% 3.9% 3.7% 2.9% 3.1% 3.5% 3.8% 3.9%Monkfish $24,759 $26,188 $30,127 $34,682 $48,714 $46,123 $42,072 $34,654 $36,642 29,901$ Monkfish % of Total Revenues 7.3% 7.1% 8.2% 9.5% 11.0% 9.9% 9.3% 7.6% 7.1% 5.0%Other $159,711 $163,907 $171,432 $152,363 $162,812 $138,606 $118,675 $105,867 $129,887 130,940$ Other % of Total Revenues 46.9% 44.5% 46.4% 41.6% 36.9% 29.7% 26.3% 23.3% 25.2% 22.0%Multispecies $57,323 $60,825 $71,309 $82,758 $83,994 $93,601 $101,816 $98,470 $88,280 79,498$ Multispecies % of Total Revenues 16.8% 16.5% 19.3% 22.6% 19.0% 20.1% 22.6% 21.7% 17.1% 13.4%Scallops $75,624 $92,763 $76,005 $72,999 $122,812 $169,409 $170,630 $194,507 $236,197 328,270$ Scallops % of Total Revenues 22.2% 25.2% 20.6% 19.9% 27.8% 36.3% 37.8% 42.9% 45.8% 55.1%Skates $2,708 $5,440 $3,071 $3,471 $3,234 $3,598 $3,068 $3,342 $4,424 3,171$ Skates % of Total Revenues 0.8% 1.5% 0.8% 0.9% 0.7% 0.8% 0.7% 0.7% 0.9% 0.5%TOTAL REVENUE $340,696 $368,369 $369,559 $366,568 $441,785 $466,797 $451,401 $453,711 $515,524 $595,418Source: NMFS Statistics Office, dealer weighout database* CT data may include landings from vessels without a 2001, 2002, 2003, or 2004 Monkfish permit1995-2001 data based on vessels that were issued a monkfish permit during the 2001 fishing year. 2002-2004 fishing year data are based on vessels issued a monkfish permit during the 2002-2004 fishing years, respectively.
Species Category $1,000, nominal (not discounted)
Table 17 – FY 1995-2004 Revenues of monkfish and other species as a percent of total landings, on vessels with a monkfish permit in 2001-2004.

2006 Annual Adjustment and 2004 SAFE Report Monkfish FMP
37
4.4.1.3 Days-at-sea (DAS) Starting in Year 2 of the FMP (May, 2000 –April, 2001) limited access monkfish vessels (Categories A, B, C, and D) were allocated 40 monkfish DAS. By definition, Category A and B vessels do not qualify for limited access multispecies or scallop permits, and Category C and D vessels must use either a multispecies or scallop DAS while on a monkfish DAS. In the NFMA, however, there is no monkfish trip limit when a vessel is on either a combined (monkfish/multispecies or monkfish/scallop) DAS or a multispecies-only DAS, and, consequently, multispecies vessels in Categories C and D and fishing in the NMFA do not call-in monkfish DAS. Therefore, DAS usage, has been well below the total DAS allocated (Table 18), and primarily reflects monkfish fishing activity in the SFMA. In FY2004 call-in vessels (that is those fishing primarily in the SFMA) used only 35% of their allocated DAS, or 59%, 39%, 32% and 33% for Categories A though D, respectively (Table 19. For comparison, in FY 2003, Category A and B call-in vessels used 70% and 55% of their allocated DAS, respectively, while Category B and D call-in vessels used 46% and 41%. The decline in usage rates is directly the result of the reduced number of DAS (28) that vessels were allowed to use in the SFMA in FY2004, even though their overall allocation remained at 40 DAS. DAS usage by Category C and D vessels that also hold a multispecies limited access permit increased from FY 2001 to FY 2003, but declined in FY2004 (Figure 16).
DAS Allocated DAS Used DAS Allocated DAS Used
A 625 316 535 316B 2,038 607 1,538 607C 17,429 939 2,936 939D 18,027 1,691 5,143 1,691
TOTAL 38,118 3,553 10,151 3,553Source: NMFS Days-at-Sea (DAS) database via onboard Vessel Monitoring System
Call-In Vessels Permit Category
All Vessels
Table 18 – Monkfish DAS usage, FY 2004
Monkfish Monkfish/ Multispecies
Monkfish/ Scallop Total % Used
A 535 316 0 0 316 59%B 1,538 607 0 0 607 39%C 2,936 0 939 0 939 32%D 5,143 0 1,691 0 1,691 33%
TOTAL 10,151 923 2,630 0 3,553 35%Source: NMFS Days-at-Sea (DAS) database via onboard Vessel Monitoring Systems (VMS)
Permit Category
DAS Allocated
DAS Used
Table 19 - Monkfish-only, Monkfish/Multispecies and Monkfish/Scallop DAS Usage by call-in vessels (vessels fishing in the SFMA), FY 2004.

2006 Annual Adjustment and 2004 SAFE Report Monkfish FMP
38
01,0002,0003,0004,0005,0006,000
2001 2002 2003 2004
Fishing Year
DA
S U
sed A
BCD
Figure 16 - DAS used by permit category, FY 2001 – 2004.
4.4.2 Ports and communities This section updates information contained in the FSEIS for Amendment 2 and the SAFE for the 2003 fishing year. The Monkfish FMP references Amendments 5 and 7 to the Northeast Multispecies FMP and Amendment 4 to the Sea Scallop FMP for social and cultural information about monkfish ports, including port profiles. Because of the nature of the monkfish fishery, there is significant overlap between the vessels and communities involved with the monkfish fishery and those involved with the multispecies (groundfish) and scallop fisheries. Many of the same boats that target monkfish or catch them incidentally also target groundfish or scallops. Only about six percent of the limited access monkfish permit holders do not also hold limited access permits in either multispecies or scallops. For the purposes of this SAFE Report, “primary monkfish ports” are defined as those averaging more than $1,000,000 in monkfish revenues from 1994-1997 (based on the dealer weighout data presented in Table 45 of the Monkfish FMP). “Secondary monkfish ports” are defined as those averaging more than $50,000 in monkfish revenues from 1994-1997 (based on the dealer weighout data presented in the Monkfish FMP. Primary monkfish ports include:
• Portland, ME • Boston, MA • Gloucester, MA • New Bedford, MA • Long Beach/Barnegat Light, NJ, and • Point Judith, RI.
Secondary monkfish ports include:
• Rockland, ME
2006 Annual Adjustment and 2004 SAFE Report Monkfish FMP
39
• Port Clyde, ME • South Bristol, ME • Ocean City, MD • Chatham, MA • Provincetown, MA • Scituate, MA • Plymouth, MA • Westport, MA • Portsmouth, NH • Point Pleasant, NJ • Cape May, NJ • Greenport, NY • Montauk, NY • Hampton Bay, NY • Newport, RI • Hampton, VA, and • Newport News, VA.
Table 20 shows the distribution of monkfish permit holders by homeport and monkfish permit category for the six primary, 18 secondary, and “other” monkfish ports for FY2000 - 2004. Table 21 shows the VTR landings for five of the six major ports (as reported by NMFS in their regular “Northeast Preliminary Fisheries Statistics” Report, not including Long Beach/Barnegat Light, NJ) and states, broken down by management area from which landings were reported, as well as by gear type. Virtually all of the monkfish landed in Portland, Gloucester and Boston come from the NFMA, while about 60% of New Bedford’s landings and only 3 percent of Pt. Judith’s landings come from the NFMA in FY2004. Portland and Boston’s landings are almost totally from otter trawls, while otter trawls make up about 65% of New Bedford landings in FY2004. Gloucester landings are evenly split between trawls and gillnets. Pt. Judith landings are about 2/3 gillnet, while New Hampshire, New York and New Jersey landings are predominately (>80%) caught by gillnet gear. This is similar to the distribution by gear for each port in the previous fishing year, except that in FY2003 New Bedford monkfish landings by scallop dredge (included in “other gear” in the table) 18% of the port’s monkfish landings, while in FY2004 those declined to 12% while the proportion of trawl landings increased. Port landings and revenue data based on May-April fishing year is presented in Table 22 and Table 23, for primary and secondary ports (as identified in the original FMP), respectively, for FY1995-FY2004. Data is based on the vessel’s homeport and, for FY2004, on the vessel’s principal port of landing as indicated on the permit application. While vessels homeported in New Bedford recorded the highest monkfish landings and revenues from 1995-1999, their share declined in more recent years, while the share of vessels homeported in Boston has increased. Of note is the observation that while Boston ranked the highest in monkfish revenues based on the vessels’ homeport, Portland and New Bedford were the highest based on principal port in FY2004, while Boston and Pt. Judith were the lowest of the six primary ports. Revenues from monkfish increased slightly in all primary ports from FY 2002 to FY 2003, with the exception of Boston where monkfish revenues declined about 11%. In FY2004, however, only New Bedford
2006 Annual Adjustment and 2004 SAFE Report Monkfish FMP
40
and Gloucester showed modest revenue increases while Long Beach/Barnegat Light and Point Judith experienced declines of about 50%, reflecting the lower trip limits and DAS available in the SFMA. Monkfish landings and revenues are noticeably smaller for the secondary ports (Table 23), but monkfish revenues make up a greater proportion of total revenues for many of those ports (Table 24).
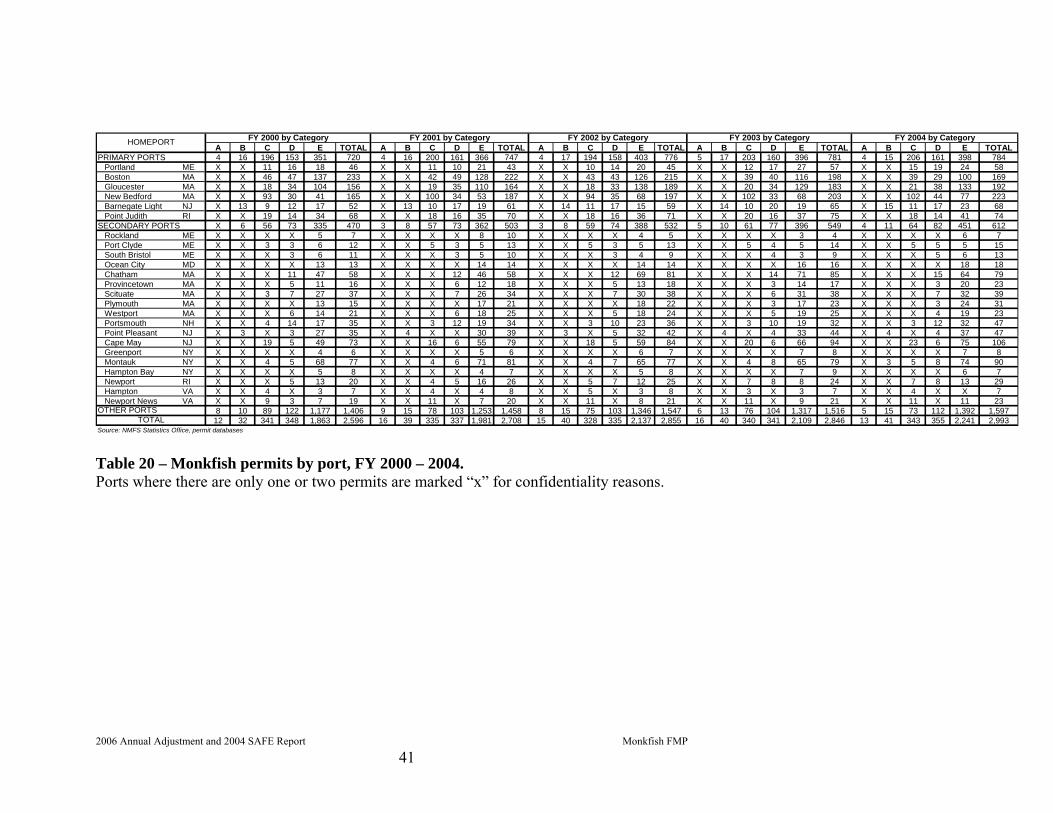
2006 Annual Adjustment and 2004 SAFE Report Monkfish FMP
41
A B C D E TOTAL A B C D E TOTAL A B C D E TOTAL A B C D E TOTAL A B C D E TOTALPRIMARY PORTS 4 16 196 153 351 720 4 16 200 161 366 747 4 17 194 158 403 776 5 17 203 160 396 781 4 15 206 161 398 784
Portland ME X X 11 16 18 46 X X 11 10 21 43 X X 10 14 20 45 X X 12 17 27 57 X X 15 19 24 58Boston MA X X 46 47 137 233 X X 42 49 128 222 X X 43 43 126 215 X X 39 40 116 198 X X 39 29 100 169Gloucester MA X X 18 34 104 156 X X 19 35 110 164 X X 18 33 138 189 X X 20 34 129 183 X X 21 38 133 192New Bedford MA X X 93 30 41 165 X X 100 34 53 187 X X 94 35 68 197 X X 102 33 68 203 X X 102 44 77 223Barnegate Light NJ X 13 9 12 17 52 X 13 10 17 19 61 X 14 11 17 15 59 X 14 10 20 19 65 X 15 11 17 23 68Point Judith RI X X 19 14 34 68 X X 18 16 35 70 X X 18 16 36 71 X X 20 16 37 75 X X 18 14 41 74
SECONDARY PORTS X 6 56 73 335 470 3 8 57 73 362 503 3 8 59 74 388 532 5 10 61 77 396 549 4 11 64 82 451 612Rockland ME X X X X 5 7 X X X X 8 10 X X X X 4 5 X X X X 3 4 X X X X 6 7Port Clyde ME X X 3 3 6 12 X X 5 3 5 13 X X 5 3 5 13 X X 5 4 5 14 X X 5 5 5 15South Bristol ME X X X 3 6 11 X X X 3 5 10 X X X 3 4 9 X X X 4 3 9 X X X 5 6 13Ocean City MD X X X X 13 13 X X X X 14 14 X X X X 14 14 X X X X 16 16 X X X X 18 18Chatham MA X X X 11 47 58 X X X 12 46 58 X X X 12 69 81 X X X 14 71 85 X X X 15 64 79Provincetown MA X X X 5 11 16 X X X 6 12 18 X X X 5 13 18 X X X 3 14 17 X X X 3 20 23Scituate MA X X 3 7 27 37 X X X 7 26 34 X X X 7 30 38 X X X 6 31 38 X X X 7 32 39Plymouth MA X X X X 13 15 X X X X 17 21 X X X X 18 22 X X X 3 17 23 X X X 3 24 31Westport MA X X X 6 14 21 X X X 6 18 25 X X X 5 18 24 X X X 5 19 25 X X X 4 19 23Portsmouth NH X X 4 14 17 35 X X 3 12 19 34 X X 3 10 23 36 X X 3 10 19 32 X X 3 12 32 47Point Pleasant NJ X 3 X 3 27 35 X 4 X X 30 39 X 3 X 5 32 42 X 4 X 4 33 44 X 4 X 4 37 47Cape May NJ X X 19 5 49 73 X X 16 6 55 79 X X 18 5 59 84 X X 20 6 66 94 X X 23 6 75 106Greenport NY X X X X 4 6 X X X X 5 6 X X X X 6 7 X X X X 7 8 X X X X 7 8Montauk NY X X 4 5 68 77 X X 4 6 71 81 X X 4 7 65 77 X X 4 8 65 79 X 3 5 8 74 90Hampton Bay NY X X X X 5 8 X X X X 4 7 X X X X 5 8 X X X X 7 9 X X X X 6 7Newport RI X X X 5 13 20 X X 4 5 16 26 X X 5 7 12 25 X X 7 8 8 24 X X 7 8 13 29Hampton VA X X 4 X 3 7 X X 4 X 4 8 X X 5 X 3 8 X X 3 X 3 7 X X 4 X X 7Newport News VA X X 9 3 7 19 X X 11 X 7 20 X X 11 X 8 21 X X 11 X 9 21 X X 11 X 11 23
8 10 89 122 1,177 1,406 9 15 78 103 1,253 1,458 8 15 75 103 1,346 1,547 6 13 76 104 1,317 1,516 5 15 73 112 1,392 1,59712 32 341 348 1,863 2,596 16 39 335 337 1,981 2,708 15 40 328 335 2,137 2,855 16 40 340 341 2,109 2,846 13 41 343 355 2,241 2,993
Source: NMFS Statistics Office, permit databases
HOMEPORT FY 2004 by Category
OTHER PORTSTOTAL
FY 2000 by Category FY 2001 by Category FY 2002 by Category FY 2003 by Category
Table 20 – Monkfish permits by port, FY 2000 – 2004. Ports where there are only one or two permits are marked “x” for confidentiality reasons.

2006 Annual Adjustment and 2004 SAFE Report Monkfish FMP
42
1000 Lbs 1000 Lbs Percent 1000 Lbs Percent 1000 Lbs Percent 1000 Lbs Percent 1000 Lbs Percent 1000 Lbs PercentPortland, ME 7,571 7,508 99% 63 1% 7,071 93% 457 6% 0 0% 43 1%Gloucester, MA 5,288 5,220 99% 68 1% 2,407 46% 2,881 54% 0 0% 0 0%Boston, MA 2,975 2,878 97% 97 3% 2,975 100% 0 0% 0 0% 0 0%New Bedford, MA 9,237 5,407 59% 3,830 41% 6,002 65% 2,081 23% 0 0% 1,154 12%Point Judith, RI 1,587 128 8% 1,459 92% 539 34% 1,038 65% 0 0% 10 1%
MAINE 8,969 8,895 99% 73 1% 8,150 91% 776 9% 0 0% 43 0%NEW HAMPSHIRE 1,689 1,678 99% 11 1% 195 12% 1,493 88% 0 0% 1 0%MASSACHUSETTS 19,805 15,006 76% 4,799 24% 11,847 60% 6,779 34% 4 0% 1,175 6%RHODE ISLAND 3,217 212 7% 3,005 93% 677 21% 2,454 76% 0 0% 86 3%CONNECTICUT 618 3 1% 615 99% 75 12% 407 66% 0 0% 136 22%NEW YORK 1,166 7 1% 1,160 99% 308 26% 850 73% 4 0% 4 0%NEW JERSEY 3,225 1 0% 3,223 100% 124 4% 2,867 89% 0 0% 234 7%OTHER NORTHEAST 832 0 0% 832 100% 232 28% 466 56% 0 0% 135 16%
TOTAL 39,521 25,802 65% 13,719 35% 21,608 55% 16,091 41% 8 0% 1,814 5%
1. The three digit statistical areas defined below are for statistical and management purposes and may not be consistent with stock area delineation used for biological assessment (see the attached statistical chart).
Monkfish stock areas: Northern: 464-465, 467, 511-515, 521-522, 561-562 Southern: 525-526, 533-534, 537-539, 541-543, 611-639
2. Landings in live weight.3. Gear data are based on vessel trip reports.
HOOK OTHER GEARSMAY 04 - APR 05
SOUTHERN
STOCK AREAS
NORTHERN
GEAR TYPES
OTTER TRAWL GILLNETPORT/ STATE
Table 21 – Preliminary FY2004 monkfish landings by primary port (excluding Long Beach/Barnegat Light, NJ) and State, by gear.

2006 Annual Adjustment and 2004 SAFE Report Monkfish FMP
43
Principal PortFY1995 FY1996 FY1997 FY1998 FY1999 FY2000 FY2001 FY2002 FY2003 FY2004 FY2004
1,000 Lbs. 1,446.2 1,604.8 1,691.7 1,472.8 2,542.9 2,995.8 1,487.6 1,498.2 1,435.6 990.0 2,041.1$1,000 $2,257.6 $2,393.9 $2,707.1 $2,640.2 $5,472.7 $6,707.8 $2,004.9 $2,289.6 $2,666.1 $2,471.3 $5,119.21,000 Lbs. 822.8 674.0 917.6 781.9 1,267.6 960.9 4,964.1 4,777.8 4,266.7 2,828.8 1,123.8$1,000 $1,082.5 $936.3 $1,300.3 $1,104.1 $2,240.1 $2,027.5 $6,737.6 $6,629.9 $5,909.2 $5,151.5 $2,008.21,000 Lbs. 1,675.6 1,154.1 844.3 941.6 1,700.9 2,364.8 2,090.8 2,055.4 1,961.8 1,353.3 1,645.8$1,000 $1,620.8 $1,097.7 $1,037.9 $1,382.6 $3,060.7 $4,441.5 $3,053.4 $2,923.5 $2,604.0 $2,698.7 $3,112.81,000 Lbs. 5,983.8 5,789.6 7,345.5 8,537.1 7,026.5 5,515.4 3,452.8 2,319.5 2,583.3 2,003.7 2,726.2$1,000 $8,980.7 $8,260.4 $11,686.0 $13,926.2 $14,442.8 $11,783.9 $4,697.9 $3,278.4 $3,916.1 $4,191.0 $5,393.61,000 Lbs. 846.4 1,382.2 729.0 1,702.9 2,568.7 1,801.5 3,582.0 2,435.4 3,625.5 1,418.0 1,380.9$1,000 $1,210.6 $1,531.5 $977.7 $2,099.9 $4,430.7 $3,049.4 $4,807.6 $3,227.3 $3,870.5 $1,797.5 $1,755.31,000 Lbs. 1,194.2 2,444.6 2,125.9 1,485.1 1,708.7 1,635.0 643.4 511.9 942.5 423.7 764.9$1,000 $1,645.1 $3,366.8 $3,248.1 $2,175.5 $3,275.3 $3,423.8 $1,008.6 $779.4 $1,359.6 $674.0 $1,134.1
Source: NMFS Statistics Office, dealer weighout & permits databasesPounds are in landed weight
Portland, ME
Boston, MA
Gloucester, MA
New Bedford, MA
HOME PORT MONKFISH LANDINGS AND REVENUES
Long Beach/Barnegat Light, NJ
Point Judith, RI
1995-2001 data based on vessels that were issued a monkfish permit during the 2001 fishing year. 2002 - 2004 fishing year data are based on vessels issued a monkfish permit during the 2002, 2003, and 2004 fishing years, respectively. Table 22 – Monkfish landings and revenues for monkfish primary ports, FY 1995 – 2004, and principal port, FY 2004.

2006 Annual Adjustment and 2004 SAFE Report Monkfish FMP
44
Principal PortFY1995 FY1996 FY1997 FY1998 FY1999 FY2000 FY2001 FY2002 FY2003 FY2004 FY2004
1,000 Lbs. 47.7 42.5 37.1 56.3 53.9 74.0 8.3 3.8 3.1 7.3 38.3$1,000 $61.2 $55.3 $54.3 $90.0 $113.2 $184.5 $15.5 $5.5 $5.4 $14.3 $89.51,000 Lbs. 119.2 120.0 183.0 210.4 294.3 325.1 543.5 471.9 386.6 293.8 339.4$1,000 $148.5 $152.7 $260.9 $328.4 $581.8 $749.5 $748.4 $676.8 $679.8 $645.7 $743.61,000 Lbs. 126.4 109.5 89.9 93.3 106.6 219.2 278.7 238.3 233.6 235.6 176.3$1,000 $162.9 $145.1 $131.2 $146.5 $217.4 $494.5 $410.1 $342.7 $431.7 $539.2 $404.81,000 Lbs. 178.5 520.8 348.5 282.0 314.1 106.7 3.1 2.6 2.4 3.3 8.6$1,000 $241.0 $450.5 $310.3 $254.1 $347.4 $154.4 $4.6 $4.2 $3.9 $5.5 $14.51,000 Lbs. 126.3 97.5 117.2 231.6 212.7 475.3 613.4 944.1 1,314.0 650.3 677.6$1,000 $110.9 $936.3 $126.9 $237.2 $327.1 $771.5 $829.9 $1,229.6 $1,358.2 $751.2 $776.01,000 Lbs. 83.3 38.8 24.4 85.6 79.9 35.1 25.9 19.8 38.0 39.2 35.2$1,000 $108.0 $51.8 $36.7 $141.5 $136.4 $76.8 $37.7 $26.4 $75.2 $84.0 $79.01,000 Lbs. 58.9 45.3 43.2 330.0 331.0 434.4 100.0 206.8 202.9 117.6 274.3$1,000 $67.9 $53.0 $50.3 $391.6 $561.5 $745.7 $147.7 $266.4 $216.1 $186.3 $403.21,000 Lbs. 53.5 33.0 27.6 42.3 13.9 276.5 585.5 613.1 717.2 306.1 307.9$1,000 $61.6 $37.6 $25.5 $55.8 $24.3 $508.0 $826.2 $795.9 $704.7 $403.5 $407.81,000 Lbs. 809.6 856.9 461.4 539.0 451.9 307.4 685.7 549.5 830.6 246.4 317.0$1,000 $764.5 $768.5 $387.6 $543.3 $691.2 $568.3 $1,022.6 $739.3 $799.1 $248.5 $316.81,000 Lbs. 370.7 387.9 519.9 474.7 845.3 1,253.7 1,098.7 671.8 560.4 439.4 859.7$1,000 $447.5 $443.0 $636.9 $532.5 $1,319.5 $2,122.7 $1,578.8 $967.0 $635.2 $612.1 $1,117.11,000 Lbs. 84.3 517.7 1,091.5 1,578.5 1,286.0 772.5 337.9 128.3 401.2 311.7 370.4$1,000 $111.4 $565.8 $1,096.5 $1,884.9 $2,320.0 $1,208.2 $441.5 $164.4 $395.6 $400.8 $474.71,000 Lbs. 273.0 312.6 465.0 316.3 124.3 117.5 187.5 117.9 161.9 87.3 115.0$1,000 $370.1 $389.2 $571.7 $398.2 $255.7 $266.2 $248.2 $134.7 $206.0 $131.2 $173.41,000 Lbs. 26.1 48.9 62.9 41.9 12.1 3.6 6.9 19.8 7.8 13.6 12.4$1,000 $35.1 $72.0 $86.2 $62.2 $20.0 $8.7 $10.7 $32.6 $14.5 $36.6 $33.61,000 Lbs. 46.9 53.0 92.2 157.4 79.7 47.2 146.7 238.4 572.5 238.7 235.2$1,000 $62.3 $74.2 $135.9 $246.9 $170.1 $122.2 $237.5 $358.4 $694.3 $368.6 $361.61,000 Lbs. 87.0 318.9 309.5 454.3 415.7 316.6 93.2 138.8 128.7 8.5 9.0$1,000 $120.5 $516.1 $589.6 $733.0 $661.6 $562.6 $134.4 $191.2 $134.6 $12.5 $13.51,000 Lbs. 312.0 406.9 436.3 406.8 581.5 360.9 614.2 671.1 1,226.6 738.2 675.4$1,000 $388.0 $505.4 $558.1 $584.3 $1,229.4 $808.1 $848.2 $917.9 $1,500.0 $1,018.9 $930.91,000 Lbs. 256.2 336.0 113.4 134.9 42.2 35.8 20.7 3.6 4.7 7.4 31.9$1,000 $326.5 $350.5 $129.3 $178.5 $79.1 $76.1 $23.8 $3.6 $6.3 $11.6 $49.61,000 Lbs. 184.3 253.9 373.0 275.2 95.9 90.0 39.6 43.8 37.3 30.7 37.4$1,000 $221.1 $285.0 $454.0 $333.1 $140.4 $106.5 $42.9 $50.9 $43.3 $41.8 $51.6
Source: NMFS Statistics Office, dealer weighout database & permit databasePounds are in landed weight
HOME PORT
Rockland, ME
MONKFISH LANDINGS AND REVENUES
Port Clyde, ME
South Bristol, ME
Ocean City, MD
Chatham, MA
Provincetown, MA
Scituate, MA
Plymouth, MA
Westport, MA
Portsmouth, NH
Point Pleasant, NJ
Cape May, NJ
Greenport, NY
Newport News, VA
Montauk, NY
Hampton Bays, NY
Newport, RI
Hampton, VA
1995-2001 data based on vessels that were issued a monkfish permit during the 2001 fishing year. 2002-2004 fishing year data are based on vessels issued a monkfish permit during the 2002-2004 fishing years, respectively. Table 23 - Monkfish landings and revenues for monkfish secondary and other ports, FY 1995 – 2004, and principal port, FY 2004.

2006 Annual Adjustment and 2004 SAFE Report Monkfish FMP
45
1 Westport, MA 25 56.9% 69.0% 42.5% 40.8% 49.6% 51.2% 62.9% 37.4% 47.3% 28.9%2 Port Clyde, ME 17 10.6% 7.7% 13.7% 19.2% 37.6% 44.6% 36.5% 32.7% 36.1% 35.4%3 Plymouth, MA 27 6.0% 4.2% 6.3% 7.9% 7.5% 38.5% 29.8% 28.6% 4.6% 23.0%4 South Bristol, ME 6 7.1% 7.6% 7.5% 13.5% 22.6% 42.5% 32.4% 27.7% 35.6% 34.1%5 Portsmouth, NH 50 11.8% 12.5% 19.8% 19.4% 38.4% 39.9% 49.8% 37.8% 31.3% 28.5%6 Scituate, MA 27 5.9% 3.5% 3.2% 20.2% 30.5% 40.5% 34.5% 17.5% 30.7% 14.1%7 Boston, MA 23 13.1% 10.8% 14.0% 13.5% 27.4% 30.8% 20.6% 23.6% 23.3% 27.8%8 Portland, ME 125 12.5% 13.0% 13.9% 14.4% 23.5% 26.2% 22.2% 27.6% 26.3% 27.4%9 Rockland, ME 8 17.6% 22.4% 4.1% 9.0% 12.3% 14.3% 9.5% 2.8% 4.2% 0.3%10 Long Beach/Barnegat Light, NJ 7 17.7% 21.6% 14.8% 28.6% 39.1% 22.3% 34.2% 24.0% 25.1% 74.1%11 Gloucester, MA 246 10.2% 6.9% 5.2% 5.8% 13.2% 18.0% 15.8% 15.1% 12.9% 14.3%12 Point Judith, RI 139 6.6% 12.7% 9.1% 8.5% 10.6% 13.3% 11.2% 8.0% 9.6% 4.2%13 Newport, RI 46 6.2% 9.5% 10.1% 10.7% 23.6% 11.4% 13.3% 12.1% 18.0% 10.9%14 Chatham, MA 126 2.8% 22.4% 2.6% 4.9% 5.7% 11.2% 9.3% 19.9% 18.0% 10.9%15 Point Pleasant, NJ 79 2.0% 7.1% 10.6% 19.0% 19.1% 9.0% 13.8% 8.0% 7.1% 4.0%16 New Bedford, MA 408 13.4% 9.4% 14.0% 15.8% 11.5% 8.1% 5.9% 4.1% 4.5% 3.5%17 Hampton Bays, NY 50 2.5% 9.5% 8.1% 10.0% 10.1% 7.9% 9.7% 7.0% 6.4% 3.5%18 Ocean City, MD 29 7.3% 15.0% 12.3% 11.7% 15.3% 4.3% 4.8% 0.8% 2.2% 1.5%19 Provincetown, MA 39 9.0% 4.9% 2.5% 8.1% 6.7% 4.3% 0.9% 2.2% 4.3% 4.8%20 Montauk, NY 83 0.9% 1.4% 1.8% 3.3% 2.1% 1.6% 2.3% 3.4% 6.2% 3.4%21 Cape May, NJ 190 1.5% 1.8% 2.4% 1.9% 1.4% 1.2% 0.7% 0.5% 0.6% 0.3%22 Greenport, NY 6 1.7% 2.6% 2.9% 2.0% 1.3% 1.0% 1.1% 0.6% 0.2% 0.1%23 Hampton, VA 63 4.0% 5.1% 2.7% 2.9% 1.2% 0.8% 0.6% 0.2% 0.2% 0.3%24 Newport News, VA 73 1.8% 2.2% 3.9% 2.8% 0.9% 0.5% 0.2% 0.2% 0.2% 0.1%
Source: NMFS Statistics Office, dealer weighout database & permit database
FY2000 FY2001 FY2002 FY2003
1995-2001 data based on vessels that were issued a monkfish permit during the 2001 fishing year. 2002-2004 fishing year data are based on vessels issued a monkfish permit during the 2002-2004 fishing years, respectively.
Number of VesselsHOME PORT FY1995 FY1996 FY1997 FY1998 FY1999 FY2004
Table 24 - Monkfish Revenues, FY 1995-2004, as a Percentage of Total Revenues by Port

2006 Annual Adjustment and 2004 SAFE Report Monkfish FMP
46
5.0 Environmental Consequences of Proposed Action
5.1 Biological Impacts
5.1.1 Impact on monkfish and non-target species The proposed action is consistent with the stock-rebuilding program adopted in Framework 2, and as such, is designed to result in an increase in monkfish biomass to the target level by 2009. Since the northern and southern stock biomass indices (3-year average) are approximately 34% and 40% below the 2005 targets, the TACs will be reduced from previous year’s landings proportionally. The 2004 NFMA and SFMA landings, however, were 69% and 90% of the target TACs, respectively, which could be due to either a decrease in availability of monkfish or to the effectiveness of the full range of management measures in place, or a combination. As a result of the lower landings, as well as evidence in the survey of some modest recruitment, the 2005 biomass indices actually increased in both areas (although the increase in the southern area was minimal), reversing a three-year decline, however, the three-year average that is used to evaluate stock status declined. The substantial reduction in monkfish effort for FY 2006 in the SFMA (only 12 DAS available for use, compared to 40 in the current year and 28 in the prior year), combined with the reductions in effort being developed for the multispecies fishery (specifically Framework 42 and any Secretarial action that would take effect May 1), and the effect of Monkfish Framework 3 (prohibiting the targeting of monkfish on multispecies B-regular DAS), if approved, which will impact monkfish fishing in both areas, will likely result in reduced fishing effort on monkfish and on incidentally caught species. Since the proposed adjustment is effective for only one year, however, the biological benefits are not likely to be significant over the long term, unless effort controls are maintained at a level that allows the stocks to rebuild to the goals established by the FMP. Without the ability to reliably estimate fishing mortality, and to project stock growth at various levels of fishing mortality, it is not possible to quantify the biological effects of this annual adjustment on target species in either the short or long term. Qualitatively, lower levels of effort will reduce mortality on target species and incidental catch species. The rates of incidental catch and bycatch for most other species encountered in the directed monkfish fishery are low, according to limited number of observations reported in Section 5.3.5 of Amendment 2. Amendment 2 reported that the overall rate of discards appears to be highest in trawl gear and lowest in large mesh gillnet fisheries. Winter skates and dogfish are the predominant species discarded in the NFMA, and winter and thorny skates, as well as dogfish are discarded in the SFMA. The limited number of observations available, however, precludes a quantitative assessment of the bycatch rates of non-target species on a fishery-wide basis. It can be noted that winter skates are not overfished and overfishing is not occurring, and that thorny skates are overfished but overfishing is not occurring according to the Q4 2005 Status of Stocks Report (NOAA/NMFS). The 2005 Skate annual review concluded that thorny skates are rebuilding. Furthermore, all vessels are required by the Skate FMP to discard all thorny skates. Overfishing is not occurring on spiny dogfish, and although there is no minimum biomass threshold established in the FMP for this stock, based on NMFS’ recommended threshold, the

2006 Annual Adjustment and 2004 SAFE Report Monkfish FMP
47
stock would be considered overfished.Based on this analysis, the proposed action is neutral, particularly in the NFMA, or slightly positive in the short term (the one year duration of the specifications) on non-target species.
5.1.2 Impact on Protected Species NOAA Fisheries previously considered the effects of implementation of Framework 2 on Endangered Species Act (ESA)-listed cetaceans, sea turtles, shortnose sturgeon, and Atlantic salmon during Section 7 consultation on the fishery, which was completed on April 14, 2003. The Biological Opinion (Opinion) for that consultation concluded that the proposed action was not likely to result in jeopardy to any ESA-listed species inhabiting the management unit. A revised Incidental Take Statement was provided for the anticipated taking of loggerhead, leatherback, green, and Kemp’s ridley sea turtles in the fishery. Reasonable and prudent measures to reduce the likelihood of takes were also provided to address the possible entanglement of sea turtles in the fishery. Under Framework 2, the 2003 fishing year TACs and the 2003 fishing year SFMA trip limits were greater than in any subsequent year, and substantially greater than what is currently proposed for FY2006. Therefore, the proposed FY2006 specifications for the monkfish fishery are not expected to result in an increase in effort in the fishery than what was considered in the Opinion for Framework 2. The proposed action would limit vessels to 12 monkfish DAS in the SFMA and maintain the ability to fish up to 40 DAS in the NFMA (not in addition to the SFMA DAS). This is a reduction in the SFMA monkfish effort, and the lowest level allowed since the DAS program was implemented in FY2000. The effects on ESA-listed species of 40 DAS allocated between the NFMA and the SFMA were previously reviewed in the April 14, 2003, Section 7 consultation on the monkfish fishery. Therefore, reducing, for one year, the number of DAS that could be used in the SFMA could result in a short-term benefit to ESA-listed species, while maintaining the 40 DAS allocation in the NFMA does not result in an increase in effort from what has already been considered in the previous Opinion. (As noted in the discussion of Table 5 in Section 4.1.2, the analysis of turtle/monkfish gear interactions has not been completed to support any definitive conclusions about the impact of effort reductions or turtle closures.) Therefore, the Councils do not expect a significant impact, positive or negative, from the proposed adjustment on marine mammals and other protected species compared to what was analyzed in Framework 2.
5.2 Habitat Impacts and EFH Assessment The embodied essential fish habitat (EFH) assessment is provided pursuant to 50 CFR 600.920(e) of the EFH Final Rule to initiate EFH consultation with the National Marine Fisheries Service. Even though this action will reduce SFMA monkfish effort from the previous year in FY 2006, the reduction will only be in effect for one year, and the habitat effects, although likely positive, will not be significant. This action proposes no change to the effort available to vessels in the NFMA, and, therefore, overall, there will be no habitat impacts of the proposed action relative to prior EFH assessments of the fishery (most recently, that contained in Amendment 2).
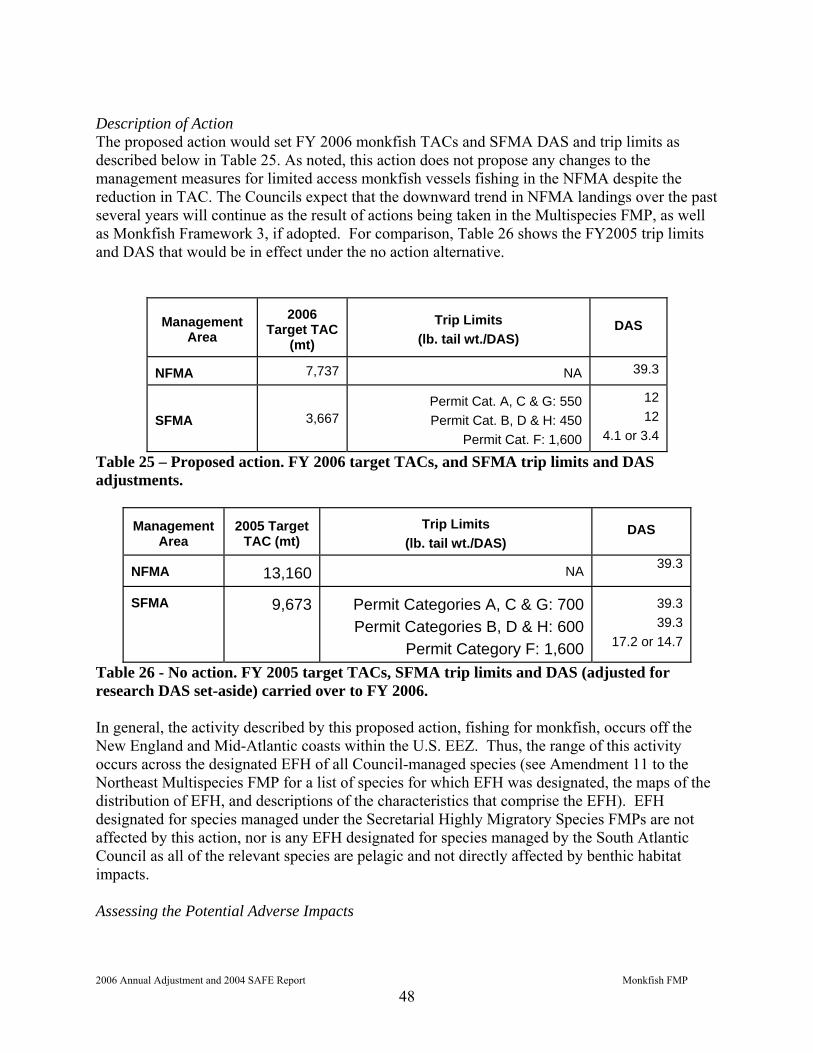
2006 Annual Adjustment and 2004 SAFE Report Monkfish FMP
48
Description of Action The proposed action would set FY 2006 monkfish TACs and SFMA DAS and trip limits as described below in Table 25. As noted, this action does not propose any changes to the management measures for limited access monkfish vessels fishing in the NFMA despite the reduction in TAC. The Councils expect that the downward trend in NFMA landings over the past several years will continue as the result of actions being taken in the Multispecies FMP, as well as Monkfish Framework 3, if adopted. For comparison, Table 26 shows the FY2005 trip limits and DAS that would be in effect under the no action alternative.
Management
Area
2006
Target TAC (mt)
Trip Limits
(lb. tail wt./DAS) DAS
NFMA 7,737
NA 39.3
SFMA 3,667
Permit Cat. A, C & G: 550 Permit Cat. B, D & H: 450
Permit Cat. F: 1,600
12 12
4.1 or 3.4
Table 25 – Proposed action. FY 2006 target TACs, and SFMA trip limits and DAS adjustments.
Management
Area
2005 Target
TAC (mt)
Trip Limits
(lb. tail wt./DAS) DAS
NFMA
13,160
NA 39.3
SFMA
9,673
Permit Categories A, C & G: 700 Permit Categories B, D & H: 600
Permit Category F: 1,600
39.3 39.3
17.2 or 14.7
Table 26 - No action. FY 2005 target TACs, SFMA trip limits and DAS (adjusted for research DAS set-aside) carried over to FY 2006. In general, the activity described by this proposed action, fishing for monkfish, occurs off the New England and Mid-Atlantic coasts within the U.S. EEZ. Thus, the range of this activity occurs across the designated EFH of all Council-managed species (see Amendment 11 to the Northeast Multispecies FMP for a list of species for which EFH was designated, the maps of the distribution of EFH, and descriptions of the characteristics that comprise the EFH). EFH designated for species managed under the Secretarial Highly Migratory Species FMPs are not affected by this action, nor is any EFH designated for species managed by the South Atlantic Council as all of the relevant species are pelagic and not directly affected by benthic habitat impacts. Assessing the Potential Adverse Impacts

2006 Annual Adjustment and 2004 SAFE Report Monkfish FMP
49
The proposed action will result in a short-term reduction in SFMA monkfish landings and effort from the previous year, and no direct change to effort in the NFMA, therefore, there will be no adverse habitat impacts of the proposed action. Minimizing or Mitigating Adverse Impacts There are no adverse habitat impacts of the proposed action and, therefore, no additional steps are needed to minimize or mitigate the effects of the fishery on EFH for any federally managed species. Any known adverse effects of the fishery are minimal and on benthic habitats are minimized by the baseline habitat protections established under Amendment 13 to the Northeast Multispecies FMP. The fishery must respect the 2,811 square nautical miles of habitat closed areas established by the Amendment 13 as well as the Oceanographer and Lydonia Canyon closures adopted in Amendment 2 to the Monkfish FMP. Therefore, effort will occur in areas that are already open to bottom tending mobile gears or by gears that have been determined to not adversely impact EFH in a manner that is more than minimal and less than temporary in nature. Conclusions The action proposed under this annual adjustment will not have an adverse effect on EFH of federally managed species, and, therefore, no EFH consultation is required.
5.3 Socioeconomic Impacts
5.3.1 Introduction to the social impact assessment This assessment is an extension of the economic analysis found in Section 6.3 of this document, the Initial Regulatory Flexibility Analysis (IRFA). The need to assess social impacts emanating from federally mandated fishing regulations stems from National Environmental Policy Act (NEPA) and Sustainable Fisheries Act (SFA). National Standard 8 of the SFA demands that “Conservation and management measures shall, consistent with the conservation requirements of this Act (including the prevention of over fishing and rebuilding of overfished stocks), take into account the importance of fishery resources to fishing communities in order to (A) provide for the sustained participation of such communities, and (B) to the extent practicable, minimize adverse economic impacts on such communities” (16 U.S.C.§1851(2)(8)). The analysis that follows provides a context for understanding possible social impacts resulting from the proposed measures in this environmental assessment. Daily routines, safety, occupational opportunities, and community infrastructure are examples of social impacts that can be affected by changes in management measures. Modifications to daily routines can make long-term planning difficult. Changes in management measures that limit access to fishing may, in some instances increase the likelihood of safety risks. Increased risk can result when fishermen spend longer periods at sea in order to maximize fishing time per allocated DAS (that is, reduce the proportion of steaming time relative to fishing time per DAS used), operate with fewer crew, or fish in poor weather conditions in order to maximize revenues or profits. When fishing under a restrictive trip limit such as that proposed in this action, however, the incentive to take such risks is reduced because operators return to port once the allowed catch limit is reached, unless additional revenues can be achieved from continuing to fish for other species.

2006 Annual Adjustment and 2004 SAFE Report Monkfish FMP
50
On a broader perspective, occupational opportunities within the fishing industry have been declining as regulations are implemented to reduce effort across a range of fisheries and rebuild stocks. Furthermore, as effort consolidation programs such as DAS leasing or transfers are implemented in various fisheries the number of participants declines, although those that remain can operate at a higher level of effort. Management measures that further reduce occupational opportunities may have social impacts on the future viability of commercial fishing unless they result in healthier, sustainable fisheries. Impacts that decrease occupational opportunities in the short term can in turn affect community infrastructure. More specifically, port infrastructure may be affected by the loss of shore based services essential to a strong working waterfront. On the other hand, if such short-term reductions in opportunity result in sustainable fisheries operating at long-term optimum yield levels, fishing communities will benefit from the stabilized and predictable levels of catch and revenues that would ensue.
5.3.2 Social impact of proposed action This section analyzes the social impact of the adjustment to the SFMA trip limit and DAS. Section 6.3, the Regulatory Impact Review, describes the negative financial returns to vessels, their home port states and crew from this action in comparison to the previous year. When compared to FY2005, the negative economic impact of the proposed action could have a commensurate short-term social impact on crew and communities affected by the reductions. The long-term effect, however, depends on the pace of rebuilding monkfish stocks, and the degree to which vessels, crew and communities can remain viable over the short term. It should also be noted that the FY2005 trip limits and DAS were an increase from the previous year, thereby mitigating some of the short-term effects of the rebuilding program. For communities that are homeport to vessels landing monkfish exclusively in the SFMA, the potential negative impact of this adjustment will be greater than for vessels landing monkfish from both areas. Both crew and vessel returns from monkfish trips will decline substantially compared to the previous year in many, but not all of the ports where monkfish is landed. It should be noted that in the previous year both trip limits and DAS available for monkfishing in the SFMA were increased from FY2004, and these same communities realized the greatest increase in crew and vessel monkfish returns. As shown in Table 27, Westport, Fairhaven and New Bedford, MA, Little Compton, Newport and Tiverton, RI, and Waretown and Barnegat Light, NJ will all see vessel and crew returns from monkfish decline more than 50% from 2005. The same is true of vessels’ communities (measured as homeport). Estimated decreases in crew returns closely followed vessel returns. Note that ports where fewer than three vessels are homeported are aggregated due to confidentially considerations. For vessels landing monkfish from both the SFMA and the NFMA, the potential impacts of this adjustment by homeport will not be as large compared to those for vessels fishing exclusively in the SFMA (Table 28). All of the vessels and crew fishing in both areas, when grouped by homeport, will see less than a 10% decline in monkfish returns, with the exception of Barnegat Light, NJ, which is projected to have a decline of 16.5%. The total decline in vessel returns from monkfish will be less than 1% for vessels fishing for monkfish in both areas, compared to 34.4% percent for vessels fishing exclusively in the SFMA. Of the communities listed with a greater-
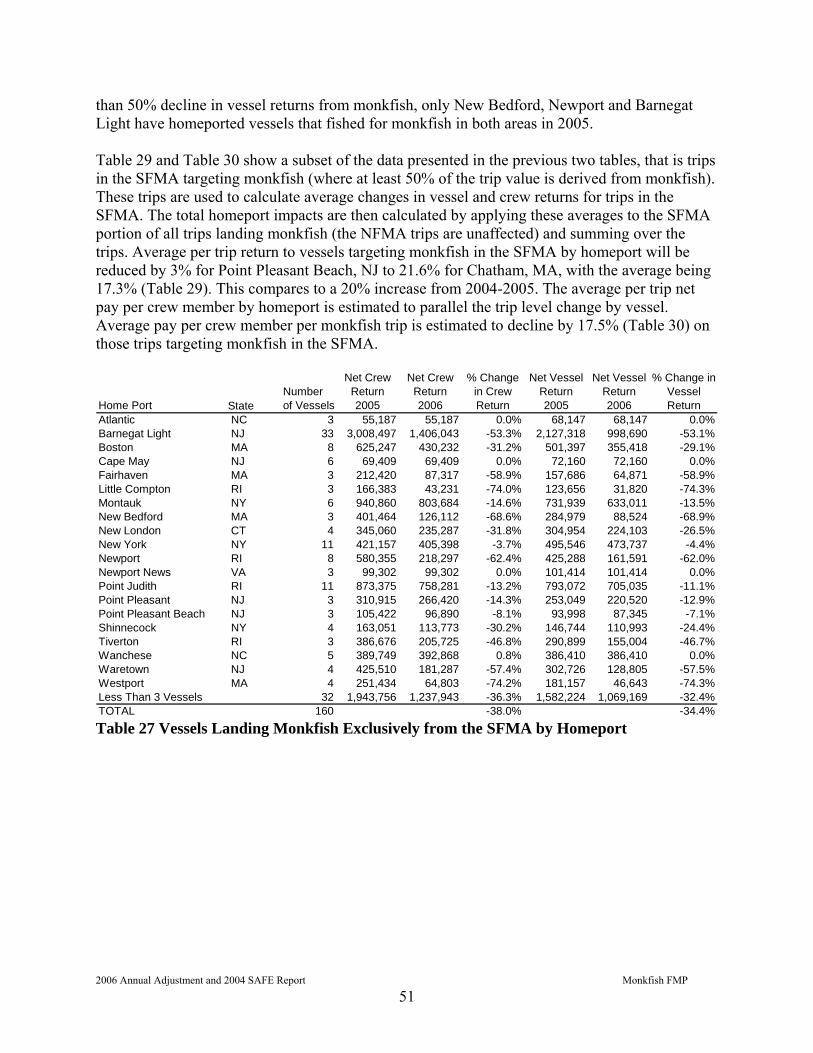
2006 Annual Adjustment and 2004 SAFE Report Monkfish FMP
51
than 50% decline in vessel returns from monkfish, only New Bedford, Newport and Barnegat Light have homeported vessels that fished for monkfish in both areas in 2005. Table 29 and Table 30 show a subset of the data presented in the previous two tables, that is trips in the SFMA targeting monkfish (where at least 50% of the trip value is derived from monkfish). These trips are used to calculate average changes in vessel and crew returns for trips in the SFMA. The total homeport impacts are then calculated by applying these averages to the SFMA portion of all trips landing monkfish (the NFMA trips are unaffected) and summing over the trips. Average per trip return to vessels targeting monkfish in the SFMA by homeport will be reduced by 3% for Point Pleasant Beach, NJ to 21.6% for Chatham, MA, with the average being 17.3% (Table 29). This compares to a 20% increase from 2004-2005. The average per trip net pay per crew member by homeport is estimated to parallel the trip level change by vessel. Average pay per crew member per monkfish trip is estimated to decline by 17.5% (Table 30) on those trips targeting monkfish in the SFMA.
Home Port StateNumber of Vessels
Net Crew Return 2005
Net Crew Return 2006
% Change in Crew Return
Net Vessel Return 2005
Net Vessel Return 2006
% Change in Vessel Return
Atlantic NC 3 55,187 55,187 0.0% 68,147 68,147 0.0%Barnegat Light NJ 33 3,008,497 1,406,043 -53.3% 2,127,318 998,690 -53.1%Boston MA 8 625,247 430,232 -31.2% 501,397 355,418 -29.1%Cape May NJ 6 69,409 69,409 0.0% 72,160 72,160 0.0%Fairhaven MA 3 212,420 87,317 -58.9% 157,686 64,871 -58.9%Little Compton RI 3 166,383 43,231 -74.0% 123,656 31,820 -74.3%Montauk NY 6 940,860 803,684 -14.6% 731,939 633,011 -13.5%New Bedford MA 3 401,464 126,112 -68.6% 284,979 88,524 -68.9%New London CT 4 345,060 235,287 -31.8% 304,954 224,103 -26.5%New York NY 11 421,157 405,398 -3.7% 495,546 473,737 -4.4%Newport RI 8 580,355 218,297 -62.4% 425,288 161,591 -62.0%Newport News VA 3 99,302 99,302 0.0% 101,414 101,414 0.0%Point Judith RI 11 873,375 758,281 -13.2% 793,072 705,035 -11.1%Point Pleasant NJ 3 310,915 266,420 -14.3% 253,049 220,520 -12.9%Point Pleasant Beach NJ 3 105,422 96,890 -8.1% 93,998 87,345 -7.1%Shinnecock NY 4 163,051 113,773 -30.2% 146,744 110,993 -24.4%Tiverton RI 3 386,676 205,725 -46.8% 290,899 155,004 -46.7%Wanchese NC 5 389,749 392,868 0.8% 386,410 386,410 0.0%Waretown NJ 4 425,510 181,287 -57.4% 302,726 128,805 -57.5%Westport MA 4 251,434 64,803 -74.2% 181,157 46,643 -74.3%Less Than 3 Vessels 32 1,943,756 1,237,943 -36.3% 1,582,224 1,069,169 -32.4%TOTAL 160 -38.0% -34.4% Table 27 Vessels Landing Monkfish Exclusively from the SFMA by Homeport

2006 Annual Adjustment and 2004 SAFE Report Monkfish FMP
52
Home Port StateNumber of Vessels
Net Crew Return 2005
Net Crew Return 2006
% Change in Crew Return
Net Vessel Return 2005
Net Vessel Return 2006
% Change in Vessel Return
Barnegat Light NJ 3 418,124 348,282 -16.7% 293,531 245,077 -16.5%Boston MA 60 11,154,123 11,060,715 -0.8% 9,945,917 9,876,889 -0.7%Chatham MA 13 1,400,002 1,308,567 -6.5% 1,019,929 953,861 -6.5%Cundys Harbor ME 4 603,068 603,068 0.0% 527,548 527,548 0.0%Gloucester MA 49 5,196,155 5,153,137 -0.8% 4,632,431 4,601,907 -0.7%Manchester MA 3 412,934 409,175 -0.9% 302,870 300,282 -0.9%Montauk NY 6 5,256,056 5,254,970 0.0% 4,163,943 4,162,012 0.0%Narragansett RI 3 416,610 416,610 0.0% 453,704 453,704 0.0%New Bedford MA 59 8,240,141 8,207,867 -0.4% 8,021,560 7,999,060 -0.3%Newburyport MA 4 283,641 283,641 0.0% 243,008 243,008 0.0%Newport RI 8 1,160,410 1,160,410 0.0% 1,273,498 1,273,498 0.0%Plymouth MA 4 530,250 521,566 -1.6% 387,836 381,256 -1.7%Point Judith RI 25 4,250,528 4,250,528 0.0% 4,148,229 4,148,229 0.0%Port Clyde ME 9 871,815 871,815 0.0% 700,938 700,938 0.0%Portland ME 23 3,612,941 3,612,941 0.0% 3,369,179 3,369,179 0.0%Portsmouth NH 13 1,181,123 1,166,511 -1.2% 922,777 911,888 -1.2%Provincetown MA 3 148,490 148,490 0.0% 130,381 130,381 0.0%Rye NH 5 540,368 518,633 -4.0% 404,502 389,401 -3.7%Scituate MA 6 320,603 295,078 -8.0% 245,821 228,152 -7.2%South Bristol ME 5 443,920 443,920 0.0% 379,661 379,661 0.0%Wakefield RI 3 729,178 729,178 0.0% 710,629 710,629 0.0%Wanchese NC 3 524,029 524,029 0.0% 518,403 518,403 0.0%Less Than 3 Vessels 62 6,791,089 6,644,586 -2.2% 6,091,503 5,985,996 -1.7%TOTAL 373 -1.0% -0.8% Table 28 Vessels Landing Monkfish from Both Management Areas by Homeport
Home Port StateNumber
of VesselsNumber of
Trips
Average Vessel Return with FY2005
Trip Limits
Average Vessel Return with FY2006
Trip Limits
Percent Change in Average Vessel
ReturnBarnegat Light NJ 35 1222 1132 914 -19.3%Boston MA 14 397 1373 1168 -14.9%Chatham MA 10 197 1264 991 -21.6%Fairhaven MA 3 54 1458 1158 -20.6%Gloucester MA 6 93 1234 1009 -18.2%Little Compton RI 3 84 888 771 -13.2%Montauk NY 7 191 1224 1029 -15.9%New Bedford MA 6 145 1770 1474 -16.7%New London CT 3 57 1064 860 -19.2%New York NY 3 51 816 715 -12.4%Newport RI 11 197 1268 1056 -16.7%Plymouth MA 3 61 1575 1249 -20.7%Point Judith RI 12 125 1752 1620 -7.5%Point Pleasant NJ 4 91 1116 938 -15.9%Point Pleasant Beach NJ 3 11 739 716 -3.1%Tiverton RI 3 118 1342 1093 -18.6%Waretown NJ 4 136 1379 1127 -18.3%Westport MA 6 186 1214 994 -18.1%Less Than 3 Vessels 33 1067 961 800 -16.8%TOTAL 169 4483 1184 980 -17.3% Table 29 Average per Trip Return to Vessels by Home Port (60/40 Lay System)

2006 Annual Adjustment and 2004 SAFE Report Monkfish FMP
53
Home Port StateNumber
of VesselsNumber of
Trips
Average Net Pay per Crew Member with FY2005 Trip Limits
Average Net Pay per Crew Member with FY2006 Trip Limits
Percent Change in Average Payment per Crew Member
Barnegat Light NJ 35 1222 735 594 -19.2%Boston MA 14 397 563 478 -15.1%Chatham MA 10 197 564 447 -20.7%Fairhaven MA 3 54 570 464 -18.6%Gloucester MA 6 93 588 483 -17.9%Little Compton RI 3 84 359 311 -13.4%Montauk NY 7 191 604 502 -16.9%New Bedford MA 6 145 746 618 -17.2%New London CT 3 57 511 416 -18.6%New York NY 3 51 530 466 -12.1%Newport RI 11 197 463 382 -17.5%Plymouth MA 3 61 560 441 -21.3%Point Judith RI 12 125 547 496 -9.3%Point Pleasant NJ 4 91 504 421 -16.5%Point Pleasant Beach NJ 3 11 473 457 -3.4%Tiverton RI 3 118 533 436 -18.2%Waretown NJ 4 136 590 482 -18.3%Westport MA 6 186 571 466 -18.4%Less Than 3 Vessels 33 1067 588 492 -16.3%TOTAL 169 4483 613 506 -17.5%
Table 30 Average per Trip Net Pay per Crew Member by Home Port (60/40 Lay System)
5.4 Environmental Consequences of the No Action Alternative The no action alternative, while not feasible from a regulatory standpoint, would result in FY 2005 TACs and SFMA trip limits and DAS allocations being retained for FY 2006. (See Table 3)
5.4.1 Biological Impacts of no action In the NFMA, the no action alternative would have the same environmental consequences as the proposed action even though the target TAC for the NFMA would be higher (13,160 vs. 7,737 mt). This is because the change in target TAC for the NFMA does not require a change in management measures (i.e., DAS or trip limits), as discussed in Section 1.0 of this EA. Even though no management measures would be implemented under this FMP to control effort in the NFMA, effort reductions in the multispecies fishery will likely reduce effort on monkfish, since almost all of the directed monkfish landings in this area are taken on multispecies DAS. Conversely, the no action alternative would result in higher trip limits and DAS available for vessels fishing in the SFMA than under the proposed action (40 DAS vs. 12, and trip limits of 700 lb. and 600 lb. vs. 550 lb. and 450 lb.). These higher DAS and trip limits could have a negative effect on monkfish stock rebuilding since more monkfish would likely be harvested. Furthermore, the higher trip limits and DAS would result in more effort in the SFMA than under the proposed action, potentially increasing the bycatch of non-target species. The level of effort allowed under the no-action alternative is inconsistent with the stock-rebuilding program and could delay achieving the FMP objectives. If the no-action alternative were adopted for FY2006, more restrictive adjustments in the future would partially offset the negative biological effect of no action in FY2006, since the stock rebuilding plan implemented in Framework 2 requires an annual adjustment to achieve the stock rebuilding goals of the FMP.
2006 Annual Adjustment and 2004 SAFE Report Monkfish FMP
54
The rates of incidental catch and bycatch for most other species encountered in the directed monkfish fishery are low, according to limited number of observations reported in Section 5.3.5 of Amendment 2. Amendment 2 reported that the overall rate of discards appears to be highest in trawl gear and lowest in large mesh gillnet fisheries. Winter skates and dogfish are the predominant species discarded in the NFMA, and winter and thorny skates, as well as dogfish are discarded in the SFMA. The limited number of observations available, however, precludes a quantitative assessment of the bycatch rates of non-target species on a fishery-wide basis. It can be noted that winter skates are not overfished and overfishing is not occurring, and that thorny skates are overfished but overfishing is not occurring according to the Q4 2005 Status of Stocks Report (NOAA/NMFS). The 2005 Skate annual review concluded that thorny skates are rebuilding. Furthermore, all vessels are required by the Skate FMP to discard all thorny skates. Overfishing is not occurring on spiny dogfish, and although there is no minimum biomass threshold established in the FMP for this stock, based on NMFS’ recommended threshold, the stock would be considered overfished. Based on this analysis, the no action alternative is neutral, particularly in the NFMA, or slightly negative in the short term (the one year duration of the specifications) on non-target species.
5.4.1.1 Impacts on Protected Species of no action The no action alternative does not increase effort over the baseline 40 DAS analyzed in the EIS for Amendment 2 to the FMP, however, this level of effort is higher than the proposed action in the SFMA. Therefore, the Councils anticipate that over the short term, the no action alternative could be moderately negative relative to the proposed action in terms of impact on protected species as a result of the larger number of DAS available under the no action alternative. The analysis of recent sea turtle/monkfish gear interactions, however, has not been completed to support a definitive conclusion of the effect of greater number of DAS.
5.4.1.2 Habitat Impacts of no action The no action alternative would continue the FY2005 DAS available to limited access monkfish vessels fishing in the SFMA at a higher level than the proposed action (40 DAS vs. 12). This level of effort would only minimally impact habitat since approximately three-fourths of the monkfish effort in the SFMA is using gillnets. Therefore, because gillnets have been determined to not adversely affect EFH, any negative effects to EFH resulting from the higher level of fishing effort in the SFMA under the no action alternative are expected to be minimal. With respect to the NFMA, the no action alternative comprises the same management measures as the proposed action, since there is no monkfish trip limit for limited access monkfish vessels that fish in the NFMA under either a monkfish or a NE multispecies DAS, and monkfish DAS are not being adjusted by the proposed action. Therefore, the habitat impacts of the no-action alternative are expected to be the same as those of the proposed action for the NFMA.
5.4.2 Socioeconomic Impacts of no action The no action alternative would enable vessels in the SFMA to fish at a higher level than under the proposed action for FY2006, both in terms of DAS and trip limits. As a result, the no action alternative would have a short-term benefit to monkfish vessels that fish in the SFMA, and their communities. According to the data presented in Table 27, 160 vessels and 20 ports with three or more vessels depend to varying degrees on monkfish fishing exclusively in the SFMA. Under the
2006 Annual Adjustment and 2004 SAFE Report Monkfish FMP
55
no-action alternative, these vessels, crew and ports would be relieved of the short-term negative effect of the proposed action. Over the long term, however, since the higher level of effort will delay rebuilding and likely cause more restrictive measures to be implemented in the future, the no-action alternative would likely have a negative long-term effect. As stated above in Section 5.4.1, the no-action alternative would not result in different management measures for the NFMA than under the proposed action. Therefore, although the no-action target TAC of 13,160 mt is higher than the proposed target TAC of 7,737 mt, there are no anticipated social or economic benefits to vessels fishing in the NFMA under the no action alternative.
5.5 Cumulative Effects
5.5.1 Introduction The purpose of this section is to summarize the incremental impact of the proposed action on the environment resulting when added to other past, present and reasonably foreseeable future actions regardless of what agency or person undertakes them. The National Environmental Policy Act (NEPA) requires that cumulative effects of “past, present, and reasonably foreseeable future actions” (40 CFR § 1508.7) be evaluated along with the direct effects and indirect effects of each proposed alternative. Cumulative impacts result from the combined effect of the proposed action’s impacts and the impacts of other past, present, and reasonably foreseeable future actions. These impacts can result from individually minor but collectively significant actions taking place over a period of time. The Council on Environmental Quality (CEQ) directs federal agencies to determine the significance of cumulative effects by comparing likely changes to the environmental baseline. On a more practical note, the CEQ (1997) states that the range of alternatives considered must include the “no-action alternative as a baseline against which to evaluate cumulative effects.” Therefore, the analyses in this document, referenced in the following cumulative impacts discussion, compare the likely effects of the proposed action to the effects of the no-action alternative. CEQ Guidelines state that cumulative effects include the effects of all actions taken, no matter who (federal, non-federal or private) has taken the actions, but that the analysis should focus on those effects that are truly meaningful in terms of the specific resource, ecosystem and human community being affected. Thus, this section will contain a summary of relevant past, present and reasonably foreseeable future actions to which the proposed alternatives may have a cumulative effect. This analysis has taken into account, to the extent possible, the relationship between historical (both pre- and post-FMP) and present condition of the monkfish population and fishery, although significantly less is known about the population and the fishery prior to the implementation of the FMP and other management actions affecting the fishery (particularly Multispecies Amendments 5 and 7 and Sea Scallop Amendment 4). In terms of past actions for fisheries, habitat and community impacts, the temporal scope for this analyis is primarily focused on the 1980’s and 1990’s, although some historical trawl survey data extending to the 1960’s is considered. For endangered and other protected species, the context is largely focused on the 1980’s and 1990’s, when NMFS began generating stock assessments for marine mammals and sea turtles that inhabit waters of the U.S. EEZ. In terms of future actions,

2006 Annual Adjustment and 2004 SAFE Report Monkfish FMP
56
the analysis examines the period between implementation of these specifications (Spring 2006) and approximately 5-10 years (the period of the rebuilding program and immediately following). The geographic scope of the analysis of impacts to fish species and habitat for this action is the range of the fisheries in the Western Atlantic Ocean, as described in the Affected Environment (Section 4.0), For endangered and protected species, the geographic range is the total range of each species as described in Appendix II. The geographic range for community impacts is defined as those fishing communities bordering the range of the monkfish fishery (Section Error! Reference source not found.), from the U.S.-Canada border to, and including North Carolina. The cumulative effects analysis focuses on five Valued Environmental Components (VEC’s):
1. target species (monkfish) 2. non-target species (incidental catch and bycatch) 3. protected species 4. habitat, and 5. communities.
The cumulative effects determination on these VEC’s is based on the following analyses: (1) the discussion in this section of non-fishing actions occurring outside the scope of this FMP; (2) the analysis of direct and indirect impacts contained in the Environmental Consequences section; and (3) the summary of past, present and future actions affecting the monkfish fishery. NOAA Fisheries staff determined that the 5 VECs (target species, non-target species, protected species, habitat and communities) are appropriate for the purpose of evaluating cumulative effects of the proposed action based on the environmental components that have historically been impacted by fishing, and statutory requirements to complete assessments of these factors under the Magnuson-Stevens Act, Endangered Species Act, Marine Mammal Protection Act, Regulatory Flexibility Act, and several Executive Orders. The VECs are intentionally broad (for example, there is one devoted to protected species, rather than just marine mammals, and one on habitat, rather than Essential Fish Habitat) to allow for flexibility in assessing all potential environmental factors that are likely to be impacted by the action. While subsistence fishing would ordinarily fall under the “communities” VEC, no subsistence fishing or Indian treaty fishing take place in the area managed under this FMP. The vessels participating in the monkfish fishery must comply with all federal air quality (engine emissions) and marine pollution regulations, and, therefore, do not significantly affect air or marine water quality. Consequently, the management measures contained in this adjustment would not likely result in any additional impact to air or marine water quality.
5.5.2 Past, Present, and Reasonably Foreseeable Future Actions The current condition of the monkfish fishery (in the context of the five VECs) is the result of the cumulative effect of the Monkfish FMP, implemented in 1999, and regulations under other FMPs in the region that impact vessels catching monkfish as well as measures adopted under other laws, particularly the Endangered Species Act and the Marine Mammal Protection Act.

2006 Annual Adjustment and 2004 SAFE Report Monkfish FMP
57
The two FMP’s that have had the greatest impact on monkfish fishery VECs, other than the Monkfish FMP, are the Sea Scallop and Northeast Multispecies FMP’s because of the spatial overlap of the fisheries, the relatively high level of incidental catch of monkfish in those fisheries, and the fact that more than 90 percent of the monkfish limited access permit holders are also permitted in one or the other of those two fisheries. Both Multispecies and Sea Scallop fisheries have undergone a series of major actions since 1994 to reduce fishing effort and rebuild overfished stocks (see Section 1.2.2). These actions have reduced overall fishing effort significantly since 1994, and have imposed other restrictions such as year-round and seasonal closed areas, and gear restrictions that have affected both the directed and incidental catch monkfish fishery. Most recently, Multispecies Amendment 13, and Frameworks 40A, 40B, and 41 have resulted in substantial reductions in multispecies effort, particularly on stocks of concern. The NEFMC is proposing Multispecies Framework 42 which could impose additional restrictions on multispecies fishing effort and prohibit the use of multispecies B-regular DAS to target monkfish. Also, Atlantic Sea Scallop Amendment 10 and Frameworks 16 and 17 have implemented area rotation measures and set scallop DAS levels to achieve mortality targets. In general these actions have reduced both DAS and the dredge contact time with the bottom as a result of increases in yield per recruit, and have, therefore, reduced overall levels of monkfish incidental catch. Improvements in the profitability of the scallop fishery have also reduced directed effort on monkfish by scallop vessels with monkfish limited access permits, since such vessels do not use their monkfish DAS (which would require also using a scallop DAS). Cumulatively, these actions have likely had a positive effect on the direct and incidental monkfish fisheries, principally as a result of the overall reduction in fishing effort (limited entry and DAS controls), closed areas, and the increased selectivity of gears used in those fisheries, as well as the relative profitability of some rebuilt stocks, such as scallops, which has resulted in a redirection of effort. In addition, these actions have contributed to mitigating the effect of fishing on protected species, habitat and communities. Other FMPs that likely have had an impact on the fishery VECs include those managing other demersal species in the region, such as the Skate FMP (implemented 2003), Spiny Dogfish FMP (implemented 2000), and the Summer Flounder, Scup, Black Sea Bass FMP (1996 and amendments). To varying degrees, these management plans, as well as others in the region, have directly or indirectly affected the monkfish fishery by causing effort to shift among fisheries and by changes to the levels of incidental catch of monkfish, but it is not possible to analyze the impact of individual actions on the monkfish fishery. In addition to FMPs implemented by the Councils, other actions that have directly and cumulatively affected the monkfish fishery VEC’s include three federal court decisions (Hall v. Evans, AOC v. Daley, and CLF v. Evans), two marine mammal take reduction plans (Harbor Porpoise and Atlantic Large Whale Take Reduction Plans), and an interim final rule implemented by NMFS under authority of the Endangered Species Act to protect sea turtles. Cumulatively, these actions have limited areas open to fishing on a seasonal basis, specifically to gillnet gear, and have prescribed gear restrictions, including the mandatory use of acoustic deterrent devices in some areas, net limits, and buoy line specifications.

2006 Annual Adjustment and 2004 SAFE Report Monkfish FMP
58
There are several reasonably foreseeable future (RFF) fishery actions that could affect the monkfish fishery. These actions are as follows: • Framework 42 to the NE Multispecies FMP/Framework 3 to the Monkfish FMP. This
multispecies action consists of the setting of revised specifications for the NE multispecies fishery based on an updated assessment of groundfish stocks that took place in 2005. Framework 42 proposes changes to multispecies DAS allocations or usage, possession limits and gear requirements, among other measures. Framework 3 would revise monkfish regulations by prohibiting vessels with both monkfish and multispecies limited access permits from using a multispecies B-regular DAS when fishing on a monkfish DAS. Vessels fishing on a B-regular DAS would operate under the area-specific monkfish incidental catch limits. Framework 3 clarifies the NEFMC’s intent with respect to the B-regular DAS program, which was adopted after the monkfish FMP implemented the joint DAS usage requirement. If adopted, Framework 42 would take effect in FY2006, and NMFS is proposing a Secretarial action that would, among other things, address multispecies rebuilding and the B-regular DAS program starting on May 1, 2006, until Framework 42 is implemented.
• Framework 18 to the Atlantic Sea Scallop FMP. This action which is pending approval by NMFS would set scallop fishery specifications for FY2006 and 2007, and implement other measures which will, among other things, improve yield-per-recruit, reduce administrative burdens and risks to safety-at-sea, and address sea turtle interactions with scallop gear.
• Amendment 11 to the Atlantic Sea Scallop FMP. The NEFMC is considering initiating this amendment to provide more effective management of the general category (currently open access) fishery. This amendment, if development continues would likely take effect in FY2007, and therefore, would have minimal interaction with the measures being considered in this annual adjustment.
• Framework 4 to the Monkfish FMP. In response to the current stock status, and concerns by members of the monkfish fishing communities about the management program’s effectiveness and impact on those communities, the NEFMC has directed the Monkfish Oversight Committee to begin development of a framework adjustment that would be implemented at the start of the 2007 fishing year. At this time, no specific goals or measures have been outlined.
Non-Fishing Actions There are several ongoing, non-fishing actions that could potentially impact the monkfish fishery. These activities include: chemical (e.g. pesticides and oil pollution), biological (e.g. invasive species and pathogens), and physical (e.g. dredging and disposal, coastal development) disturbances to riverine, inshore and offshore fish habitats; power plant operations (thermal pollution and entrainment of larvae); global warming; and energy projects such as liquid natural gas (LNG) facilities (two onshore LNG projects have been constructed, one in Everett, MA and one in Cove Point, MD). The majority of these activities tend to affect inshore areas, and the impacts are often localized. Monkfish are a ubiquitous species that can be found in inshore areas to depths greater than 800 meters. Monkfish are known to migrate seasonally and these migration patterns, although not well understood, are thought to be associated with spawning and food availability. Additionally, monkfish are known to live on various types of substrate from mud to rocky bottom, and can tolerate a wide range of temperatures. Since monkfish are not

2006 Annual Adjustment and 2004 SAFE Report Monkfish FMP
59
dependant upon any particular biological, physical, or habitat requirements during any life stage, the impacts to this species of non-fishing activities such as oil pollution, dredging activities, and coastal development are likely localized, and minimal as a whole. Similarly, as discussed in the paragraphs below, the potential impacts associated with LNGs and windfarms are also localized, with minimal impact to the monkfish fishery as a whole. In addition to ongoing non-fishing impacts, the following RFF actions could impact the monkfish resource: • LNG terminals. LNG facilities are currently proposed or planned for construction in Pleasant
Point, ME (onshore); two projects offshore of Boston, MA, one in Boston Harbor, MA (onshore) and one in Fall River, MA (onshore); Providence, RI (onshore); Long Island Sound, NY (onshore); Logan Township, NJ (onshore); Philadelphia, PA (onshore); and an expansion of an existing facility in Cove Point, MD.
Depending on the specific location and type of LNG facility, a range of impacts to fisheries and/or fisheries habitat may result from both construction and operation of terminals. Due to the large size of LNG tankers, dredging may need to occur in order to access onshore terminals. Dredging can result in direct loss of fish and/or shellfish habitat and can elevate levels of suspended sediment within the water column. As with other dredging, suspended sediments can impact various life stages of fish and shellfish. Further, the construction of pipelines and fill associated with site construction can have adverse impacts on intertidal habitats and salt marshes in the area.
• Offshore wind energy generation projects. Although only two offshore wind energy projects
have formally been proposed in the northeast region, at least 20 other separate projects may be proposed in the near future. Cape Wind Associates (CWA) proposes to construct a wind farm on Horseshoe Shoal, located between Cape Cod and Nantucket in Nantucket Sound, Massachusetts. A second project is proposed by the Long Island Power Authority (LIPA) off Long Island, New York. The CWA project would have 130 wind turbines located as close as 4.1 miles offshore of Cape Cod in an area of approximately 24 square miles with the turbines being placed at a minimum of 1/3 mile apart. The turbines will be interconnected by cables, which will relay the energy to shore to the power grid.
The Army Corps of Engineers developed a DEIS for the proposed CWA project on Horseshoe Shoal. Subsequently, the Minerals Management Service was named the lead Federal agency and a new DEIS is under development. If constructed, the turbines would preempt other bottom uses in an area similar to oil and natural gas leases. The potential impacts associated with the CWA offshore wind energy project include the construction, operation and removal of turbine platforms and transmission cables; thermal and vibration impacts; and changes to species assemblages within the area from the introduction of vertical structures.
5.5.3 Cumulative Effects on the Monkfish Fishery (target species) The proposed action is taken in accordance with the stock-rebuilding program adopted in Framework 2, and is, therefore, expected to have a positive cumulative effect on the monkfish
2006 Annual Adjustment and 2004 SAFE Report Monkfish FMP
60
resource. This program sets annual target TACs and associated management measures based on the progress of the rebuilding program relative to annual rebuilding goals. Thus, in the SFMA, proposed monkfish trip limits and DAS allocations are based on a TAC that is proportionally reduced (since the observed index is below the annual target) from the previous year’s landings. In the NFMA, where the monkfish fishery is closely integrated with the multispecies fishery, the Councils propose no specific action and expect that effort controls implemented in Amendment 13 (primarily, DAS reductions) and subsequent framework adjustments, including effort controls proposed in Framework 42, will effectively keep landings below the target TAC. The cumulative effect of actions proposed in this annual adjustment, in conjunction with actions taken or proposed in the Multispecies FMP to reduce fishing effort on species of concern, combined with the successful management of the scallop fishery allowing those vessels to operate profitably without the need to target monkfish on a scallop DAS, is positive for the monkfish resource. The cumulative effect of non-fishing activities cited above is not likely to be substantial, given the life history and spatial distribution of monkfish relative to those activities.
5.5.4 Cumulative Effects on Non-target Species Since the proposed action reduces effort levels (DAS) from the baseline level established in the FMP, the cumulative effect of the adjustment to the TACs and SFMA trip limits and DAS for FY 2006 on non-target species is expected to be consistent with the neutral or positive cumulative effects of the rebuilding program as described in the FMP and subsequent analyses (Framework 2 and Amendment 2). The principal non-target species affected by the directed monkfish fishery are skates, and both skate species that are in a formal rebuilding plan (thorny and barndoor) are not present in the SFMA. Since the proposed action does not result in an increase in effort in the NFMA, and in combination with Framework 42/3 could actually result in a modest reduction in monkfish effort in that area, the cumulative effect on non-target species is likely to be neutral or positive. Of note, since the effort level is within the baseline analyzed in the Skate FMP, the proposed adjustment does not trigger a skate baseline review. The cumulative effect of non-fishing activities on non-target species affected by the proposed is unknown, but there is no evidence suggesting that they are having a substantial effect.
5.5.5 Cumulative Effects on Protected Species The proposed action maintains or reduces, depending on area, monkfish fishing effort at the level analyzed in Amendment 2 and Framework 2 (40 DAS). Therefore, the proposed action is not expected to have significant cumulative effects on marine mammals and protected species beyond those analyzed and discussed in the noted documents. Those documents concluded that the cumulative effect of the monkfish management program, combined with measures adopted to protect marine mammals and ESA-listed species and effort control programs in other fisheries affecting monkfish vessels could enhance, and at least not undermine the protection of marine mammals and other protected species. There is no evidence suggesting that non-fishing activities are having a cumulative effect on protected species affected by this proposed action.
5.5.6 Cumulative Effects on Habitat The cumulative effect of the proposed action on habitat should be viewed in context of the habitat protection measures adopted in Amendment 2 to the Monkfish FMP, as well as actions taken in Sea Scallop and Multispecies FMPs. Effort reductions and Habitat Closed Areas were adopted in Monkfish Amendment 2, Sea Scallops Amendment 10 and Multispecies Amendment
2006 Annual Adjustment and 2004 SAFE Report Monkfish FMP
61
13 to minimize the adverse impact of mobile, bottom-tending fishing gear (bottom trawls and dredges) on benthic EFH. The effort allocation in the NFMA is unchanged, and in the SFMA is reduced, for one year. Therefore, the proposed action will not adversely impact habitat in the Northeast Region, and, there will be no cumulative effects.
5.5.7 Cumulative Effects on Communities The proposed action, which reduces DAS available for targeting monkfish in the SFMA will have a short-term negative effect on communities due to the resulting decrease in community, vessel and crew revenues from monkfish. DAS and trip limits on monkfish in the NFMA are not affected by the proposed action. The cumulative effect of the proposed action on fishing communities, in conjunction with other past, present and reasonably foreseeable future actions, including non-fishing activites, will be negative in the short term for those communities dependant on monkfish, particularly those communities whose vessels fish exclusively in the SFMA. Over the long term, however, those communities most dependant on the directed monkfish fishery will realize the greatest cumulative benefit from stock rebuilding.
5.5.8 Summary of Cumulative Effects There are no significant cumulative impacts of this fishery action on the monkfish resource, non-target species, social/economic resources, EFH, or protected species. The proposed action is to set monkfish TACs, and SFMA trip limits and DAS consistent with the stock rebuilding program established in Framework 2, based on annual evaluation of stock status (trawl survey indices relative to annual index targets) and previous fishing year landings. The DAS and trip limits proposed for FY 2006 are within the range of DAS and trip limits analyzed in Framework 2, and determined to be “not significant” under the National Environmental Policy Act (NEPA) guidelines, even though the short-term (1 year) negative economic and social impacts could be substantial for some vessels and communities. This action is also not considered a “significant regulatory action” under the criteria established in Executive Order 12866 (See Section 6.3 Regulatory Impact Review and Initial Regulatory Flexibility Analysis for more details on the economic impacts of the proposed action).
6.0 Consistency with Applicable Law
6.1 Magnuson-Stevens Act (MSA) This action is being taken in conformance with the Monkfish FMP, which requires that specifications be set for this fishery on an annual basis. Framework Adjustment 2 to the FMP established the annual specifications process; this framework was approved on April 21, 2003, and was found to be fully in compliance with all national standards and other required provisions of the Magnuson-Stevens Act. Nothing in this action changes the findings in Framework 2 that this framework complies with the Magnuson-Stevens Act.
6.2 National Environmental Policy Act (NEPA) This section evaluates the proposed action in the context of NEPA, for determining the significance of federal actions, in this case the setting of annual monkfish fishery specifications.
6.2.1 Finding of No Significant Impact (FONSI Statement)

2006 Annual Adjustment and 2004 SAFE Report Monkfish FMP
62
NMFS has provided guidance for the determination of significance under NEPA in Section 6.01(b) of NOAA Administrative Order NAO 216-6, May 20, 1999, as well as in NMFS Instruction 3-124-1, July 22, 2005. Based on the analysis of impacts and alternatives in this document and the Monkfish FMP (including the EA for Framework 2 and the EIS for Amendment 2 to the FMP), the proposed 2006 specifications are not deemed to be significant. The proposed action, does not modify the total DAS allocated to vessels as established in the original FMP but, as in FY2004 limits the number of monkfish DAS a vessel may use in the SFMA. The proposed action also sets FY 2006 trip limits within the range of trip limits analyzed in Framework 2, and is consistent with the monkfish rebuilding plan established in Framework 2. Therefore, the proposed action will not likely substantially impact the target species, non-target species, the ecosystem biota, or the physical structures or the habitat of any endangered species. They do not threaten or violate a Federal, State, or local law or requirements imposed for the protection of the environment. The action is also not deemed to be controversial. NOAA Administrative Order 216-6 (NAO 216-6, May 20, 1999) contains criteria for determining the significance of the impacts of a proposed action. In addition, the Council on Environmental Quality regulations at 40 CFR 1508.27 state that the significance of an action should be analyzed both in terms of “context” and “intensity”. Each criterion listed in the sixteen questions below is relevant in making a finding of no significant impact, and have been considered individually, as well as in combination with the others. The significance of this action is analyzed based on the NAO 216-6 criteria and CEQ’s context and intensity criteria. The sixteen criteria to be considered are addressed below:
1. Can the proposed action be reasonably expected to jeopardize the sustainability of any target species that may be affected by the action?
As noted in Section 5.1.1, the proposed action is an adjustment to the monkfish effort allocation in accordance with the stock rebuilding program established in Framework 2, and is, therefore, intended to ensure the sustainability of the target species affected by this action, and certainly not expected to jeopardize that sustainability.
2. Can the proposed action be reasonably expected to jeopardize the sustainability of any non-target species?
As noted in Section 5.1.1, the proposed action is not expected to jeopardize the sustainability of any non-target species. The effort levels and trip limits set by this action are within the levels analyzed in the FMP, Framework 2, and Amendment 2. Although information about bycatch is limited and not conclusive with respect to fishery-wide impacts, the impact of the monkfish fishery on non-target species is not significant, primarily as a result of the gear requirements and low level of effort allocated.
3. Can the proposed action be reasonably expected to allow substantial damage to the ocean and coastal habitats and/or EFH as defined under the Magnuson-Stevens Fishery Conservation and Management Act and identified in FMPs?
Impacts of the proposed specifications on ocean and coastal habitats and/or EFH were assessed in Section 5.2. The analysis concluded that this action is not expected to allow substantial damage to the ocean and coastal habitats and/or EFH as defined under the Magnuson-Stevens

2006 Annual Adjustment and 2004 SAFE Report Monkfish FMP
63
Fishery Conservation and Management Act and identified in the FMP and updated in Amendment 2.
4. Can the proposed action be reasonably expected to have a substantial adverse impact on public health or safety?
The proposed specifications are not expected to have substantial adverse impacts on public health or safety. The proposed action sets effort allocations within the levels established in the FMP, including Framework 2 and Amendment 2. There has been no indication that these levels affect public health or safety in any way.
5. Can the proposed action be reasonably expected to adversely affect endangered or threatened species, marine mammals, or critical habitat of these species?
The activities to be conducted under the proposed action are within the scope of the FMP and do not change the basis for the determinations made in previous consultations, as noted in Section 5.1.2. Effort reductions in the SFMA may reduce monkfish gillnet gear interactions with sea turtles for the period when those reductions are in effect (FY2006).
6. Can the proposed action be expected to have a substantial impact on biodiversity and/or ecosystem function within the affected area (e.g., benthic productivity, predator-prey relationships)?
The proposed action is not expected to have a substantial impact on biodiversity and ecosystem function within the affected area, since it is a one-year incremental adjustment within the overall monkfish rebuilding program. While the role of monkfish within the ecosystem is not well understood, the rebuilding of this predator and opportunistic feeder to historical and sustainable levels is likely to promote biodiversity and ecosystem function over the long term.
7. Are significant social or economic impacts interrelated with significant natural or physical environmental effects?
There are no significant social or economic impacts, nor are there any significant natural or physical environmental effects expected to result from the proposed action (Section 5.0, Environmental Consequences). Even though some vessels and communities may experience a substantial reduction in revenues from monkfish fishing in FY2006, the duration of this restriction reduces the significance of the proposed action in the context of NEPA. Furthermore, the long-term benefits of rebuilding the monkfish resource will be proportionally more positive for those dependant vessels and communities. The proposed adjustment is within the range of specifications analyzed in the EA for Framework 2, the action establishing the specification setting methodology.
8. Are the effects on the quality of human environment likely to be highly controversial?
The effects of annual specifications presented in this document on the human environment are not expected to be highly controversial, since they are based on the best and most recent scientific information available. Framework 2, in addition to implementing the annual specifications process, eliminated the controversial default measures in the FMP that would have closed the directed fishery. The public and the Councils are concerned, however, that the

2006 Annual Adjustment and 2004 SAFE Report Monkfish FMP
64
rebuilding program is behind schedule, and will be considering refinements to address this issue prior to the end of the program. To address these concerns, the NEFMC has initiated a framework adjustment to be implemented for the fishing year starting May 1, 2007.
9. Can the proposed action reasonably be expected to result in substantial impacts to unique areas, such as historic or cultural resources, park land, prime farmlands, wetlands, wild and scenic rivers or ecologically critical areas?
Other than the Stellwagen Bank National Marine Sanctuary (SBNMS), the proposed action does not affect areas of historic or cultural resources, park land, farmland, wetlands wild and scenic rivers or ecologically critical areas that are not already under protection (essential fish habitat areas and marine mammal protection zones). The effect on SBNMS is not likely to be substantial since the area is not a major monkfish fishing ground, and since the proposed action calls for a reduction in overall monkfish effort. Fishing vessels intentionally avoid shipwrecks, such as the SS “Portland” which is located within the SBNMS and is listed on the National Register of Historic Places (see question 12).
10. Are the effects on the human environment likely to be highly uncertain or involve unique or unknown risks?
The analysis of the effects on the human environment of the proposed adjustment is consistent with the analyses done for prior adjustments and a broad range of fishery management actions taken by the Councils. While these analyses have some inherent uncertainty because they involve predicting future impacts, the degree of uncertainty is not high, especially since the action is only to be in effect for one year.
11. Is the proposed action related to other actions with individually insignificant, but cumulatively significant impacts?
The proposed action is related to other recent management actions beginning with the implementation of the Monkfish FMP in 1999 which put in place most of the management measures that are currently in effect. While the FMP, and the associated monkfish rebuilding program resulted in some significant impacts to the human environment, the framework actions and Amendment 2 which followed and which refined the original FMP measures were found to not result in significant impacts. Further, the measures included in this annual adjustment proposed action were previously analyzed under Framework 2, in which the Councils modified the rebuilding plan, and found not to contribute to significant cumulative impacts. Thus, while the proposed action is related to a recent past action that was found to have significant impacts (the rebuilding plan under the FMP), as discussed and analyzed in the cumulative effects assessment (CEA), this action when combined with other past, present and RFFAs would not result in significant cumulative impacts (see the CEA in Section 5.5).
12. Is the proposed action likely to adversely affect districts, sites, highways, structures, or objects listed in or eligible for listing in the National Register of Historic Places or may cause loss or destruction of significant scientific, cultural or historic resources?

2006 Annual Adjustment and 2004 SAFE Report Monkfish FMP
65
The proposed action is not likely to directly or indirectly affect objects listed in the National Register of Historic Places or cause significant impact to scientific, cultural or historical resources due to the spatial remoteness of the regulated activity relative to listed sites. The only object in the management area listed on the National Register of Historic Places is the wreck of the steamship “Portland”, within the Stellwagen Bank National Marine Sanctuary. The current regulations allow fishing within the Sanctuary, however, vessels typically avoid fishing near shipwrecks or bottom obstructions in order to avoid tangling and losing expensive fishing gear. Therefore, this action would not result in any adverse affects to the wreck of the “Portland”.
13. Can the proposed action reasonably be expected to result in the introduction or spread of a non-indigenous species?
Since the proposed action is a reduction in monkfish fishing effort for one year, there is no basis to expect that it will result in the introduction or spread of non-indigenous species. In 2002, an invasive colonial sea squirt (Didemnum sp) was observed on Georges Bank. The tunicate occurs on pebble gravel habitat, and does not occur on moving sand. NMFS has surveyed the area and is monitoring the growth. At this time, there is no evidence that fishing spreads this species more than it would spread naturally. Furthermore, the proposed action is not expected to spread the species more than regular fishing activity would, however, the role of fishing gear in the spread of invasive tunicates should be evaluated and monitored.
14. Is the proposed action likely to establish a precedent for future actions with significant effects or represents a decision in principle about a future consideration?
No, the proposed action is not likely to establish a precedent for future action with significant effects, and it does not represent a decision in principle about future consideration. This action is taken under an existing stock-rebuilding program that is scheduled to be completed in 2009. The future management regime for the monkfish fishery, once rebuilt, has not been established, and will depend on the advancements made in the scientific understanding of the species and its population dynamics.
15. Can the proposed action reasonably be expected to threaten a violation of Federal, State, or local law or requirements imposed for the protection of the environment?
No, the proposed action is not reasonably expected to threaten a violation of Federal, State or local laws or requirements imposed for the protection of the environment. This action does not propose any changes that would provide incentives for environmental laws to be broken.
16. Can the proposed action be reasonably expected to result in cumulative adverse effects that could have a substantial effect on the target species or non-target species?
Cumulative effects related to the proposed action are discussed in Section 5.5 of this document. Based on that discussion, cumulative effects are not expected to be significant, and there is no change from the original analysis of cumulative impacts as assessed in the FMP and in the EIS for Amendment 2.

2006 Annual Adjustment and 2004 SAFE Report Monkfish FMP
66
FONSI Statement In view of the analysis presented in this document, the EA/RIR/RFA for the 2006 specifications, as well as in the EA for Framework 2 (establishing the stock rebuilding method under which these specifications are set), and in the EIS for the Monkfish Fishery Management Plan (including the Supplemental EIS for Amendment 2), the 2006 specifications will not have a significant effect on the human environment, with specific reference to the criteria contained in Section 6.02 of NOAA Administrative Order NAO 216-6, Environmental Review events for Implementing the National Environmental Policy Act, May 20, 1999. The impacts and alternatives in this document were analyzed with regard to both context and intensity, and are deemed not to be significant. Accordingly, the preparation of a Supplemental Environmental Impact Statement for the proposed action is not necessary. Assistant Administrator for Fisheries, NOAA Date
6.3 Regulatory Impact Review and Initial Regulatory Flexibility Analysis (EO 12866 and RFA)
6.3.1 Determination of significance under E.O. 12866
NOAA Fisheries Guidelines provide criteria to be used to evaluate whether a proposed action is significant. A “significant regulatory action” means any regulatory action that is likely to result in a rule that may:
1. Have an annual effect on the economy of $100 million or more, or adversely effect in a material way the economy, a sector of the economy, productivity, competition, jobs, the environment, public health or safety, or State, local or tribal governments or communities.
This action will have neither an annual effect on the economy of $100 million, nor adversely effect in a material way the economy, a sector of the economy, productivity, competition, the environment, public health or safety, or State, local, tribal governments or communities. During fishing years 1998 through 2000, gross monkfish revenues averaged approximately $43.9 million per fishing year. Monkfish revenues were $41.8 million in fishing year 2001 but dropped to $34.7 million in fishing year 2002 before increasing to $37.0 million in fishing year 2003. In fishing year 2004, monkfish revenues declined to $30.4 million. Assuming the entire FY2005 TAC was taken, the total value of monkfish landings would be $40.8 million at the 2004 average price. The value of the proposed FY2006 TAC would be $20.4 million at the same price. Thus, there would be an impact on the National economy of $20.4 million in forgone revenues from monkfish landings relative to fishing year 2005.
Monkfish dealers likely would be impacted by the proposed decreases in TAC for the NFMA and SFMA due to the decreased availability of product. This will likely increase their costs relative to FY2005. In past years, monkfish dealers have been able to mitigate cost increases by purchasing monkfish landed in the NFMA to offset the lack of TAC

2006 Annual Adjustment and 2004 SAFE Report Monkfish FMP
67
available in the SFMA. While this will still be true in FY2006, the large decrease in TAC for both management areas is expected to reduce opportunities to mitigate cost increases.
2. Create a serious inconsistency or otherwise interfere with an action taken or planned by another agency. The proposed action does not create an inconsistency or otherwise interfere with an action taken or planned by another agency. The activity that would be allowed under this action involves commercial fishing for monkfish in Federal waters of the EEZ, for which NOAA Fisheries is the sole agency responsible for regulation. Therefore, there is no interference with actions taken by another agency. Furthermore, this action would create no inconsistencies in the management and regulation of commercial fisheries in the Northeast.
3. Materially alter the budgetary impact of entitlements, grants, user fees, or loan programs or the rights and obligations of recipients thereof. The proposed action would establish target monkfish TACs for the 2006 fishing year, and adjust the trip limits and DAS available for vessels fishing in the SFMA. This action is unrelated to any entitlements, grants, user fees, or loan programs, and, therefore, cannot be considered significant under the third criterion specified in E.O. 12866.
4. Raise novel legal or policy issues arising out of legal mandates, the President’s priorities, or the principles set forth in the Executive Order. The proposed action is being taken pursuant to the mandates of the Sustainable Fisheries Act to end overfishing, rebuild the stock to MSY in 10 years, and achieve optimum yield from the fishery using the best scientific information available. This action uses biomass indices from the most recent NOAA Fisheries Fall Trawl Survey (Fall 2005) to establish target TACs for the 2006 fishing year based on a streamlined target TAC setting process that was established in Framework 2. Therefore, the proposed action would not be considered significant under the fourth criterion specified in E.O. 12866.
Because none of these criteria apply, NOAA Fisheries has determined that the proposed action in the monkfish fishery to establish target TACs, and adjust the trip limits and DAS available for vessels fishing in the SMFA for the 2006 fishing year, is not significant for the purpose of E.O. 12866.
6.3.2 Initial Regulatory Flexibility Analysis (IRFA) The following sections contain analyses of the effect of the proposed action on small entities in accordance with Section 603(b) of the Regulatory Flexibility Act.
6.3.2.1 Reasons for Considering the Action The FMP requires that the status of the monkfish resource be reviewed on an annual basis. In addition, the measures contained in Framework 2 established an annual target TAC setting method that is based on the most recent 3-year running average of the NOAA Fisheries fall trawl

2006 Annual Adjustment and 2004 SAFE Report Monkfish FMP
68
survey biomass index as compared to an established annual biomass index target. This action utilizes the target TAC setting method implemented in Framework 2 to establish target TACs for FY 2006, as required under the regulations at § 648.96(b)(1). Framework 2 also established a method for adjusting trip limits and DAS for vessels fishing in the SFMA to achieve the target TAC for that area. This action also adjusts the trip limits and DAS for vessels fishing in the SFMA based upon the method established in Framework 2, and implemented under the regulations at § 648.96(b)(2) and (b)(3).
6.3.2.2 Objectives and legal basis for the action The regulations implementing the FMP, found at 50 CFR Part 648, authorize the Council to adjust the management measures as needed in order to achieve the goals of the FMP. Framework 2 adjusted FMP management measures by establishing a streamlined process for setting annual target TACs, and for adjusting trip limits and DAS allocations as necessary to achieve those target TACs. The objective of this action is to achieve the goals of the FMP through the application of the target TAC setting method established in Framework 2 for the 2006 fishing year. Thus, the proposed action is consistent with the goals of the FMP and its implementing regulations.
6.3.2.3 Description and number of small entities to which the rule applies All of the entities (fishing vessels) affected by this action are considered small entities under the SBA size standards for small fishing businesses ($4.0 million in gross sales). As of January 30, 2006, there are approximately 741 limited access monkfish permit holders and approximately 2,263 vessels holding an open access Category E permit. This action would affect only limited access monkfish vessels while fishing for monkfish in the SFMA. Based on activity reports for the 2004 fishing year (the most recent fishing year for which complete information is available) there were 491 limited access permit holders participating in the monkfish fishery. Of these, 166 fished for monkfish exclusively in the Northern Fishery Management Area (NFMA) and 151 fished for monkfish in only the Southern Fishery Management Area (SFMA). The remaining 174 vessels fished for monkfish in both management areas. Thus, the proposed measures would affect at least the 325 vessels that fished for monkfish for at least part of the time in the SFMA, but would be likely to have greatest affect on the 151 vessels that fished for monkfish exclusively in the SFMA.
6.3.2.4 Reporting, recordkeeping and other compliance requirements This action does not introduce any new reporting, recordkeeping, or other compliance requirements. However, this action would reinforce the fact that if a vessel wants to fish in the NFMA under the less restrictive measures of that area, it must obtain a LOA from the Regional Administrator. If a vessel does not possess a monkfish LOA, then it is assumed fishing in the SFMA.
6.3.2.5 Duplication, overlap or conflict with other Federal rules The proposed rule does not duplicate, overlap or conflict with other Federal rules.
6.3.2.6 Economic impacts on small entities resulting from the proposed action

2006 Annual Adjustment and 2004 SAFE Report Monkfish FMP
69
The combined TAC for both monkfish management areas would be decreased by approximately 50 percent compared to fishing year 2005. While the TAC for the NFMA would be decreased by approximately 41 percent, the SFMA TAC would be decreased by approximately 62 percent. Monkfish trip limits in the SFMA would also be decreased by approximately 25 percent, and since the target TAC for the SFMA has been set at a level less than the 8,000-mt threshold below which DAS reductions are triggered, allowable DAS that may be fished in the SFMA would be reduced to an allotment of 12 DAS. Thus, the proposed measures would have differential impacts on participating vessels depending on the management area in which they fish. As in the 2005 annual adjustment, estimation of relative economic impacts was accomplished using a two-step procedure. The first step identifies FY2003 trips in the SFMA using large mesh where monkfish revenue was at least 50 percent of trip revenue, and uses these trips to calculate the average change in per-trip vessel returns net of operating costs and crew payments. In the second step, this trip average was applied to all trips landings monkfish from the SFMA while also including average DAS decreases based on FY2003 call-in data. A more detailed description of these two steps follows. Step 1. Estimation of per-Trip Returns The impact of changes in trip limits is amenable to analysis when moving from a higher to a lower trip limit. While FY2005 trip limits are higher than those proposed for FY2006, the 2005 fishing year is not yet complete. FY2004 trip limits were the same as those proposed for FY2006, but those trip limits were lower than the FY2005 limits and participants could only fish 28 DAS in the SFMA in FY2004. Therefore, it is necessary to use data from an earlier fishing year to analyze the impact of the changes proposed for FY2006. Since FY2003 trip limits were higher than the proposed FY2006 limits, FY2003 data can be used to analyze the economic effect of the proposed change. As was the case in the FY2004 and FY2005 annual adjustments, the effect was evaluated based on a comparison of the expected return for alternative trip-taking strategies. A vessel may abandon a trip if the trip limit causes earnings to fall below zero, they may continue to fish while discarding any monkfish above the trip limit, or they may fish up to the trip limit and then return to port. Assuming that a trip is taken, vessels may choose to continue fishing while discarding monkfish over the trip limit so long as the revenue earned from other species offsets the costs of fishing. Trips where other species make up a relatively small portion of the trip revenue may lead to trips being discontinued when the trip limit is reached, since the cost of continued fishing would exceed the additional revenue. The relative change in net return to the vessel was estimated by calculating the average per-trip returns to the vessel owner using both the FY2005 trip limits and the proposed FY2006 trip limits. These returns take into account operating costs, which were estimated using trip cost data collected on observer logs in FY2003. Trips landing monkfish during FY 2003 in the NFMA and SFMA were identified, and the total trip cost was estimated as using a regression of the logarithm of trip cost against the logarithms of days absent, the number of crew, the vessel length and a dummy variable indicating that the vessel gear type is otter trawl. The parameters from this regression were then used to construct estimates of trip cost and cost per day absent for all trips landing monkfish during FY 2003. Returns to the vessel were calculated using a standard 60/40 lay system where 40 percent of the gross revenue goes to the vessel and 60 percent is shared

2006 Annual Adjustment and 2004 SAFE Report Monkfish FMP
70
among the crew, who pay for the operating expenses for the trip. Therefore, the net to the crew is the difference between the 60 percent share and the operating costs. Net pay per crew member is then the total net pay divided by the number of crew. Based on the trip limit model, the per trip average vessel return on monkfish trips would be reduced by 16.9 percent (see Table 31). On average, a trip taken in the SFMA would produce 16.9 percent less income toward fixed costs, debt, and owner profit under the proposed FY2006 trip limits. Net pay per crew member would be decreased by an average of 17.1 percent (see Table 32).
Home Port State Number of Trips
Average Vessel Return with FY2005
Trip Limits
Average Vessel Return with FY2006
Trip Limits
Percent Change in Average Vessel
ReturnCT 90 1028 831 -19.1%MA 1309 1358 1115 -17.9%NH 156 1026 825 -19.5%NJ 1516 1145 928 -18.9%NY 501 973 836 -14.1%RI 677 1227 1062 -13.4%All States -16.9%* Data for 1 DE, 1 MD, 1 ME, 2 NC, and 2 VA vessels not reported due to confidentiality.
Table 31 Average Per Trip Return to Vessels by Home Port State (60/40 Lay System)
Home Port State
Average Net Pay per Crew Member with FY2005 Trip Limits
Average Net Pay per Crew Member with FY2006 Trip Limits
Percent Change in Average Payment per Crew Member
CT 574 466 -18.9%MA 581 477 -17.9%NH 635 505 -20.4%NJ 699 567 -18.9%NY 601 516 -14.2%RI 512 443 -13.6%All States -17.1%* Data for 1 DE, 1 MD, 1 ME, 2 NC, and 2 VA vessels not reported due to confidentiality.
Table 32 Average Per Trip Net Pay per Crew Member by Home Port State (60/40 Lay System) Step 2. Estimation of Economic Impacts of Proposed Measures Having estimated the average changes in returns due to the proposed trip limit changes, FY2003 data were again used to estimate the impacts on participating limited access monkfish permit holders in the following manner. Vessel trip reports for all trips taken by limited access monkfish permit holders and landing at least one pound of monkfish were identified. This permits estimation of economic impacts on a vessel’s entire fishing business, by including both trips where monkfish was targeted and trips where monkfish was not landed or may have been landed in incidental quantities. The total value earned on each trip was estimated by applying average

2006 Annual Adjustment and 2004 SAFE Report Monkfish FMP
71
prices from dealer data to the reported kept pounds for each species in the trip reports. The 60/40 lay system was applied to each trip to calculate returns to the vessel and the net crew payments. Trips using large mesh and landing monkfish in greater than incidental quantities were then identified, and the returns to vessel owners and crew on trips determined to be monkfish trips in the SFMA were adjusted based on the average change in returns that was calculated in Step 1. Specifically, FY2003 returns to the vessel were decreased by 16.9 percent and net pay to crew was decreased by 17.1 percent. Each vessel from the FY2003 data set was assigned to one of three categories depending on whether the vessel fished for monkfish exclusively in the SFMA, exclusively in the NFMA, or fished for monkfish at least once in both management areas. Since no changes to either trip limits or DAS are proposed for the NFMA, vessels fishing exclusively in the NFMA would not be affected by the proposed measure. Vessels fishing in both management areas would be affected by the proposed SFMA trip limits when fishing in the SFMA. Since the FY2006 TAC in the SFMA is less than the 8,000mt threshold that triggers a reduction in DAS, the decrease in available DAS must be taken into account when calculating the economic impact. To do so, the average decrease in DAS used by vessels fishing exclusively in the SFMA was estimated. Based on call-in records, approximately 56 percent of vessels landing monkfish exclusively from the SFMA took no monkfish-only trips. Of the remaining 44 percent of vessels taking at least one monkfish-only trip, the average difference between observed call-in DAS and the proposed allowable DAS in the SFMA was 16 days. Thus, the average vessel fishing for monkfish in the SFMA would lose 16 days of fishing over and above the losses associated with the change in trip limits. To account for this decrease in DAS, the average return on monkfish DAS was multiplied by 16 and subtracted from the total net return for the year. Total net returns to each vessel and total net crew payments were summed for all trips, which were adjusted for the applicable trip limits. For vessels fishing for monkfish exclusively in the SFMA, total net return was then decreased by the value associated with the decreased DAS allowance. As was previously noted, vessels fishing exclusively in the NFMA would not be affected by the proposed SFMA measures. The average impact on vessels fishing in both areas is estimated to be roughly a 2 percent decrease in both net pay to crew and net return to the vessel, though average decreases for New Jersey vessels would be more than 10 percent (see Table 33). This relatively low level of impact suggests that vessels fishing in both management areas fished primarily in the NFMA during FY2003. The average impact of vessels fishing exclusively in the SFMA is estimated to be a 34.3 percent decrease in net pay to crew and a 31.8 percent decrease in returns to the vessel owner. These effects vary greatly between states with vessels from North Carolina experiencing smaller decreases relative to vessels from Massachusetts and New Jersey, where average decreases range from 40 to 50 percent (see Table 34).

2006 Annual Adjustment and 2004 SAFE Report Monkfish FMP
72
Home Port State Number of Vessels
Average Change in Net Pay to Crew
Average Change in Return to Vessel Owner
CT 3 -5.3% -3.7%MA 220 -1.2% -1.0%ME 63 -0.2% -0.1%NC 5 -2.2% -1.7%NH 21 -2.4% -2.2%NJ 7 -12.3% -11.6%NY 10 0.0% 0.0%RI 41 0.0% 0.0%All States -2.4% -2.0%* Data for 2 DE and 1 VA vessels not reported due to confidentiality.
Table 33 Relative Change in Vessel Net Return and Change in Average Net Pay to Crew for Vessels Landing Monkfish from Both Management Areas Home Port State Number of Vessels
Average Change in Net Pay to Crew
Average Change in Return to Vessel Owner
CT 5 -28.3% -23.0%MA 23 -52.8% -51.4%NC 12 -7.5% -5.8%NJ 55 -46.8% -44.7%NY 27 -17.6% -15.0%RI 30 -36.1% -32.7%VA 6 -26.7% -21.0%All States -34.3% -31.8%* Data for 1 DE and 1 MD vessel not reported due to confidentiality.
Table 34 Relative Change in Vessel Net Return and Change in Average Net Pay to Crew for Vessels Landing Monkfish Exclusively from the SFMA
6.4 Endangered Species Act (ESA) Section 7 of the ESA requires Federal agencies conducting, authorizing, or funding activities that affect threatened or endangered species to ensure that those effects do not jeopardize the continued existence of listed species. The NEFMC has concluded that the annual monkfish specifications for FY 2006 and the prosecution of the monkfish fishery is not likely to result in jeopardy to any ESA-listed species under NOAA Fisheries Service jurisdiction, or alter or modify any critical habitat, based on the discussion in this document. For further information on the potential impacts of the fishery and the proposed management action, see Section 5.1.2 of this document. Once this document is submitted, it is expected that NOAA Fisheries Service would initiate an informal consultation on this action under section 7 of the ESA.
6.5 Marine Mammal Protection Act (MMPA) The NEFMC has reviewed the impacts of the annual monkfish specifications for FY 2006 on marine mammals and concluded that the management actions proposed are consistent with the provisions of the MMPA and would not alter existing measures to protect the species likely to
2006 Annual Adjustment and 2004 SAFE Report Monkfish FMP
73
inhabit the management unit of the monkfish fishery. For further information on the potential impacts of the fishery and the proposed management action, see Section 5.1.2 of this document.
6.6 Paperwork Reduction Act (PRA) The purpose of the PRA is to control and, to the extent possible, minimize the paperwork burden for individuals, small businesses, nonprofit institutions, and other persons resulting from the collection of information by or for the Federal Government. This action does not propose to modify any existing collections, or to add any new collections; therefore, no review under the PRA is necessary.
6.7 Coastal Zone Management Act (CZMA) Section 307(c)(1) of the Federal CZMA of 1972 requires that all Federal activities that directly affect the coastal zone be consistent with approved state coastal zone management programs to the maximum extent practicable. The NEFMC reviewed the approved coastal zone management plans of the following states to determine the consistency of the annual monkfish specifications for FY 2006 with the enforceable policies of the state programs: Maine, New Hampshire, Massachusetts, Rhode Island, Connecticut, New York, Pennsylvania, New Jersey, Delaware, Maryland, Virginia, and North Carolina. The NEFMC has determined that the proposed action is consistent to the maximum extent possible with the enforceable policies of the coastal zone management programs of these states and has notified them of this determination, providing them also with a copy of this document. A letter requesting their concurrence with the NEFMC’s initial determination was sent on February 14, 2006. A list of the specific state contacts and a copy of the letters are available upon request.
6.8 Data Quality Act (DQA) Pursuant to NOAA Fisheries guidelines implementing Section 515 of Public Law 106-554 (the Data Quality Act), all information products released to the public must first undergo a Pre-Dissemination Review to ensure and maximize the quality, objectivity, utility, and integrity of information (including statistical information) disseminated by Federal agencies. The following paragraphs address these requirements. Utility The information presented in this document is helpful to the intended users (the affected public) by presenting a clear description of the purpose and need of the proposed action, the measures proposed, and the impacts of those measures. A discussion of the reasons for selecting the proposed action is included so that intended users may have a full understanding of the proposed action and its implications. The intended users of the information contained in this document include individuals involved in the monkfish fishery, (e.g., fishing vessels, fish processors, fish processors, fishery managers), and other individuals interested in the management of the monkfish fishery. The information contained in this document will be helpful and beneficial to owners of vessels holding limited access monkfish permits since it will notify these individuals of changes to the monkfish target TACs and trip limits for FY 2006. This information will enable these individuals to adjust their management practices and make appropriate business decisions based upon the new management measures.

2006 Annual Adjustment and 2004 SAFE Report Monkfish FMP
74
Until a proposed rule is prepared and published, this document is the principal means by which the information contained herein is available to the public. The information provided in this document is based on the most recent available information from the relevant data sources. The information contained in this document includes detailed, and relatively recent information on the monkfish resource and, therefore, represents an improvement over previously available information. For example, the Affected Human Environment section of the EA contains the most recent (FY 2004) Stock Assessment and Fishery Evaluation (SAFE Report) for the monkfish fishery. The information product will be subject to public comment through proposed rulemaking, as required under the Administrative Procedure Act and, therefore, may be improved based on comments received. This document is available in several formats, including printed publication, and online through the NEFMC’s web page (www.nefmc.org). The Federal Register notice that announces the proposed rule and the final rule and implementing regulations will be made available in printed publication, on the website for the Northeast Regional Office (www.nero.noaa.gov), and through the Regulations.gov website. The Federal Register documents will provide metric conversions for all measurements.
Integrity Prior to dissemination, information associated with this action, independent of the specific intended distribution mechanism, is safeguarded from improper access, modification, or destruction, to a degree commensurate with the risk and magnitude of harm that could result from the loss, misuse, or unauthorized access to or modification of such information. All electronic information disseminated by NOAA Fisheries Service adheres to the standards set out in Appendix III, “Security of Automated Information Resources,” of OMB Circular A-130; the Computer Security Act; and the Government Information Security Act. All confidential information (e.g., dealer purchase reports) is safeguarded pursuant to the Privacy Act; Titles 13, 15, and 22 of the U.S. Code (confidentiality of census, business, and financial information); the Confidentiality of Statistics provisions of the Magnuson-Stevens Act; and NOAA Administrative Order 216-100, Protection of Confidential Fisheries Statistics. Objectivity For purposes of the Pre-Dissemination Review, this document is considered to be a “Natural Resource Plan.” Accordingly, the document adheres to the published standards of the Magnuson-Stevens Act; the Operational Guidelines, Fishery Management Plan Process; the Essential Fish Habitat Guidelines; the National Standard Guidelines; and NOAA Administrative Order 216-6, Environmental Review Procedures for Implementing the National Environmental Policy Act. This information product uses information of known quality from sources acceptable to the relevant scientific and technical communities. Several sources of data were used in the development of Framework 2, which implemented the target TAC setting method and trip limit analysis method used in this action. These data sources included, but were not limited to, landings data from the Vessel Trip Report and Commercial Dealer Weighout databases, effort data collected in the monkfish DAS call-in program, and fisheries independent data collected in the NMFS bottom trawl surveys and cooperative research projects. The proposed action,

2006 Annual Adjustment and 2004 SAFE Report Monkfish FMP
75
including the associated EA/RIR/IRFA, utilized current landings data (for FY 2004) from the Vessel Trip Report and Commercial Dealer Weighout databases, and the most recent fisheries independent data from the 2005 NMFS bottom trawl survey. Thus, the original analyses contained in this document were prepared using data from accepted sources. Furthermore, these analyses have been reviewed by members of the Monkfish Monitoring Committee and the Monkfish Plan Development Team. Despite current data limitations, the conservation and management measures proposed for this action were selected based upon the best scientific information available. The analyses conducted in support of the proposed action were conducted using information from the most recent fishing years through FY 2004. Specialists (including professional members of plan development teams, technical teams, committees, and Council staff) who worked with these data are familiar with the most current analytical techniques and with the available data and information relevant to the monkfish fishery. The policy choices are clearly articulated, in Section 3.0 of this document, as the management alternatives considered in this action. The supporting science and analyses, upon which the policy choices are based, are summarized and described in Section 5.0 of this document. All supporting materials, information, data, and analyses within this document have been, to the maximum extent practicable, properly referenced according to commonly accepted standards for scientific literature to ensure transparency. The review process used in preparation of this document involves the responsible Council (the NEFMC), the Northeast Fisheries Science Center (Center), the Northeast Regional Office (NERO), and NOAA Fisheries Service Headquarters. The Center’s technical review is conducted by senior level scientists with specialties in population dynamics, stock assessment methods, demersal resources, population biology, and the social sciences. The Council review process involves public meetings at which affected stakeholders have opportunity to provide comments on the document. Review by staff at the Regional Office is conducted by those with expertise in fisheries management and policy, habitat conservation, protected species, and compliance with the applicable law. Final approval of any proposed regulatory action, including any implementing regulations, is conducted by staff at NOAA Fisheries Service Headquarters, the Department of Commerce, and the U.S. Office of Management and Budget. Framework 2 to the FMP, which established the target TAC setting method being utilized in this action, was reviewed in such a manner. Because this action would establish the 2006 target TACs, and associated management measures, utilizing the expedited method established in Framework 2, this level of review is unnecessary. However, this document (the EA/RIR/IRFA) and the proposed and final rules will undergo review by staff within NERO, various staff (Office of Sustainable Fisheries, Office of General Counsel, etc.) at the NOAA Fisheries Service Headquarters, as well as other staff within the Department of Commerce. In addition, the information contained in this document concerning monkfish stock status (SAW 40) was peer reviewed according to standard methodology (Stock Assessment Review Committee; SARC).
6.8 E.O. 13132 (Federalism) This E.O. established nine fundamental federalism principles for Federal agencies to follow when developing and implementing actions with federalism implications. The E.O. also lists a

2006 Annual Adjustment and 2004 SAFE Report Monkfish FMP
76
series of policy making criteria to which Federal agencies must adhere when formulating and implementing policies that have federalism implications. However, no federalism issues or implications have been identified relative to the measures proposed in the annual monkfish specifications for FY 2006. This action does not contain policies with federalism implications sufficient to warrant preparation of an assessment under E.O. 13132. The affected states have been closely involved in the development of the proposed management measures through their representation on the New England and Mid-Atlantic Fishery Management Councils (all affected states are represented as voting members of at least one Regional Fishery Management Council). No comments were received from any state officials relative to any federalism implications that may be associated with this action.
6.9 Administrative Procedure Act (APA) Section 553 of the APA establishes procedural requirements applicable to informal rulemaking by Federal agencies. The purpose of these requirements is to ensure public access to the Federal rulemaking process, and to give the public adequate notice and opportunity for comment. At this time, the NEFMC is not requesting any abridgement of the rulemaking process for this action.
7.0 References New England Fishery Management Council. 1998. The Omnibus Habitat Amendment. (Amendment 11 – Multispecies, Amendment 9 – Sea Scallops, Amendment 1 – Monkfish, Amendment 1 – Atlantic Salmon, and Components of proposed Atlantic Herring FMP). New England Fishery Management Council. 2003. Framework 2 to the Monkfish FMP. New England Fishery Management Council. 2004. Amendment 2 to the Monkfish FMP. NOAA/NMFS. Status of the Stocks Report for the Northeast Region – Q4 2005. Stevenson, D.K., L.A. Chiarella, C.D. Stephan, R.N. Reid, G.E. McCarthy, M. Pentony. In Press. Characterization of Fishing Practices and the Marine Benthic Ecosystems of the Northeast U.S. Shelf, and an evaluation of the potential effects of fishing on essential fish habitat. NOAA Technical Memorandum (In Press). 165 p. Waring, G.T., R.M. Pace, J.M. Quintal, C. P. Fairfield, K. Maze-Foley (eds). 2003. U.S. Atlantic and Gulf of Mexico marine mammal stock assessments - 2003 . NOAA Technical Memorandum NMFS-NE-182. 287 p.
2006 Annual Adjustment and 2004 SAFE Report Monkfish FMP
77
8.0 List of Preparers and Persons Consulted This document was prepared through the cooperative efforts of the Monkfish Monitoring Committee members, and members of the staffs of NMFS and the New England Fishery Management Council. Contributors include:
• Matt Cieri, MMC, ME DMR • Steve Correia, MMC, MA DMF • Patricia Fiorelli, NEFMC • Allison Ferreira, MMC, NMFS • Charles Fulcher, MMC, NEFSC • Phil Haring, MMC, NEFMC • Jay Hermsen, MMC, NMFS • Jean-Jacques Maguire, MMC • Leslie-Ann McGee, NEFMC • Anne Richards, MMC, NEFSC • Dierdre Valentine, NEFMC • Stan Wang, MMC, NMFS • Kurt Wilhelm, NMFS • John Witzig, NMFS
Primary point of contact to obtain copies of this Environmental Assessment: Pat Kurkul, Northeast Regional Administrator, NOAA Fisheries,
1 Blackburn Dr., Gloucester, MA 01930. Phone: (978) 281-9300


Monkfish FMP 2006 Specifications
APPENDIX I FY2006 Monkfish Trip Limit and DAS Analysis


i
FY2006 Monkfish Southern Fishery Management Area (SFMA) Daily Landings Limit Analysis
Kurt Wilhelm and Jay Hermsen, Ph.D.1
January 26, 2006
Abstract The target TAC for the Southern Fishery Management Area (SFMA) is 3,667 mt for FY2006. This triggers DAS landing limits of 550 and 450 lbs. of monk tail per DAS for category A/C vessels and category B/D vessels respectively. Calculations of landings per DAS, based on FY2004 data, project that a limit of 12 DAS is needed for all categories to achieve the target TAC.
Background According to regulations laid out in section 649.96(b)(1) of Title 50 of the Code of Federal Regulations (50 CFR 648.96(b)(1)), the Monkfish Monitoring Committee (MFMC) sets the target total allowable catch (TAC) for the SFMA for a given fishing year. The Regional Administrator is charged with setting the daily landing and days at sea (DAS) limits for monkfish permit categories A & C (AC) and B & D (BD) in response to these TAC adjustments. However, if the MFMC sets the Southern Fishery Management Area (SFMA) target TAC below 8,000 mt, the limits for monkfish permit categories AC and BD vessels will be set at 550 lbs. and 450 lbs. of monkfish tails per DAS, respectively. For FY2006, the target TAC for the SFMA has been set at 3,667 mt, less than the 8,000-mt threshold below which reductions in DAS are triggered. Therefore, the DAS allocations for permit categories AC and BD must be adjusted according to the method laid out in 50 CFR 648.96(b)(3)(iii). The purpose of this report is to recommend adjusted DAS allocations for monkfish permit categories AC and BD, along with the assumptions and methods used to arrive at those recommendations. Methods Data from fishing year 2004 were used for this analysis, as they satisfy criteria that are important to such an analysis: 1) FY2004 FVTR data are the most recent complete reference for predicting landings of monkfish in FY2006, 2) the TAC in the SFMA in FY2004, like in FY2006, was set below 8,000 mt, which required limits of 550 lbs. and 450 lbs. of monkfish tails per DAS for permit categories AC and BD, respectively, and 3) the FY2004 TAC is greater than the FY2006 TAC, implying that fewer DAS will be used in FY2006. Assumptions
1- Fishery Statistics Office, Northeast Regional Office, NOAA Fisheries

ii
● Landings from permit category E, vessels employing dredge gear, and unknown category vessels will be exactly the same, in terms of live pounds landed, in the SFMA in FY2006 as they were in FY2004. This assumption enables a reasonable reduction of the FY2006 SFMA monkfish quota to account for the landings from category E, vessels employing dredge gear, and unknown category vessels. ● Vessels will use the same number of days in FY2006 as in FY2004, up to the limit available. ● Vessels will comply with the proposed mandated daily landing limits, i.e. the analysis does not account for daily landing limit overage if they did, in fact, occur. ● Fishing and landing patterns will be similar in FY2006 to those experienced in FY2004 as detailed in the text below. Data Sources We used the dealer weighout slips and fishing vessel trip reports (FVTR) for FY2004 to collect information for this analysis. The dealer weighout data is considered to be the most accurate accounting of total landings of monkfish. Dealer weighout landings were apportioned by permit category, gear sector and monkfish fishery management area using proportions calculated from the FVTR database. Although the landings reported on fishing vessel trip reports are considered underestimates, the proportions of landings by gear, permit category, and monkfish management area are crucial to this analysis. Simulation To estimate landings in the SFMA in FY2006 by permit categories AC and BD, the proportion of catch for non-dredge AC and BD permit holders was computed for the proportions reported in VTR. Those proportions were used to estimate FY2004 landings and the FY2006 allocations. The number of days at sea spent on a trip was calculated by subtracting the date sailed from the date landed on the FVTR and rounding any fractional days up to the next integer. In FY2004 the DAS allocation was 28 DAS plus any carryover. In this analysis, landings were assumed to be at a constant rate per day. The landings at any DAS level for each vessel were calculated by either including all landings if the vessel used fewer days than the proposed DAS level, or reducing the landings by an amount proportionate to the days exceeding the DAS level. For example, if a vessel landed 1,000 in 30 days of fishing, the calculated landings for 15 days would be 500 pounds. The resulting range of estimated landings was fit with a loglinear function. This empirical function was then used to solve for the target DAS limit that would result in the desired target TAC. Results The vessel trip reports database allowed for the categorization of landings of monkfish in FY2004 by permit category and gear sector (Table 1). This enables the allocation of landings

iii
from the dealer landings database by management area, permit category and gear sector. Of the total 39.6 million pounds of monkfish landed, 35% (or 14 million pounds) were from the SFMA. Table 1: Summary Statistics for the Southern Fishery Management Area for Monkfish in FY2004.
Permit Category
Permitted Vessels
Reporting Vessels
Reported Trips
VTR Landings (Lbs. live weight)
Percent of total
landings
Calculated Dealer WO Landings
(lbs.) AC,
non-dredge 356 132 2,689 3,039,731 32% 4,423,182
BD non-dredge 396 203 4,397 5,150,302 53% 7,494,321
E, Dredge 2,241 486 4,823 1,448,394 15% 2,107,591
Total 2,993 821 11,909 9,638,427 100% 14,025,095 Source: NMFS Permits and Vessel Trip Report Databases. The sum of landings from permit category E, from any unknown permit category vessels, and from vessels employing a dredge in the SFMA in FY2004 represented 15% of the VTR reported landings. It therefore was estimated at 2,107,591 lbs. live weight. The FY2006 allocation of 3,667 mt (8,084,353 live lbs.) recommended by the MFMC was reduced by this amount, leaving 5,976,761 live lbs. to be shared by permit categories A-D in the SFMA in FY2006. The proportion of landings accounted for by permit categories AC and BD in the SFMA in FY2004 dictate the allocation of landings to the two permit category groups in FY2006 (i.e., if category AC landed 50% of the monkfish in the SFMA in FY2004 landed by permit categories A-D, then category AC will be allocated 50% of the landings in the SFMA in FY2006). Using their respective proportions of the landings from FY2004, categories AC and BD receive approximately 37% (2,218,275 live lbs.) and 63% (3,758,486 lbs.) of the remaining allocation, respectively (Table 2). Table 2. Allocation of FY2006 monkfish SFMA TAC of 3,667 mt (8,084,353 live lb.)
Permit Category
Percent of AC/BD
landings
Allocation of TAC
(pounds) AC 37% 2,218,275BD 63% 3,758,486
E, dredge 2,107,591Total 8,084,353

iv
Interpolation of the data (Table 3, Figure 1), to achieve the desired landings targets indicates that AC and BD should be each allocated 12 DAS. The results of the DAS allocation simulation indicate that a 50% reduction in landings from FY2004 can be achieved by 57% reduction in DAS allocation. Table 3. Calculated monkfish landings under various DAS limits.
AC BD DAS (lbs. live monkfish) 8 1,611,310 2,656,486 12 2,276,510 3,717,960 16 2,795,684 4,624,078 20 3,235,326 5,413,631 24 3,579,104 6,039,624 28 3,811,279 6,510,992
Figure 1. Expected monkfish landings as a function of DAS allocations by permit category.
-
1,000,000
2,000,000
3,000,000
4,000,000
5,000,000
6,000,000
7,000,000
8 12 16 20 24 28 32Days-at-Sea (DAS) Allocation
Pre
dict
ed M
onkf
ish
Land
ings
(lbs
. liv
e w
t.)
Category A & C vessels
Category B & D vessels
It should be remembered that this analysis is extremely sensitive to the assumptions listed above. In particular, if the assumption that days-at-sea usage for the FY2006 will be the same as that of FY2004 underestimates the actual FY2006 usage, then the monkfish TAC could be very quickly

v
exceeded. Use of latent monkfish days could occur if vessel operators switch fisheries because of reduced groundfish day-at-sea, or some other circumstances.


Monkfish FMP 2006 Specifications
APPENDIX II Description of listed Marine Mammals and Protected Species


Appendix II 1
Endangered and Other Protected Species The following protected species are found in the environment utilized by the monkfish fishery. A number of them are listed under the Endangered Species Act of 1973 (ESA) as endangered or threatened, while others are identified as protected under the Marine Mammal Protection Act of 1972 (MMPA). Two right whale critical habitat designations are located in the area in which the monkfish fishery is prosecuted. While a list of the species is included in this document, the information provided here is summary of the full descriptions provided in the Amendment 2 Final Supplemental Environmental Impact Statement. Cetaceans Northern right whale (Eubalaena glacialis) Endangered Humpback whale (Megaptera novaeangliae) Endangered Fin whale (Balaenoptera physalus) Endangered Blue whale (Balaenoptera musculus) Endangered Sei whale (Balaenoptera borealis) Endangered Sperm whale (Physeter macrocephalus) Endangered Minke whale (Balaenoptera acutorostrata) Protected Harbor porpoise (Phocoena phocoena) Protected Risso’s dolphin (Grampus griseus) Protected Pilot whale (Globicephala spp.) Protected White-sided dolphin (Lagenorhynchus acutus) Protected Common dolphin (Delphinus delphis) Protected Bottlenose dolphin: coastal stocks (Tursiops truncatus) Protected Seals Harbor seal (Phoca vitulina) Protected Gray seal (Halichoerus grypus) Protected Harp seal (Phoca groenlandica) Protected Sea Turtles Leatherback sea turtle (Dermochelys coriacea) Endangered Kemp’s ridley sea turtle (Lepidochelys kempii) Endangered Green sea turtle (Chelonia mydas) Endangered Hawksbill sea turtle (Eretmochelys imbricata) Endangered Loggerhead sea turtle (Caretta caretta) Threatened Fish Shortnose sturgeon (Acipenser brevirostrum) Endangered Atlantic salmon (Salmo salar) Endangered Critical Habitat Designations Right whale Cape Cod Bay Great South Channel Although all of the species listed above may be found in the general geographical area covered by the Monkfish FMP, not all are affected by the fishery. Some species may inhabit areas other
Appendix II 2
than those in which the fishery is prosecuted, prefer a different depth or temperature zone, or may migrate through the area at times when the fishery is not in operation. In addition, certain protected species may not be vulnerable to capture or entanglement with the gear used in the fishery. Therefore, protected species are divided into two groups. The first contains those species not likely to be affected by the fishery or measures included in this action, while the second group is the subject of a more detailed assessment because of potential or documented interactions with protected species. Protected Species Not Likely to be Affected by the Multispecies FMP Following a review of the current information available on the distribution and habitat needs of the endangered, threatened, and otherwise protected species listed above in relation to the action being considered, the Council considers that monkfish fishing operations and the measures proposed in this action are unlikely to affect the shortnose sturgeon, the Gulf of Maine distinct population segment (DPS) of Atlantic salmon, and the hawksbill sea turtle, all of which are species listed under the ESA. As discussed in Amendment 2, because of preferred habitat and distribution, there is little overlap between these species and the monkfish fishery making the likelihood of encounters relatively rare events. No evidence to date suggests that operation of the fishery adversely affects the value of critical habitat designated to protect right whales. Right whale critical habitat, therefore, it is not discussed further in this document. Protected Species Potentially Affected by the Multispecies FMP The status information below is a summary of information provided in the Amendment 2 documents and describes the threatened and endangered species that are potentially affected by the proposed action, as well as those accorded protection by the Marine Mammal Protection Act. The information has previously been discussed in more detail in the Amendment 2 Final Supplemental Environmental Impact Statement and has been updated as necessary. The Amendment 2 information is incorporated herein by reference. North Atlantic Right Whale The North Atlantic right whale population, which numbers less than 300 animals ranges from wintering and calving grounds in the southeastern U.S. to summer feeding grounds in New England, the northern Bay of Fundy and the Scotian Shelf. New England waters are a primary feeding ground. Right whales feed on zooplankton throughout the water column, and may feed near the bottom in shallow waters. In the Gulf of Maine, they have been observed feeding primarily on copepods, by skimming at or below the water’s surface with open mouths (NMFS 1991; Kenney et al. 1986; Murison and Gaskin 1989; and Mayo and Marx 1990). Research suggests that right whales must locate and exploit extremely dense patches of zooplankton to feed efficiently (Waring et al. 2004). At least some portion of the right whale population is present in New England waters throughout most months of the year. They are most abundant in Cape Cod Bay between February and April (Hamilton and Mayo 1990; Schevill et al. 1986; Watkins and Schevill 1982) and in the Great

Appendix II 3
South Channel in May and June (Kenney et al. 1986; Payne et al. 1990) where they have been observed feeding predominantly on copepods, largely of the genera Calanus and Pseudocalanus (Waring et al. 2004). Right whales also frequent Stellwagen Bank and Jeffrey’s Ledge, as well as Canadian waters including the Bay of Fundy and Browns and Baccaro Banks, in the spring and summer months. Mid-Atlantic waters are used as a migratory pathway from the spring and summer feeding/nursery areas to the winter calving grounds off the coast of Georgia and Florida. Sources of mortality include ship strikes and entanglement in fixed fishing gear. Considered to be the most endangered whale in the world, the current death rate far exceeds the birth rate in the western North Atlantic population. An increasing calving interval, the relatively large number of female right whales killed and human-related mortality make the probability of right whale extinction in the next 191 years very high (Caswell et al. 1999, Best et al. 2001). Humpback Whale Humpback whales calve and mate in the West Indies and migrate to feeding areas in the northwestern Atlantic during the summer months. Six separate feeding areas are utilized in northern waters (Waring et al. 2004). Only one of these feeding areas, the Gulf of Maine, lies within U.S. waters contained within the management unit of the FMP. Most of the humpbacks that forage in the Gulf of Maine visit Stellwagen Bank and the waters of Massachusetts and Cape Cod Bays. Sightings are most frequent from mid-March through November between 41º N and 43º N, from the Great South Channel north along the outside of Cape Cod to Stellwagen Bank and Jeffreys Ledge (CeTAP 1982), and peak in May and August. However, small numbers of individuals may be present in this area year-round. They feed on a number of species of small schooling fishes, particularly sand lance and Atlantic herring, by filtering large amounts of water through their baleen to capture prey (Wynne and Schwartz 1999). Humpback whales use the Mid-Atlantic as a migratory pathway. Observations of juvenile humpbacks since 1989 in the Mid-Atlantic have been increasing during the winter months, peaking January through March (Swingle et al. 1993). Biologists theorize that non-reproductive animals may be establishing a winter-feeding range in this area since they are not participating in reproductive behavior in the Caribbean. The whales in the mid-Atlantic area were found to be residents of the Gulf of Maine and Atlantic Canada (Gulf of St. Lawrence and Newfoundland) feeding groups, suggesting a mixing of different feeding stocks in the mid-Atlantic region. New information has become available on the status and trends of the humpback whale population in the North Atlantic that indicates the population is increasing. However, it has not yet been determined whether this increase is uniform across all six feeding stocks (Waring et al. 2003). For example, although the overall rate of increase has been estimated at 9.0% (CV=0.25) by Katona and Beard (1990), Barlow and Clapham (1997) reported a 6.5% rate through 1991 for the Gulf of Maine feeding group. A variety of methods have been used to estimate the North Atlantic humpback whale population. However, the photographic mark-recapture analyses from the Years of the North Atlantic Humpback (YONAH) project gave a North Atlantic basin-wide estimate of 11,570 (CV= 0.069) is regarded as the best available estimate for that population, although caveat are associated with this estimate (Waring et al. 2003).
Appendix II 4
The major known sources of anthropogenic mortality and injury of humpback whales include entanglement in commercial fishing gear such as the sink gillnet gear used to catch multispecies, and ship strikes. Based on photographs of the caudal peduncle of humpback whales, Robbins and Mattila (1999) estimated that between 48% and 78% of animals in the Gulf of Maine exhibit scarring caused by entanglement. Fin Whale Fin whales inhabit a wide range of latitudes between 20-75° N and 20-75° S (Perry et al. 1999). Fin whales spend the summer feeding in the relatively high latitudes of both hemispheres, particularly along the cold eastern boundary currents in the North Atlantic and North Pacific Oceans and in Antarctic waters (IWC 1992). Most migrate seasonally from relatively high-latitude Arctic and Antarctic feeding areas in the summer to relatively low-latitude breeding and calving areas in the winter (Perry et al. 1999). In the North Atlantic today, fin whales are widespread and occur from the Gulf of Mexico and Mediterranean Sea northward to the edges of the arctic pack ice (NMFS 1998b). A number of researchers have suggested the existence of fin whale subpopulations in the North Atlantic. Mizroch et al. (1984) suggested that local depletions resulting from commercial over harvesting supported the existence of North Atlantic fin whale subpopulations. Others have used genetic information to support the existence of multiple subpopulations of fin whales in the North Atlantic and Mediterranean (Bérubé et al. 1998). Although the IWC’s Scientific Committee proposed seven stocks for North Atlantic fin whales, it is uncertain whether these stock boundaries define biologically isolated units (Waring et al. 2003). NMFS has designated one stock of fin whale for U.S. waters of the North Atlantic (Waring et al. 2003) where the species is commonly found from Cape Hatteras northward. Various estimates have been provided to describe the current status of fin whales in western North Atlantic waters. The latest published SAR (Waring et al. 2003) gives a best estimate of abundance for fin whales of 2,814 (CV = 0.21). However, this is considered an underestimate, as too little is known about population structure, and the estimate is derived from surveys over a limited portion of the western North Atlantic. There is also not enough information to estimate population trends. The major known sources of anthropogenic mortality and injury of fin whales include ship strikes and entanglement in commercial fishing gear such as the sink gillnet gear used to catch multispecies. However, many of the reports of mortality cannot be attributed to a particular source. Of 18 fin whale mortality records collected between 1991 and 1995, four were associated with vessel interactions, although the true cause of mortality was not known. Although several fin whales have been observed entangled in fishing gear, with some being disentangled, no mortalities have been attributed to gear entanglement. In general, known fishing gear-related mortalities of fin whales are less than those recorded for right and humpback whales. This may be due in part to the more offshore distribution of fin whales where they are either less likely to encounter entangling gear, or are less likely to be noticed when gear entanglements or vessel strikes do occur.

Appendix II 5
The overall distribution of fin whales may be based on prey availability. This species preys opportunistically on both zooplankton and fish (Watkins et al. 1984). The predominant prey of fin whales varies greatly in different geographical areas depending on what is locally available. In the western North Atlantic fin whales feed on a variety of small schooling fish (i.e., herring, capelin, sand lance) as well as squid and planktonic crustaceans (Wynne and Schwartz 1999). As with humpback whales, fin whales feed by filtering large volumes of water for their prey through their baleen plates. Photo identification studies in western North Atlantic feeding areas, particularly in Massachusetts Bay, have shown a high rate of annual return by fin whales, both within years and between years (Seipt et al. 1990). Sei Whale Sei whales are a widespread species in the world’s temperate, subpolar and subtropical and even tropical marine waters, although they appear to be more restricted to temperate waters than other balaenopterids (Perry et al. 1999). Mitchell and Chapman (1977) suggested that the sei whale population in the western North Atlantic consists of two stocks, a Nova Scotian Shelf stock and a Labrador Sea stock. The Nova Scotian Shelf stock includes the continental shelf waters of the Northeast Region, and extends northeastward to south of Newfoundland. The IWC boundaries for this stock are from the U.S. east coast to Cape Breton, Nova Scotia and east to 42°W longitude (Waring et al. 2003). This is the only sei whale stock within the management unit of this FMP. Sei whales occur in deep water throughout their range, typically over the continental slope or in basins situated between banks (NMFS 1998a). In the northwest Atlantic, the whales travel along the eastern Canadian coast in autumn on their way to and from the Gulf of Maine and Georges Bank where they occur in winter and spring. Within the Northeast Region, the sei whale is most common on Georges Bank and into the Gulf of Maine/Bay of Fundy region during spring and summer. Individuals may range as far south as North Carolina. It is important to note that sei whales are known for inhabiting an area for weeks at a time then disappearing for year or even decades. This has been observed all over the world, including in the southwestern Gulf of Maine in 1986, but the basis for this phenomenon is not clear. Although sei whales may prey upon small schooling fish and squid in the Northeast Region, available information suggests that calanoid zooplankton are the primary prey of this species. There are occasional influxes of sei whales further into Gulf of Maine waters, presumably in conjunction with years of high copepod abundance inshore. There are insufficient data to determine trends of the sei whale population. Because there are no abundance estimates within the last 10 years, a minimum population estimate cannot be determined for management purposes (Waring et al. 2003). Abundance surveys are problematic because this species is difficult to distinguish from the fin whale and too little is known of the sei whale’s distribution, population structure and patterns of movement. No instances of injury or mortality of sei whales due to entanglements in fishing gear have been recorded in U.S. waters, possibly because sei whales typically inhabit waters further offshore than most commercial fishing operations, or perhaps entanglements do occur but are less likely
Appendix II 6
to be observed. However, due to the overlap of this species observed range with the monkfish fishery areas that use sink gillnet gear, the potential for entanglement does exist. As noted in Waring, et al. (2003), sei whale movements into inshore areas have occurred historically. Similar impacts noted above for other baleen whales may also occur. Due to the deep-water distribution of this species, interactions that do occur are less likely to be observed or reported than those involving right, humpback, and fin whales that often frequent areas within the continental shelf. Blue Whale Like the fin whale, blue whales occur worldwide and are believed to follow a similar migration pattern from northern summering grounds to more southern wintering areas (Perry et al. 1999). Of the three subspecies have been identified, only B. musculus occurs in the northern hemisphere. Blue whales range in the North Atlantic from the subtropics to Baffin Bay and the Greenland Sea NMFS recognizes a minimum population estimate of 308 blue whales within the Northeast Region (Waring et al. 2003). Blue whales are only occasional visitors to east coast U.S. waters. They are more commonly found in Canadian waters, particularly the Gulf of St. Lawrence where they are present for most of the year, and in other areas of the North Atlantic. It is assumed that blue whale distribution is governed largely by food requirements which, at least in the Gulf of St. Lawrence, appear to include predominantly copepod species (NMFS 1998b). Entanglements in fishing gear such as the sink gillnet gear used in the monkfish fishery and ship strikes are believed to be the major sources of anthropogenic mortality and injury of blue whales, however, confirmed deaths or serious injuries are few. NOAA Fisheries 2003 Biological Opinion for the monkfish fishery references an incident in 1987, when, concurrent with an unusual influx of blue whales into the Gulf of Maine, one report was received from a whale watch boat that spotted a blue whale in the southern Gulf of Maine entangled in gear described as probable lobster pot gear. A second animal found in the Gulf of St. Lawrence apparently died from the effects of an entanglement. Sperm Whale Sperm whales inhabit all ocean basins, from equatorial waters to the polar regions (Perry et al. 1999). In the western North Atlantic they range from Greenland to the Gulf of Mexico and the Caribbean. The sperm whales that occur in the western North Atlantic are believed to represent only a portion of the total stock (Blaylock et al. 1995). Total numbers of sperm whales off the USA or Canadian Atlantic coast are unknown, although eight estimates from selected regions of the habitat do exist for select time periods. The best estimate of abundance for the North Atlantic stock of sperm whales is 4,702 (CV=0.36) (Waring et al. 2003). Sperm whales generally occur in waters greater than 180 meters in depth with a preference for continental margins, seamounts, and areas of upwelling, where food is abundant (Leatherwood and Reeves 1983). Sperm whales in both hemispheres migrate to higher latitudes in the summer for feeding and return to lower latitude waters in the winter where mating and calving occur. Mature males typically range to higher latitudes than mature females and immature animals but return to the lower latitudes in the winter to breed (Perry et al. 1999). Waring et al. (2003)

Appendix II 7
suggest sperm whale distribution is closely correlated with the Gulf Stream edge with a migration to higher latitudes during summer months where they are concentrated east and northeast of Cape Hatteras. Distribution is described as extending further northward to areas north of Georges Bank and the Northeast Channel region in summer and then south of New England in fall, back to the mid-Atlantic Bight (Waring et al. 2003). Sperm whales, especially mature males in higher latitude waters, have been observed to take significant quantities of large demersal and deep water sharks, multispecies, and bony fishes. Few instances of injury or mortality of sperm whales due to human impacts have been recorded in U.S. waters. Because of their generally more offshore distribution and their benthic feeding habits, sperm whales are less subject to entanglement than are right or humpback whales. However, the multispecies fishery is conducted near the shelf edge and utilizes fixed sink gillnet gear that may pose a threat to sperm whales. Documented takes primarily involve offshore fisheries such as the offshore lobster pot fishery and pelagic driftnet and pelagic longline fisheries. Ships also strike sperm whales. Due to the offshore distribution interactions (both ship strikes and entanglements) that do occur are less likely to be reported than those involving right, humpback, and fin whales that more often occur in nearshore areas. Leatherback Sea Turtle The leatherback sea turtle is the largest living turtle and ranges farther than any other sea turtle species, exhibiting broad thermal tolerances that allow it to forage into the colder Northeast Region waters (NMFS and USFWS, 1995). Evidence from tag returns and strandings in the western North Atlantic suggests that adults engage in routine migrations between boreal, temperate and tropical waters (NMFS and USFWS, 1992). In the U.S., leatherback turtles are found throughout the western North Atlantic during the warmer months along the continental shelf, and near the Gulf Stream edge. A 1979 aerial survey of the outer Continental Shelf from Cape Hatteras, North Carolina to Cape Sable, Nova Scotia showed leatherbacks to be present throughout the area with the most numerous sightings made from the Gulf of Maine south to Long Island (CeTAP 1982). Shoop and Kenney (1992) also observed concentrations of leatherbacks during the summer off the south shore of Long Island and New Jersey. Leatherbacks in these waters are thought to be following their preferred jellyfish prey. Leatherbacks are predominantly a pelagic species and feed on jellyfish and other soft-body prey. Time-depth-recorder data collected by Eckert et al. (1996) indicate that they are night feeders and are deep divers, with recorded dives to depths in excess of 1,000 meters. However, leatherbacks may feed in shallow waters if there is an abundance of jellyfish near shore. For example, leatherbacks occur annually in shallow bays such as Cape Cod and Narragansett Bays during the fall. Recent information suggests that western North Atlantic populations declined from 18,800 nesting females in 1996 (Spotila et al. 1996) to 15,000 nesting females by 2000. Anthropogenic impacts to the leatherback population include fishery interactions as well as exploitation of the eggs (Ross 1979). Eckert (1996) and Spotila et al. (1996) record that adult
Appendix II 8
mortality has also increased significantly, particularly as a result of driftnet and longline fisheries. Numerous fisheries that occur in both U.S. state and federal waters are known to negatively impact juvenile and adult leatherback sea turtles. These include incidental take in several commercial and recreational fisheries. Fisheries known or suspected to incidentally capture leatherbacks include those deploying bottom trawls, off-bottom trawls, purse seines, hook and line, gillnets, drift nets, traps, haul seines, pound nets, beach seines, and surface longlines (NMFS and USFWS 1992). Leatherbacks are also susceptible to entanglement in lobster and crab pot gear. The probable reasons may be attraction to gelatinous organisms and algae that collect on buoys and buoy lines at or near the surface; attraction to the buoys which could appear as prey; or the gear configuration which may be more likely to wrap around flippers. The total number of leatherbacks reported entangled from New York through Maine from all sources for the years 1980 - 2000 is 119. Entanglements are also common in Canadian waters where Goff and Lien (1988) reported that 14 of 20 leatherbacks encountered off the coast of Newfoundland/Labrador were entangled in fishing gear including salmon net, herring net, gillnet, trawl line and crab pot line. Prescott (1988) reviewed stranding data for Cape Cod Bay and concluded that for those turtles where cause of death could be determined (the minority), entanglement in fishing gear is the leading cause of death followed by capture by dragger, cold stunning, or collision with boats. Kemp’s Ridley Sea Turtle The Kemp’s ridley is the most endangered of the world’s sea turtle species. Of the world’s seven extant species of sea turtles, the Kemp's ridley has declined to the lowest population level. The Turtle Expert Working Group (TEWG) (1998; 2000), however, indicated that the Kemp's ridley population appears to be in the early stage of exponential expansion. Nesting data, estimated number of adults, and percentage of first time nesters have all increased from lows experienced in the 1970s and 1980s. From 1985 to 1999, the number of nests observed at Rancho Nuevo and nearby beaches has increased at a mean rate of 11.3% per year, allowing cautious optimism that the population is on its way to recovery. Juvenile Kemp’s ridleys use northeastern and Mid-Atlantic coastal waters of the U.S. Atlantic coastline as primary developmental habitat during summer months, with shallow coastal embayments serving as important foraging grounds. Next to loggerheads, they are the second most abundant sea turtle in Virginia and Maryland waters, arriving in these areas during May and June (Keinath et al., 1987; Musick and Limpus, 1997). Studies have found that post-pelagic ridleys feed primarily on a variety of species of crabs. Mollusks, shrimp, and fish are consumed less frequently (Bjorndal, 1997). With the onset of winter and cooler water temperatures, ridleys migrate southward from September to November (Keinath et al., 1987; Musick and Limpus, 1997). Turtles that do not head south soon enough face the risks of cold stunning in northern waters. Cold stunning can be a significant natural cause of mortality for sea turtles in Cape Cod Bay and Long Island Sound. Cold-stunned turtles have also been found on beaches in New York and New Jersey. Such

Appendix II 9
events can represent a significant cause of natural mortality, in spite of the fact that many cold-stunned turtles can survive if found early enough. Like other turtle species, the severe decline in the Kemp’s ridley population appears to have been heavily influenced by a combination of exploitation of eggs and impacts from fishery interactions. Currently, anthropogenic impacts to the Kemp’s ridley population are similar to those discussed above for other sea turtle species. Takes of Kemp’s ridley turtles have been recorded by sea sampling coverage in the Northeast otter trawl fishery, pelagic longline fishery, and southeast shrimp and summer flounder bottom trawl fisheries. Although not directly related to the monkfish fishery, new information now included in a November 2005 Section 7 consultation adds to the information on sea turtles and fishery interactions. A turtle observed captured in scallop dredge gear operating on Georges Bank in August 2005 was identified as a Kemp’s ridley from photographs taken by an NMFS-authorized observer. The event constitutes new information about the area in which interactions between sea turtles and fishing gear occurs and the species involved in such interactions. Green Sea Turtle Green turtles are distributed circumglobally. In the western Atlantic they range from Massachusetts to Argentina, including the Gulf of Mexico and Caribbean, but are considered rare north of Cape Hatteras (Wynne and Schwartz, 1999). Recent population estimates for the western Atlantic area are not available. Green turtles appear to prefer marine grasses and algae in shallow bays, lagoons and reefs (Rebel 1974) but also consume jellyfish, salps, and sponges. Green sea turtles use mid-Atlantic and northern areas of the western Atlantic coast as important summer developmental habitat. They are found in estuarine and coastal waters as far north as Long Island Sound, Chesapeake Bay, and North Carolina sounds (Musick and Limpus 1997). Like loggerheads and Kemp’s ridleys, green sea turtles that use northern waters during the summer return to warmer waters when water temperatures drop, or face the risk of cold stunning. Cold stunning of green turtles may occur in southern areas as well (i.e., Indian River, Florida), as these natural mortality events are dependent on water temperatures and not solely geographical location. Anthropogenic impacts to the green sea turtle population are similar to those discussed above for other sea turtles species. Fishery mortality accounts for a large proportion of annual human-caused mortality outside the nesting beaches, while other activities like dredging, pollution, and habitat destruction account for an unknown level of other mortality. Sea sampling coverage in the pelagic driftnet, pelagic longline, southeast shrimp trawl, and summer flounder bottom trawl fisheries has recorded takes of green turtles. As with Kemps ridleys, new information also has become available concerning green turtles. Following a review of information associated with a turtle observed taken in scallop dredge gear in 1997, it was determined that the turtle was a green sea turtle as originally identified by the

Appendix II 10
observer and as recorded in the observer database. Previous agency Biological Opinions for the Atlantic sea scallop fishery, including the December 15, 2004, Opinion had identified this turtle as an “unidentified hard-shelled species’ dating back to the December 28, 2000 ESA section 7 consultation for Framework Adjustment 14 to the Atlantic Sea Scallop FMP. Loggerhead Sea Turtle Loggerhead sea turtles occur throughout the temperate and tropical regions of the Atlantic, Pacific, and Indian Oceans in a wide range of habitats. These include open ocean, continental shelves, bays, lagoons, and estuaries (NMFS and USFWS 1995). Loggerhead sea turtles are primarily benthic feeders, opportunistically foraging on crustaceans and mollusks (Wynne and Schwartz 1999). Under certain conditions they may also scavenge fish (NMFS and USFWS 1991). The threatened loggerhead sea turtle is the most abundant of the sea turtles listed as threatened or endangered in the U.S. waters. However, the status of the northern loggerhead subpopulation is of particular concern. There are only an estimated 3,800 nesting females in the northern loggerhead subpopulation, and the status of this northern population based on number of loggerhead nests, has been classified declining or stable (TEWG 2000). Another factor that may add to the vulnerability of the northern subpopulation is that genetics data show that the northern subpopulation produces predominantly males (65%). In contrast, the much larger south Florida subpopulation produces predominantly females (80%) (NMFS SEFSC 2001). The activity of the loggerhead is limited by temperature. Loggerheads commonly occur throughout the inner continental shelf from Florida through Cape Cod, Massachusetts. Loggerheads may also occur as far north as Nova Scotia when oceanographic and prey conditions are favorable. Surveys conducted offshore as well as sea turtle stranding data collected during November and December off North Carolina suggest that sea turtles emigrating from northern waters in fall and winter months may concentrate in nearshore and southerly areas influenced by warmer Gulf Stream waters (Epperly et al. 1995). This is supported by the collected work of Morreale and Standora (1998) who tracked 12 loggerheads and 3 Kemp’s ridleys by satellite. All of the turtles followed similar spatial and temporal corridors, migrating south from Long Island Sound, New York, during October through December. The turtles traveled within a narrow band along the continental shelf and became sedentary for one or two months south of Cape Hatteras. Loggerhead sea turtles do not usually appear on the most northern summer foraging grounds in the Gulf of Maine until June, but are found in Virginia as early as April. They remain in the mid-Atlantic and northeast areas until as late as November and December in some cases, but the majority leaves the Gulf of Maine by mid-September. Aerial surveys of loggerhead turtles north of Cape Hatteras indicate that they are most common in waters from 22 to 49 meters deep, although they range from the beach to waters beyond the continental shelf (Shoop and Kenney 1992). Loggerhead sea turtles originating from the western Atlantic nesting aggregations are believed to lead a pelagic existence in the North Atlantic gyre for as long as 7-12 years before settling into benthic environments. In the waters off the coastal U.S., they are exposed to a suite of fisheries
Appendix II 11
in federal and State waters including trawl, scallop dredge, purse seine, hook and line, gillnet, pound net, longline, and trap fisheries. Loggerhead sea turtles are captured in fixed pound net gear in the Long Island Sound, in pound net gear and trawls in summer flounder and other finfish fisheries in the Mid-Atlantic and Chesapeake Bay, in gillnet fisheries in the Mid-Atlantic and elsewhere, and in multispecies, monkfish, spiny dogfish, and northeast sink gillnet fisheries. Perhaps more relevant to the monkfish fishery, a total of five loggerhead sea turtles have been observed captured in trawl gear used in the Atlantic sea scallop fishery during the 2005 fishing year to date. Therefore, the number of loggerhead sea turtles observed taken thus far in the 2005 scallop trawl fishery represents new information on the effects of that fishery on ESA-listed sea turtles. Previously, interactions were not attributed to this sector of the fishery. Minke Whale Minke whales have a cosmopolitan distribution in polar, temperate, and tropical waters. The Canadian east coast population is one of four populations recognized in the North Atlantic. Minke whales off the eastern coast of the U.S. are considered to be part of the population that extends from Davis Strait off Newfoundland to the Gulf of Mexico. The species is common and widely distributed along the U.S. continental shelf. They show a certain seasonal distribution with spring and summer peak numbers, falling off in the fall to very low winter numbers. Like all baleen whales, the minke whale generally occupies the continental shelf proper. Minke whales are known to be taken in sink gillnet gear that is also used to catch monkfish. Takes have also been documented in trawl fisheries. Waring et al. (2003) has described the estimated total take of minkes in all fisheries to be below the PBR established for that species. Harbor Porpoise During the summer months harbor porpoise are concentrated in the northern Gulf of Maine/Bay of Fundy regions and migrate seasonally to the mid-Atlantic. During the fall and spring months they are widely dispersed from Maine to New Jersey. During March and April they travel through heavily fished areas of Jeffrey’s Ledge, Mass Bay, southern New England and south, regions in which they are subject to entanglement in sink gillnet gear. The historic level of serious injury and mortality of harbor porpoise in sink gillnet gear was known to be high relative to the estimated population level though the mid-1990s. Subsequently, the Harbor Porpoise Take Reduction Plan (HPTRP) was implemented in 1998 to reduce takes in the Northeast and Mid-Atlantic gillnet fisheries through a series of time/area closures and required use of acoustical deterrents that have reduced the take to acceptable levels. NMFS recently reported (67 FR 51234 dated August 7, 2002) that the estimated incidental take of harbor porpoise in U.S. waters for 2001 was 80 animals. The minimum population estimate for 1999 was established at 74,695, and the potential biological removal (PBR) for the harbor porpoise is now set at 747. Although the 2002 mortality estimate was below the latest PBR level, the stock is still considered a strategic stock requiring continued measures to reduce human-caused mortality from

Appendix II 12
commercial fishing. This is due to the fact that there are insufficient data to determine population trends for this species. In 2004, the commercial fishery take exceeded PBR for harbor porpoise. Atlantic White-Sided Dolphin White-sided dolphins are found in the temperate and sub-polar waters of the North Atlantic, primarily on the continental shelf waters out to the 100-meter depth contour. The species is distributed from central western Greenland to North Carolina, with the Gulf of Maine stock commonly found from Hudson Canyon to Georges Bank and into the Gulf of Maine to the Bay of Fundy. A minimum population estimate of 37,904 for the Gulf of Maine stock of white-sided dolphin was derived from several survey estimates according to Waring et al. (2003). White-sided dolphins have been observed taken in sink gillnets, pelagic drift gillnets, and several mid-water and bottom trawl fisheries. While is unclear whether sink gillnets with takes of white-sided dolphins were engaged in the monkfish fishery, the inference can be made that the gear type is capable of interactions with this species. Waring et al. (2003) described the estimated total take of white-sided dolphins in all fisheries (including those that catch multispecies) to be below the PBR established for that species. Risso’s Dolphin Risso’s dolphins are distributed along the continental shelf edge of North America from Cape Hatteras to Georges Bank. A minimum population estimate of 29,110 was derived from limited survey estimates in northern U.S. waters. Observers have documented takes in the pelagic drift gillnet, pelagic longline, and mid-water trawl fisheries, but have not reported this species in monkfish gear (Waring et al. 2003), although takes have been documented in the Northeast multispecies sink gillnet fishery. Since both fisheries use similar gear, Risso’s dolphin could be vulnerable to entanglement in the directed monkfish fishery, although it may be a rare occurrence. This conclusion is based on their preference for pelagic prey species (squid and schooling fishes) and because their general distribution makes encounters with monkfish gear unlikely. Therefore although takes in this fishery could occur, they should not that compromise the ability of this species to maintain optimum sustainable population levels, or cause their serious injury and mortality levels to exceed the PBR levels allowed for commercial fisheries under the MMPA. Coastal Bottlenose Dolphins The coastal form of the bottlenose dolphin, which is listed as depleted under the MMPA, occurs in the shallow, relatively warm waters along the U.S. Atlantic coast from New Jersey to Florida and the Gulf of Mexico. Recent genetic analyses indicate a minimum of five stocks along the U.S. Atlantic coast rather than one homogeneous population. The species rarely range beyond the 25-meter depth contour north of Cape Hatteras. Waring et al. (2003) discusses interactions with various kinds of fishing gear including gillnets, seines, longlines, shrimp trawls and crab pots. The stock is considered strategic under the MMPA because fishery-related mortality and serious injury exceed PBR. Pelagic Delphinids (Pilot whales, offshore bottlenose and common dolphins) The pelagic delphinid complex is made up of small odontocete species that are broadly distributed along the continental shelf edge where depths range from 200 - 400 meters. They are

Appendix II 13
commonly found in large schools feeding on schools of fish. The minimum population estimates for each species number in the tens of thousands. They are known to be taken in pelagic and sink gillnets gear as well as mid-water and bottom trawl gear. Takes have occurred in the bottom trawl fishery and gillnet fisheries, although their pelagic prey species suggest they do not forage near the bottom. Interactions therefore are likely to be infrequent. Harbor seal Harbor seals are year-round inhabitants of the coastal waters of eastern Canada and Maine, and occur seasonally along the southern New England and New York coasts from September through late-May. However, breeding and pupping normally occur only in waters north of the New Hampshire/Maine border. Since passage of the MMPA in 1972, the number of seals found along the New England coast has increased nearly five-fold with the number of pups seen along the Maine coast increasing at an annual rate of 12.9 percent during the 1981-1997 period (Gilbert and Guldager 1998). The minimum population estimate for the harbor seal is 30,990 based on uncorrected total counts along the Maine coast in 1997 (Waring et al. 2003). Harbor seals are taken in sink gillnet gear used in the monkfish fishery. Waring et al. (2003) has described the estimated total take of harbor seals in all fisheries (972) to be below the PBR of 5,493 established for that species. Gray seal The gray seal is found on both sides of the North Atlantic, with the western North Atlantic population occurring from New England to Labrador. There are two breeding concentrations in eastern Canada; one at Sable Island and one that breeds on the pack ice in the Gulf of St. Lawrence. There are several small breeding colonies on isolated islands along the coast of Maine and on outer Cape Cod and Nantucket Island in Massachusetts (Waring et al. 2003). The population estimates for the Sable Island and Gulf of St Lawrence breeding groups was 143,000 in 1993. The gray seal population in Massachusetts has increased from 2,010 in 1994 to 5,611 in 1999, although it is not clear how much of this increase may be due to animals emigrating from northern areas. Approximately 150 gray seals have been observed on isolated islands off Maine. Gray seals are taken in sink gillnet gear. Waring et al. (2003) has described the estimated total take of gray seals from 1959 to 1999 in all fisheries to be between 50 and 155 animals which is well below the PBR of 8,850 established for that species. Harp seal The harp seal occurs throughout much of the North Atlantic and Arctic Oceans, and has been increasing off the East Coast of the United States from Maine to New Jersey. Harp seals are usually found off the U.S. from January to May when the western stock of harp seals is at their most southern point of migration (Waring et al. 2003). This species congregates on the edge of the pack ice in February through April when breeding and pupping takes place. The harp seal is highly migratory, moving north and south with the edge of the pack ice. Non-breeding juveniles will migrate the farthest south in the winter, but the entire population moves north toward the Artic in the summer. The minimum population estimate for the western North Atlantic is 5.2 million seals.

Appendix II 14
A large number of harp seals are killed in Canada, Greenland and the Artic. The Canadian kill is controlled by DFO who set the allowed kill at 275,000 in 1997. Mortality in Greenland and the Artic may exceed 100,000 (Waring et al. 2003). Harp seals are also taken in sink gillnet gear used to catch multispecies and possibly monkfish. Waring et al. (2003) has described the estimated total take of harp seals from 1959 to 1999 in all fisheries to range between 78 and 694 animals depending on the location of the pack ice edge which drives the seals farther south into the range of the sink gillnet fishery. Even with the highest takes observed, the take is well below the PBR of 156,000 established for that species. Actions to Minimize Interactions with Protected Species Many of the factors that serve to mitigate the impacts of the multispecies fishery on protected species are currently being implemented in the Northeast Region under either the Atlantic Large Whale Take Reduction Plan (ALWTRP) or the Harbor Porpoise Take Reduction Plan (HPTRP). In addition, the Multispecies FMP has undergone repeated consultations pursuant to Section 7 of the Endangered Species Act (ESA), with the most recent Biological Opinion dated June 14, 2001. The conclusion in that Opinion states that the multispecies fishery is likely to jeopardize the continued existence of the North Atlantic right whale, and required NMFS to implement a set of Reasonable and Prudent Alternatives (RPAs) to remedy the jeopardy finding. As described below, the regulatory measures of the ALWTRP and the HPTRP have been implemented in direct response to the impacts of fishing operations taking place under the Multispecies FMP (and others) and must be adhered to by any vessel fishing for multispecies. Harbor Porpoise Take Reduction Plan NMFS published the rule implementing the Harbor Porpoise Take Reduction Plan on December 1, 1998. The HPTRP includes measures for gear modifications and area closures, based on area, time of year, and gillnet mesh size. In general, the Gulf of Maine component of the HPTRP includes time and area closures, some of which are complete closures; others are closures to gillnet fishing unless pingers (acoustic deterrent devices) are used in the prescribed manner. The Mid-Atlantic component includes time and area closures in which gillnet fishing is prohibited regardless of the gear specifications. Atlantic Large Whale Take Reduction Plan The ALWTRP contains a series of regulatory measures designed to reduce the likelihood of fishing gear entanglements of right, humpback, fin, and minke whales in the North Atlantic. The main tools of the plan include a combination of broad gear modifications and time/area closures (which are being supplemented by progressive gear research), expanded disentanglement efforts, extensive outreach efforts in key areas, and an expanded right whale surveillance program to supplement the Mandatory Ship Reporting System. Key regulatory changes implemented in 2002 included: 1) new gear modifications; 2) implementation of a Dynamic Area Management system (DAM) of short-term closures to protect unexpected concentrations of right whales in the Gulf of Maine; and 3) establishment of a Seasonal Area Management system (SAM) of additional gear modifications to protect known seasonal concentrations of right whales in the southern Gulf of Maine and Georges Bank.

Appendix II 15
The most recent change to the ALWTRP, which became effective on September 25, 2003, allows lobster trap and anchored gillnet gear in a DAM zone once a closure is triggered, but specifies additional gear modifications designed to reduce the risk of entanglements of northern right whales. NMFS Rule to Conserve Sea Turtles NMFS published a final rule (67 FR 71895, December 3, 2002), effective January 2, 2003, that enacted a series of seasonal closures to the use of large mesh gillnets in the EEZ off the coast of Virginia and North Carolina. The purpose of the closures is to reduce the impact of the monkfish fishery on endangered and threatened species of sea turtles. This final rule followed several temporary actions taken by NMFS since 2000 in response to sea turtle strandings. Federal waters between Oregon Inlet and the North Carolina/South Carolina border are closed year round, while three other areas to the north (up to Chincoteague, VA) are closed from March 16, April 1, and April 16, respectively, to January 14 each year. NMFS is currently reviewing a proposed rule that would require that the gillnet gear restrictions from the North Carolina/South Carolina border to Chincoteague be extended into state waters that are seaward of the COLREGS lines. It also proposes to make the gillnet gear restriction applicable to gillnets with 7" or greater stretched mesh (rather than the current larger than 8-inch stretched mesh). The proposed rule can be found at http://www.nmfs.noaa.gov/pr/interactions/trt/bdtrp.htm. Atlantic Trawl Take Reduction Team
On April 29, 2003, the Center for Biological Diversity (CBD) and the National Marine Fisheries Service entered into a settlement agreement concerning claims that NMFS violated section 118 of the Marine Mammal Protection Act (MMPA). CBD’s claim focused on two distinct fisheries – the pelagic longline and Atlantic squid, mackerel and butterfish fisheries. As part of the settlement agreement, NMFS agreed to convene a TRT for the Atlantic pelagic longline fishery with regard to incidental mortality and serious injury of pilot whales no later than June 30, 2005. NMFS also agreed to convene a TRT for the Atlantic squid, mackerel, butterfish trawl fishery with regard to incidental mortality and serious injury of pilot whales and common dolphins no later than September 30, 2006. The Southeast Region was designated the lead for the Atlantic pelagic longline TRT and the Northeast Region (NER) was designated the lead for the Atlantic squid, mackerel, butterfish trawl TRT. The final makeup of the TRT will be determined after the appropriate observer and stock assessment information has been completed and analyzed as outlined in the settlement agreement. Since sea turtles have documented takes in many of the trawl gear configurations being considered for the new TRT, the NER and Northeast Fisheries Science Center intend to work with sea turtle managers to incorporate the sea turtle management strategy into the new trawl TRT process. Consequently, the NER and NEFSC will be implementing a broader based TRT that encompasses several configurations of trawl gear that have known incidental moralities and serious injuries of sea turtles as well as marine mammals. Additional Information

Appendix II 16
Additional background information on the range-wide status of these species can be found in a number of published documents, including sea turtle status reviews and biological reports (NOAA Fisheries and USFWS 1995; Marine Turtle Expert Working Group (TEWG) 1998 & 2000), recovery plans for the humpback whale (NOAA Fisheries 1991a), right whale (1991b), loggerhead sea turtle (NOAA Fisheries and USFWS 1991a), Kemp’s ridley sea turtle (USFWS and NOAA Fisheries 1992), green sea turtle (NOAA Fisheries and USFWS 1991b) and leatherback sea turtle (NOAA Fisheries and USFWS 1992), the Marine Mammal Stock Assessment Reports (SAR) (Waring et al. 2003), and other publications (e.g., Perry et al. 1999; Clapham et al. 1999; IWC 2001a). A draft recovery plan for fin and sei whales is available at http://www.NOAA Fisheries.noaa.gov/prot_res/PR3/recovery.html (NOAA Fisheries 1998b, unpublished). A revised recovery plan for right whales is also available at the same web address, along with a recovery plan for blue whales.