Embed Size (px)
Citation preview
MAKING MARK
ETS
FU
NC
TIO
NB
ET
TE
R
YEARS
Apollo Hospitals Enterprise Ltd
CRISIL IERIndependentEquityResearch
Enhancing investment decisions
Detailed Report
Monnet Ispat & Energy Ltd
Detailed report
CRISIL IERIndependentEquityResearch
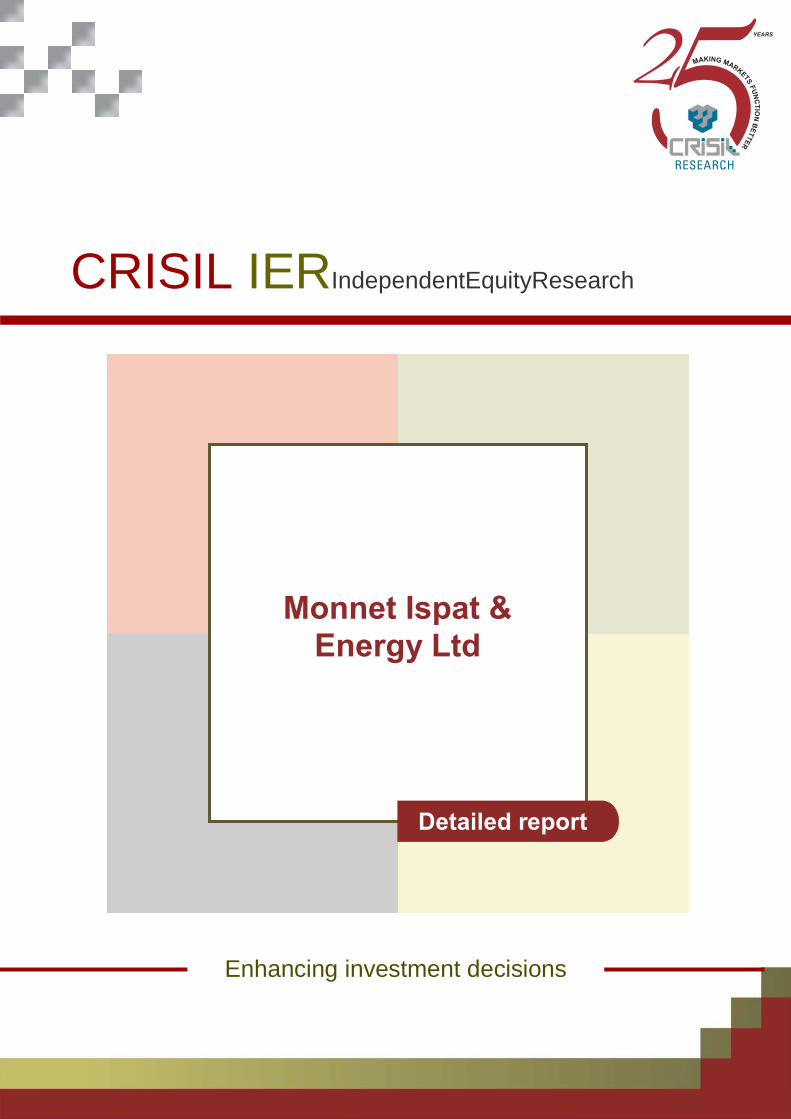
Explanation of CRISIL Fundamental and Valuation (CFV) matrix
The CFV Matrix (CRISIL Fundamental and Valuation Matrix) addresses the two important analysis of an investment making process – Analysis of Fundamentals (addressed through Fundamental Grade) and Analysis of Returns (Valuation Grade) The fundamental grade is assigned on a five-point scale from grade 5 (indicating Excellent fundamentals) to grade 1 (Poor fundamentals) The valuation grade is assigned on a five-
point scale from grade 5 (indicating strong upside from the current market price (CMP)) to grade 1 (strong downside from the CMP).
CRISIL Fundamental Grade Assessment
CRISIL Valuation Grade Assessment
5/5 Excellent fundamentals 5/5 Strong upside (>25% from CMP) 4/5 Superior fundamentals 4/5 Upside (10-25% from CMP) 3/5 Good fundamentals 3/5 Align (+-10% from CMP) 2/5 Moderate fundamentals 2/5 Downside (negative 10-25% from CMP) 1/5 Poor fundamentals 1/5 Strong downside (<-25% from CMP)
About CRISIL Limited CRISIL is a global analytical company providing ratings, research, and risk and policy advisory services. We are India's leading ratings agency.We are also the foremost provider of high-end research to the world's largest banks and leading corporations. About CRISIL Research CRISIL Research is India's largest independent and integrated research house.We provide insights, opinions, and analysis on the Indian economy, industries, capital markets and companies. We are India's most credible provider of economy and industry research. Our industry research covers 70 sectors and is known for its rich insights and perspectives. Our analysis is supported by inputs from our network of more than 4,500 primary sources, including industry experts, industry associations, and trade channels. We play a key role in India's fixed income markets.We are India's largest provider of valuations of fixed income securities, serving the mutual fund, insurance, and banking industries. We are the sole provider of debt and hybrid indices to India's mutual fund and life insurance industries.We pioneered independent equity research in India, and are today India's largest independent equity research house. Our defining trait is the ability to convert information and data into expert judgements and forecasts with complete objectivity. We leverage our deep understanding of the macroeconomy and our extensive sector coverage to provide unique insights on micromacro and cross-sectoral linkages. We deliver our research through an innovative web-based research platform. Our talent pool comprises economists, sector experts, company analysts, and information management specialists. CRISIL Privacy CRISIL respects your privacy. We use your contact information, such as your name, address, and email id, to fulfill your request and service your account and to provide you with additional information from CRISIL and other parts of The McGraw-Hill Companies, Inc. you may find of interest. For further information, or to let us know your preferences with respect to receiving marketing materials, please visit www.crisil.com/privacy. You can view McGraw-Hill's Customer Privacy Policy at http://www.mcgrawhill.com/site/tools/privacy/privacy_english. Last updated: 31 March, 2011 Analyst Disclosure Each member of the team involved in the preparation of the grading report, hereby affirms that there exists no conflict of interest that can bias the grading recommendation of the company. Disclaimer: This Company-commissioned CRISIL IER report is based on data publicly available or from sources considered reliable. CRISIL Ltd. (CRISIL) does not represent that it is accurate or complete and hence, it should not be relied upon as such. The data / report is subject to change without any prior notice. Opinions expressed herein are our current opinions as on the date of this report. Nothing in this report constitutes investment, legal, accounting or tax advice or any solicitation, whatsoever. The subscriber / user assume the entire risk of any use made of this data / report. CRISIL especially states that, it has no financial liability whatsoever, to the subscribers / users of this report. This report is for the personal information only of the authorised recipient in India only. This report should not be reproduced or redistributed or communicated directly or indirectly in any form to any other person – especially outside India or published or copied in whole or in part, for any purpose.
MAKING MARK
ETS
FU
NC
TIO
NB
ET
TE
R
YEARS Monnet Ispat & Energy Ltd
Capacity expansion to take it a level higher
Fundamental Grade 4/5 (Superior fundamentals)
Valuation Grade 5/5 (CMP has strong upside)
Industry Metals & Mining
1
April 16, 2012
Fair Value Rs 660 CMP Rs 470
Monnet Ispat & Energy Ltd (Monnet) is expanding capacity to fuel the next level of growth and become an integrated steel company with total steel capacity of 1.8 mn MTPA. The operational captive coal mine along with other allocated iron ore and coking coal mines, once operational, will partially meet its raw material requirement and give it a cost advantage. Further, diversification into power generation with a 1,050 MW power plant in Orissa is expected to be value accretive given captive fuel linkages. However, regulatory approvals and delays remain key monitorables. We reaffirm a fundamental grade of ‘4/5’ on Monnet, indicating that its fundamentals are ‘superior’ relative to other listed securities in India.
Transitioning into a mid-sized integrated steel player Monnet is transitioning from the second largest coal-based sponge iron producer to a mid-sized integrated steel company with a capacity of 1.8 mn MTPA by end-FY14. The expansion will help raise the share of value-added products (structural steel, longs (bars) and flats (plates)) in the revenue to 63% in FY13 and 79% in FY14 from 8% in FY11. The mining linkage for iron ore, coal and coking coal will partially meet its requirement and give it a cost advantage.
Power plant to fuel growth Work on subsidiary Monnet Power’s 1,050 MW power plant is progressing and is expected to be commissioned in FY14. The upcoming pit head plant has 100% coal linkage through its two captive blocks, making it very cost efficient and highly profitable. Utkal mine, the first block, has secured all approvals and is set to start operations once the mining lease is signed. The Mandani block is yet to secure regulatory approvals.
Operates in a cyclical industry, faces regulatory delays Monnet operates in a highly cyclical industry - steel - where the profitability of the players is dependent on global steel prices. Further, the company faces the risk of delay in approvals for its mines (except Utkal mine), which can hamper its profitability and expansion plans.
Standalone revenues to grow at a three-year CAGR of 35% We expect Monnet’s standalone revenues to grow to Rs 39 bn by FY14 from Rs 15.7 bn in FY11, largely driven by capacity expansion. EBITDA margin is expected to drop to 25% in FY13 from 29% in FY11 on account of lower margins from pig iron; however, it is expected to improve in FY14 to 28% with the commissioning of the pellet plant and iron ore mine. Margins are expected to improve in the long run as the captive coking coal block also becomes operational.
Valuations – the current market price has ‘strong upside’ CRISIL Research has used the sum-of-the-parts (SOTP) method to value Monnet and arrived at a fair value of Rs 660 per share. Our valuation grade is ‘5/5’, which indicates the market price has a ‘strong upside’ from the current.
KEY FORECAST (STANDALONE)
(Rs mn) FY10 FY11 FY12E FY13E FY14EOperating income 14,825 15,705 18,473 29,794 39,057EBITDA 4,487 4,522 5,019 7,311 10,800Adj Net income 2,709 2,819 2,957 3,019 4,205EPS-Rs 51.8 43.8 45.9 46.9 65.3EPS growth (%) 15.2 (15.5) 4.9 2.1 39.3Dividend yield (%) 1.2 1.1 1.1 1.1 1.1P/E (x) 9.1 10.7 10.2 10.0 7.2P/BV (x) 1.5 1.4 1.3 1.2 1.0RoCE (%) 13.3 9.6 7.9 8.4 11.9RoE (%) 19.0 15.1 13.3 12.2 15.0EV/EBITDA (x) 8.3 11.1 11.8 9.0 6.5
NM: Not meaningful; CMP: Current market price
Source: Company, CRISIL Research estimates
CFV MATRIX
KEY STOCK STATISTICS NIFTY/SENSEX 5207/17090
NSE /BSE ticker MONNETISPA/
MONNETFace value (Rs per share) 10Shares outstanding (mn) 64.3Market cap (Rs mn)/(US$ mn) 30,240/588Enterprise value (Rs mn)/(US$ mn) 50,077/97452-week range (Rs)/(H/L) 535/305Beta 0.97Free float (%) 50.6%Avg daily volumes (30-days) 24,483Avg daily value (30-days) (Rs mn) 8.9
SHAREHOLDING PATTERN
PERFORMANCE VIS-À-VIS MARKET
Returns
1-m 3-m 6-m 12-mMonnet 2% 18% -3% -11%NIFTY -4% 7% 3% -12%
ANALYTICAL CONTACT Chetan Majithia (Head) [email protected] Vishal Rampuria [email protected] Pravesh Rawat [email protected]
Client servicing desk +91 22 3342 3561 [email protected]
1 2 3 4 5
1
2
3
4
5
Valuation Grade
Fund
amen
tal G
rade
Poor Fundamentals
ExcellentFundamentals
Str
ong
Dow
nsid
e
Str
ong
Ups
ide
49.4% 49.4% 49.4% 49.4%
32.5% 32.1% 35.3% 34.8%
4.5% 4.4% 4.4% 4.3%13.6% 14.1% 10.9% 11.5%
0%10%20%30%40%50%60%70%80%90%
100%
Mar-11 Jun-11 Sep-11 Dec-11
Promoter FII DII Others

CRISIL IERIndependentEquityResearch
2
Table 1: Monnet Business environment (Standalone)
Product / Segment Sponge iron Steel and others Power
Revenue contribution (FY11) 68.7% 11.3% 20.0%
Revenue contribution (FY12/FY13/FY14)
69% / 21% / 12% 19% / 68% / 82% 12% / 11% / 6%
Product / service offering Coal-based sponge iron Various sizes of structural sections covering a wide range of structural grades, ferro alloys
Power generated through coal and waste heat
Geographic presence Manufacturing facility: Raipur and Raigarh, Chhattisgarh
Manufacturing facility: Raipur, Chhattisgarh
Manufacturing facility in Raigarh under construction
Manufacturing facility: Raipur and Raigarh, Chhattisgarh
Market position Second largest coal-based sponge iron producer in India
Industry growth expectations • Domestic steel demand is expected to increase at a healthier pace of 7-9% over the next couple of years
• International steel demand is expected to grow at a CAGR of 5-6%
Sales growth (FY08-FY11 – 3-yr CAGR)
33% -38% 184%
Sales forecast (FY11-FY14 – 3-yr CAGR)
-25% (captive consumption to lead to decline in sponge iron sales)
160% -9% (captive consumption to lead to decline in power)
Demand drivers • Strong growth in infrastructure, construction and automobiles sectors
• The government's increased focus on infrastructure development
Key competitors JSPL, JSW Steel, Tata Steel, SAIL, Jai Balaji Steel, MSP Steel, Bhushan Steel and others
Key risks • Dependence on the open market for procuring iron ore and coking coal exposes Monnet to fluctuations in raw material prices
• Sale of residual power after captive use in the merchant market exposes Monnet to the risk of decrease in merchant rates in the future
• Monnet is yet to commence mining extraction. Any delay in that will negatively impact the company’s profitability
Source: Company, CRISIL Research
MAKING MARK
ETS
FU
NC
TIO
NB
ET
TE
R
YEARS
3
Monnet Ispat & Energy Ltd
Grading Rationale
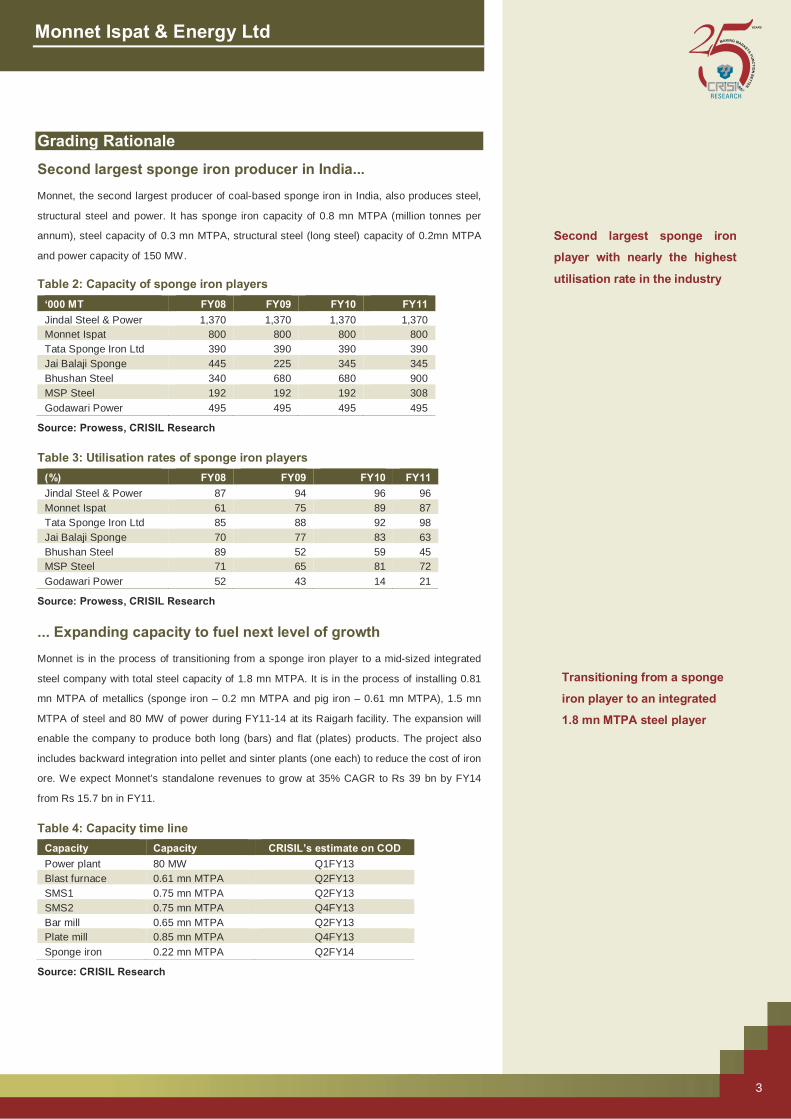
Second largest sponge iron producer in India... Monnet, the second largest producer of coal-based sponge iron in India, also produces steel,
structural steel and power. It has sponge iron capacity of 0.8 mn MTPA (million tonnes per
annum), steel capacity of 0.3 mn MTPA, structural steel (long steel) capacity of 0.2mn MTPA
and power capacity of 150 MW.
Table 2: Capacity of sponge iron players ‘000 MT FY08 FY09 FY10 FY11 Jindal Steel & Power 1,370 1,370 1,370 1,370 Monnet Ispat 800 800 800 800 Tata Sponge Iron Ltd 390 390 390 390 Jai Balaji Sponge 445 225 345 345 Bhushan Steel 340 680 680 900 MSP Steel 192 192 192 308 Godawari Power 495 495 495 495
Source: Prowess, CRISIL Research Table 3: Utilisation rates of sponge iron players
(%) FY08 FY09 FY10 FY11 Jindal Steel & Power 87 94 96 96 Monnet Ispat 61 75 89 87 Tata Sponge Iron Ltd 85 88 92 98 Jai Balaji Sponge 70 77 83 63 Bhushan Steel 89 52 59 45 MSP Steel 71 65 81 72 Godawari Power 52 43 14 21
Source: Prowess, CRISIL Research
... Expanding capacity to fuel next level of growth Monnet is in the process of transitioning from a sponge iron player to a mid-sized integrated
steel company with total steel capacity of 1.8 mn MTPA. It is in the process of installing 0.81
mn MTPA of metallics (sponge iron – 0.2 mn MTPA and pig iron – 0.61 mn MTPA), 1.5 mn
MTPA of steel and 80 MW of power during FY11-14 at its Raigarh facility. The expansion will
enable the company to produce both long (bars) and flat (plates) products. The project also
includes backward integration into pellet and sinter plants (one each) to reduce the cost of iron
ore. We expect Monnet’s standalone revenues to grow at 35% CAGR to Rs 39 bn by FY14
from Rs 15.7 bn in FY11. Table 4: Capacity time line
Capacity Capacity CRISIL’s estimate on COD Power plant 80 MW Q1FY13 Blast furnace 0.61 mn MTPA Q2FY13 SMS1 0.75 mn MTPA Q2FY13 SMS2 0.75 mn MTPA Q4FY13 Bar mill 0.65 mn MTPA Q2FY13 Plate mill 0.85 mn MTPA Q4FY13 Sponge iron 0.22 mn MTPA Q2FY14
Source: CRISIL Research
Transitioning from a sponge
iron player to an integrated
1.8 mn MTPA steel player
Second largest sponge iron
player with nearly the highest
utilisation rate in the industry

CRISIL IERIndependentEquityResearch
4
Monnet is expected to incur capital expenditure of ~Rs 36 bn over FY11-14 to complete the
expansion. It will be funded though a mix of debt and internal accrual; the company has
already tied up for its debt requirements. We expect the major part of the expansion to come
on stream in FY13. The company has spent close to ~Rs 26 bn as of H1FY12. Strategic expansion to provide value addition and hedge
The company is expanding its capacity to add value-added products to its portfolio. It is also
adding a second route of steel manufacturing – blast furnace, which will provide it with a
hedge against raw material price fluctuations. The completion of the total capacity addition will
enable the company to enjoy higher per tonne realisation of ~Rs 34,000 in FY14 and will
provide cushion against raw material price volatility. Figure 1: Expanding across the value chain
FY11 FY13 FY14
Source: Company, CRISIL Research
Forward integration to add more value-added products: Monnet is moving up the value
chain with the installation of 1.5 mn MTPA of value-added steel capacity (steel plate - 0.75 mn
MTPA and steel bars – 0.85 mn MTPA). The increasing contribution of higher value-added
products will increase the blended realisation at 25% CAGR over FY11 to FY14. Figure 2: Value-added products to contribute more Figure 3: Blended steel/tonne realisation to rise
Source: CRISIL Research, World Steel Association Source: CRISIL Research
0.86mnmtpa
0.30mnmtpa 0.20mn
mtpa
150MW
Mettalics SMS Steel Power
Sponge Iron Pig Iron
0.86mnmtpa
0.61mnmtpa
1.80mnmtpa 0.85mn
mtpa 230MW
Mettalics SMS Steel Power
Sponge Iron Pig Iron
1.02mnmtpa
0.61mnmtpa
1.80mnmtpa
0.85mnmtpa
0.85mnmtpa
230MW
Mettalics SMS Steel Power
Sponge Iron Pig Iron
15.7%7.6% 12.8% 13.0% 7.0%
30.4%31.3%
19.9%41.1%
0%
10%
20%
30%
40%
50%
60%
70%
80%
90%
FY10 FY11 FY12E FY13E FY14E
Structural Steel Steel Bar Steel plate
14,05517,237
23,911
33,231 34,036
0
5,000
10,000
15,000
20,000
25,000
30,000
35,000
40,000
FY10 FY11 FY12E FY13E FY14E
(Rs per tonnne)

MAKING MARK
ETS
FU
NC
TIO
NB
ET
TE
R
YEARS
5
Monnet Ispat & Energy Ltd
Blast furnace to provide a hedge: The company is planning to use the blast furnace to
produce steel in addition to the currently operational sponge iron route. The primary difference
in the two methods is the types of raw materials used - scrap and power are used in the
sponge iron route and coke in the blast furnace route. The availability of both capacities will
provide a hedge against direct and indirect impact of higher cost of manufacturing from any
single route. For instance, a player with only sponge iron capacity is exposed to the dip in
steel prices on account of a drop in coke prices – a key raw material for the blast furnace.
Reduction in coke prices will reduce the cost of producing steel from the blast furnace route
and a lower cost will pull the price down. In this case, sponge iron players are left with the only
option of selling steel at reduced prices, thus putting pressure on their profitability as their cost
of steel manufacturing is unchanged. Also the company will enter into flat products using steel
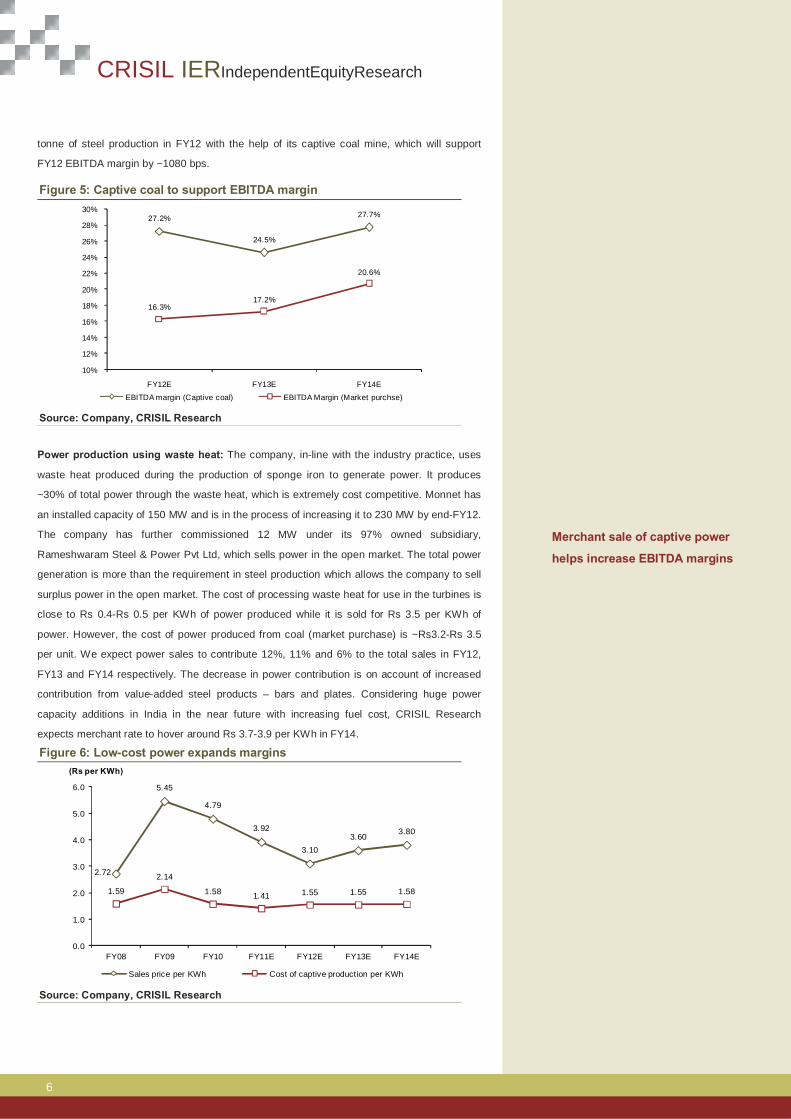
manufactured through the blast furnace route. The captive mine meets ~72-75% of coal
requirement for the sponge iron plant.
Linkage, backward integration support profitability Monnet enjoyed higher EBITDA margins of 29% in FY11 and 30% in FY10 compared to 15%-
20% of other smaller players such as MSP Steel, Jai Balaji and Godavari Power. During the
turbulent times faced by the industry in the past quarters, margins of non-integrated players
have fallen significantly on account of high raw material prices. On the contrary, Monnet’s
margins have been relatively steady thanks to its coal linkage, though it remains exposed to
iron ore price fluctuations. Coal cost is ~45-50% of the total cost of production of sponge iron. Figure 4: Highly volatile margins of non-linked players
Source: CRISIL Research
Coal mine: Monnet operates the Milupara mine - the largest underground coal block in India.
It has steel grade coal reserves of ~86 MT and annual production capacity of 1 MT. Its
requirement for the sponge iron plant is largely met by coal produced from the mine. During
FY11, close to 72-75% of coal demand for the sponge iron plant was met with coal from the
Milupara mine. The coal from this mine costs ~Rs 1,400-1,500 per tonne compared to the
market price of ~Rs 3,700 per tonne (Grade B) in FY11. This makes Monnet cost competitive
compared to other players in the industry. The company is expected to save ~Rs 2,800 per
-5%
0%
5%
10%
15%
20%
25%
30%
35%
40%
Q3FY11 Q4FY11 Q1FY12 Q2FY12 Q3FY12
MSP Jai Balaji Bhushan Steel
Godawari Power Tata Sponge Monnet
Availability of both capacities
will provide a hedge against
higher cost of manufacturing
from any single route
Captive coal mine to reduce per
tonne cost of steel production
by ~Rs 2,800 in FY12
CRISIL IERIndependentEquityResearch
6
tonne of steel production in FY12 with the help of its captive coal mine, which will support
FY12 EBITDA margin by ~1080 bps.
Figure 5: Captive coal to support EBITDA margin
Source: Company, CRISIL Research
Power production using waste heat: The company, in-line with the industry practice, uses
waste heat produced during the production of sponge iron to generate power. It produces
~30% of total power through the waste heat, which is extremely cost competitive. Monnet has
an installed capacity of 150 MW and is in the process of increasing it to 230 MW by end-FY12.
The company has further commissioned 12 MW under its 97% owned subsidiary,
Rameshwaram Steel & Power Pvt Ltd, which sells power in the open market. The total power
generation is more than the requirement in steel production which allows the company to sell
surplus power in the open market. The cost of processing waste heat for use in the turbines is
close to Rs 0.4-Rs 0.5 per KWh of power produced while it is sold for Rs 3.5 per KWh of
power. However, the cost of power produced from coal (market purchase) is ~Rs3.2-Rs 3.5
per unit. We expect power sales to contribute 12%, 11% and 6% to the total sales in FY12,
FY13 and FY14 respectively. The decrease in power contribution is on account of increased
contribution from value-added steel products – bars and plates. Considering huge power
capacity additions in India in the near future with increasing fuel cost, CRISIL Research
expects merchant rate to hover around Rs 3.7-3.9 per KWh in FY14.
Figure 6: Low-cost power expands margins
Source: Company, CRISIL Research
27.2%
24.5%
27.7%
16.3%17.2%
20.6%
10%
12%
14%
16%
18%
20%
22%
24%
26%
28%
30%
FY12E FY13E FY14E
EBITDA margin (Captive coal) EBITDA Margin (Market purchse)
2.72
5.45
4.79
3.92
3.103.60
3.80
1.59
2.14
1.58 1.41 1.55 1.55 1.58
0.0
1.0
2.0
3.0
4.0
5.0
6.0
FY08 FY09 FY10 FY11E FY12E FY13E FY14E
(Rs per KWh)
Sales price per KWh Cost of captive production per KWh
Merchant sale of captive power
helps increase EBITDA margins

MAKING MARK
ETS
FU
NC
TIO
NB
ET
TE
R
YEARS
7
Monnet Ispat & Energy Ltd
But expansion exposes to raw material price risk Monnet’s capacity expansion will increase its requirement of coal, iron ore and coking coal. So
far, its captive coal mine caters to ~50% of total coal requirement (steel + power) but this is
likely to decrease to ~45% with the commissioning of the 80 MW power plant. Further, after
the addition of the blast furnace, the company will require coke along with the iron ore, which
will increase Monnet’s exposure to market purchase of raw materials. Given a high
percentage of raw material cost to overall costs and volatility in the prices of these raw
materials, the profitability of the steel producer remains highly susceptible to price change. We
expect Monnet’s margins to contract in FY13 on account of increased exposure to market
purchases of raw material. Figure 7: Raw material exposure (FY13E) Figure 8: EBITDA margin’s susceptibility
Source: Company, CRISIL Research Source: Company, CRISIL Research
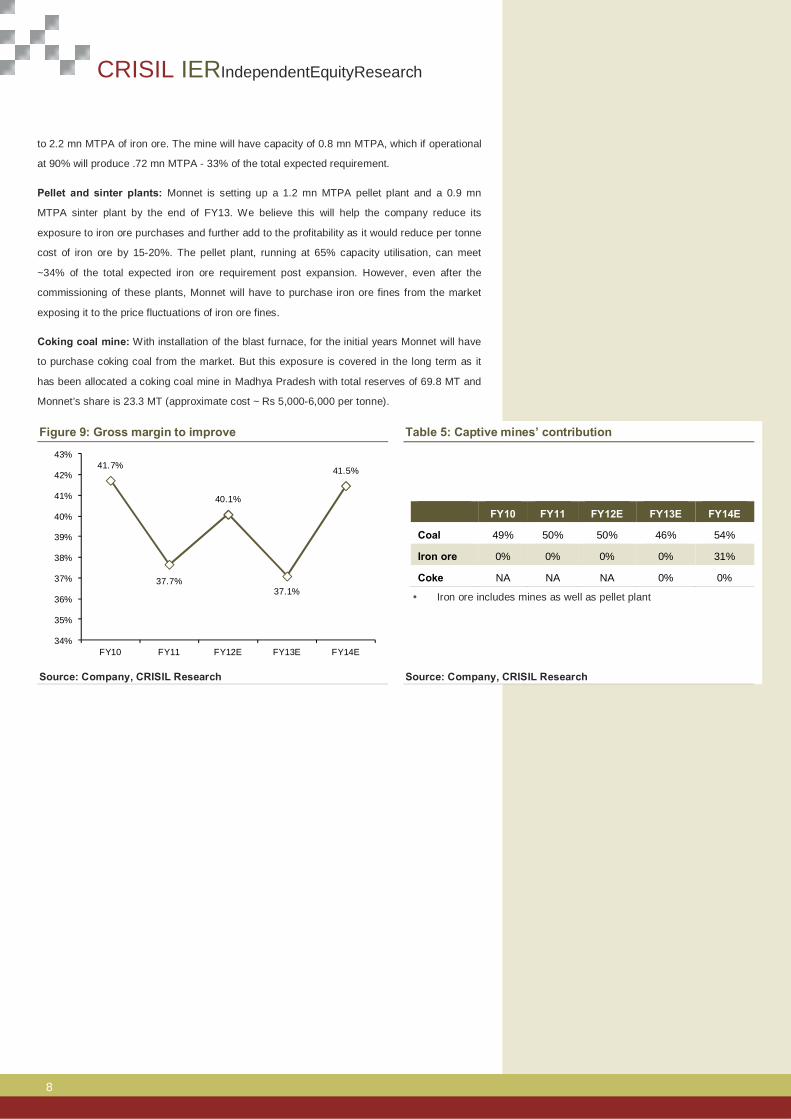
Benefit to return with iron ore and coking coal mines
Monnet has been allocated mining assets, which will help it reduce exposure to fluctuation in
market prices of iron ore and coking coal. It is also setting up a 1.2 mn MTPA pellet capacity.
The company will use low-cost iron ore fines to produce pellets at a cost of Rs 3000-3500 per
tonne. We expect EBITDA margin to improve by 300 bps in FY14 to 28.2% on account of part
commissioning of the iron ore mine and the pellet capacity. Post FY14, when the mines (iron
ore and coking coal) and pellet capacity become fully operational, Monnet’s profitability will
improve significantly.
Coal mine: Monnet plans to increase the extraction of coal to 1.5 mn MTPA at the Milupara
mine, which will further support the sponge iron manufacturing unit. The company has also
been allocated one more coal mine (steel grade) in Rajgamar, Chhattisgarh but the benefit of
the mine is expected to flow post FY14.
Iron ore mine: Monnet bought 97% stake in Rameshwaram Steel & Power, which owns an
iron ore mine in Rajnath Gaon, Chhattisgarh. The mine is an underground one with 30 MT
reserves (62-65% iron content). Post expansion (installation of the 0.61 mn MTPA blast
furnace and expansion of sponge iron plant to 1.02 mn MTPA), the company will require close
46%
54%
100% 100%
0%
10%
20%
30%
40%
50%
60%
70%
80%
90%
100%
Coal Iron Ore Coke
Captive Market purchase
23.2%
21.9%
23.7%27.2%
22.3%
22.3%23.2%
19.1%
17.8%
27.2%
24.5%
27.7%
15%
17%
19%
21%
23%
25%
27%
29%
FY12E FY13E FY14E10% increase in Iron ore 10% increase in coke10% incrase in both Expected EBITDA margin
CRISIL IERIndependentEquityResearch
8
to 2.2 mn MTPA of iron ore. The mine will have capacity of 0.8 mn MTPA, which if operational
at 90% will produce .72 mn MTPA - 33% of the total expected requirement.
Pellet and sinter plants: Monnet is setting up a 1.2 mn MTPA pellet plant and a 0.9 mn
MTPA sinter plant by the end of FY13. We believe this will help the company reduce its
exposure to iron ore purchases and further add to the profitability as it would reduce per tonne
cost of iron ore by 15-20%. The pellet plant, running at 65% capacity utilisation, can meet
~34% of the total expected iron ore requirement post expansion. However, even after the
commissioning of these plants, Monnet will have to purchase iron ore fines from the market
exposing it to the price fluctuations of iron ore fines.
Coking coal mine: With installation of the blast furnace, for the initial years Monnet will have
to purchase coking coal from the market. But this exposure is covered in the long term as it
has been allocated a coking coal mine in Madhya Pradesh with total reserves of 69.8 MT and
Monnet’s share is 23.3 MT (approximate cost ~ Rs 5,000-6,000 per tonne). Figure 9: Gross margin to improve Table 5: Captive mines’ contribution
FY10 FY11 FY12E FY13E FY14E
Coal 49% 50% 50% 46% 54%
Iron ore 0% 0% 0% 0% 31%
Coke NA NA NA 0% 0%
• Iron ore includes mines as well as pellet plant
Source: Company, CRISIL Research Source: Company, CRISIL Research
41.7%
37.7%
40.1%
37.1%
41.5%
34%
35%
36%
37%
38%
39%
40%
41%
42%
43%
FY10 FY11 FY12E FY13E FY14E
MAKING MARK
ETS
FU
NC
TIO
NB
ET
TE
R
YEARS
9
Monnet Ispat & Energy Ltd
Table 6: Status of allocated mines
Mine Mine type Quality of mineral
Reserves (mn MT) Extraction
Expected time-line of extraction Status of development
Milupara, Raigarh
Underground coal mine
B to D grade coal
86 Present - 1mn MTPA Expected - 1.5mn MTPA
Operational; expansion expected by end-FY13
The company has initiated the process for approval to increase the capacity to 1.5 mn MTPA
Rajnath, Chhattisgarh
Underground iron ore mine
62-65% Fe 30 Expected - 0.8 mn MTPA
FY14 Yet to commence land acquisition, forest clearance and mining lease
Rajgamar Underground coal mine
B to E grade coal
Total reserves - 61.7, Monnet share - 49.9
FY15 Yet to commence land acquisition, forest clearance and mining lease
Urtan -North, Madhya Pradesh
Underground coking coal mine
NA Total reserves - 69.8, Monnet share - 23.3
FY15 Yet to commence land acquisition, forest clearance and mining lease
Source: Company, CRISIL Research
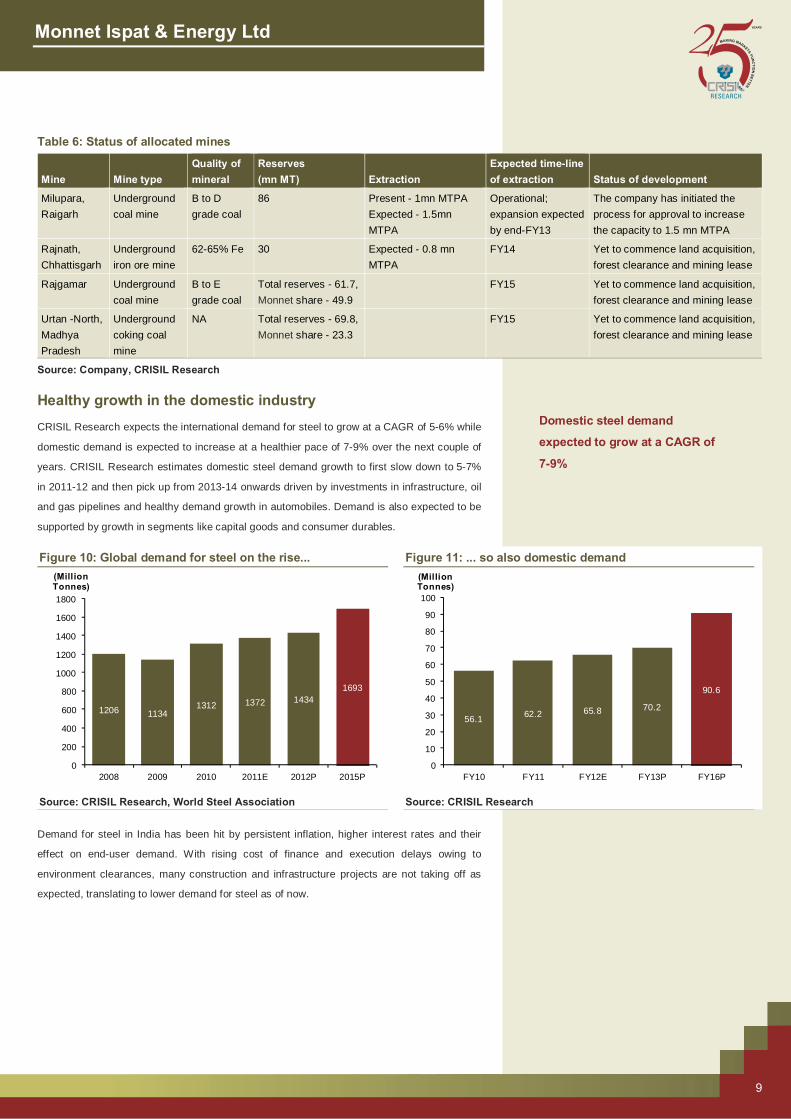
Healthy growth in the domestic industry CRISIL Research expects the international demand for steel to grow at a CAGR of 5-6% while
domestic demand is expected to increase at a healthier pace of 7-9% over the next couple of
years. CRISIL Research estimates domestic steel demand growth to first slow down to 5-7%
in 2011-12 and then pick up from 2013-14 onwards driven by investments in infrastructure, oil
and gas pipelines and healthy demand growth in automobiles. Demand is also expected to be
supported by growth in segments like capital goods and consumer durables.
Figure 10: Global demand for steel on the rise... Figure 11: ... so also domestic demand
Source: CRISIL Research, World Steel Association Source: CRISIL Research
Demand for steel in India has been hit by persistent inflation, higher interest rates and their
effect on end-user demand. With rising cost of finance and execution delays owing to
environment clearances, many construction and infrastructure projects are not taking off as
expected, translating to lower demand for steel as of now.
1206 11341312 1372 1434
1693
0
200
400
600
800
1000
1200
1400
1600
1800
2008 2009 2010 2011E 2012P 2015P
(Million Tonnes)
56.1 62.2 65.8 70.2
90.6
0
10
20
30
40
50
60
70
80
90
100
FY10 FY11 FY12E FY13P FY16P
(Million Tonnes)
Domestic steel demand
expected to grow at a CAGR of
7-9%
CRISIL IERIndependentEquityResearch
10
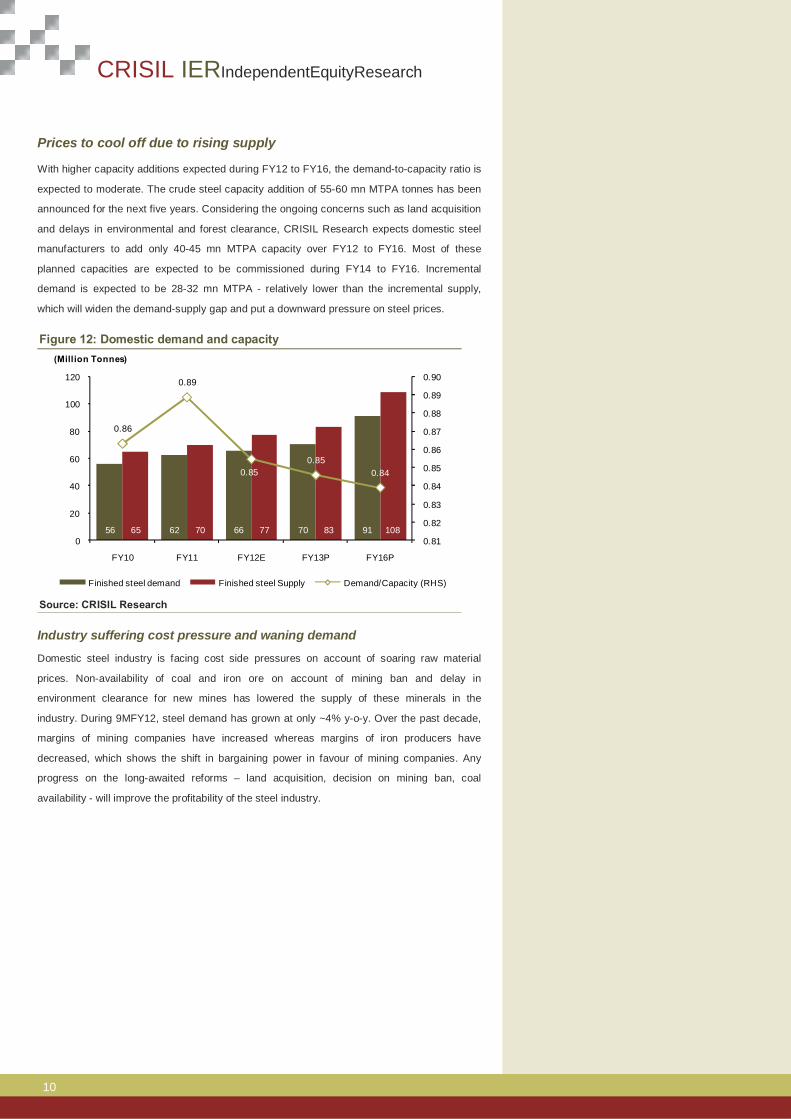
Prices to cool off due to rising supply
With higher capacity additions expected during FY12 to FY16, the demand-to-capacity ratio is
expected to moderate. The crude steel capacity addition of 55-60 mn MTPA tonnes has been
announced for the next five years. Considering the ongoing concerns such as land acquisition
and delays in environmental and forest clearance, CRISIL Research expects domestic steel
manufacturers to add only 40-45 mn MTPA capacity over FY12 to FY16. Most of these
planned capacities are expected to be commissioned during FY14 to FY16. Incremental
demand is expected to be 28-32 mn MTPA - relatively lower than the incremental supply,
which will widen the demand-supply gap and put a downward pressure on steel prices. Figure 12: Domestic demand and capacity
Source: CRISIL Research Industry suffering cost pressure and waning demand
Domestic steel industry is facing cost side pressures on account of soaring raw material
prices. Non-availability of coal and iron ore on account of mining ban and delay in
environment clearance for new mines has lowered the supply of these minerals in the
industry. During 9MFY12, steel demand has grown at only ~4% y-o-y. Over the past decade,
margins of mining companies have increased whereas margins of iron producers have
decreased, which shows the shift in bargaining power in favour of mining companies. Any
progress on the long-awaited reforms – land acquisition, decision on mining ban, coal
availability - will improve the profitability of the steel industry.
56 62 66 70 9165 70 77 83 108
0.86
0.89
0.850.85
0.84
0.81
0.82
0.83
0.84
0.85
0.86
0.87
0.88
0.89
0.90
0
20
40
60
80
100
120
FY10 FY11 FY12E FY13P FY16P
(Million Tonnes)
Finished steel demand Finished steel Supply Demand/Capacity (RHS)

MAKING MARK
ETS
FU
NC
TIO
NB
ET
TE
R
YEARS
11
Monnet Ispat & Energy Ltd
Monnet’s strategic investments - Orissa Sponge and Indonesia mine Orissa Sponge
Monnet acquired 11.07% stake in Orissa Sponge through its associate Mount Everest Trading
and Investment in FY09. To gain access to Mount Everest’s investment in Orissa Sponge,
Monnet merged Mount Everest with itself in FY10 by issuing two shares of Monnet for every
five shares held in Mount Everest. Later, Monnet bought ~15% shares from the promoters of
Orissa Sponge, increasing its total stake to 26% in the company. The shares are lying in the
escrow account as the company is required to make an open offer before claiming ownership.
Monnet is reported to be competing with Bhushan Steel to acquire the controlling stake in
Orissa Sponge.
Orissa Sponge is a small integrated steel company with an installed capacity of - sponge iron -
0.25 mn MTPA, power - 24MW and steel billet – 0.10 mn MTPA. It also has two mining assets
– iron ore (~120 mn MT reserves with Fe grade of 62-65%) and coal (~120 mn MT reserves).
Both are located close to the steel plant, which lowers the transportation cost. Coal mine in Indonesia
Monnet has acquired a coal mine - having 65 mn tonnes of reserves – in Indonesia at a cost
of US$24 mn. The mine has a stripping ratio of 1:3.5 and has low-sulphur coal. The company
has already demarcated the extraction area. The company is evaluating various options of
coal usage – import to India and a sale in the open market and setting up a coal based
thermal power plant on the Indian coast. We have not incorporated this in our forecast
because of lack of clarity on the timelines of mining and use of coal.
1,050 MW power plant – a value changer Monnet is entering the power generation space as an independent power producer (IPP) by
setting up a 1,050 MW power plant in Angul, Orissa under its 87.5%-owned subsidiary –
Monnet Power. This will help it de-risk the cyclicality of the metal business. The plant will have
two units of 525 MW each at a total cost of ~Rs 50 bn. The company will use coal from two
coal mines allocated to it in Orissa, which are in proximity to the plant. Capital tied up – roped in Blackstone as investor
Monnet has achieved financial closure of the 1,050 MW power plant and plans to fund the
estimated cost of Rs 50 bn with a debt-equity ratio of 3:1. The equity portion (~Rs 12.3 bn) will
be funded by Monnet (Rs 6.05 bn), Blackstone (Rs 2.75 bn) and preferred equity (Rs 3.5 bn).
Out of the committed capital of Rs 6.05 bn, Monnet has infused ~Rs 3.1 bn in the company as
of March 2011. It sold a 12.5% stake to Blackstone in July 2010 for Rs 2.75 bn, valuing the
subsidiary at Rs 22 bn. The company has also tied up for preferred equity with IFCI, IL&FS
and IDFC at a cost of 13.5% per annum.
Blackstone has bought 12.5%
stake for Rs 2.75 bn, valuing
the company at Rs 22 bn
100% raw material linkages
make Orissa Sponge a low cost
steel producer

CRISIL IERIndependentEquityResearch
12
Project execution on track
The project has received all statutory approvals and clearances. It is being executed in two
units of 525 MW each. The management expects the first phase to go on line by July 2013
and the second phase by the end of September 2013. The company has given the order for
BTG equipment to BHEL and the balance of plant (BOP) order has been given to Indure Pvt
Ltd. During our site visit on February 17, 2012, we found that boiler foundation for the first
phase has been completed and boiler drum has arrived at the site. The boiler lifting for the first
unit is expected to be completed by February-end. The company is also planning to start work
in two shifts to hasten the pace of construction. We expect delay in the commissioning by two-
three months considering it is the first independent power producer project by the group and
its size. Table 7: Activity-wise status of the power plant
Activity Status
Land acquisition 81% land acquired out of total land required for main plant area.
BTG (phase I) Boiler foundation has been completed. Boiler lifting to be completed by February-end. Turbine foundation concreting is in progress. Eight out of 14 columns casting is complete.
BTG (phase II) Boiler foundation is complete. Boiler drum manufacturing is in progress. Turbine foundation concreting is in progress.
BOP Chimney raft casting is complete. Civil work for all four cooling towers is in progress, it is in the advance stage for two cooling towers required in phase I
Source: Company, CRISIL Research Captive linkage makes it extremely cost competitive
The power project is expected to be a very profitable venture as the complete fuel requirement
is expected to be met from its nearby-located captive coal mines. Once the plant is fully
operational, it will require close to 5.3 mn MTPA of thermal grade coal. Monnet has been
allocated two coal blocks in Orissa - Utkal B2, Angul and Mandakini, Talcher with combined
reserves of ~182 mn MT. The mines will have a combined annual production of more than
~8.5 mn MT (Angul – 3.5 mn MT and Mandakini – 5 mn MT). Overall, we expect the cost of
generation to be Rs 1.3-1.5 per KWh, making it extremely cost competitive.
Utkal B2 coal mine: The Utkal B2 mine is in the advanced stage of completion and the
company has acquired ~90% of the land. The company has received all the necessary
approvals. It is seeking approval from the state government for the lease of mining surface
post which extraction can be started. The company has built a resettlement and rehabilitation
(R&R) colony to shift the land occupants. The very low stripping ratio of 1:0.85 and proximity
(~5 km, the coal will be transported through a conveyor belt) to the power plant ensure very
low raw material cost. As per the management, the cost of coal from Utkal B2 will be ~Rs 300-
350 per tonne compared to the market rate of Rs 1,500 per tonne. The company plans to
outsource the mining operation. The management expects the mine to be operational in
Q1FY13. The usage of mine has been changed to “steel and power” from earlier “steel”,
however there is still an ambiguity over the usage mix between steel and power. The
company has been following up with the ministry for the same.
1,050 MW power plant with
100% coal linkage
MAKING MARK
ETS
FU
NC
TIO
NB
ET
TE
R
YEARS
13
Monnet Ispat & Energy Ltd
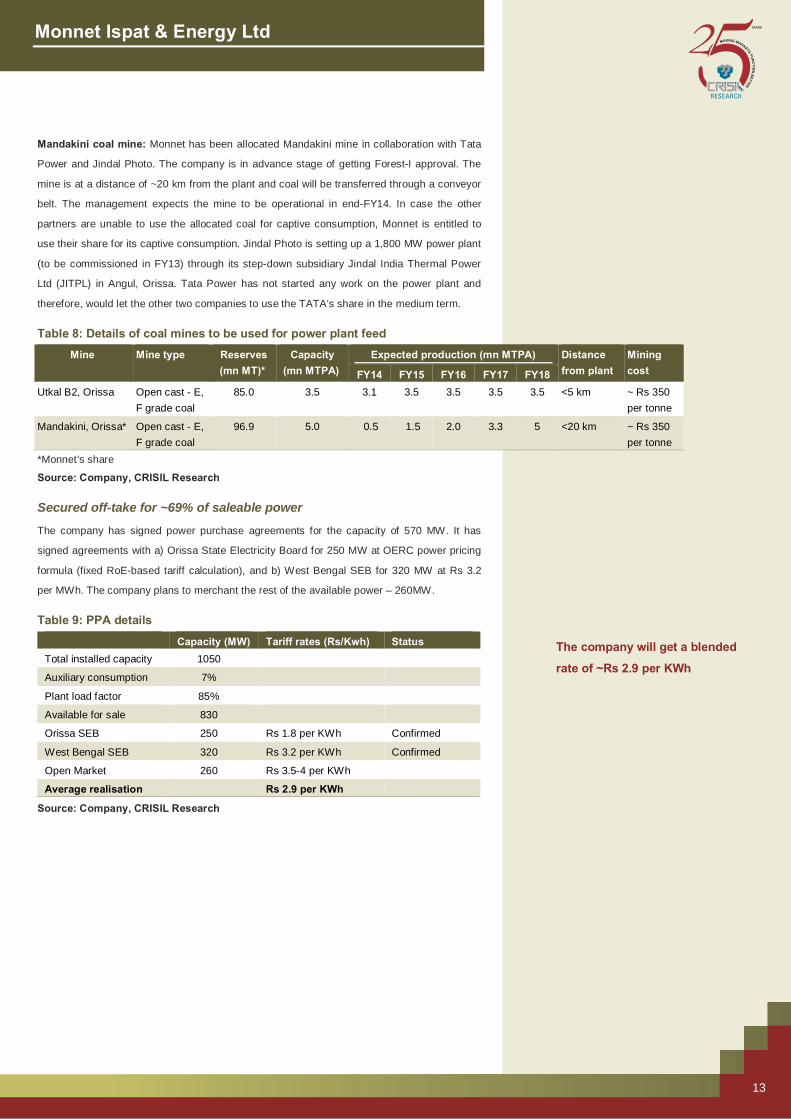
Mandakini coal mine: Monnet has been allocated Mandakini mine in collaboration with Tata
Power and Jindal Photo. The company is in advance stage of getting Forest-I approval. The
mine is at a distance of ~20 km from the plant and coal will be transferred through a conveyor
belt. The management expects the mine to be operational in end-FY14. In case the other
partners are unable to use the allocated coal for captive consumption, Monnet is entitled to
use their share for its captive consumption. Jindal Photo is setting up a 1,800 MW power plant
(to be commissioned in FY13) through its step-down subsidiary Jindal India Thermal Power
Ltd (JITPL) in Angul, Orissa. Tata Power has not started any work on the power plant and
therefore, would let the other two companies to use the TATA’s share in the medium term. Table 8: Details of coal mines to be used for power plant feed
Mine Mine type Reserves (mn MT)*
Capacity (mn MTPA)
Expected production (mn MTPA) Distance from plant
Mining cost FY14 FY15 FY16 FY17 FY18
Utkal B2, Orissa Open cast - E, F grade coal
85.0 3.5 3.1 3.5 3.5 3.5 3.5 <5 km ~ Rs 350 per tonne
Mandakini, Orissa* Open cast - E, F grade coal
96.9 5.0 0.5 1.5 2.0 3.3 5 <20 km ~ Rs 350 per tonne
*Monnet’s share
Source: Company, CRISIL Research Secured off-take for ~69% of saleable power
The company has signed power purchase agreements for the capacity of 570 MW. It has
signed agreements with a) Orissa State Electricity Board for 250 MW at OERC power pricing
formula (fixed RoE-based tariff calculation), and b) West Bengal SEB for 320 MW at Rs 3.2
per MWh. The company plans to merchant the rest of the available power – 260MW. Table 9: PPA details
Capacity (MW) Tariff rates (Rs/Kwh) Status Total installed capacity 1050
Auxiliary consumption 7%
Plant load factor 85%
Available for sale 830
Orissa SEB 250 Rs 1.8 per KWh Confirmed
West Bengal SEB 320 Rs 3.2 per KWh Confirmed
Open Market 260 Rs 3.5-4 per KWh
Average realisation Rs 2.9 per KWh
Source: Company, CRISIL Research
The company will get a blended
rate of ~Rs 2.9 per KWh

CRISIL IERIndependentEquityResearch
14
Mining delay – a threat The company has been allocated two coal blocks for the power plant. For Utkal B2, the
company only requires the surface lease from the state government to start the coal extraction
but resettlement of villagers living on the mining area is a key monitorable. Monnet has
already received consent letters from the villages and started the construction of R&R
colonies. It has also agreed to offer jobs to one male member (with age over 18 years) per
family. For Mandakini, the company is seeking environmental approvals. Any delay on
account of regulatory approval or people resettlement will jeopardise the power project
timeline and also profitability of the company.
Peer comparison EBITDA margin
In % FY07 FY08 FY09 FY10 FY11
Monnet 27.69 21.90 24.56 30.26 28.79
JSPL 35.08 34.37 30.76 33.19 36.4
MSP Steel 21.39 19.05 15.91 17.70 21.02
Bhushan Steel 20.97 24.98 29.74 37.6 39.24
Godawari Power 16.93 16.85 10.64 15.02 18.52
TATA Sponge 10.19 9.91 4.89 6.15 6.89
Jai Balaji 13.36 18.86 9.63 12.22 14.5 PAT margin
In % FY07 FY08 FY09 FY10 FY11 Monnet 21.17 14.33 13.13 18.15 17.90 JSPL 17.66 19.77 17.71 18.16 19.14 MSP Steel 9.03 12.86 9.40 8.10 9.89 Bhushan Steel 7.3 8.92 7.76 13.8 13.14 Godawari Power 10.19 9.91 4.89 6.15 6.89 TATA Sponge 6.34 17.61 17.32 14.58 13.43 Jai Balaji 5.41 7.61 0.07 1.54 3.15

MAKING MARK
ETS
FU
NC
TIO
NB
ET
TE
R
YEARS
15
Monnet Ispat & Energy Ltd
D/E
FY07 FY08 FY09 FY10 FY11 Monnet 1.76 1.01 1.10 0.90 1.28 JSPL 1.41 1.03 0.92 1.24 1.39 MSP Steel 1.40 1.57 1.61 2.06 2.20 Bhushan Steel 2.67 3.52 3.31 2.86 2.81 Godawari Power 1.35 0.75 0.77 0.82 1.15 TATA Sponge 0.93 0.35 0 0 0 Jai Balaji 2.74 4.23 5.23 1.76 1.9
Interest Coverage
FY07 FY08 FY09 FY10 FY11 Monnet 5.35 4.92 5.87 5.00 8.45 JSPL 6.93 7.73 9.53 7.69 6.67 MSP Steel 3.11 4.37 2.62 2.80 3.53 Bhushan Steel 2.35 2.31 1.69 2.23 2.02 Godawari Power 4.5 4.65 2.95 2.96 2.66 TATA Sponge 5.13 11.97 na na na Jai Balaji 3.88 2.00 1.04 1.33 1.78
RoE
In % FY07 FY08 FY09 FY10 FY11 Monnet 27.48 20.12 18.82 18.96 15.05 JSPL 32.39 39.56 33.5 24.33 26.75 MSP Steel 27.85 32.35 17.99 15.97 21.24 Bhushan Steel 29.78 29.84 20.75 26.32 20.33 Godawari Power 34.51 32.24 14.04 11.26 13.72 TATA Sponge 13.9 47.55 40.69 21.96 21.86 Jai Balaji 40.03 39.73 0.36 5.06 7.88

CRISIL IERIndependentEquityResearch
16
Key risks
Exposed to fluctuation in iron ore and coke prices Monnet procures iron ore from the open market, which exposes it to fluctuation in iron ore
prices. Post installation of the blast furnace (0.61 mn MTPA) and expansion of the sponge iron
plant (to 1.02 mn MTPA), Monnet will require close to 2.2 mn MTPA of iron ore and 0.32 mn
MTPA of coke in FY14. The market purchase of these ores will constitute 60% of the total raw
material cost in FY14. Increase in prices of these raw materials will severely affect the
profitability of the company. A 10% increase in the prices of iron ore and coke will lead to ~280
bps contraction in the PAT margin. Further, the management has indicated that the company
will focus on acquiring the raw material first before planning future capex.
Margins dependent on merchant power rate
The company has installed 150 MW power stations in its steel mills against a requirement of
less than 40 MW. It sells the remaining power in the open market, which exposes it to the risk
of decline in merchant rates in the future. CRISIL Research estimates high growth in supply
will reduce the power deficit to 3.9% by 2015-16 from 8.5% in 2010-11, which pegs merchant
rates in the Rs 3.8-4.4 per KWh range during FY12-16. The merchant rate in FY11 declined to
~Rs 3.6 from Rs ~5.2 in FY10.
Regulatory risk The company has been allocated coal, iron ore and coke blocks but it is yet to receive the
necessary approvals for most of them. Any delay in the clearance process of mining leases
will negatively impact the company’s future margins.
Also, the draft mining bill mandates sharing of 26% of the profit from mining for development
of the locals. In case the bill gets approved, it will adversely impact profitability of all the mining
players including Monnet.
Recently, the prime minister’s office (PMO) directed Coal India to sign fuel supply agreements
with power plants that have been commissioned up to December 31, 2011. As per the
decision, Coal India will be penalised if the supply of coal is below 80%. This may reduce the
steel industry’s share in Coal India’s total coal output, which will hamper the profitability of the
industry.

MAKING MARK
ETS
FU
NC
TIO
NB
ET
TE
R
YEARS
17
Monnet Ispat & Energy Ltd
Financial Outlook
Revenues to grow at three-year CAGR of 35% Standalone revenues are expected to increase at a three-year CAGR of 35% to Rs 39 bn by
FY14. The growth will be fuelled by capacity expansion and higher per unit realisation on
account of increasing share of high value-added products. The company will start
manufacturing steel through the pig iron route and commence the production of value-added
products such as bars and plates. Figure 13: Expansion to drive revenue growth Figure 14: Increase in revenue per tonne
Source: Company, CRISIL Research Source: Company, CRISIL Research
EBITDA margin to fall in short term, improve later We expect Monnet’s EBITDA margin to decline to 27% in FY12 on account of increase in raw
material cost. In FY13, it is expected to contract further by 210 bps to 25% on account of
lower margins in the steel manufactured through the pig iron route as the company is exposed
to the market for the purchase of iron ore and coking coal. The blast furnace is expected to
get operational in FY13 but the iron ore mine and the pellet capacity are expected to get
operational in FY14. However, post the commissioning of the iron ore mine and the pellet
plant, we expect margin to improve by 311 bps to 28%. Post FY14, when the mine and the
pellet capacity run on full capacity utilisation and coking coal mine also gets operational, we
believe Monnet’s profitability will improve significantly.
15,545
14,825
15,705 18,473 29,794 39,057
34%
-5%
6%
18%
61%
31%
-10%
0%
10%
20%
30%
40%
50%
60%
70%
0
5,000
10,000
15,000
20,000
25,000
30,000
35,000
40,000
45,000
FY09 FY10 FY11 FY12E FY13E FY14E
(Rs mn)
Revenue % change (RHS)
682,
847
678,
023
715,
222
837,
966
1,13
0,20
8
24,316
16,97720,004
23,911
33,231
0
5,000
10,000
15,000
20,000
25,000
30,000
35,000
0
200,000
400,000
600,000
800,000
1,000,000
1,200,000
FY10 FY11 FY12E FY13E FY14E
(Rs per tonne)
(Tonnes)
Total tonnes sold Revenue per tonne (RHS)
Revenues likely to grow at a three-
year CAGR of 35% driven by
capacity expansion and higher
realisations

CRISIL IERIndependentEquityResearch
18
Figure 15: Margin expected to decline and then improve
Source: Company, CRISIL Research
PAT to grow at 14% CAGR; RoE to remain subdued Monnet’s PAT is expected to grow at a three-year CAGR of 14% to Rs 4.2 bn in FY14. PAT
growth is lower than EBITDA growth on account of increase in depreciation and interest
expense due to capitalisation of WIP. The company is expected to post EPS of Rs 45.9, Rs
46.9 and Rs 65.3 in FY12, FY13 and FY14 respectively. The company’s RoE is expected to
remain at 15.0% in FY14 on account of lower asset turnover (underutilised capacity) and
lower PAT margin (exposure to open market purchase of raw materials). However, we expect
it will improve substantially once the capacity utilisation rate picks up and mines are
operational.
Figure 16: PAT growth - expansion and mines Figure 17: Improvement in RoE post FY13
Source: Company, CRISIL Research Source: Company, CRISIL Research
Debt equity ratio to increase to 1.4 in FY14 Post expansion, Monnet’s D/E ratio is expected to increase from 1.3 in FY11 to 1.4 in FY14.
During FY13, when most of the capacity is expected to come on-stream, the interest cost will
start flowing through the income statement. The interest coverage ratio is also expected to
deteriorate to 2.2 in FY14. As per our discussion, we have learnt that management is keen to
deleverage the balance sheet of the company.
3,818 4,487 4,522 5,019 7,311 10,800
25%
30%29%
27%25%
28%
0%
5%
10%
15%
20%
25%
30%
35%
0
2,000
4,000
6,000
8,000
10,000
12,000
FY09 FY10 FY11 FY12E FY13E FY14E
(Rs mn)
EBITDA EBITDA Margin (RHS)
2,157 2,709 2,819 2,957 3,019 4,205
13.9
18.3 17.916.0
10.110.8
02468101214161820
0
500
1,000
1,500
2,000
2,500
3,000
3,500
4,000
4,500
FY09 FY10 FY11 FY12E FY13E FY14E
(Rs mn)
Adjusted PAT Adj PAT margin (RHS)
18.8% 19.0%
15.1%
13.3%12.2%
15.0%
6%
8%
10%
12%
14%
16%
18%
20%
FY09 FY10 FY11 FY12E FY13E FY14E

MAKING MARK
ETS
FU
NC
TIO
NB
ET
TE
R
YEARS
19
Monnet Ispat & Energy Ltd
Management Overview
CRISIL's fundamental grading methodology includes a broad assessment of management
quality, apart from other key factors such as industry and business prospects, and financial
performance.
Experienced management Monnet has an experienced management headed by Mr Sandeep Jajodia, executive vice
chairman and managing director. He has over 18 years of experience in diversified industries
including steel, sugar and power. Under his management, Monnet’s sales grew at a five-year
CAGR of 25% from Rs 5.3 bn in FY06 to Rs 15.7 bn in FY11.
Professional set-up and strong second line Mr Sandeep Jajodia has adopted a professional approach towards managing Monnet. The
company has inducted various professionals from the industry at the senior and mid
management levels to prepare for the next level of growth. Mr Jajodia has built a strong team
of professionals to back Monnet’s growth plans. • Mr K. K. Khanna, executive director – projects: Mr Khanna has 40 years of experience
and has held senior positions with Ispat Industries and SAIL
• Mr M. D. Mundra – president – projects: Mr Mundra has 33 years of experience in the
power industry
• Mr K. L. Khurana, president – power: Mr Khurana has 45 years of experience in the
power industry and was previously with BHEL as executive director.
• Mr M. K. Sinha: Mr Sinha has 42 years of experience in the mining sector and was
previously working as director (tech) with Coal India
• Mr Vinay Mittal, CEO – Monnet Power Company Ltd: Monnet has recently Inducted Mr
Mittal, as chief executive officer in the MPCL. He has worked with NTPC and TATA
Power. He has vast experience of leading power projects in India. He was instrumental in
the TATA Power’s 4000 MW UMPP in Mundra.
An experienced
management
CRISIL IERIndependentEquityResearch
20
Corporate Governance
CRISIL’s fundamental grading methodology includes a broad assessment of corporate
governance and management quality, apart from other key factors such as industry and
business prospects, and financial performance. In this context, CRISIL Research analyses the
shareholding structure, board composition, typical board processes, disclosure standards and
related-party transactions. Any qualifications by regulators or auditors also serve as useful
inputs while assessing a company’s corporate governance.
Overall, corporate governance at Monnet meets the regulatory requirement – it has
reasonably good board practices and an independent board.
Board composition The board consists of eight members, of whom six are independent directors, thereby meeting
the requirements under Clause 49 of SEBI’s listing guidelines. The board is chaired by an
independent director, Mr Mohinder Gujral, who has 62 years of experience and was previously
chairman of Railway Board and chairman of Coal India Ltd. The directors have a strong
industry experience and are highly qualified. Given the background of directors, we believe
the board is experienced. The independent directors on the board include: • Mr G C Mrig, who is experienced in cool mining and related activities and has retired as
CMD of Bharat Coking Cool Ltd. He owns a coal washery.
• Mr. Gopal Tiwari, who is an Ex-Chairman of Chhattisgarh State Electricity Board, who has
replaced Mr P L Nene on the board. He has also been inducted as an independent
member of the Audit Committee.
• Mr J P Lath, who has expertise in liasioning with the government departments for
procuring registrations, licences and entering into MoUs with state governments.
• Mr C.P. Baid, who is former CEO of Sterlite Energy and former director of Sesa Goa. He
was appointed as deputy managing director in 2010.
Board’s processes The company’s quality of disclosure can be considered good judged by the level of
information and details furnished in the annual report, websites and other publicly available
data. The company has all the necessary committees – audit, remuneration, nomination and
investor grievance - in place to support corporate governance practices. The audit committee
is chaired by an independent director, Mr Mohinder Gujral.
Corporate governance
practices meet the
regulatory requirement
MAKING MARK
ETS
FU
NC
TIO
NB
ET
TE
R
YEARS
21
Monnet Ispat & Energy Ltd
Valuation Grade: 5/5
We have used the sum-of-the-parts (SOTP) method to value Monnet. The steel business is
valued by the EV/EBITDA method, power business using discounted cash flow method and
investments (Orissa Sponge, Indonesia coal mine and Rameshwaram steel) on the book
value. We have rolled forward our model to FY14. The steel business has been valued at Rs
298 per share, power business at Rs 315 per share and investment in subsidiaries at Rs 47
per share. Consequently our fair value is Rs 660 per share and valuation grade is ‘5/5’.
Steel business: We have valued the steel business by the EV/EBITDA method and
assigned a multiple of 5.5 to the standalone FY14E EBITDA of Rs 10.8 bn. Valuation of standalone steel business
Rs mn FY14E EBITDA 10,800 x EV/EBITDA 5.5 = EV 59,400 - Net debt 40,276 = Equity value 19,124 / Number of shares 64 = Value per share from steel business 298
Source: CRISIL Research
Power business: In our initiating report, we estimated the power project to commence at
end-FY13, but the management has indicated a delay. We expect it to come on stream in
H2FY14 and have factored in the delay in our valuation. We have valued Monnet’s 87.5%
interest in the power subsidiary by the DCF method. Based on this method, we arrive at a total
valuation of Rs 23.2 bn valuing Monnet’s 87.5% stake at Rs 20.3 bn. We have used cost of
equity of 21% considering a project execution risk as it is Monnet’s first power project and
ambiguity on the usage of coal from the mines between steel and power. This translates to a
value of Rs 315 per share for Monnet. Valuation of power business
(Rs mn) FY13E FY14E FY15E FY16E …. FY33EInstalled capacity 525 1050 1050 1050Sales (MWh) 1,283 5,560 7,271 7,271Tariff 2.75 2.78 2.81 3.3Revenue 3,529 15,443 20,397 24,157EBITDA 2,272 11,827 16,070 16,392EBITDA margins 64% 77% 79% 68%PAT -1,353 4,760 7,882 8,676FCFE -1,542 -692 2656 6450 11369
NPV 23,202
87.5% share 20,302
Number of shares 64
Value per share 315
Source: CRISIL Research
We roll forward our model to
FY14 and increase our fair
value to Rs 660 per share
CRISIL IERIndependentEquityResearch
22
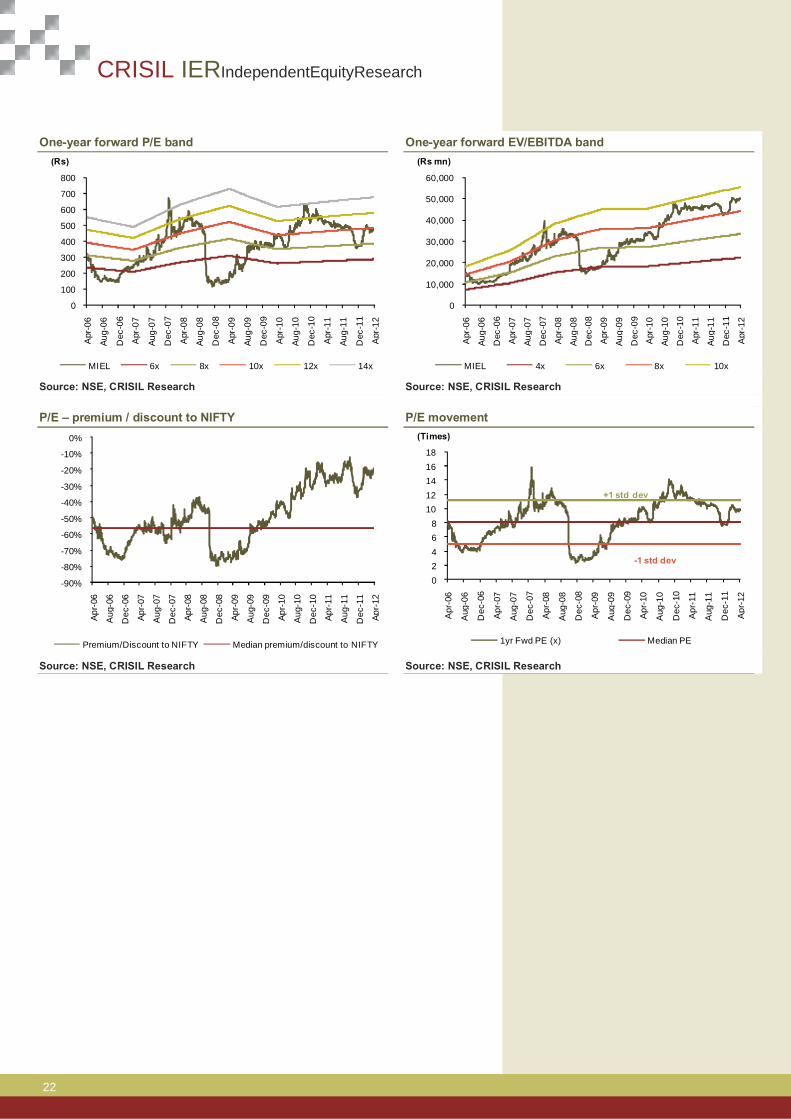
One-year forward P/E band One-year forward EV/EBITDA band
Source: NSE, CRISIL Research Source: NSE, CRISIL Research P/E – premium / discount to NIFTY P/E movement
Source: NSE, CRISIL Research Source: NSE, CRISIL Research
0
100
200
300
400
500
600
700
800
Apr
-06
Aug-
06
Dec
-06
Apr
-07
Aug-
07
Dec
-07
Apr
-08
Aug-
08
Dec
-08
Apr
-09
Aug-
09
Dec
-09
Apr
-10
Aug-
10
Dec
-10
Apr
-11
Aug-
11
Dec
-11
Apr
-12
(Rs)
MIEL 6x 8x 10x 12x 14x
0
10,000
20,000
30,000
40,000
50,000
60,000
Apr
-06
Aug-
06
Dec
-06
Apr
-07
Aug-
07
Dec
-07
Apr
-08
Aug-
08
Dec
-08
Apr
-09
Aug-
09
Dec
-09
Apr
-10
Aug-
10
Dec
-10
Apr
-11
Aug-
11
Dec
-11
Apr
-12
(Rs mn)
MIEL 4x 6x 8x 10x
-90%
-80%
-70%
-60%
-50%
-40%
-30%
-20%
-10%
0%
Apr-
06
Aug
-06
Dec
-06
Apr-
07
Aug
-07
Dec
-07
Apr-
08
Aug
-08
Dec
-08
Apr-
09
Aug
-09
Dec
-09
Apr-
10
Aug
-10
Dec
-10
Apr-
11
Aug
-11
Dec
-11
A pr-
12
Premium/Discount to NIFTY Median premium/discount to NIFTY
02468
1012141618
Apr
-06
Aug
-06
Dec
-06
Apr
-07
Au g
-07
Dec
-07
Apr
-08
Au g
-08
Dec
-08
Apr
-09
Au g
-09
Dec
-09
Apr
-10
Aug
-10
Dec
-10
Apr
-11
Aug
-11
Dec
-11
Apr
-12
(Times)
1yr Fwd PE (x) Median PE
+1 std dev
-1 std dev
MAKING MARK
ETS
FU
NC
TIO
NB
ET
TE
R
YEARS
23
Monnet Ispat & Energy Ltd
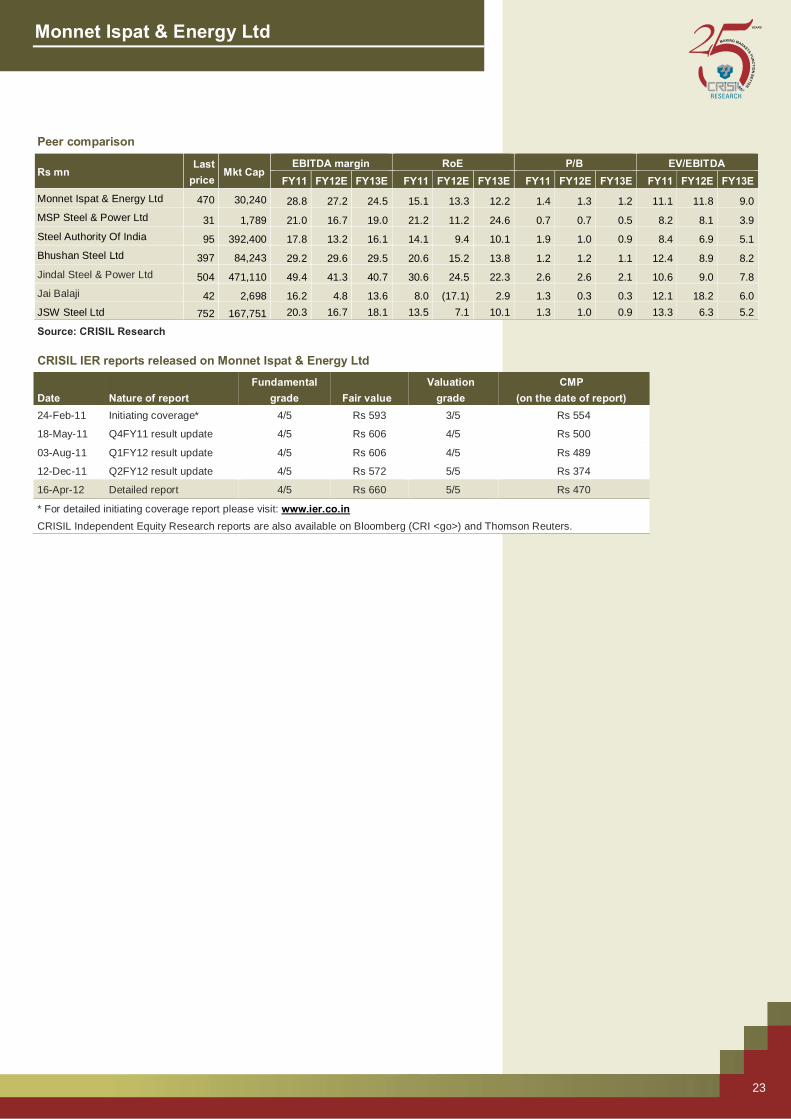
Peer comparison
Rs mn Last
price Mkt Cap
EBITDA margin RoE P/B EV/EBITDA FY11 FY12E FY13E FY11 FY12E FY13E FY11 FY12E FY13E FY11 FY12E FY13E
Monnet Ispat & Energy Ltd 470 30,240 28.8 27.2 24.5 15.1 13.3 12.2 1.4 1.3 1.2 11.1 11.8 9.0MSP Steel & Power Ltd 31 1,789 21.0 16.7 19.0 21.2 11.2 24.6 0.7 0.7 0.5 8.2 8.1 3.9Steel Authority Of India 95 392,400 17.8 13.2 16.1 14.1 9.4 10.1 1.9 1.0 0.9 8.4 6.9 5.1Bhushan Steel Ltd 397 84,243 29.2 29.6 29.5 20.6 15.2 13.8 1.2 1.2 1.1 12.4 8.9 8.2Jindal Steel & Power Ltd 504 471,110 49.4 41.3 40.7 30.6 24.5 22.3 2.6 2.6 2.1 10.6 9.0 7.8Jai Balaji 42 2,698 16.2 4.8 13.6 8.0 (17.1) 2.9 1.3 0.3 0.3 12.1 18.2 6.0JSW Steel Ltd 752 167,751 20.3 16.7 18.1 13.5 7.1 10.1 1.3 1.0 0.9 13.3 6.3 5.2
Source: CRISIL Research CRISIL IER reports released on Monnet Ispat & Energy Ltd
Date Nature of report Fundamental
grade Fair value Valuation
grade CMP
(on the date of report) 24-Feb-11 Initiating coverage* 4/5 Rs 593 3/5 Rs 554
18-May-11 Q4FY11 result update 4/5 Rs 606 4/5 Rs 500
03-Aug-11 Q1FY12 result update 4/5 Rs 606 4/5 Rs 489
12-Dec-11 Q2FY12 result update 4/5 Rs 572 5/5 Rs 374
16-Apr-12 Detailed report 4/5 Rs 660 5/5 Rs 470
* For detailed initiating coverage report please visit: www.ier.co.in CRISIL Independent Equity Research reports are also available on Bloomberg (CRI <go>) and Thomson Reuters.

CRISIL IERIndependentEquityResearch
24
Company Overview
Incorporated in 1990, Delhi-based Monnet produces coal-based sponge iron and steel, and
also generates power. Monnet is the second largest coal-based sponge iron producer in India
after JSPL. It is listed on the NSE, BSE and Madhya Pradesh Stock Exchange. Key milestones
Year Milestones 1990 Incorporated as Monnet Ispat Ltd
1994 Commenced first manufacturing facility in Raipur (Chhattisgarh), with a capacity of 0.10 mn MTPA of sponge iron and 0.05 mn MTPA of mild steel
1996 Allotment of first coal mine in Milupara, Raigarh
2003 Consolidated the capacity of sponge iron and steel to 0.30 mn MTPA at the Raipur plant
2005 Increased the capacity of ferro alloys to 0.06 mn MTPA from 0.04 mn MTPA at the Raipur plant
2006 Changed its name to Monnet Ispat and Energy and set up another plant in Raigarh with 0.17 mn MTPA sponge iron capacity
2007 Installed 0.20 mn MTPA structured steel capacity. Increased the power generation capacity to 60 MW from 45 MW at the Raipur plant and sponge iron capacity to 0.39 mn MTPA at the Raigarh plant
2008 Set up a 90 MW power generation facility and increased sponge iron capacity to 0.50 mn MTPA at the Raigarh plant
Source: Company, CRISIL Research
Details of Monnet’s current capacity Monnet has two plants, one each in Raipur and Raigarh in Chhattisgarh. Capacity and utilisation details
Product
Plant-wise capacity break-up Total capacity
(mn MTPA/MW)
FY10 FY11
Total production (mn MTPA/MW)
Capacity utilisation rate
Total production (mn MTPA/MW)
Capacity utilisation rateRaipur Raigarh
Sponge iron 0.30 mn MTPA 0.50 mn MTPA 0.8 0.71 88.8% 0.69 86.5%
MS/SS products 0.30 mn MTPA - 0.3 0.12 38.4% 0.04 14.0%
Structured steel 0.20 mn MTPA - 0.2 0.09 46.0% 0.04 19.6%
Ferro alloys 0.06 mn MTPA - 0.06 0 0.0% 0 14.7%
Power 60 MW 90 MW 150 117 77.7% 111 73.8%
Source: Company, CRISIL Research
Monnet owns the largest underground coal mine in the country in Raigarh (Chhattisgarh). It
has total high grade coal (B to D) reserves of 86 mn MTPA, which is currently operational with
an annual extraction of 1.0 mn MTPA--repeat.
Monnet’s production process
Monnet produces sponge iron through the direct reduced iron (DRI) process. It has also
installed waste heat recovery units to produce power from waste heat, which is emitted during
the production of sponge iron.

MAKING MARK
ETS
FU
NC
TIO
NB
ET
TE
R
YEARS
25
Monnet Ispat & Energy Ltd
Production flow chart
Source: Company, CRISIL Research Product portfolio
Monnet’s current product portfolio includes coal-based sponge iron, steel, ferro alloys and
power.
Product-wise contribution to total revenues
Source: Company, CRISIL Research
Coal(Captive + Purchased)
Iron Ore(Purchased)
Rotary kiln
Sponge Irone
Power(Captive)
EAF
Billets Structured Steel
SaleWaste heat
Sale
Sale Sale
33% 38%52% 53%
69%
49%
18%
9% 3%
0%
1%
17%15%
16%
8%1%
14% 26% 20%17%
26%
9%2% 4%
0%
10%
20%
30%
40%
50%
60%
70%
80%
90%
100%
FY07 FY08 FY09 FY10 FY11
Sponge Iron MS / SS Products - Sponge iron Structural Steel Power (MWh) Others

CRISIL IERIndependentEquityResearch
26
Monnet’s subsidiary details
Monnet has six subsidiary companies - four are incorporated in India and two (Monnet
Overseas Ltd and Monnet Global Ltd) are incorporated in Jabel Ali Free Trade Zone Dubai,
UAE. Details of subsidiaries
Subsidiary Ownership interest Operational activity
Monnet Overseas Ltd 100.00% Deals in overseas investments
Monnet Global Ltd 100.00% MGL is promoted to hold the overseas mining assets to provide raw materials to Monnet and MPCL. It has acquired a 80 mn MTPA coal mine in Indonesia
Monnet Power Company Ltd 87.50% MPCL is primarily into power generation and distribution. It is setting up a 1,050 MW power plant in Angul, Orissa
Monnet Daniels Coal Washeries Pvt Ltd 51.64% The company has 3.5 mn MTPA capacity of coal washery near Ranchi in Jharkhand. Along with Punjab State Electricity Board, it is setting up a 4.2 mn MTPA coal washery in North Karanpura in Jharkhand
Monnet Cement Ltd 99.95% A cement producer aiming to set up a cement plant in Raipur with a capacity of 3 mn MTPA
Rameshwaram Steel & Power Pvt Ltd 97.00% The company has sponge iron manufacturing. Acquisition of Rameshwaram has added 30 mn MTPA captive iron ore mine to the existing capacities
Source: Company, CRISIL Research
Monnet Power Company Monnet Power Company Ltd (MPCL) was set up in 2006 by Monnet to generate and distribute
power. It is setting up a 1,050 MW coal-based power plant in Angul, Orissa. Coal requirement
for the plant will be met from captive mines in Utkal-B2, Angul and Mandakini, Talchar in
Orissa. The orders for BTG Package and balance of plant have been placed with BHEL and
Indure Pvt. Ltd, respectively.
The financial closure of the project has already been achieved and the arrangements for
evacuation and sale of ~87% of saleable power have also been concluded.

MAKING MARK
ETS
FU
NC
TIO
NB
ET
TE
R
YEARS
27
Monnet Ispat & Energy Ltd
Annexure: Standalone Financials
Source: CRISIL Research
Income statement Balance Sheet(Rs mn) FY10 FY11 FY12E FY13E FY14E (Rs mn) FY10 FY11 FY12E FY13E FY14EOperating income 14,825 15,705 18,473 29,794 39,057 LiabilitiesEBITDA 4,487 4,522 5,019 7,311 10,800 Equity share capital 523 644 644 644 644 EBITDA margin 30.3% 28.8% 27.2% 24.5% 27.7% Reserves 16,024 20,258 22,838 25,481 29,310 Depreciation 717 739 901 2,163 2,488 Minorities - - - - - EBIT 3,770 3,783 4,118 5,148 8,312 Net worth 16,546 20,901 23,482 26,125 29,954 Interest 754 448 697 2,022 3,755 Convertible debt 525 392 - - - Operating PBT 3,016 3,335 3,422 3,126 4,557 Other debt 14,425 26,327 33,219 40,219 43,219 Other income 297 280 369 745 976 Total debt 14,950 26,719 33,219 40,219 43,219 Exceptional inc/(exp) (18) (7) - - - Deferred tax liability (net) 1,196 1,412 1,488 1,490 1,634 PBT 3,295 3,608 3,791 3,871 5,533 Total liabilities 32,692 49,032 58,189 67,833 74,806 Tax provision 604 797 834 852 1,328 AssetsMinority interest - - - - - Net f ixed assets 11,283 10,937 32,036 36,373 40,384 PAT (Reported) 2,691 2,812 2,957 3,019 4,205 Capital WIP 7,212 15,127 5,127 5,127 5,127 Less: Exceptionals (18) (7) - - - Total fixed assets 18,495 26,064 37,164 41,500 45,512 Adjusted PAT 2,709 2,819 2,957 3,019 4,205 Investments 5,130 5,432 5,432 6,432 7,432
Current assetsRatios Inventory 2,188 3,604 4,302 6,938 9,096
FY10 FY11 FY12E FY13E FY14E Sundry debtors 1,289 1,898 2,024 3,265 4,280 Growth Loans and advances 5,351 7,831 8,158 9,498 11,351 Operating income (%) (4.6) 5.9 17.6 61.3 31.1 Cash & bank balance 2,052 6,881 4,115 4,777 2,874 EBITDA (%) 17.5 0.8 11.0 45.7 47.7 Marketable securities 324 68 68 68 68 Adj PAT (%) 25.6 4.0 4.9 2.1 39.3 Total current assets 11,204 20,282 18,668 24,547 27,669 Adj EPS (%) 15.2 (15.5) 4.9 2.1 39.3 Total current liabilities 2,137 2,746 3,074 4,646 5,806
Net current assets 9,067 17,536 15,593 19,901 21,863 Profitability Intangibles/Misc. expenditure - - - - - EBITDA margin (%) 30.3 28.8 27.2 24.5 27.7 Total assets 32,692 49,032 58,189 67,833 74,806 Adj PAT Margin (%) 18.3 17.9 16.0 10.1 10.8 RoE (%) 19.0 15.1 13.3 12.2 15.0 Cash flowRoCE (%) 13.3 9.6 7.9 8.4 11.9 (Rs mn) FY10 FY11 FY12E FY13E FY14ERoIC (%) 16.6 11.9 9.8 11.3 15.1 Pre-tax prof it 3,313 3,615 3,791 3,871 5,533
Total tax paid (547) (580) (758) (850) (1,184) Valuations Depreciation 717 739 901 2,163 2,488 Price-earnings (x) 9.1 10.7 10.2 10.0 7.2 Working capital changes 760 (3,897) (823) (3,646) (3,864) Price-book (x) 1.5 1.4 1.3 1.2 1.0 Net cash from operations 4,243 (123) 3,110 1,538 2,973 EV/EBITDA (x) 8.3 11.1 11.8 9.0 6.5 Cash from investmentsEV/Sales (x) 2.5 3.2 3.2 2.2 1.8 Capital expenditure (4,846) (8,308) (12,000) (6,500) (6,500) Dividend payout ratio (%) 10.6 12.3 10.9 10.7 7.7 Investments and others (3,298) (46) - (1,000) (1,000) Dividend yield (%) 1.2 1.1 1.1 1.1 1.1 Net cash from investments (8,144) (8,354) (12,000) (7,500) (7,500)
Cash from financingB/S ratios Equity raised/(repaid) 874 2,041 - - - Inventory days 81 122 120 116 121 Debt raised/(repaid) 1,698 11,769 6,500 7,000 3,000 Creditors days 62 75 69 61 61 Dividend (incl. tax) (334) (399) (376) (376) (376) Debtor days 30 41 38 38 38 Others (incl extraordinaries) 1,260 (106) - 0 - Working capital days 174 201 217 162 159 Net cash from financing 3,498 13,305 6,124 6,624 2,624 Gross asset turnover (x) 1.1 1.1 0.7 0.7 0.8 Change in cash position (403) 4,829 (2,766) 662 (1,903) Net asset turnover (x) 1.3 1.4 0.9 0.9 1.0 Closing cash 2,052 6,881 4,115 4,777 2,874 Sales/operating assets (x) 0.9 0.7 0.6 0.8 0.9 Current ratio (x) 5.2 7.4 6.1 5.3 4.8 Quarterly financialsDebt-equity (x) 0.9 1.3 1.4 1.5 1.4 (Rs mn) Q3FY11 Q4FY11 Q1FY12 Q2FY12 Q3FY12Net debt/equity (x) 0.8 0.9 1.2 1.4 1.3 Net Sales 3,471 4,456 4,272 4,586 4,810 Interest coverage 5.0 8.4 5.9 2.5 2.2 Change (q-o-q) -4% 28% -4% 7% 5%
EBITDA 1,109 1,286 1,163 1,195 1,252 Per share Change (q-o-q) 6% 16% -10% 3% 5%
FY10 FY11 FY12E FY13E FY14E EBITDA margin 32.0% 28.9% 27.2% 26.1% 26.0%Adj EPS (Rs) 51.8 43.8 45.9 46.9 65.3 PAT 702 766 732 769 731 CEPS 65.5 55.3 59.9 80.5 104.0 Adj PAT 702 766 732 769 731 Book value 316.5 324.9 364.9 405.9 465.4 Change (q-o-q) 7% 9% -4% 5% -5%Dividend (Rs) 5.0 5.4 5.0 5.0 5.0 Adj PAT margin 20.2% 17.2% 17.1% 16.8% 15.2%Actual o/s shares (mn) 52.3 64.3 64.4 64.4 64.4 Adj EPS 13.4 11.9 11.4 12.0 11.4

CRISIL IERIndependentEquityResearch
28
Focus Charts Capacity expansion across the value chain... ... to drive revenue growth...
Source: Company, CRISIL Research Source: Company, CRISIL Research ... and per tonne realisation Margins to dip in short term but improve later...
Source: Company, CRISIL Research Source: Company, CRISIL Research .. with increase in captive raw materials RoE to start improving post FY13
FY10 FY11 FY12E FY13E FY14E Coal 49% 50% 50% 46% 54% Iron ore 0% 0% 0% 0% 31% Coke NA NA NA 0% 0%
Source: Company, CRISIL Research Source: Company, CRISIL Research
1.02mnmtpa
0.61mnmtpa
1.80mnmtpa
0.85mnmtpa
0.85mnmtpa
230MW
Mettalics SMS Steel Power
Sponge Iron Pig Iron
15,545
14,825
15,705 18,473 29,794 39,057
34%
-5%
6%
18%
61%
31%
-10%
0%
10%
20%
30%
40%
50%
60%
70%
0
5,000
10,000
15,000
20,000
25,000
30,000
35,000
40,000
45,000
FY09 FY10 FY11 FY12E FY13E FY14E
(Rs mn)
Revenue % change (RHS)
14,05517,237
23,911
33,231 34,036
0
5,000
10,000
15,000
20,000
25,000
30,000
35,000
40,000
FY10 FY11 FY12E FY13E FY14E
(Rs per tonnne)
3,818 4,487 4,522 5,019 7,311 10,800
25%
30% 29%27%
25%28%
0%
5%
10%
15%
20%
25%
30%
35%
0
2,000
4,000
6,000
8,000
10,000
12,000
FY09 FY10 FY11 FY12E FY13E FY14E
(Rs mn)
EBITDA EBITDA Margin (RHS)
18.8% 19.0%
15.1%
13.3%12.2%
15.0%
6%
8%
10%
12%
14%
16%
18%
20%
FY09 FY10 FY11 FY12E FY13E FY14E

MAKING MARK
ETS
FU
NC
TIO
NB
ET
TE
R
YEARS
This page intentionally left blank
CRISIL IERIndependentEquityResearch
CRISIL Research Team
President
Mukesh Agarwal CRISIL Research +91 22 3342 3035 [email protected]
Analytical Contacts
Tarun Bhatia Senior Director, Capital Markets +91 22 3342 3226 [email protected]
Prasad Koparkar Senior Director, Industry & Customised Research +91 22 3342 3137 [email protected]
Chetan Majithia Director, Equity Research +91 22 3342 4148 [email protected]
Mohit Modi Director, Equity Research +91 22 3342 2860 [email protected]
Jiju Vidyadharan Director, Funds & Fixed Income Research +91 22 3342 8091 [email protected]
Ajay D'Souza Director, Industry Research +91 22 3342 3567 [email protected]
Ajay Srinivasan Director, Industry Research +91 22 3342 3530 [email protected]
Rahul Prithiani Director, Industry Research +91 22 3342 3574 [email protected]
Binaifer Jehani Director, Customised Research +91 22 3342 4091 [email protected]
Manoj Mohta Director, Customised Research +91 22 3342 3554 [email protected]
Sudhir Nair Director, Customised Research +91 22 3342 3526 [email protected]
Business Development
Ashish Sethi Director, Capital Markets +91 22 3342 8023 [email protected]
Vinaya Dongre Director, Industry & Customised Research +91 22 3342 8025 [email protected]
Siddharth Arora Director, Customised Research +91 22 3342 4133 [email protected]
Sagar Sawarkar Associate Director, Equity Research +91 22 3342 8012 [email protected]
Deepak Mittal Associate Director, Funds & Fixed Income Research +91 22 3342 8031 [email protected]
Prosenjit Ghosh Associate Director, Industry & Customised Research +91 22 3342 8008 [email protected]
MAKING MARK
ETS
FU
NC
TIO
NB
ET
TE
R
YEARS
Our Capabilities
Making Markets Function Better
Economy and Industry Research
▪ Largest team of economy and industry research analysts in India ▪ Coverage on 70 industries and 139 sub-sectors; provide growth forecasts, profitability analysis, emerging trends,
expected investments, industry structure and regulatory frameworks ▪ 90 per cent of India’s commercial banks use our industry research for credit decisions ▪ Special coverage on key growth sectors including real estate, infrastructure, logistics, and financial services ▪ Inputs to India’s leading corporates in market sizing, demand forecasting, and project feasibility ▪ Published the first India-focused report on Ultra High Net-worth Individuals ▪ All opinions and forecasts reviewed by a highly qualified panel with over 200 years of cumulative experience ▪ Largest independent equity research house in India, focusing on small and mid-cap companies; coverage
exceeds 100 companies ▪ Released company reports on all 1,401 companies listed and traded on the National Stock Exchange; a global
first for any stock exchange ▪ First research house to release exchange-commissioned equity research reports in India
Funds and Fixed Income Research
▪ Largest and most comprehensive database on India’s debt market, covering more than 14,000 securities ▪ Largest provider of fixed income valuations in India ▪ Value more than Rs.33 trillion (USD 650 billion) of Indian debt securities, comprising 85 per cent of outstanding
securities ▪ Sole provider of fixed income and hybrid indices to mutual funds and insurance companies; we maintain 12
standard indices and over 80 customised indices ▪ Ranking of Indian mutual fund schemes covering 73 per cent of assets under management and Rs.5 trillion
(USD100 billion) by value ▪ Retained by India’s Employees’ Provident Fund Organisation, the world’s largest retirement scheme ▪ covering over 50 million individuals, for selecting fund managers and monitoring their performance
Equity and Company Research
▪ Largest independent equity research house in India, focusing on small and mid-cap companies; coverage exceeds 100 companies
▪ Released company reports on all 1,401 companies listed and traded on the National Stock Exchange; a global first for any stock exchange
▪ First research house to release exchange-commissioned equity research reports in India ▪ Assigned the first IPO grade in India

Our Office
Ahmedabad 706, Venus Atlantis Nr. Reliance Petrol Pump Prahladnagar, Ahmedabad, India Phone: +91 79 4024 4500 Fax: +91 79 2755 9863
Kolkata Horizon, Block 'B', 4th Floor 57 Chowringhee Road Kolkata - 700 071, India Phone: +91 33 2289 1949/50 Fax: +91 33 2283 0597
Bengaluru W-101, Sunrise Chambers, 22, Ulsoor Road, Bengaluru - 560 042, India Phone:+91 80 2558 0899
+91 80 2559 4802 Fax: +91 80 2559 4801
New Delhi The Mira, G-1, 1st Floor, Plot No. 1 & 2 Ishwar Nagar, Mathura Road, New Delhi - 110 065, India Phone: +91 11 4250 5100
+91 11 2693 0117/121 Fax: +91 11 2684 2212
Chennai Thapar House, 43/44, Montieth Road, Egmore, Chennai - 600 008, India Phone:+91 44 2854 6205/06
+91 44 2854 6093 Fax: +91 44 2854 7531
Pune 1187/17, Ghole Road, Shivaji Nagar, Pune - 411 005, India Phone: +91 20 2553 9064/67 Fax: +91 20 4018 1930
Hyderabad 3rd Floor, Uma Chambers Plot No. 9&10, Nagarjuna Hills, (Near Punjagutta Cross Road) Hyderabad - 500 482, India Phone: +91 40 2335 8103/05 Fax: +91 40 2335 7507
CRISIL Ltd is a Standard & Poor's company
CRISIL Limited CRISIL House, Central Avenue, Hiranandani Business Park, Powai, Mumbai – 400076. India Phone: +91 22 3342 3000 | Fax: +91 22 3342 8088 www.crisil.com