Embed Size (px)
Citation preview

MONO CREEK SEDIMENT TRANSPORT AND FLOODPLAIN CONNECTIVITY STUDY
Mono Creek Sediment Transport and Floodplain Connectivity Study
FERC Project Nos. 2085, 2175, 67 and 120
Copyright 2005 by Southern California Edison Company ii November 2005
TABLE OF CONTENTS
Page
1.0 INTRODUCTION...................................................................................................... 1 2.0 STUDY OBJECTIVES.............................................................................................. 1 3.0 STUDY AREA .......................................................................................................... 2
3.1 Upper Adjustable Study Reach (RM 3.5-3.7) .................................................... 2 3.2 Lower Adjustable Study Reach (RM 2.5-2.7) .................................................... 2 3.3 Non-Adjustable Study Reach (RM 3.8-5.5) ....................................................... 2
4.0 TEST FLOW RELEASE SUMMARY........................................................................ 3 5.0 METHODS ............................................................................................................... 3
5.1 Methods Used to Measure Sediment Transport................................................ 3 5.2 Methods Used to Measure Changes in Bed Surface Elevation......................... 4 5.3 Methods Used to Measure Floodplain Connectivity .......................................... 4
6.0 RESULTS................................................................................................................. 4 6.1 Sediment Transport .......................................................................................... 4
6.1.1 Adjustable Channel Reaches ........................................................................ 4 6.1.2 Non-Adjustable Channel Reach .................................................................... 5
6.2 Changes in Bed Surface Elevation ................................................................... 6 6.3 Related Observations ....................................................................................... 6
6.3.1 Large Woody Debris...................................................................................... 6 6.3.2 Bank Erosion ................................................................................................. 7
6.4 Floodplain Connectivity ..................................................................................... 7 6.4.1 Wetted Width................................................................................................. 7 6.4.2 Depth............................................................................................................. 7
7.0 CONCLUSIONS....................................................................................................... 8 8.0 REFERENCES......................................................................................................... 9
Mono Creek Sediment Transport and Floodplain Connectivity Study
FERC Project Nos. 2085, 2175, 67 and 120
Copyright 2005 by Southern California Edison Company iii November 2005
LIST OF TABLES
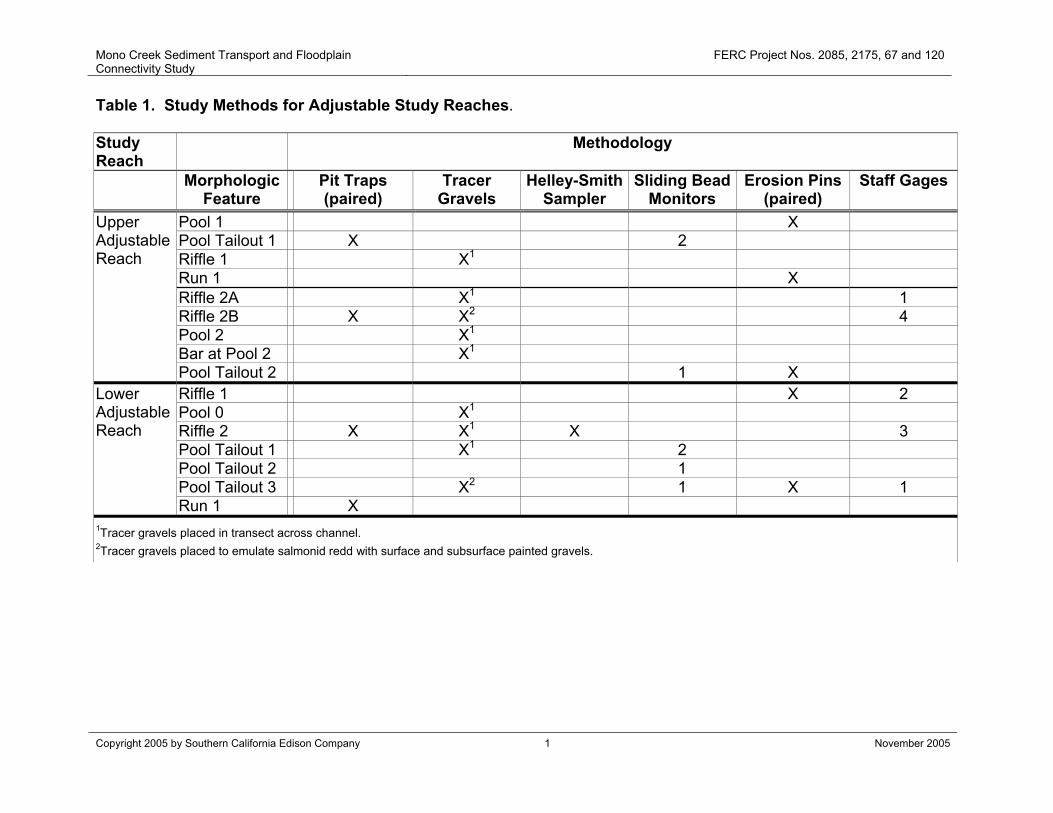
Table 1. Study Methods for Adjustable Study Reaches.
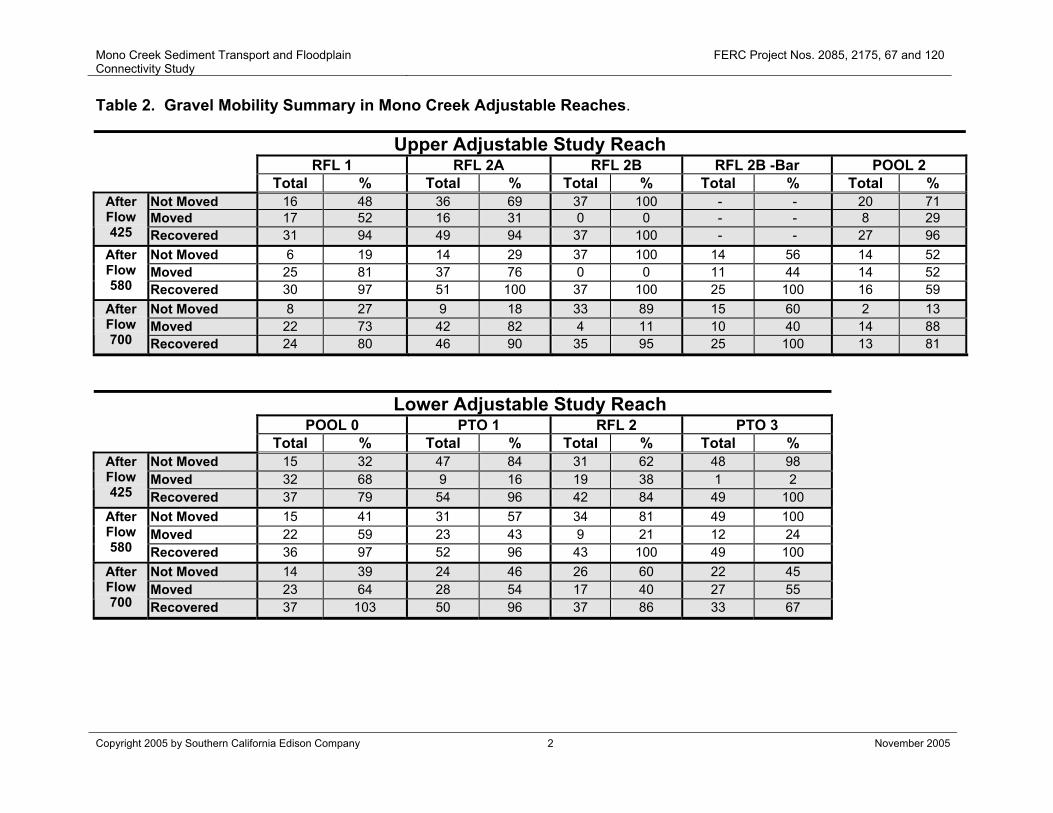
Table 2. Gravel Mobility Summary in Mono Creek Adjustable Reaches.
Table 3. Summation of Pit Trap Sediment Data.
Table 4. Gravel Mobility Summary in Mono Creek Non-Adjustable Reach.
Table 5. Net Scour as Measured with Sliding Bead Monitors.
Table 6. Summary of Erosion Pin Data.
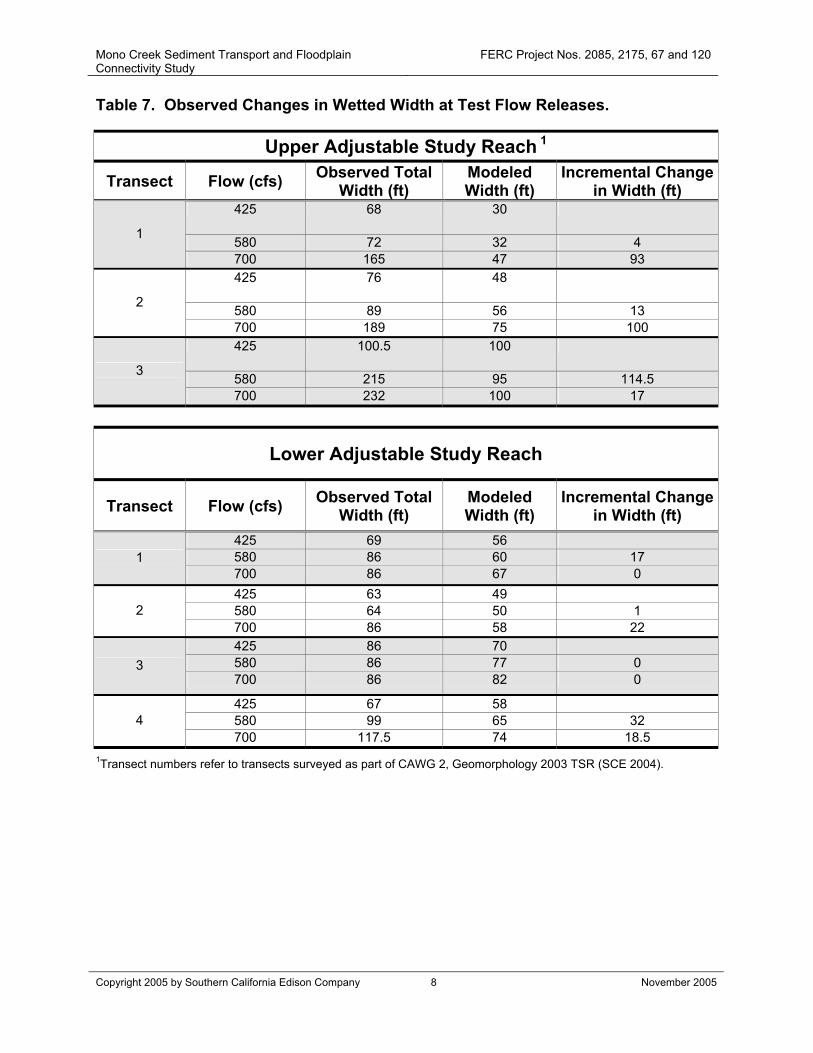
Table 7. Observed Changes in Wetted Width at Test Flow Releases.
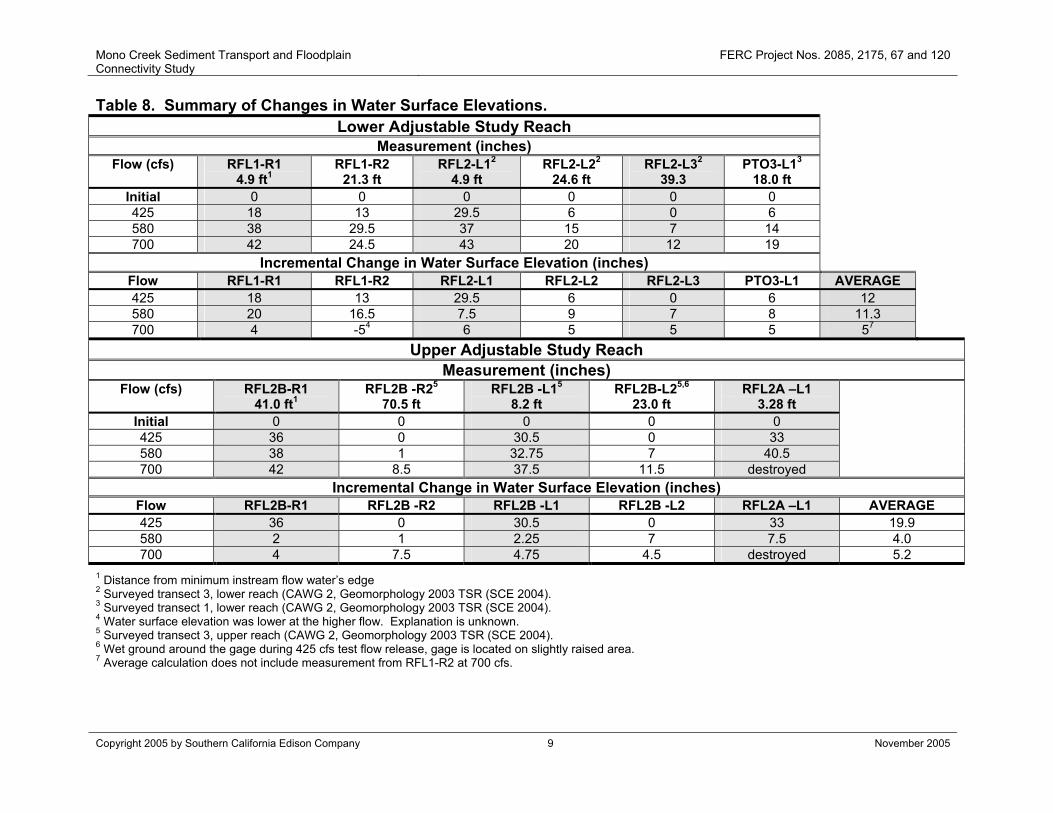
Table 8. Summary of Changes in Water Surface Elevations.
LIST OF FIGURES
Figure 1. Study Location Map.
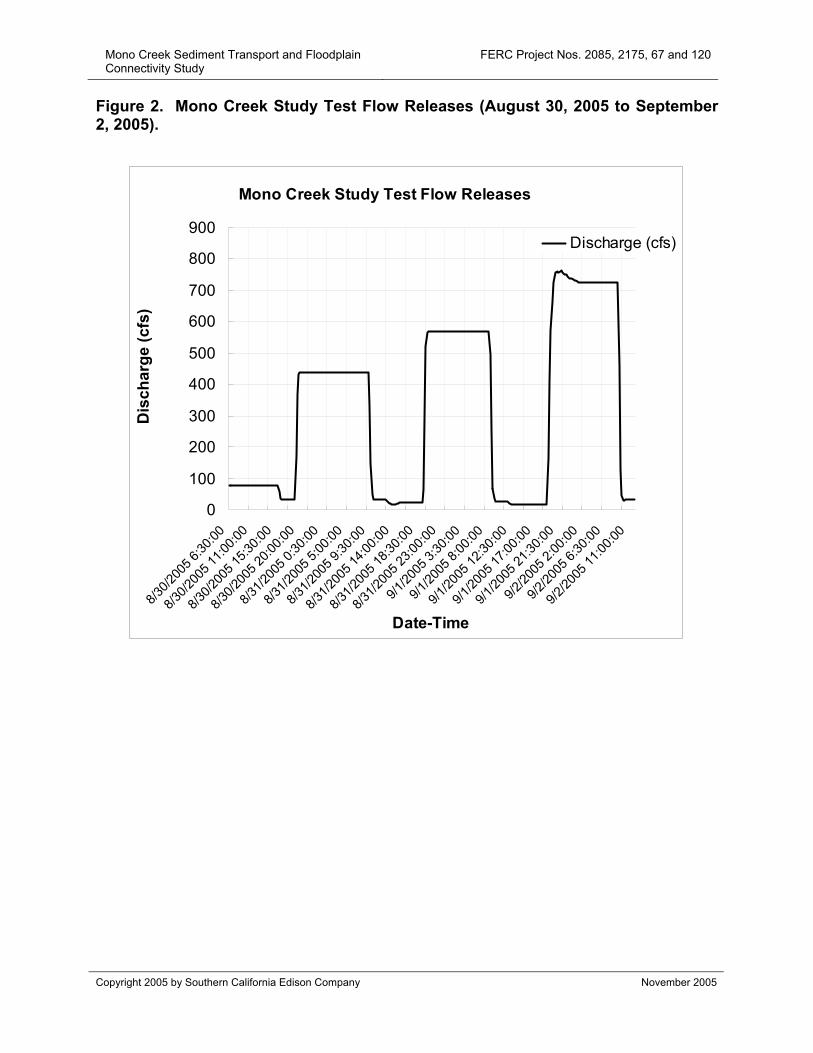
Figure 2. Mono Creek Study Test Flow Releases (August 30, 2005 to September 2, 2005).
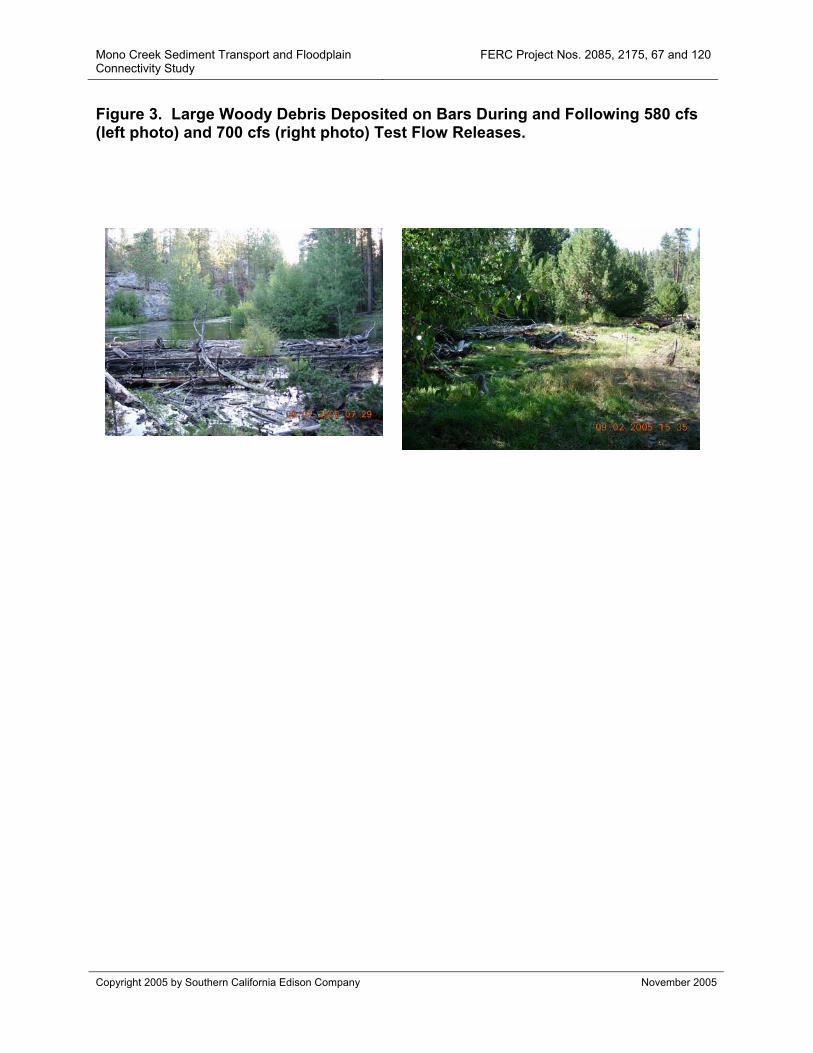
Figure 3. Large Woody Debris Deposited on Bars During and Following 580 cfs (left photo) and 700 cfs (right photo) Test Flow Releases.
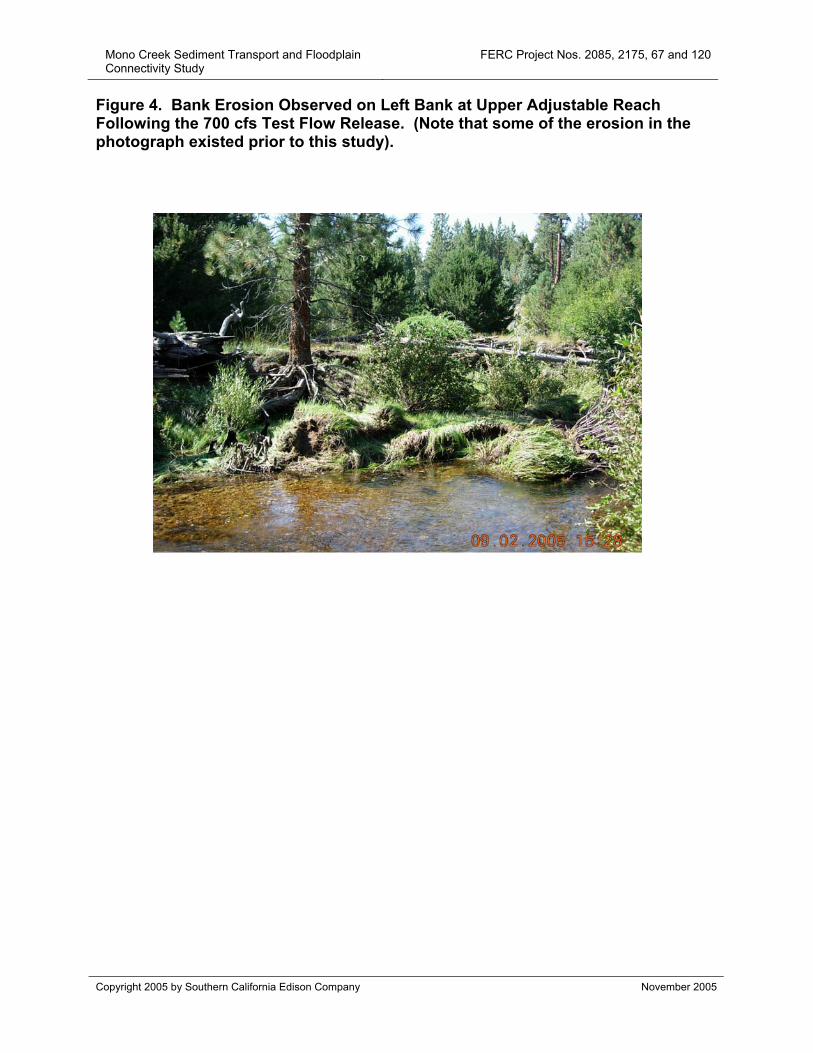
Figure 4. Bank Erosion Observed on Left Bank at Upper Adjustable Reach Following the 700 cfs Test Flow Release.
Figure 5. Wetted Width Cross Sections.
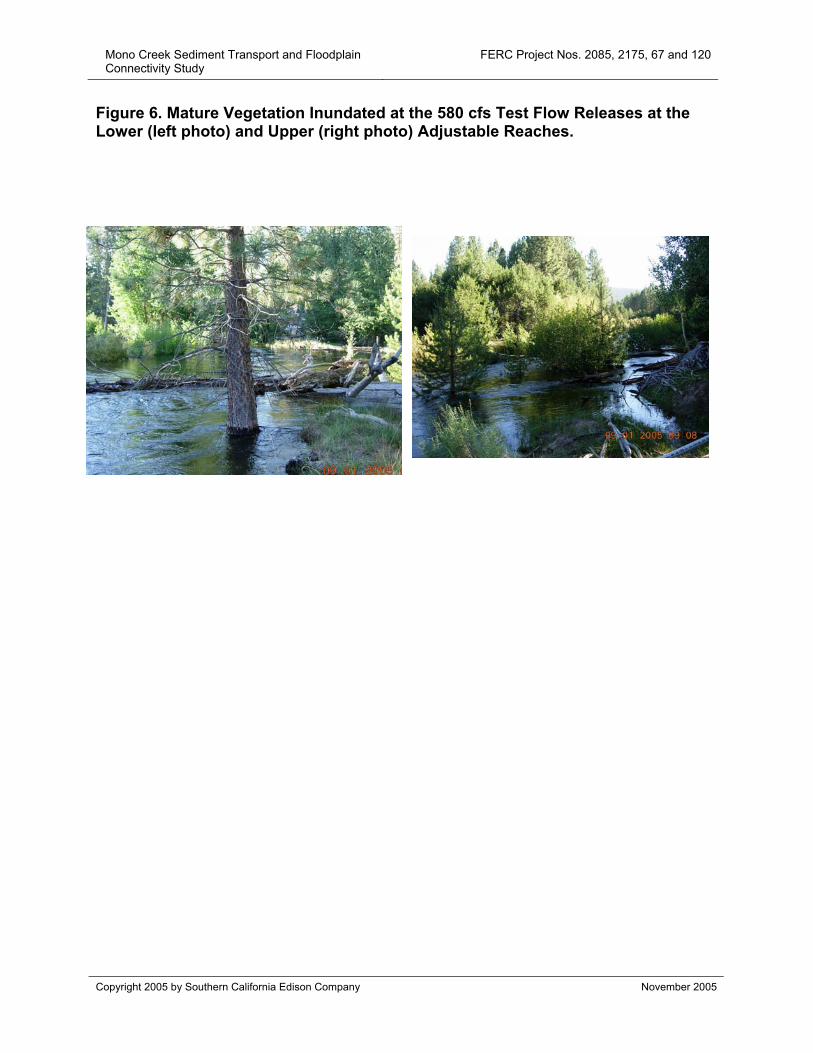
Figure 6. Mature Vegetation Inundated at the 580 cfs Test Flow Releases at the Lower (left photo) and Upper (right photo) Adjustable Reaches.
LIST OF APPENDICES
Appendix A Sampling Methods.
Appendix B Mono Creek Sediment Transport and Floodplain Connectivity Study Plenary Presentation 13 September 2005.
Appendix C Study Data and Result Details.
Mono Creek Sediment Transport and Floodplain Connectivity Study
FERC Project Nos. 2085, 2175, 67 and 120
Copyright 2005 by Southern California Edison Company 1 November 2005
1.0 INTRODUCTION
Previous studies performed for the Big Creek ALP indicate that the present day non-native trout population in Mono Creek is low, possibly as a result of low recruitment. Low trout recruitment may be related to the presence of fine sediment in spawning gravels, which are present in the reach. Aquatic insect populations are also low, possibly due to sedimentation. Previous studies indicate that fine sediment in Mono Creek is higher, on average, in pools of the adjustable portions of the creek than in other areas studied as part of the Big Creek ALP. Fine sediment content of spawning gravels is also higher than recommendations established in the geomorphology and fisheries literature (CAWG 2, Geomorphology, 2003 Technical Study Report (TSR), SCE 2004). The source of fine sediment is likely attributable to three sources: 1) releases during maintenance of Mono Creek diversion; 2) run off from sand-dominated hill slopes immediately below the diversion, and; 3) local runoff from meadow areas (some meadows have gullies).
This study was designed to evaluate the relationship between flow and sediment movement in Mono Creek to assist in the development of Channel Riparian Maintenance Flow (CRMF) releases. Flood plain connectivity was also evaluated as a component of this study because CRMF releases would affect flood plain inundation frequency and duration, and therefore riparian resources. The information developed as part of this study is intended to augment information collected during previous studies and supplements the information presented in the following two reports:
• CAWG 2, Geomorphology, 2003 TSR (SCE 2004).
• CAWG 11, Riparian, 2003 TSR (SCE 2004).
It should be noted that only 12% of the Mono Creek channel is considered to have an adjustable bedform. The remaining 88% is considered non-adjustable, but contains numerous pockets of spawning gravels. Flows that move sand through the adjustable reach could affect the mobility of pocket gravels in the non-adjustable reaches of the channel. This study evaluates the effect of flows on both types of channels.
2.0 STUDY OBJECTIVES
The Mono Creek Sediment Transport and Floodplain Connectivity Study (Study) was performed to evaluate the relationship between flow and sediment (sand and gravel) movement in Mono Creek and to evaluate flood plain connectivity. The specific objectives of the study were to determine the:
• Magnitude of flow required to flush fine sediment from spawning gravels and to transport fine sediments through pools in the adjustable reaches in order to improve and increase the amount of certain types of fish habitats;
• Potential to transport gravel stored in the non-adjustable reaches (typically pocket gravels deposited on the lee side of boulders) during the test flow releases; and
Mono Creek Sediment Transport and Floodplain Connectivity Study
FERC Project Nos. 2085, 2175, 67 and 120
Copyright 2005 by Southern California Edison Company 2 November 2005
• Extent of floodplain inundation at specified discharges.
These objectives were accomplished by:
• Identifying the threshold at which sand and gravel transport is initiated in adjustable and non-adjustable reaches;
• Characterizing channel scour depth-discharge relationships;
• Characterizing stage-discharge relationships, and
• Characterizing inundation levels at each of the test flows.
3.0 STUDY AREA
This Study was performed on Mono Creek, a tributary of the South Fork San Joaquin River. Two adjustable reaches and one non-adjustable reach of Mono Creek were selected as study sites. The locations of these three study reaches are shown on Figure 1 and are described below.
3.1 UPPER ADJUSTABLE STUDY REACH (RM 3.5-3.7)
This reach is defined as a B4c channel type, characterized by one complete meander wave consisting of 2 pools (P), 2 pool tail-outs (PTO), 2 riffles (RFL), and 1 run (R). The bed material is dominated by small gravel with sand representing the subdominant particle size. The median particle size (D50) is 13mm. Equal amounts of sand and larger gravel occur throughout the study reach. Large woody debris is abundant throughout the study reach, with one significant debris jam located at the downstream terminus of the reach.
3.2 LOWER ADJUSTABLE STUDY REACH (RM 2.5-2.7)
This reach is defined as a B4c channel type, consisting of a straight reach containing 3 P, 3 PTO, 3 RFL, and 1 R. The bed material is dominated by small gravel with sand subdominant. The median particle size (D50) is 10mm. In the lower portion of the study reach, the flow path splits around a vegetated mid-channel bar. Large woody debris is abundant throughout the study reach.
3.3 NON-ADJUSTABLE STUDY REACH (RM 3.8-5.5)
The majority of Mono Creek (88%) is considered non-adjustable. The reach used for this study is a steep-gradient B2 channel type. Boulders are the dominant particle size, with lesser amounts of sand, gravel, and cobble present. The median particle size (D50) on riffles is 350mm. Gravel deposits suitable for spawning are found only in small “pockets”, usually within the lee of boulders that create a low-velocity shadow.
Mono Creek Sediment Transport and Floodplain Connectivity Study
FERC Project Nos. 2085, 2175, 67 and 120
Copyright 2005 by Southern California Edison Company 3 November 2005
4.0 TEST FLOW RELEASE SUMMARY
Three flow releases were tested at each study reach between August 31 and September 2, 2005, as follows:
• 425 cfs on August 31
• 580 cfs on September 1
• 700 cfs on September 2
The duration of each release was approximately 12 hours. Figure 2 depicts the magnitude and duration of these flows during the test period.
5.0 METHODS
A variety of methods were employed to determine the particle sizes entrained, total sediment load, change in bed surface elevation (i.e., bed scour or aggradation), and to determine the extent of floodplain connectivity during each test flow release at the study sites. A wide range of methods are reported in the geomorphic literature that have been traditionally used to estimate sediment transport rates in rivers, including predictions from empirical formula, sampling using hand-held or pit traps, tracking grain movement with tracer gravels and scour chains, and measuring the entire sediment load in slot traps or settling ponds (Wilcock 2001). The methods used in this Study are briefly summarized below. Detailed methodologies are provided in Appendix A, for reference. All the methods employed in the adjustable reach study sites are listed in Table 1. Only tracer gravel study methods were used to track bed material movement in the non-adjustable reach. It was not feasible to install any of the other monitoring devices in the non-adjustable sections of the channel, owing to the coarse boulder and cobble dominated substrate.
5.1 METHODS USED TO MEASURE SEDIMENT TRANSPORT
Pit traps, tracer gravels, and a Helly-Smith bedload sampler were used to evaluate the particle sizes that were entrained and to estimate total sediment load at the test flow releases.
Tracer gravels were monitored at nine study sites in the two adjustable reaches with a total of 202 individual tracer pieces installed. Tracer gravels were monitored at 14 study sites in the non-adjustable reach, with a total of 380 individual tracer pieces installed. Four pit trap study sites were monitored, with two pit traps installed at each site for a total of eight pit traps.
Helly-Smith bedload sampling was performed twice in the lower adjustable study reach during the receding limb of the 580 cfs and 700 cfs test flows to estimate total sediment load. It was not feasible to perform more bedload sampling due to the limited number of sites where it was safe to wade the channel with the sampler during the flow releases, and due to time constraints.
Mono Creek Sediment Transport and Floodplain Connectivity Study
FERC Project Nos. 2085, 2175, 67 and 120
Copyright 2005 by Southern California Edison Company 4 November 2005
5.2 METHODS USED TO MEASURE CHANGES IN BED SURFACE ELEVATION
Sliding bead monitors and erosion pins were used to measure changes in bed surface elevation. A total of 7 sliding bead monitors were installed at 5 PTO study sites. Five pairs of erosion pins were installed.
5.3 METHODS USED TO MEASURE FLOODPLAIN CONNECTIVITY
Floodplain connectivity was evaluated by measuring top wetted width following each of the test flow releases and by measuring flow depth with a staff gage during the test flow release. Test flow conditions were documented with photographs and video.
6.0 RESULTS
The sediment transport, bed surface elevation and floodplain connectivity results are summarized below. These results and associated conclusions were previously presented to the Big Creek ALP Plenary group on September 13, 2005. The presentation, which included numerous photographs, is included in Appendix B, for reference. Additional data and results are provided in Tables 2 through 8 and in Appendix C.
6.1 SEDIMENT TRANSPORT
6.1.1 ADJUSTABLE CHANNEL REACHES
All of the test flows mobilized surface tracer gravels (Table 2). Up to 65% of the placed tracer gravels were mobilized during the first test flow release of 425 cfs. During the 580 cfs test flow release, up to 81% of the tracer gravels were mobilized. During the 700 cfs test flow release, between 11% and 88% of the tracer gravels moved. At three of the nine study sites, more tracer gravels moved with each incremental increase in flow. At three of the other study sites, fewer tracer gravels were mobilized during the 425 cfs flow than at the 580 cfs and 700 cfs flow releases, but tracer gravel movement was similar at the two higher test flow releases. Lastly, tracer gravel movement did not differ, or decreased, with increases in flows at the remaining three study sites.
Subsurface gravel movement was also evaluated using tracer gravels at selected locations. No subsurface gravels moved during any of the test flow releases (Appendix B). These findings indicate that partial bed mobilization of coarse sand (<2 mm) to gravel sizes (>2 mm to 45 mm) occurred during all test flows but none of the flows were sufficient to provide full bed mobility.
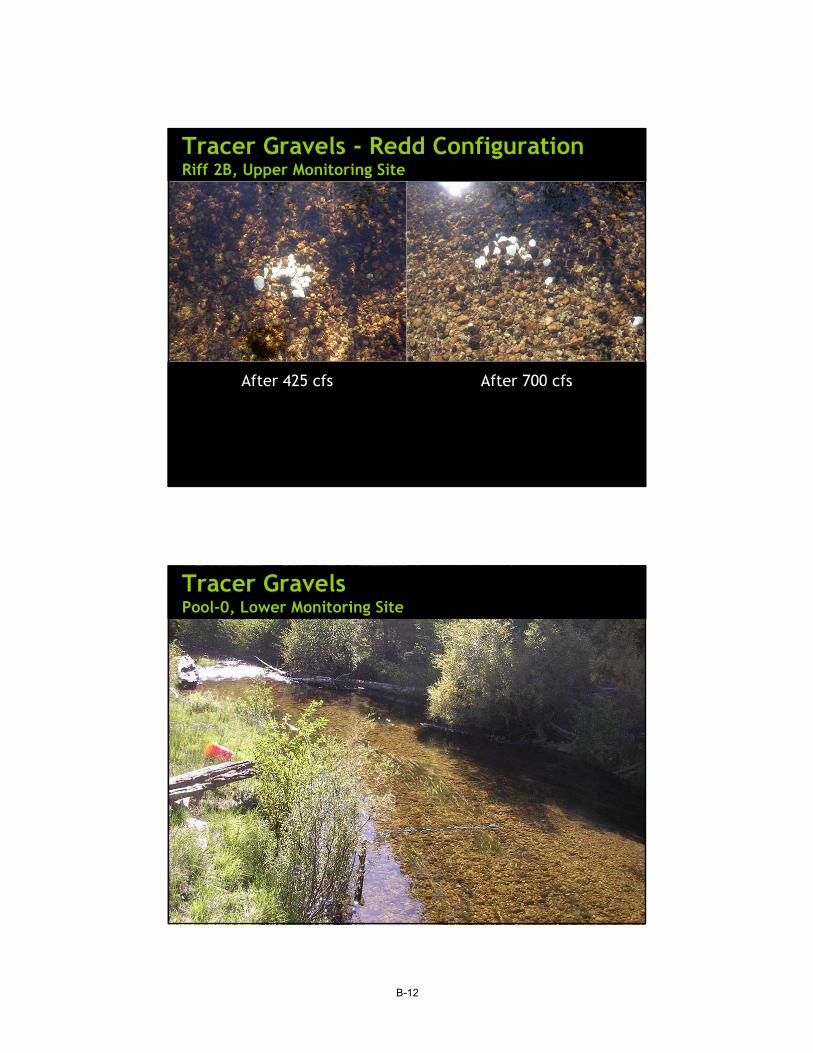
Partial mobilization of bar sediments was observed following the 580 cfs and 700 cfs test flow releases (Table 2). Tracer gravels were not installed on the bar surface in the upper monitoring reach prior to the 425 cfs test flow release. Forty-four percent and 40% of tracer gravels were partially mobilized during the 580 cfs and 700 cfs test flow releases, respectively. Sand was mobile during all three test flow releases based on observations of sand ripples left behind on the bar surface following recession of the
Mono Creek Sediment Transport and Floodplain Connectivity Study
FERC Project Nos. 2085, 2175, 67 and 120
Copyright 2005 by Southern California Edison Company 5 November 2005
flows. These findings indicate that partial mobilization of bar sediments occurred during the test flow releases.
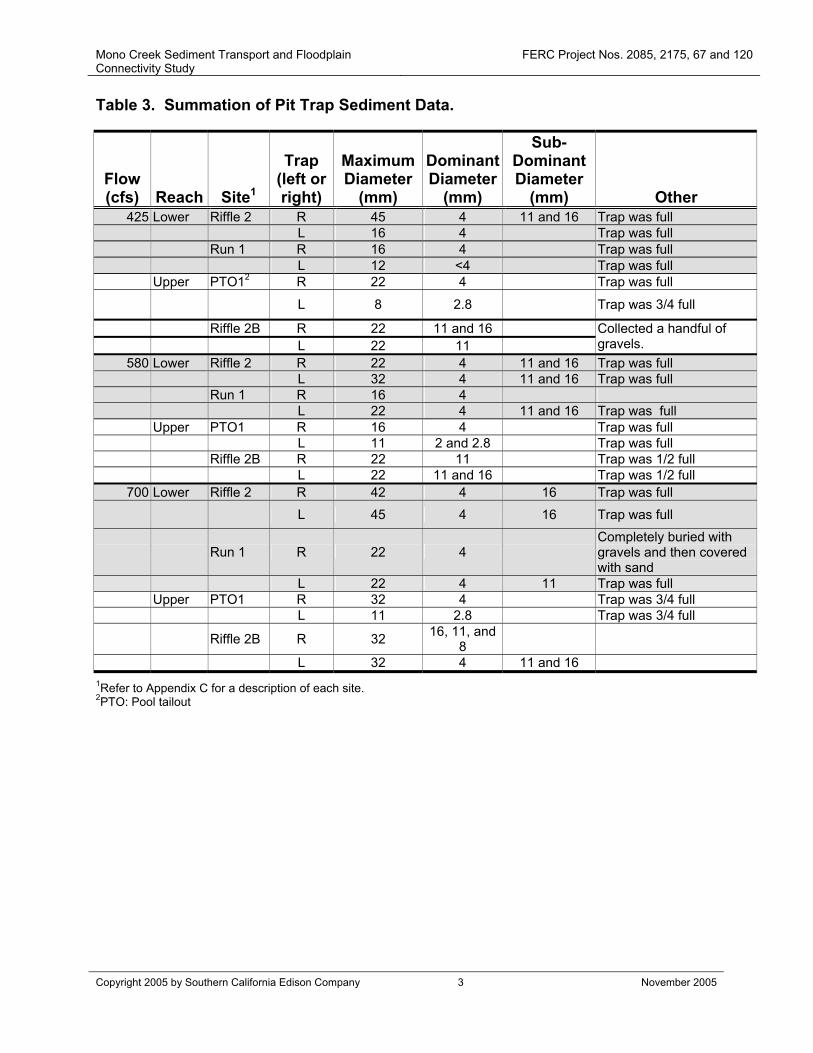
Almost all the pit traps were completely full of sediment following each of the test flow releases (except site Riffle 2B in the upper reach, which was usually about ½ full or less) (Table 3). This indicates that bedload was moving at all test flows in both adjustable reaches. The dominant particle size captured by the pit traps was usually 4mm (very fine gravel), and maximum particle sizes were typically between 16 and 22mm, and up to 45mm in some instances. There was no discernable difference in the amount of sediment captured, or the particle sizes mobilized, at any of the three test flows based on the pit trap data.
Total Sediment Load
Bedload transport rate, measured in the lower adjustable reach on the receding limb of the hydrograph, during the 580 cfs test flow release was 2.6 tons/day. Flows were dropping rapidly during the sampling, and it was impossible to determine the discharge from the gaging records, but the flow is roughly estimated to have been between 350 cfs to 250 cfs during the measurement. The largest particle size captured during this flow was 11mm, with most material in the coarse sand size range (<2 mm).
Bedload transport rate was 4.7 tons/day during the receding limb of the 700 cfs test flow release. Sampling was known to have begun at approximately 425 cfs (left over-bank), with most of the bedload samples collected at approximately 350 cfs to 400 cfs. Thus, most of the sampling occurred at a higher discharge than that during the receding limb of the 580 cfs release on the day before. The largest particle size captured during this flow was 16mm, with most material in the coarse sand size range (<2 mm).
These data clearly demonstrate that during the receding limb of the hydrograph, for flows less than 400 cfs to about 250 cfs:
• Bedload transport is occurring
• Most particle sizes in transport are in the sand size range
• Small gravels (up to 16 mm) represent the maximum particle size in transport
It is very reasonable to assume that during the peak 580 cfs and 700 cfs test releases, a considerably greater sediment load was in transport, and larger particle sizes were mobilized (as supported by the results of the pit traps and tracer gravels).
6.1.2 NON-ADJUSTABLE CHANNEL REACH
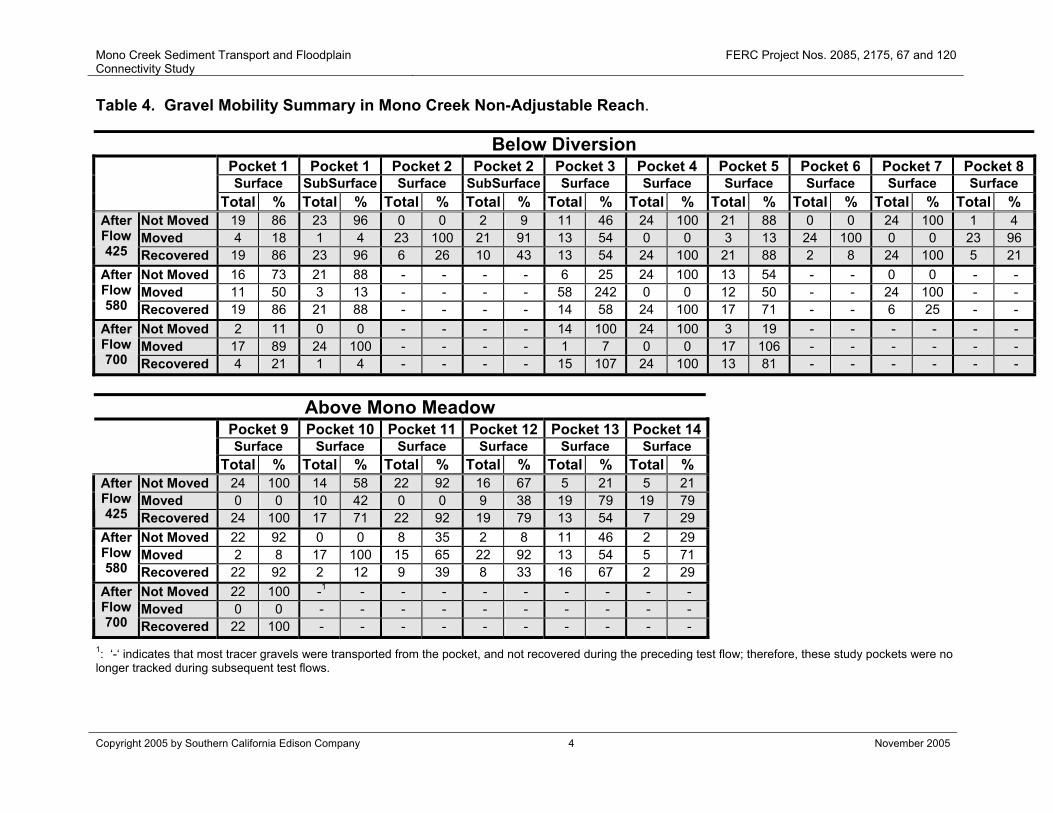
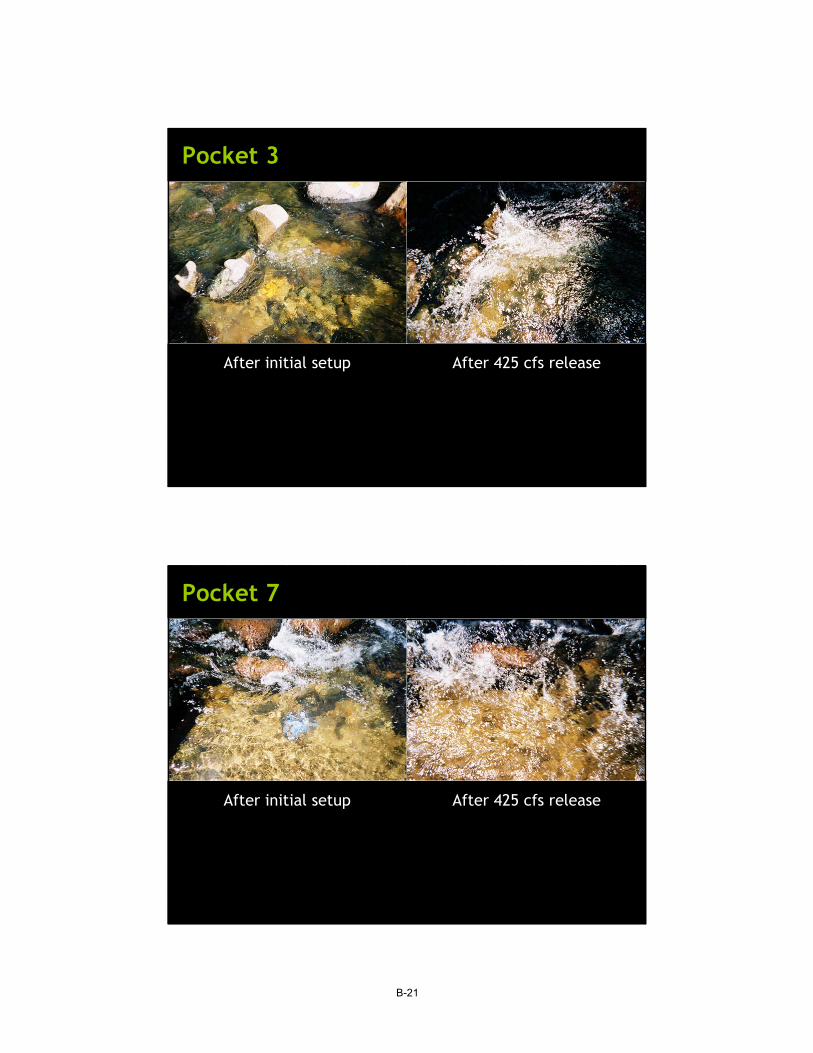
Substantial transport of sand and small gravel (<16 mm) was observed following the 425 cfs test flow release. Specifically, nine of 14 pockets were substantially disturbed. Significant gravel transport (including subsurface gravels) or turnover occurred at six of the pockets and three were buried by sand during the flow release (Table 4). Following the 580 cfs test flow releases, 11 of 14 pockets were substantially disturbed.
Mono Creek Sediment Transport and Floodplain Connectivity Study
FERC Project Nos. 2085, 2175, 67 and 120
Copyright 2005 by Southern California Edison Company 6 November 2005
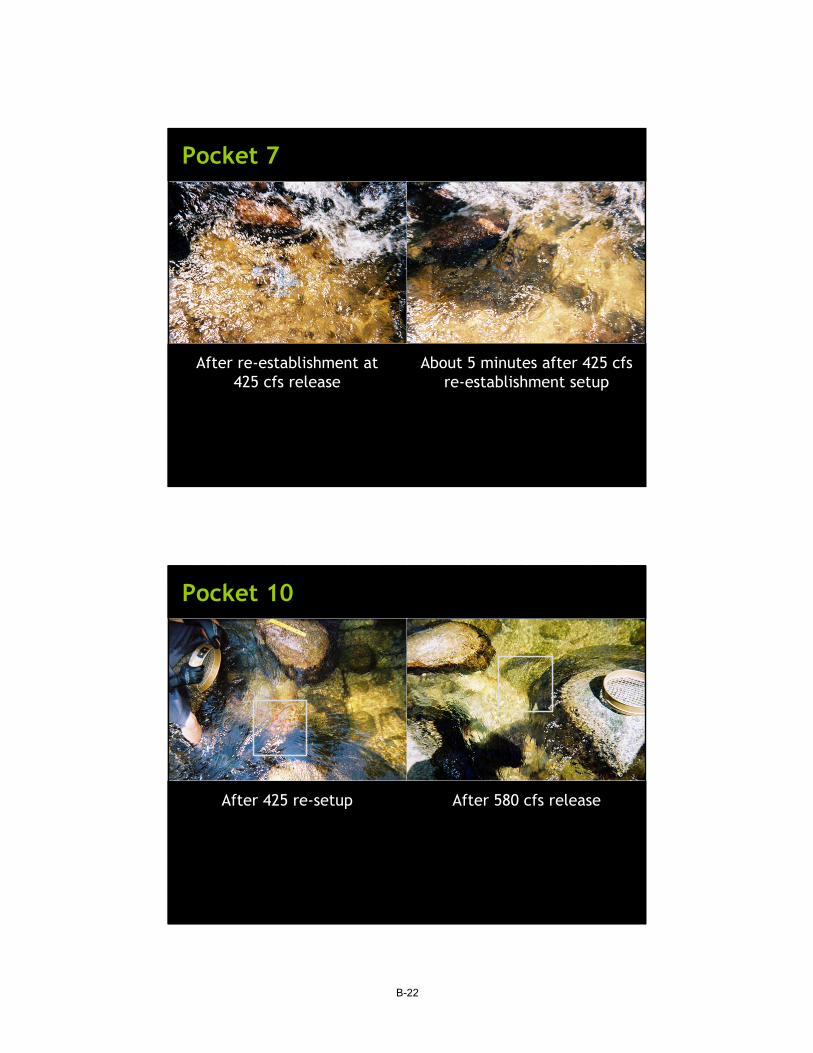
Observations indicated that gravels (>32 mm) and even cobbles were transported. The 700 cfs flow release caused significant gravel movement, with only one pocket remaining intact. This one pocket was located about 1.5 feet above the base flow water surface elevation on the bank, and was submerged at 450 cfs and greater flows.
6.2 CHANGES IN BED SURFACE ELEVATION
Changes in bed surface elevations following each of the test flows were measured in the adjustable study reaches using sliding bead monitors and erosion pins. Changes in bed surface elevations were not measured in the non-adjustable reaches.
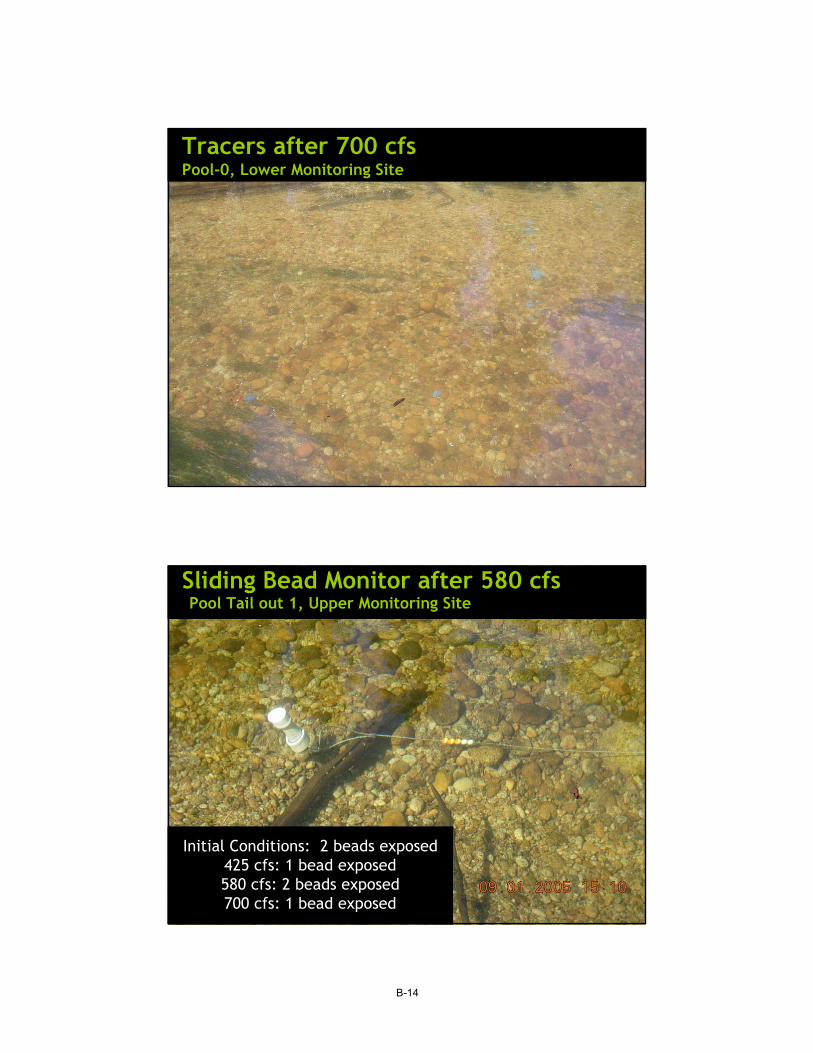
Net scour depth was measured at seven study sites using sliding bead monitors following each test flow release. As shown in Table 5, net incremental scour depths ranged from 0 to 1.5 inches. The estimated D50 bed material size (12 mm ≈ 0.5 inches) falls within the range of measured scoured depths. Net cumulative scour depths (total scour including the preceding test flow releases) ranged from 0 to 2.5 inches. The greatest net change in bed surface elevation occurred in a sand-dominated site located in the upper adjustable reach site identified as PTO1 (refer to Appendix C for grain size data). Net scour and deposition were not uniform across the bed at any site or flow.
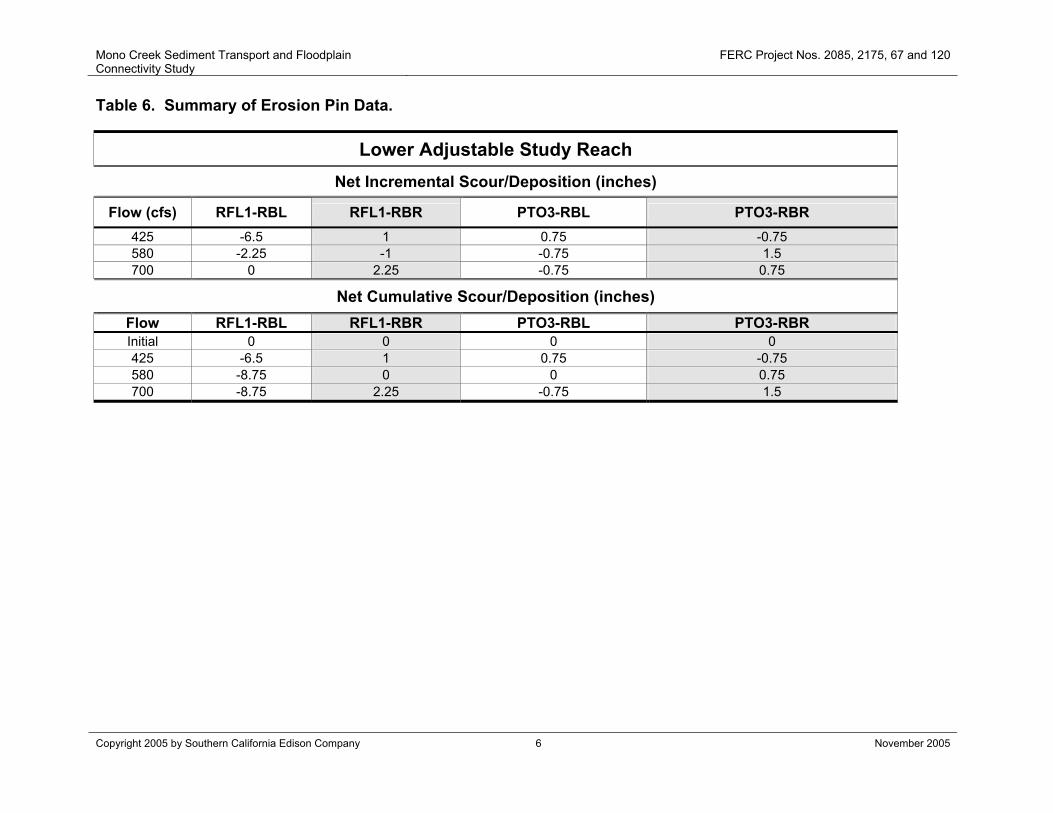
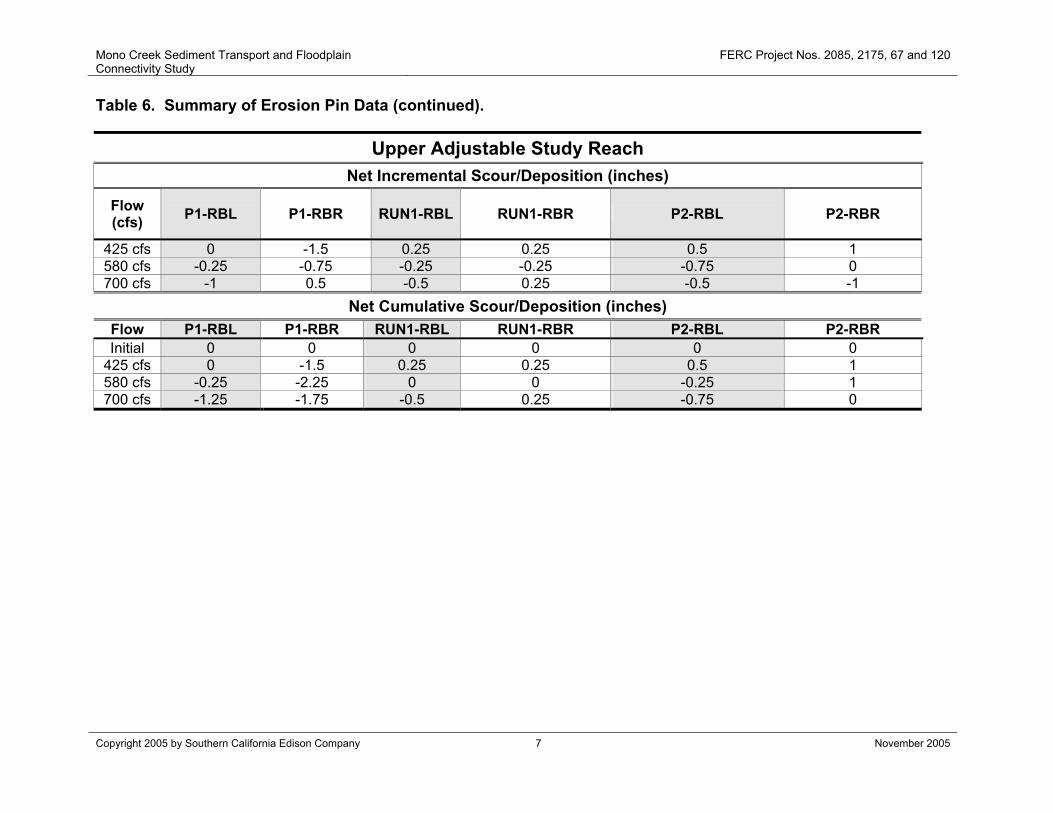
Net scour/deposition depth was measured using five sets of erosion pins. As shown in Table 6, net incremental scour ranged from 0 to 2.25 inches, except at a sand dominated site, RFL1-RBL, where 6.5 inches of scour was measured following the 425 cfs test flow release. Net incremental deposition ranged from 0 to 2.25 inches. The net cumulative change in bed surface elevation ranged from 8.75 inches of scour in sandy substrate (RFL1-RBL) to 2.25 inches of deposition at RFL1-RBR, (gravel dominant). Net cumulative change (scour or deposition) was generally 0.75 to 1 inches. The results of the net change in bed elevation data and the tracer gravel data indicate that a surface layer of the bed material was likely mobilized during all three test flows, but most subsurface material was not mobilized.
6.3 RELATED OBSERVATIONS
In addition to the previously discussed measurement of sediment transport and changes in bed surface elevation, a number of incidental observations were made during and following the test flow releases. These observations, including transport and accumulation of large wood debris and bank erosion, are summarized below.
6.3.1 LARGE WOODY DEBRIS
Large woody debris (LWD) was transported at all test flow releases. A relatively greater amount of LWD transport was observed following the 700 cfs release, but this could be the result of cumulative effects from the two preceding test flows (425 cfs and 580 cfs) (Figure 3).
Mono Creek Sediment Transport and Floodplain Connectivity Study
FERC Project Nos. 2085, 2175, 67 and 120
Copyright 2005 by Southern California Edison Company 7 November 2005
6.3.2 BANK EROSION
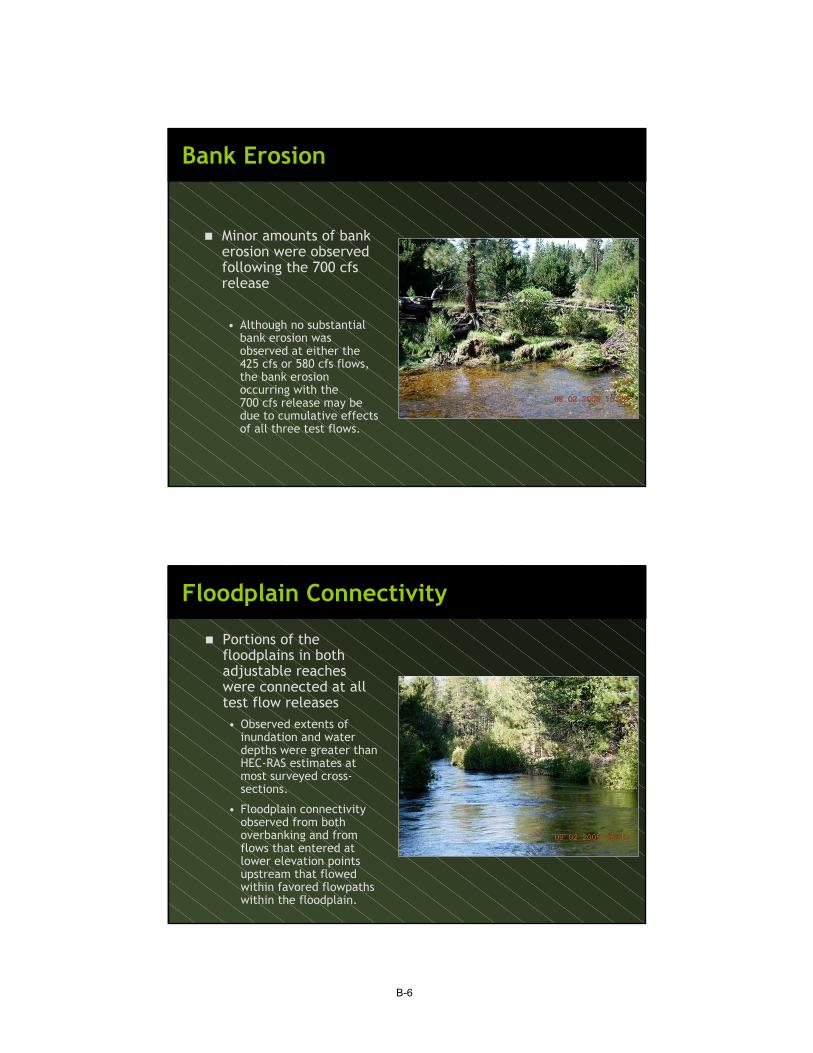
Minor bank erosion was observed in a few locations following the 700 cfs test flow release, often in association with LWD movement (Figure 4). Although substantial bank erosion was not observed at either the 425 cfs and 580 cfs flows, bank erosion observed after the 700 cfs release may be due to cumulative effects of all 3 test flows.
6.4 FLOODPLAIN CONNECTIVITY
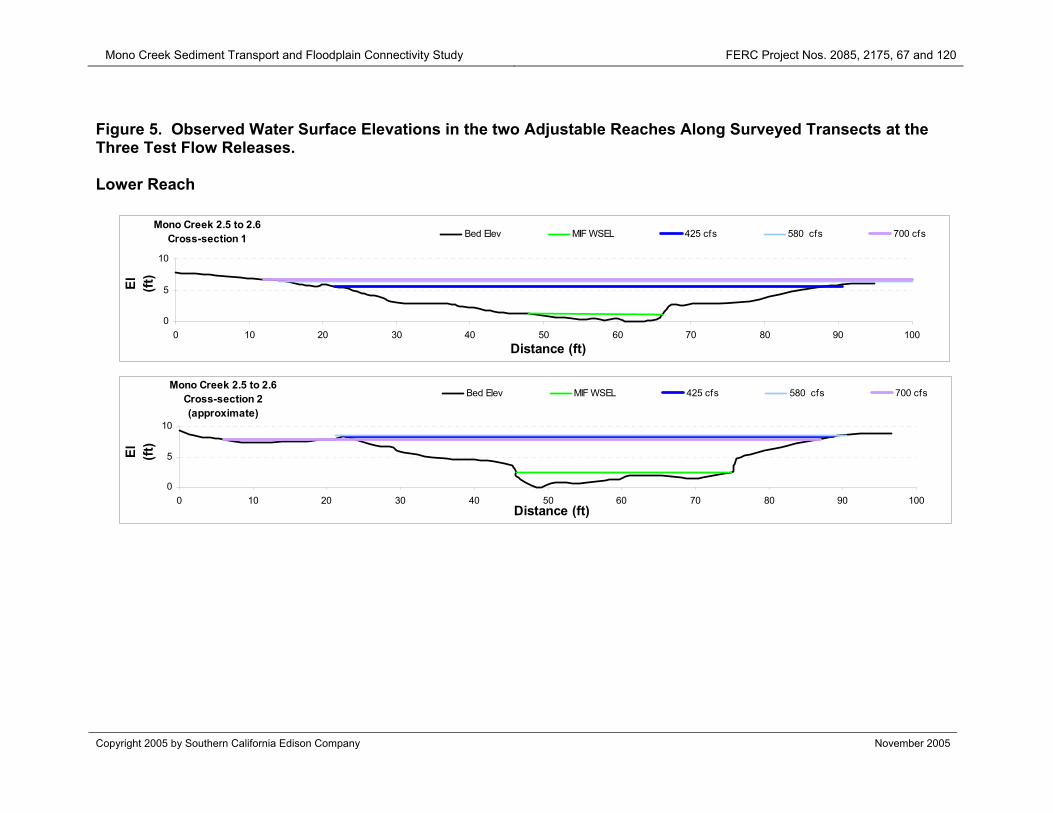
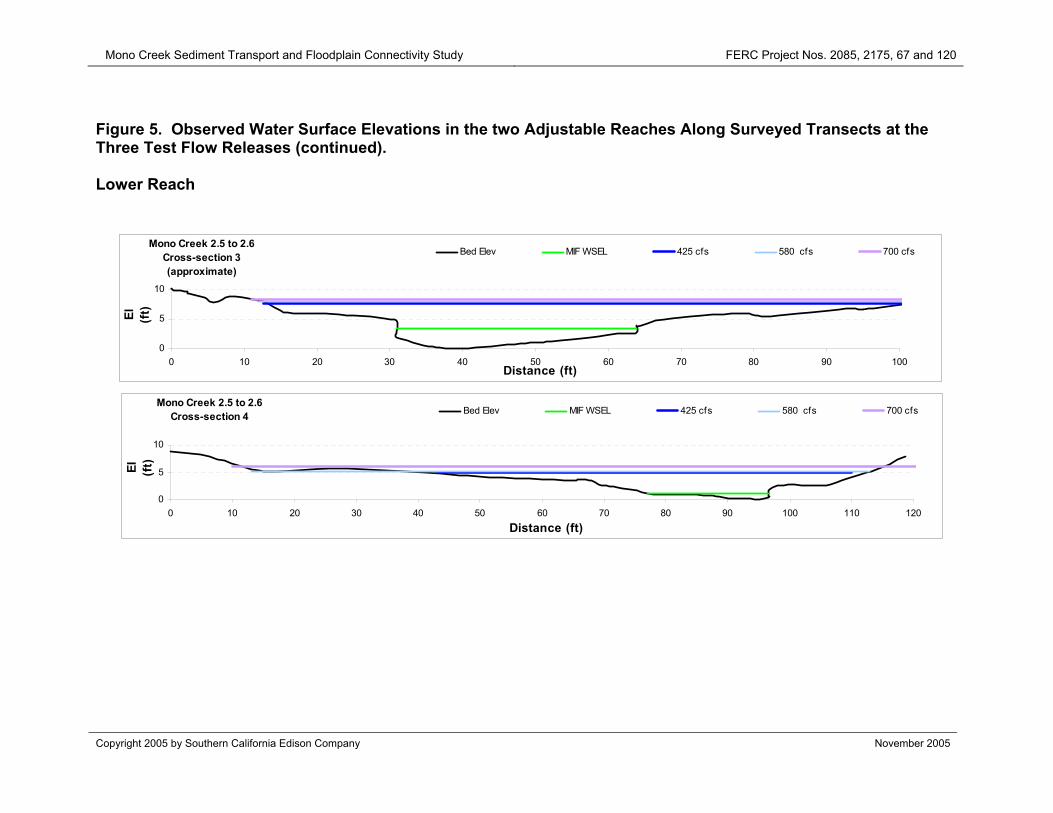
Floodplain connectivity was evaluated in the two adjustable study reaches. Wetted-width measurements were conducted at the same locations as those used for the hydraulic modeling performed during earlier studies (refer to CAWG 2, Geomorphology, 2003 TSR (SCE 2004)), following the test flow releases. Portions of the floodplain were connected at all test flow releases. Observed wetted widths and water depths for each of the test flow releases were greater than indicated by the hydraulic modeling at most of the surveyed cross-sections. Cross-sections with observed wetted widths at the three test flow releases are shown in Figure 5.
6.4.1 WETTED WIDTH
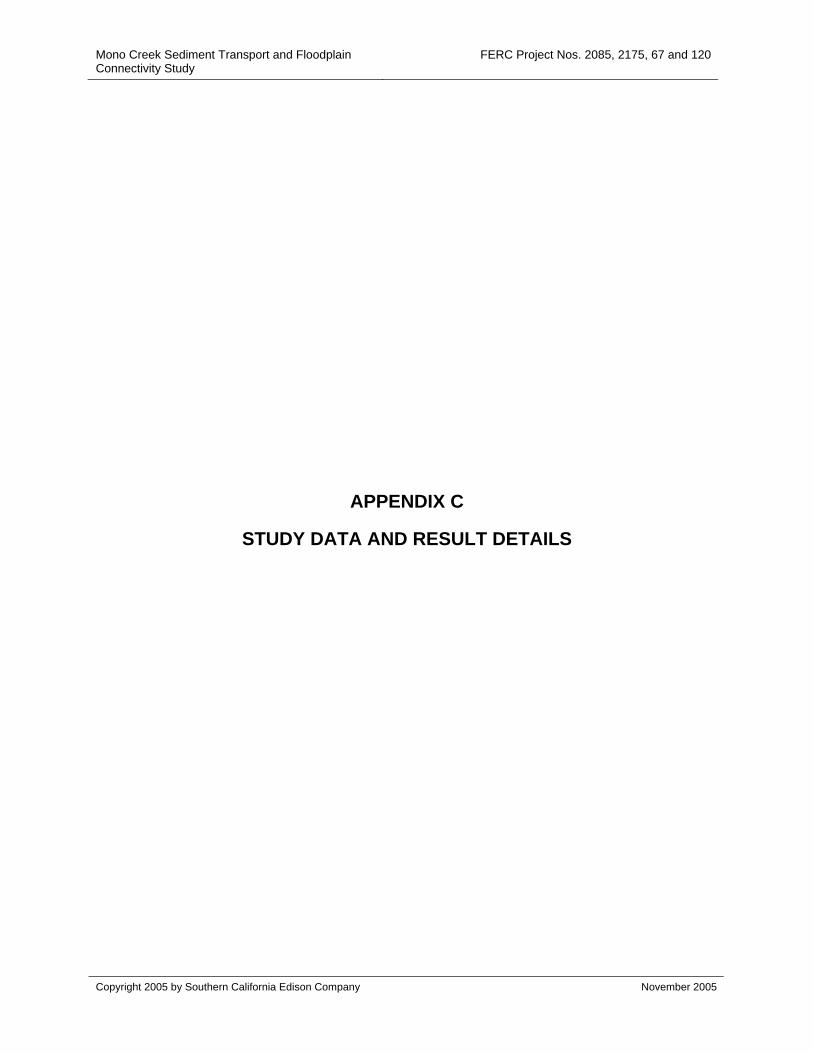
Floodplain inundation occurred both as a result of overbanking (as modeled with HEC-RAS) and as a result of flows that entered onto the floodplain at points upstream where bank elevations are lower. Once water entered onto the floodplain surface at an upstream point, it then flowed downstream over the floodplain surface within favored flow paths. The extent of inundation at each site and with increases in flow is controlled by local variations in topography and width of the valley floor. The increase in wetted width measured with each subsequent test flow release was greater in the upstream adjustable study reach than in the downstream adjustable study reach (Table 7). Encroached mature vegetation was inundated at all test flows. Figure 6 shows mature vegetation Inundated at the 580 cfs test flow.
6.4.2 DEPTH
Flow depth increased by 6.7 inches on average (6 inch median) during each of the test flow releases at all of the sites in both of the adjustable study reaches. The largest increases in water depth in both reaches were observed as flows increased from initial conditions to 425 cfs, as areas near the channel were initially inundated (with the greatest incremental change in flow magnitude). In the lower reach, incremental increases in flow depth were greatest when flows were increased from initial conditions (0 inches) to 425 cfs (12 inches) and 580 cfs (11.3) inches. In the upper reach, incremental increases in flow depth were greatest when flows were increased from initial conditions to 425 cfs (19.9 inches). In both reaches, depths increased by approximately 5 inches when flow magnitudes increased from 580 cfs to 700 cfs (Table 8).
Mono Creek Sediment Transport and Floodplain Connectivity Study
FERC Project Nos. 2085, 2175, 67 and 120
Copyright 2005 by Southern California Edison Company 8 November 2005
7.0 CONCLUSIONS
Differences in mobility and transport of bed sediments were not significant between the three test flow releases. The D50 particle size (small gravel) was clearly mobilized during all three test flows. Some larger bed material (large gravel up to 64 mm) was also mobilized. Surface bed material was entrained at each test flow release, with scour depths roughly equal to the D50 bed particle size (12mm) in the adjustable channel reaches. Partial bed mobility was achieved in the adjustable reach during all three test flows, but full mobility was never observed. Full bed mobility can be a relatively rare event, requiring flows that have much higher than a 2-year flood frequency (Haschenburger and Wilcock 2003). Total sediment load transport associated with the 700 cfs test flow releases was likely greater than that which occurred during the 580 cfs and 425 cfs test flow releases. This difference, however, could not be quantified as part of this study.
In the non-adjustable reach, all three test flows scoured pocket gravels. Most pocket gravels were disrupted to the extent that incubation would not be successful at any of the test flows. Furthermore, the findings indicate that incubation in the majority of the spawnable gravels could substantially be disrupted by flows as low as 425 cfs. The non-adjustable reach represents 88% of the Mono Creek channel below the diversion. Therefore, the recruitment of native trout would likely decrease if flows frequently exceed 425 cfs.
Sandy slopes along the channel immediately below Mono Diversion appear to be a source of fine sediment recruitment to the channel. There is the potential that as flow releases from the Mono Diversion increase, these sediment sources become more active, recruiting additional fine sediment to the channel. It is unknown whether sediments can be effectively flushed from the channel bed, considering the existing infrastructure constraints. Flows exceeding 400 cfs will definitely transport gravel and sand. However, the net change in fine sediment in the interstices of gravels and in pools may remain unchanged as additional sand is recruited to the channel. Erosion pin data and general observations made during the test flow releases indicate that some portions of the bed scour while new sand is deposited on other parts of the bed. Flushing of sand and mobilization of gravels is very likely not a uniform process over the channel bed.
Portions of the floodplain and bars were connected at all three test flow releases as a result of flows entering into the floodplains at lower elevation points upstream and flowing within favored flow paths within the floodplain, and flow overbanking. As a result, wetted width and depths at the test flow releases were greater than predicted by the hydraulic modeling. In general, wetted width increased with greater flow magnitudes. However, comparatively minor changes in wetted width were noted in the lower reach as flows were increased from 580 cfs to 700 cfs due to the width of the valley bottom and local topography. Encroached vegetation was inundated at all three test flow releases.
Mono Creek Sediment Transport and Floodplain Connectivity Study
FERC Project Nos. 2085, 2175, 67 and 120
Copyright 2005 by Southern California Edison Company 9 November 2005
8.0 REFERENCES
Haschenburger, J. K., and P. R. Wilcock. 2003. Partial transport in a natural gravel-bed channel. Water Resource Research 39:1020.
Lisle, T. E., and R. E. Eads. 1991. Methods to measure sedimentation of spawning gravels. USDA Forest Service Research Note PSW-411.
Nawa, R. K., and C. A. Frissell. 1993. Measuring scour and fill of gravel streambeds with scour chains and sliding-bead monitors. North American Journal of Fisheries Management 13:634-639.
Schuett-Hames, D., B. Conrad, A. Pleus, and K. Lautz. 1996. Literature review and monitoring recommendations for salmonid spawning gravel scour. Northwest Indian Fisheries Commission, Timber-Fish-Wildlife (TFW)-AM-9-96-001.
Schuett-Hames, D., B. Conrad, A. Pleus, and K. Lautz. 1999. TFW Monitoring Program Method Manual for the Salmonid Spawning Gravel Scour Survey. NW Indian Fisheries Commission TFW-AM9-99-008.
Southern California Edison. 2004. CAWG 2, Geomorphology, 2003 Final Technical Study Report Package for the Big Creek Hydroelectric System Alternative Licensing Process. December 2004.
Southern California Edison. 2004. CAWG 2, Geomorphology, 2003 Final Technical Study Report Package for the Big Creek Hydroelectric System Alternative Licensing Process. December 2004.
Wilcock, P.R., S.T. Kenworth, and J.C. Crowe. 2001. Experimental study of the transport of mixed sand and gravel. Water Resources Research, Vol. 37, No. 12, pgs. 3349-3358, December 2001.
Mono Creek Sediment Transport and Floodplain Connectivity Study
FERC Project Nos. 2085, 2175, 67 and 120
Copyright 2005 by Southern California Edison Company November 2005
TABLES
Mono Creek Sediment Transport and Floodplain Connectivity Study
FERC Project Nos. 2085, 2175, 67 and 120
Copyright 2005 by Southern California Edison Company 1 November 2005
Table 1. Study Methods for Adjustable Study Reaches.
Study Reach
Methodology
Morphologic Feature
Pit Traps (paired)
Tracer Gravels
Helley-Smith Sampler
Sliding Bead Monitors
Erosion Pins (paired)
Staff Gages
Pool 1 X Pool Tailout 1 X 2 Riffle 1 X1 Run 1 X Riffle 2A X1 1 Riffle 2B X X2 4 Pool 2 X1 Bar at Pool 2 X1
Upper Adjustable Reach
Pool Tailout 2 1 X Riffle 1 X 2 Pool 0 X1 Riffle 2 X X1 X 3 Pool Tailout 1 X1 2 Pool Tailout 2 1 Pool Tailout 3 X2 1 X 1
Lower Adjustable Reach
Run 1 X 1Tracer gravels placed in transect across channel. 2Tracer gravels placed to emulate salmonid redd with surface and subsurface painted gravels.
Mono Creek Sediment Transport and Floodplain Connectivity Study
FERC Project Nos. 2085, 2175, 67 and 120
Copyright 2005 by Southern California Edison Company 2 November 2005
Table 2. Gravel Mobility Summary in Mono Creek Adjustable Reaches.
Upper Adjustable Study Reach RFL 1 RFL 2A RFL 2B RFL 2B -Bar POOL 2 Total % Total % Total % Total % Total % Not Moved 16 48 36 69 37 100 - - 20 71 Moved 17 52 16 31 0 0 - - 8 29
After Flow 425 Recovered 31 94 49 94 37 100 - - 27 96
Not Moved 6 19 14 29 37 100 14 56 14 52 Moved 25 81 37 76 0 0 11 44 14 52
After Flow 580 Recovered 30 97 51 100 37 100 25 100 16 59
Not Moved 8 27 9 18 33 89 15 60 2 13 Moved 22 73 42 82 4 11 10 40 14 88
After Flow 700 Recovered 24 80 46 90 35 95 25 100 13 81
Lower Adjustable Study Reach POOL 0 PTO 1 RFL 2 PTO 3 Total % Total % Total % Total % Not Moved 15 32 47 84 31 62 48 98 Moved 32 68 9 16 19 38 1 2
After Flow 425 Recovered 37 79 54 96 42 84 49 100
Not Moved 15 41 31 57 34 81 49 100 Moved 22 59 23 43 9 21 12 24
After Flow 580 Recovered 36 97 52 96 43 100 49 100
Not Moved 14 39 24 46 26 60 22 45 Moved 23 64 28 54 17 40 27 55
After Flow 700 Recovered 37 103 50 96 37 86 33 67
Mono Creek Sediment Transport and Floodplain Connectivity Study
FERC Project Nos. 2085, 2175, 67 and 120
Copyright 2005 by Southern California Edison Company 3 November 2005
Table 3. Summation of Pit Trap Sediment Data.
Flow (cfs) Reach Site1
Trap (left or right)
Maximum Diameter
(mm)
Dominant Diameter
(mm)
Sub-Dominant Diameter
(mm) Other 425 Lower Riffle 2 R 45 4 11 and 16 Trap was full
L 16 4 Trap was full Run 1 R 16 4 Trap was full L 12 <4 Trap was full Upper PTO12 R 22 4 Trap was full
L 8 2.8 Trap was 3/4 full
Riffle 2B R 22 11 and 16 L 22 11
Collected a handful of gravels.
580 Lower Riffle 2 R 22 4 11 and 16 Trap was full L 32 4 11 and 16 Trap was full Run 1 R 16 4 L 22 4 11 and 16 Trap was full Upper PTO1 R 16 4 Trap was full L 11 2 and 2.8 Trap was full Riffle 2B R 22 11 Trap was 1/2 full L 22 11 and 16 Trap was 1/2 full
700 Lower Riffle 2 R 42 4 16 Trap was full
L 45 4 16 Trap was full
Run 1 R 22 4 Completely buried with gravels and then covered with sand
L 22 4 11 Trap was full Upper PTO1 R 32 4 Trap was 3/4 full L 11 2.8 Trap was 3/4 full
Riffle 2B R 32 16, 11, and 8
L 32 4 11 and 16 1Refer to Appendix C for a description of each site. 2PTO: Pool tailout
Mono Creek Sediment Transport and Floodplain Connectivity Study
FERC Project Nos. 2085, 2175, 67 and 120
Copyright 2005 by Southern California Edison Company 4 November 2005
Table 4. Gravel Mobility Summary in Mono Creek Non-Adjustable Reach.
Below Diversion Pocket 1 Pocket 1 Pocket 2 Pocket 2 Pocket 3 Pocket 4 Pocket 5 Pocket 6 Pocket 7 Pocket 8 Surface SubSurface Surface SubSurface Surface Surface Surface Surface Surface Surface Total % Total % Total % Total % Total % Total % Total % Total % Total % Total % Not Moved 19 86 23 96 0 0 2 9 11 46 24 100 21 88 0 0 24 100 1 4 Moved 4 18 1 4 23 100 21 91 13 54 0 0 3 13 24 100 0 0 23 96
After Flow 425 Recovered 19 86 23 96 6 26 10 43 13 54 24 100 21 88 2 8 24 100 5 21
Not Moved 16 73 21 88 - - - - 6 25 24 100 13 54 - - 0 0 - - Moved 11 50 3 13 - - - - 58 242 0 0 12 50 - - 24 100 - -
After Flow 580 Recovered 19 86 21 88 - - - - 14 58 24 100 17 71 - - 6 25 - -
Not Moved 2 11 0 0 - - - - 14 100 24 100 3 19 - - - - - - Moved 17 89 24 100 - - - - 1 7 0 0 17 106 - - - - - -
After Flow 700 Recovered 4 21 1 4 - - - - 15 107 24 100 13 81 - - - - - -
Above Mono Meadow
Pocket 9 Pocket 10 Pocket 11 Pocket 12 Pocket 13 Pocket 14Surface Surface Surface Surface Surface Surface
Total % Total % Total % Total % Total % Total % Not Moved 24 100 14 58 22 92 16 67 5 21 5 21 Moved 0 0 10 42 0 0 9 38 19 79 19 79
After Flow 425 Recovered 24 100 17 71 22 92 19 79 13 54 7 29
Not Moved 22 92 0 0 8 35 2 8 11 46 2 29 Moved 2 8 17 100 15 65 22 92 13 54 5 71
After Flow 580 Recovered 22 92 2 12 9 39 8 33 16 67 2 29
Not Moved 22 100 -1 - - - - - - - - - Moved 0 0 - - - - - - - - - -
After Flow 700 Recovered 22 100 - - - - - - - - - -
1: ‘-‘ indicates that most tracer gravels were transported from the pocket, and not recovered during the preceding test flow; therefore, these study pockets were no longer tracked during subsequent test flows.

Mono Creek Sediment Transport and Floodplain Connectivity Study
FERC Project Nos. 2085, 2175, 67 and 120
Copyright 2005 by Southern California Edison Company 5 November 2005
Table 5. Net Scour as Measured with Sliding Bead Monitors.
Lower Adjustable Study Reach Net Incremental Scour (inches)
Flow (cfs) PTO1-SBL1 PTO1-SBR PTO2-SBR PTO3-RBL
425 -0.5 0 -0.5 0 580 -1 0 0 0 700 0 0 0 -0.5
Net Cumulative Scour (inches) Flow PTO1-SBL PTO1-SBR PTO2-SBR PTO3-RBL Initial 0 0 0 0 425 -0.5 0 -0.5 0 580 -1.5 0 -0.5 0 700 -1.5 0 -0.5 -0.5
Upper Adjustable Study Reach
Net Incremental Scour (inches) Flow (cfs) PTO1-SBL PTO1-SBR PTO2-SBR
425 -0.5 0 -1 580 -1.5 0 -0.5 700 -0.5 0 0
Net Cumulative Scour (inches) Flow PTO1-SBL PTO1-SBR PTO2-SBR Initial 0 0 0 425 -0.5 0 -1 580 -2 0 -1.5 700 -2.5 0 -1.5
1Negative values indicate net erosion
Mono Creek Sediment Transport and Floodplain Connectivity Study
FERC Project Nos. 2085, 2175, 67 and 120
Copyright 2005 by Southern California Edison Company 6 November 2005
Table 6. Summary of Erosion Pin Data.
Lower Adjustable Study Reach
Net Incremental Scour/Deposition (inches)
Flow (cfs) RFL1-RBL RFL1-RBR PTO3-RBL PTO3-RBR 425 -6.5 1 0.75 -0.75 580 -2.25 -1 -0.75 1.5 700 0 2.25 -0.75 0.75
Net Cumulative Scour/Deposition (inches) Flow RFL1-RBL RFL1-RBR PTO3-RBL PTO3-RBR Initial 0 0 0 0 425 -6.5 1 0.75 -0.75 580 -8.75 0 0 0.75 700 -8.75 2.25 -0.75 1.5
Mono Creek Sediment Transport and Floodplain Connectivity Study
FERC Project Nos. 2085, 2175, 67 and 120
Copyright 2005 by Southern California Edison Company 7 November 2005
Table 6. Summary of Erosion Pin Data (continued).
Upper Adjustable Study Reach Net Incremental Scour/Deposition (inches)
Flow (cfs) P1-RBL P1-RBR RUN1-RBL RUN1-RBR P2-RBL P2-RBR
425 cfs 0 -1.5 0.25 0.25 0.5 1 580 cfs -0.25 -0.75 -0.25 -0.25 -0.75 0 700 cfs -1 0.5 -0.5 0.25 -0.5 -1
Net Cumulative Scour/Deposition (inches) Flow P1-RBL P1-RBR RUN1-RBL RUN1-RBR P2-RBL P2-RBR Initial 0 0 0 0 0 0
425 cfs 0 -1.5 0.25 0.25 0.5 1 580 cfs -0.25 -2.25 0 0 -0.25 1 700 cfs -1.25 -1.75 -0.5 0.25 -0.75 0
Mono Creek Sediment Transport and Floodplain Connectivity Study
FERC Project Nos. 2085, 2175, 67 and 120
Copyright 2005 by Southern California Edison Company 8 November 2005
Table 7. Observed Changes in Wetted Width at Test Flow Releases.
Upper Adjustable Study Reach 1
Transect Flow (cfs) Observed Total Width (ft)
Modeled Width (ft)
Incremental Change in Width (ft)
425 68 30
580 72 32 4 1
700 165 47 93 425 76 48
580 89 56 13 2
700 189 75 100 425 100.5 100
580 215 95 114.5 3
700 232 100 17
Lower Adjustable Study Reach
Transect Flow (cfs) Observed Total Width (ft)
Modeled Width (ft)
Incremental Change in Width (ft)
425 69 56 580 86 60 17 1 700 86 67 0 425 63 49 580 64 50 1 2 700 86 58 22 425 86 70 580 86 77 0 3 700 86 82 0
425 67 58 580 99 65 32 4 700 117.5 74 18.5
1Transect numbers refer to transects surveyed as part of CAWG 2, Geomorphology 2003 TSR (SCE 2004).
Mono Creek Sediment Transport and Floodplain Connectivity Study
FERC Project Nos. 2085, 2175, 67 and 120
Copyright 2005 by Southern California Edison Company 9 November 2005
Table 8. Summary of Changes in Water Surface Elevations. Lower Adjustable Study Reach
Measurement (inches) Flow (cfs) RFL1-R1
4.9 ft1 RFL1-R2
21.3 ft RFL2-L12
4.9 ft RFL2-L22
24.6 ft RFL2-L32
39.3 PTO3-L13
18.0 ft Initial 0 0 0 0 0 0 425 18 13 29.5 6 0 6 580 38 29.5 37 15 7 14 700 42 24.5 43 20 12 19
Incremental Change in Water Surface Elevation (inches) Flow RFL1-R1 RFL1-R2 RFL2-L1 RFL2-L2 RFL2-L3 PTO3-L1 AVERAGE 425 18 13 29.5 6 0 6 12 580 20 16.5 7.5 9 7 8 11.3 700 4 -54 6 5 5 5 57
Upper Adjustable Study Reach Measurement (inches)
Flow (cfs) RFL2B-R1 41.0 ft1
RFL2B -R25 70.5 ft
RFL2B -L15
8.2 ft RFL2B-L25,6
23.0 ft RFL2A –L1
3.28 ft Initial 0 0 0 0 0 425 36 0 30.5 0 33 580 38 1 32.75 7 40.5 700 42 8.5 37.5 11.5 destroyed
Incremental Change in Water Surface Elevation (inches) Flow RFL2B-R1 RFL2B -R2 RFL2B -L1 RFL2B -L2 RFL2A –L1 AVERAGE 425 36 0 30.5 0 33 19.9 580 2 1 2.25 7 7.5 4.0 700 4 7.5 4.75 4.5 destroyed 5.2
1 Distance from minimum instream flow water’s edge 2 Surveyed transect 3, lower reach (CAWG 2, Geomorphology 2003 TSR (SCE 2004). 3 Surveyed transect 1, lower reach (CAWG 2, Geomorphology 2003 TSR (SCE 2004). 4 Water surface elevation was lower at the higher flow. Explanation is unknown. 5 Surveyed transect 3, upper reach (CAWG 2, Geomorphology 2003 TSR (SCE 2004). 6 Wet ground around the gage during 425 cfs test flow release, gage is located on slightly raised area. 7 Average calculation does not include measurement from RFL1-R2 at 700 cfs.
Mono Creek Sediment Transport and Floodplain Connectivity Study
FERC Project Nos. 2085, 2175, 67 and 120
Copyright 2005 by Southern California Edison Company November 2005
FIGURES

Mono Creek Sediment Transport and Floodplain Connectivity Study
FERC Project Nos. 2085, 2175, 67 and 120
Copyright 2005 by Southern California Edison Company November 2005
Placeholder for Figure 1 Study Location Map
Non-Internet Public Information
This Figure has been removed in accordance with the Commission regulations at 18 CFR Section 388.112.
This Figure is considered Non-Internet Public information and should not be posted on the Internet. This information is provided in Volume 4 of the Application for New License and is identified as “Non-Internet Public” information. This information may be accessed from the FERC’s Public Reference Room, but is not expected to be posted on the Commission’s electronic library, except as an indexed item.
Mono Creek Sediment Transport and Floodplain Connectivity Study
FERC Project Nos. 2085, 2175, 67 and 120
Copyright 2005 by Southern California Edison Company November 2005
Figure 2. Mono Creek Study Test Flow Releases (August 30, 2005 to September 2, 2005).
Mono Creek Study Test Flow Releases
0
100
200
300
400
500
600
700
800
900
8/30/2
005 6
:30:00
8/30/2
005 1
1:00:0
0
8/30/2
005 1
5:30:0
0
8/30/2
005 2
0:00:0
0
8/31/2
005 0
:30:00
8/31/2
005 5
:00:00
8/31/2
005 9
:30:00
8/31/2
005 1
4:00:0
0
8/31/2
005 1
8:30:0
0
8/31/2
005 2
3:00:0
0
9/1/20
05 3:
30:00
9/1/20
05 8:
00:00
9/1/20
05 12
:30:00
9/1/20
05 17
:00:00
9/1/20
05 21
:30:00
9/2/20
05 2:
00:00
9/2/20
05 6:
30:00
9/2/20
05 11
:00:00
Date-Time
Dis
char
ge (c
fs)
Discharge (cfs)
Mono Creek Sediment Transport and Floodplain Connectivity Study
FERC Project Nos. 2085, 2175, 67 and 120
Copyright 2005 by Southern California Edison Company November 2005
Figure 3. Large Woody Debris Deposited on Bars During and Following 580 cfs (left photo) and 700 cfs (right photo) Test Flow Releases.
Mono Creek Sediment Transport and Floodplain Connectivity Study
FERC Project Nos. 2085, 2175, 67 and 120
Copyright 2005 by Southern California Edison Company November 2005
Figure 4. Bank Erosion Observed on Left Bank at Upper Adjustable Reach Following the 700 cfs Test Flow Release. (Note that some of the erosion in the photograph existed prior to this study).
Mono Creek Sediment Transport and Floodplain Connectivity Study FERC Project Nos. 2085, 2175, 67 and 120
Copyright 2005 by Southern California Edison Company November 2005
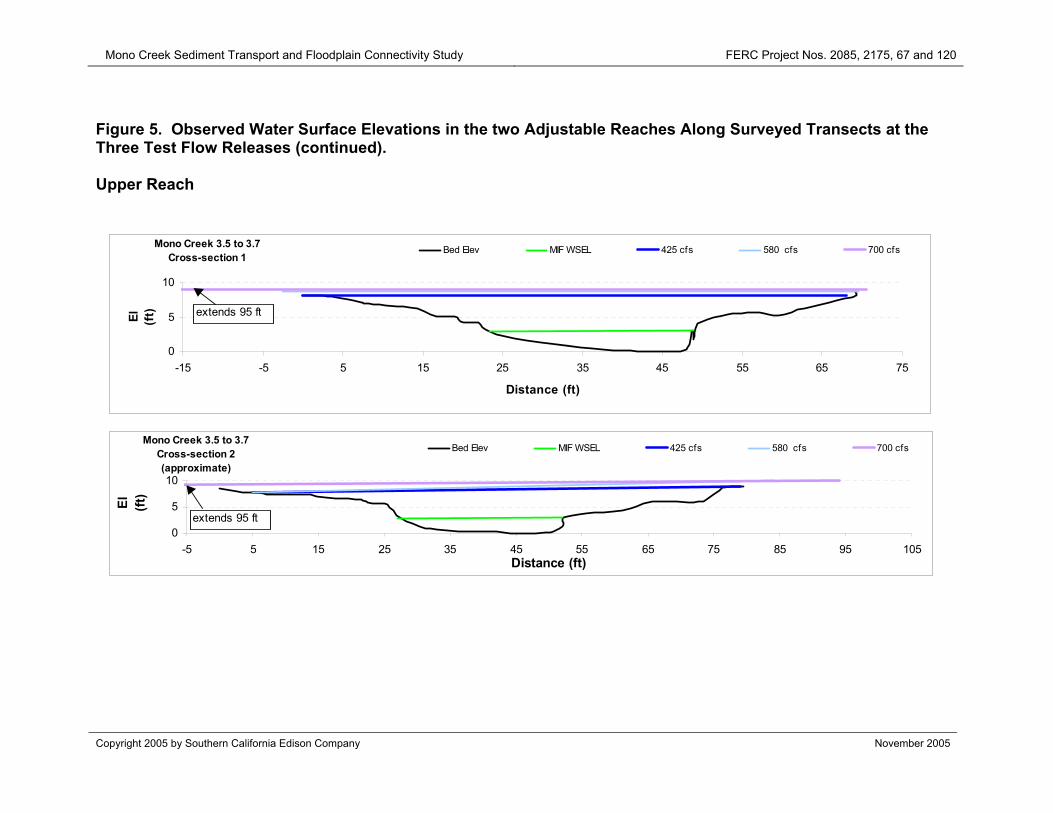
Figure 5. Observed Water Surface Elevations in the two Adjustable Reaches Along Surveyed Transects at the Three Test Flow Releases. Lower Reach
Mono Creek 2.5 to 2.6Cross-section 1
0
5
10
0 10 20 30 40 50 60 70 80 90 100Distance (ft)
El
(ft)
Bed Elev MIF WSEL 425 cfs 580 cfs 700 cfs
Mono Creek 2.5 to 2.6Cross-section 2(approximate)
0
5
10
0 10 20 30 40 50 60 70 80 90 100Distance (ft)
El
(ft)
Bed Elev MIF WSEL 425 cfs 580 cfs 700 cfs
Mono Creek Sediment Transport and Floodplain Connectivity Study FERC Project Nos. 2085, 2175, 67 and 120
Copyright 2005 by Southern California Edison Company November 2005
Figure 5. Observed Water Surface Elevations in the two Adjustable Reaches Along Surveyed Transects at the Three Test Flow Releases (continued). Lower Reach
Mono Creek 2.5 to 2.6Cross-section 4
0
5
10
0 10 20 30 40 50 60 70 80 90 100 110 120Distance (ft)
El
(ft)
Bed Elev MIF WSEL 425 cfs 580 cfs 700 cfs
Mono Creek 2.5 to 2.6Cross-section 3(approximate)
0
5
10
0 10 20 30 40 50 60 70 80 90 100Distance (ft)
El
(ft)
Bed Elev MIF WSEL 425 cfs 580 cfs 700 cfs
Mono Creek Sediment Transport and Floodplain Connectivity Study FERC Project Nos. 2085, 2175, 67 and 120
Copyright 2005 by Southern California Edison Company November 2005
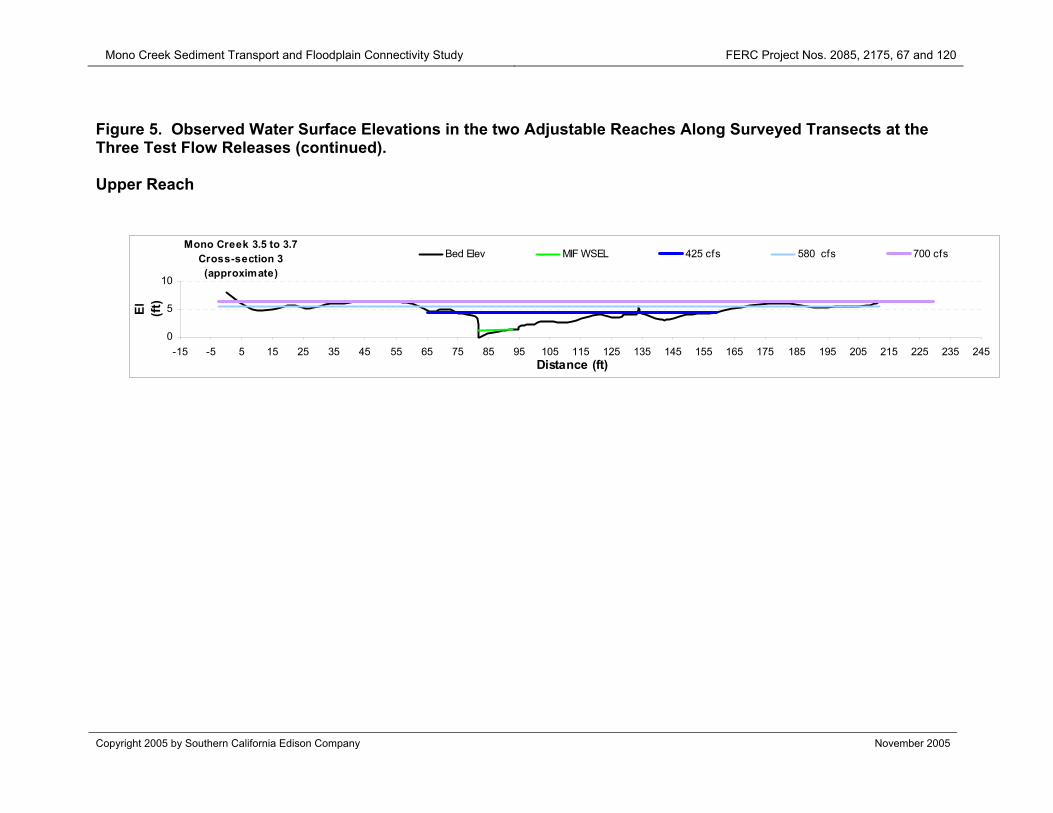
Figure 5. Observed Water Surface Elevations in the two Adjustable Reaches Along Surveyed Transects at the Three Test Flow Releases (continued). Upper Reach
Mono Creek 3.5 to 3.7Cross-section 1
0
5
10
-15 -5 5 15 25 35 45 55 65 75
Distance (ft)
El
(ft)
Bed Elev MIF WSEL 425 cfs 580 cfs 700 cfs
extends 95 ft
Mono Creek 3.5 to 3.7Cross-section 2(approximate)
0
5
10
-5 5 15 25 35 45 55 65 75 85 95 105Distance (ft)
El
(ft)
Bed Elev MIF WSEL 425 cfs 580 cfs 700 cfs
extends 95 ft
Mono Creek Sediment Transport and Floodplain Connectivity Study FERC Project Nos. 2085, 2175, 67 and 120
Copyright 2005 by Southern California Edison Company November 2005
Figure 5. Observed Water Surface Elevations in the two Adjustable Reaches Along Surveyed Transects at the Three Test Flow Releases (continued). Upper Reach
Mono Creek 3.5 to 3.7Cross-section 3(approximate)
0
5
10
-15 -5 5 15 25 35 45 55 65 75 85 95 105 115 125 135 145 155 165 175 185 195 205 215 225 235 245Distance (ft)
El
(ft)
Bed Elev MIF WSEL 425 cfs 580 cfs 700 cfs
Mono Creek Sediment Transport and Floodplain Connectivity Study
FERC Project Nos. 2085, 2175, 67 and 120
Copyright 2005 by Southern California Edison Company November 2005
Figure 6. Mature Vegetation Inundated at the 580 cfs Test Flow Releases at the Lower (left photo) and Upper (right photo) Adjustable Reaches.
Mono Creek Sediment Transport and Floodplain Connectivity Study
FERC Project Nos. 2085, 2175, 67 and 120
Copyright 2005 by Southern California Edison Company November 2005
APPENDIX A
SAMPLING METHODS
Mono Creek Sediment Transport and Floodplain Connectivity Study
FERC Project Nos. 2085, 2175, 67 and 120
Copyright 2005 by Southern California Edison Company A-1 November 2005
Sediment Transport
Pit traps, tracer gravels, and bedload sediment sampling were used to evaluate the particle sizes that were entrained and to estimate total sediment load at the test flow releases, and are described below.
Pit Traps
Half-gallon plastic buckets with a 7.5-inch diameter and 7.5-inch depth were embedded into the channel. The pit traps were installed flush with the channel bed surface. Two pit traps were placed on each cross-section. Material transported by a test flow event is deposited into the bucket as it passes over the opening of the pit trap. Following each test flow event, all the captured material was manually removed from the pit trap (pit trap was not removed during study), sorted by particle size, and the dominant and largest particle sizes recorded and photo-documented. The proportion of the pit trap volume filled with sediment was estimated.
Tracer Gravels
Native gravels ranging from 16 mm to 64 mm were collected from each of the adjustable study sites, sized (in half-phi unit intervals based on the b-axis diameter), and painted various colors to distinguish them from the in-situ bed material. The tracer gravels were then placed on the channel bed in one of either two possible configurations. In one configuration, tracers over the range of sizes (16 mm to 64 mm) were randomly placed as a linear transect across the channel width. In the second configuration, surface and subsurface tracers were placed in tight clusters at a pool-tailout location to emulate a typical salmonid redd. The surface and subsurface tracers were painted a different color to distinguish them. A different color was used for each study site. Prior to the test flow releases, a tally of the particle sizes installed at each were recorded.
Following each test flow release, tracers that had moved downstream were re-collected, sized, and placed into one of three “distance-moved” categories; <1 ft, 1-5 ft, and >5ft. Tracers that moved less than 1 ft were treated as a “not moved” particle, in accordance with many other similar types of sediment transport studies to account for the fact that the tracers are placed by hand on the bed. Hand-placed gravels tend to disturb the bed, which makes them less stable than in-situ, fluvially deposited gravels. Tracers not found downstream and not accounted for at their originally placed position were assumed to have been transported downstream. Photographs of the tracer installation were taken before and after each test flow release.
In the non-adjustable reaches, pockets were visually identified by walking the stream looking for locations where spawnable sized gravels (8 to 45 mm) accumulated on the surface of the bed. In general, these pockets were not embedded in sand at the bed surface, although the subsurface often contained a high proportion of sand. Sites were selected where there was a visible surface velocity at base flow, because velocity over
Mono Creek Sediment Transport and Floodplain Connectivity Study
FERC Project Nos. 2085, 2175, 67 and 120
Copyright 2005 by Southern California Edison Company A-2 November 2005
the gravels would be necessary for spawning to occur in these pockets. Fourteen sites were selected; 8 below Mono Diversion Dam and 6 upstream of Mono Meadow.
Pockets were excavated and visually assessed for substrate composition. Three sizes of gravels were sorted out and painted to track movement. These sizes were 16-22 mm, 22-32 mm, and 32-45 mm, based on the median particle diameter. Substrate elements less than 16 mm or more than 45 mm were not tracked. The painted material was remixed with a small portion of the non-painted material from the pocket, placed on the surface, and tapped down lightly. Where subsurface gravels were placed, these gravels were painted a different color than the surface gravels. These painted gravels were placed in a cohesive pocket in the center of the bulk of the excavated material that was returned to the pocket. The subsurface gravels were generally at a depth of 75 -125 mm below the final surface of the pocket. We initially placed 12 pieces of the 16-22 mm gravel and 6 pieces each of the 22-32 and 32-45 mm gravel in each layer of gravel within a pocket.
Each monitoring site was photographed prior to the first flow release for later comparison with post-release photos. After each flow release, the pockets were inspected for signs of movement or disruption and the area downstream of each pocket was searched for tracer gravels that may have been displaced by the flow. The size of any particles recovered was recorded. The distance a particle moved was recorded as being less than 1 ft, 1-5 ft, 5 to 20 ft, or more than 20 ft. Tracer gravels within 1 ft of the pocket were not considered to have been moved. The pocket was re-excavated and the gravels remaining in the pocket were sized and counted. If visual examination indicated that a pocket had not been mobilized by the test flow, then the study site was not re-excavated to avoid further disturbance of the tracer gravels.
If the majority of gravel remained in the pocket, then the gravels recovered were re-counted and returned to the pocket using the same procedure described above. If the majority of gravels in a pocket were moved out of the pocket by a flow event, the pocket was not replaced for subsequent, higher flow releases. Each pocket was tracked until it was disrupted to an extent that the survival of any eggs in the pocket was unlikely or through all three test flows.
Bedload Monitoring with Helley-Smith Sampler
A Helley-Smith hand-held wading sampler with a 3-inch orifice was used to collect bedload samples at the lower adjustable monitoring site during the test release flows. Samples could not be collected at the upper monitoring site due to both time constraints during peak flows and to unsafe wading conditions. The samples were collected at 2-ft spacing intervals (stations) across the channel width, with a 2-minute sampling duration at each station. Individual bedload samples from each station were combined into a single composite sample for the cross-section.
It was not possible to conduct the bedload sampling when flows were at a steady-state peak due to unsafe wading conditions. As a result, samples were collected during the receding limb of the hydrograph. As it was only possible to estimate the range of flows
Mono Creek Sediment Transport and Floodplain Connectivity Study
FERC Project Nos. 2085, 2175, 67 and 120
Copyright 2005 by Southern California Edison Company A-3 November 2005
during the sampling period; the gaging record at the USGS station immediately below Mono Diversions could not be used to accurately determine the discharge during bedload sampling. One bedload sample was collected during the receding limb of the 580 cfs peak test flow release, and one sample was collected during the receding limb of the 700 cfs peak test flow release. No samples were collected on the receding limb of the 425 cfs test release due to time limitations. We provide a professional estimate of the range of flows during the sampling in Section 6.0, Results.
The bedload samples were later air-dried, weighed with a spring scale, and sieved. The data was used to calculate the total bedload transport rate during the sampling period. Each bedload sample was then sieved at the 16mm and 22mm size categories to determine the largest particle sizes captured.
Net Change in Bed Surface Elevation
Sliding bead monitors and erosion pins were used to measure net changes in bed surface elevation, and are described below.
Sliding Bead Monitors
Sliding bead monitors were used to measure net erosion of the streambed. Seven monitors were installed at 5 study reaches. The design and installation of samplers were similar to that described in (Lisle and Eads 1991; Nawa and Frissell 1993; Schuett-Hames et al. 1996; 1999), although modified for the Mono Creek substrate properties and stream characteristics. The sliding bead monitors consisted of twenty ½-inch floating beads (corkies) laced onto a 1.5 m (59-inch) length of 3/32-inch diameter cable. Anchors and PVC floats (bobbers) were also constructed that attached to the bottom and top of the string of beads, respectively.
The sliding bead monitor was installed into the bed by digging down into the subsurface material, holding the sampler vertically, and then burying the cable and beads such that the top bead was just underneath the bed surface. The sliding bead monitors were placed only in pool tailouts, where it was feasible to install the samplers to a sufficient depth below the surface to provide adequate anchoring against the test flows. Care was taken to ensure that the final bed elevation and particle sizes were similar to that present prior to installation. The dominant and sub-dominant grain size prior to and after each test flow release were noted (Appendix C).
Net changes in bed surface elevation were measured by the number of beads exposed or depth of deposited sediment above the top bead (measured by the length of cord) following the test flow release. A bead is exposed for every ½-inch of scour. Therefore, the depth of scour is determined by counting the number of exposed beads and multiplying by 0.5 inches.
Mono Creek Sediment Transport and Floodplain Connectivity Study
FERC Project Nos. 2085, 2175, 67 and 120
Copyright 2005 by Southern California Edison Company A-4 November 2005
Erosion Pins
Eighteen-inch lengths of ¼-inch rebar were driven into the bed of the channel at selected locations and measured prior to the initiation of the test flows. The net change in bed surface elevation was determined by measuring the distance from the top of the scour pin to the bed surface prior to and following each test flow release. The dominant and sub-dominant grain size prior to and after each test flow release were noted.
Floodplain Connectivity
Top Wetted Width Measurement
Maximum top wetted channel width in the adjustable study reaches was measured following each flow release. The wetted width was measured at locations where the left and/or right bank pins from previous channel cross-section topographic surveys (conducted in 2003 for the HEC-RAS model developed for CAWG 2, Geomorphology, 2003 TSR (SCE 2004) and CAWG-11, Riparian 2003 TSR (SCE 2004)) could be found. Trash lines and wet soil conditions were used to estimate the maximum top wetted width after the peak test flow release had receded. Top wetted width measurements were determined for 3 cross-section at the upper study site and 4 at the lower study site.
Staff Gage Depth Measurements
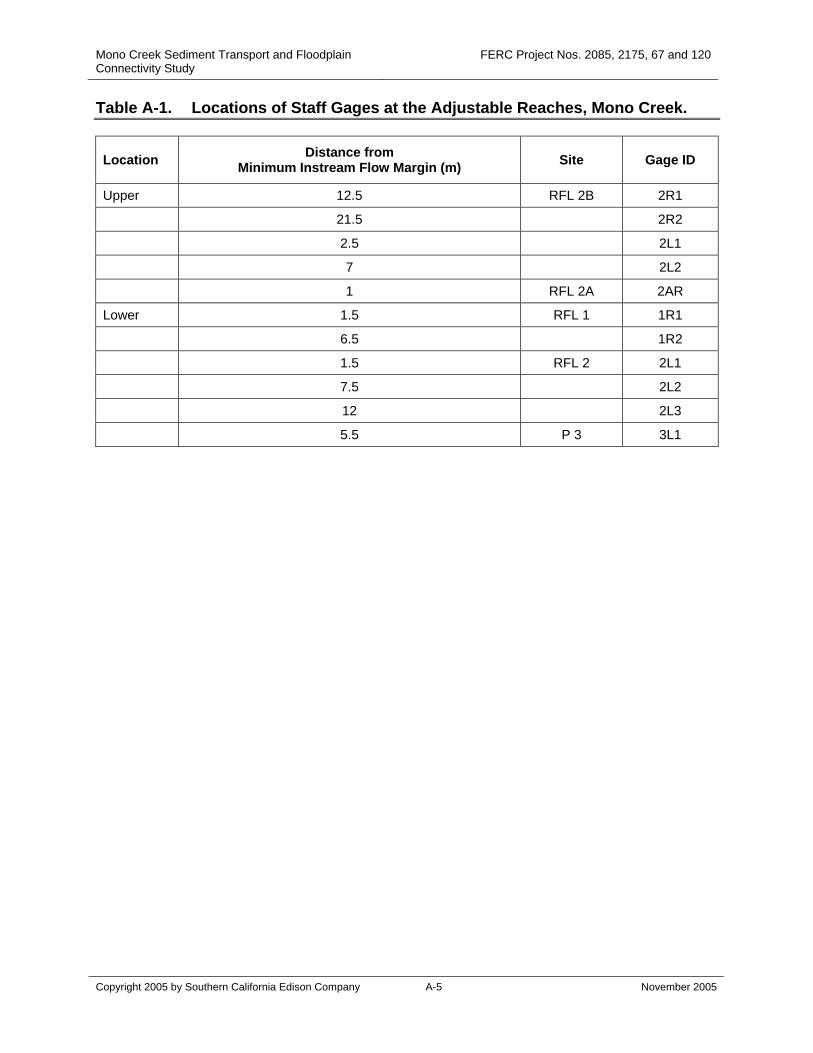
Staff gages were installed in the upper and lower adjustable study sites to measure the depth of flow over selected bar, bank, and floodplain features. The staff gages were constructed with yardsticks tied to 5-foot gardening metal fence posts that were driven into the bed and bank substrate. The bottom of the yardstick was initially placed level with the ground surface. The staff gages installed at RFL 2B were along the HEC-RAS surveyed cross-section 3 used for HEC-RAS modeling. The distance of each staff gage from the water’s edge (normal to the flow path) at the minimum instream flow is provided in Table A-1. Six staff gages were installed at the lower adjustable study reach. Two were installed on the right bar at RFL 1, 3 on the left bank and bar at RFL 2 (surveyed cross-section 3 for HEC-RAS), and 1 on the left bar at P 3 (surveyed cross-section 1 for HEC-RAS).
The staff gages were read, photographed, and videotaped during each peak test flow release to determine the change in depth at each of the test flow releases.
Photographic and Videographic Documentation
Conditions during each peak test flow release were recorded by video camera and by photographs in the two adjustable reaches and non-adjustable reaches. The position of riparian vegetation and channel banks relative to the water surface elevation at each release is noted in the video and photo-documentation.
Mono Creek Sediment Transport and Floodplain Connectivity Study
FERC Project Nos. 2085, 2175, 67 and 120
Copyright 2005 by Southern California Edison Company A-5 November 2005
Table A-1. Locations of Staff Gages at the Adjustable Reaches, Mono Creek.
Location Distance from Minimum Instream Flow Margin (m) Site Gage ID
Upper 12.5 RFL 2B 2R1
21.5 2R2
2.5 2L1
7 2L2
1 RFL 2A 2AR
Lower 1.5 RFL 1 1R1
6.5 1R2
1.5 RFL 2 2L1
7.5 2L2
12 2L3
5.5 P 3 3L1

Mono Creek Sediment Transport and Floodplain Connectivity Study
FERC Project Nos. 2085, 2175, 67 and 120
Copyright 2005 by Southern California Edison Company November 2005
APPENDIX B
MONO CREEK SEDIMENT TRANSPORT AND FLOODPLAIN CONNECTIVITY STUDY
PLENARY PRESENTATION
13 SEPTEMBER 2005
B-1
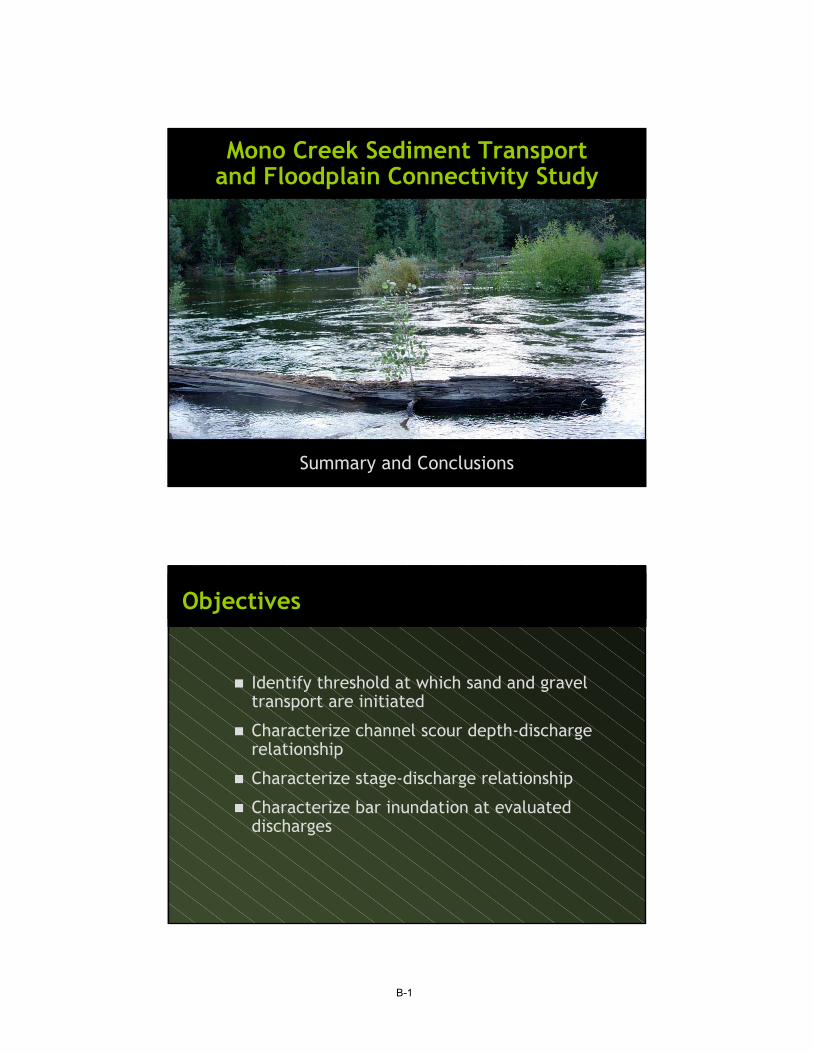
Mono Creek Sediment Transportand Floodplain Connectivity Study
Summary and Conclusions
Objectives
Identify threshold at which sand and graveltransport are initiated
Characterize channel scour depth-dischargerelationship
Characterize stage-discharge relationship
Characterize bar inundation at evaluateddischarges
B-2
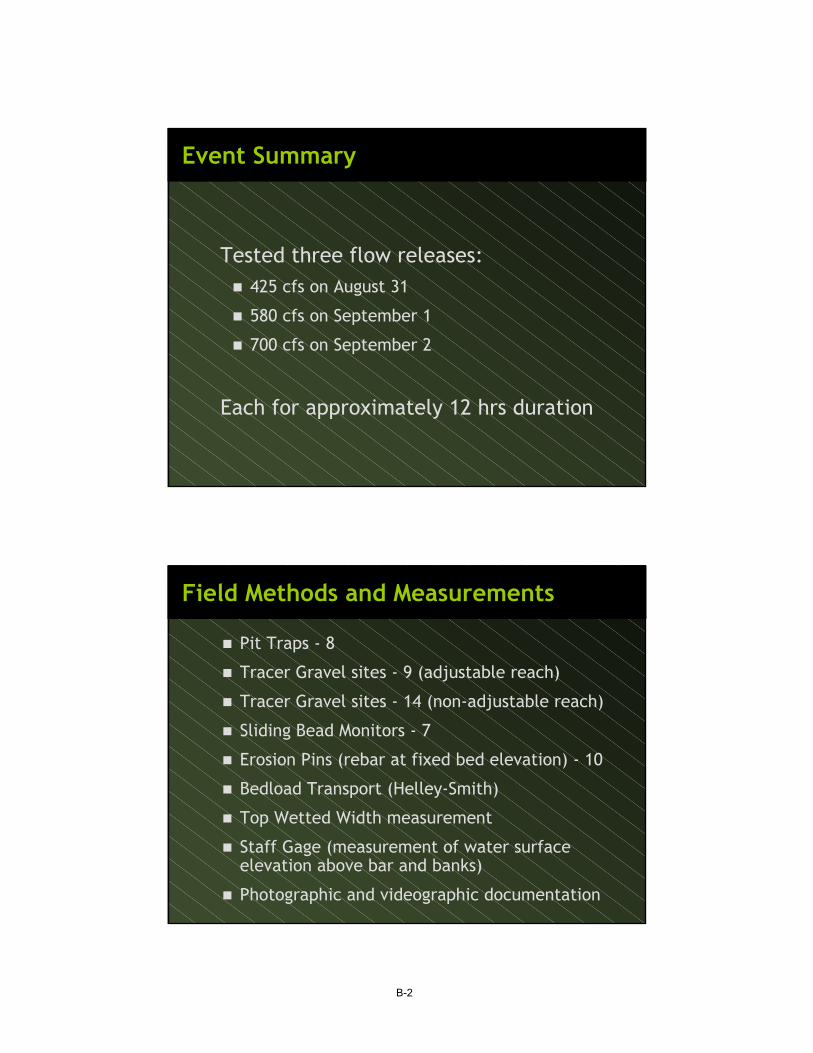
Event Summary
Tested three flow releases:425 cfs on August 31
580 cfs on September 1
700 cfs on September 2
Each for approximately 12 hrs duration
Field Methods and Measurements
Pit Traps - 8
Tracer Gravel sites - 9 (adjustable reach)
Tracer Gravel sites - 14 (non-adjustable reach)
Sliding Bead Monitors - 7
Erosion Pins (rebar at fixed bed elevation) - 10
Bedload Transport (Helley-Smith)
Top Wetted Width measurement
Staff Gage (measurement of water surfaceelevation above bar and banks)
Photographic and videographic documentation
B-3
Mono Creek Sediment Transport and Riparian Study
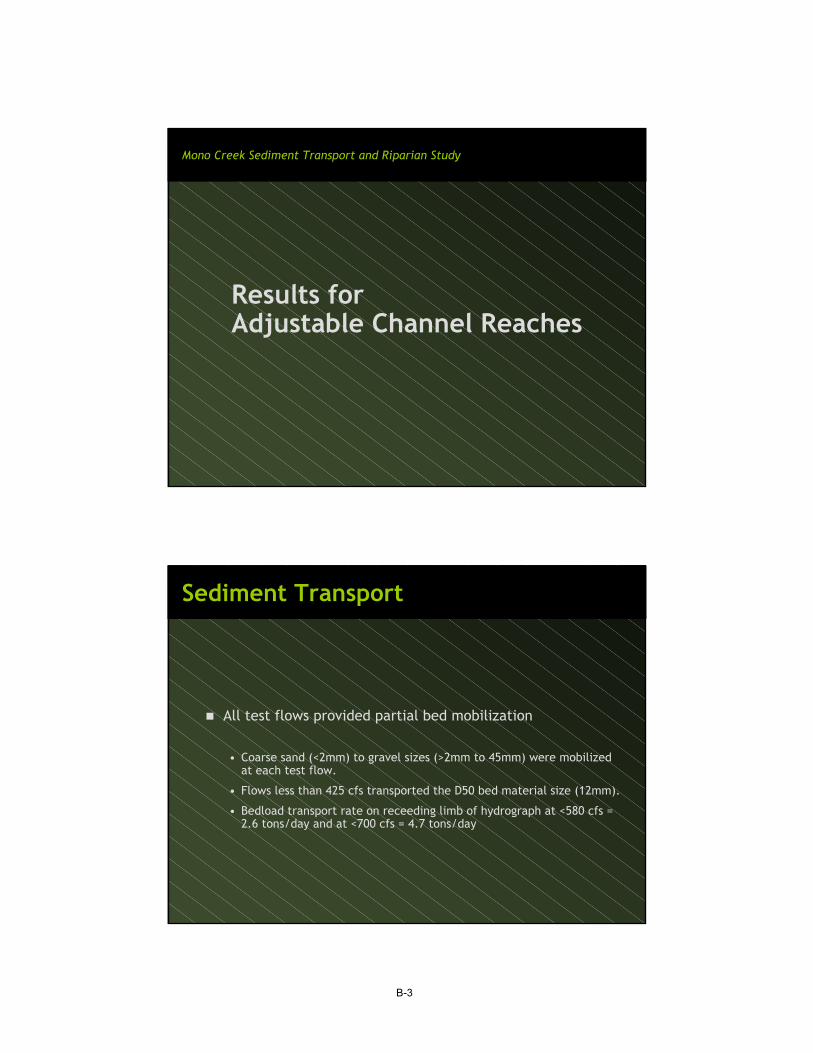
Results forAdjustable Channel Reaches
Sediment Transport
All test flows provided partial bed mobilization
• Coarse sand (<2mm) to gravel sizes (>2mm to 45mm) were mobilizedat each test flow.
• Flows less than 425 cfs transported the D50 bed material size (12mm).
• Bedload transport rate on receeding limb of hydrograph at <580 cfs =2.6 tons/day and at <700 cfs = 4.7 tons/day
B-4
Sediment Transport
None of the test flows provided full mobility• Coarsest bed material sizes (cobble) were almost never mobilized, and
some portions of the channel bed surface were never mobilized.
• Some surface grains remained immobile during each of the test flowreleases.
• Partial transport is a common condition, which can persist from yearto year, but transport rates can remain large. Spatial variability in bedcomposition and bed topography influence the areal extent andfrequency of bed material entrainment. Full bed mobility can be arelatively rare event, requiring flows that have much higher than a2 year flood frequency (Haschenburger and Wilcock, 2003).
Scour
Scour depths at all flows were similar
• Typical scour depths were about the estimated D50 bedmaterial size, 12mm (1/2-inch).
• Surface gravels were transported; sub-surface gravels were notmobilized.
B-5
Scour and Deposition
Both scour and deposition occurred during each ofthe test flow releases
• There was not uniform scour or deposition across the bed in anyof the study reaches.
• Small areas of sand deposition on bars and along the channelmargin above the low-flow channel were observed following the700 cfs release.
Large Woody Debris
Large Woody Debris was transported at all testflow releases
• Observed a relatively greater amount of LWD transportfollowing the 700 cfs release, but this could have been theresult of cumulative effects from the 425 cfs and 580 cfs testflows.
B-6
Bank Erosion
Minor amounts of bankerosion were observedfollowing the 700 cfsrelease
• Although no substantialbank erosion wasobserved at either the425 cfs or 580 cfs flows,the bank erosionoccurring with the700 cfs release may bedue to cumulative effectsof all three test flows.
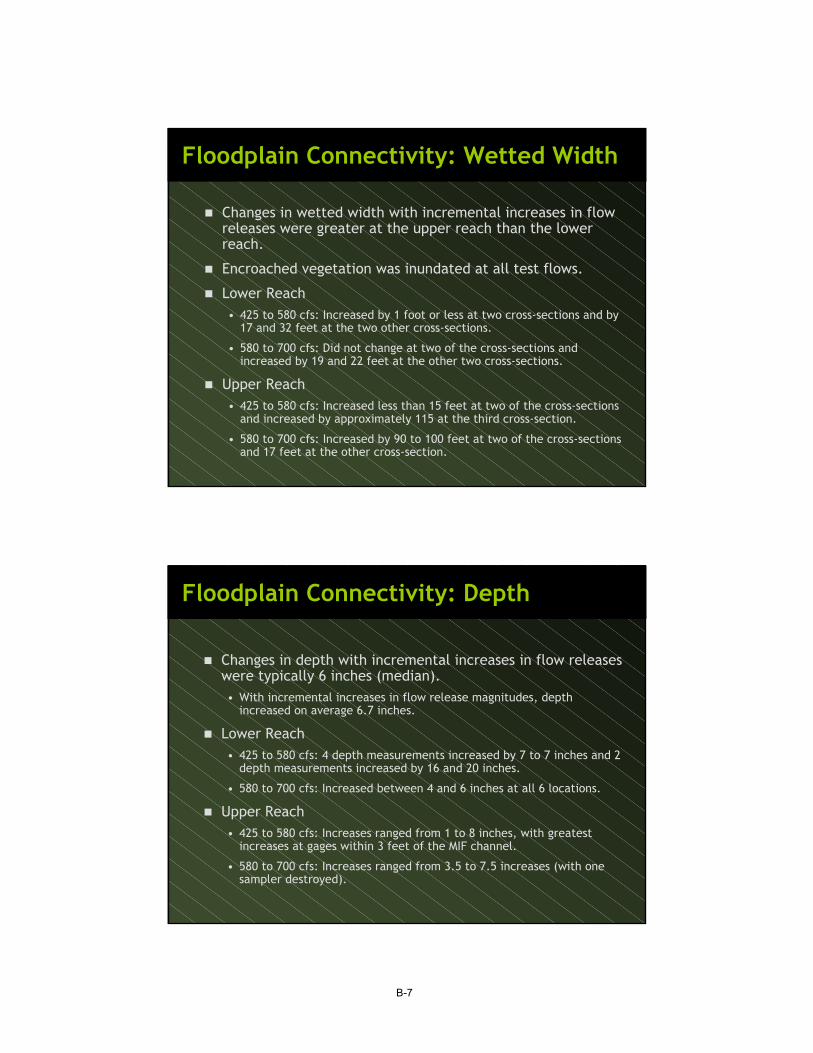
Floodplain Connectivity
Portions of thefloodplains in bothadjustable reacheswere connected at alltest flow releases• Observed extents of
inundation and waterdepths were greater thanHEC-RAS estimates atmost surveyed cross-sections.
• Floodplain connectivityobserved from bothoverbanking and fromflows that entered atlower elevation pointsupstream that flowedwithin favored flowpathswithin the floodplain.
B-7
Floodplain Connectivity: Wetted Width
Changes in wetted width with incremental increases in flowreleases were greater at the upper reach than the lowerreach.
Encroached vegetation was inundated at all test flows.
Lower Reach• 425 to 580 cfs: Increased by 1 foot or less at two cross-sections and by
17 and 32 feet at the two other cross-sections.
• 580 to 700 cfs: Did not change at two of the cross-sections andincreased by 19 and 22 feet at the other two cross-sections.
Upper Reach• 425 to 580 cfs: Increased less than 15 feet at two of the cross-sections
and increased by approximately 115 at the third cross-section.
• 580 to 700 cfs: Increased by 90 to 100 feet at two of the cross-sectionsand 17 feet at the other cross-section.
Floodplain Connectivity: Depth
Changes in depth with incremental increases in flow releaseswere typically 6 inches (median).• With incremental increases in flow release magnitudes, depth
increased on average 6.7 inches.
Lower Reach• 425 to 580 cfs: 4 depth measurements increased by 7 to 7 inches and 2
depth measurements increased by 16 and 20 inches.
• 580 to 700 cfs: Increased between 4 and 6 inches at all 6 locations.
Upper Reach• 425 to 580 cfs: Increases ranged from 1 to 8 inches, with greatest
increases at gages within 3 feet of the MIF channel.
• 580 to 700 cfs: Increases ranged from 3.5 to 7.5 increases (with onesampler destroyed).
B-8
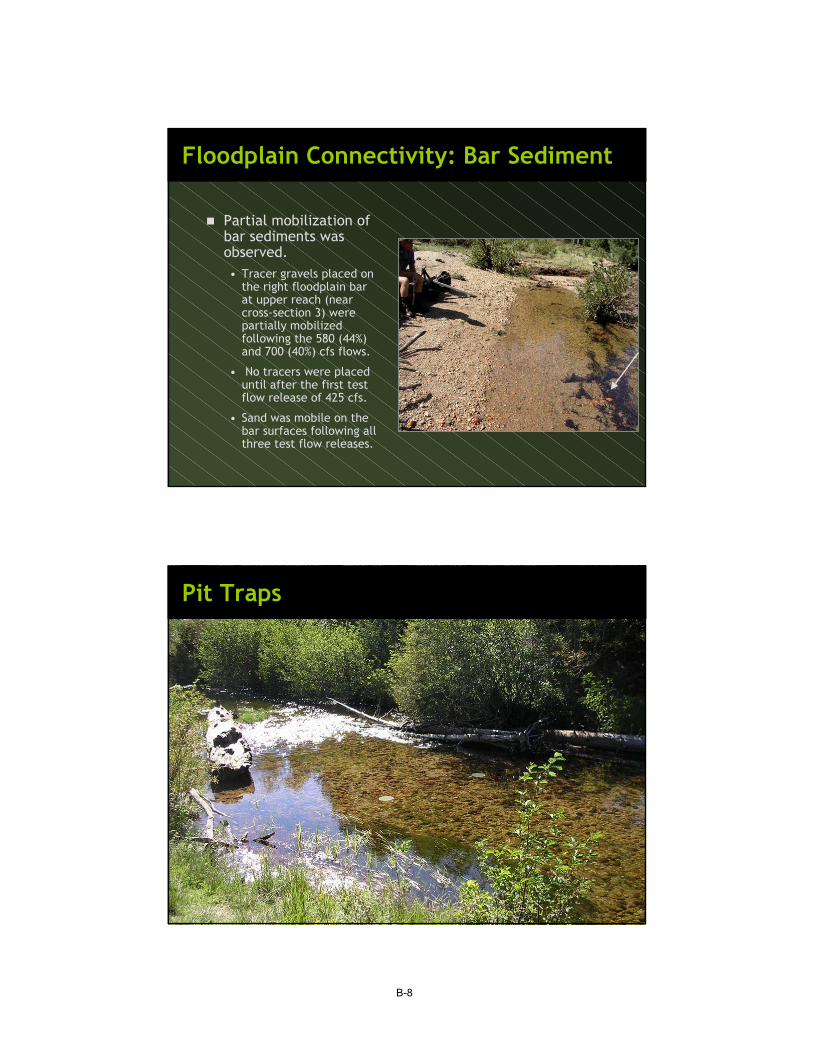
Floodplain Connectivity: Bar Sediment
Partial mobilization ofbar sediments wasobserved.• Tracer gravels placed on
the right floodplain barat upper reach (nearcross-section 3) werepartially mobilizedfollowing the 580 (44%)and 700 (40%) cfs flows.
• No tracers were placeduntil after the first testflow release of 425 cfs.
• Sand was mobile on thebar surfaces following allthree test flow releases.
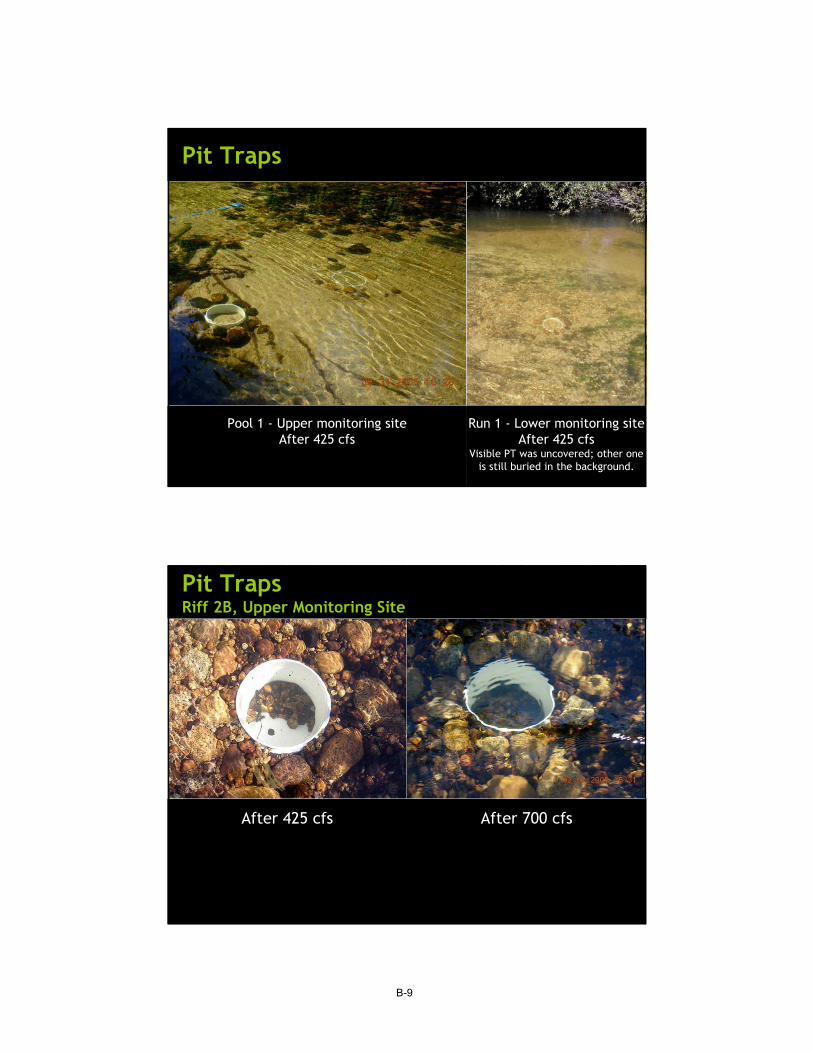
Pit Traps
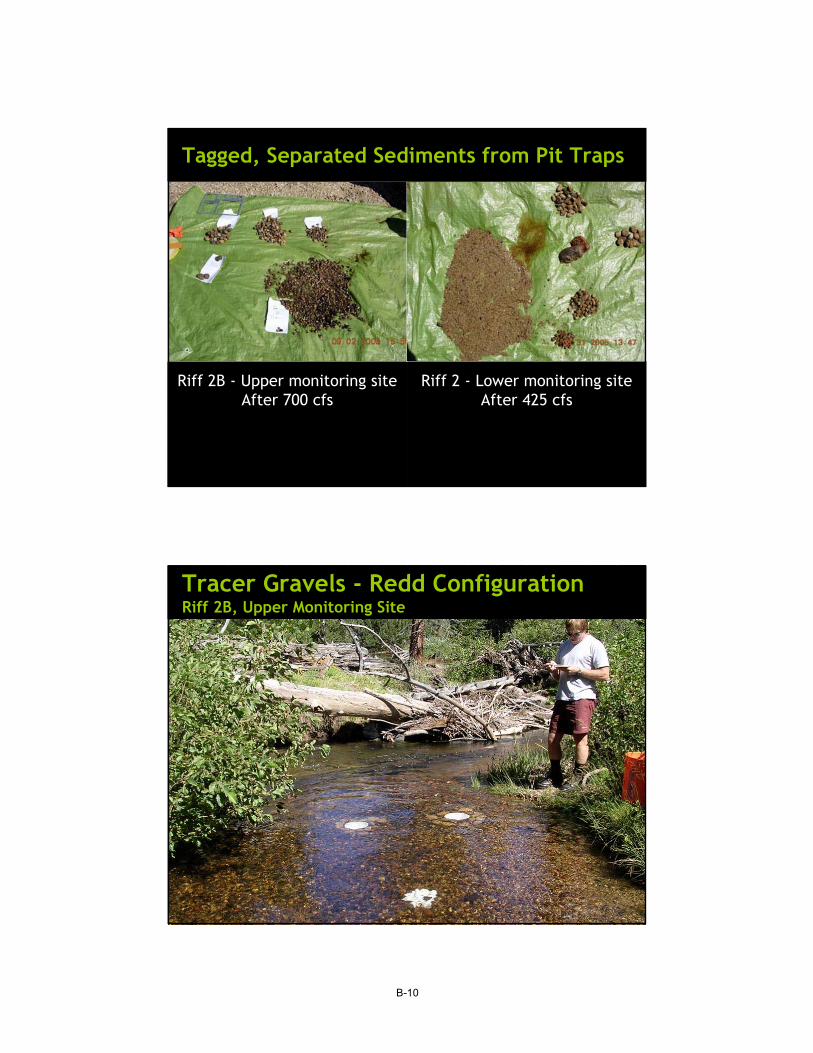
B-9
Pool 1 - Upper monitoring siteAfter 425 cfs
Run 1 - Lower monitoring siteAfter 425 cfs
Visible PT was uncovered; other oneis still buried in the background.
Pit Traps
After 425 cfs After 700 cfs
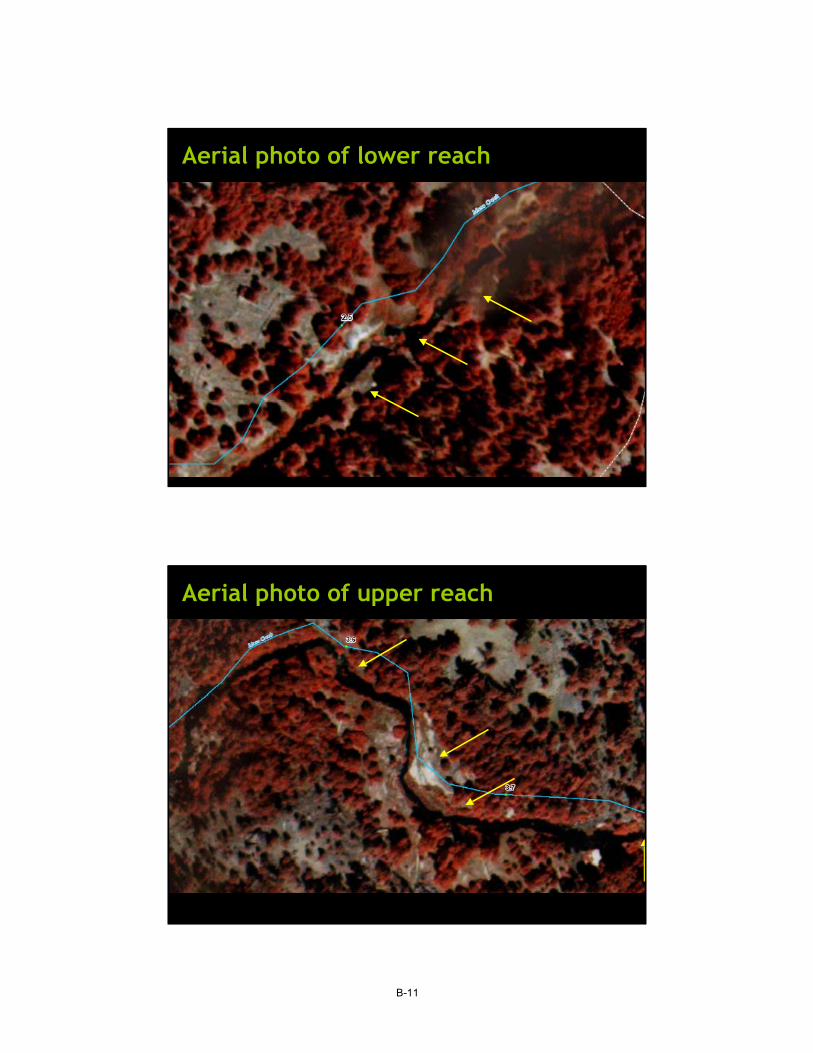
Pit TrapsRiff 2B, Upper Monitoring Site
B-10
Riff 2B - Upper monitoring siteAfter 700 cfs
Riff 2 - Lower monitoring siteAfter 425 cfs
Tagged, Separated Sediments from Pit Traps
Tracer Gravels - Redd ConfigurationRiff 2B, Upper Monitoring Site
B-11
Aerial photo of lower reach
Aerial photo of upper reach
B-12
After 425 cfs After 700 cfs
Tracer Gravels - Redd ConfigurationRiff 2B, Upper Monitoring Site
Tracer GravelsPool-0, Lower Monitoring Site
B-13
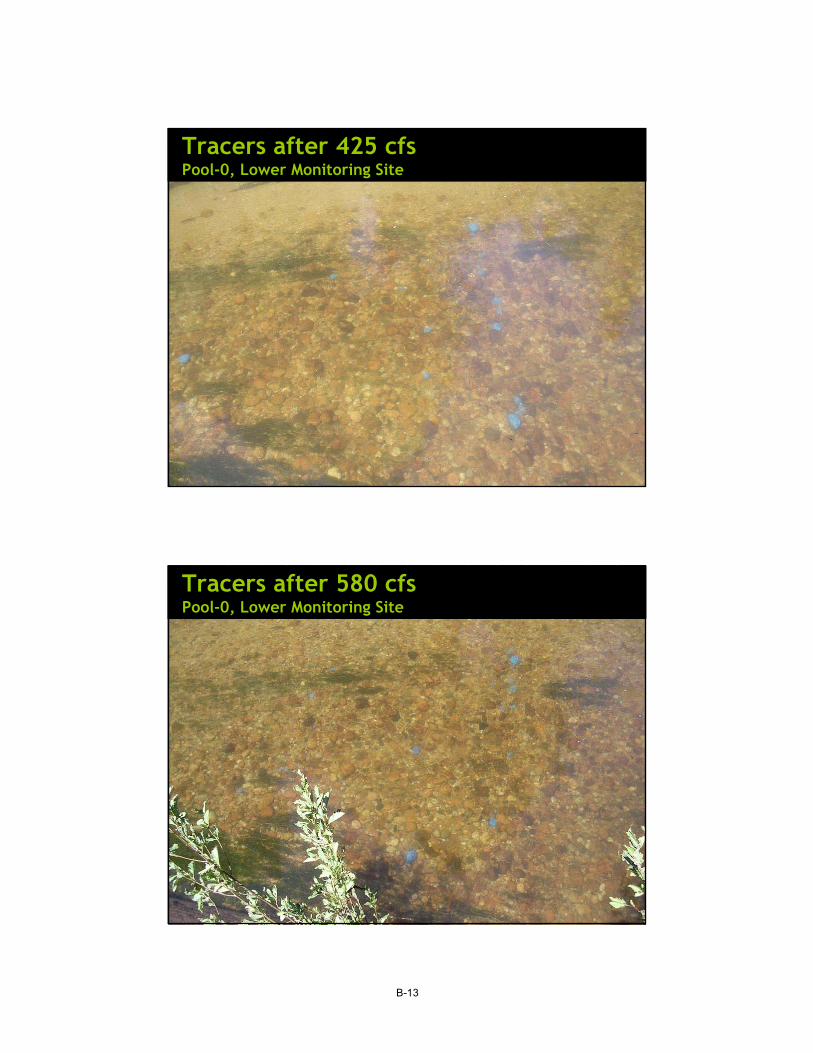
Tracers after 425 cfsPool-0, Lower Monitoring Site
Tracers after 580 cfsPool-0, Lower Monitoring Site
B-14
Tracers after 700 cfsPool-0, Lower Monitoring Site
Sliding Bead Monitor after 580 cfs Pool Tail out 1, Upper Monitoring Site
Initial Conditions: 2 beads exposed425 cfs: 1 bead exposed580 cfs: 2 beads exposed700 cfs: 1 bead exposed
B-15
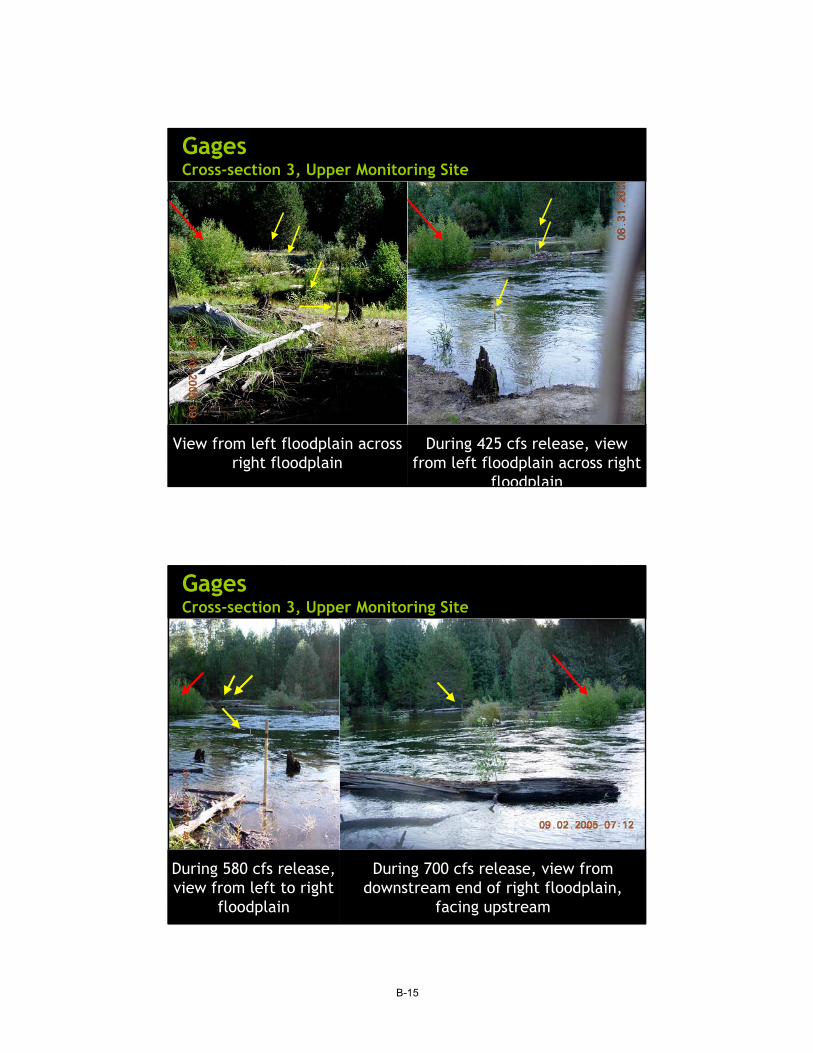
View from left floodplain acrossright floodplain
During 425 cfs release, viewfrom left floodplain across right
floodplain
GagesCross-section 3, Upper Monitoring Site
During 580 cfs release,view from left to right
floodplain
During 700 cfs release, view fromdownstream end of right floodplain,
facing upstream
GagesCross-section 3, Upper Monitoring Site
B-16
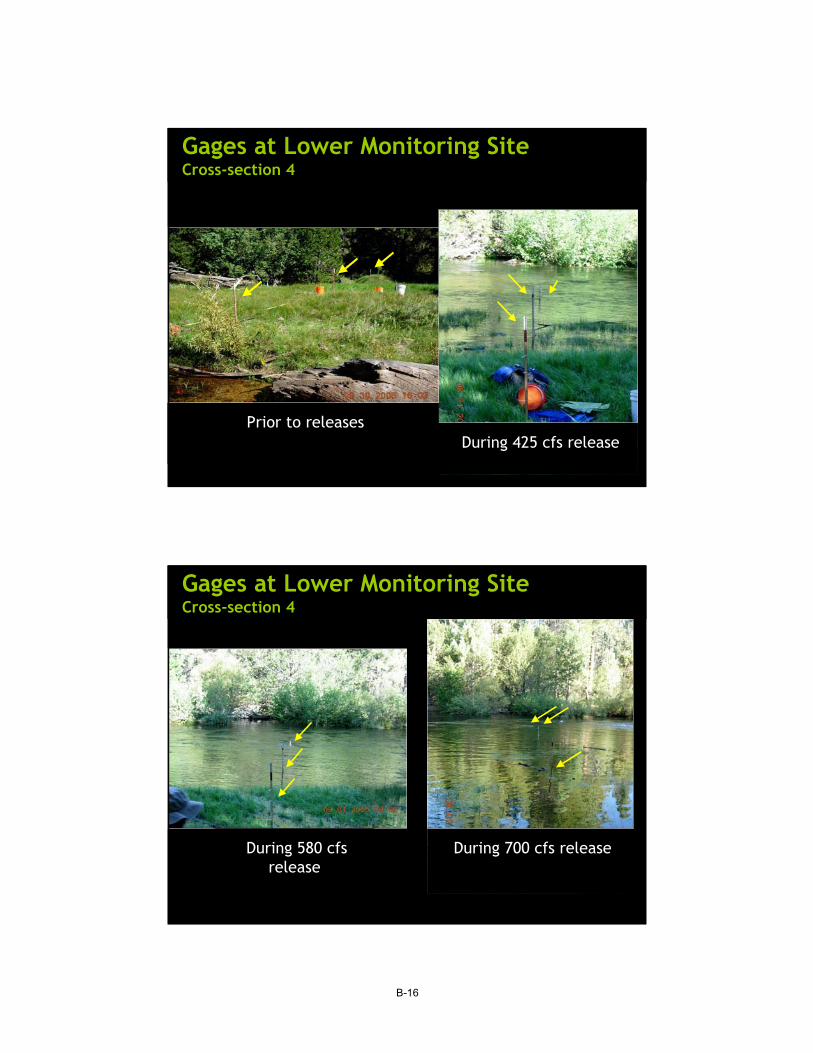
Gages at Lower Monitoring SiteCross-section 4
During 425 cfs release Prior to releases
Gages at Lower Monitoring SiteCross-section 4
During 580 cfsrelease
During 700 cfs release
B-17
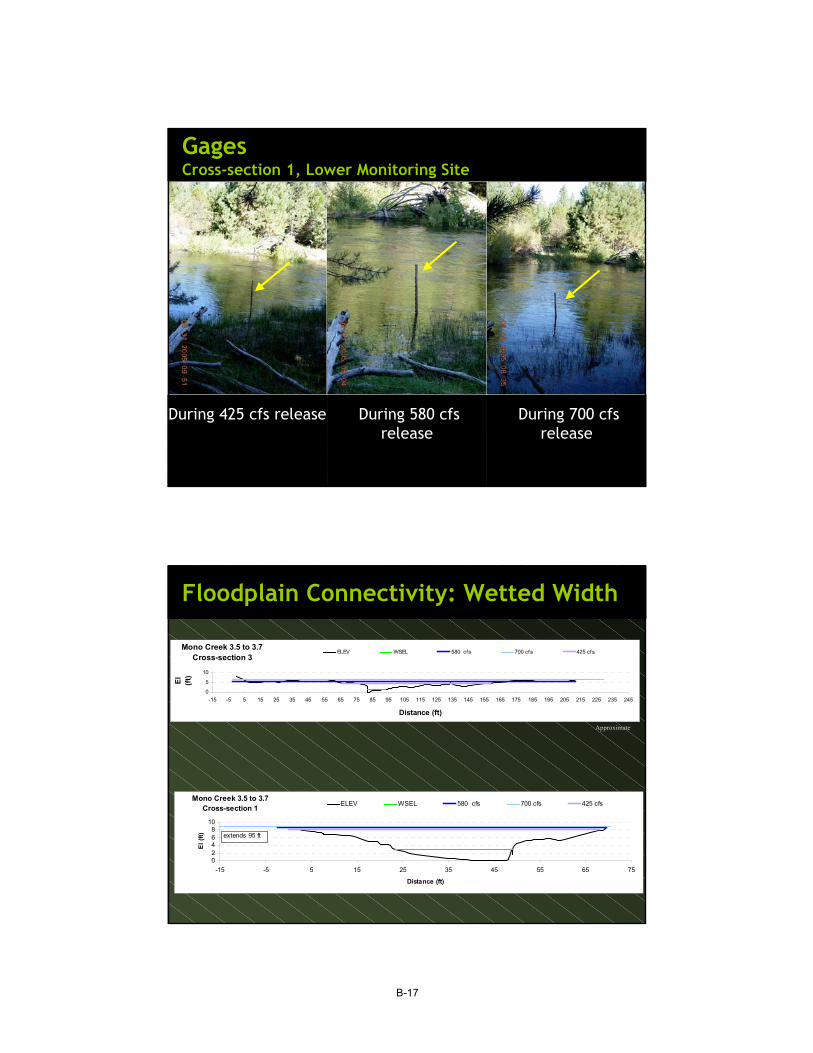
GagesCross-section 1, Lower Monitoring Site
During 425 cfs release During 580 cfsrelease
During 700 cfsrelease
Floodplain Connectivity: Wetted Width
Mono Creek 3.5 to 3.7Cross-section 3
0
5
10
-15 -5 5 15 25 35 45 55 65 75 85 95 105 115 125 135 145 155 165 175 185 195 205 215 225 235 245
Distance (ft)
El
(ft)
ELEV WSEL 580 cfs 700 cfs 425 cfs
Approximate
Mono Creek 3.5 to 3.7Cross-section 1
02468
10
-15 -5 5 15 25 35 45 55 65 75
Distance (ft)
El (f
t)
ELEV WSEL 580 cfs 700 cfs 425 cfs
extends 95 ft
B-18
Mono Creek 2.5 to 2.6Cross-section 1
02468
10
0 10 20 30 40 50 60 70 80 90 100Distance (ft)
El (f
t)
ELEV WSEL 580 cfs 700 cfs 425 cfs
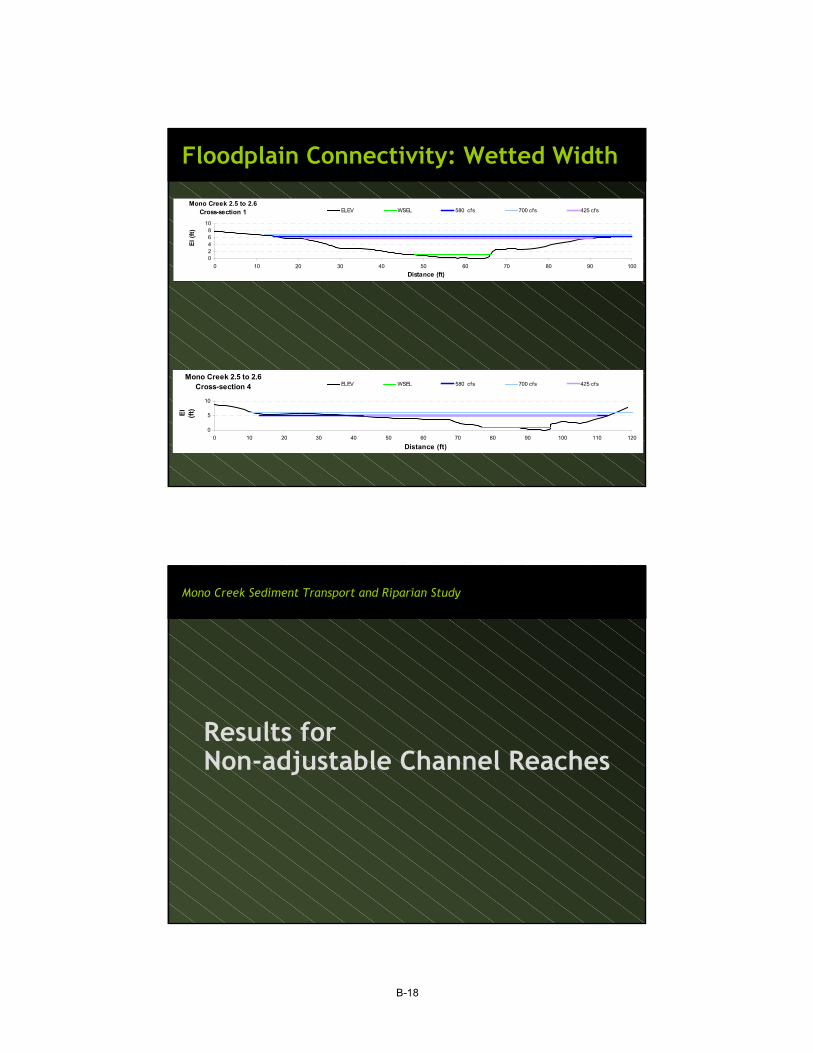
Floodplain Connectivity: Wetted Width
Mono Creek 2.5 to 2.6Cross-section 4
0
5
10
0 10 20 30 40 50 60 70 80 90 100 110 120
Distance (ft)
El
(ft)
ELEV WSEL 580 cfs 700 cfs 425 cfs
Mono Creek Sediment Transport and Riparian Study
Results forNon-adjustable Channel Reaches
B-19
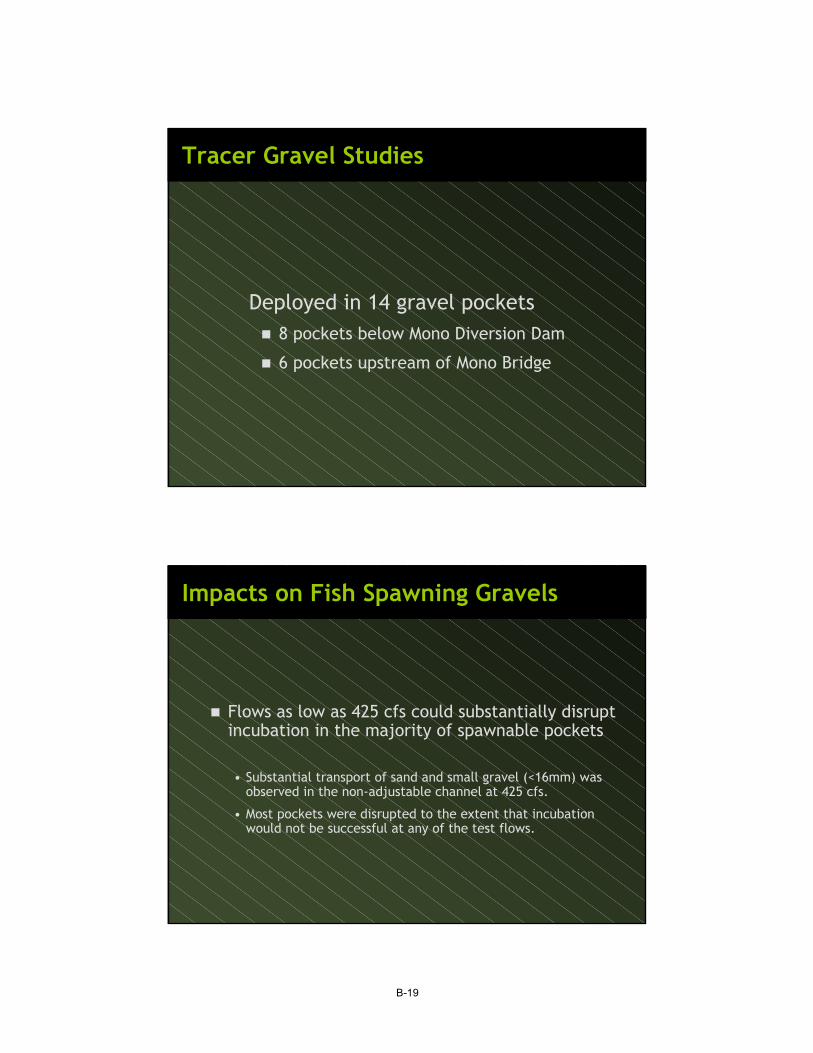
Tracer Gravel Studies
Deployed in 14 gravel pockets8 pockets below Mono Diversion Dam
6 pockets upstream of Mono Bridge
Impacts on Fish Spawning Gravels
Flows as low as 425 cfs could substantially disruptincubation in the majority of spawnable pockets
• Substantial transport of sand and small gravel (<16mm) wasobserved in the non-adjustable channel at 425 cfs.
• Most pockets were disrupted to the extent that incubationwould not be successful at any of the test flows.

B-20
Impacts on Fish Spawning Gravels
After the 425 cfs release, 5 of 14 pockets were sufficientlyundisturbed to support incubation.• Of the remaining 9 pockets, significant gravel transport (including
subsurface gravels) or turnover occurred at 6, and the 3 remainingpockets were buried by sand transported by the flow.
After the 580 cfs release, only 3 of the 14 pockets retainedsufficient integrity to support incubation
At the 580 cfs flow, there was substantial evidence thatgravels > 32 mm and even cobbles were being transported
After the 700 cfs release, only one pocket remained intact• All other pockets experienced significant movement of gravels.
• The one intact pocket was located on the bank about 1.5 feet abovethe base flow water level, but was submerged at 450 cfs.
After initial setup After 425 cfs release
Pocket 2
B-21
After initial setup After 425 cfs release
Pocket 3
After initial setup After 425 cfs release
Pocket 7
B-22
After re-establishment at425 cfs release
About 5 minutes after 425 cfsre-establishment setup
Pocket 7
After 425 re-setup After 580 cfs release
Pocket 10

B-23
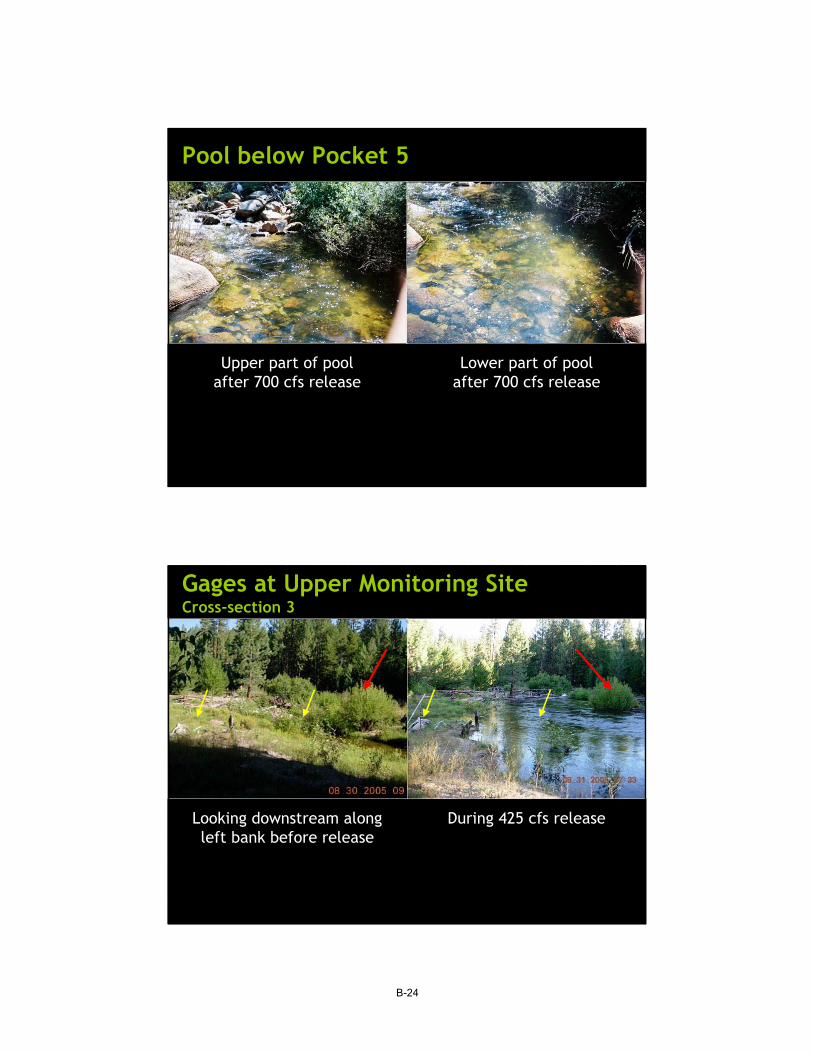
Pool below Pocket 5
After 425 cfs release
After 580 cfs release
Pool below Pocket 5
B-24
Upper part of poolafter 700 cfs release
Lower part of poolafter 700 cfs release
Pool below Pocket 5
During 425 cfs releaseLooking downstream alongleft bank before release
Gages at Upper Monitoring SiteCross-section 3
Mono Creek Sediment Transport and Floodplain Connectivity Study
FERC Project Nos. 2085, 2175, 67 and 120
Copyright 2005 by Southern California Edison Company November 2005
APPENDIX C
STUDY DATA AND RESULT DETAILS
Mono Creek Sediment Transport and Floodplain Connectivity Study
FERC Project Nos. 2085, 2175, 67 and 120
Copyright 2005 by Southern California Edison Company C-1 November 2005
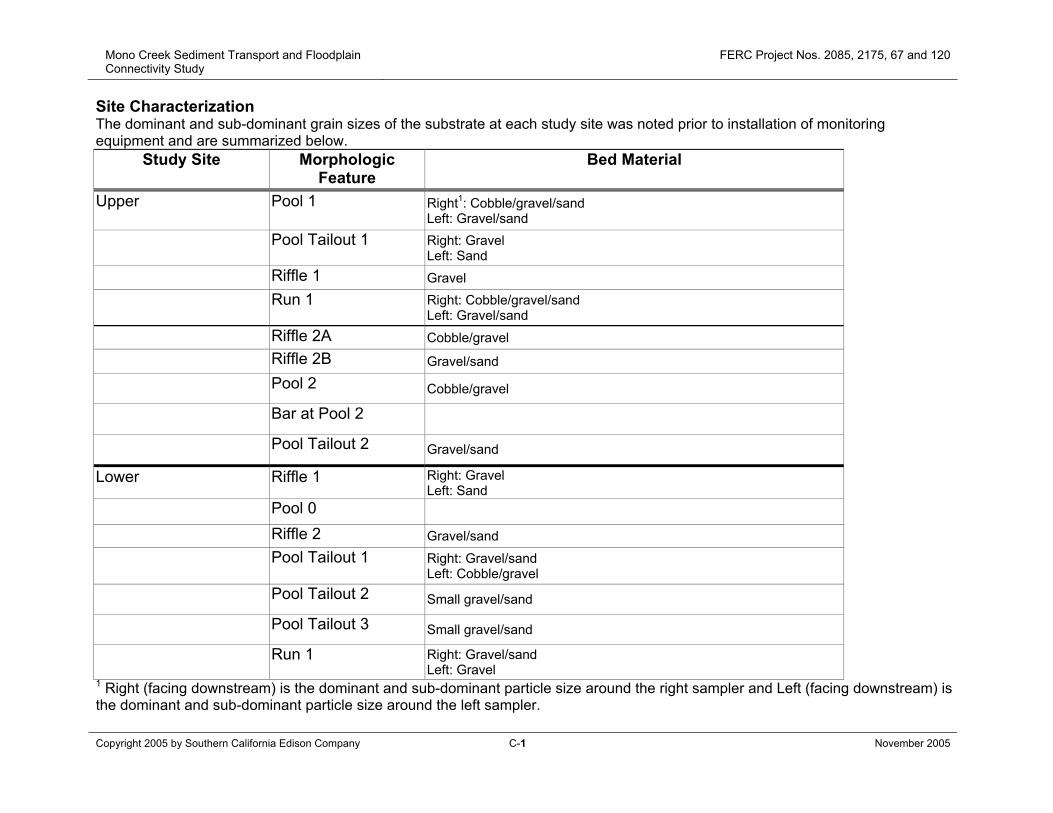
Site Characterization The dominant and sub-dominant grain sizes of the substrate at each study site was noted prior to installation of monitoring equipment and are summarized below.
Study Site Morphologic Feature
Bed Material
Upper Pool 1 Right1: Cobble/gravel/sand Left: Gravel/sand
Pool Tailout 1 Right: Gravel Left: Sand
Riffle 1 Gravel
Run 1 Right: Cobble/gravel/sand Left: Gravel/sand
Riffle 2A Cobble/gravel Riffle 2B Gravel/sand
Pool 2 Cobble/gravel
Bar at Pool 2
Pool Tailout 2 Gravel/sand
Lower Riffle 1 Right: Gravel Left: Sand
Pool 0
Riffle 2 Gravel/sand Pool Tailout 1 Right: Gravel/sand
Left: Cobble/gravel Pool Tailout 2 Small gravel/sand
Pool Tailout 3 Small gravel/sand
Run 1 Right: Gravel/sand Left: Gravel
1 Right (facing downstream) is the dominant and sub-dominant particle size around the right sampler and Left (facing downstream) is the dominant and sub-dominant particle size around the left sampler.
Mono Creek Sediment Transport and Floodplain Connectivity Study
FERC Project Nos. 2085, 2175, 67 and 120
Copyright 2005 by Southern California Edison Company C-2 November 2005
Sediment Transport Particle Sizes Entrained Tracer Gravel Results Tracer gravel results for each site are provided on the following pages. Sites within the adjustable reaches are presented first, followed by results from the non-adjustable reaches.
Mono Creek Sediment Transport and Floodplain Connectivity Study
FERC Project Nos. 2085, 2175, 67 and 120
Copyright 2005 by Southern California Edison Company C-3 November 2005
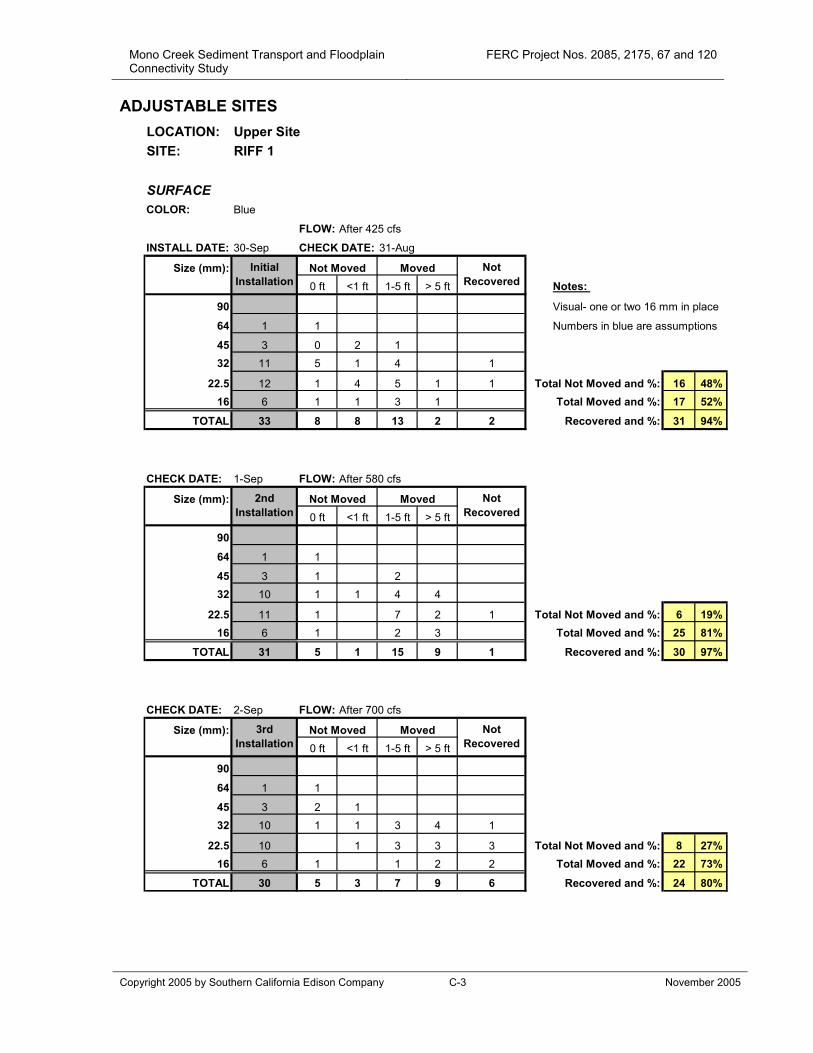
ADJUSTABLE SITES
LOCATION: Upper SiteSITE: RIFF 1
SURFACECOLOR: Blue
FLOW: After 425 cfs
INSTALL DATE: 30-Sep CHECK DATE: 31-Aug
Size (mm): Not Moved Moved0 ft <1 ft 1-5 ft > 5 ft Notes:
90 Visual- one or two 16 mm in place
64 1 1 Numbers in blue are assumptions
45 3 0 2 132 11 5 1 4 1
22.5 12 1 4 5 1 1 Total Not Moved and %: 16 48%16 6 1 1 3 1 Total Moved and %: 17 52%
TOTAL 33 8 8 13 2 2 Recovered and %: 31 94%
CHECK DATE: 1-Sep FLOW: After 580 cfs
Size (mm): Not Moved Moved0 ft <1 ft 1-5 ft > 5 ft
90
64 1 1
45 3 1 232 10 1 1 4 4
22.5 11 1 7 2 1 Total Not Moved and %: 6 19%16 6 1 2 3 Total Moved and %: 25 81%
TOTAL 31 5 1 15 9 1 Recovered and %: 30 97%
CHECK DATE: 2-Sep FLOW: After 700 cfs
Size (mm): Not Moved Moved0 ft <1 ft 1-5 ft > 5 ft
90
64 1 1
45 3 2 132 10 1 1 3 4 1
22.5 10 1 3 3 3 Total Not Moved and %: 8 27%16 6 1 1 2 2 Total Moved and %: 22 73%
TOTAL 30 5 3 7 9 6 Recovered and %: 24 80%
Initial Installation
Not Recovered
3rd Installation
Not Recovered
2nd Installation
Not Recovered
Mono Creek Sediment Transport and Floodplain Connectivity Study
FERC Project Nos. 2085, 2175, 67 and 120
Copyright 2005 by Southern California Edison Company C-4 November 2005
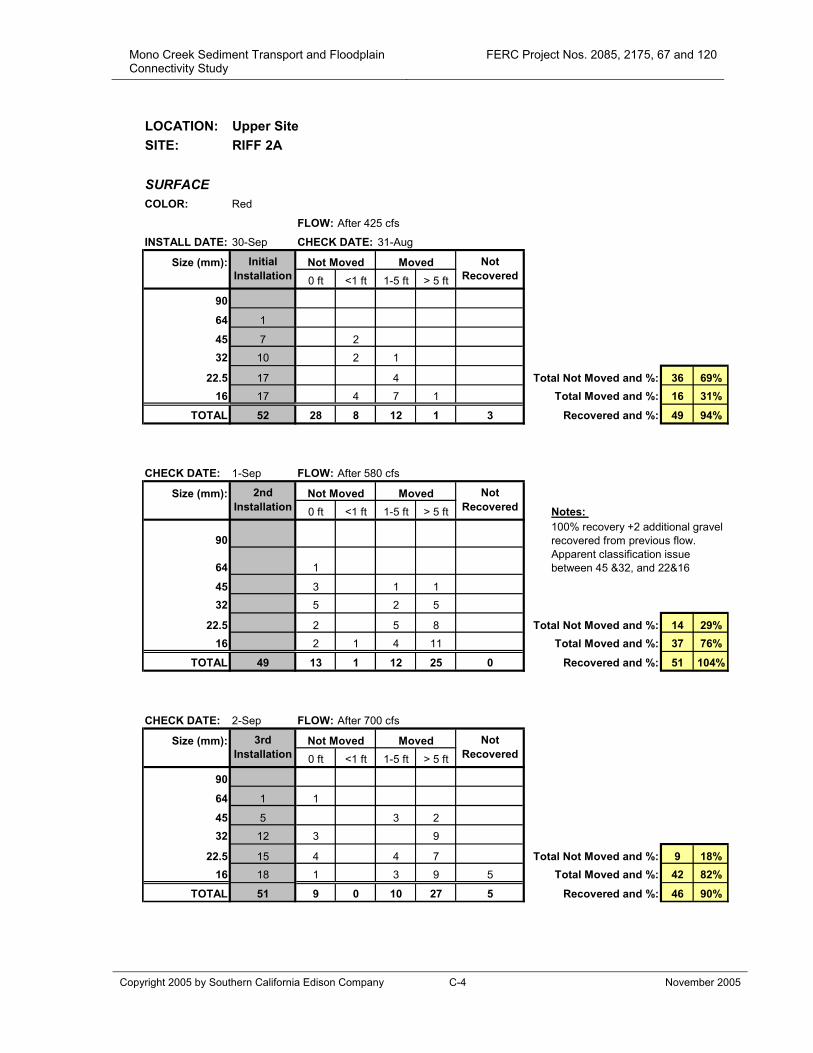
LOCATION: Upper SiteSITE: RIFF 2A
SURFACECOLOR: Red
FLOW: After 425 cfs
INSTALL DATE: 30-Sep CHECK DATE: 31-Aug
Size (mm): Not Moved Moved0 ft <1 ft 1-5 ft > 5 ft
90
64 1
45 7 232 10 2 1
22.5 17 4 Total Not Moved and %: 36 69%16 17 4 7 1 Total Moved and %: 16 31%
TOTAL 52 28 8 12 1 3 Recovered and %: 49 94%
CHECK DATE: 1-Sep FLOW: After 580 cfs
Size (mm): Not Moved Moved0 ft <1 ft 1-5 ft > 5 ft Notes:
90
64 1
45 3 1 132 5 2 5
22.5 2 5 8 Total Not Moved and %: 14 29%16 2 1 4 11 Total Moved and %: 37 76%
TOTAL 49 13 1 12 25 0 Recovered and %: 51 104%
CHECK DATE: 2-Sep FLOW: After 700 cfs
Size (mm): Not Moved Moved0 ft <1 ft 1-5 ft > 5 ft
90
64 1 1
45 5 3 232 12 3 9
22.5 15 4 4 7 Total Not Moved and %: 9 18%16 18 1 3 9 5 Total Moved and %: 42 82%
TOTAL 51 9 0 10 27 5 Recovered and %: 46 90%
100% recovery +2 additional gravel recovered from previous flow.Apparent classification issue between 45 &32, and 22&16
Initial Installation
Not Recovered
3rd Installation
Not Recovered
2nd Installation
Not Recovered
Mono Creek Sediment Transport and Floodplain Connectivity Study
FERC Project Nos. 2085, 2175, 67 and 120
Copyright 2005 by Southern California Edison Company C-5 November 2005
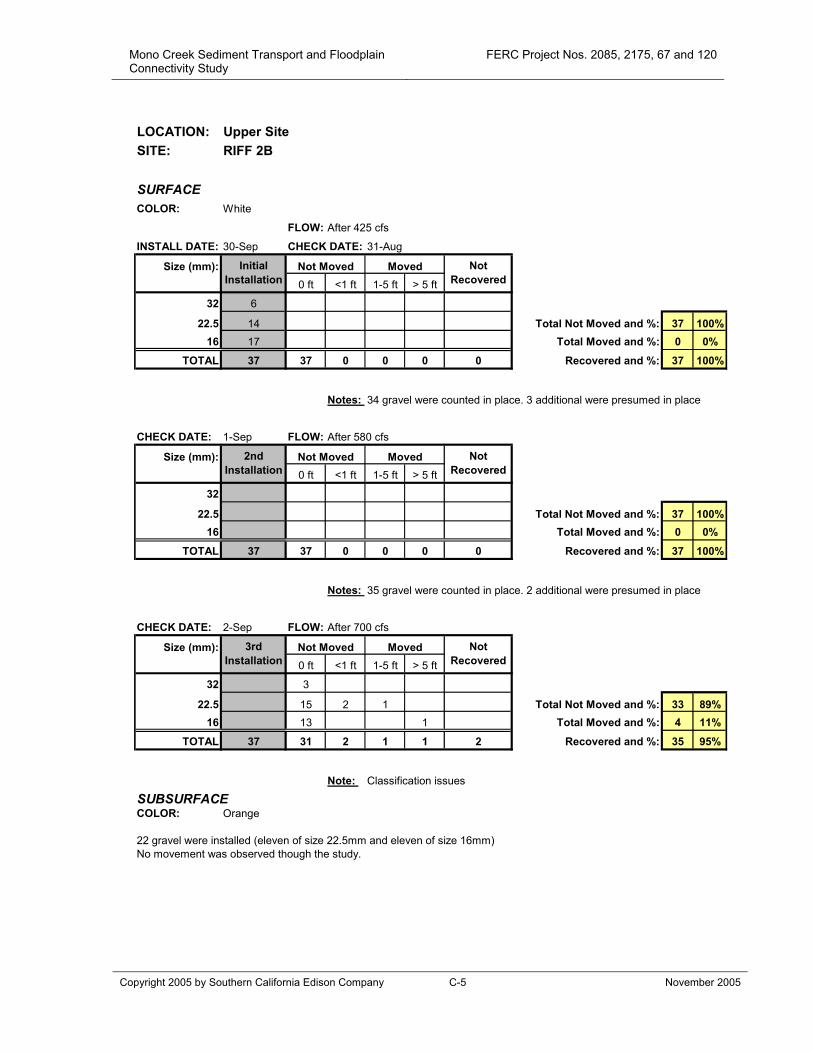
LOCATION: Upper SiteSITE: RIFF 2B
SURFACECOLOR: White
FLOW: After 425 cfs
INSTALL DATE: 30-Sep CHECK DATE: 31-Aug
Size (mm): Not Moved Moved0 ft <1 ft 1-5 ft > 5 ft
32 6
22.5 14 Total Not Moved and %: 37 100%16 17 Total Moved and %: 0 0%
TOTAL 37 37 0 0 0 0 Recovered and %: 37 100%
Notes: 34 gravel were counted in place. 3 additional were presumed in place
CHECK DATE: 1-Sep FLOW: After 580 cfs
Size (mm): Not Moved Moved0 ft <1 ft 1-5 ft > 5 ft
32
22.5 Total Not Moved and %: 37 100%16 Total Moved and %: 0 0%
TOTAL 37 37 0 0 0 0 Recovered and %: 37 100%
Notes: 35 gravel were counted in place. 2 additional were presumed in place
CHECK DATE: 2-Sep FLOW: After 700 cfs
Size (mm): Not Moved Moved0 ft <1 ft 1-5 ft > 5 ft
32 3
22.5 15 2 1 Total Not Moved and %: 33 89%16 13 1 Total Moved and %: 4 11%
TOTAL 37 31 2 1 1 2 Recovered and %: 35 95%
Note: Classification issues
SUBSURFACECOLOR: Orange
22 gravel were installed (eleven of size 22.5mm and eleven of size 16mm)No movement was observed though the study.
Initial Installation
Not Recovered
3rd Installation
Not Recovered
2nd Installation
Not Recovered

Mono Creek Sediment Transport and Floodplain Connectivity Study
FERC Project Nos. 2085, 2175, 67 and 120
Copyright 2005 by Southern California Edison Company C-6 November 2005
LOCATION: Upper SiteSITE: RIFF 2B (Bar gravel at Staff Gages)
SURFACECOLOR: Orange
FLOW: After 580 cfs
INSTALL DATE: 31-Aug CHECK DATE: 1-Sep
Size (mm): Not Moved Moved0 ft <1 ft 1-5 ft > 5 ft
90
64 1 1
45 2 1 132 11 4 1 6
22.5 7 5 2 Total Not Moved and %: 14 56%16 4 2 2 Total Moved and %: 11 44%
TOTAL 25 13 1 11 0 0 Recovered and %: 25 100%
CHECK DATE: 2-Sep FLOW: After 700 cfs
Size (mm): Not Moved Moved0 ft <1 ft 1-5 ft > 5 ft
90
64 1 1
45 2 132 11 6 2 2
22.5 7 4 1 1 3 Total Not Moved and %: 15 60%16 4 2 1 1 Total Moved and %: 10 40%
TOTAL 25 14 1 4 6 0 Recovered and %: 25 100%
Initial Installation
Not Recovered
3rd Installation
Not Recovered
Mono Creek Sediment Transport and Floodplain Connectivity Study
FERC Project Nos. 2085, 2175, 67 and 120
Copyright 2005 by Southern California Edison Company C-7 November 2005
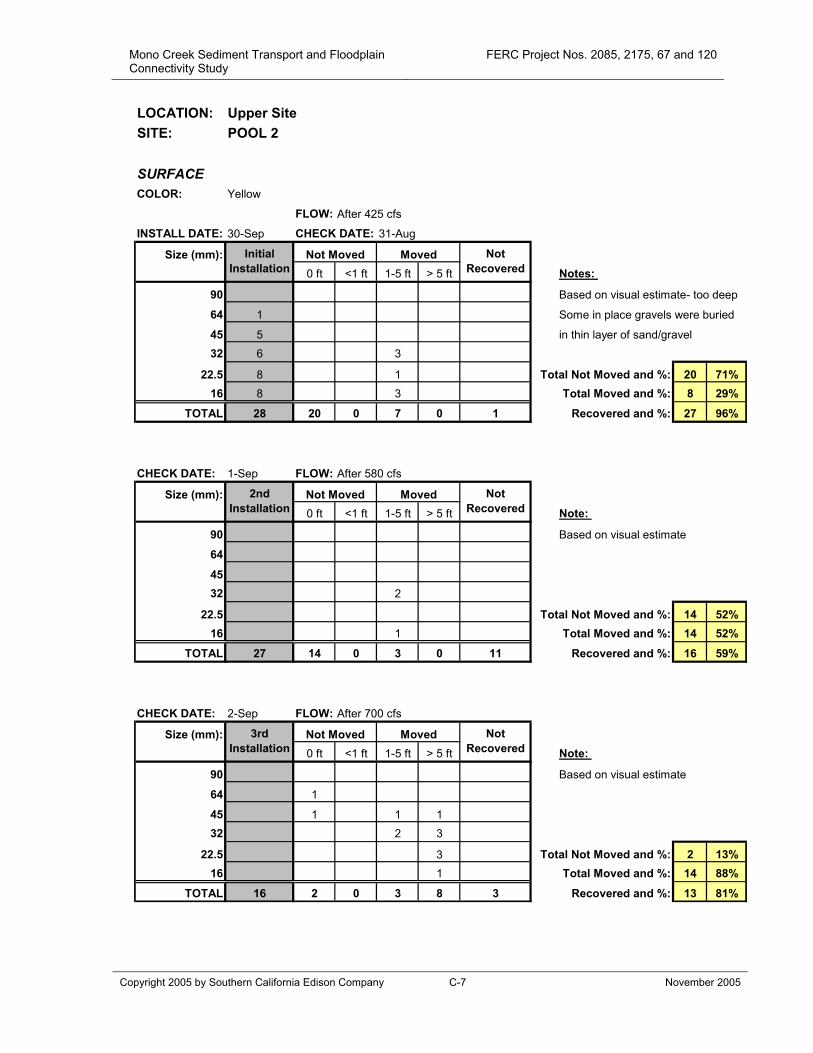
LOCATION: Upper SiteSITE: POOL 2
SURFACECOLOR: Yellow
FLOW: After 425 cfs
INSTALL DATE: 30-Sep CHECK DATE: 31-Aug
Size (mm): Not Moved Moved0 ft <1 ft 1-5 ft > 5 ft Notes:
90 Based on visual estimate- too deep
64 1 Some in place gravels were buried
45 5 in thin layer of sand/gravel32 6 3
22.5 8 1 Total Not Moved and %: 20 71%16 8 3 Total Moved and %: 8 29%
TOTAL 28 20 0 7 0 1 Recovered and %: 27 96%
CHECK DATE: 1-Sep FLOW: After 580 cfs
Size (mm): Not Moved Moved0 ft <1 ft 1-5 ft > 5 ft Note:
90 Based on visual estimate
64
4532 2
22.5 Total Not Moved and %: 14 52%16 1 Total Moved and %: 14 52%
TOTAL 27 14 0 3 0 11 Recovered and %: 16 59%
CHECK DATE: 2-Sep FLOW: After 700 cfs
Size (mm): Not Moved Moved0 ft <1 ft 1-5 ft > 5 ft Note:
90 Based on visual estimate
64 1
45 1 1 132 2 3
22.5 3 Total Not Moved and %: 2 13%16 1 Total Moved and %: 14 88%
TOTAL 16 2 0 3 8 3 Recovered and %: 13 81%
Initial Installation
Not Recovered
3rd Installation
Not Recovered
2nd Installation
Not Recovered

Mono Creek Sediment Transport and Floodplain Connectivity Study
FERC Project Nos. 2085, 2175, 67 and 120
Copyright 2005 by Southern California Edison Company C-8 November 2005
LOCATION: Lower SiteSITE: POOL 0
SURFACECOLOR: Blue
FLOW: After 425 cfs
INSTALL DATE: 30-Sep CHECK DATE: 31-Aug
Size (mm): Not Moved Moved0 ft <1 ft 1-5 ft > 5 ft
90
64 2 2
45 7 2 3 232 11 6 3 2
22.5 13 2 1 3 7 Total Not Moved and %: 15 32%16 14 1 1 4 8 Total Moved and %: 32 68%
TOTAL 47 13 2 6 16 10 Recovered and %: 37 79%
CHECK DATE: 1-Sep FLOW: After 580 cfs
Size (mm): Not Moved Moved0 ft <1 ft 1-5 ft > 5 ft
90
64 2 1
45 5 332 11 1 7
22.5 13 2 2 4 Total Not Moved and %: 15 41%16 6 1 2 1 Total Moved and %: 22 59%
TOTAL 37 12 3 5 16 1 Recovered and %: 36 97%
CHECK DATE: 2-Sep FLOW: After 700 cfs
Size (mm): Not Moved Moved0 ft <1 ft 1-5 ft > 5 ft Notes:
90 100% recovery
64 2
45 3 1 232 4 1 7
22.5 2 1 1 7 Total Not Moved and %: 14 39%16 2 1 3 Total Moved and %: 23 64%
TOTAL 36 13 1 4 19 0 Recovered and %: 37 103%
+ additional gravel recovered from previous flow
Initial Installation
Not Recovered
3rd Installation
Not Recovered
2nd Installation
Not Recovered
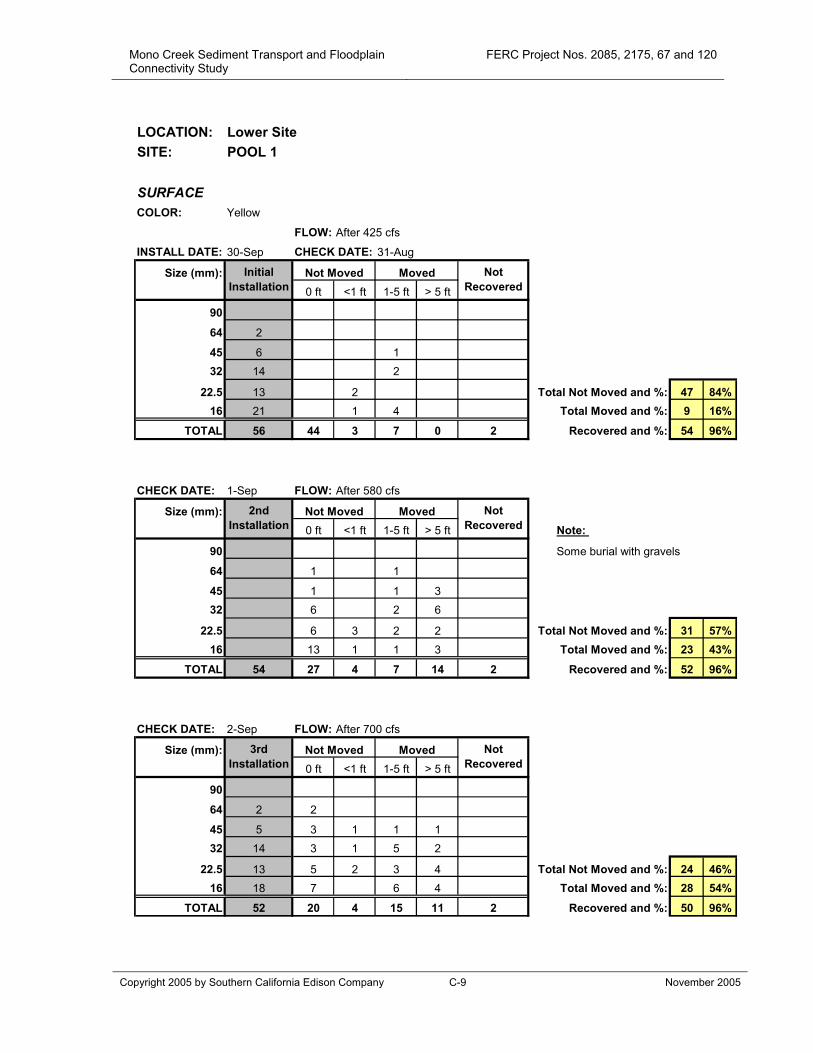
Mono Creek Sediment Transport and Floodplain Connectivity Study
FERC Project Nos. 2085, 2175, 67 and 120
Copyright 2005 by Southern California Edison Company C-9 November 2005
LOCATION: Lower SiteSITE: POOL 1
SURFACECOLOR: Yellow
FLOW: After 425 cfs
INSTALL DATE: 30-Sep CHECK DATE: 31-Aug
Size (mm): Not Moved Moved0 ft <1 ft 1-5 ft > 5 ft
90
64 2
45 6 132 14 2
22.5 13 2 Total Not Moved and %: 47 84%16 21 1 4 Total Moved and %: 9 16%
TOTAL 56 44 3 7 0 2 Recovered and %: 54 96%
CHECK DATE: 1-Sep FLOW: After 580 cfs
Size (mm): Not Moved Moved0 ft <1 ft 1-5 ft > 5 ft Note:
90 Some burial with gravels
64 1 1
45 1 1 332 6 2 6
22.5 6 3 2 2 Total Not Moved and %: 31 57%16 13 1 1 3 Total Moved and %: 23 43%
TOTAL 54 27 4 7 14 2 Recovered and %: 52 96%
CHECK DATE: 2-Sep FLOW: After 700 cfs
Size (mm): Not Moved Moved0 ft <1 ft 1-5 ft > 5 ft
90
64 2 2
45 5 3 1 1 132 14 3 1 5 2
22.5 13 5 2 3 4 Total Not Moved and %: 24 46%16 18 7 6 4 Total Moved and %: 28 54%
TOTAL 52 20 4 15 11 2 Recovered and %: 50 96%
Initial Installation
Not Recovered
3rd Installation
Not Recovered
2nd Installation
Not Recovered
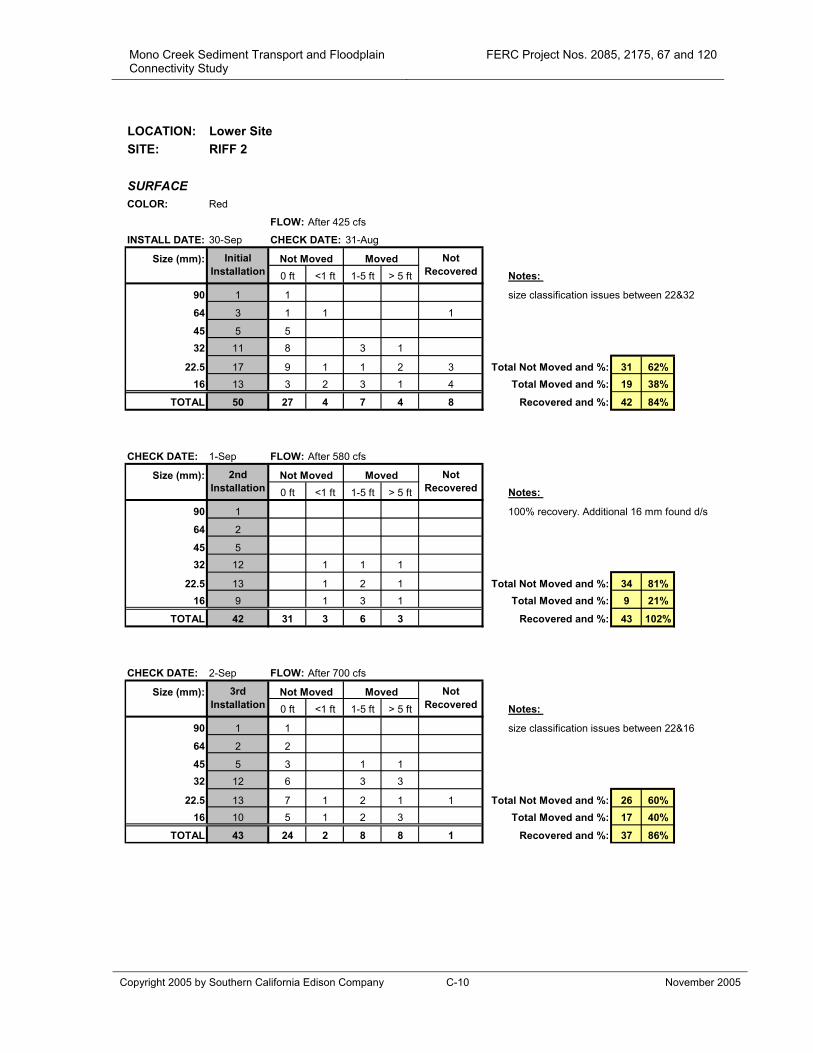
Mono Creek Sediment Transport and Floodplain Connectivity Study
FERC Project Nos. 2085, 2175, 67 and 120
Copyright 2005 by Southern California Edison Company C-10 November 2005
LOCATION: Lower SiteSITE: RIFF 2
SURFACECOLOR: Red
FLOW: After 425 cfs
INSTALL DATE: 30-Sep CHECK DATE: 31-Aug
Size (mm): Not Moved Moved0 ft <1 ft 1-5 ft > 5 ft Notes:
90 1 1 size classification issues between 22&32
64 3 1 1 1
45 5 532 11 8 3 1
22.5 17 9 1 1 2 3 Total Not Moved and %: 31 62%16 13 3 2 3 1 4 Total Moved and %: 19 38%
TOTAL 50 27 4 7 4 8 Recovered and %: 42 84%
CHECK DATE: 1-Sep FLOW: After 580 cfs
Size (mm): Not Moved Moved0 ft <1 ft 1-5 ft > 5 ft Notes:
90 1 100% recovery. Additional 16 mm found d/s
64 2
45 532 12 1 1 1
22.5 13 1 2 1 Total Not Moved and %: 34 81%16 9 1 3 1 Total Moved and %: 9 21%
TOTAL 42 31 3 6 3 Recovered and %: 43 102%
CHECK DATE: 2-Sep FLOW: After 700 cfs
Size (mm): Not Moved Moved0 ft <1 ft 1-5 ft > 5 ft Notes:
90 1 1 size classification issues between 22&16
64 2 2
45 5 3 1 132 12 6 3 3
22.5 13 7 1 2 1 1 Total Not Moved and %: 26 60%16 10 5 1 2 3 Total Moved and %: 17 40%
TOTAL 43 24 2 8 8 1 Recovered and %: 37 86%
Initial Installation
Not Recovered
3rd Installation
Not Recovered
2nd Installation
Not Recovered
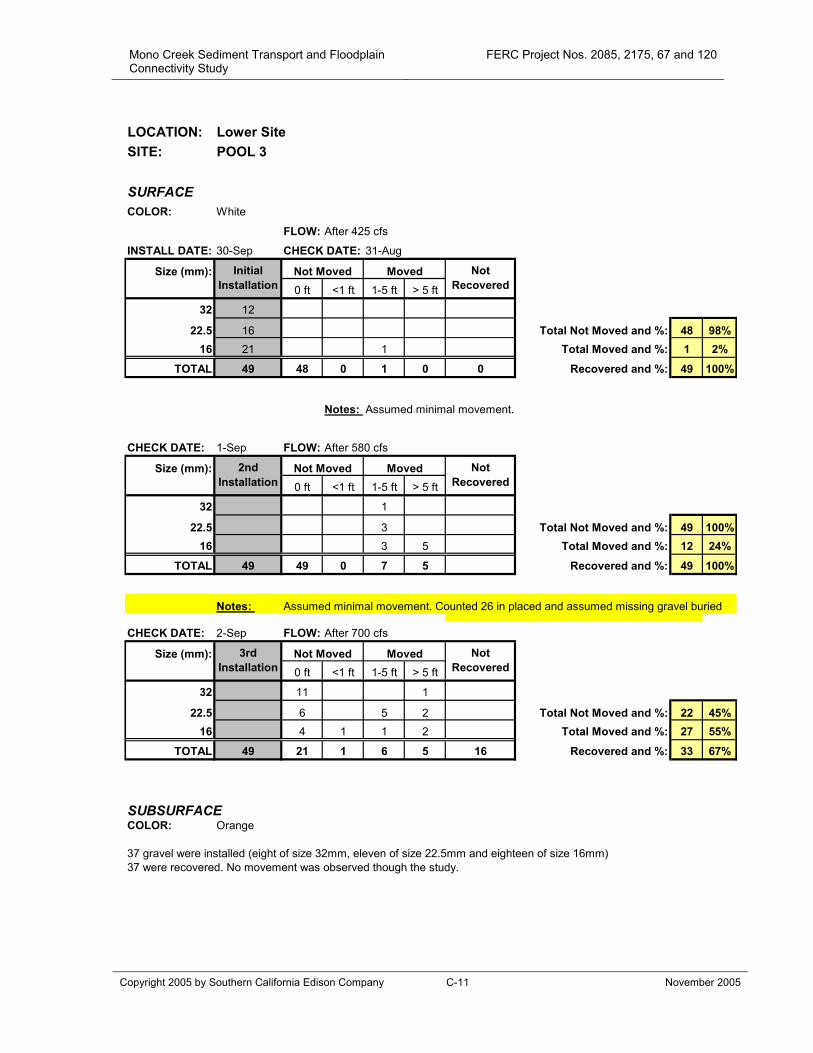
Mono Creek Sediment Transport and Floodplain Connectivity Study
FERC Project Nos. 2085, 2175, 67 and 120
Copyright 2005 by Southern California Edison Company C-11 November 2005
LOCATION: Lower SiteSITE: POOL 3
SURFACECOLOR: White
FLOW: After 425 cfs
INSTALL DATE: 30-Sep CHECK DATE: 31-Aug
Size (mm): Not Moved Moved0 ft <1 ft 1-5 ft > 5 ft
32 12
22.5 16 Total Not Moved and %: 48 98%16 21 1 Total Moved and %: 1 2%
TOTAL 49 48 0 1 0 0 Recovered and %: 49 100%
Notes: Assumed minimal movement.
CHECK DATE: 1-Sep FLOW: After 580 cfs
Size (mm): Not Moved Moved0 ft <1 ft 1-5 ft > 5 ft
32 1
22.5 3 Total Not Moved and %: 49 100%16 3 5 Total Moved and %: 12 24%
TOTAL 49 49 0 7 5 Recovered and %: 49 100%
Notes: Assumed minimal movement. Counted 26 in placed and assumed missing gravel buried
CHECK DATE: 2-Sep FLOW: After 700 cfs
Size (mm): Not Moved Moved0 ft <1 ft 1-5 ft > 5 ft
32 11 1
22.5 6 5 2 Total Not Moved and %: 22 45%16 4 1 1 2 Total Moved and %: 27 55%
TOTAL 49 21 1 6 5 16 Recovered and %: 33 67%
SUBSURFACECOLOR: Orange
37 gravel were installed (eight of size 32mm, eleven of size 22.5mm and eighteen of size 16mm)37 were recovered. No movement was observed though the study.
Initial Installation
Not Recovered
3rd Installation
Not Recovered
2nd Installation
Not Recovered
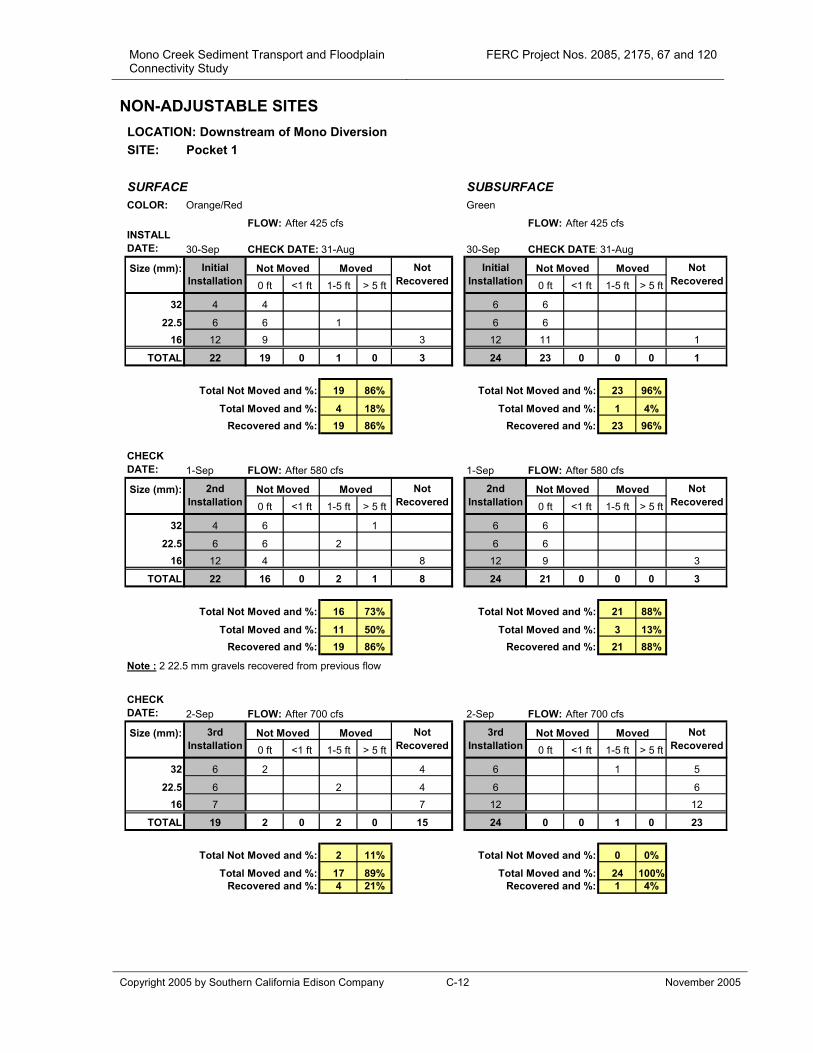
Mono Creek Sediment Transport and Floodplain Connectivity Study
FERC Project Nos. 2085, 2175, 67 and 120
Copyright 2005 by Southern California Edison Company C-12 November 2005
NON-ADJUSTABLE SITES
LOCATION: Downstream of Mono DiversionSITE: Pocket 1
SURFACE SUBSURFACECOLOR: Orange/Red Green
FLOW: After 425 cfs FLOW: After 425 cfsINSTALL DATE: 30-Sep CHECK DATE: 31-Aug 30-Sep CHECK DATE:31-Aug
Size (mm): Not Moved Moved Not Moved Moved0 ft <1 ft 1-5 ft > 5 ft 0 ft <1 ft 1-5 ft > 5 ft
32 4 4 6 6
22.5 6 6 1 6 616 12 9 3 12 11 1
TOTAL 22 19 0 1 0 3 24 23 0 0 0 1
Total Not Moved and %: 19 86% Total Not Moved and %: 23 96%
Total Moved and %: 4 18% Total Moved and %: 1 4%Recovered and %: 19 86% Recovered and %: 23 96%
CHECK DATE: 1-Sep FLOW: After 580 cfs 1-Sep FLOW: After 580 cfs
Size (mm): Not Moved Moved Not Moved Moved0 ft <1 ft 1-5 ft > 5 ft 0 ft <1 ft 1-5 ft > 5 ft
32 4 6 1 6 6
22.5 6 6 2 6 616 12 4 8 12 9 3
TOTAL 22 16 0 2 1 8 24 21 0 0 0 3
Total Not Moved and %: 16 73% Total Not Moved and %: 21 88%
Total Moved and %: 11 50% Total Moved and %: 3 13%Recovered and %: 19 86% Recovered and %: 21 88%
Note : 2 22.5 mm gravels recovered from previous flow
CHECK DATE: 2-Sep FLOW: After 700 cfs 2-Sep FLOW: After 700 cfs
Size (mm): Not Moved Moved Not Moved Moved0 ft <1 ft 1-5 ft > 5 ft 0 ft <1 ft 1-5 ft > 5 ft
32 6 2 4 6 1 5
22.5 6 2 4 6 616 7 7 12 12
TOTAL 19 2 0 2 0 15 24 0 0 1 0 23
Total Not Moved and %: 2 11% Total Not Moved and %: 0 0%
Total Moved and %: 17 89% Total Moved and %: 24 100%Recovered and %: 4 21% Recovered and %: 1 4%
Initial Installation
Not Recovered
3rd Installation
Not Recovered
2nd Installation
3rd Installation
Not Recovered
Not Recovered
Initial Installation
Not Recovered
2nd Installation
Not Recovered

Mono Creek Sediment Transport and Floodplain Connectivity Study
FERC Project Nos. 2085, 2175, 67 and 120
Copyright 2005 by Southern California Edison Company C-13 November 2005
LOCATION: Downstream of Mono DiversionSITE: Pocket 2
SURFACE SUBSURFACECOLOR: Red Blue
FLOW: After 425 cfs FLOW: After 425 cfsINSTALL DATE: 30-Sep CHECK DATE: 31-Aug 30-Sep CHECK DATE:31-Aug
Size (mm): Not Moved Moved Not Moved Moved0 ft <1 ft 1-5 ft > 5 ft 0 ft <1 ft 1-5 ft > 5 ft
32 5 2 3 5 2 3
22.5 6 2 4 6 2 3 116 12 1 1 10 12 2 1 9
TOTAL 23 0 0 3 3 17 23 2 0 4 4 13
Total Not Moved and %: 0 0% Total Not Moved and %: 2 9%
Total Moved and %: 23 100% Total Moved and %: 21 91%Recovered and %: 6 26% Recovered and %: 10 43%
Notes:Pocket not restablished after flow of 450cfs. The following gravels were recovered after 600 cfs:
1 large Blue, 1 large red, 1 small red, 1 medium blue 15ft d/s
Initial Installation
Not Recovered
Initial Installation
Not Recovered
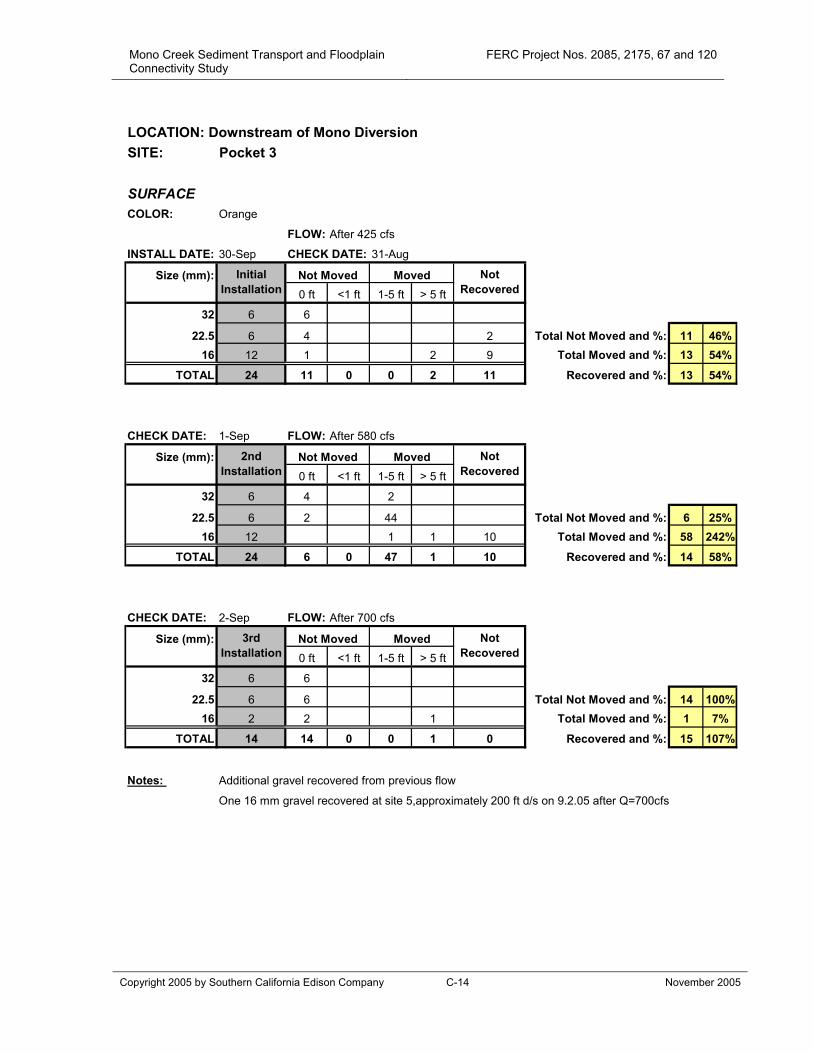
Mono Creek Sediment Transport and Floodplain Connectivity Study
FERC Project Nos. 2085, 2175, 67 and 120
Copyright 2005 by Southern California Edison Company C-14 November 2005
LOCATION: Downstream of Mono DiversionSITE: Pocket 3
SURFACECOLOR: Orange
FLOW: After 425 cfs
INSTALL DATE: 30-Sep CHECK DATE: 31-Aug
Size (mm): Not Moved Moved0 ft <1 ft 1-5 ft > 5 ft
32 6 6
22.5 6 4 2 Total Not Moved and %: 11 46%16 12 1 2 9 Total Moved and %: 13 54%
TOTAL 24 11 0 0 2 11 Recovered and %: 13 54%
CHECK DATE: 1-Sep FLOW: After 580 cfs
Size (mm): Not Moved Moved0 ft <1 ft 1-5 ft > 5 ft
32 6 4 2
22.5 6 2 44 Total Not Moved and %: 6 25%16 12 1 1 10 Total Moved and %: 58 242%
TOTAL 24 6 0 47 1 10 Recovered and %: 14 58%
CHECK DATE: 2-Sep FLOW: After 700 cfs
Size (mm): Not Moved Moved0 ft <1 ft 1-5 ft > 5 ft
32 6 6
22.5 6 6 Total Not Moved and %: 14 100%16 2 2 1 Total Moved and %: 1 7%
TOTAL 14 14 0 0 1 0 Recovered and %: 15 107%
Notes: Additional gravel recovered from previous flow
One 16 mm gravel recovered at site 5,approximately 200 ft d/s on 9.2.05 after Q=700cfs
Initial Installation
Not Recovered
3rd Installation
Not Recovered
2nd Installation
Not Recovered
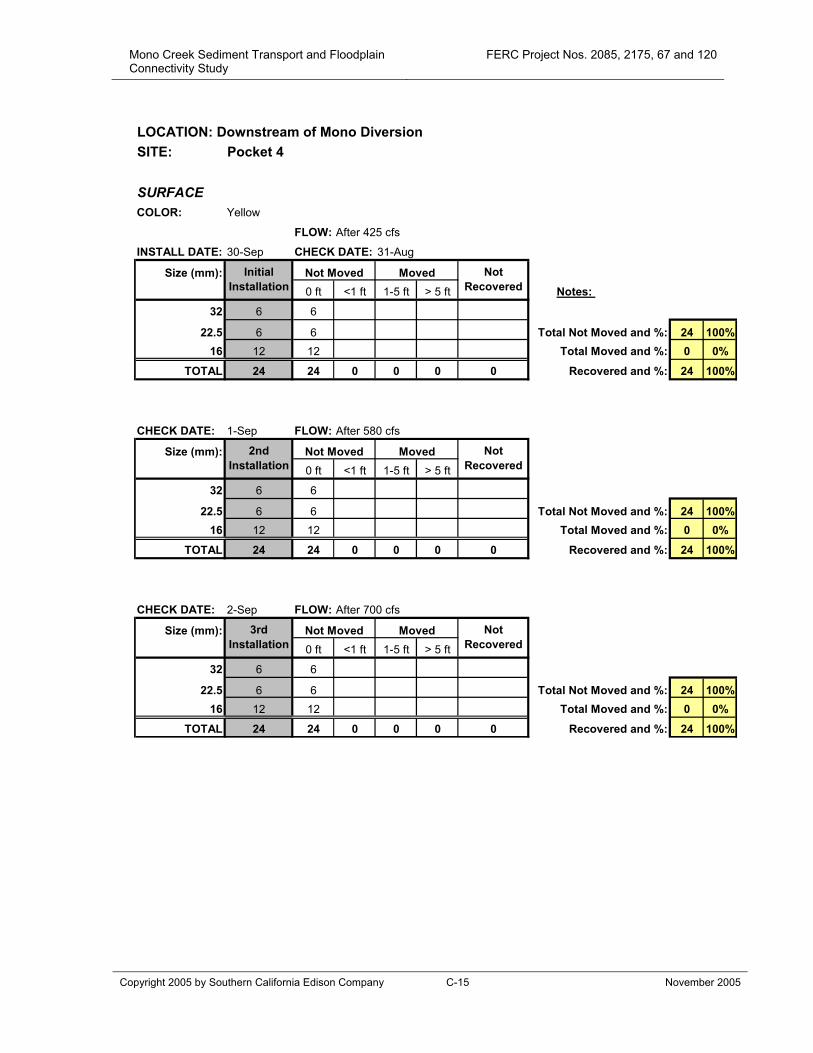
Mono Creek Sediment Transport and Floodplain Connectivity Study
FERC Project Nos. 2085, 2175, 67 and 120
Copyright 2005 by Southern California Edison Company C-15 November 2005
LOCATION: Downstream of Mono DiversionSITE: Pocket 4
SURFACECOLOR: Yellow
FLOW: After 425 cfs
INSTALL DATE: 30-Sep CHECK DATE: 31-Aug
Size (mm): Not Moved Moved0 ft <1 ft 1-5 ft > 5 ft Notes:
32 6 6
22.5 6 6 Total Not Moved and %: 24 100%16 12 12 Total Moved and %: 0 0%
TOTAL 24 24 0 0 0 0 Recovered and %: 24 100%
CHECK DATE: 1-Sep FLOW: After 580 cfs
Size (mm): Not Moved Moved0 ft <1 ft 1-5 ft > 5 ft
32 6 6
22.5 6 6 Total Not Moved and %: 24 100%16 12 12 Total Moved and %: 0 0%
TOTAL 24 24 0 0 0 0 Recovered and %: 24 100%
CHECK DATE: 2-Sep FLOW: After 700 cfs
Size (mm): Not Moved Moved0 ft <1 ft 1-5 ft > 5 ft
32 6 6
22.5 6 6 Total Not Moved and %: 24 100%16 12 12 Total Moved and %: 0 0%
TOTAL 24 24 0 0 0 0 Recovered and %: 24 100%
Initial Installation
Not Recovered
3rd Installation
Not Recovered
2nd Installation
Not Recovered
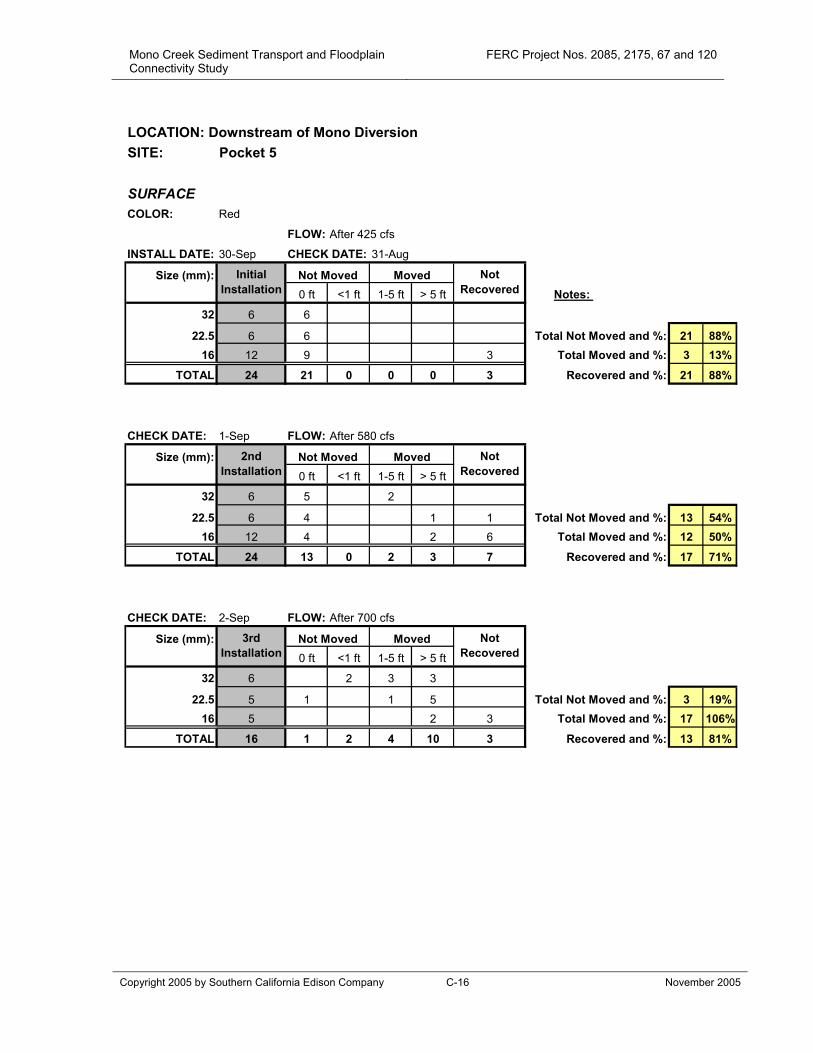
Mono Creek Sediment Transport and Floodplain Connectivity Study
FERC Project Nos. 2085, 2175, 67 and 120
Copyright 2005 by Southern California Edison Company C-16 November 2005
LOCATION: Downstream of Mono DiversionSITE: Pocket 5
SURFACECOLOR: Red
FLOW: After 425 cfs
INSTALL DATE: 30-Sep CHECK DATE: 31-Aug
Size (mm): Not Moved Moved0 ft <1 ft 1-5 ft > 5 ft Notes:
32 6 6
22.5 6 6 Total Not Moved and %: 21 88%16 12 9 3 Total Moved and %: 3 13%
TOTAL 24 21 0 0 0 3 Recovered and %: 21 88%
CHECK DATE: 1-Sep FLOW: After 580 cfs
Size (mm): Not Moved Moved0 ft <1 ft 1-5 ft > 5 ft
32 6 5 2
22.5 6 4 1 1 Total Not Moved and %: 13 54%16 12 4 2 6 Total Moved and %: 12 50%
TOTAL 24 13 0 2 3 7 Recovered and %: 17 71%
CHECK DATE: 2-Sep FLOW: After 700 cfs
Size (mm): Not Moved Moved0 ft <1 ft 1-5 ft > 5 ft
32 6 2 3 3
22.5 5 1 1 5 Total Not Moved and %: 3 19%16 5 2 3 Total Moved and %: 17 106%
TOTAL 16 1 2 4 10 3 Recovered and %: 13 81%
Initial Installation
Not Recovered
3rd Installation
Not Recovered
2nd Installation
Not Recovered
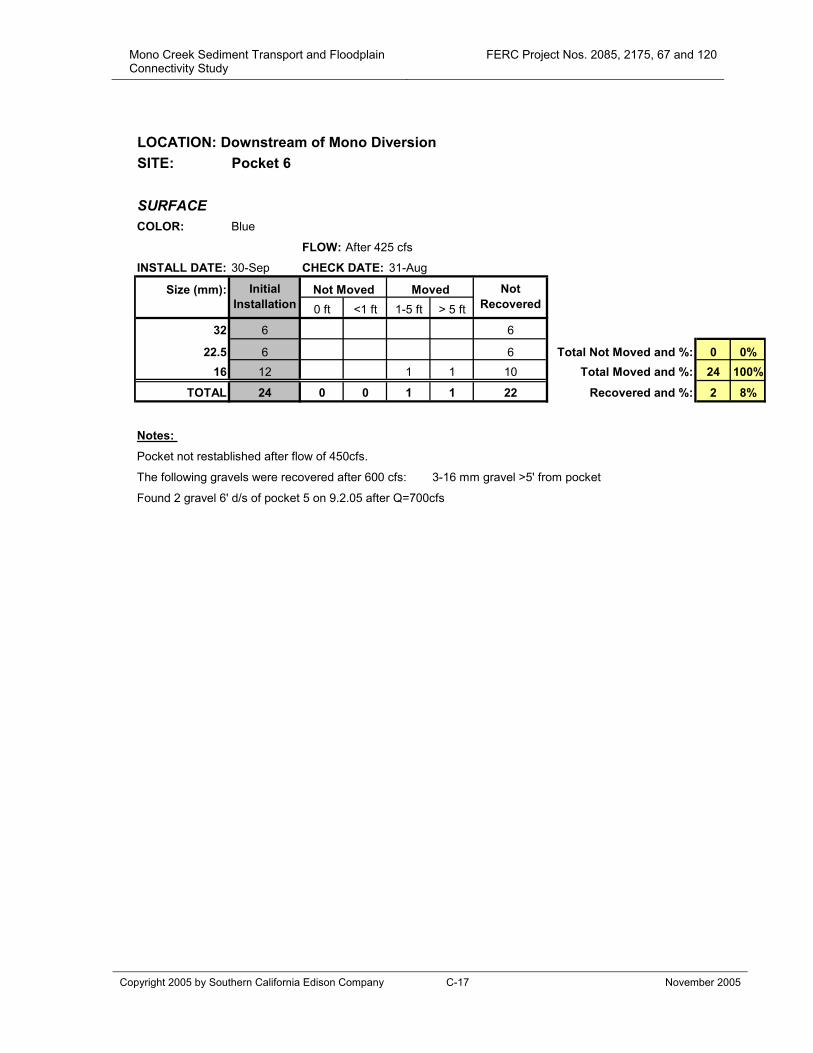
Mono Creek Sediment Transport and Floodplain Connectivity Study
FERC Project Nos. 2085, 2175, 67 and 120
Copyright 2005 by Southern California Edison Company C-17 November 2005
LOCATION: Downstream of Mono DiversionSITE: Pocket 6
SURFACECOLOR: Blue
FLOW: After 425 cfs
INSTALL DATE: 30-Sep CHECK DATE: 31-Aug
Size (mm): Not Moved Moved0 ft <1 ft 1-5 ft > 5 ft
32 6 6
22.5 6 6 Total Not Moved and %: 0 0%16 12 1 1 10 Total Moved and %: 24 100%
TOTAL 24 0 0 1 1 22 Recovered and %: 2 8%
Notes:
Pocket not restablished after flow of 450cfs.
The following gravels were recovered after 600 cfs: 3-16 mm gravel >5' from pocket
Found 2 gravel 6' d/s of pocket 5 on 9.2.05 after Q=700cfs
Initial Installation
Not Recovered
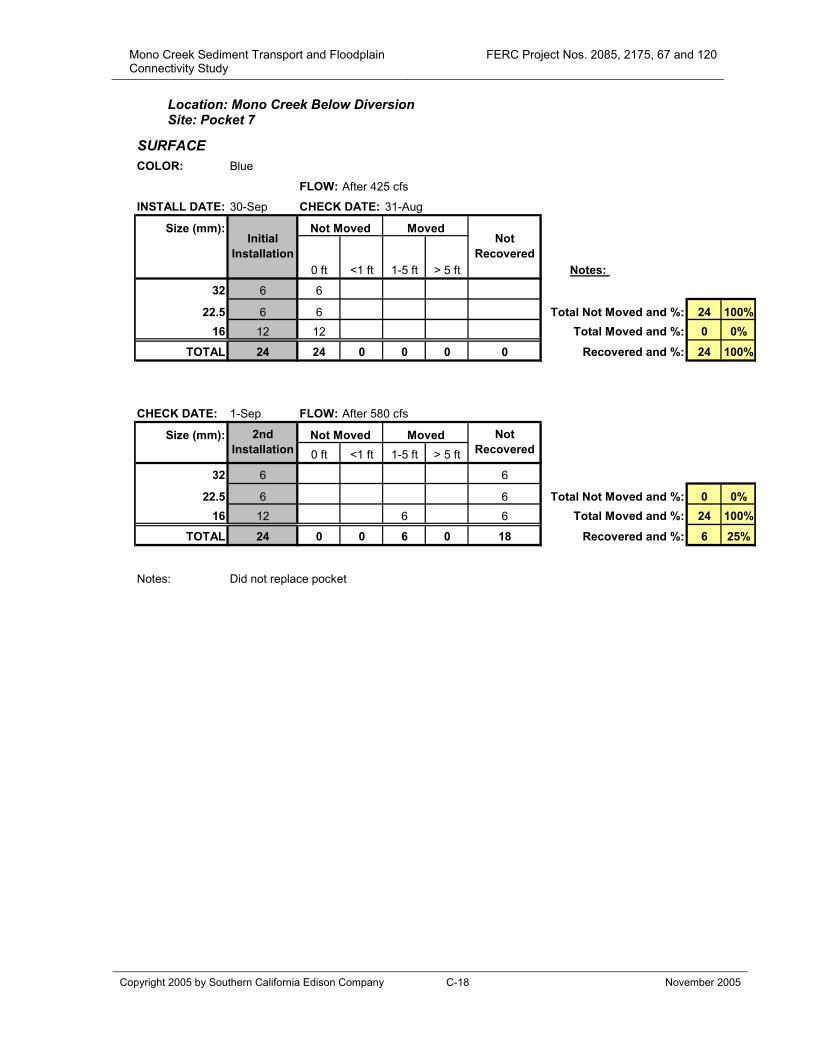
Mono Creek Sediment Transport and Floodplain Connectivity Study
FERC Project Nos. 2085, 2175, 67 and 120
Copyright 2005 by Southern California Edison Company C-18 November 2005
Location: Mono Creek Below Diversion Site: Pocket 7
SURFACECOLOR: Blue
FLOW: After 425 cfs
INSTALL DATE: 30-Sep CHECK DATE: 31-Aug
Size (mm): Not Moved Moved
0 ft <1 ft 1-5 ft > 5 ft Notes:
32 6 6
22.5 6 6 Total Not Moved and %: 24 100%16 12 12 Total Moved and %: 0 0%
TOTAL 24 24 0 0 0 0 Recovered and %: 24 100%
CHECK DATE: 1-Sep FLOW: After 580 cfs
Size (mm): Not Moved Moved0 ft <1 ft 1-5 ft > 5 ft
32 6 6
22.5 6 6 Total Not Moved and %: 0 0%16 12 6 6 Total Moved and %: 24 100%
TOTAL 24 0 0 6 0 18 Recovered and %: 6 25%
Notes: Did not replace pocket
Initial Installation
Not Recovered
2nd Installation
Not Recovered
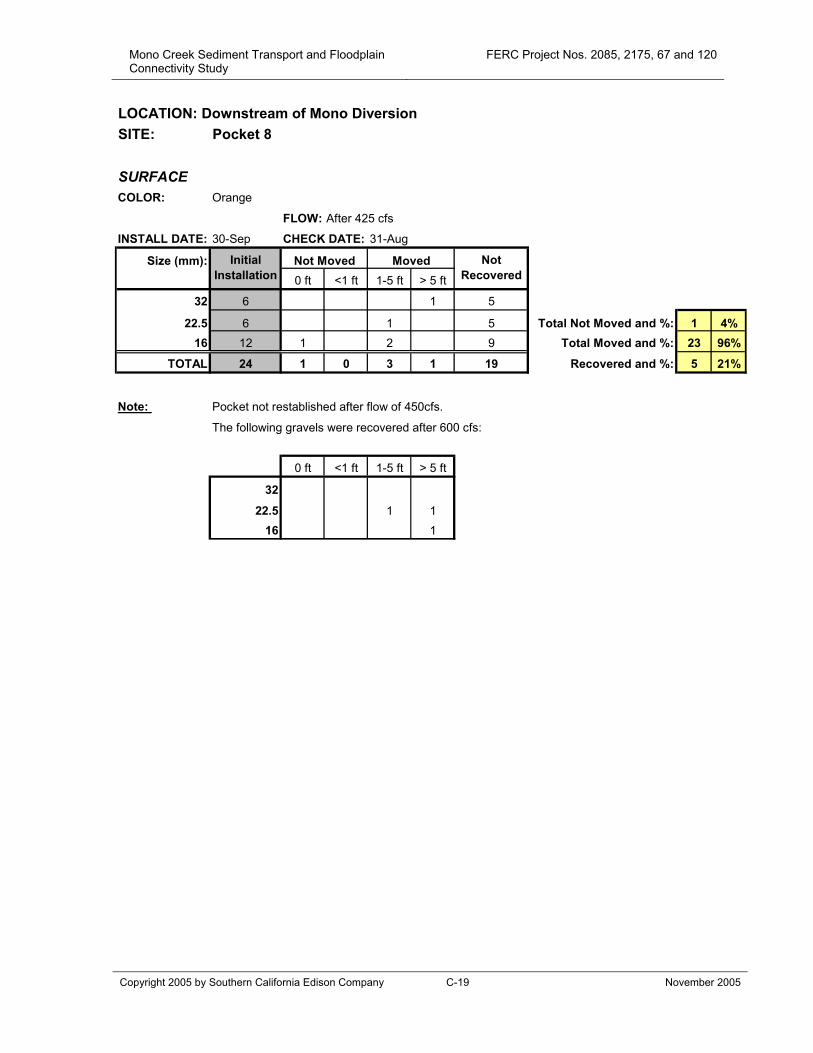
Mono Creek Sediment Transport and Floodplain Connectivity Study
FERC Project Nos. 2085, 2175, 67 and 120
Copyright 2005 by Southern California Edison Company C-19 November 2005
LOCATION: Downstream of Mono DiversionSITE: Pocket 8
SURFACECOLOR: Orange
FLOW: After 425 cfs
INSTALL DATE: 30-Sep CHECK DATE: 31-Aug
Size (mm): Not Moved Moved0 ft <1 ft 1-5 ft > 5 ft
32 6 1 5
22.5 6 1 5 Total Not Moved and %: 1 4%16 12 1 2 9 Total Moved and %: 23 96%
TOTAL 24 1 0 3 1 19 Recovered and %: 5 21%
Note: Pocket not restablished after flow of 450cfs.
The following gravels were recovered after 600 cfs:
0 ft <1 ft 1-5 ft > 5 ft
32
22.5 1 116 1
Initial Installation
Not Recovered
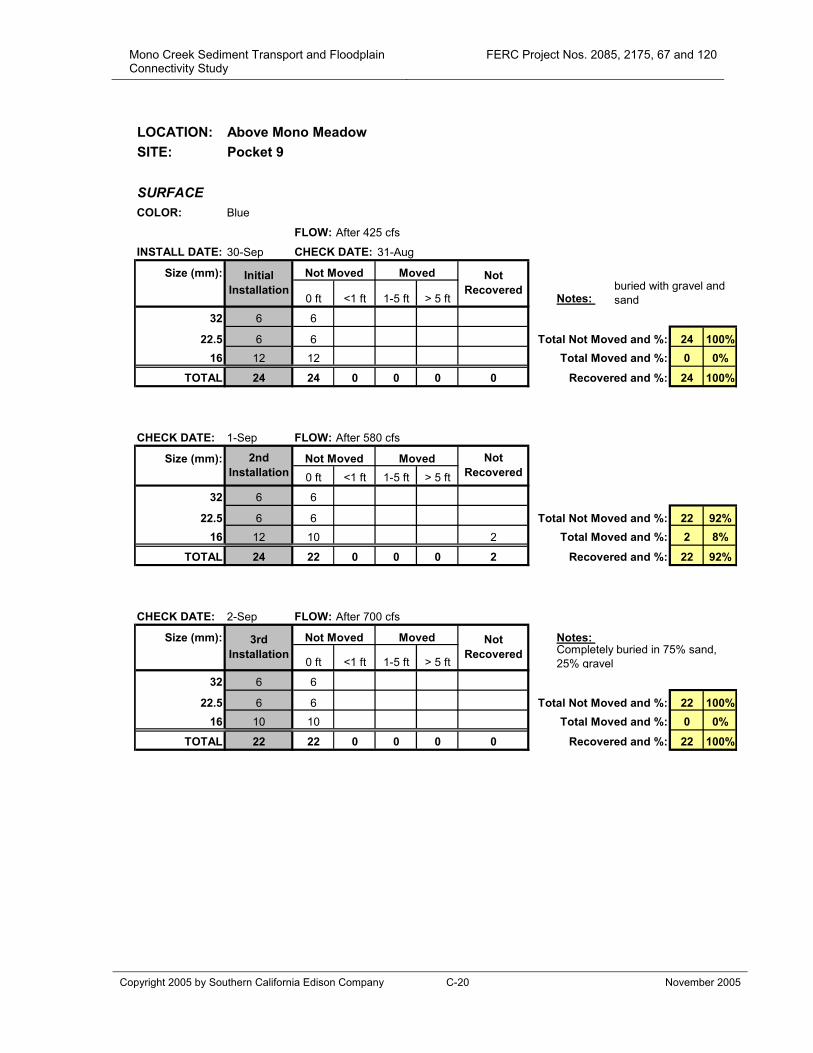
Mono Creek Sediment Transport and Floodplain Connectivity Study
FERC Project Nos. 2085, 2175, 67 and 120
Copyright 2005 by Southern California Edison Company C-20 November 2005
LOCATION: Above Mono MeadowSITE: Pocket 9
SURFACECOLOR: Blue
FLOW: After 425 cfs
INSTALL DATE: 30-Sep CHECK DATE: 31-Aug
Size (mm): Not Moved Moved
0 ft <1 ft 1-5 ft > 5 ft Notes:
32 6 6
22.5 6 6 Total Not Moved and %: 24 100%16 12 12 Total Moved and %: 0 0%
TOTAL 24 24 0 0 0 0 Recovered and %: 24 100%
CHECK DATE: 1-Sep FLOW: After 580 cfs
Size (mm): Not Moved Moved0 ft <1 ft 1-5 ft > 5 ft
32 6 6
22.5 6 6 Total Not Moved and %: 22 92%16 12 10 2 Total Moved and %: 2 8%
TOTAL 24 22 0 0 0 2 Recovered and %: 22 92%
CHECK DATE: 2-Sep FLOW: After 700 cfs
Size (mm): Not Moved Moved Notes:
0 ft <1 ft 1-5 ft > 5 ft
32 6 6
22.5 6 6 Total Not Moved and %: 22 100%16 10 10 Total Moved and %: 0 0%
TOTAL 22 22 0 0 0 0 Recovered and %: 22 100%
buried with gravel and sand
Completely buried in 75% sand, 25% gravel
Initial Installation
Not Recovered
3rd Installation
Not Recovered
2nd Installation
Not Recovered

Mono Creek Sediment Transport and Floodplain Connectivity Study
FERC Project Nos. 2085, 2175, 67 and 120
Copyright 2005 by Southern California Edison Company C-21 November 2005
LOCATION: Above Mono MeadowSITE: Pocket 10
SURFACECOLOR: Orange
FLOW: After 425 cfs
INSTALL DATE: 30-Sep CHECK DATE: 31-Aug
Size (mm): Not Moved Moved0 ft <1 ft 1-5 ft > 5 ft
32 6 6
22.5 6 3 3 Total Not Moved and %: 14 58%16 12 5 7 Total Moved and %: 10 42%
TOTAL 24 14 0 3 0 7 Recovered and %: 17 71%
CHECK DATE: 1-Sep FLOW: After 580 cfs
Size (mm): Not Moved Moved0 ft <1 ft 1-5 ft > 5 ft
32 6 6
22.5 6 6 Total Not Moved and %: 0 0%16 5 2 3 Total Moved and %: 17 100%
TOTAL 17 0 0 2 0 15 Recovered and %: 2 12%
Notes: Pocket not replaced
Initial Installation
Not Recovered
2nd Installation
Not Recovered
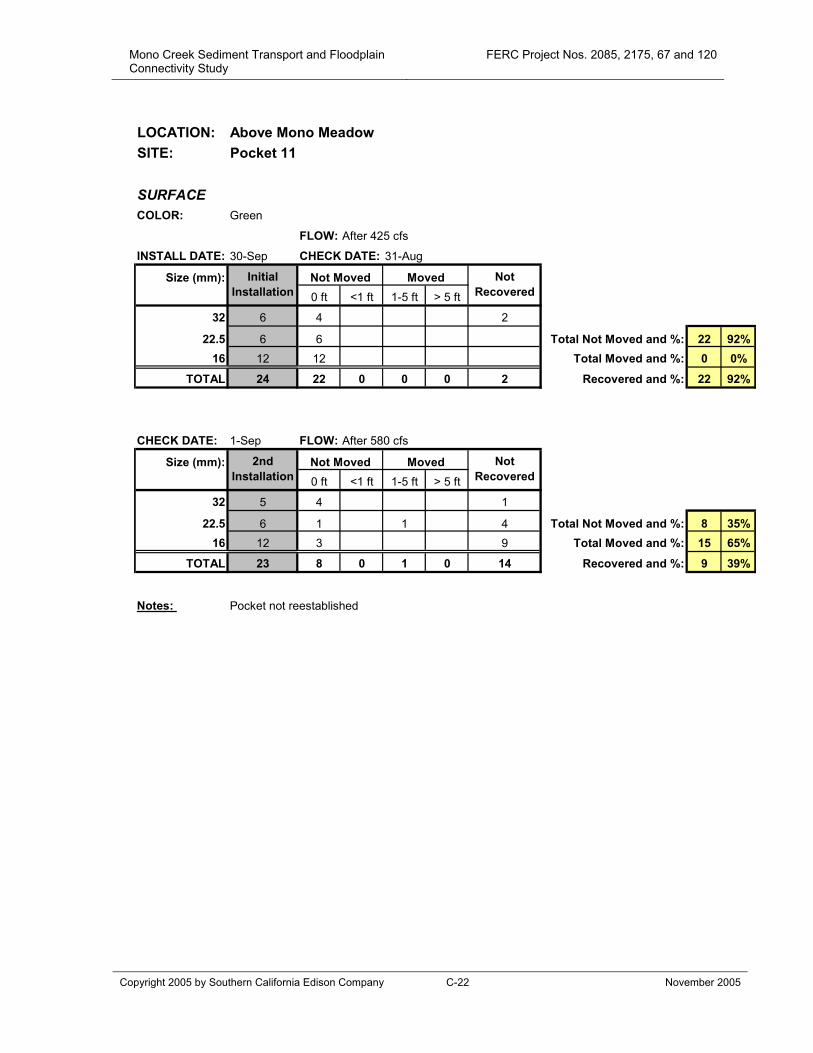
Mono Creek Sediment Transport and Floodplain Connectivity Study
FERC Project Nos. 2085, 2175, 67 and 120
Copyright 2005 by Southern California Edison Company C-22 November 2005
LOCATION: Above Mono MeadowSITE: Pocket 11
SURFACECOLOR: Green
FLOW: After 425 cfs
INSTALL DATE: 30-Sep CHECK DATE: 31-Aug
Size (mm): Not Moved Moved0 ft <1 ft 1-5 ft > 5 ft
32 6 4 2
22.5 6 6 Total Not Moved and %: 22 92%16 12 12 Total Moved and %: 0 0%
TOTAL 24 22 0 0 0 2 Recovered and %: 22 92%
CHECK DATE: 1-Sep FLOW: After 580 cfs
Size (mm): Not Moved Moved0 ft <1 ft 1-5 ft > 5 ft
32 5 4 1
22.5 6 1 1 4 Total Not Moved and %: 8 35%16 12 3 9 Total Moved and %: 15 65%
TOTAL 23 8 0 1 0 14 Recovered and %: 9 39%
Notes: Pocket not reestablished
Initial Installation
Not Recovered
2nd Installation
Not Recovered
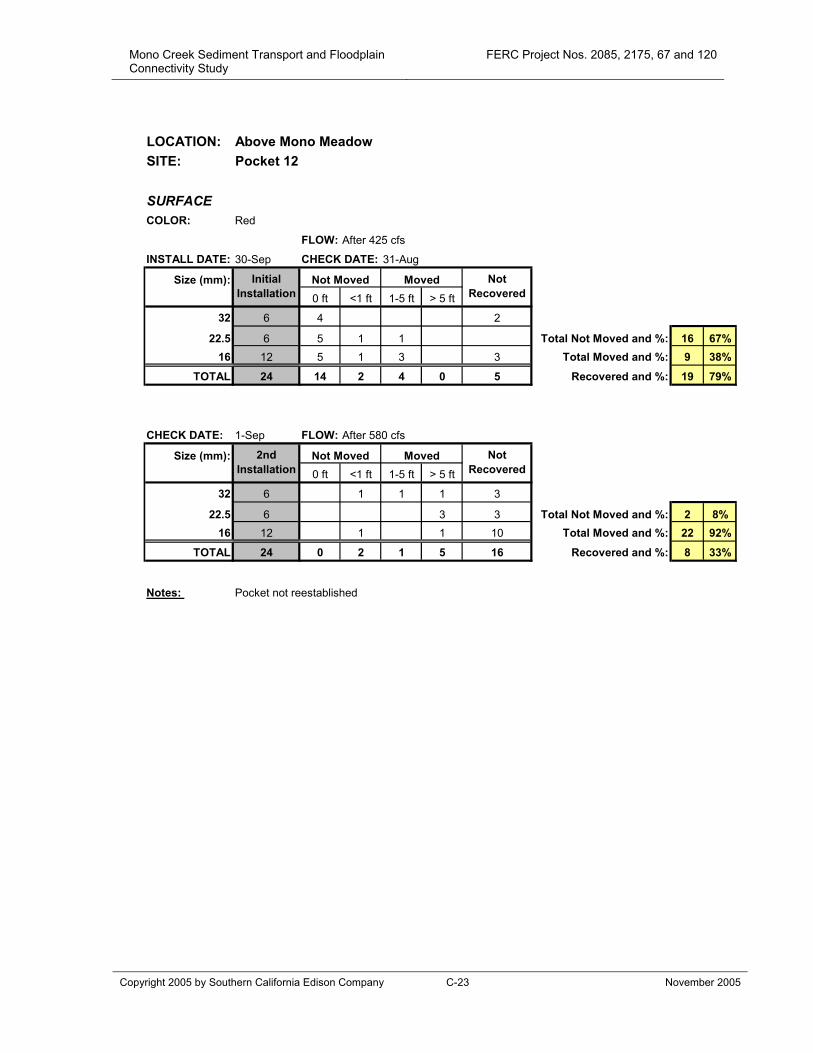
Mono Creek Sediment Transport and Floodplain Connectivity Study
FERC Project Nos. 2085, 2175, 67 and 120
Copyright 2005 by Southern California Edison Company C-23 November 2005
LOCATION: Above Mono MeadowSITE: Pocket 12
SURFACECOLOR: Red
FLOW: After 425 cfs
INSTALL DATE: 30-Sep CHECK DATE: 31-Aug
Size (mm): Not Moved Moved0 ft <1 ft 1-5 ft > 5 ft
32 6 4 2
22.5 6 5 1 1 Total Not Moved and %: 16 67%16 12 5 1 3 3 Total Moved and %: 9 38%
TOTAL 24 14 2 4 0 5 Recovered and %: 19 79%
CHECK DATE: 1-Sep FLOW: After 580 cfs
Size (mm): Not Moved Moved0 ft <1 ft 1-5 ft > 5 ft
32 6 1 1 1 3
22.5 6 3 3 Total Not Moved and %: 2 8%16 12 1 1 10 Total Moved and %: 22 92%
TOTAL 24 0 2 1 5 16 Recovered and %: 8 33%
Notes: Pocket not reestablished
Initial Installation
Not Recovered
2nd Installation
Not Recovered
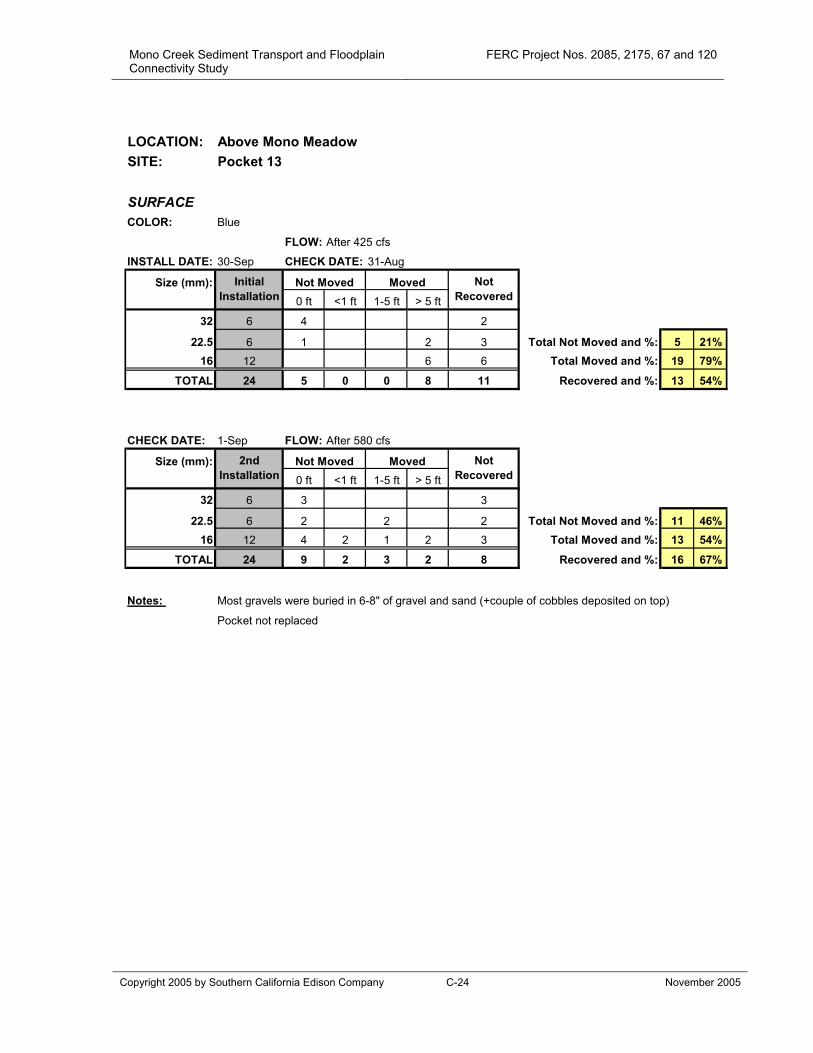
Mono Creek Sediment Transport and Floodplain Connectivity Study
FERC Project Nos. 2085, 2175, 67 and 120
Copyright 2005 by Southern California Edison Company C-24 November 2005
LOCATION: Above Mono MeadowSITE: Pocket 13
SURFACECOLOR: Blue
FLOW: After 425 cfs
INSTALL DATE: 30-Sep CHECK DATE: 31-Aug
Size (mm): Not Moved Moved0 ft <1 ft 1-5 ft > 5 ft
32 6 4 2
22.5 6 1 2 3 Total Not Moved and %: 5 21%16 12 6 6 Total Moved and %: 19 79%
TOTAL 24 5 0 0 8 11 Recovered and %: 13 54%
CHECK DATE: 1-Sep FLOW: After 580 cfs
Size (mm): Not Moved Moved0 ft <1 ft 1-5 ft > 5 ft
32 6 3 3
22.5 6 2 2 2 Total Not Moved and %: 11 46%16 12 4 2 1 2 3 Total Moved and %: 13 54%
TOTAL 24 9 2 3 2 8 Recovered and %: 16 67%
Notes: Most gravels were buried in 6-8" of gravel and sand (+couple of cobbles deposited on top)
Pocket not replaced
Initial Installation
Not Recovered
2nd Installation
Not Recovered
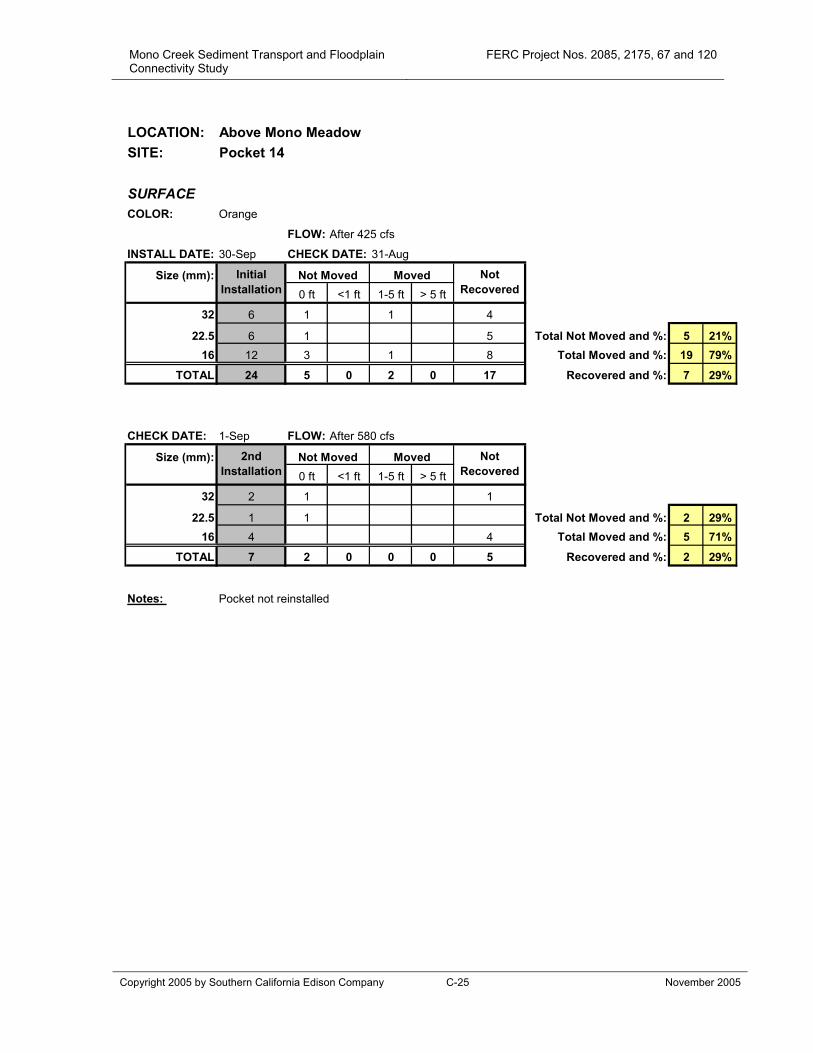
Mono Creek Sediment Transport and Floodplain Connectivity Study
FERC Project Nos. 2085, 2175, 67 and 120
Copyright 2005 by Southern California Edison Company C-25 November 2005
LOCATION: Above Mono MeadowSITE: Pocket 14
SURFACECOLOR: Orange
FLOW: After 425 cfs
INSTALL DATE: 30-Sep CHECK DATE: 31-Aug
Size (mm): Not Moved Moved0 ft <1 ft 1-5 ft > 5 ft
32 6 1 1 4
22.5 6 1 5 Total Not Moved and %: 5 21%16 12 3 1 8 Total Moved and %: 19 79%
TOTAL 24 5 0 2 0 17 Recovered and %: 7 29%
CHECK DATE: 1-Sep FLOW: After 580 cfs
Size (mm): Not Moved Moved0 ft <1 ft 1-5 ft > 5 ft
32 2 1 1
22.5 1 1 Total Not Moved and %: 2 29%16 4 4 Total Moved and %: 5 71%
TOTAL 7 2 0 0 0 5 Recovered and %: 2 29%
Notes: Pocket not reinstalled
Initial Installation
Not Recovered
2nd Installation
Not Recovered
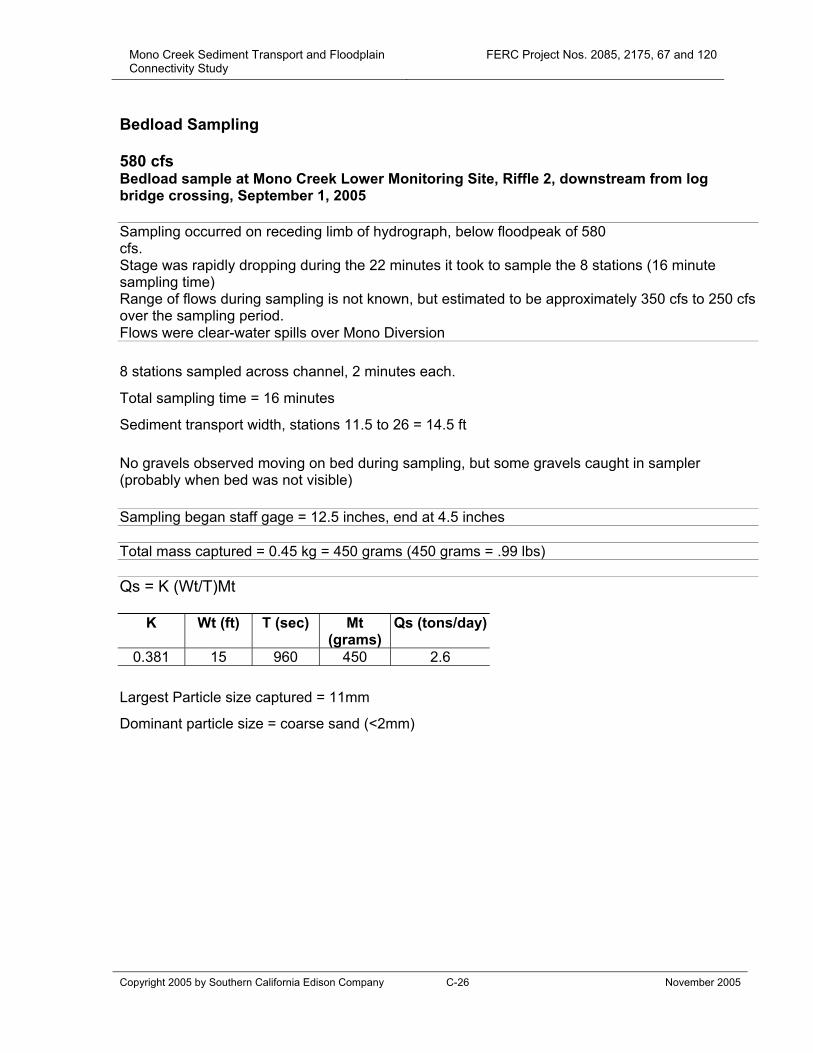
Mono Creek Sediment Transport and Floodplain Connectivity Study
FERC Project Nos. 2085, 2175, 67 and 120
Copyright 2005 by Southern California Edison Company C-26 November 2005
Bedload Sampling 580 cfs Bedload sample at Mono Creek Lower Monitoring Site, Riffle 2, downstream from log bridge crossing, September 1, 2005
Sampling occurred on receding limb of hydrograph, below floodpeak of 580 cfs. Stage was rapidly dropping during the 22 minutes it took to sample the 8 stations (16 minute sampling time) Range of flows during sampling is not known, but estimated to be approximately 350 cfs to 250 cfs over the sampling period. Flows were clear-water spills over Mono Diversion 8 stations sampled across channel, 2 minutes each.
Total sampling time = 16 minutes
Sediment transport width, stations 11.5 to 26 = 14.5 ft
No gravels observed moving on bed during sampling, but some gravels caught in sampler (probably when bed was not visible)
Sampling began staff gage = 12.5 inches, end at 4.5 inches
Total mass captured = 0.45 kg = 450 grams (450 grams = .99 lbs)
Qs = K (Wt/T)Mt
K Wt (ft) T (sec) Mt
(grams) Qs (tons/day)
0.381 15 960 450 2.6
Largest Particle size captured = 11mm
Dominant particle size = coarse sand (<2mm)
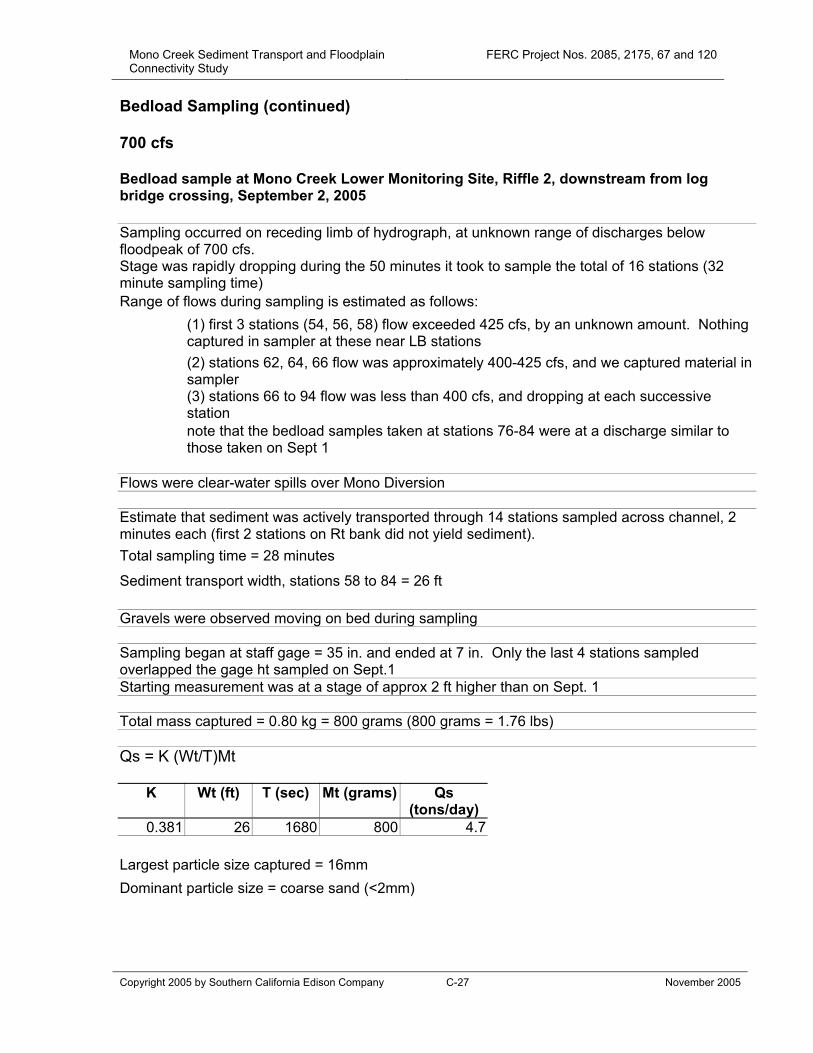
Mono Creek Sediment Transport and Floodplain Connectivity Study
FERC Project Nos. 2085, 2175, 67 and 120
Copyright 2005 by Southern California Edison Company C-27 November 2005
Bedload Sampling (continued) 700 cfs Bedload sample at Mono Creek Lower Monitoring Site, Riffle 2, downstream from log bridge crossing, September 2, 2005 Sampling occurred on receding limb of hydrograph, at unknown range of discharges below floodpeak of 700 cfs. Stage was rapidly dropping during the 50 minutes it took to sample the total of 16 stations (32 minute sampling time) Range of flows during sampling is estimated as follows:
(1) first 3 stations (54, 56, 58) flow exceeded 425 cfs, by an unknown amount. Nothing captured in sampler at these near LB stations
(2) stations 62, 64, 66 flow was approximately 400-425 cfs, and we captured material in sampler
(3) stations 66 to 94 flow was less than 400 cfs, and dropping at each successive station
note that the bedload samples taken at stations 76-84 were at a discharge similar to those taken on Sept 1
Flows were clear-water spills over Mono Diversion Estimate that sediment was actively transported through 14 stations sampled across channel, 2 minutes each (first 2 stations on Rt bank did not yield sediment). Total sampling time = 28 minutes
Sediment transport width, stations 58 to 84 = 26 ft Gravels were observed moving on bed during sampling Sampling began at staff gage = 35 in. and ended at 7 in. Only the last 4 stations sampled overlapped the gage ht sampled on Sept.1 Starting measurement was at a stage of approx 2 ft higher than on Sept. 1
Total mass captured = 0.80 kg = 800 grams (800 grams = 1.76 lbs)
Qs = K (Wt/T)Mt
K Wt (ft) T (sec) Mt (grams) Qs
(tons/day)
0.381 26 1680 800 4.7
Largest particle size captured = 16mm
Dominant particle size = coarse sand (<2mm)