Embed Size (px)
Citation preview
1
MonotaRO Co., Ltd.
MonotaRO Co., Ltd.
FY2013_3Q(Jan. to Sep., 2013)
2
MonotaRO Co., Ltd.
MonotaRO Co., Ltd.MonotaRO means1) Maintenance, Repair & Operation2) “The sufficient number of products” in Japanese3) Fight with unfair old distribution system as “Momotaro”
Overview: MonotaRO provides MRO products through Internet and catalogs, targeting small and mid-sized domestic manufacturing companies which aren’t treated well by conventional tool retailers
MRO products: Cutting tools/Safety products/Bearings/Fasteners/ Industrial equipment(We sell more than 5,000,000 products)
# of customers: 1,059,000 and more throughout Japan
Date of foundation: October 19, 2000
Full-scale operation start date: November 13, 2001
Capital stock: 1.81 billion yen or 18.4million dollars (U$1=JPY98.2)
# of employees: 631 including regular employees 183(Sep.,2013 Conslolidated)
Address/Distribution base: GLP Amagasaki 3F, Nishimukojima-cho, Amagasaki-city, Hyogo 660-0857
1. Company profile
3
MonotaRO Co., Ltd.
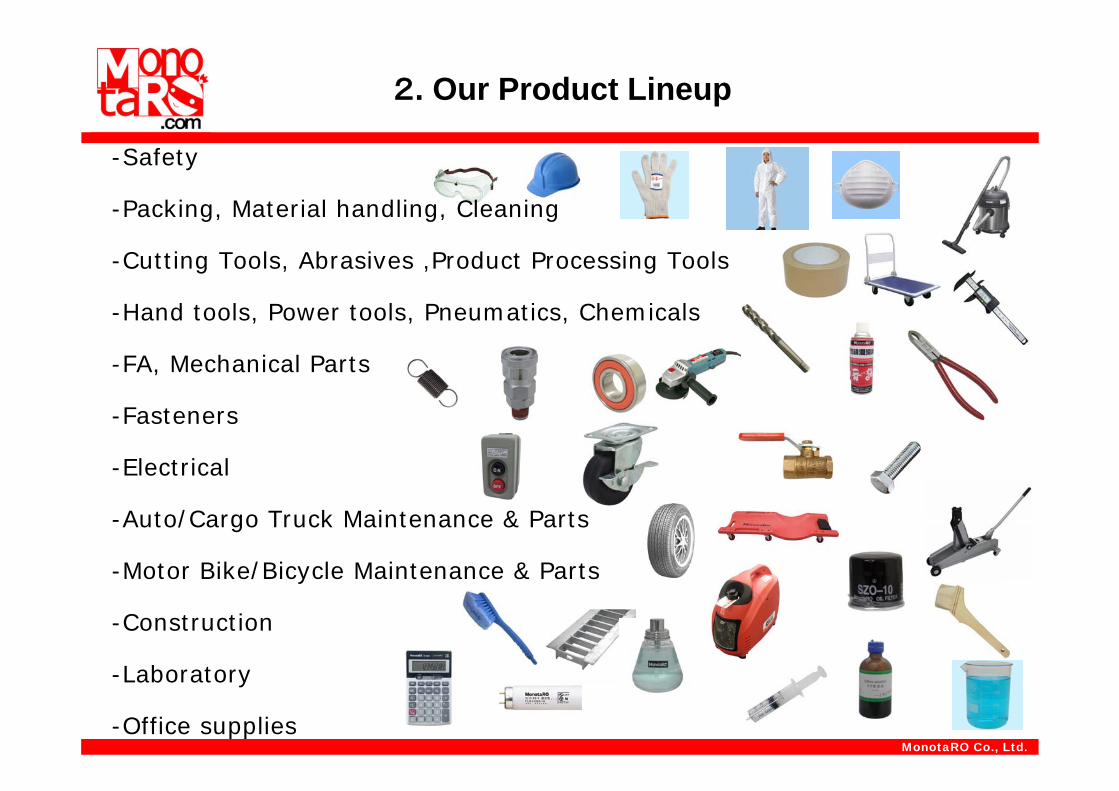
-Safety
-Packing, Material handling, Cleaning
-Cutting Tools, Abrasives ,Product Processing Tools
-Hand tools, Power tools, Pneumatics, Chemicals
-FA, Mechanical Parts
-Fasteners
-Electrical
-Auto/Cargo Truck Maintenance & Parts
-Motor Bike/Bicycle Maintenance & Parts
-Construction
-Laboratory
-Office supplies
2. Our Product Lineup
4
MonotaRO Co., Ltd.
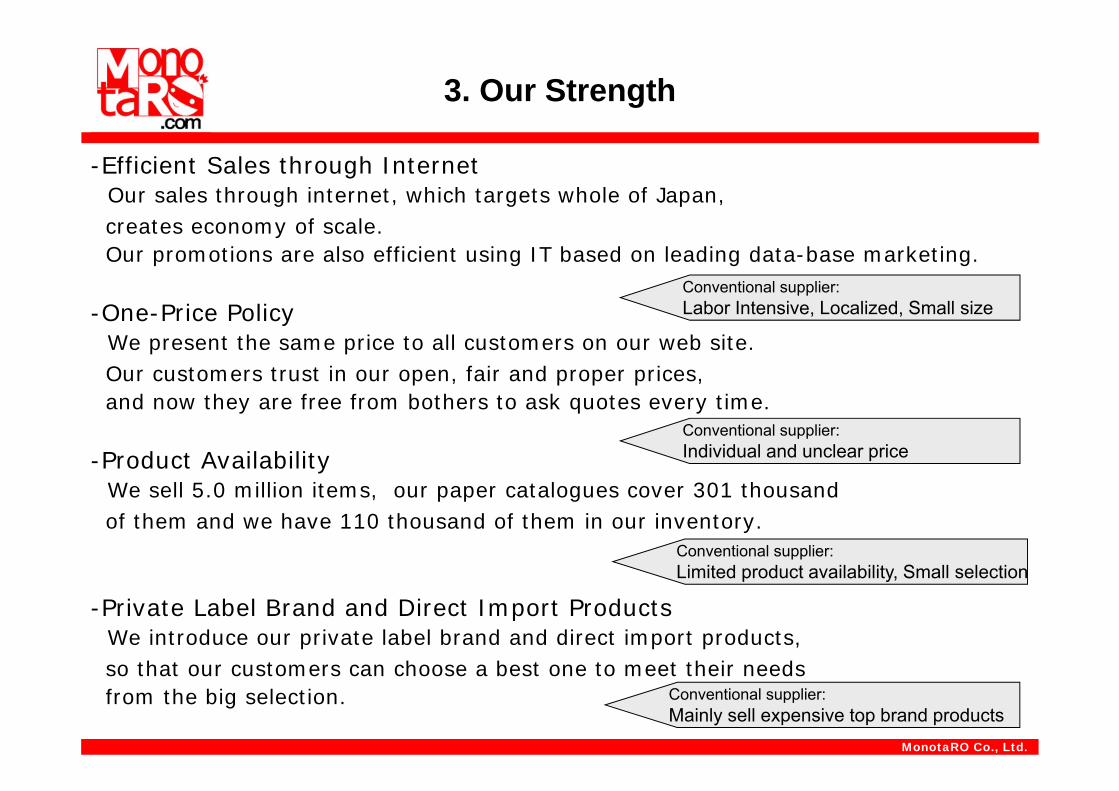
-Efficient Sales through Internet Our sales through internet, which targets whole of Japan,creates economy of scale.Our promotions are also efficient using IT based on leading data-base marketing.
-One-Price PolicyWe present the same price to all customers on our web site.Our customers trust in our open, fair and proper prices,and now they are free from bothers to ask quotes every time.
-Product AvailabilityWe sell 5.0 million items, our paper catalogues cover 301 thousand of them and we have 110 thousand of them in our inventory.
-Private Label Brand and Direct Import ProductsWe introduce our private label brand and direct import products,so that our customers can choose a best one to meet their needs from the big selection.
3. Our Strength
Conventional supplier:Labor Intensive, Localized, Small size
Conventional supplier:Individual and unclear price
Conventional supplier:Limited product availability, Small selection
Conventional supplier:Mainly sell expensive top brand products
5
MonotaRO Co., Ltd.
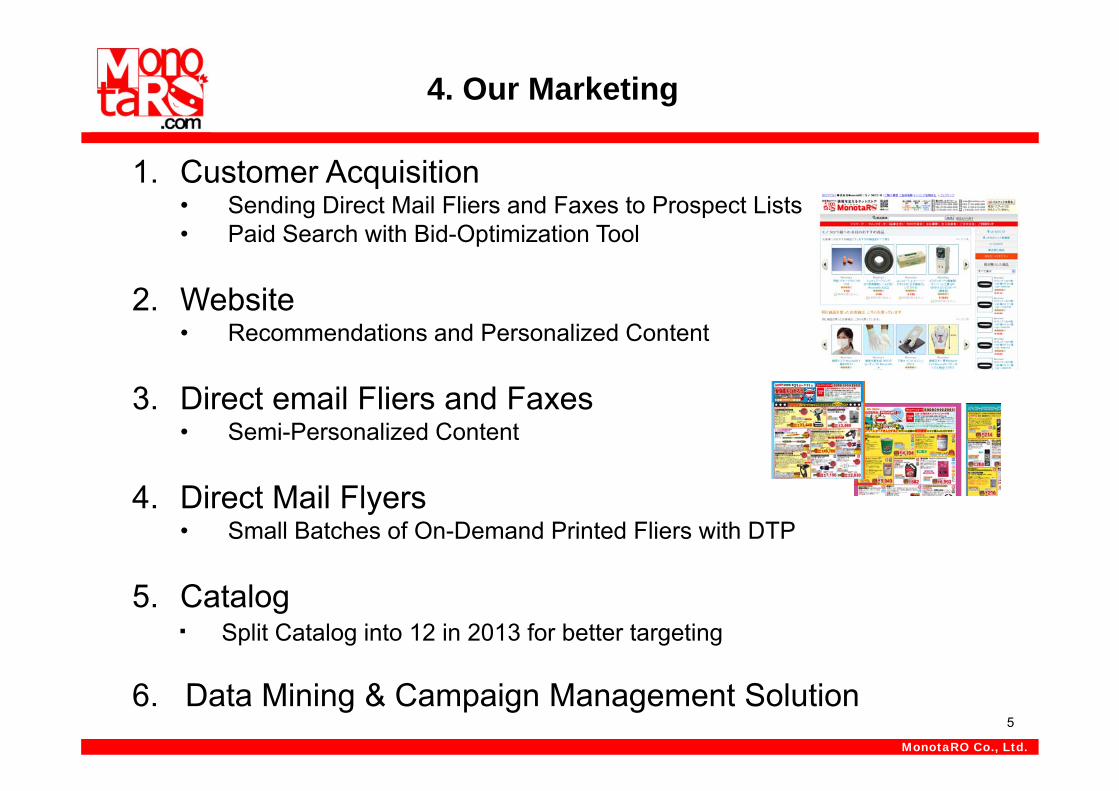
4. Our Marketing
1. Customer Acquisition• Sending Direct Mail Fliers and Faxes to Prospect Lists• Paid Search with Bid-Optimization Tool
2. Website• Recommendations and Personalized Content
3. Direct email Fliers and Faxes• Semi-Personalized Content
4. Direct Mail Flyers• Small Batches of On-Demand Printed Fliers with DTP
5. Catalog・ Split Catalog into 12 in 2013 for better targeting
6. Data Mining & Campaign Management Solution
6
MonotaRO Co., Ltd.
5. Our Procurement
・Direct Import Goods 17.4% of Sales・Private Label Brand Goods 26.2% of Sales
・Direct Import and/or Private Label Brand 28.4% of Sales(FY2012)
Implication of Direct import and Private Label Brand Goods・Higher Margin ・Lower Inventory Turnover・Unique Competitive Advantage
Promotion Strategy・Trade Down from National Brand.
7
MonotaRO Co., Ltd.
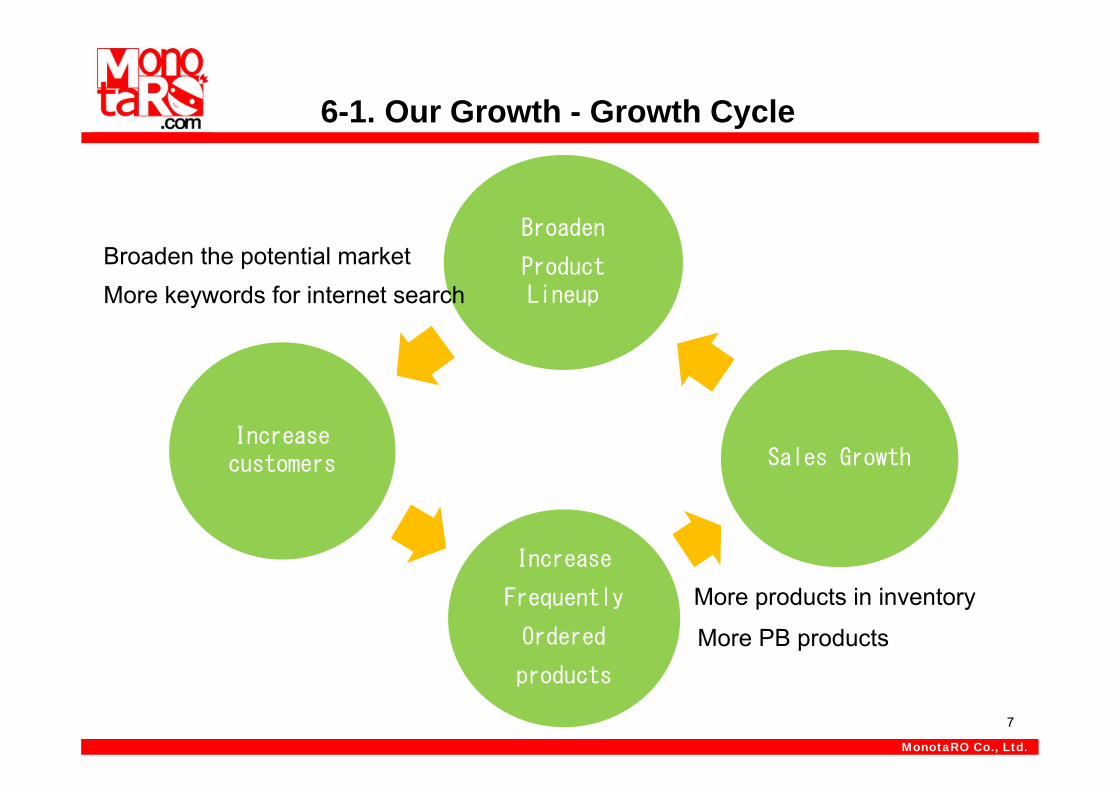
6-1. Our Growth - Growth Cycle
Broaden
Product Lineup
Sales Growth
Increase
Frequently
Ordered
products
Increase customers
Broaden the potential marketMore keywords for internet search
More products in inventory
More PB products
8
MonotaRO Co., Ltd.
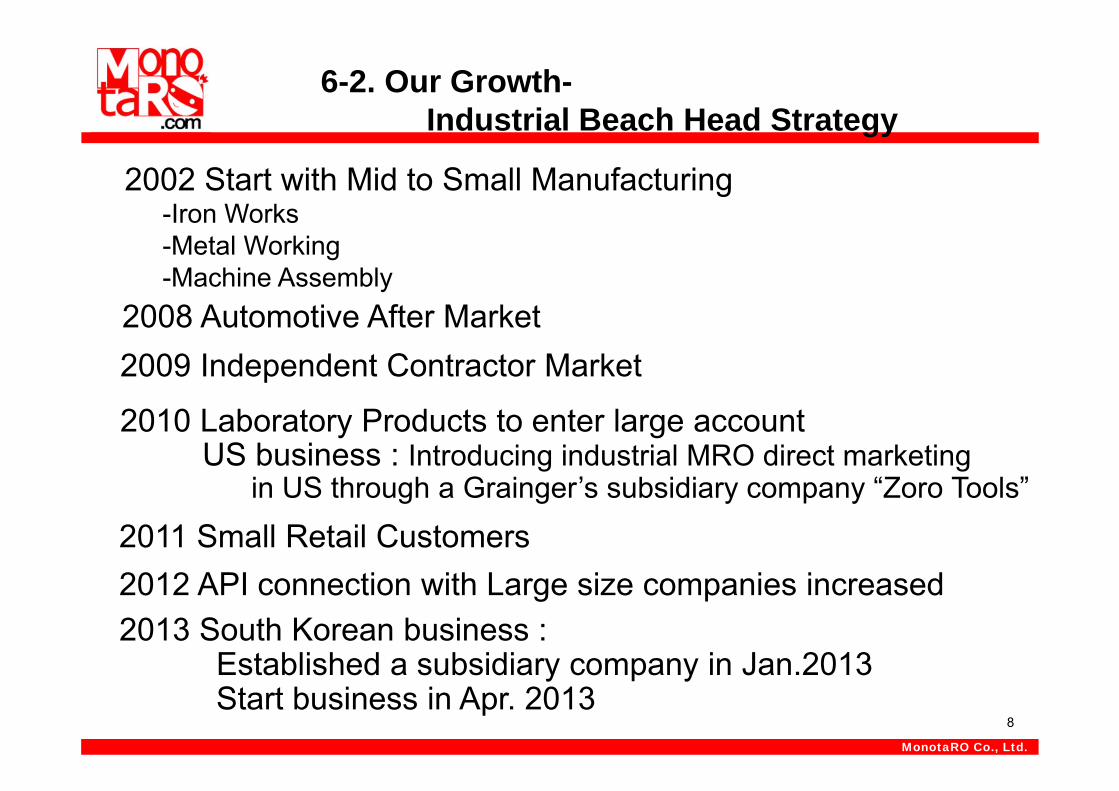
-Iron Works-Metal Working-Machine Assembly
2002 Start with Mid to Small Manufacturing
2008 Automotive After Market2009 Independent Contractor Market
2010 Laboratory Products to enter large account
2011 Small Retail Customers
6-2. Our Growth-Industrial Beach Head Strategy
US business : Introducing industrial MRO direct marketing in US through a Grainger’s subsidiary company “Zoro Tools”
2012 API connection with Large size companies increased2013 South Korean business :
Established a subsidiary company in Jan.2013Start business in Apr. 2013
9
MonotaRO Co., Ltd.
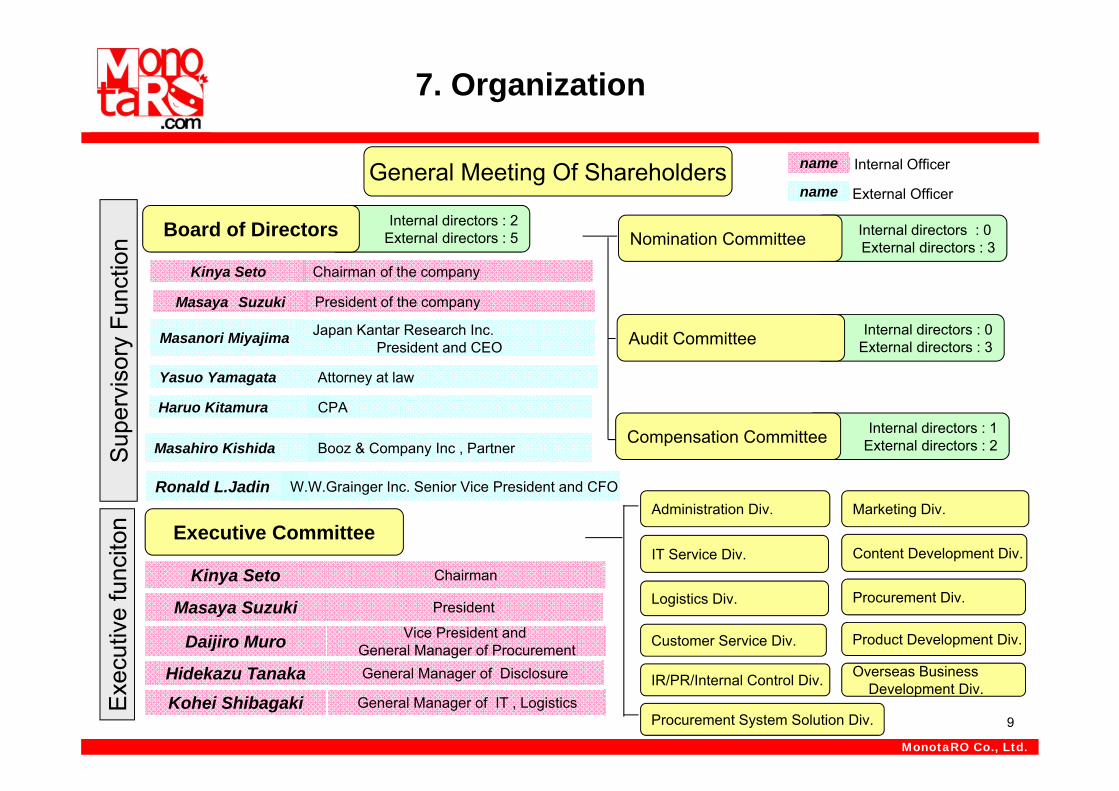
Internal directors : 0 External directors : 3
Internal directors : 0External directors : 3
Internal directors : 1External directors : 2
Internal directors : 2External directors : 5Board of Directors
General Meeting Of Shareholders
Kinya Seto Chairman of the company
Masanori Miyajima Japan Kantar Research Inc.President and CEO
Yasuo Yamagata Attorney at law
Haruo Kitamura CPA
Ronald L.Jadin W.W.Grainger Inc. Senior Vice President and CFO
Kinya Seto
Hidekazu Tanaka
Nomination Committee
Audit Committee
Compensation Committee
Executive Committee
Chairman
General Manager of Disclosure
Daijiro Muro Vice President and General Manager of Procurement
Masaya Suzuki President
name Internal Officer
name External Officer
IT Service Div.
Logistics Div.
Customer Service Div.
Marketing Div.Administration Div.
Sup
ervi
sory
Fun
ctio
nE
xecu
tive
func
iton
Procurement Div.
Masaya Suzuki President of the company
Masahiro Kishida Booz & Company Inc , Partner
Kohei Shibagaki General Manager of IT , Logistics
7. Organization
Content Development Div.
Product Development Div.
IR/PR/Internal Control Div. Overseas Business Development Div.
Procurement System Solution Div.
10
MonotaRO Co., Ltd.
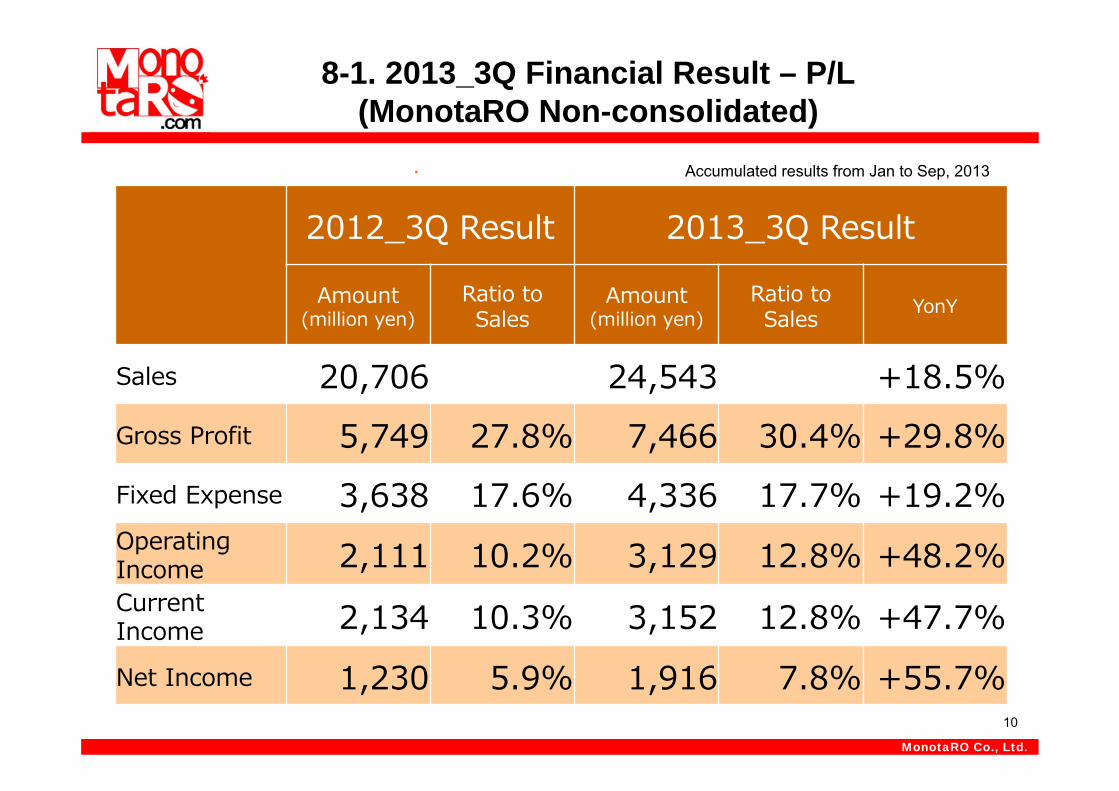
8-1. 2013_3Q Financial Result – P/L(MonotaRO Non-consolidated)
Accumulated results from Jan to Sep, 2013
2012_3Q Result 2013_3Q Result
Amount(million yen)
Ratio to Sales
Amount(million yen)
Ratio to Sales YonY
Sales 20,706 24,543 +18.5%Gross Profit 5,749 27.8% 7,466 30.4% +29.8%Fixed Expense 3,638 17.6% 4,336 17.7% +19.2%OperatingIncome 2,111 10.2% 3,129 12.8% +48.2%CurrentIncome 2,134 10.3% 3,152 12.8% +47.7%Net Income 1,230 5.9% 1,916 7.8% +55.7%
11
MonotaRO Co., Ltd.
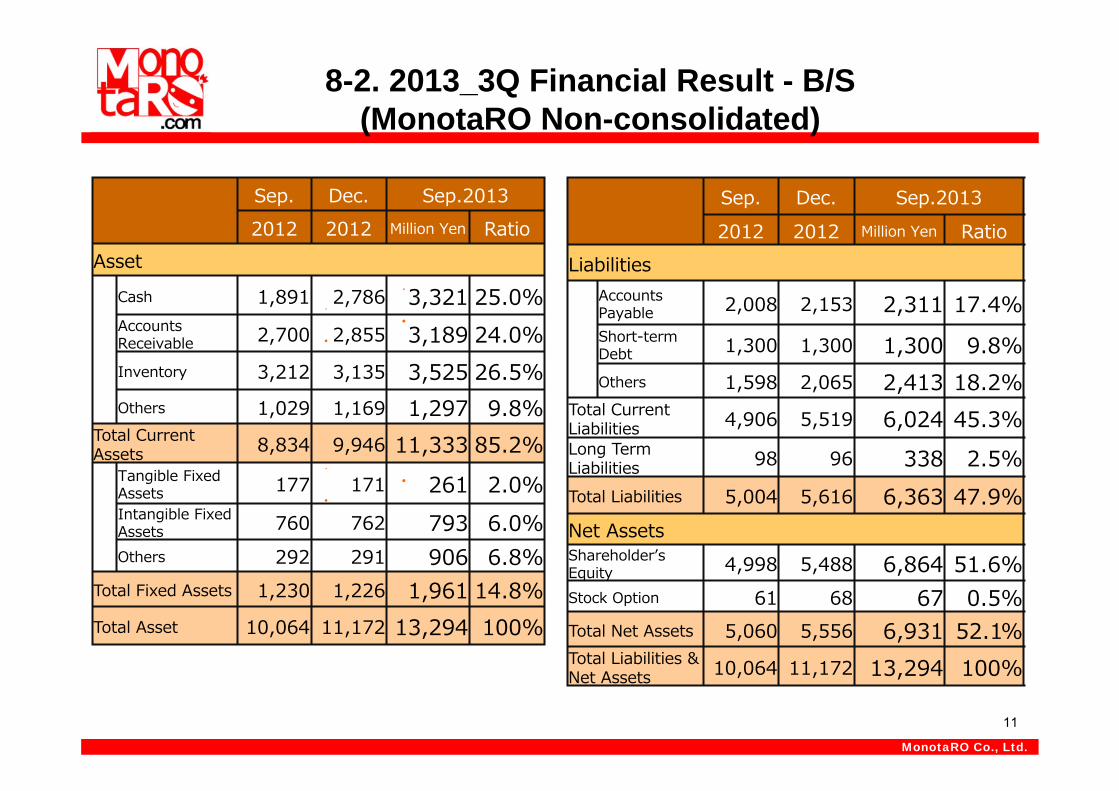
8-2. 2013_3Q Financial Result - B/S(MonotaRO Non-consolidated)
Sep. Dec. Sep.20132012 2012 Million Yen Ratio
AssetCash 1,891 2,786 3,321 25.0%AccountsReceivable 2,700 2,855 3,189 24.0%Inventory 3,212 3,135 3,525 26.5%Others 1,029 1,169 1,297 9.8%
Total CurrentAssets 8,834 9,946 11,333 85.2%
Tangible Fixed Assets 177 171 261 2.0%Intangible FixedAssets 760 762 793 6.0%Others 292 291 906 6.8%
Total Fixed Assets 1,230 1,226 1,961 14.8%Total Asset 10,064 11,172 13,294 100%
Sep. Dec. Sep.20132012 2012 Million Yen Ratio
LiabilitiesAccounts Payable 2,008 2,153 2,311 17.4%Short-term Debt 1,300 1,300 1,300 9.8%Others 1,598 2,065 2,413 18.2%
Total Current Liabilities 4,906 5,519 6,024 45.3%Long TermLiabilities 98 96 338 2.5%Total Liabilities 5,004 5,616 6,363 47.9%Net AssetsShareholderʼs Equity 4,998 5,488 6,864 51.6%Stock Option 61 68 67 0.5%Total Net Assets 5,060 5,556 6,931 52.1%Total Liabilities & Net Assets 10,064 11,172 13,294 100%
12
MonotaRO Co., Ltd.
8-4. 2013_3Q Financial Result - Outline(MonotaRO Non-consolidated)
Sales-18.5% growth year on year -Existing customers growth is low because of the weakness of MRO market demand. The recovery sign in demand was seen in 3Q-New customer acquisition is strong.
Gross Profit-29.8% growth year on year-GP rate is 30.4%, improved by 2.6 YonY, but dropped by 0.9 points from the previous quarter affected by the import products purchased by weak yen in around May.
Fixed Cost-19.2% increased year on year-Efficient control of operation cost, while continuous aggressive investment to the promotions for the new customer acquisition and the existing customers’ sales increase.
Operating Income-48.2% growth year on year
13
MonotaRO Co., Ltd.
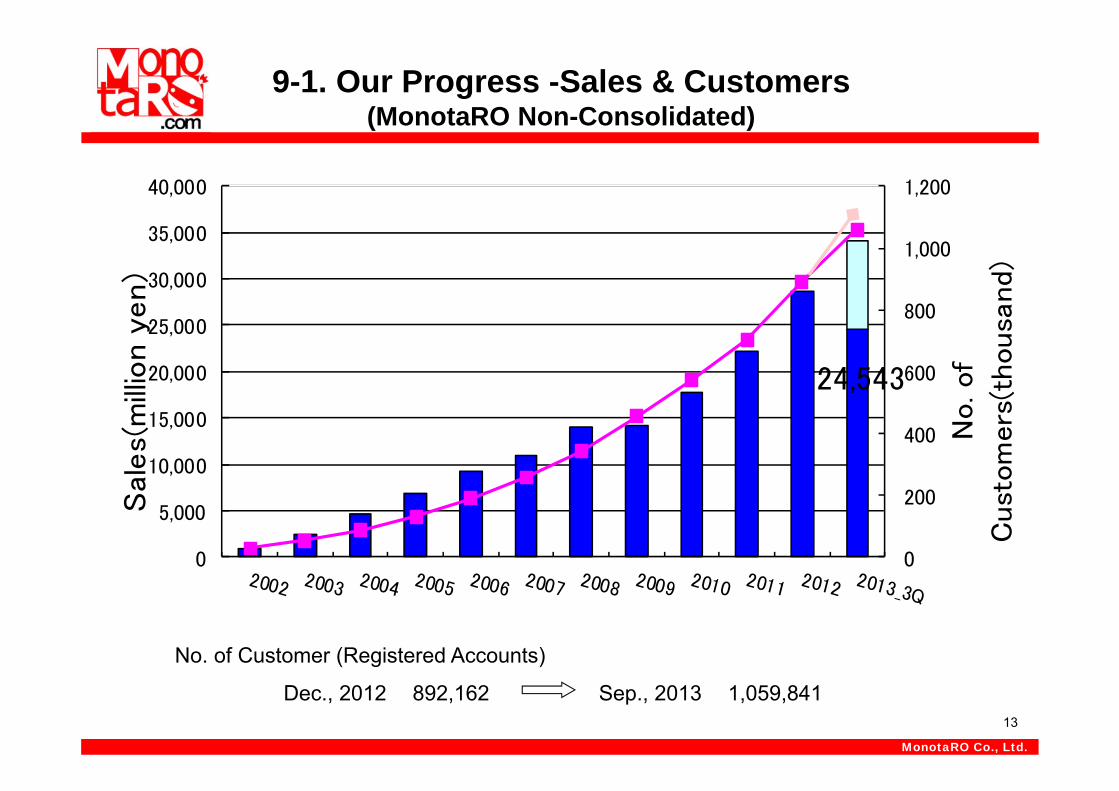
9-1. Our Progress -Sales & Customers(MonotaRO Non-Consolidated)
24,543
0
200
400
600
800
1,000
1,200
0
5,000
10,000
15,000
20,000
25,000
30,000
35,000
40,000
No. of
Cust
om
ers
(thousa
nd)
Sale
s(m
illio
n y
en)
Dec., 2012 892,162 Sep., 2013 1,059,841
No. of Customer (Registered Accounts)
14
MonotaRO Co., Ltd.
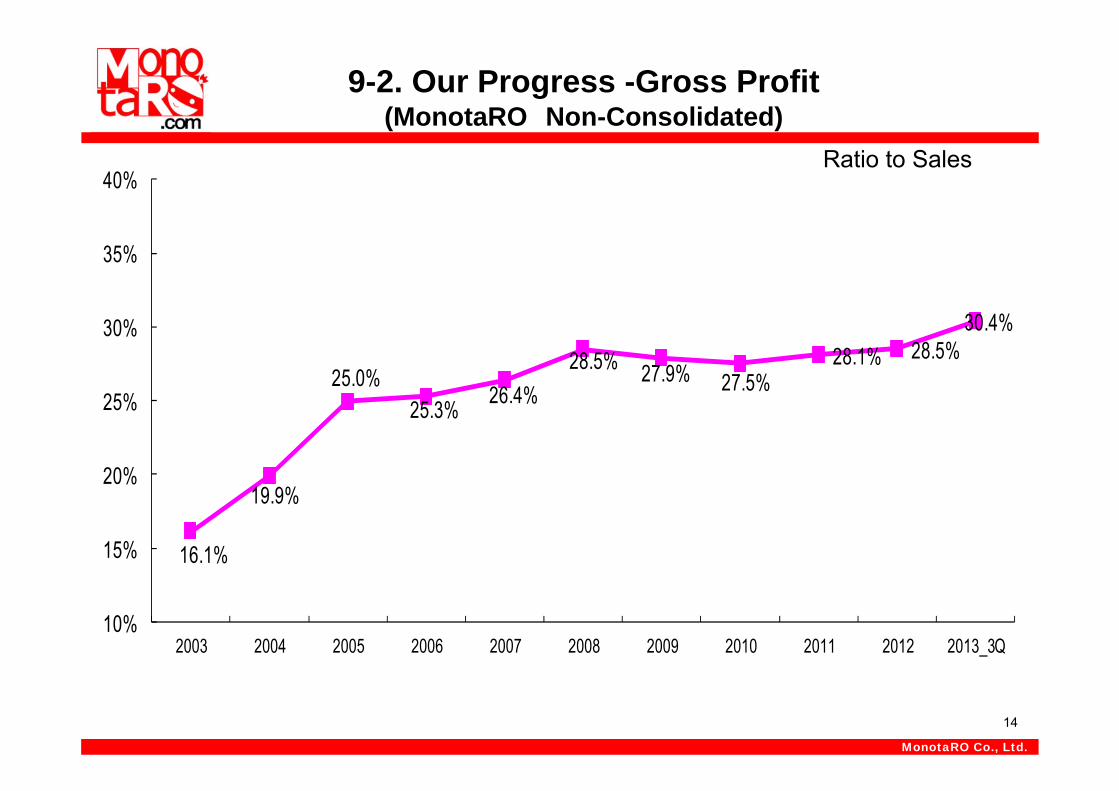
9-2. Our Progress -Gross Profit (MonotaRO Non-Consolidated)
16.1%
19.9%
25.0%25.3% 26.4%
28.5% 27.9% 27.5%28.1% 28.5%
30.4%
10%
15%
20%
25%
30%
35%
40%
2003 2004 2005 2006 2007 2008 2009 2010 2011 2012 2013_3Q
Ratio to Sales
15
MonotaRO Co., Ltd.
17.7%
0.0%
10.0%
20.0%
30.0%
40.0%
50.0%
60.0%
2003 2004 2005 2006 2007 2008 2009 2010 2011 2012 2013_3Q
Labor Cost+Outsourcing
Rent
Promotion+Mailing Cost
Depreciation
Others
Total
2013_3Q(accumulated)Expense Breakdown
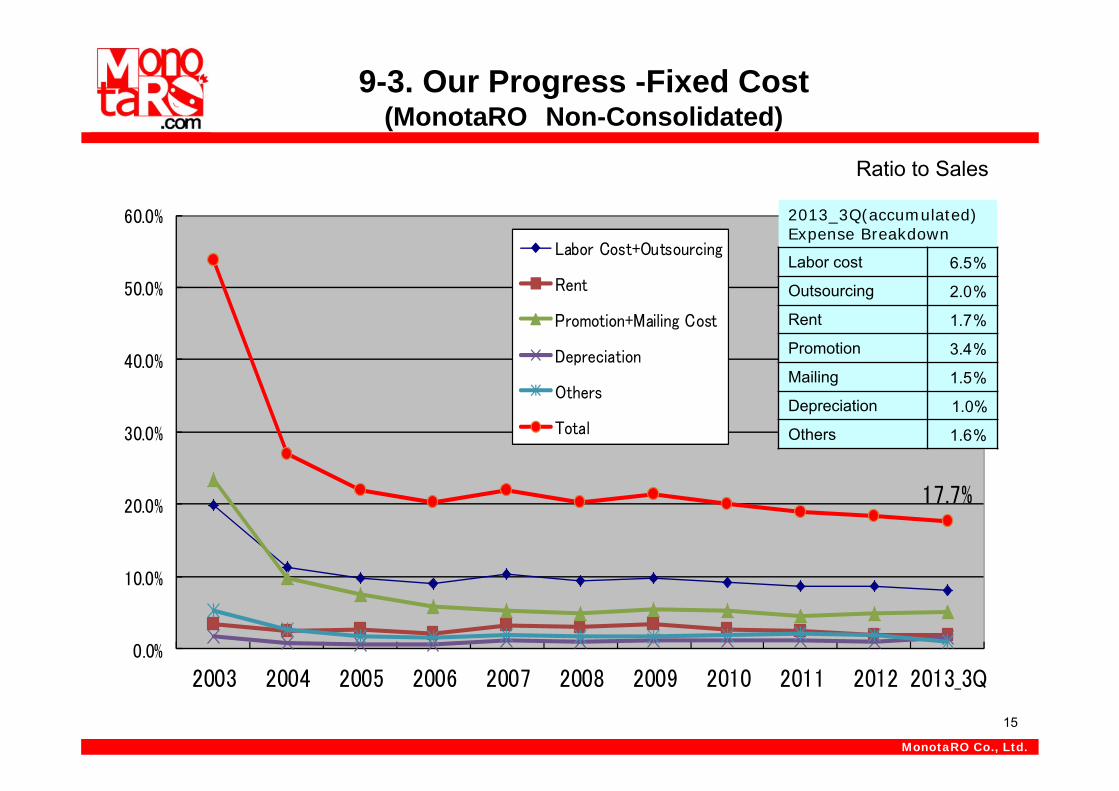
Labor cost 6.5%Outsourcing 2.0%Rent 1.7%Promotion 3.4%Mailing 1.5%Depreciation 1.0%Others 1.6%
9-3. Our Progress -Fixed Cost(MonotaRO Non-Consolidated)
Ratio to Sales
16
MonotaRO Co., Ltd.
10-1. FY2013 Revised Plan
Conslidated
Non-Conslidated
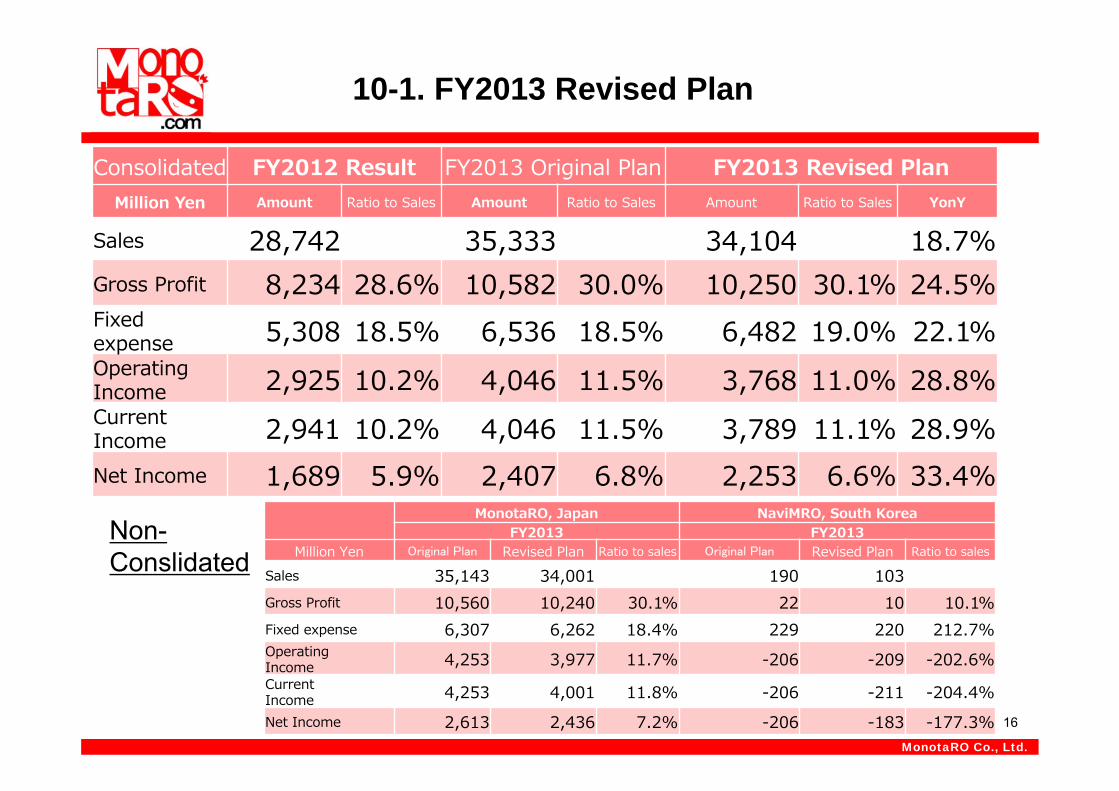
Consolidated FY2012 Result FY2013 Original Plan FY2013 Revised PlanMillion Yen Amount Ratio to Sales Amount Ratio to Sales Amount Ratio to Sales YonY
Sales 28,742 35,333 34,104 18.7%Gross Profit 8,234 28.6% 10,582 30.0% 10,250 30.1% 24.5%Fixedexpense 5,308 18.5% 6,536 18.5% 6,482 19.0% 22.1%OperatingIncome 2,925 10.2% 4,046 11.5% 3,768 11.0% 28.8%CurrentIncome 2,941 10.2% 4,046 11.5% 3,789 11.1% 28.9%Net Income 1,689 5.9% 2,407 6.8% 2,253 6.6% 33.4%
MonotaRO, Japan NaviMRO, South KoreaFY2013 FY2013
Million Yen Original Plan Revised Plan Ratio to sales Original Plan Revised Plan Ratio to sales
Sales 35,143 34,001 190 103Gross Profit 10,560 10,240 30.1% 22 10 10.1%Fixed expense 6,307 6,262 18.4% 229 220 212.7%OperatingIncome 4,253 3,977 11.7% -206 -209 -202.6%CurrentIncome 4,253 4,001 11.8% -206 -211 -204.4%Net Income 2,613 2,436 7.2% -206 -183 -177.3%
17
MonotaRO Co., Ltd.
10-2. FY2013 Revised Plan-Outline 1/2
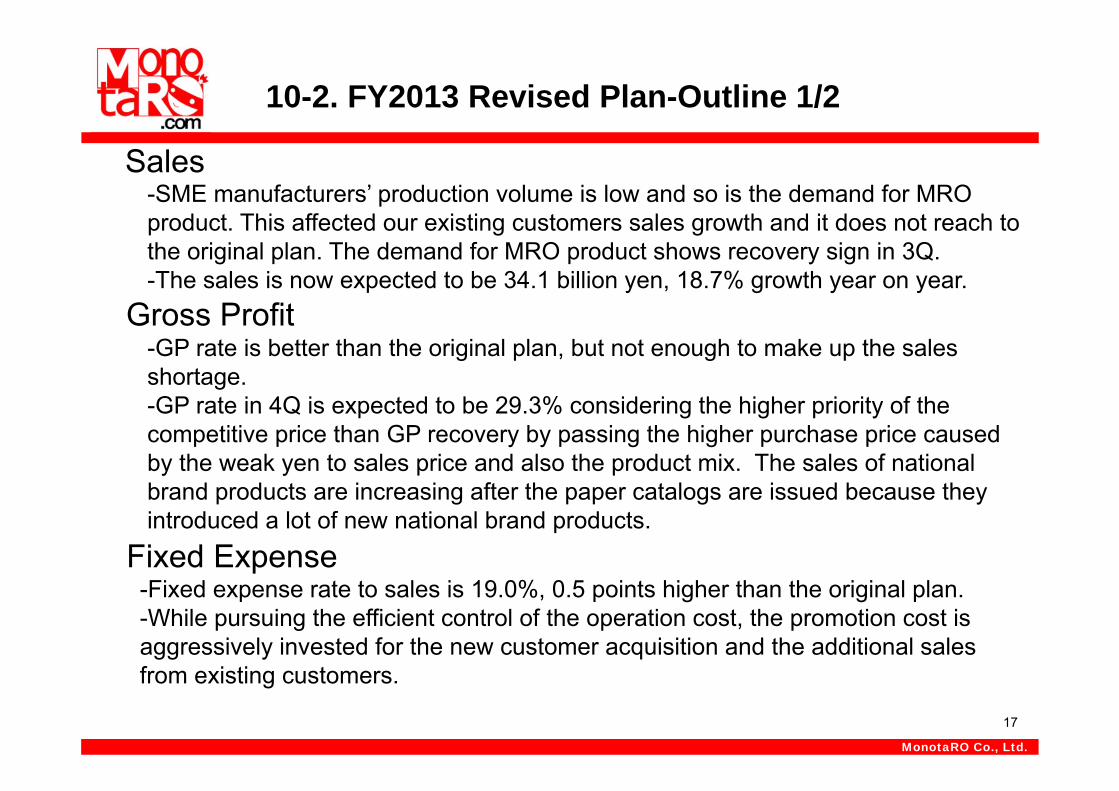
Sales-SME manufacturers’ production volume is low and so is the demand for MRO product. This affected our existing customers sales growth and it does not reach to the original plan. The demand for MRO product shows recovery sign in 3Q.-The sales is now expected to be 34.1 billion yen, 18.7% growth year on year.
Gross Profit-GP rate is better than the original plan, but not enough to make up the sales shortage. -GP rate in 4Q is expected to be 29.3% considering the higher priority of the competitive price than GP recovery by passing the higher purchase price caused by the weak yen to sales price and also the product mix. The sales of national brand products are increasing after the paper catalogs are issued because they introduced a lot of new national brand products.
Fixed Expense-Fixed expense rate to sales is 19.0%, 0.5 points higher than the original plan.-While pursuing the efficient control of the operation cost, the promotion cost is aggressively invested for the new customer acquisition and the additional sales from existing customers.
18
MonotaRO Co., Ltd.
10-2. FY2013 Revised Plan-Outline 2/2
Operating Income-Expected to be 3,768 million yen decreased by 278 million yen from the original plan-The competitive price and the necessary investment for the medium to long term growth takes priority to the immediate benefit.
Extraordinary Loss and Extraordinary Profit-The expense of 218 million yen occurred and expected to occur in future related to the voluntary collection of the brake pads is recorded extraordinary loss. -The compensation from the Taiwan manufacturer of 55 million yen is recorded as extraordinary profit-The net loss relating to this voluntary collection is 162 million yen.
19
MonotaRO Co., Ltd.
10-3. FY2013 Strategy-Update-1/2
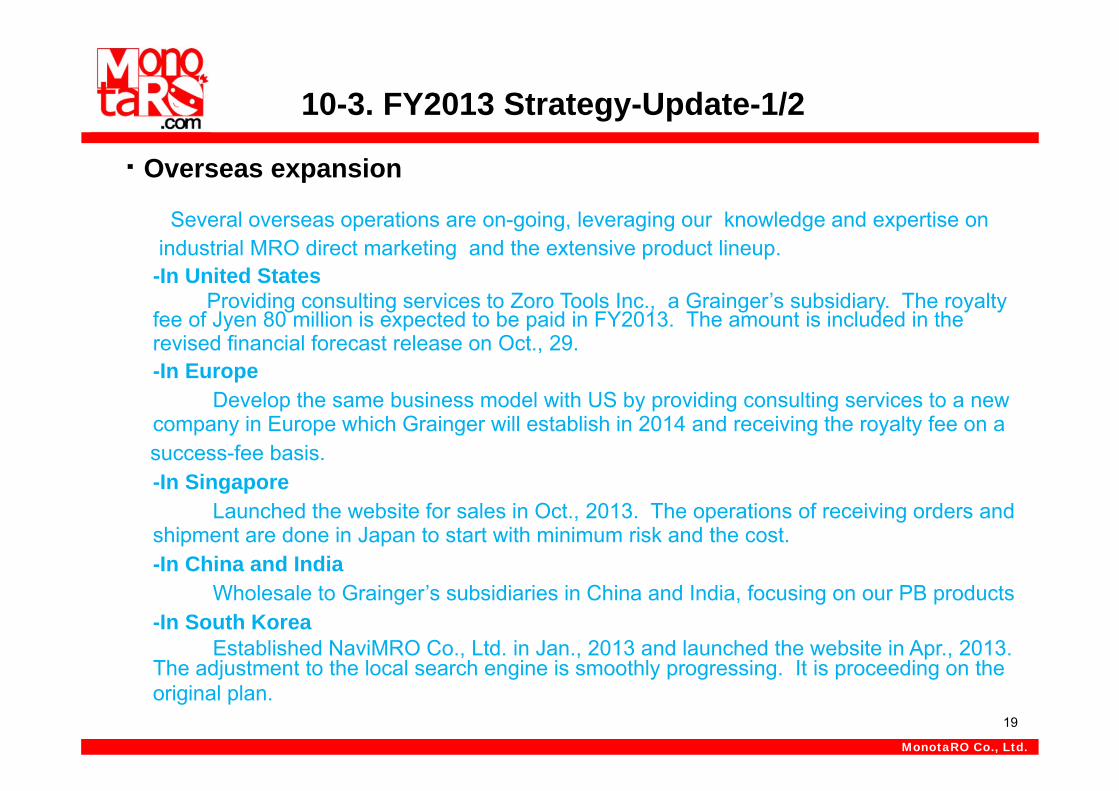
・Overseas expansion
Several overseas operations are on-going, leveraging our knowledge and expertise on industrial MRO direct marketing and the extensive product lineup.
-In United StatesProviding consulting services to Zoro Tools Inc., a Grainger’s subsidiary. The royalty
fee of Jyen 80 million is expected to be paid in FY2013. The amount is included in the revised financial forecast release on Oct., 29.-In Europe
Develop the same business model with US by providing consulting services to a new company in Europe which Grainger will establish in 2014 and receiving the royalty fee on a success-fee basis.-In Singapore
Launched the website for sales in Oct., 2013. The operations of receiving orders and shipment are done in Japan to start with minimum risk and the cost.-In China and India
Wholesale to Grainger’s subsidiaries in China and India, focusing on our PB products-In South Korea
Established NaviMRO Co., Ltd. in Jan., 2013 and launched the website in Apr., 2013. The adjustment to the local search engine is smoothly progressing. It is proceeding on the original plan.
20
MonotaRO Co., Ltd.
10-3. FY2013 Strategy-Update-2/2
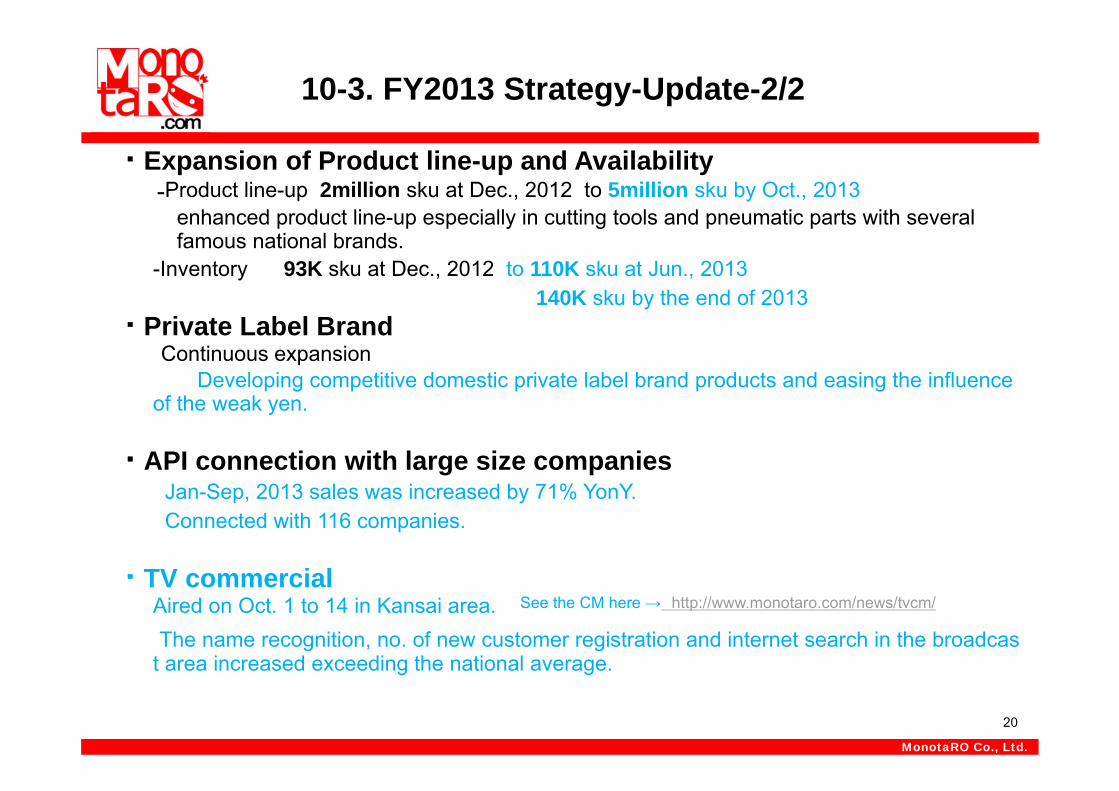
・Expansion of Product line-up and Availability-Product line-up 2million sku at Dec., 2012 to 5million sku by Oct., 2013
enhanced product line-up especially in cutting tools and pneumatic parts with several famous national brands.
-Inventory 93K sku at Dec., 2012 to 110K sku at Jun., 2013140K sku by the end of 2013
・Private Label BrandContinuous expansion
Developing competitive domestic private label brand products and easing the influence of the weak yen.
・API connection with large size companiesJan-Sep, 2013 sales was increased by 71% YonY.Connected with 116 companies.
・TV commercialAired on Oct. 1 to 14 in Kansai area. See the CM here → http://www.monotaro.com/news/tvcm/
The name recognition, no. of new customer registration and internet search in the broadcast area increased exceeding the national average.
21
MonotaRO Co., Ltd.
11-1.2013_3Q Financial Result-P/L(Consolidated)
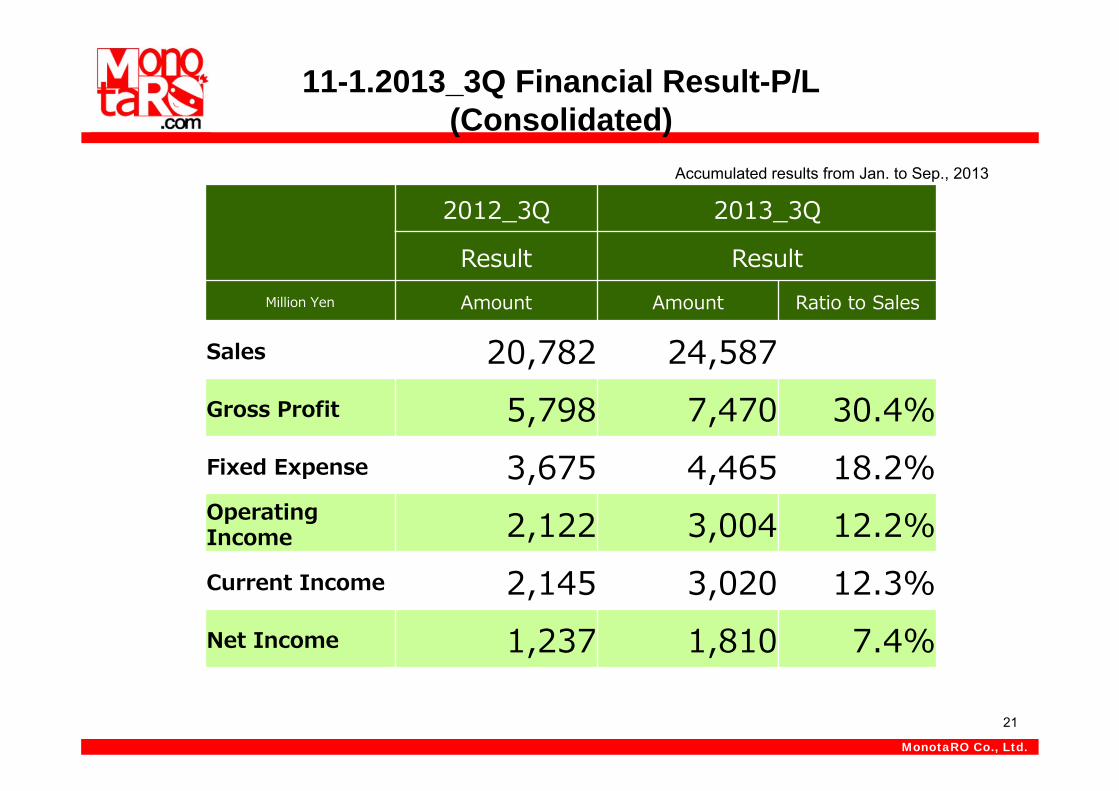
Accumulated results from Jan. to Sep., 2013
2012_3Q 2013_3Q
Result ResultMillion Yen Amount Amount Ratio to Sales
Sales 20,782 24,587Gross Profit 5,798 7,470 30.4%Fixed Expense 3,675 4,465 18.2%OperatingIncome 2,122 3,004 12.2%Current Income 2,145 3,020 12.3%Net Income 1,237 1,810 7.4%
22
MonotaRO Co., Ltd.
11-2.2013_3Q Financial Result-B/S(Consolidated)
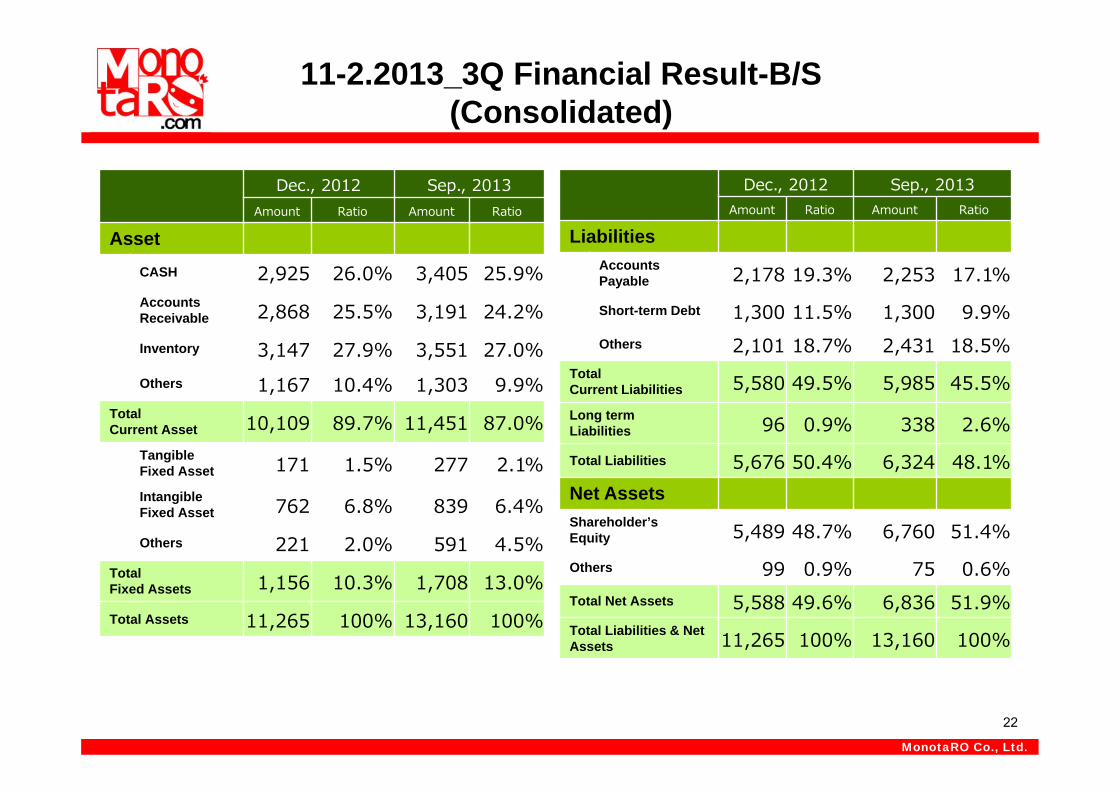
Dec., 2012 Sep., 2013Amount Ratio Amount Ratio
AssetCASH 2,925 26.0% 3,405 25.9%Accounts Receivable 2,868 25.5% 3,191 24.2%Inventory 3,147 27.9% 3,551 27.0%Others 1,167 10.4% 1,303 9.9%
Total Current Asset 10,109 89.7% 11,451 87.0%
Tangible Fixed Asset 171 1.5% 277 2.1%Intangible Fixed Asset 762 6.8% 839 6.4%Others 221 2.0% 591 4.5%
Total Fixed Assets 1,156 10.3% 1,708 13.0%Total Assets 11,265 100% 13,160 100%
Dec., 2012 Sep., 2013Amount Ratio Amount Ratio
LiabilitiesAccountsPayable 2,178 19.3% 2,253 17.1%Short-term Debt 1,300 11.5% 1,300 9.9%Others 2,101 18.7% 2,431 18.5%
Total Current Liabilities 5,580 49.5% 5,985 45.5%Long term Liabilities 96 0.9% 338 2.6%Total Liabilities 5,676 50.4% 6,324 48.1%Net AssetsShareholder’s Equity 5,489 48.7% 6,760 51.4%Others 99 0.9% 75 0.6%Total Net Assets 5,588 49.6% 6,836 51.9%Total Liabilities & Net Assets 11,265 100% 13,160 100%
23
MonotaRO Co., Ltd.
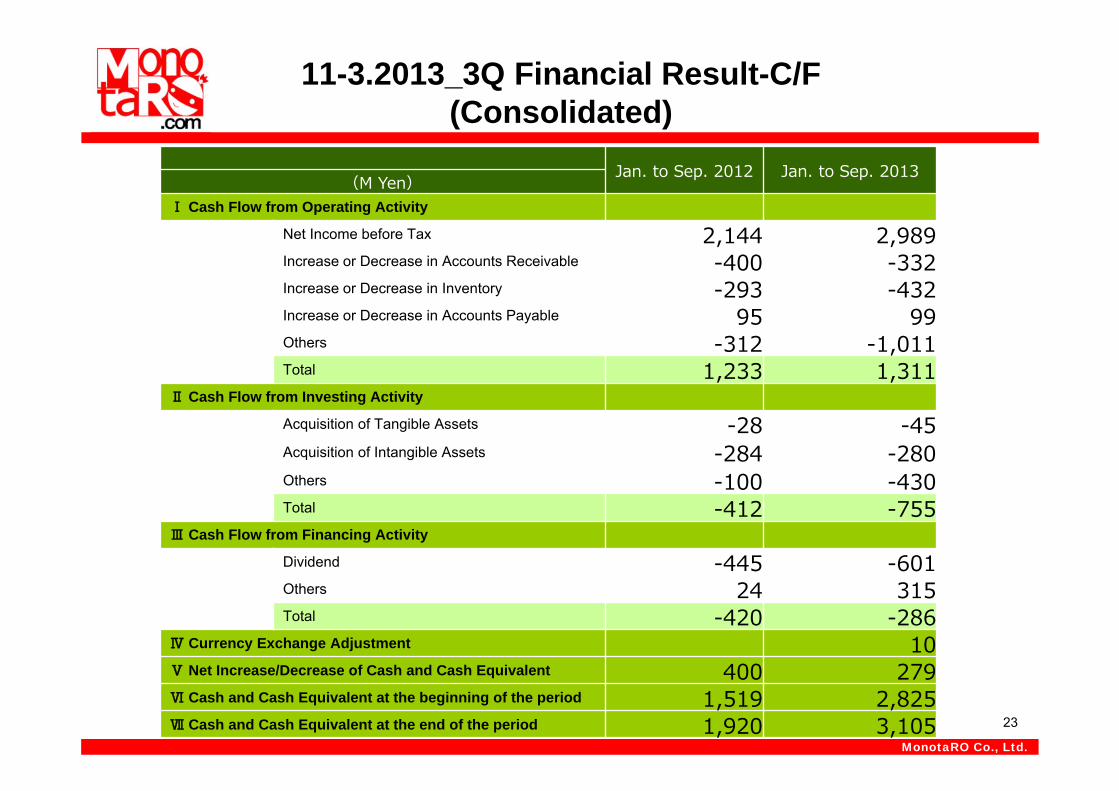
11-3.2013_3Q Financial Result-C/F(Consolidated)
Jan. to Sep. 2012 Jan. to Sep. 2013(M Yen)Ⅰ Cash Flow from Operating Activity
Net Income before Tax 2,144 2,989Increase or Decrease in Accounts Receivable -400 -332Increase or Decrease in Inventory -293 -432Increase or Decrease in Accounts Payable 95 99Others -312 -1,011Total 1,233 1,311
Ⅱ Cash Flow from Investing Activity
Acquisition of Tangible Assets -28 -45Acquisition of Intangible Assets -284 -280Others -100 -430Total -412 -755
Ⅲ Cash Flow from Financing Activity
Dividend -445 -601Others 24 315Total -420 -286
Ⅳ Currency Exchange Adjustment 10Ⅴ Net Increase/Decrease of Cash and Cash Equivalent 400 279Ⅵ Cash and Cash Equivalent at the beginning of the period 1,519 2,825Ⅶ Cash and Cash Equivalent at the end of the period 1,920 3,105
24
MonotaRO Co., Ltd.
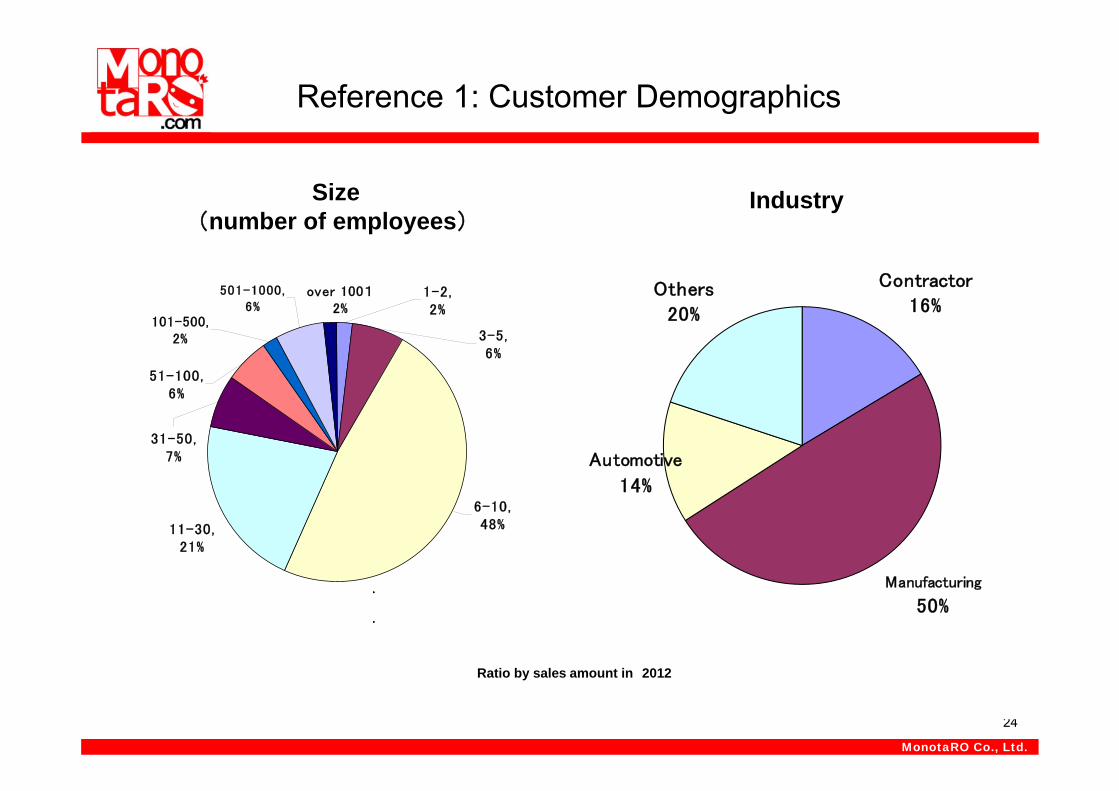
Reference 1: Customer Demographics
Size (number of employees)
Industry
Contractor
16%
Manufacturing
50%
Automotive
14%
Others
20%1-2,2%
over 10012%
501-1000,6%
101-500,2%
51-100,6%
31-50,7%
11-30,21%
6-10,48%
3-5,6%
Ratio by sales amount in 2012
25
MonotaRO Co., Ltd.
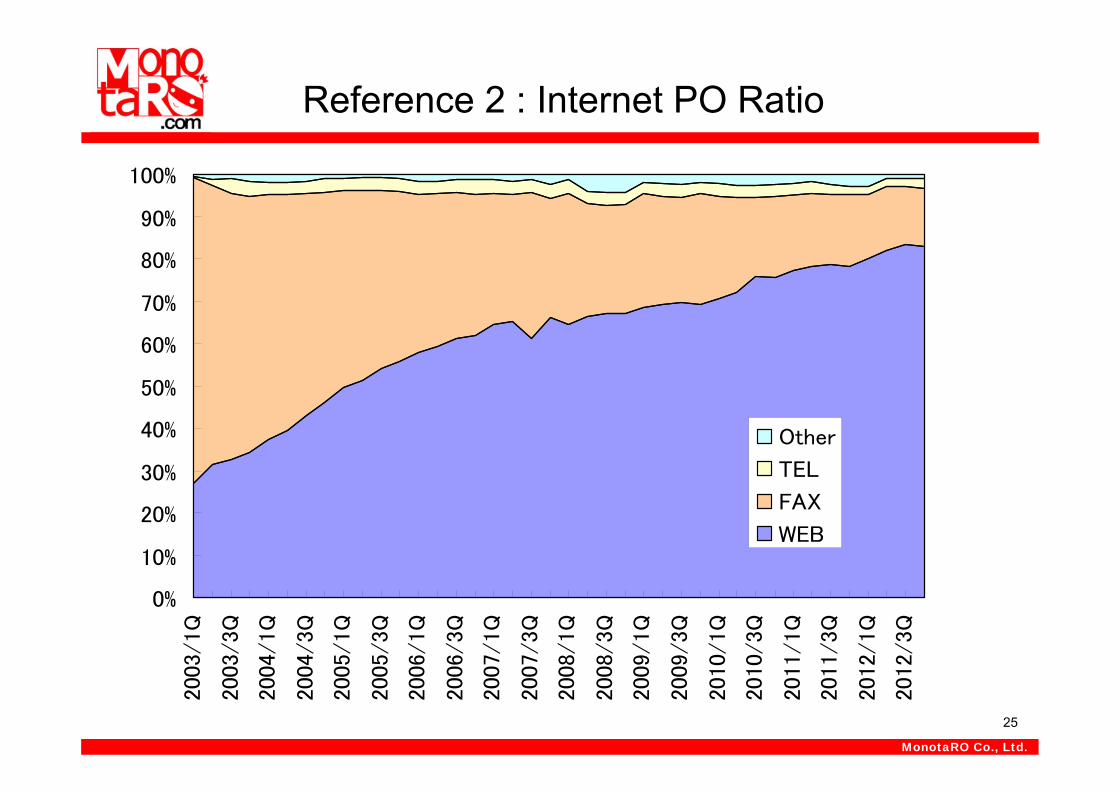
0%
10%
20%
30%
40%
50%
60%
70%
80%
90%
100%2003/1Q
2003/3Q
2004/1Q
2004/3Q
2005/1Q
2005/3Q
2006/1Q
2006/3Q
2007/1Q
2007/3Q
2008/1Q
2008/3Q
2009/1Q
2009/3Q
2010/1Q
2010/3Q
2011/1Q
2011/3Q
2012/1Q
2012/3Q
Other
TEL
FAX
WEB
Reference 2 : Internet PO Ratio
26
MonotaRO Co., Ltd.
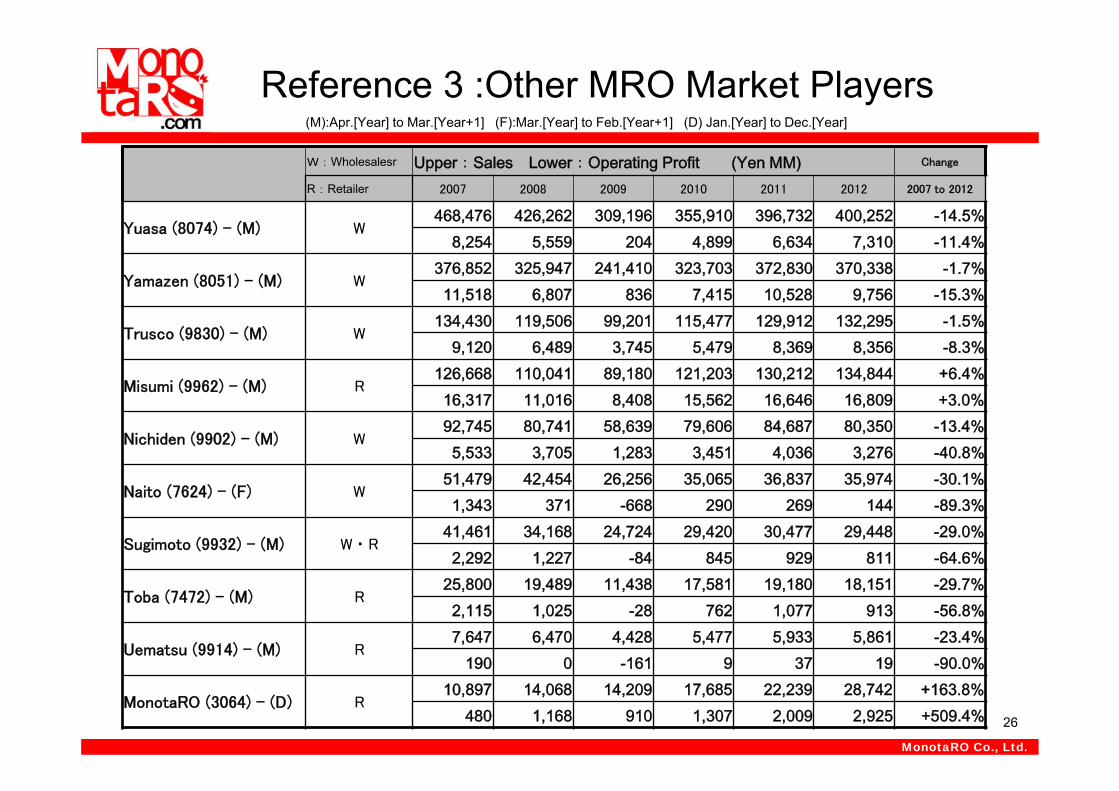
(M):Apr.[Year] to Mar.[Year+1] (F):Mar.[Year] to Feb.[Year+1] (D) Jan.[Year] to Dec.[Year]
Reference 3 :Other MRO Market Players
W:Wholesalesr Upper:Sales Lower:Operating Profit (Yen MM) Change
R:Retailer 2007 2008 2009 2010 2011 2012 2007 to 2012
Yuasa (8074) - (M) W468,476 426,262 309,196 355,910 396,732 400,252 -14.5%
8,254 5,559 204 4,899 6,634 7,310 -11.4%
Yamazen (8051) - (M) W376,852 325,947 241,410 323,703 372,830 370,338 -1.7%
11,518 6,807 836 7,415 10,528 9,756 -15.3%
Trusco (9830) - (M) W134,430 119,506 99,201 115,477 129,912 132,295 -1.5%
9,120 6,489 3,745 5,479 8,369 8,356 -8.3%
Misumi (9962) - (M) R126,668 110,041 89,180 121,203 130,212 134,844 +6.4%
16,317 11,016 8,408 15,562 16,646 16,809 +3.0%
Nichiden (9902) - (M) W92,745 80,741 58,639 79,606 84,687 80,350 -13.4%5,533 3,705 1,283 3,451 4,036 3,276 -40.8%
Naito (7624) - (F) W51,479 42,454 26,256 35,065 36,837 35,974 -30.1%1,343 371 -668 290 269 144 -89.3%
Sugimoto (9932) - (M) W・R41,461 34,168 24,724 29,420 30,477 29,448 -29.0%2,292 1,227 -84 845 929 811 -64.6%
Toba (7472) - (M) R25,800 19,489 11,438 17,581 19,180 18,151 -29.7%2,115 1,025 -28 762 1,077 913 -56.8%
Uematsu (9914) - (M) R7,647 6,470 4,428 5,477 5,933 5,861 -23.4%
190 0 -161 9 37 19 -90.0%
MonotaRO (3064) - (D) R10,897 14,068 14,209 17,685 22,239 28,742 +163.8%
480 1,168 910 1,307 2,009 2,925 +509.4%
27
MonotaRO Co., Ltd.
Contact Us
E-mail:[email protected]
MonotaRO Co.Ltd.
TEL: 81-6-4869-7190FAX: 81-6-4869-7178


![Heat Resistant Wire 600V Silicone, Rubber Insulated Glass Braided Cable Ishikawa Toku Electric Wire and Cable [MonotaRO Singapore] 600V LKGB](https://img.pdfslide.net/doc/110x75/55cf8572550346484b8e1a74/heat-resistant-wire-600v-silicone-rubber-insulated-glass-braided-cable-ishikawa.jpg)


![F: 11 a [r.p.m]) æFÆN(L/rnin) 7000 300 0.62 9.5 1.1 PTI (M5) 7ti4—Jb … · 2017. 9. 11. · Jb71J5—5 ñ73— (Y5yF.) 0.62MPa ñ73— (735) ñ73— (735) ñ73— (Y5yt--) MonotaRO](https://img.pdfslide.net/doc/110x75/6052c894cb3d5a14842ab2ab/f-11-a-rpm-fnlrnin-7000-300-062-95-11-pti-m5-7ti4ajb-2017-9.jpg)