Embed Size (px)
Citation preview
Page1
MonroeTownshipSchoolDistrictMonroeTownship,NewJersey
MiddleSchool7th Grade*PREPARATIONPACKET*
Welcometo7thGradeMathematics!Our7thGradeMathematicsCourseisacomprehensivesurveycoursethatwillprovideyouwiththefundamentaltoolsofmathematicalunderstandingthatwillsupportyouinallyourhighschoolcourses.Sinceyouwillbetaking7thGradeMathematicsaftersuccessfulcompletionof6thGradeMathematics,theMonroeTownshipMiddleSchool7thGRADEPREPARATIONPACKETcontainsreviewmaterialofthe6thgradeconcepts,skills,andproceduresthatshouldbemasteredBEFOREentering7thgradeinthefall.Essentially,thispacketprovidesareviewofthemajor6thgradetopicsaswellasapreviewof7thgradetopics.ThesectionsarebasedontheNJ2016StudentLearningStandards.Seeourtownshipwebsiteforgreatweb-basedresources
ifyouneedarefresheronanyoftheproblemsencounteredhereinthispacket.Herearesomewebsitesyoumightfindparticularlyuseful:
• http://www.khanacademy.org/• http://www.ixl.com/math/• http://phschool.com/atschool/cmp2/program_page.html• http://www.studyisland.com/web/index/
Thiscollectionofproblemswillidentifythoseconceptsthatyouhavemasteredaswellasthoseyouwillneedtopracticeandreview.Youareexpectedtoseekextrahelpimmediatelyonthoseconceptswithwhichyouhavenotdemonstratedproficiency.Beresourceful–usetheonlineresources!***SOLVETHESEPROBLEMSWITHOUTTHEUSEOFACALCULATORANDSHOWALLWORK***YouwillberesponsibleforhandinginthecompletedpacketwithallworkshownONTHEFIRSTDAYOFSCHOOL.TheproblemshereareveryrepresentativeofthetypesofitemsyouwillneedtohavemasteredBEFORE7thGradeMath…sowestronglyencouragethatyouincludethispacketinyoursummerfestivities!Goodluckandenjoy!J
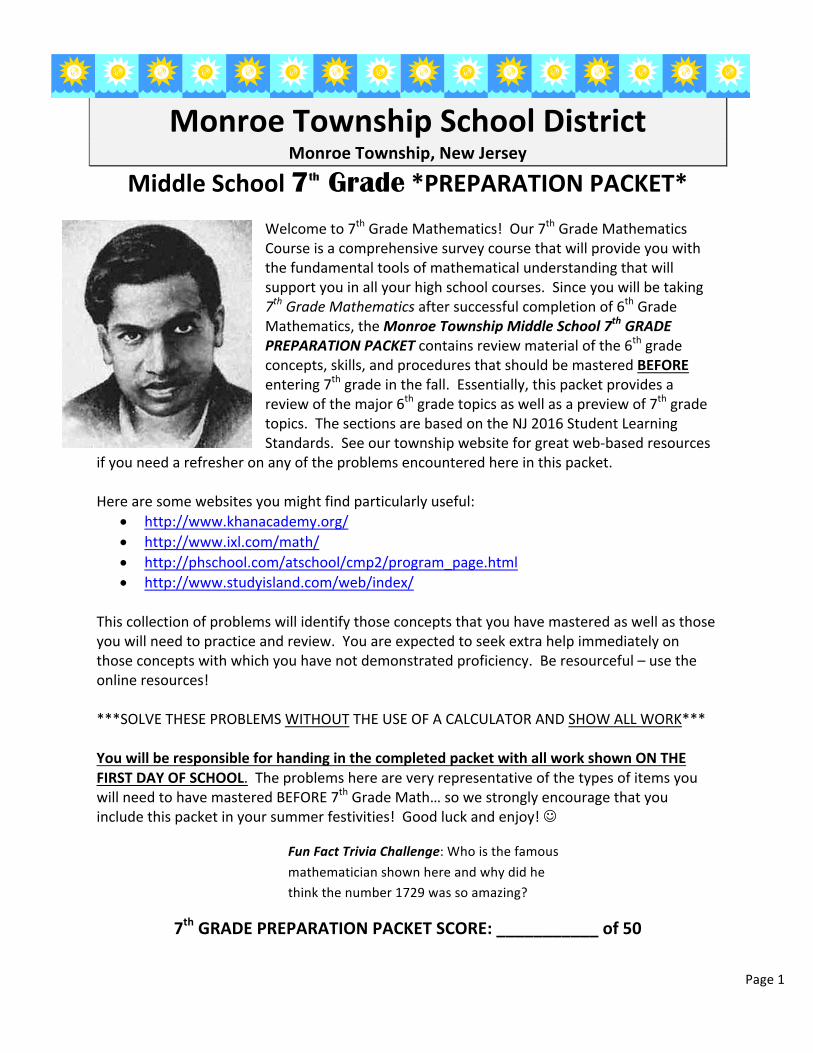
FunFactTriviaChallenge:Whoisthefamousmathematicianshownhereandwhydidhethinkthenumber1729wassoamazing?
7thGRADEPREPARATIONPACKETSCORE:___________of50
Page2
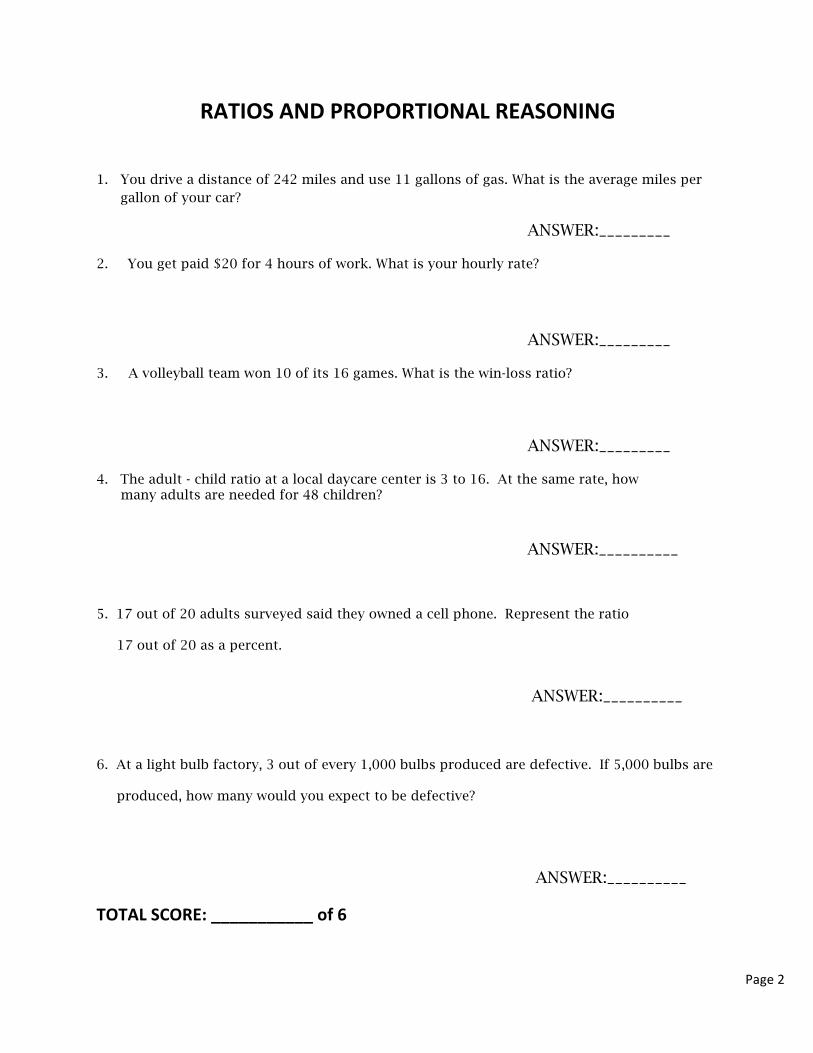
RATIOSANDPROPORTIONALREASONING
1. You drive a distance of 242 miles and use 11 gallons of gas. What is the average miles per gallon of your car?
ANSWER:_________
2. You get paid $20 for 4 hours of work. What is your hourly rate?
ANSWER:_________
3. A volleyball team won 10 of its 16 games. What is the win-loss ratio?
ANSWER:_________
4. The adult - child ratio at a local daycare center is 3 to 16. At the same rate, how many adults are needed for 48 children?
ANSWER:__________
5. 17 out of 20 adults surveyed said they owned a cell phone. Represent the ratio
17 out of 20 as a percent.
ANSWER:__________
6. At a light bulb factory, 3 out of every 1,000 bulbs produced are defective. If 5,000 bulbs are
produced, how many would you expect to be defective?
ANSWER:__________
TOTALSCORE:___________of6
Page3
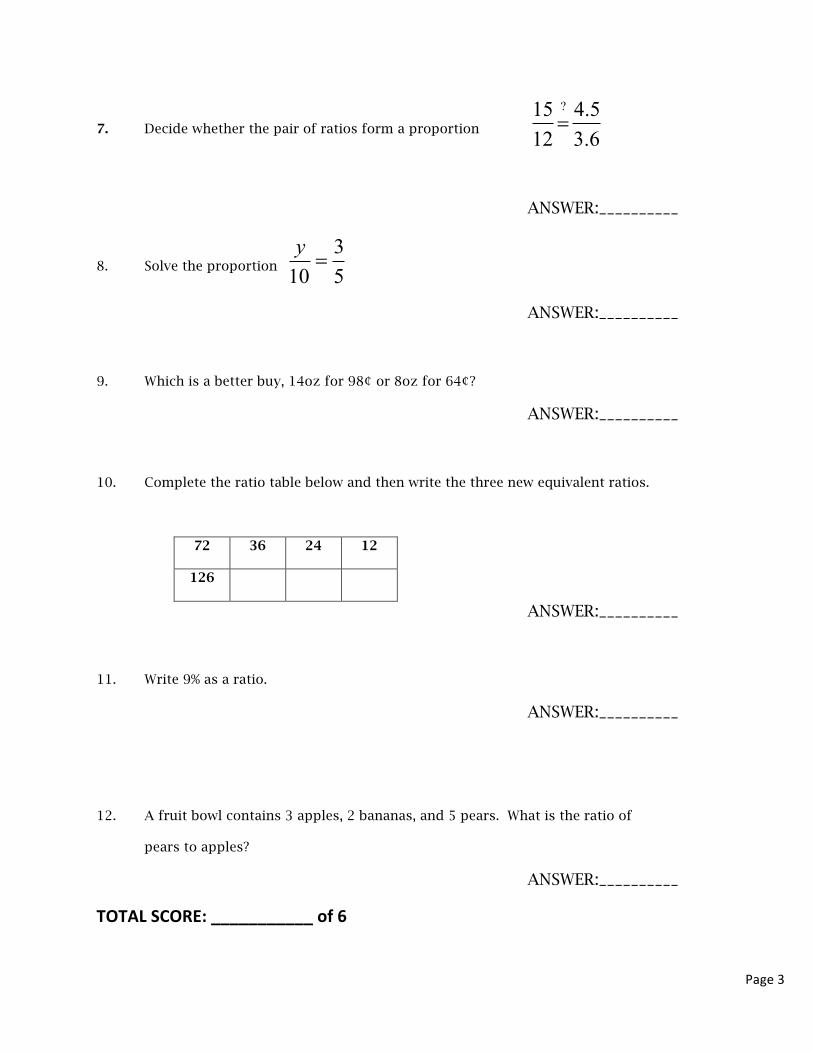
7. Decide whether the pair of ratios form a proportion ?15 4.5
12 3.6=
ANSWER:__________
8. Solve the proportion 3
10 5y=
ANSWER:__________
9. Which is a better buy, 14oz for 98¢ or 8oz for 64¢?
ANSWER:__________
10. Complete the ratio table below and then write the three new equivalent ratios.
72 36 24 12
126
ANSWER:__________
11. Write 9% as a ratio.
ANSWER:__________
12. A fruit bowl contains 3 apples, 2 bananas, and 5 pears. What is the ratio of
pears to apples?
ANSWER:__________
TOTALSCORE:___________of6
Page4
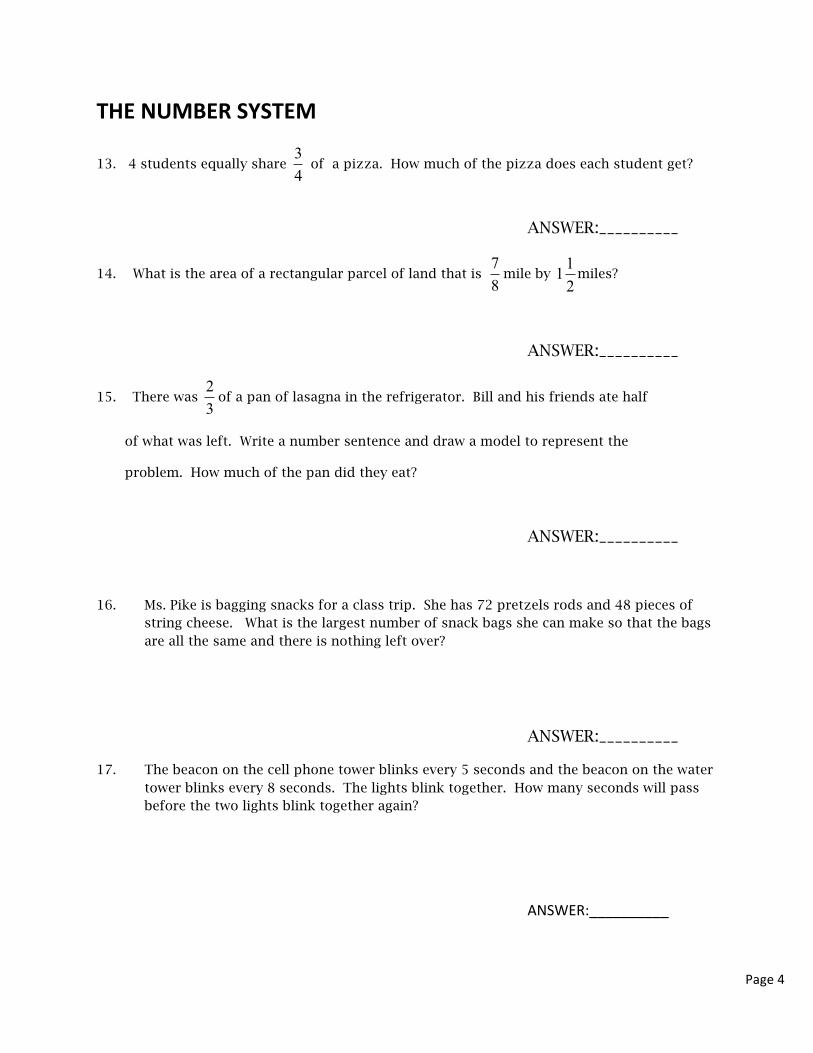
THENUMBERSYSTEM
13. 4 students equally share 34
of a pizza. How much of the pizza does each student get?
ANSWER:__________
14. What is the area of a rectangular parcel of land that is 78
mile by 112
miles?
ANSWER:__________
15. There was 23
of a pan of lasagna in the refrigerator. Bill and his friends ate half
of what was left. Write a number sentence and draw a model to represent the
problem. How much of the pan did they eat?
ANSWER:__________
16. Ms. Pike is bagging snacks for a class trip. She has 72 pretzels rods and 48 pieces of string cheese. What is the largest number of snack bags she can make so that the bags are all the same and there is nothing left over?
ANSWER:__________
17. The beacon on the cell phone tower blinks every 5 seconds and the beacon on the water tower blinks every 8 seconds. The lights blink together. How many seconds will pass before the two lights blink together again?
ANSWER:__________
Page5
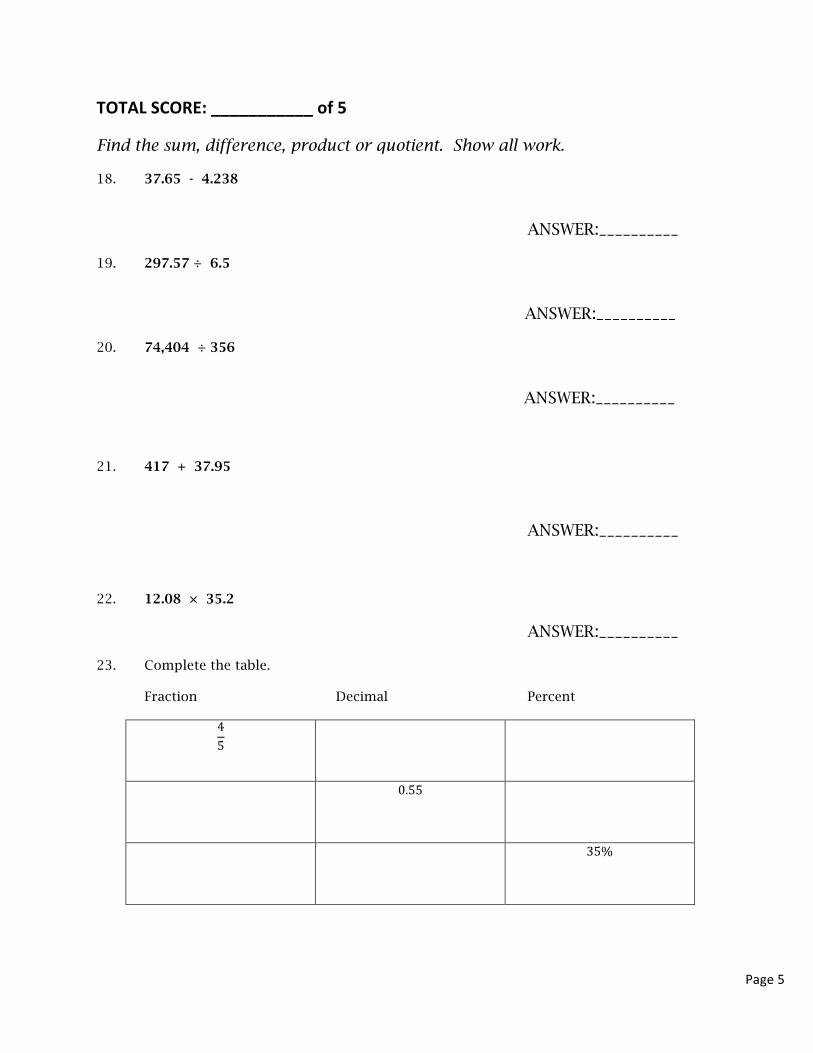
TOTALSCORE:___________of5
Find the sum, difference, product or quotient. Show all work.
18. 37.65 - 4.238
ANSWER:__________
19. 297.57 ÷ 6.5
ANSWER:__________
20. 74,404 ÷ 356
ANSWER:__________
21. 417 + 37.95
ANSWER:__________
22. 12.08 × 35.2
ANSWER:__________
23. Complete the table.
Fraction Decimal Percent
45
0.55
35%
Page6
TOTALSCORE:___________of6
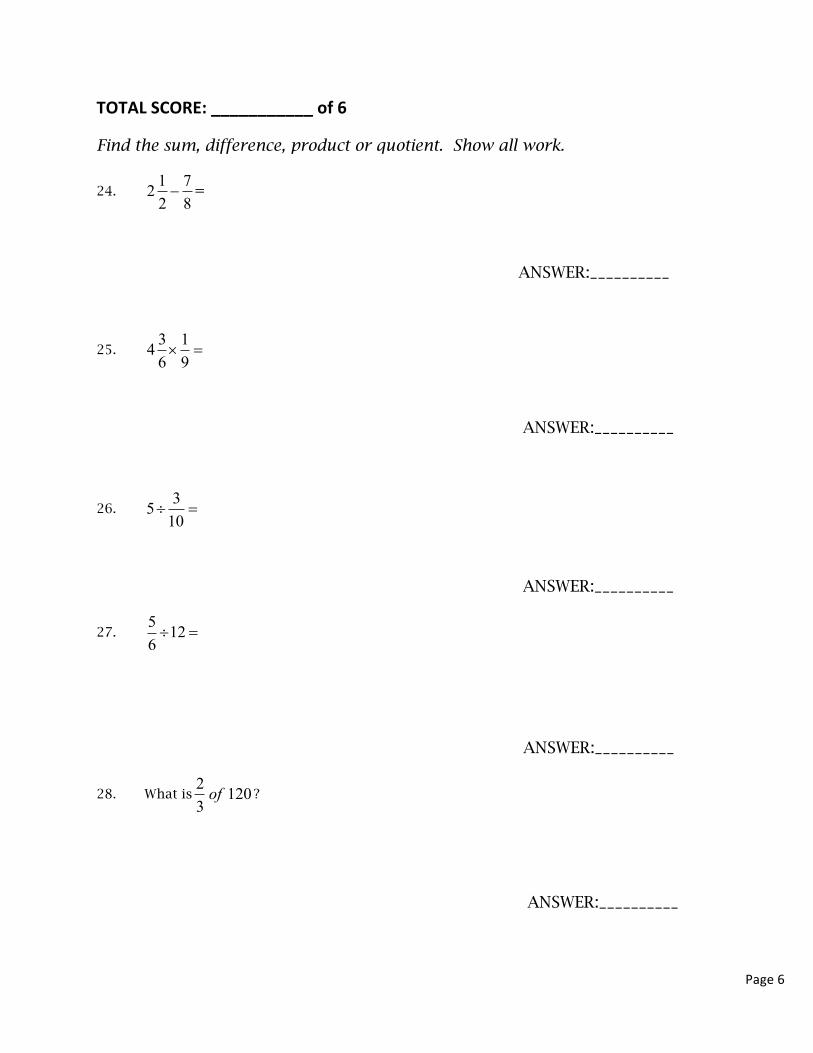
Find the sum, difference, product or quotient. Show all work.
24. 1 722 8- =
ANSWER:__________
25. 3 146 9´ =
ANSWER:__________
26. 3510
÷ =
ANSWER:__________
27. 5 126÷ =
ANSWER:__________
28. What is2 1203of ?
ANSWER:__________
Page7
TOTALSCORE:___________of5
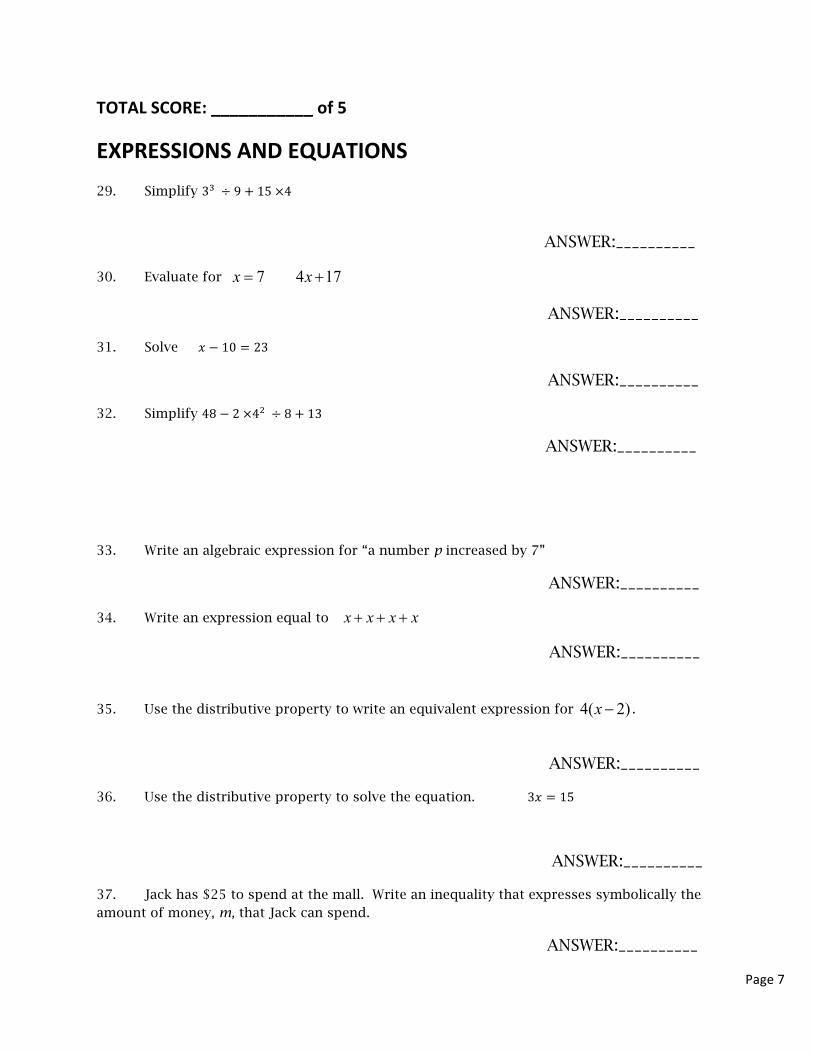
EXPRESSIONSANDEQUATIONS29. Simplify 3' ÷ 9 + 15×4
ANSWER:__________
30. Evaluate for 7 4 17x x= +
ANSWER:__________
31. Solve 𝑥 − 10 = 23
ANSWER:__________
32. Simplify 48 − 2×43 ÷ 8 + 13
ANSWER:__________
33. Write an algebraic expression for “a number p increased by 7”
ANSWER:__________
34. Write an expression equal to x x x x+ + +
ANSWER:__________
35. Use the distributive property to write an equivalent expression for 4( 2)x - .
ANSWER:__________
36. Use the distributive property to solve the equation. 3𝑥 = 15
ANSWER:__________
37. Jack has $25 to spend at the mall. Write an inequality that expresses symbolically the amount of money, m, that Jack can spend.
ANSWER:__________
Page8
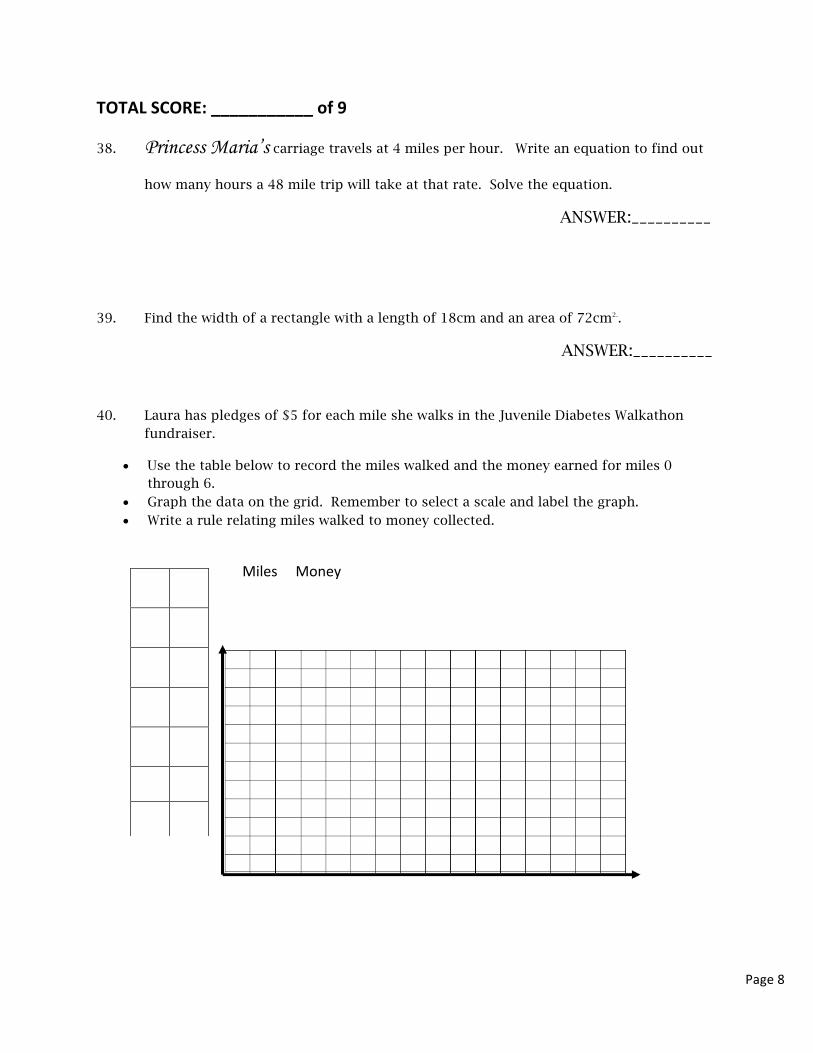
TOTALSCORE:___________of9
38. Princess Maria’s carriage travels at 4 miles per hour. Write an equation to find out
how many hours a 48 mile trip will take at that rate. Solve the equation.
ANSWER:__________
39. Find the width of a rectangle with a length of 18cm and an area of 72cm2..
ANSWER:__________
40. Laura has pledges of $5 for each mile she walks in the Juvenile Diabetes Walkathon fundraiser.
• Use the table below to record the miles walked and the money earned for miles 0 through 6.
• Graph the data on the grid. Remember to select a scale and label the graph. • Write a rule relating miles walked to money collected.
MilesMoney
Page9
TOTALSCORE:___________of3
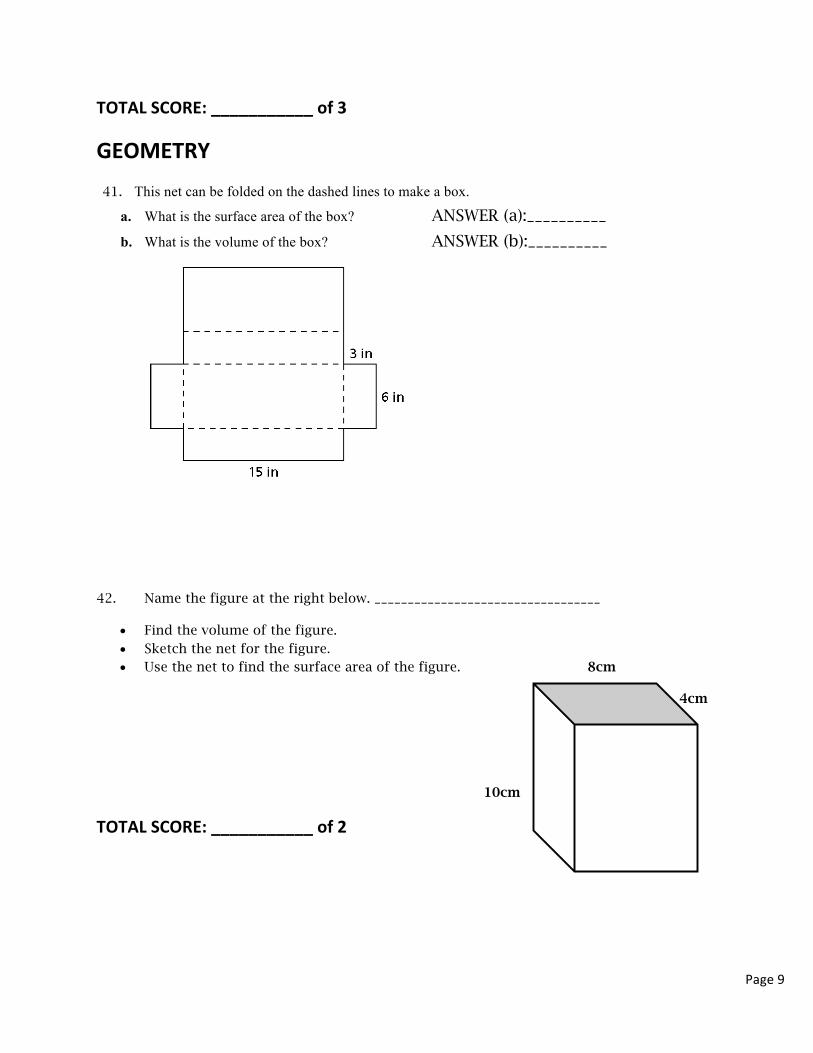
GEOMETRY41. This net can be folded on the dashed lines to make a box.
a. What is the surface area of the box? ANSWER (a):__________
b. What is the volume of the box? ANSWER (b):__________
42. Name the figure at the right below. __________________________________
• Find the volume of the figure. • Sketch the net for the figure. • Use the net to find the surface area of the figure. 8cm
4cm
10cm
TOTALSCORE:___________of2
Page10
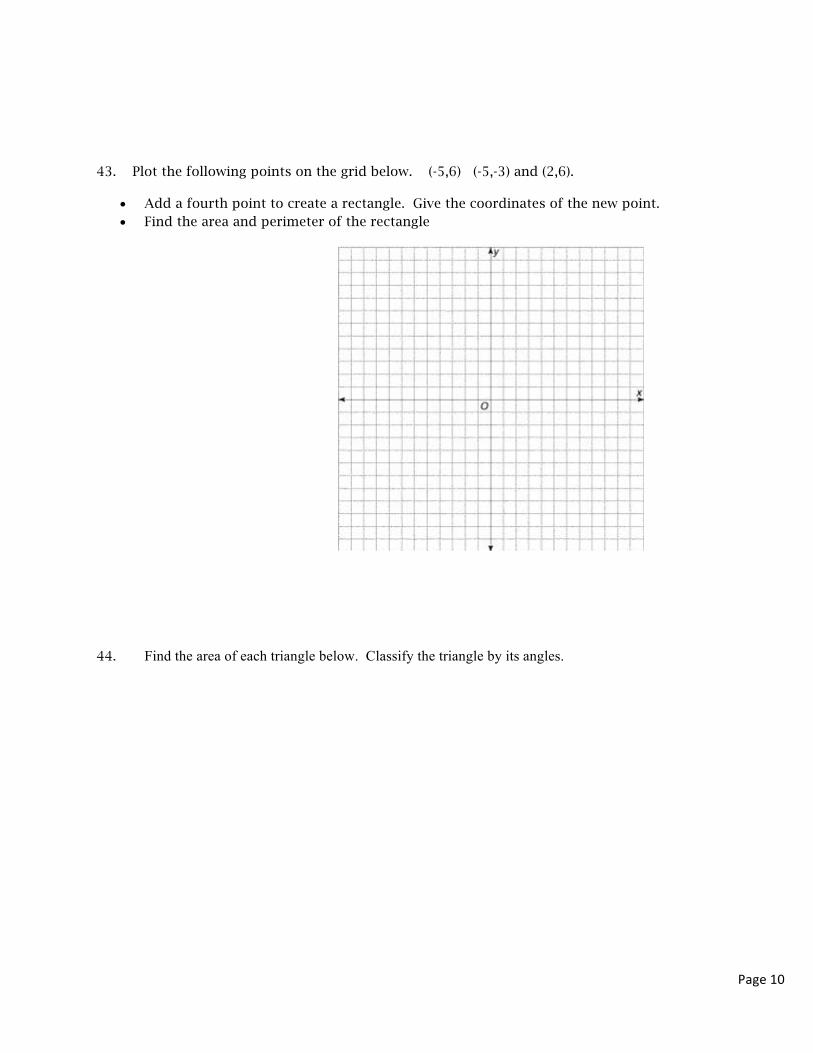
43. Plot the following points on the grid below. (-5,6) (-5,-3) and (2,6).
• Add a fourth point to create a rectangle. Give the coordinates of the new point. • Find the area and perimeter of the rectangle
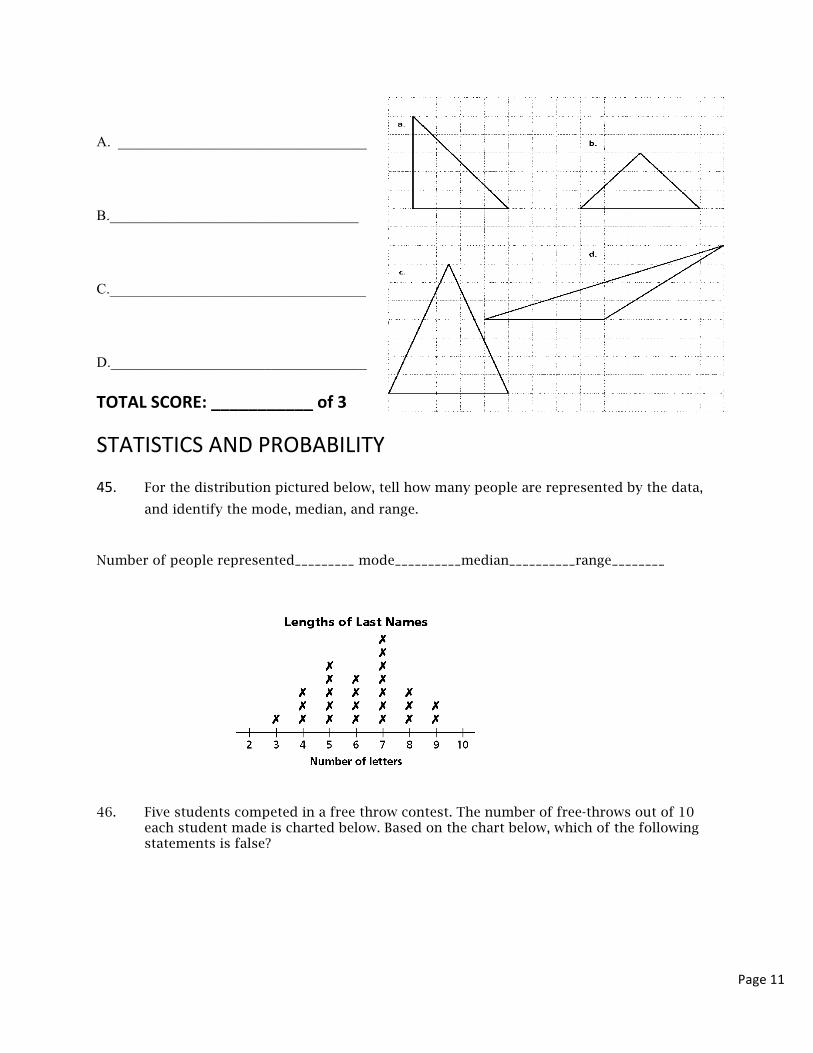
44. Find the area of each triangle below. Classify the triangle by its angles.
Page11
A. __________________________________
B.__________________________________
C.___________________________________
D.___________________________________
TOTALSCORE:___________of3
STATISTICSANDPROBABILITY
45. For the distribution pictured below, tell how many people are represented by the data,
and identify the mode, median, and range.
Number of people represented_________ mode__________median__________range________
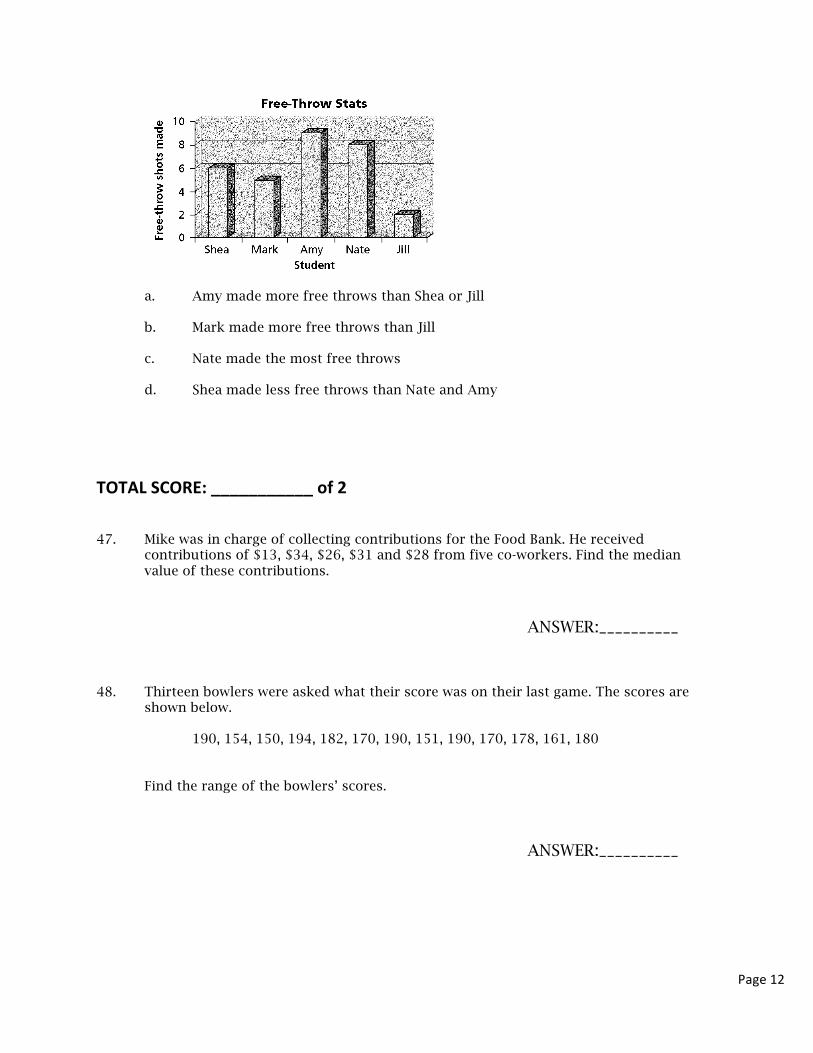
46. Five students competed in a free throw contest. The number of free-throws out of 10 each student made is charted below. Based on the chart below, which of the following statements is false?
Page12
a. Amy made more free throws than Shea or Jill b. Mark made more free throws than Jill c. Nate made the most free throws d. Shea made less free throws than Nate and Amy
TOTALSCORE:___________of2
47. Mike was in charge of collecting contributions for the Food Bank. He received
contributions of $13, $34, $26, $31 and $28 from five co-workers. Find the median value of these contributions.
ANSWER:__________
48. Thirteen bowlers were asked what their score was on their last game. The scores are shown below.
190, 154, 150, 194, 182, 170, 190, 151, 190, 170, 178, 161, 180
Find the range of the bowlers’ scores.
ANSWER:__________
Page13
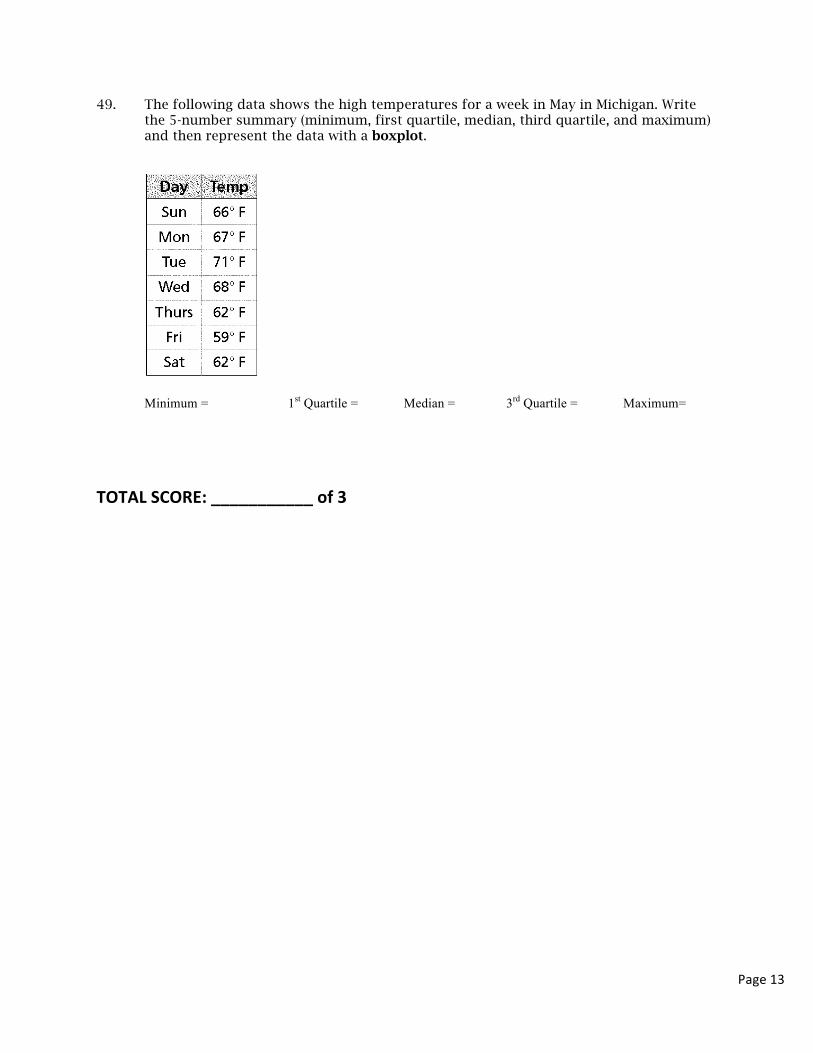
49. The following data shows the high temperatures for a week in May in Michigan. Write the 5-number summary (minimum, first quartile, median, third quartile, and maximum) and then represent the data with a boxplot.
Minimum = 1st Quartile = Median = 3rd Quartile = Maximum=
TOTALSCORE:___________of3