Embed Size (px)
Citation preview
Montana Drug Treatment Courts Montana Drug Treatment Courts
Brenda K. Roche, Ph.D., LPBrenda K. Roche, Ph.D., LPNeuropsychologist/Program EvaluatorNeuropsychologist/Program Evaluator
Eastern Montana Meth SummitEastern Montana Meth Summit
April 22, 2005April 22, 2005
Montana Treatment CourtsMontana Treatment Courts Missoula Youth Drug CourtMissoula Youth Drug Court Mineral County Youth Drug CourtMineral County Youth Drug Court Bozeman Adult Felony Drug CourtBozeman Adult Felony Drug Court Yellowstone County Family Drug Treatment CourtYellowstone County Family Drug Treatment Court Lewistown Family Treatment CourtLewistown Family Treatment Court Custer County Family Treatment CourtCuster County Family Treatment Court Butte Silver Bow Family Treatment CourtButte Silver Bow Family Treatment Court Billings Adult Misdemeanor Drug CourtBillings Adult Misdemeanor Drug Court Missoula Adult Mental Health CourtMissoula Adult Mental Health Court Cascade County Adult Drug CourtCascade County Adult Drug Court Chippewa Cree Youth Wellness Court Chippewa Cree Youth Wellness Court Crow Youth Wellness CourtCrow Youth Wellness Court Ft. Belknap Youth Wellness CourtFt. Belknap Youth Wellness Court Ft. Peck Youth Wellness CourtFt. Peck Youth Wellness Court Northern CheyenneNorthern Cheyenne Youth Wellness Court Youth Wellness Court
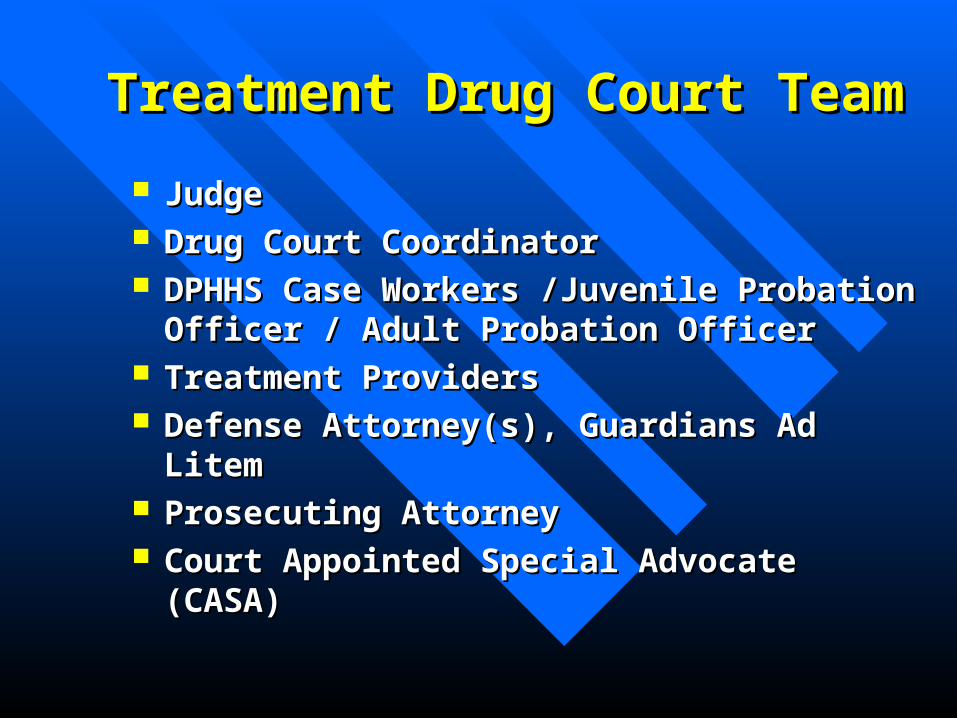
Treatment Drug Court TeamTreatment Drug Court Team
JudgeJudge Drug Court CoordinatorDrug Court Coordinator DPHHS Case Workers /Juvenile Probation DPHHS Case Workers /Juvenile Probation
Officer / Adult Probation OfficerOfficer / Adult Probation Officer Treatment ProvidersTreatment Providers Defense Attorney(s), Guardians Ad LitemDefense Attorney(s), Guardians Ad Litem Prosecuting AttorneyProsecuting Attorney Court Appointed Special Advocate (CASA)Court Appointed Special Advocate (CASA)
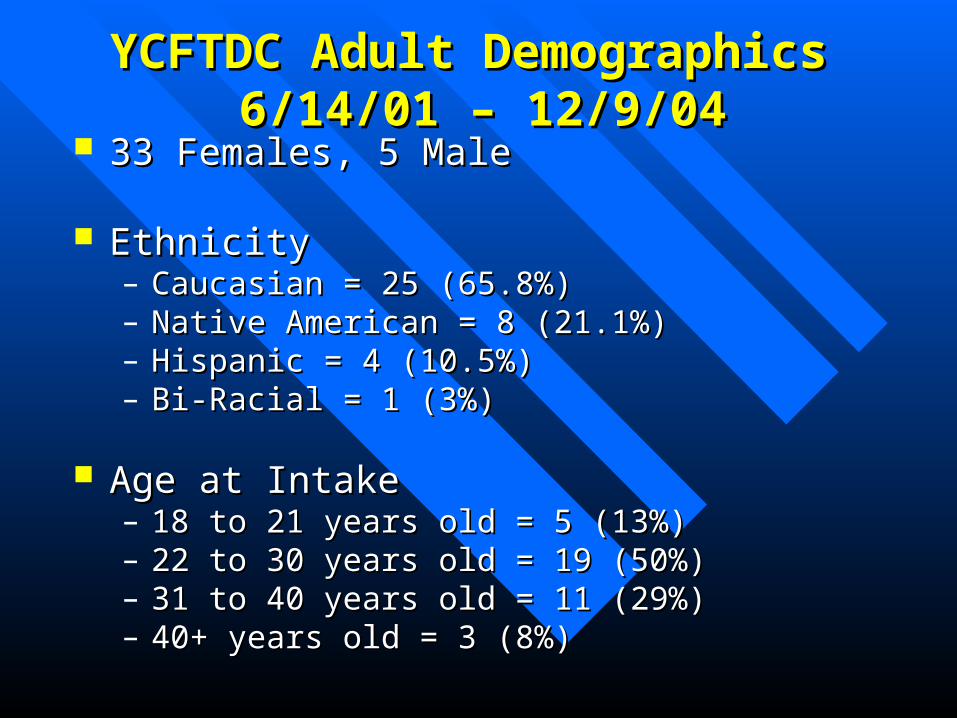
YCFTDC Adult Demographics YCFTDC Adult Demographics 6/14/01 – 12/9/046/14/01 – 12/9/04
33 Females, 5 Male33 Females, 5 Male
EthnicityEthnicity– Caucasian = 25 (65.8%)Caucasian = 25 (65.8%)– Native American = 8 (21.1%)Native American = 8 (21.1%)– Hispanic = 4 (10.5%)Hispanic = 4 (10.5%)– Bi-Racial = 1 (3%)Bi-Racial = 1 (3%)
Age at IntakeAge at Intake– 18 to 21 years old = 5 (13%)18 to 21 years old = 5 (13%)– 22 to 30 years old = 19 (50%)22 to 30 years old = 19 (50%)– 31 to 40 years old = 11 (29%)31 to 40 years old = 11 (29%)– 40+ years old = 3 (8%)40+ years old = 3 (8%)
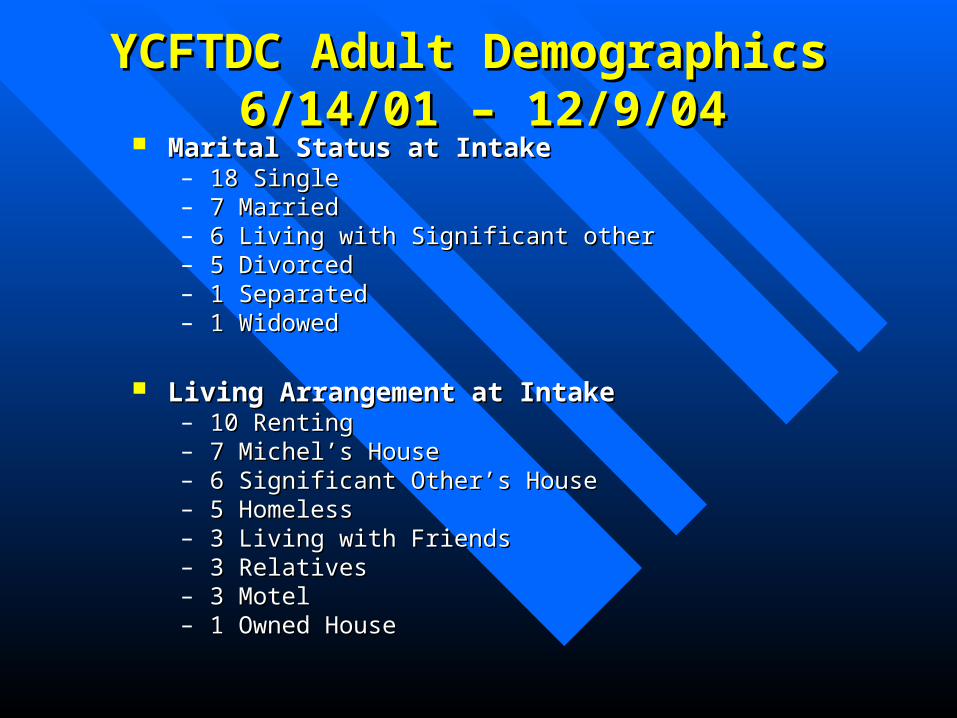
YCFTDC Adult Demographics YCFTDC Adult Demographics 6/14/01 – 12/9/046/14/01 – 12/9/04
Marital Status at IntakeMarital Status at Intake– 18 Single18 Single– 7 Married7 Married– 6 Living with Significant other 6 Living with Significant other – 5 Divorced5 Divorced– 1 Separated1 Separated– 1 Widowed1 Widowed
Living Arrangement at IntakeLiving Arrangement at Intake– 10 Renting10 Renting– 7 Michel’s House7 Michel’s House– 6 Significant Other’s House6 Significant Other’s House– 5 Homeless5 Homeless– 3 Living with Friends3 Living with Friends– 3 Relatives3 Relatives– 3 Motel3 Motel– 1 Owned House1 Owned House
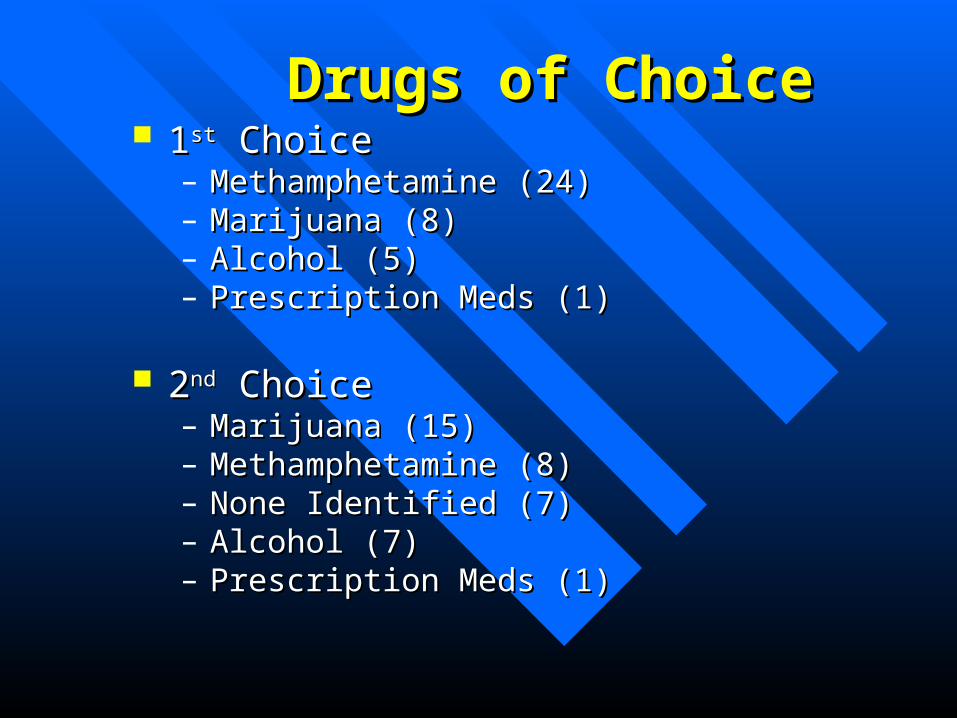
Drugs of ChoiceDrugs of Choice 11stst Choice Choice
– Methamphetamine (24)Methamphetamine (24)– Marijuana (8)Marijuana (8)– Alcohol (5)Alcohol (5)– Prescription Meds (1)Prescription Meds (1)
22ndnd Choice Choice– Marijuana (15)Marijuana (15)– Methamphetamine (8)Methamphetamine (8)– None Identified (7)None Identified (7)– Alcohol (7)Alcohol (7)– Prescription Meds (1)Prescription Meds (1)
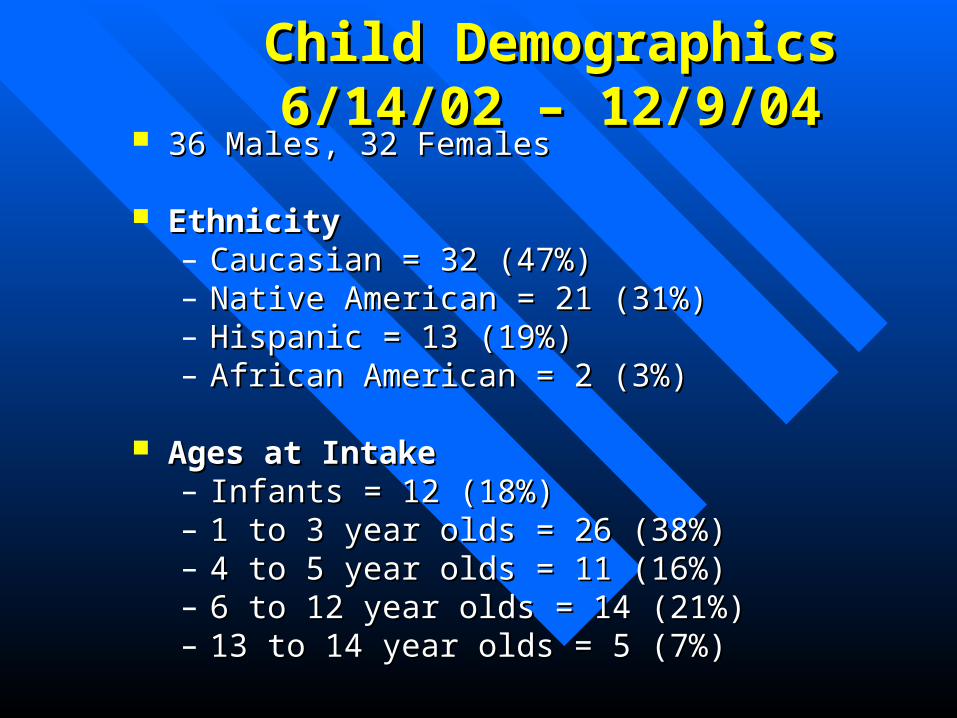
Child DemographicsChild Demographics6/14/02 – 12/9/046/14/02 – 12/9/04
36 Males, 32 Females36 Males, 32 Females
EthnicityEthnicity– Caucasian = 32 (47%)Caucasian = 32 (47%)– Native American = 21 (31%)Native American = 21 (31%)– Hispanic = 13 (19%)Hispanic = 13 (19%)– African American = 2 (3%)African American = 2 (3%)
Ages at IntakeAges at Intake– Infants = 12 (18%)Infants = 12 (18%)– 1 to 3 year olds = 26 (38%)1 to 3 year olds = 26 (38%)– 4 to 5 year olds = 11 (16%)4 to 5 year olds = 11 (16%)– 6 to 12 year olds = 14 (21%)6 to 12 year olds = 14 (21%)– 13 to 14 year olds = 5 (7%)13 to 14 year olds = 5 (7%)
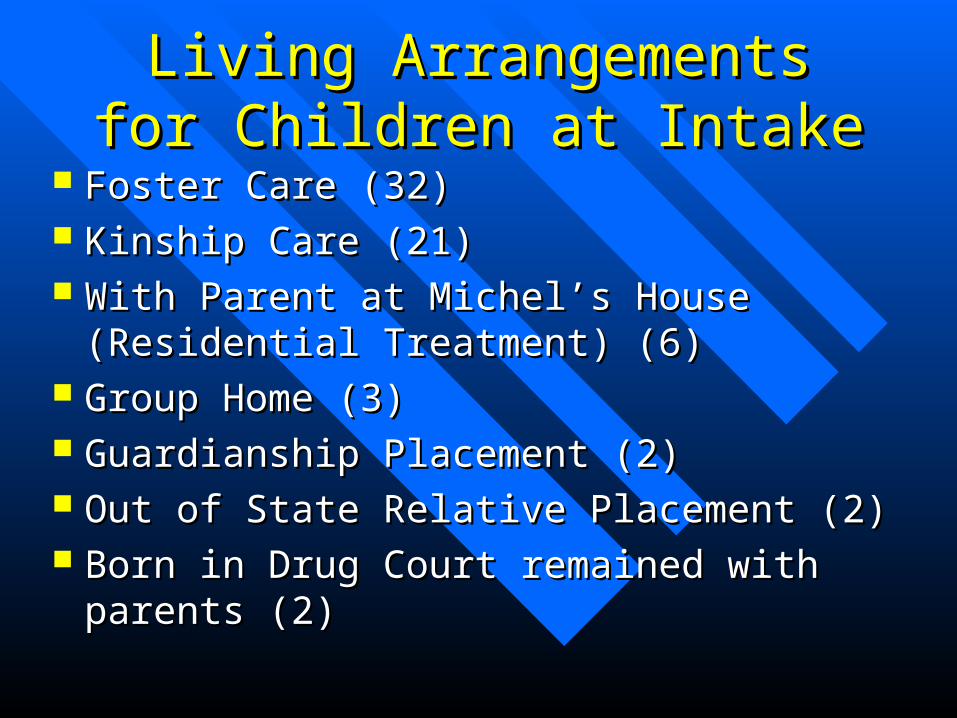
Living Arrangements for Living Arrangements for Children at IntakeChildren at Intake
Foster Care (32)Foster Care (32) Kinship Care (21)Kinship Care (21) With Parent at Michel’s House (Residential With Parent at Michel’s House (Residential
Treatment) (6)Treatment) (6) Group Home (3)Group Home (3) Guardianship Placement (2)Guardianship Placement (2) Out of State Relative Placement (2)Out of State Relative Placement (2) Born in Drug Court remained with parents (2)Born in Drug Court remained with parents (2)
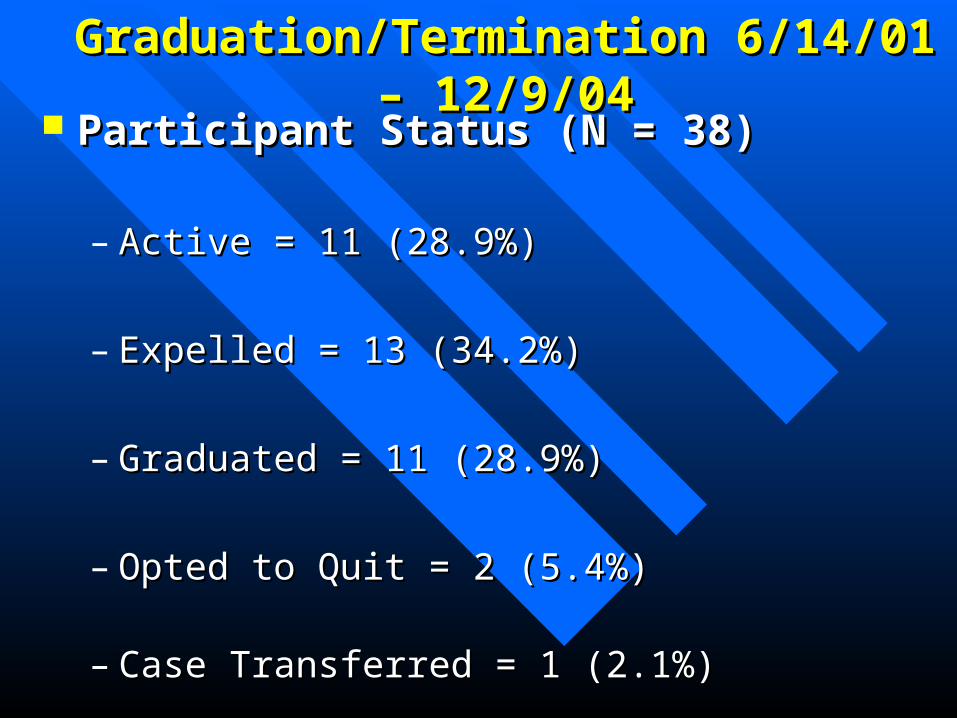
Graduation/Termination 6/14/01 – 12/9/04Graduation/Termination 6/14/01 – 12/9/04 Participant Status (N = 38)Participant Status (N = 38)
– Active = 11 (28.9%)Active = 11 (28.9%)
– Expelled = 13 (34.2%)Expelled = 13 (34.2%)
– Graduated = 11 (28.9%)Graduated = 11 (28.9%)
– Opted to Quit = 2 (5.4%)Opted to Quit = 2 (5.4%)
– Case Transferred = 1 (2.1%)Case Transferred = 1 (2.1%)
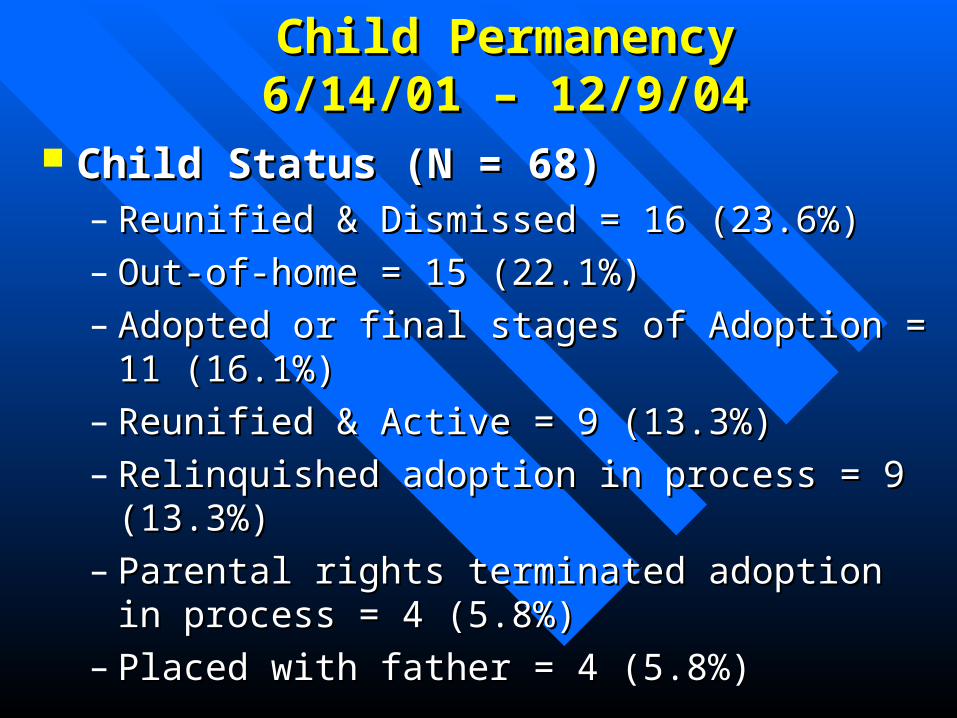
Child PermanencyChild Permanency6/14/01 – 12/9/046/14/01 – 12/9/04
Child Status (N = 68)Child Status (N = 68)– Reunified & Dismissed = 16 (23.6%)Reunified & Dismissed = 16 (23.6%)– Out-of-home = 15 (22.1%)Out-of-home = 15 (22.1%)– Adopted or final stages of Adoption = 11 (16.1%)Adopted or final stages of Adoption = 11 (16.1%)– Reunified & Active = 9 (13.3%)Reunified & Active = 9 (13.3%)– Relinquished adoption in process = 9 (13.3%) Relinquished adoption in process = 9 (13.3%) – Parental rights terminated adoption in process = 4 Parental rights terminated adoption in process = 4
(5.8%)(5.8%)– Placed with father = 4 (5.8%)Placed with father = 4 (5.8%)
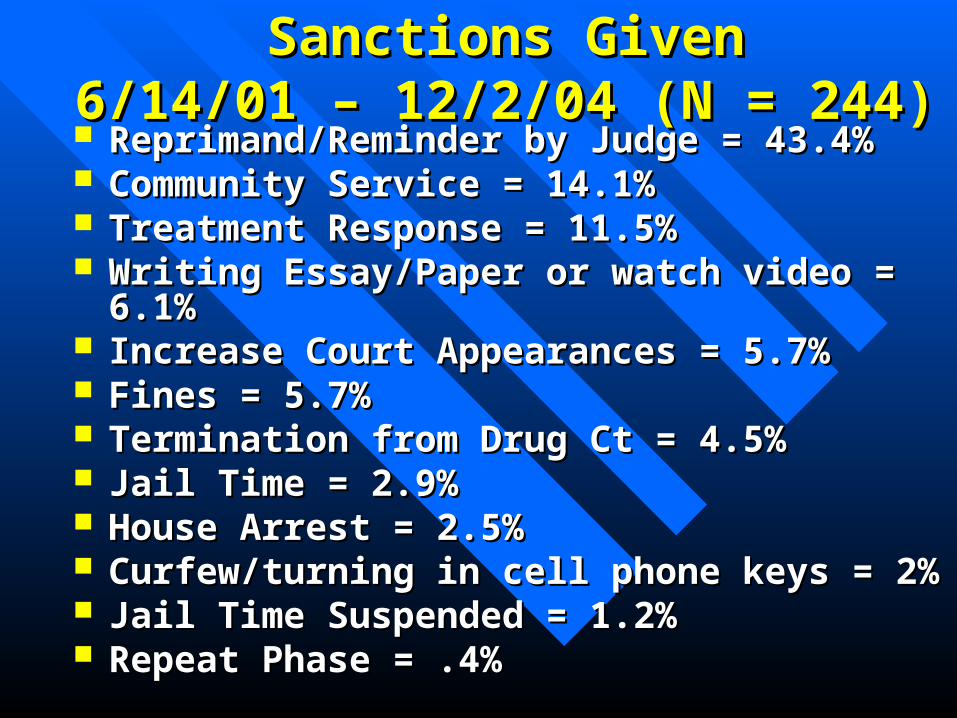
Sanctions GivenSanctions Given6/14/01 – 12/2/04 (N = 244)6/14/01 – 12/2/04 (N = 244)
Reprimand/Reminder by Judge = 43.4%Reprimand/Reminder by Judge = 43.4% Community Service = 14.1%Community Service = 14.1% Treatment Response = 11.5% Treatment Response = 11.5% Writing Essay/Paper or watch video = 6.1%Writing Essay/Paper or watch video = 6.1% Increase Court Appearances = 5.7%Increase Court Appearances = 5.7% Fines = 5.7%Fines = 5.7% Termination from Drug Ct = 4.5% Termination from Drug Ct = 4.5% Jail Time = 2.9%Jail Time = 2.9% House Arrest = 2.5%House Arrest = 2.5% Curfew/turning in cell phone keys = 2%Curfew/turning in cell phone keys = 2% Jail Time Suspended = 1.2%Jail Time Suspended = 1.2% Repeat Phase = .4%Repeat Phase = .4%
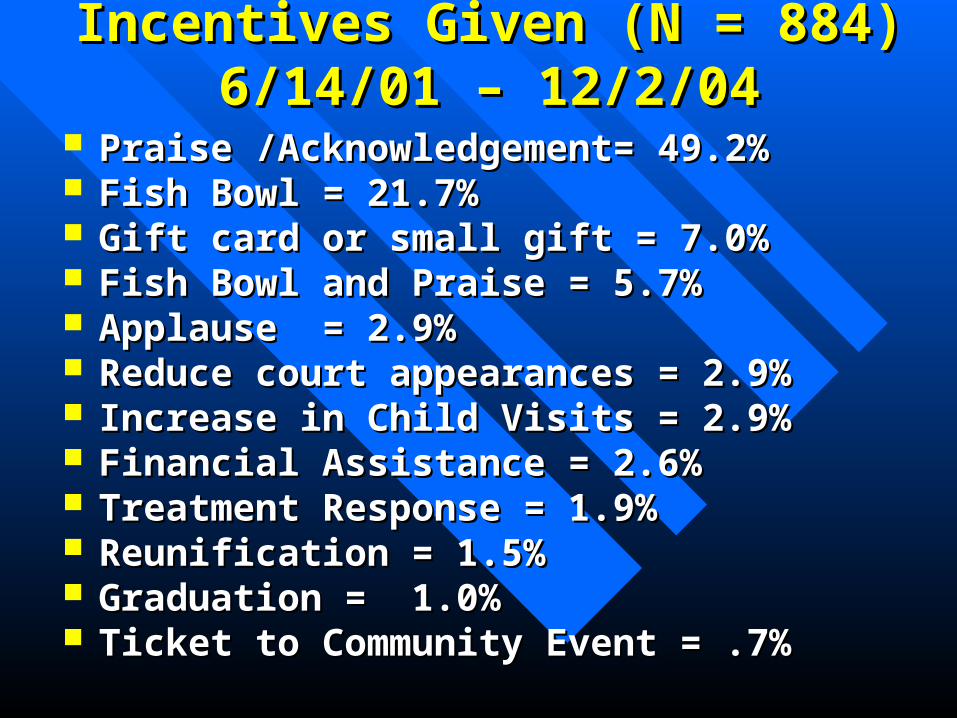
Incentives Given (N = 884) Incentives Given (N = 884) 6/14/01 – 12/2/04 6/14/01 – 12/2/04
Praise /Acknowledgement= 49.2%Praise /Acknowledgement= 49.2% Fish Bowl = 21.7%Fish Bowl = 21.7% Gift card or small gift = 7.0%Gift card or small gift = 7.0% Fish Bowl and Praise = 5.7%Fish Bowl and Praise = 5.7% Applause = 2.9%Applause = 2.9% Reduce court appearances = 2.9%Reduce court appearances = 2.9% Increase in Child Visits = 2.9%Increase in Child Visits = 2.9% Financial Assistance = 2.6%Financial Assistance = 2.6% Treatment Response = 1.9% Treatment Response = 1.9% Reunification = 1.5% Reunification = 1.5% Graduation = 1.0% Graduation = 1.0% Ticket to Community Event = .7%Ticket to Community Event = .7%

Incentive & Sanction Comparison Incentive & Sanction Comparison 6/14/01 – 12/2/046/14/01 – 12/2/04
Incentives per participantIncentives per participant– Average = 26.9Average = 26.9– Minimum = 1Minimum = 1– Maximum = 72Maximum = 72– Mode = 19Mode = 19
Sanctions per participantSanctions per participant– Average = 7Average = 7– Minimum = 1Minimum = 1– Maximum = 17Maximum = 17– Mode = 3Mode = 3
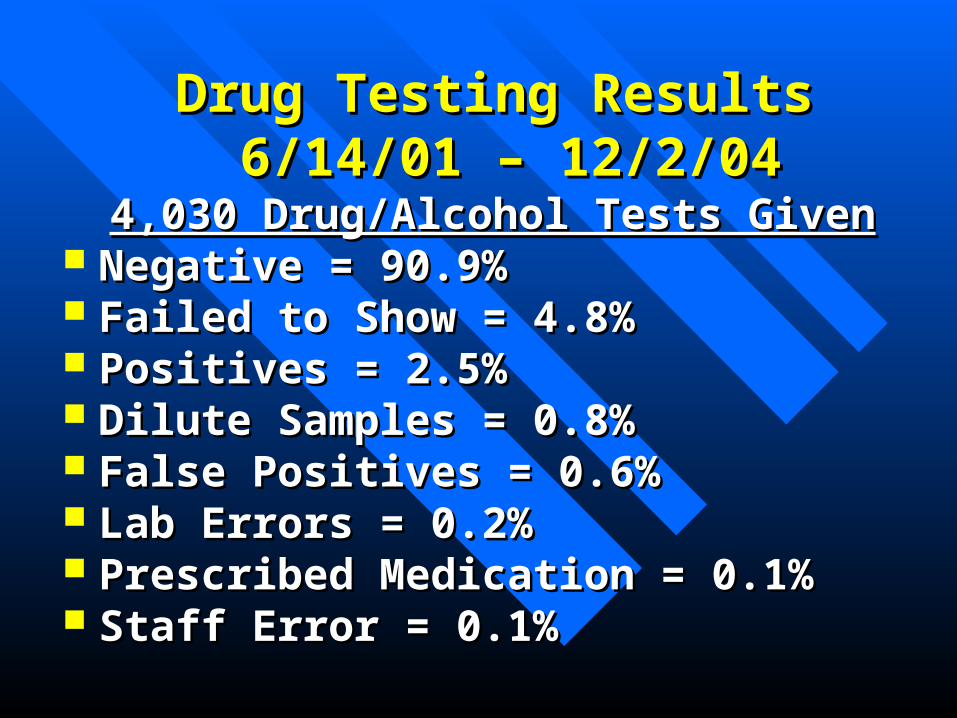
Drug Testing Results Drug Testing Results 6/14/01 – 12/2/046/14/01 – 12/2/04
4,030 Drug/Alcohol Tests Given4,030 Drug/Alcohol Tests Given Negative = 90.9% Negative = 90.9% Failed to Show = 4.8%Failed to Show = 4.8% Positives = 2.5%Positives = 2.5% Dilute Samples = 0.8%Dilute Samples = 0.8% False Positives = 0.6%False Positives = 0.6% Lab Errors = 0.2%Lab Errors = 0.2% Prescribed Medication = 0.1%Prescribed Medication = 0.1% Staff Error = 0.1%Staff Error = 0.1%
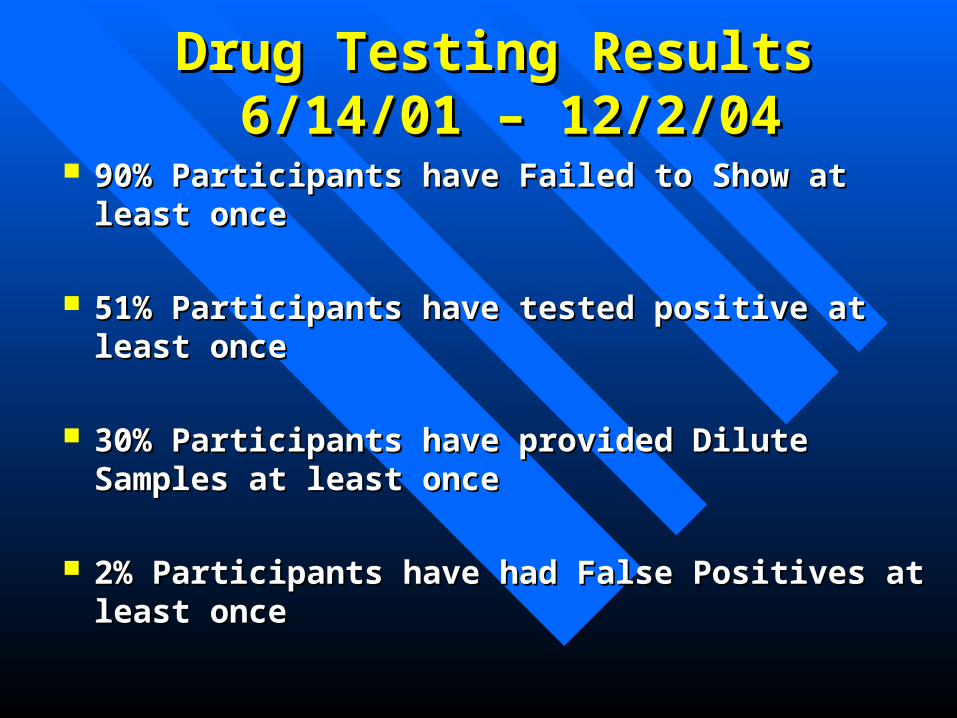
Drug Testing Results Drug Testing Results 6/14/01 – 12/2/046/14/01 – 12/2/04
90% Participants have Failed to Show at least once90% Participants have Failed to Show at least once
51% Participants have tested positive at least once51% Participants have tested positive at least once
30% Participants have provided Dilute Samples at 30% Participants have provided Dilute Samples at least onceleast once
2% Participants have had False Positives at least 2% Participants have had False Positives at least onceonce
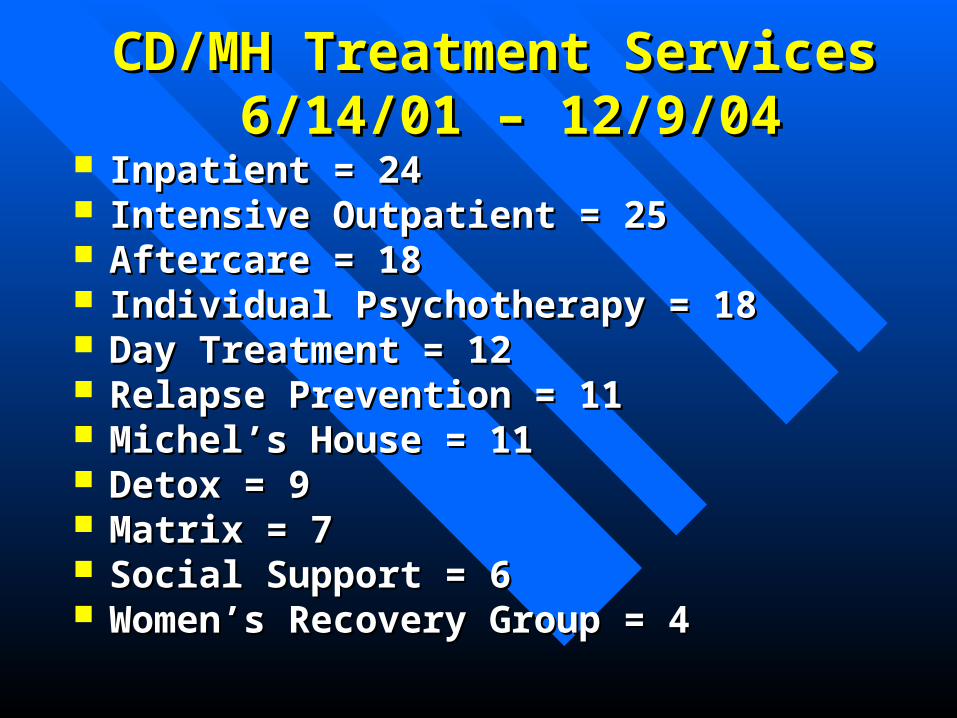
CD/MH Treatment Services CD/MH Treatment Services 6/14/01 – 12/9/046/14/01 – 12/9/04
Inpatient = 24Inpatient = 24 Intensive Outpatient = 25Intensive Outpatient = 25 Aftercare = 18Aftercare = 18 Individual Psychotherapy = 18 Individual Psychotherapy = 18 Day Treatment = 12 Day Treatment = 12 Relapse Prevention = 11 Relapse Prevention = 11 Michel’s House = 11Michel’s House = 11 Detox = 9 Detox = 9 Matrix = 7Matrix = 7 Social Support = 6Social Support = 6 Women’s Recovery Group = 4Women’s Recovery Group = 4
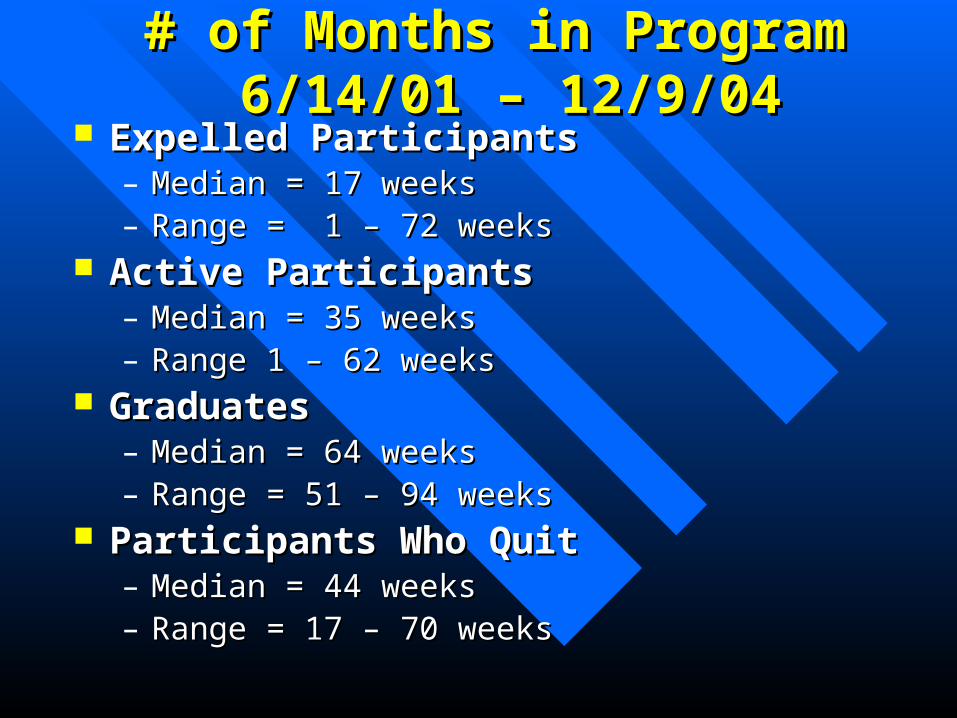
# of Months in Program # of Months in Program 6/14/01 – 12/9/046/14/01 – 12/9/04
Expelled ParticipantsExpelled Participants– Median = 17 weeksMedian = 17 weeks– Range = 1 – 72 weeksRange = 1 – 72 weeks
Active ParticipantsActive Participants– Median = 35 weeksMedian = 35 weeks– Range 1 – 62 weeksRange 1 – 62 weeks
GraduatesGraduates– Median = 64 weeksMedian = 64 weeks– Range = 51 – 94 weeksRange = 51 – 94 weeks
Participants Who QuitParticipants Who Quit– Median = 44 weeksMedian = 44 weeks– Range = 17 – 70 weeksRange = 17 – 70 weeks
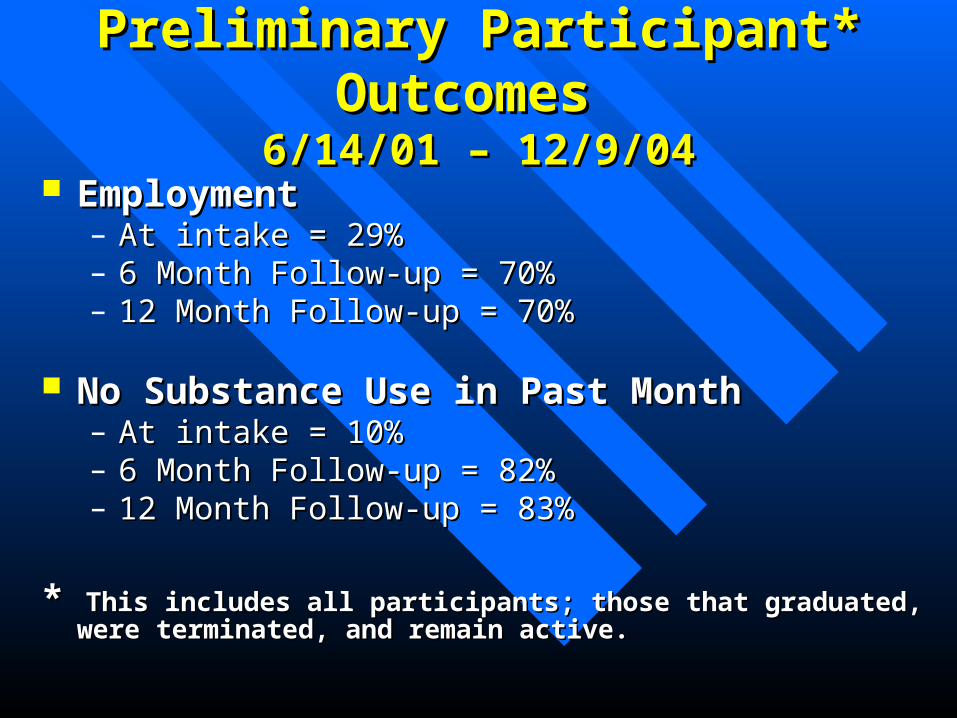
Preliminary Participant* Outcomes Preliminary Participant* Outcomes 6/14/01 – 12/9/046/14/01 – 12/9/04
EmploymentEmployment– At intake = 29%At intake = 29%– 6 Month Follow-up = 70%6 Month Follow-up = 70%– 12 Month Follow-up = 70%12 Month Follow-up = 70%
No Substance Use in Past MonthNo Substance Use in Past Month– At intake = 10%At intake = 10%– 6 Month Follow-up = 82%6 Month Follow-up = 82%– 12 Month Follow-up = 83%12 Month Follow-up = 83%
* * This includes all participants; those that graduated, were terminated, and This includes all participants; those that graduated, were terminated, and remain active.remain active.
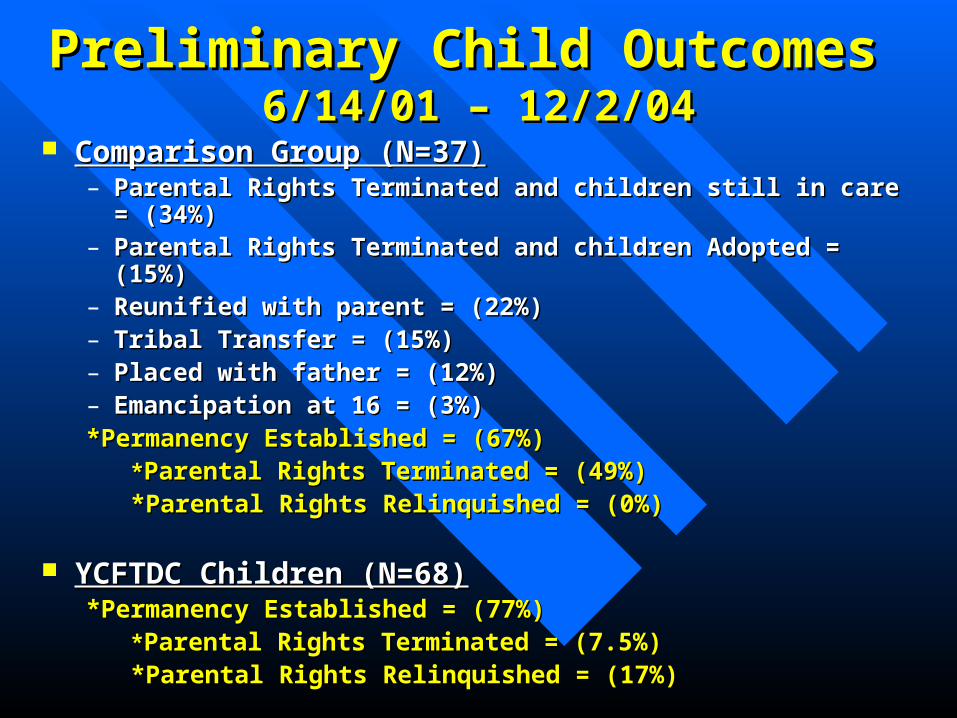
Preliminary Child Outcomes Preliminary Child Outcomes 6/14/01 – 12/2/046/14/01 – 12/2/04
Comparison Group (N=37)Comparison Group (N=37)– Parental Rights Terminated and children still in care = (34%)Parental Rights Terminated and children still in care = (34%)– Parental Rights Terminated and children Adopted = (15%)Parental Rights Terminated and children Adopted = (15%)– Reunified with parent = (22%)Reunified with parent = (22%)– Tribal Transfer = (15%)Tribal Transfer = (15%)– Placed with father = (12%)Placed with father = (12%)– Emancipation at 16 = (3%)Emancipation at 16 = (3%)*Permanency Established = (67%)*Permanency Established = (67%)
**Parental Rights Terminated = (49%)Parental Rights Terminated = (49%)*Parental Rights Relinquished = (0%)*Parental Rights Relinquished = (0%)
YCFTDC Children (N=68)YCFTDC Children (N=68)*Permanency Established = (77%)*Permanency Established = (77%)
**Parental Rights Terminated = (7.5%)Parental Rights Terminated = (7.5%)*Parental Rights Relinquished = (17%)*Parental Rights Relinquished = (17%)
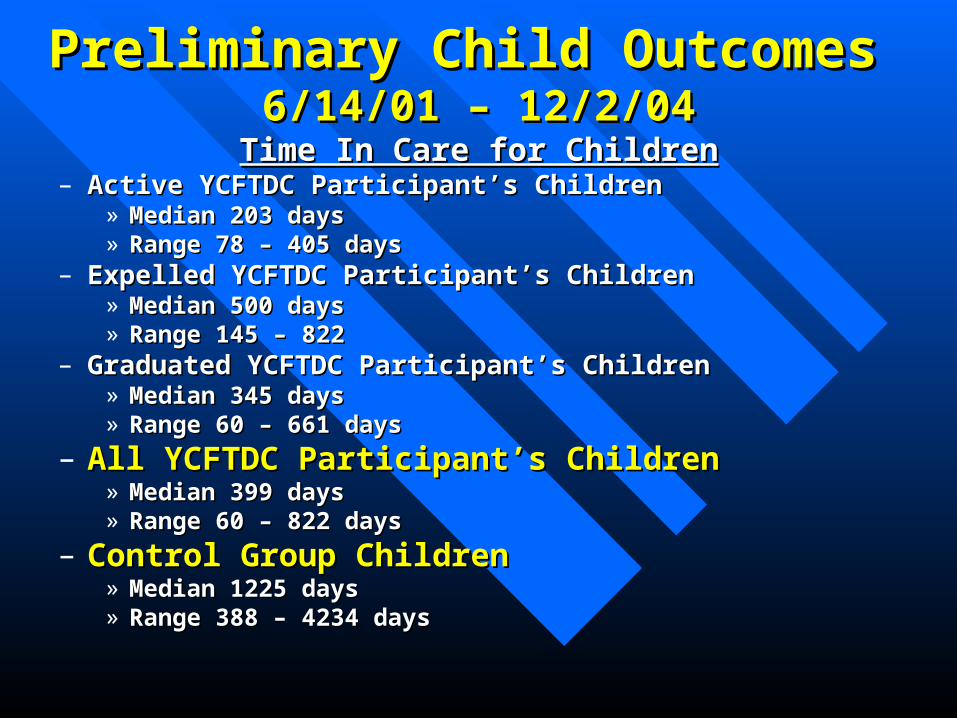
Preliminary Child Outcomes Preliminary Child Outcomes 6/14/01 – 12/2/046/14/01 – 12/2/04
Time In Care for ChildrenTime In Care for Children– Active YCFTDC Participant’s ChildrenActive YCFTDC Participant’s Children
» Median 203 daysMedian 203 days» Range 78 – 405 daysRange 78 – 405 days
– Expelled YCFTDC Participant’s ChildrenExpelled YCFTDC Participant’s Children» Median 500 daysMedian 500 days» Range 145 – 822Range 145 – 822
– Graduated YCFTDC Participant’s ChildrenGraduated YCFTDC Participant’s Children» Median 345 daysMedian 345 days» Range 60 – 661 daysRange 60 – 661 days
– All YCFTDC Participant’s ChildrenAll YCFTDC Participant’s Children» Median 399 daysMedian 399 days» Range 60 – 822 daysRange 60 – 822 days
– Control Group ChildrenControl Group Children» Median 1225 daysMedian 1225 days» Range 388 – 4234 daysRange 388 – 4234 days
Treatment NeedsTreatment Needs
Data suggests that anything Data suggests that anything less than 15 less than 15
monthsmonths of formalized treatment decreases of formalized treatment decreases
the success rate by approximately 63%.the success rate by approximately 63%.

Comments by Participants About Comments by Participants About YCFTDCYCFTDC
How is your life different because of YCFTDC?How is your life different because of YCFTDC?– ““It has made me realize how much I love my children.”It has made me realize how much I love my children.”
– ““I’m really busy – but that is good.”I’m really busy – but that is good.”
– ““It has never been so good!”It has never been so good!”
– ““I have learned a lot about my behaviors that I I have learned a lot about my behaviors that I wouldn’t have.”wouldn’t have.”
– ““I can’t jump through the hoops.”I can’t jump through the hoops.”
– ““My kids have a mom now.”My kids have a mom now.”
– ““I never knew I could be so happy.”I never knew I could be so happy.”
– ““I just love spending time with my kids.”I just love spending time with my kids.”
– ““I feel like I can deal with things.”I feel like I can deal with things.”
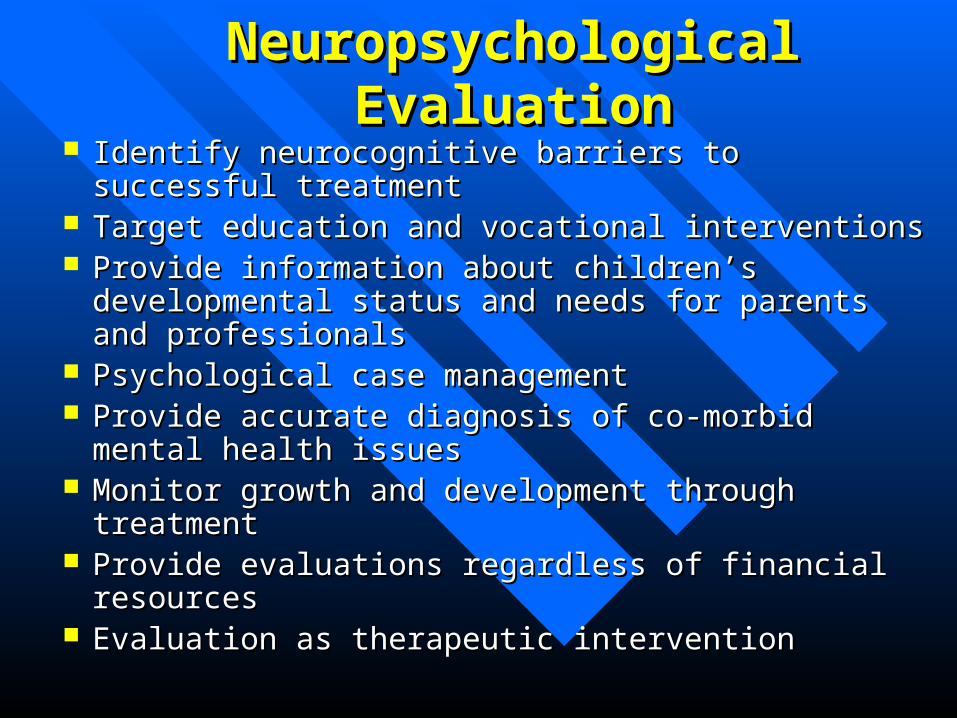
Neuropsychological EvaluationNeuropsychological Evaluation Identify neurocognitive barriers to successful treatmentIdentify neurocognitive barriers to successful treatment Target education and vocational interventionsTarget education and vocational interventions Provide information about children’s developmental Provide information about children’s developmental
status and needs for parents and professionalsstatus and needs for parents and professionals Psychological case managementPsychological case management Provide accurate diagnosis of co-morbid mental health Provide accurate diagnosis of co-morbid mental health
issuesissues Monitor growth and development through treatmentMonitor growth and development through treatment Provide evaluations regardless of financial resourcesProvide evaluations regardless of financial resources Evaluation as therapeutic interventionEvaluation as therapeutic intervention
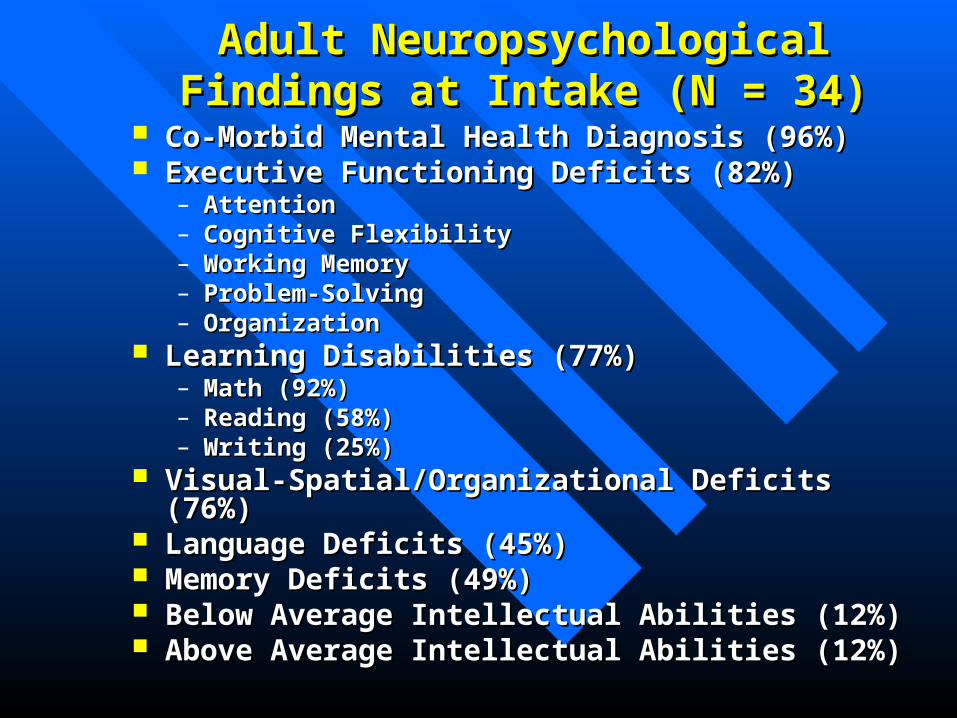
Adult Neuropsychological Findings at Adult Neuropsychological Findings at Intake (N = 34)Intake (N = 34)
Co-Morbid Mental Health Diagnosis (96%)Co-Morbid Mental Health Diagnosis (96%) Executive Functioning Deficits (82%) Executive Functioning Deficits (82%)
– AttentionAttention– Cognitive FlexibilityCognitive Flexibility– Working MemoryWorking Memory– Problem-SolvingProblem-Solving– OrganizationOrganization
Learning Disabilities (77%)Learning Disabilities (77%)– Math (92%)Math (92%)– Reading (58%)Reading (58%)– Writing (25%)Writing (25%)
Visual-Spatial/Organizational Deficits (76%)Visual-Spatial/Organizational Deficits (76%) Language Deficits (45%)Language Deficits (45%) Memory Deficits (49%) Memory Deficits (49%) Below Average Intellectual Abilities (12%)Below Average Intellectual Abilities (12%) Above Average Intellectual Abilities (12%)Above Average Intellectual Abilities (12%)
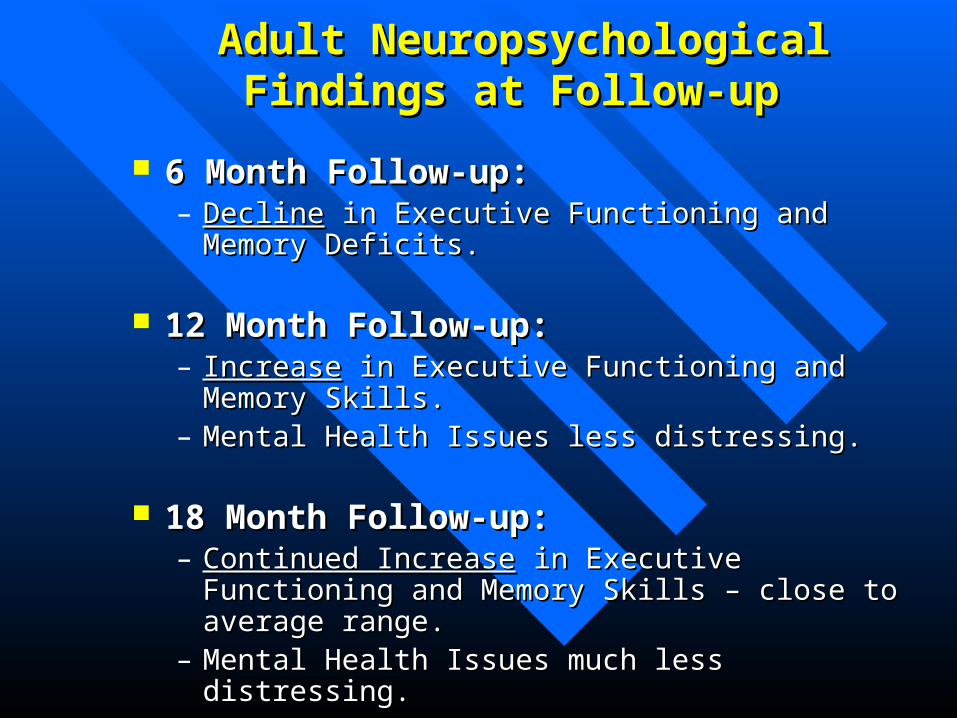
Adult Neuropsychological Findings at Adult Neuropsychological Findings at Follow-up Follow-up
6 Month Follow-up:6 Month Follow-up:– DeclineDecline in Executive Functioning and Memory in Executive Functioning and Memory
Deficits.Deficits.
12 Month Follow-up: 12 Month Follow-up: – IncreaseIncrease in Executive Functioning and Memory Skills. in Executive Functioning and Memory Skills.– Mental Health Issues less distressing.Mental Health Issues less distressing.
18 Month Follow-up: 18 Month Follow-up: – Continued IncreaseContinued Increase in Executive Functioning and in Executive Functioning and
Memory Skills – close to average range.Memory Skills – close to average range.– Mental Health Issues much less distressing.Mental Health Issues much less distressing.
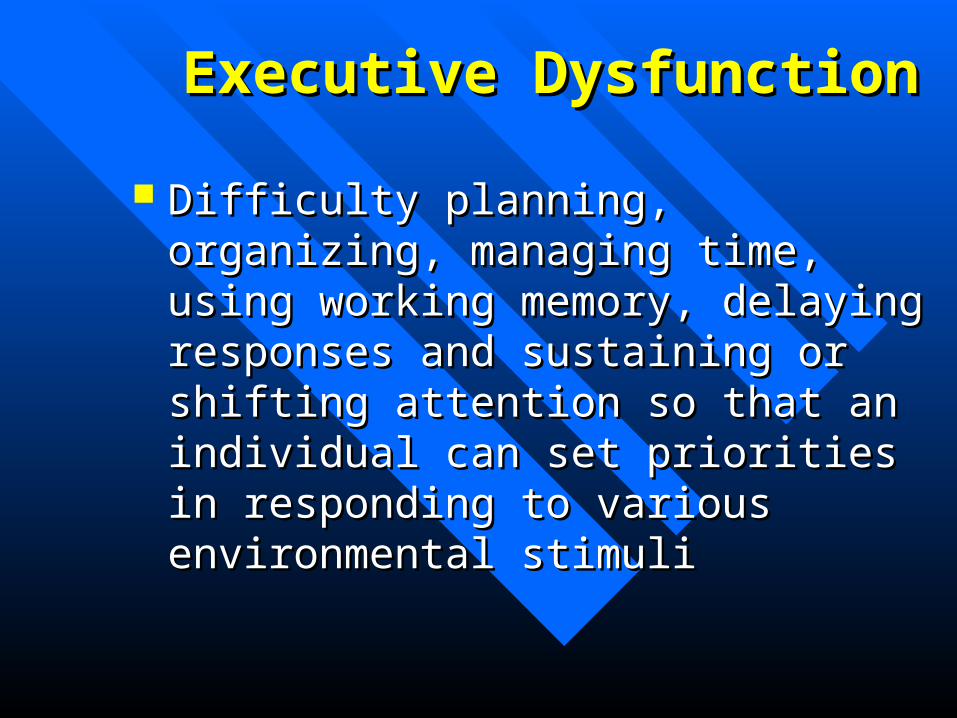
Executive DysfunctionExecutive Dysfunction
Difficulty planning, organizing, managing Difficulty planning, organizing, managing time, using working memory, delaying time, using working memory, delaying responses and sustaining or shifting responses and sustaining or shifting attention so that an individual can set attention so that an individual can set priorities in responding to various priorities in responding to various environmental stimulienvironmental stimuli
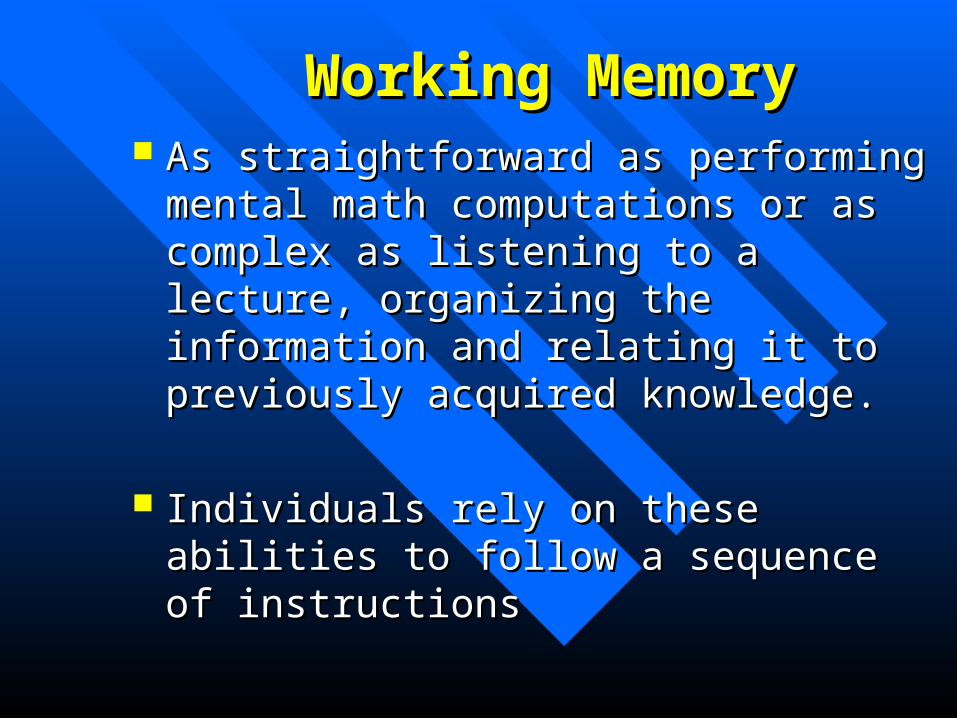
Working MemoryWorking Memory As straightforward as performing mental As straightforward as performing mental
math computations or as complex as math computations or as complex as listening to a lecture, organizing the listening to a lecture, organizing the information and relating it to previously information and relating it to previously acquired knowledge.acquired knowledge.
Individuals rely on these abilities to follow Individuals rely on these abilities to follow
a sequence of instructionsa sequence of instructions
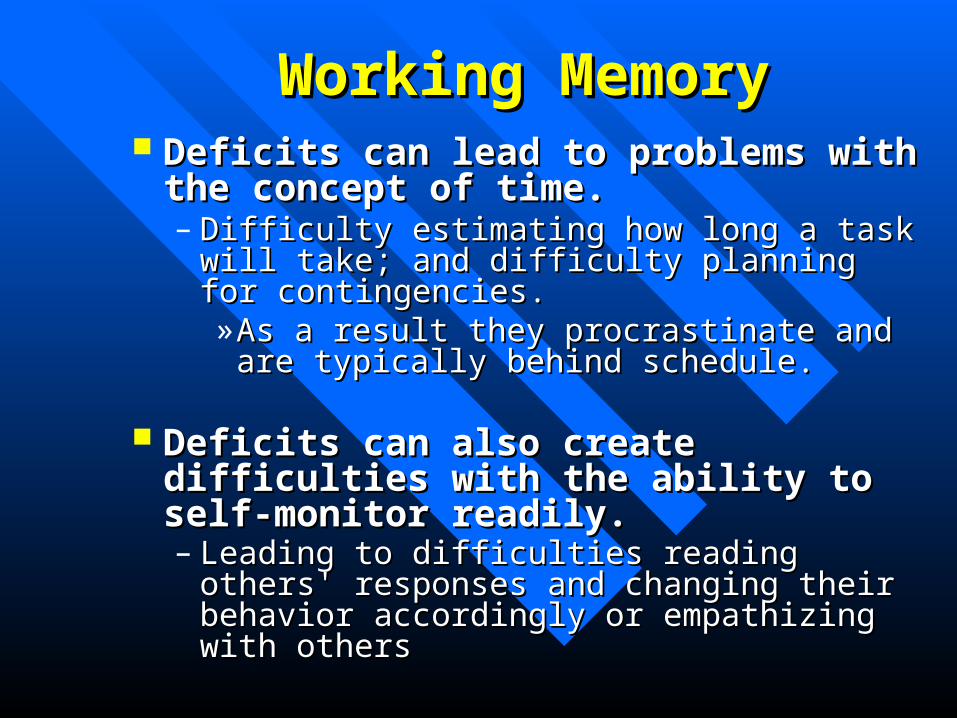
Working MemoryWorking Memory Deficits can lead to problems with the Deficits can lead to problems with the
concept of time. concept of time. – Difficulty estimating how long a task will take; Difficulty estimating how long a task will take;
and difficulty planning for contingencies. and difficulty planning for contingencies. » As a result they procrastinate and are As a result they procrastinate and are
typically behind schedule.typically behind schedule.
Deficits can also create difficulties with Deficits can also create difficulties with the ability to self-monitor readily.the ability to self-monitor readily.– Leading to difficulties reading others' responses Leading to difficulties reading others' responses
and changing their behavior accordingly or and changing their behavior accordingly or empathizing with othersempathizing with others
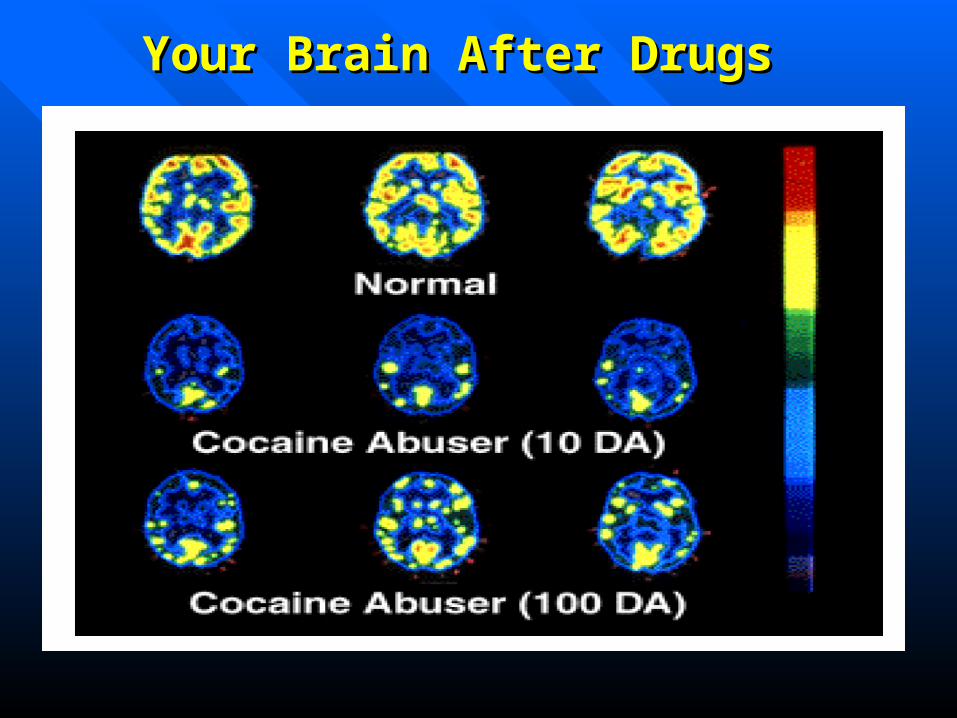
Your Brain After DrugsYour Brain After Drugs
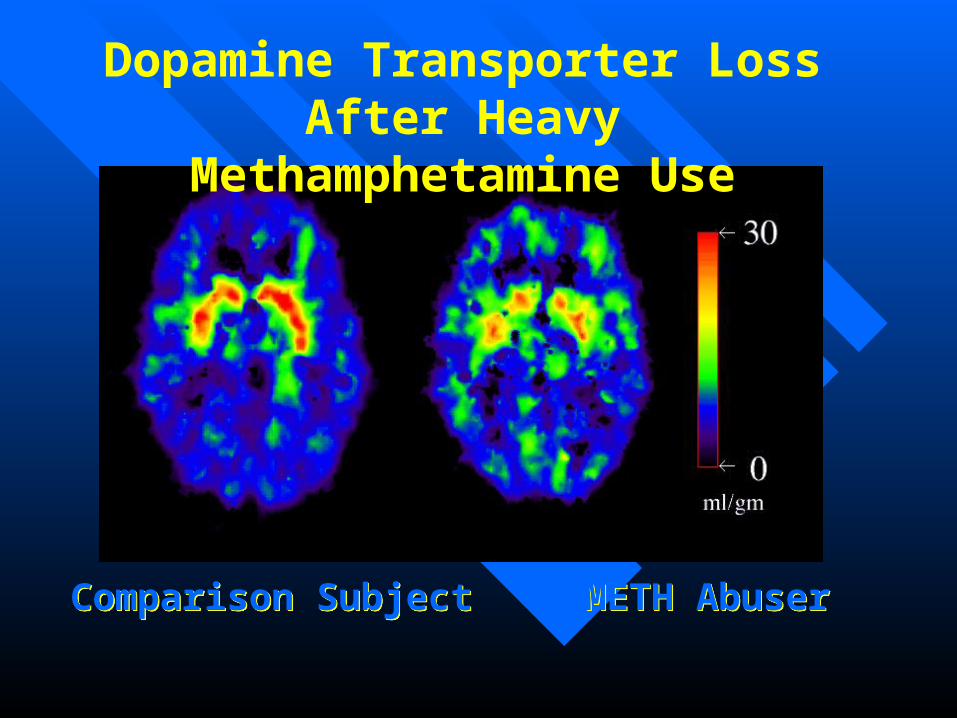
Comparison Subject METH AbuserComparison Subject METH Abuser
Dopamine Transporter Loss After Heavy Methamphetamine Use
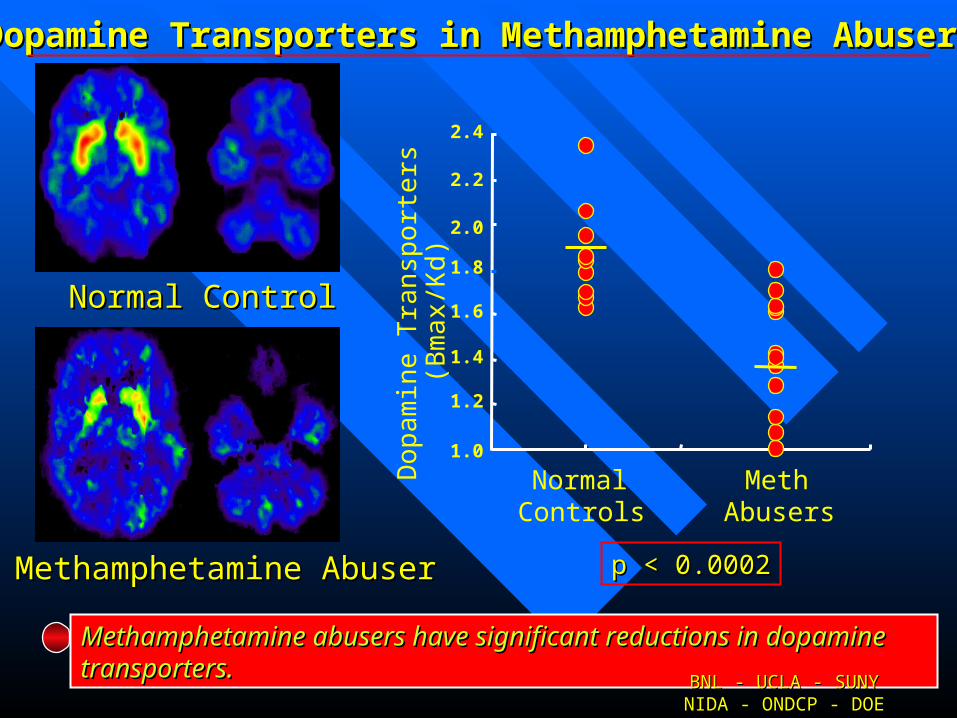
Dopamine Transporters in Methamphetamine AbusersDopamine Transporters in Methamphetamine Abusers
Methamphetamine abusers have significant reductions in dopamine Methamphetamine abusers have significant reductions in dopamine transporters.transporters.
Normal ControlNormal Control
Methamphetamine AbuserMethamphetamine Abuser p < 0.0002p < 0.0002
Do
pam
ine
Tra
nsp
ort
ers
(Bm
ax/
Kd
)
NormalControls
MethAbusers
1.0
1.2
1.4
1.6
1.8
2.0
2.2
2.4
BNL - UCLA - SUNYBNL - UCLA - SUNYNIDA - ONDCP - DOENIDA - ONDCP - DOE
Implication:
Compromised dopamine systems contribute to the consequences of drug addiction.
Implication:
Compromised dopamine systems contribute to the consequences of drug addiction.
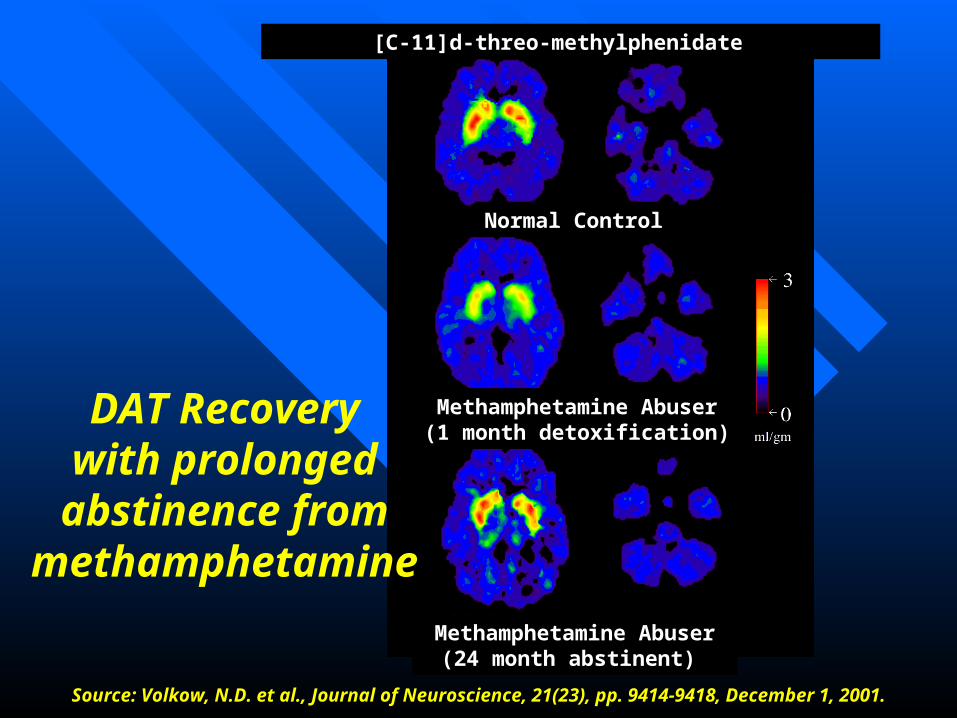
DAT Recoverywith prolongedabstinence from
methamphetamine
Normal Control
Methamphetamine Abuser(1 month detoxification)
Methamphetamine Abuser (24 month abstinent)
[C-11]d-threo-methylphenidate
Source: Volkow, N.D. et al., Journal of Neuroscience, 21(23), pp. 9414-9418, December 1, 2001.
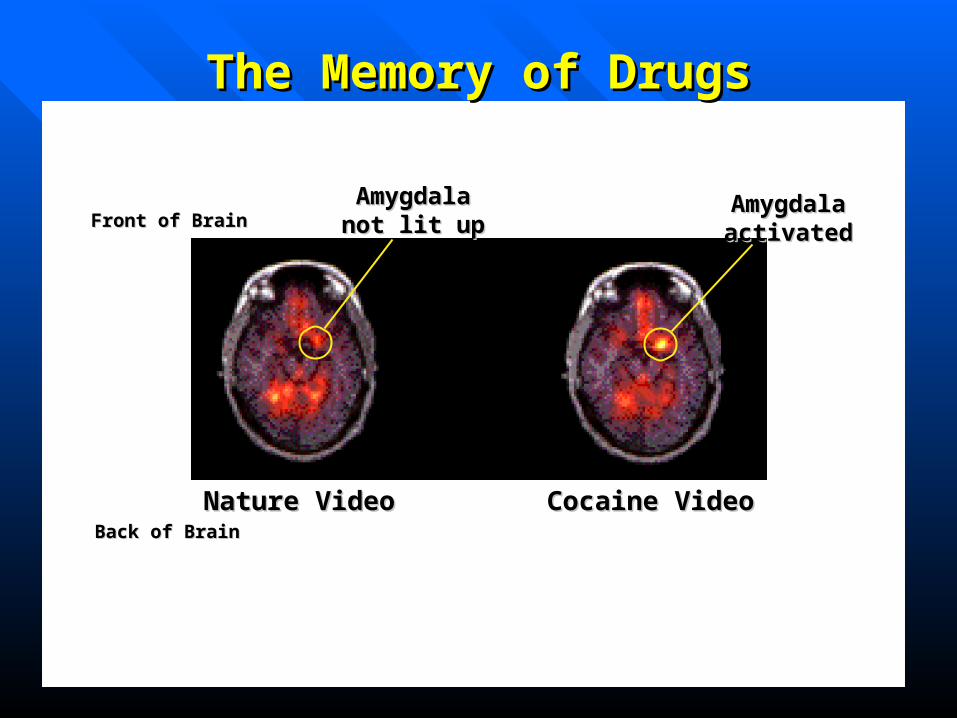
The Memory of DrugsThe Memory of Drugs
Nature VideoNature Video Cocaine VideoCocaine Video
Front of BrainFront of Brain
Back of BrainBack of Brain
AmygdalaAmygdalanot lit upnot lit up
AmygdalaAmygdalaactivatedactivated
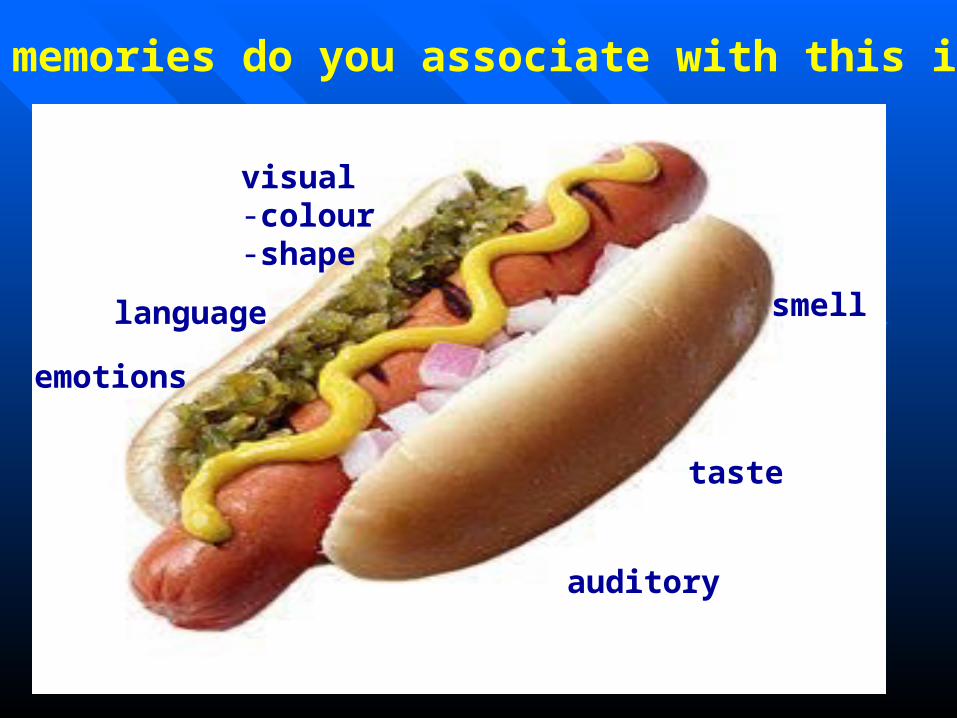
What memories do you associate with this image?
visual-colour -shape
smell
emotions
auditory
taste
language
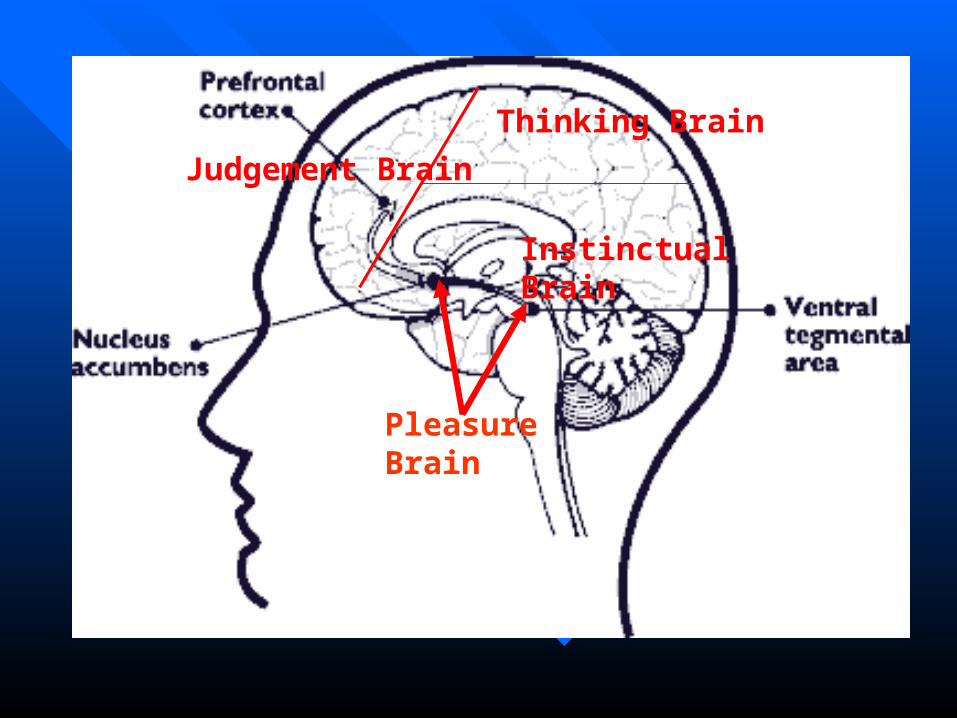
Thinking Brain
Judgement Brain
Instinctual Brain
Pleasure Brain
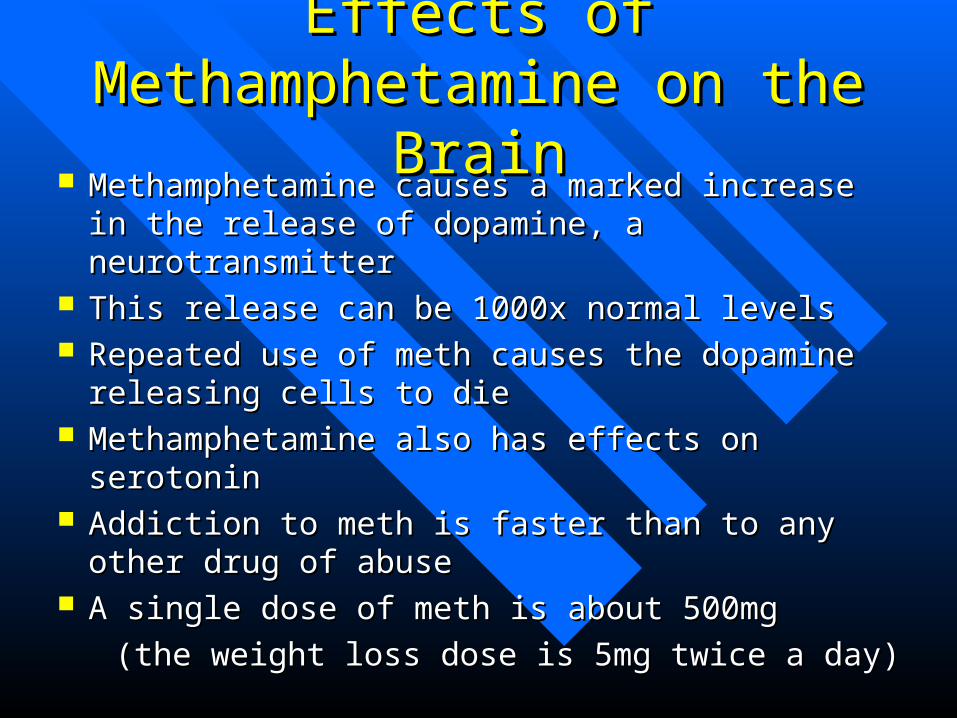
Effects of Methamphetamine on Effects of Methamphetamine on the Brainthe Brain
Methamphetamine causes a marked increase in the Methamphetamine causes a marked increase in the release of dopamine, a neurotransmitterrelease of dopamine, a neurotransmitter
This release can be 1000x normal levelsThis release can be 1000x normal levels Repeated use of meth causes the dopamine releasing Repeated use of meth causes the dopamine releasing
cells to diecells to die Methamphetamine also has effects on serotonin Methamphetamine also has effects on serotonin Addiction to meth is faster than to any other drug of Addiction to meth is faster than to any other drug of
abuseabuse A single dose of meth is about 500mg A single dose of meth is about 500mg
(the weight loss dose is 5mg twice a day)(the weight loss dose is 5mg twice a day)
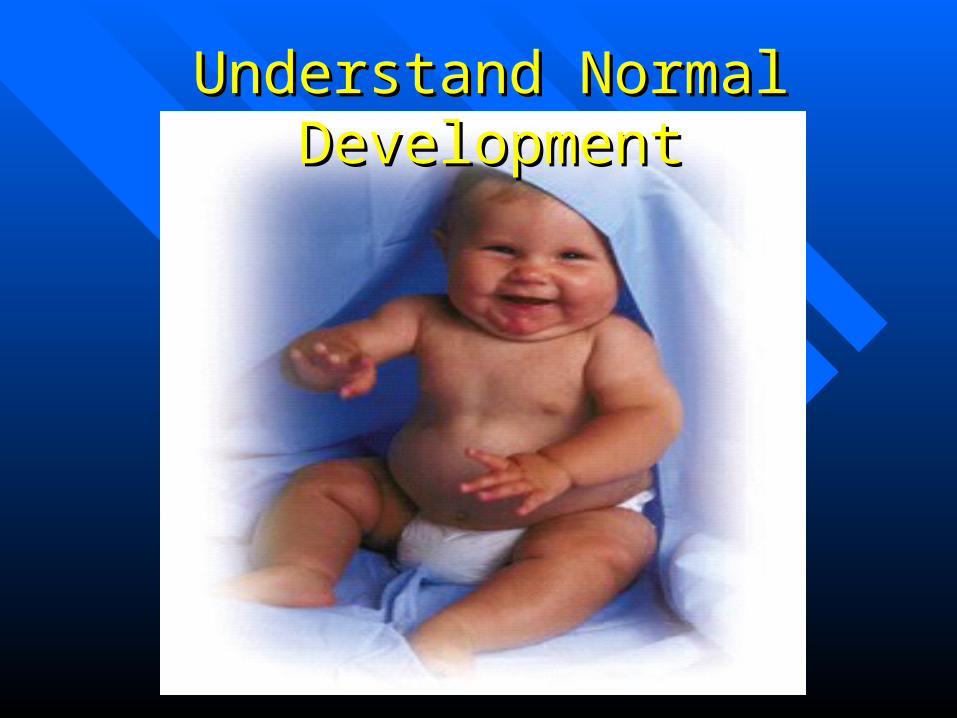
Understand Normal DevelopmentUnderstand Normal Development
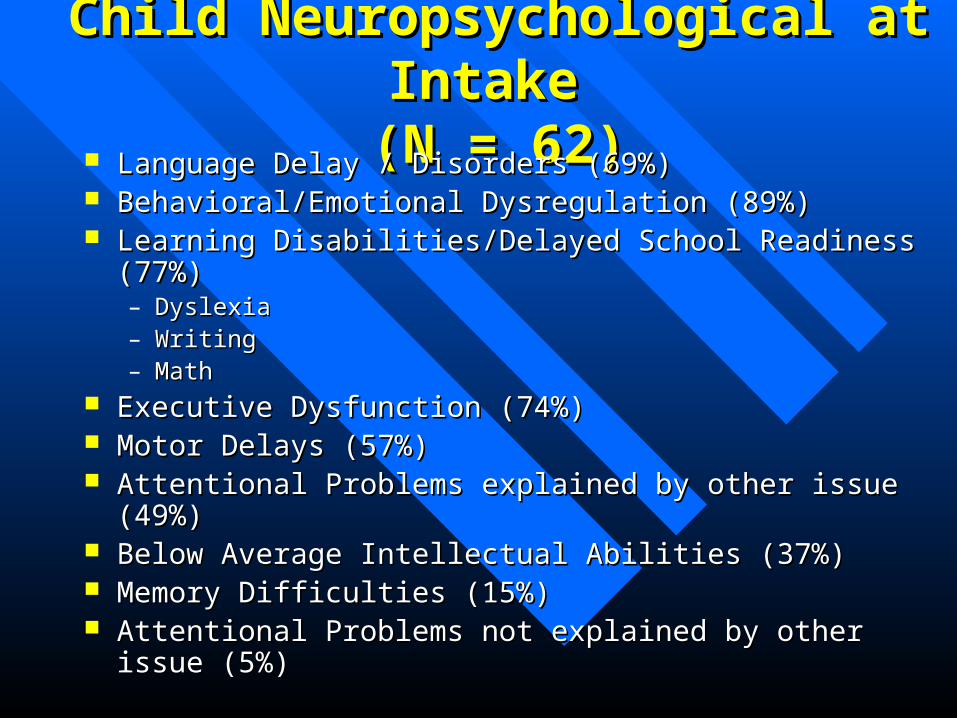
Child Neuropsychological at Intake Child Neuropsychological at Intake (N = 62)(N = 62)
Language Delay / Disorders (69%)Language Delay / Disorders (69%) Behavioral/Emotional Dysregulation (89%)Behavioral/Emotional Dysregulation (89%) Learning Disabilities/Delayed School Readiness (77%)Learning Disabilities/Delayed School Readiness (77%)
– DyslexiaDyslexia– WritingWriting– Math Math
Executive Dysfunction (74%)Executive Dysfunction (74%) Motor Delays (57%)Motor Delays (57%) Attentional Problems explained by other issue (49%)Attentional Problems explained by other issue (49%) Below Average Intellectual Abilities (37%)Below Average Intellectual Abilities (37%) Memory Difficulties (15%) Memory Difficulties (15%) Attentional Problems not explained by other issue (5%) Attentional Problems not explained by other issue (5%)
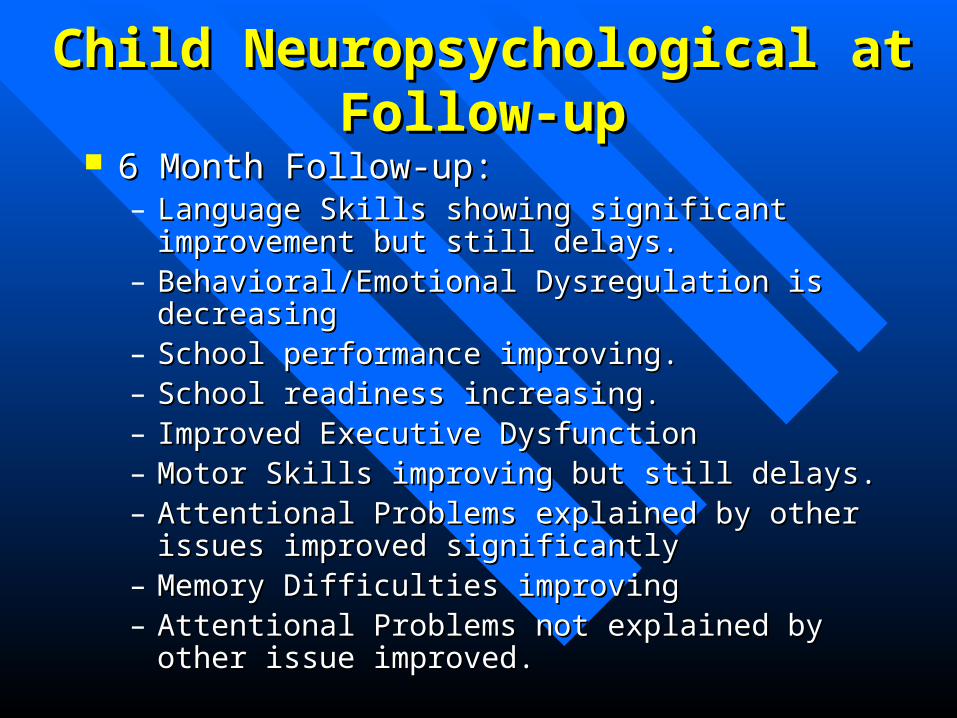
Child Neuropsychological at Follow-upChild Neuropsychological at Follow-up
6 Month Follow-up:6 Month Follow-up:– Language Skills showing significant improvement but still Language Skills showing significant improvement but still
delays.delays.– Behavioral/Emotional Dysregulation is decreasingBehavioral/Emotional Dysregulation is decreasing– School performance improving.School performance improving.– School readiness increasing.School readiness increasing.– Improved Executive Dysfunction Improved Executive Dysfunction – Motor Skills improving but still delays. Motor Skills improving but still delays. – Attentional Problems explained by other issues improved Attentional Problems explained by other issues improved
significantlysignificantly– Memory Difficulties improving Memory Difficulties improving – Attentional Problems not explained by other issue Attentional Problems not explained by other issue
improved. improved.
Child Neuropsychological at Follow-upChild Neuropsychological at Follow-up
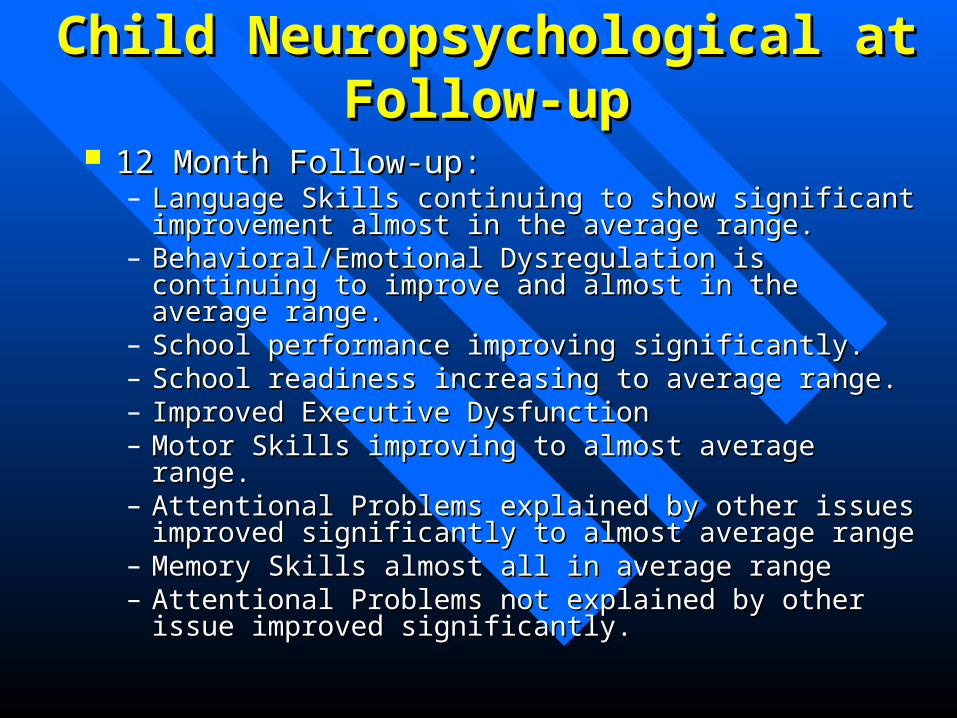
12 Month Follow-up:12 Month Follow-up:– Language Skills continuing to show significant Language Skills continuing to show significant
improvement almost in the average range.improvement almost in the average range.– Behavioral/Emotional Dysregulation is continuing to Behavioral/Emotional Dysregulation is continuing to
improve and almost in the average range. improve and almost in the average range. – School performance improving significantly.School performance improving significantly.– School readiness increasing to average range.School readiness increasing to average range.– Improved Executive Dysfunction Improved Executive Dysfunction – Motor Skills improving to almost average range. Motor Skills improving to almost average range. – Attentional Problems explained by other issues improved Attentional Problems explained by other issues improved
significantly to almost average rangesignificantly to almost average range– Memory Skills almost all in average range Memory Skills almost all in average range – Attentional Problems not explained by other issue Attentional Problems not explained by other issue
improved significantly. improved significantly.
Language DisordersLanguage Disorders How Do Children Learn to How Do Children Learn to
Communicate?Communicate?
– Need someone to interact with themNeed someone to interact with them
– Need to be actively engaged with people in Need to be actively engaged with people in order for the communication experience to be order for the communication experience to be meaningfulmeaningful
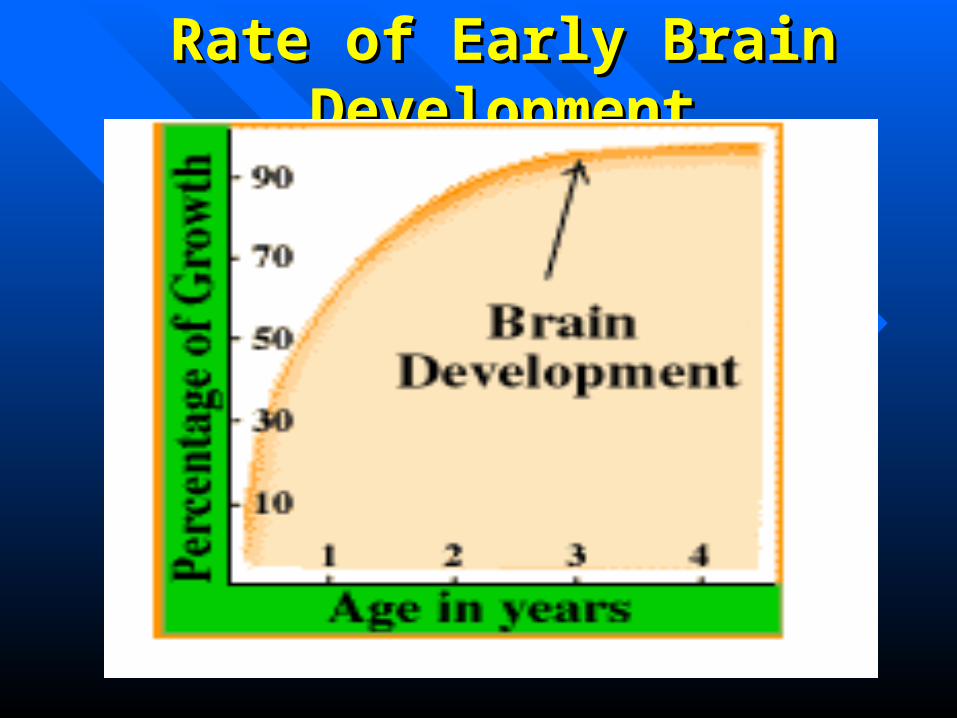
Rate of Early Brain DevelopmentRate of Early Brain Development
Early IdentificationEarly Identification
Children whose language delay is identified Children whose language delay is identified early have a significantly better chance of early have a significantly better chance of developing necessary pre-reading and developing necessary pre-reading and academic skills than children whose delay academic skills than children whose delay is not identified early.is not identified early.
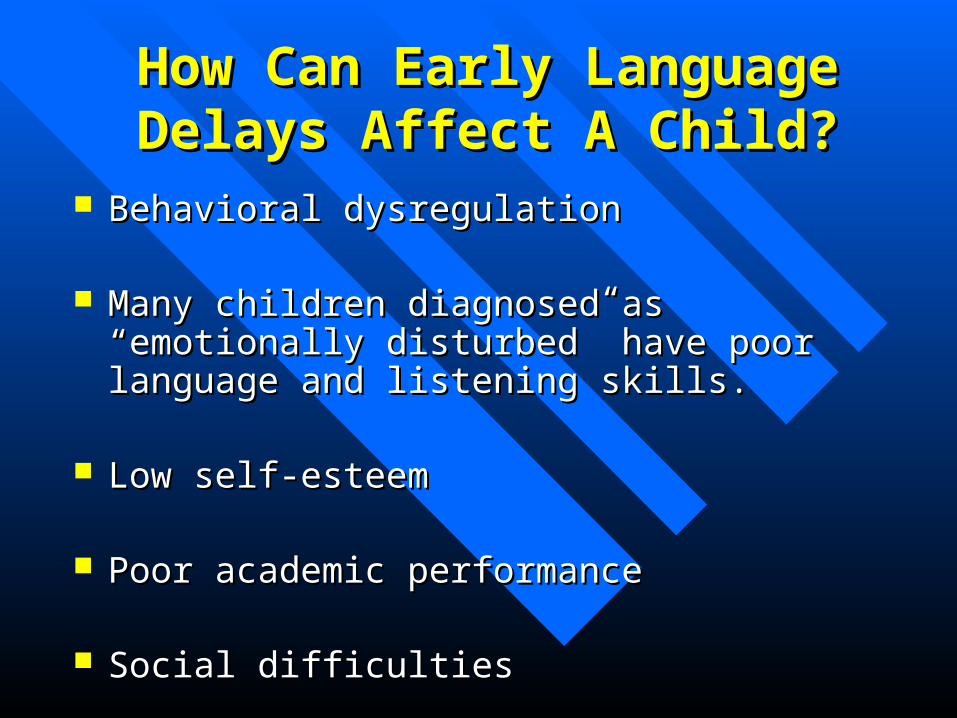
How Can Early Language Delays How Can Early Language Delays Affect A Child?Affect A Child?
Behavioral dysregulationBehavioral dysregulation
Many children diagnosed as “emotionally disturbed” Many children diagnosed as “emotionally disturbed” have poor language and listening skills.have poor language and listening skills.
Low self-esteemLow self-esteem
Poor academic performancePoor academic performance
Social difficultiesSocial difficulties
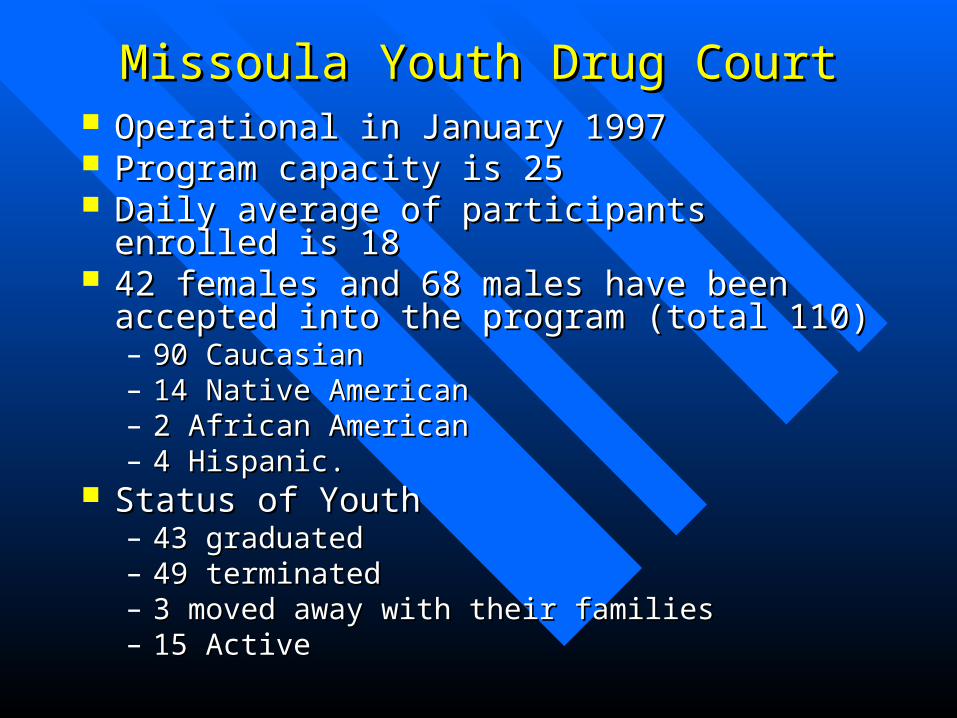
Missoula Youth Drug CourtMissoula Youth Drug Court Operational in January 1997Operational in January 1997 Program capacity is 25Program capacity is 25 Daily average of participants enrolled is 18Daily average of participants enrolled is 18 42 females and 68 males have been accepted into 42 females and 68 males have been accepted into
the program (total 110)the program (total 110)– 90 Caucasian90 Caucasian– 14 Native American14 Native American– 2 African American2 African American– 4 Hispanic. 4 Hispanic.
Status of YouthStatus of Youth– 43 graduated 43 graduated – 49 terminated49 terminated– 3 moved away with their families3 moved away with their families– 15 Active 15 Active
Outcomes from Missoula Youth Outcomes from Missoula Youth Drug Court Drug Court
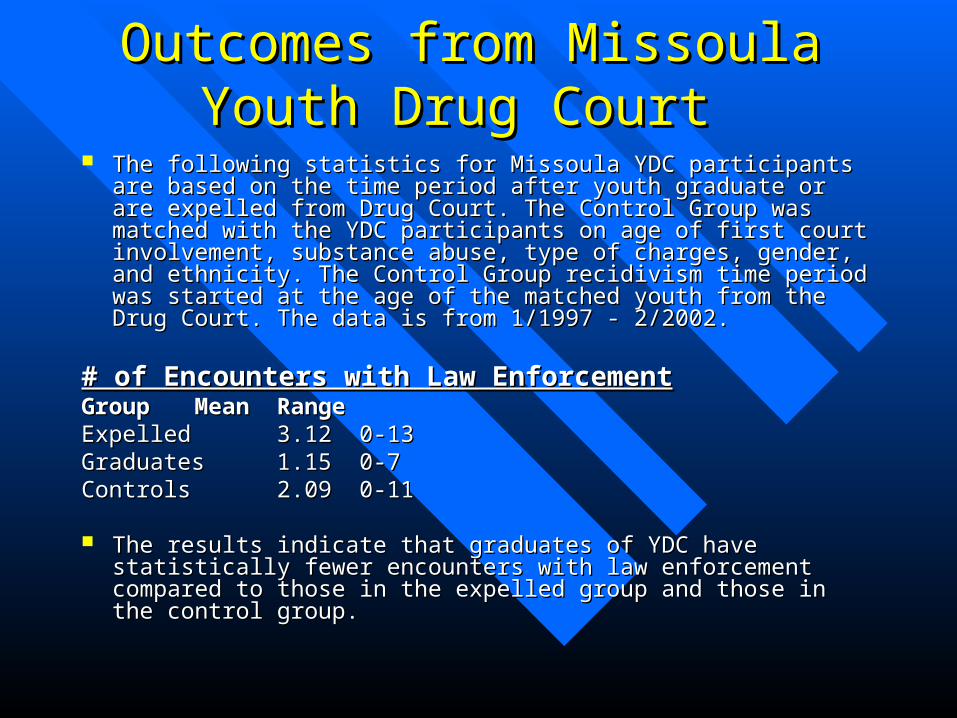
The following statistics for Missoula YDC participants are based on The following statistics for Missoula YDC participants are based on the time period after youth graduate or are expelled from Drug Court. the time period after youth graduate or are expelled from Drug Court. The Control Group was matched with the YDC participants on age of The Control Group was matched with the YDC participants on age of first court involvement, substance abuse, type of charges, gender, and first court involvement, substance abuse, type of charges, gender, and ethnicity. The Control Group recidivism time period was started at the ethnicity. The Control Group recidivism time period was started at the age of the matched youth from the Drug Court. The data is from age of the matched youth from the Drug Court. The data is from 1/1997 - 2/2002.1/1997 - 2/2002.
# of Encounters with Law Enforcement# of Encounters with Law EnforcementGroup Group Mean Mean RangeRangeExpelled Expelled 3.12 3.12 0-130-13Graduates Graduates 1.15 1.15 0-70-7Controls Controls 2.09 2.09 0-110-11
The results indicate that graduates of YDC have statistically fewer The results indicate that graduates of YDC have statistically fewer encounters with law enforcement compared to those in the expelled encounters with law enforcement compared to those in the expelled group and those in the control group. group and those in the control group.
Outcomes from Missoula Youth Outcomes from Missoula Youth Drug Court Drug Court
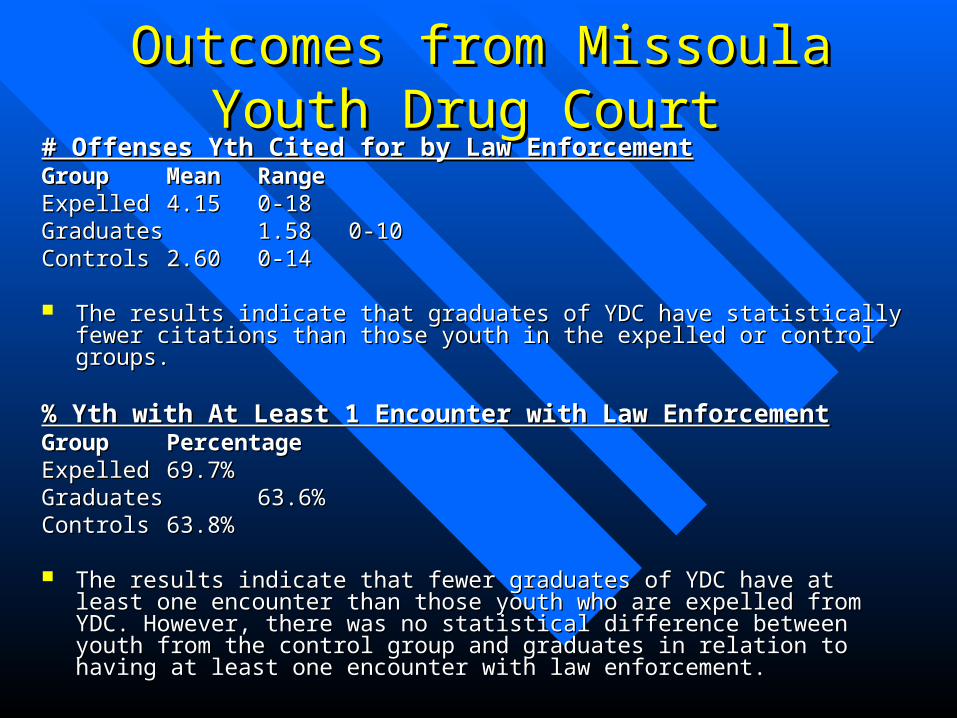
# Offenses Yth Cited for by Law Enforcement# Offenses Yth Cited for by Law EnforcementGroup Group Mean Mean RangeRangeExpelled Expelled 4.15 4.15 0-180-18Graduates Graduates 1.58 1.58 0-100-10Controls Controls 2.60 2.60 0-140-14
The results indicate that graduates of YDC have statistically fewer citations than those The results indicate that graduates of YDC have statistically fewer citations than those youth in the expelled or control groups.youth in the expelled or control groups.
% Yth with At Least 1 Encounter with Law Enforcement% Yth with At Least 1 Encounter with Law EnforcementGroup Group PercentagePercentageExpelled Expelled 69.7%69.7%Graduates Graduates 63.6%63.6%Controls Controls 63.8%63.8%
The results indicate that fewer graduates of YDC have at least one encounter than The results indicate that fewer graduates of YDC have at least one encounter than those youth who are expelled from YDC. However, there was no statistical difference those youth who are expelled from YDC. However, there was no statistical difference between youth from the control group and graduates in relation to having at least one between youth from the control group and graduates in relation to having at least one encounter with law enforcement.encounter with law enforcement.
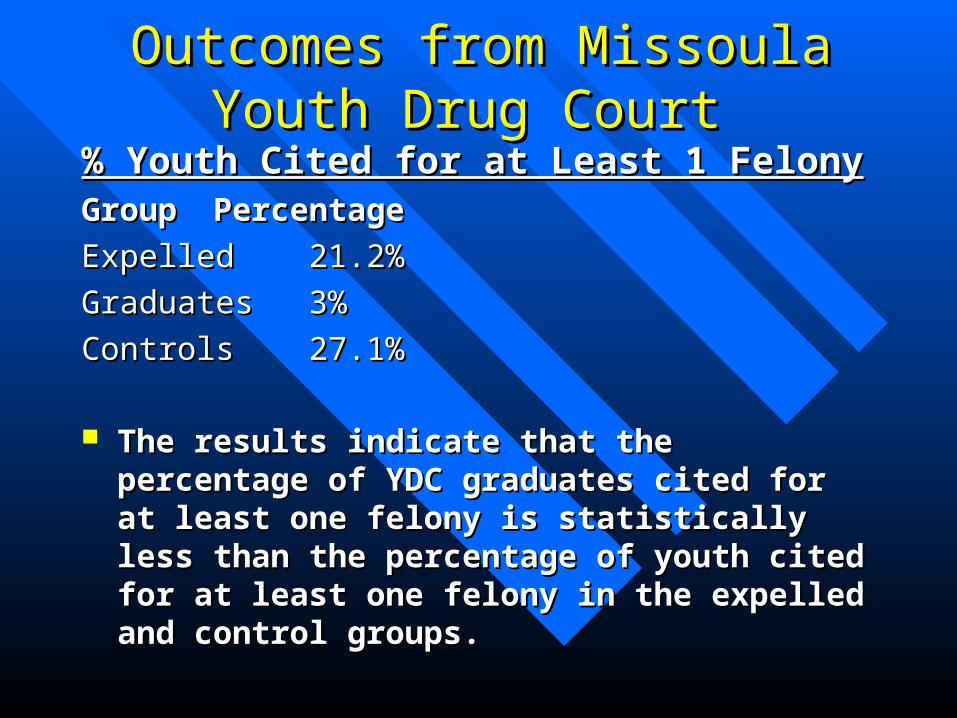
Outcomes from Missoula Youth Outcomes from Missoula Youth Drug Court Drug Court
% Youth Cited for at Least 1 Felony% Youth Cited for at Least 1 FelonyGroup Group PercentagePercentage
Expelled Expelled 21.2%21.2%
Graduates Graduates 3%3%
Controls Controls 27.1%27.1%
The results indicate that the percentage of YDC The results indicate that the percentage of YDC graduates cited for at least one felony is statistically less graduates cited for at least one felony is statistically less than the percentage of youth cited for at least one than the percentage of youth cited for at least one felony in the expelled and control groups.felony in the expelled and control groups.
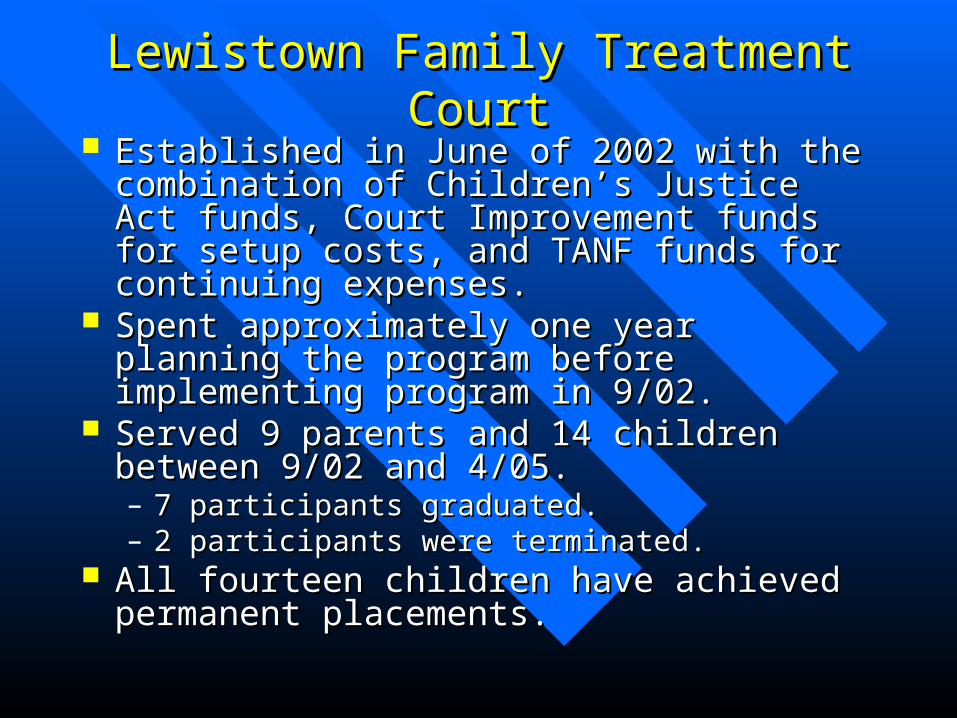
Lewistown Family Treatment CourtLewistown Family Treatment Court Established in June of 2002 with the combination Established in June of 2002 with the combination
of Children’s Justice Act funds, Court of Children’s Justice Act funds, Court Improvement funds for setup costs, and TANF Improvement funds for setup costs, and TANF funds for continuing expenses. funds for continuing expenses.
Spent approximately one year planning the Spent approximately one year planning the program before implementing program in 9/02. program before implementing program in 9/02.
Served 9 parents and 14 children between 9/02 Served 9 parents and 14 children between 9/02 and 4/05. and 4/05. – 7 participants graduated. 7 participants graduated. – 2 participants were terminated.2 participants were terminated.
All fourteen children have achieved permanent All fourteen children have achieved permanent placements. placements.
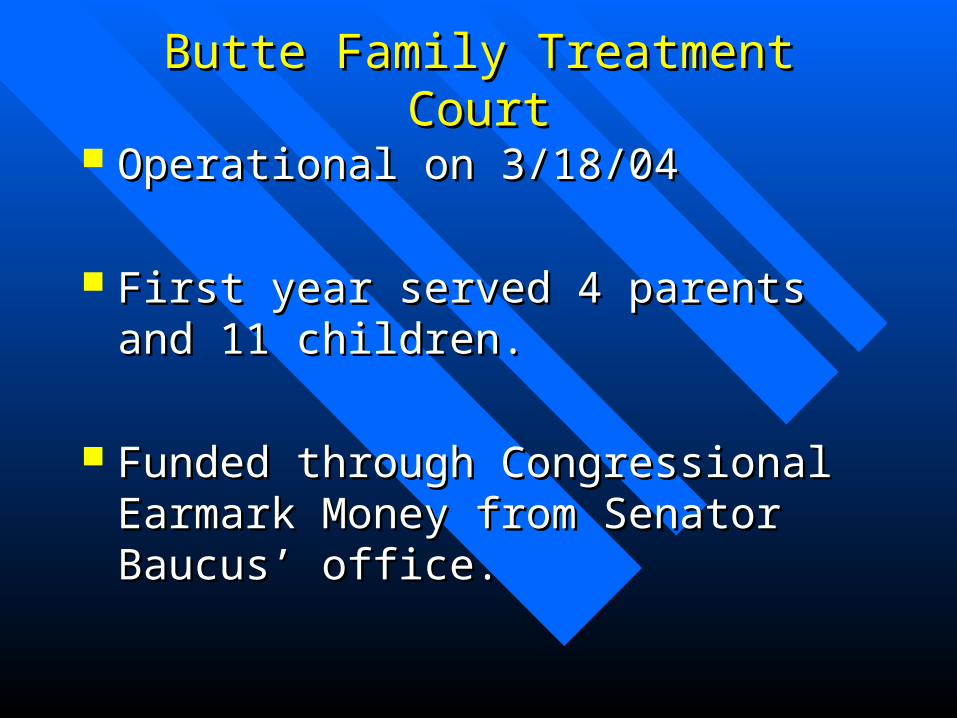
Butte Family Treatment CourtButte Family Treatment Court
Operational on 3/18/04Operational on 3/18/04
First year served 4 parents and 11 children. First year served 4 parents and 11 children.
Funded through Congressional Earmark Funded through Congressional Earmark Money from Senator Baucus’ office.Money from Senator Baucus’ office.
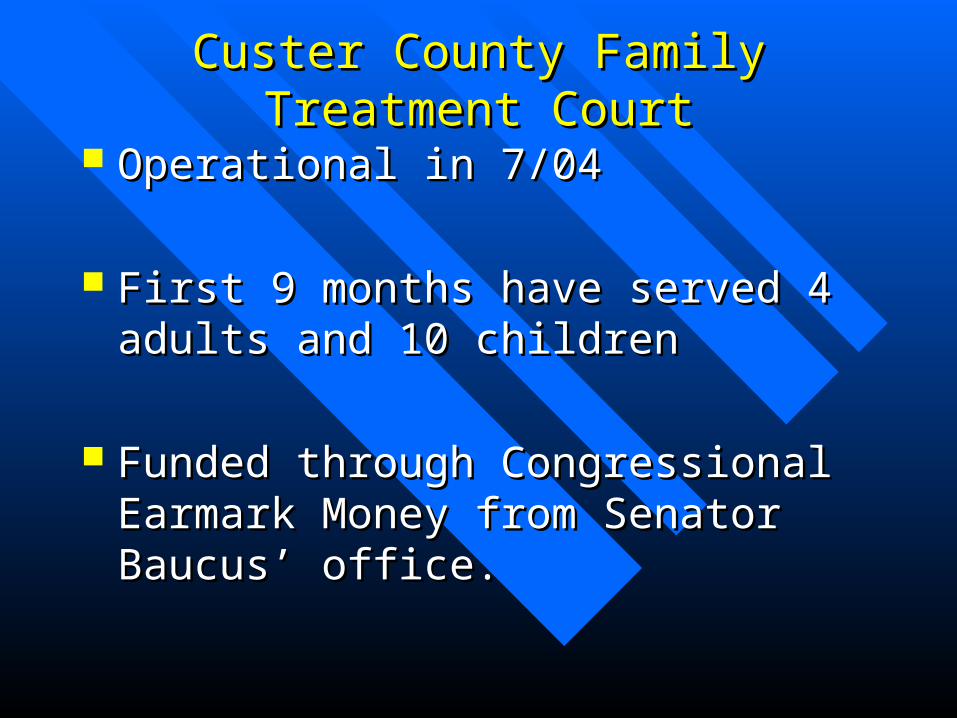
Custer County Family Treatment CourtCuster County Family Treatment Court
Operational in 7/04Operational in 7/04
First 9 months have served 4 adults and 10 First 9 months have served 4 adults and 10 childrenchildren
Funded through Congressional Earmark Funded through Congressional Earmark Money from Senator Baucus’ office.Money from Senator Baucus’ office.
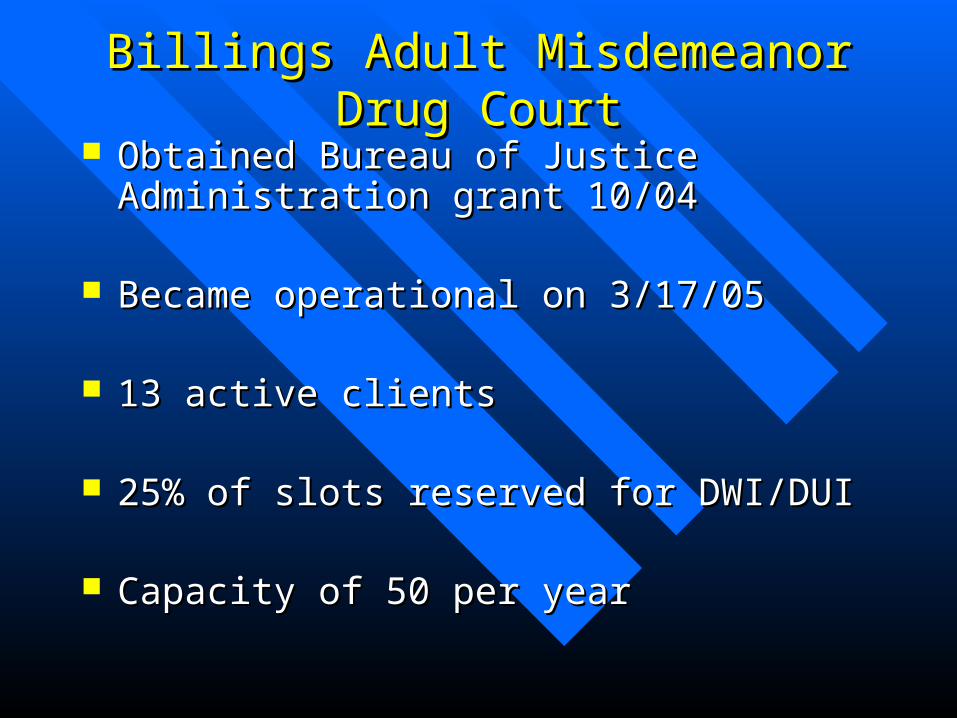
Billings Adult Misdemeanor Drug CourtBillings Adult Misdemeanor Drug Court Obtained Bureau of Justice Administration grant Obtained Bureau of Justice Administration grant
10/0410/04
Became operational on 3/17/05Became operational on 3/17/05
13 active clients 13 active clients
25% of slots reserved for DWI/DUI25% of slots reserved for DWI/DUI
Capacity of 50 per year Capacity of 50 per year
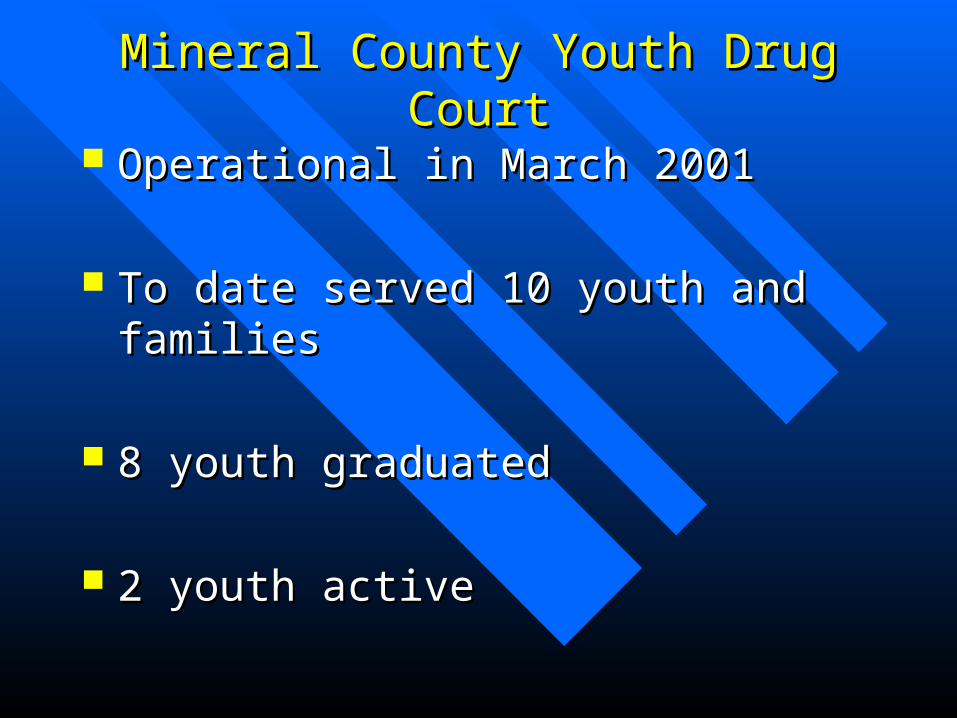
Mineral County Youth Drug CourtMineral County Youth Drug Court
Operational in March 2001Operational in March 2001
To date served 10 youth and familiesTo date served 10 youth and families
8 youth graduated8 youth graduated
2 youth active2 youth active
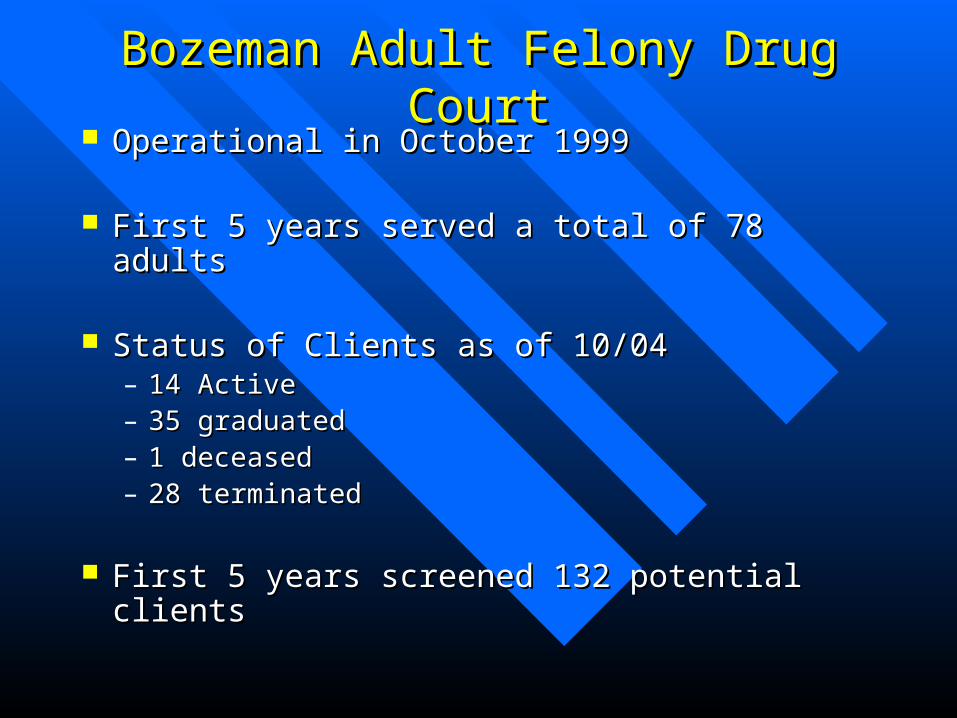
Bozeman Adult Felony Drug CourtBozeman Adult Felony Drug Court Operational in October 1999Operational in October 1999
First 5 years served a total of 78 adultsFirst 5 years served a total of 78 adults
Status of Clients as of 10/04Status of Clients as of 10/04– 14 Active14 Active– 35 graduated35 graduated– 1 deceased1 deceased– 28 terminated 28 terminated
First 5 years screened 132 potential clientsFirst 5 years screened 132 potential clients

Advances in Science Advances in Science Have Revolutionized Our Have Revolutionized Our Fundamental Views of Fundamental Views of
Drug Abuse and AddictionDrug Abuse and Addiction
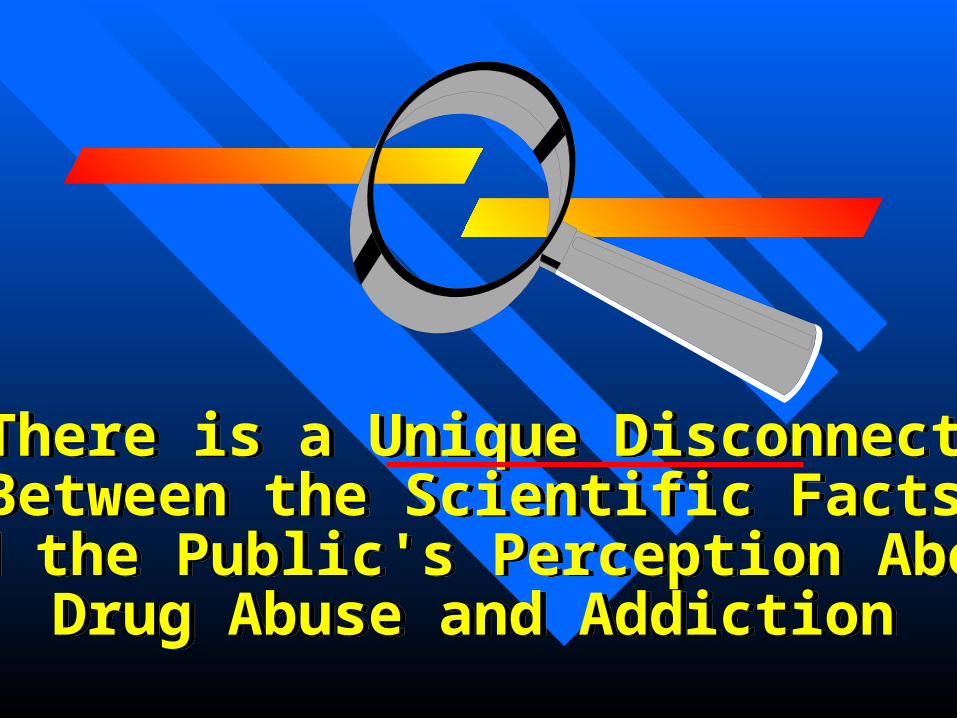
There is a Unique DisconnectBetween the Scientific Facts
and the Public's Perception AboutDrug Abuse and Addiction
There is a Unique DisconnectBetween the Scientific Facts
and the Public's Perception AboutDrug Abuse and Addiction
Drug Abuse Is A Preventable BehaviorDrug Abuse Is A Preventable Behavior
Partnership for a Drug Free AmericaPartnership for a Drug Free America
Drug Addiction Is A Treatable DiseaseDrug Addiction Is A Treatable Disease
Initial Drug Use Is A Voluntary Behavior…
A Person Chooses toTake a Drug for the First Time
Initial Drug Use Is A Voluntary Behavior…
A Person Chooses toTake a Drug for the First Time

Why Do People Take Drugs Why Do People Take Drugs In The First Place?In The First Place?
People Take Drugs To:People Take Drugs To:
Feel good (sensation seeking)Feel good (sensation seeking)
Feel better (self medication)Feel better (self medication)
A Major Reason People Take A Major Reason People Take a Drug is They Like Whata Drug is They Like What
it Does to Their Brainsit Does to Their Brains
Many Things Are Happening During the Transition Between Voluntary
Drug Use and Addiction…
Many Things Are Happening During the Transition Between Voluntary
Drug Use and Addiction…
A Major Task for Drug Treatment A Major Task for Drug Treatment is Changing Brains Back!is Changing Brains Back!
Behaviorally
Pharmacologically
We Need to Treat theWe Need to Treat the
Whole Person!Whole Person!We Need to Treat theWe Need to Treat the
Whole Person!Whole Person!
The Most Effective Treatment The Most Effective Treatment Strategies Will Attend to All Strategies Will Attend to All
Aspects of Addiction:Aspects of Addiction: BiologyBiology
BehaviorBehavior
Social ContextSocial Context

We Need to Keep Our Eye onWe Need to Keep Our Eye on the Real Targetthe Real Target
We Need to Keep Our Eye onWe Need to Keep Our Eye on the Real Targetthe Real Target
AbstinenceAbstinenceAbstinenceAbstinence
Functionality inFunctionality in
Family, WorkFamily, Work
and Communityand Community
Functionality inFunctionality in
Family, WorkFamily, Work
and Communityand Community
In Treating Addiction…In Treating Addiction…
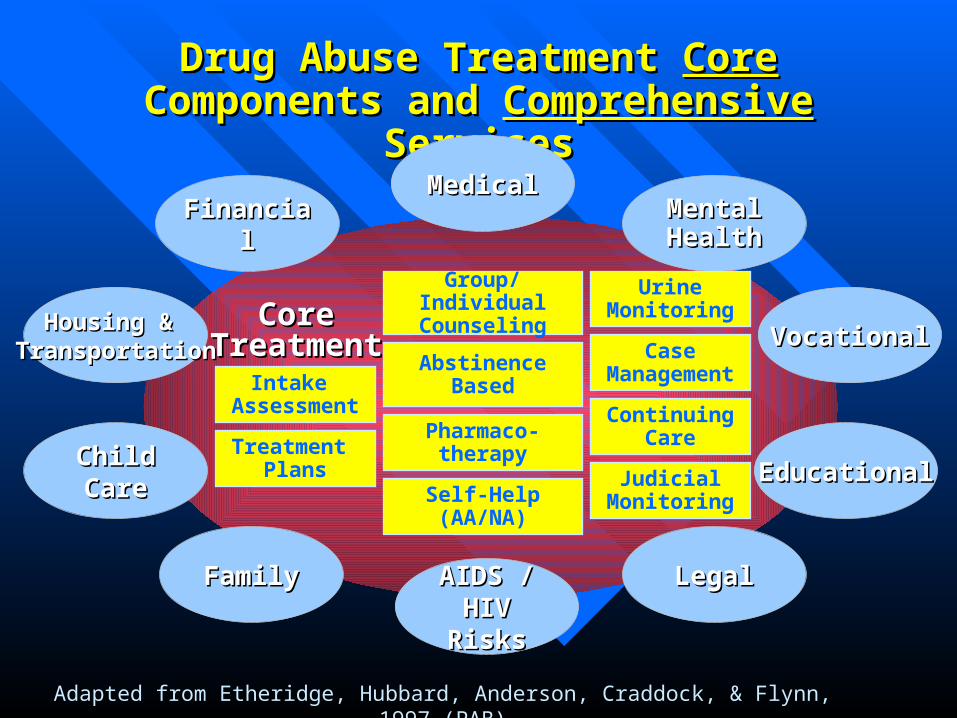
Drug Abuse Treatment Drug Abuse Treatment CoreCore Components and Components and ComprehensiveComprehensive
ServicesServicesMedicalMedical
Mental Mental HealthHealth
VocationalVocational
EducationalEducational
LegalLegalAIDS / AIDS /
HIV RisksHIV Risks
FinancialFinancial
Housing & Housing & TransportationTransportation
Child Child CareCare
FamilyFamily
Continuing Care
Case Management
Urine Monitoring
Self-Help(AA/NA)
Pharmaco-therapy
Group/Individual Counseling
AbstinenceBasedIntake
Assessment
Treatment Plans
CoreCoreTreatmentTreatment
Adapted from Etheridge, Hubbard, Anderson, Craddock, & Flynn, 1997 (PAB)
Judicial Monitoring

TerminationTermination
MaintenanceMaintenanceActioActionn
PreparationPreparationContemplatiContemplationon
PrecontemplationPrecontemplationStages of ChangeProchaska et al, 1991
Where to go from here?Where to go from here?
Continue to follow participants Continue to follow participants longitudinally.longitudinally.
Obtain state funding to continue drug court Obtain state funding to continue drug court initiative.initiative.
Expand drug court programs across the state.Expand drug court programs across the state. Obtain funding to add neuroimaging studies.Obtain funding to add neuroimaging studies. Disseminate data.Disseminate data.

““Coming together Coming together
is a beginning, is a beginning,
talking together talking together
is a process, is a process,
and working together and working together
is a success.”is a success.”
--- Henry Ford--- Henry Ford

Contact InformationContact Information
Brenda K. Roche, Ph.D., LPBrenda K. Roche, Ph.D., LPArrowhead Psychological & Behavioral Sciences, LLCArrowhead Psychological & Behavioral Sciences, LLC
406-294-9510406-294-9510
[email protected]@earthlink.net