Embed Size (px)
Citation preview

RESEARCH & ANALYSIS BUREAUP.O. Box 1728 - Helena, MT 59624(406) 444-4100 - www.lmi.mt.gov
MontanaEconomy at a Glance
OCTOBER 2017
Industry Oct. 2017 (prelim)
Sept. 2017
Net Change
% Change
Total Non-AgEmployment 475.4 474.1 1.3 0.3%
Natural Resources & Mining
7.2 7.2 0.0 0.0%
Construction 27.7 26.8 0.9 3.4%Manufacturing 19.7 19.6 0.1 0.5%Trade,Transportation,& Utilities
94.0 95.1 -1.1 -1.2%
Information 6.2 6.4 -0.2 -3.1%Financial Activities 24.6 24.8 -0.2 -0.8%
Professional & Business Services
42.3 41.9 0.4 1.0%
Education & Health Services
76.9 77.0 -0.1 -0.1%
Leisure & Hospitality 66.4 65.0 1.4 2.2%
Other Services 17.4 17.6 -0.2 -1.1%Total Government 93.0 92.7 0.3 0.3%
Montana’s total non-agricultural payroll employment increased by 1,300 jobs over the month, for a total of 475,400.
Montana’s unemployment rate for October 2017 held steady at 3.9% over the month, making this the 5th month in a row with no change. Meanwhile, the U.S. unemployment rate decreased slightly, dropping to 4.1% from September’s rate of 4.2%.
PAYROLL EMPLOYMENTBY INDUSTRY
In Thousands - Seasonally Adjusted*
UNEMPLOYMENT RATESeasonally Adjusted
NON-AGRICULTURAL EMPLOYMENTIn Thousands
*Excludes self-employed and agricultural employment

Montana Economy at a Glance 2
Montana Department of Labor & Industry
Each student entering college is faced with a daunting question – what field should I study? This decision carries a lot of weight because it can potentially impact a student’s future career trajectory and earnings. While a student’s college major should ultimately reflect their personal interests and aptitudes, it’s also important to consider how much value employers place on different types of degrees. This article examines the relative economic value of different college majors in Montana, using workforce outcomes data produced by the Montana Department of Labor & Industry for the report Meeting State Worker Demand.
Field of Study Impacts Workforce Outcomes More than Major
1 Includes bachelor’s graduates from the 2001-02 academic year to the 2014-15 academic year from Montana State University-Bozeman, MSU-Northern, MSU-Billings, Montana Tech, University of Montana - Missoula, UM-Western, Rocky Mountain College, and Carroll College.
Montana’s four-year colleges offer a wide variety of programs to serve students pursuing many different career paths. So many choices can be overwhelming. However, students can rest assured that their specific major selection probably won’t have a large impact on their workforce ourcomes.
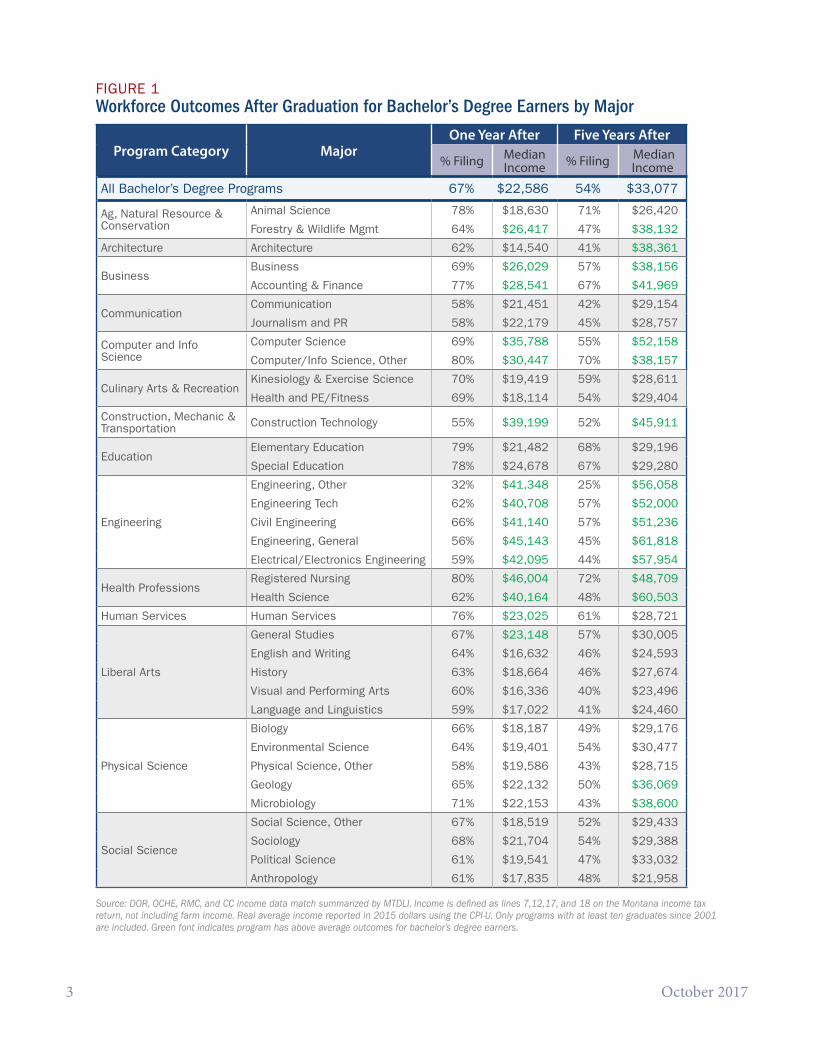
A student’s broader decision about what field to study – such as the liberal arts, business, communications, healthcare, or engineering – has a larger influence on workforce outcomes than the specific major chosen. Figure 1 shows the workforce outcomes for bachelor’s degree graduates from Montana colleges by major.1 The figure includes the percentage of graduates in each major who earned income in Montana one and five years after graduation and the median income for each.
The workforce outcomes of bachelor’s degree graduates vary the most between different program categories. For example, engineering and health professions graduates reported a median income about twice as high as those reported by liberal arts, social science, and communication graduates a year after graduation. The differences in workforce outcomes by program category persist over time, suggesting a student’s career decision helps determine their initial employability post-graduation as well as their future earnings potential.
Health professions and engineering fields reported the highest median wage among bachelor’s degree programs in Montana. All majors within these fields report over $40,000 in median income a
Does Your CollegeMajor Matter in the Workforce? By Amy Watson, Senior Economist
3 October 2017
FIGURE 1Workforce Outcomes After Graduation for Bachelor’s Degree Earners by Major
Program Category MajorOne Year After Five Years After
% Filing Median Income % Filing Median
Income
All Bachelor’s Degree Programs 67% $22,586 54% $33,077
Ag, Natural Resource & Conservation
Animal Science 78% $18,630 71% $26,420
Forestry & Wildlife Mgmt 64% $26,417 47% $38,132
Architecture Architecture 62% $14,540 41% $38,361
BusinessBusiness 69% $26,029 57% $38,156
Accounting & Finance 77% $28,541 67% $41,969
CommunicationCommunication 58% $21,451 42% $29,154
Journalism and PR 58% $22,179 45% $28,757
Computer and Info Science
Computer Science 69% $35,788 55% $52,158
Computer/Info Science, Other 80% $30,447 70% $38,157
Culinary Arts & RecreationKinesiology & Exercise Science 70% $19,419 59% $28,611
Health and PE/Fitness 69% $18,114 54% $29,404
Construction, Mechanic & Transportation Construction Technology 55% $39,199 52% $45,911
EducationElementary Education 79% $21,482 68% $29,196
Special Education 78% $24,678 67% $29,280
Engineering
Engineering, Other 32% $41,348 25% $56,058
Engineering Tech 62% $40,708 57% $52,000
Civil Engineering 66% $41,140 57% $51,236
Engineering, General 56% $45,143 45% $61,818
Electrical/Electronics Engineering 59% $42,095 44% $57,954
Health ProfessionsRegistered Nursing 80% $46,004 72% $48,709
Health Science 62% $40,164 48% $60,503
Human Services Human Services 76% $23,025 61% $28,721
Liberal Arts
General Studies 67% $23,148 57% $30,005
English and Writing 64% $16,632 46% $24,593
History 63% $18,664 46% $27,674
Visual and Performing Arts 60% $16,336 40% $23,496
Language and Linguistics 59% $17,022 41% $24,460
Physical Science
Biology 66% $18,187 49% $29,176
Environmental Science 64% $19,401 54% $30,477
Physical Science, Other 58% $19,586 43% $28,715
Geology 65% $22,132 50% $36,069
Microbiology 71% $22,153 43% $38,600
Social Science
Social Science, Other 67% $18,519 52% $29,433
Sociology 68% $21,704 54% $29,388
Political Science 61% $19,541 47% $33,032
Anthropology 61% $17,835 48% $21,958
Source: DOR, OCHE, RMC, and CC income data match summarized by MTDLI. Income is defined as lines 7,12,17, and 18 on the Montana income tax return, not including farm income. Real average income reported in 2015 dollars using the CPI-U. Only programs with at least ten graduates since 2001 are included. Green font indicates program has above average outcomes for bachelor’s degree earners.

Montana Economy at a Glance 4
Montana Department of Labor & Industry
year after graduation. Graduates in construction technology and computer and information science follow closely behind, reporting over $30,000 in median income. Graduates in these fields remained some of the highest income earners five years after graduation, suggesting their degree helped improve their earning potential compared to graduates from other programs.
Bachelor’s graduates in liberal arts, social science, communication, and physical science have below average workforce outcomes. Graduates in most of these programs reported an income of less than $20,000 after a year, and their income levels remained below average five years after graduation. Students interested in these programs should consider starting out at a two-year college to lower the cost of a bachelor’s degree. On average,
2 A complete list of transfer cost savings by program is available in Figure 2.12 on page 49 of the statewide college workforce report. http://lmi.mt.gov/Publications/PublicationsContainer/meeting-state-worker-demand.
3 A complete list of wage premiums for bachelor’s degree attainment by program can be found in Figure 2.6 on page 38 of the statewide college report. http://lmi.mt.gov/Publications/PublicationsContainer/meeting-state-worker-demand
students who transferred from a two-year to four-year college saved about $1,300 in tuition and recovered their costs faster than those who enrolled directly in a four-year college. Students in more generalized fields, such as liberal arts, tend to save more money from transferring than students in more specialized bachelor’s degree programs.2
The decision between a career in health professions or a career in communication has a much bigger impact on a graduate’s workforce outcomes than the decision between studying business or finance. Graduate workforce outcomes do not vary as significantly within a program category. For example, history majors report only about $3,000 more in median income than English majors five years after graduation. Similarly, engineering graduates’ income levels only vary by about $5,000 a year after graduation depending on the graduate’s specific engineering degree. The difference in income levels between engineering degrees does rise over time. However, some of that difference can be attributed to individual job performance. Students torn between studying environmental science or biology may be relieved to know their decision probably won’t have a large impact on their future earning potential.
Workforce Outcomes Also Impacted by Degree Selection Many students view a bachelor’s degree in any field as a ticket to a successful career. As a result, some students choose to enroll in a four-year college directly after high school without much thought about what they will study once they arrive. However, a bachelor’s degree may not be the most efficient path for a student to achieve their desired career. Some careers pay more to graduates who hold a bachelor’s degree, while others do not. Before students decide to pursue a bachelor’s degree, they should consider the education level required by employers in their field of interest.
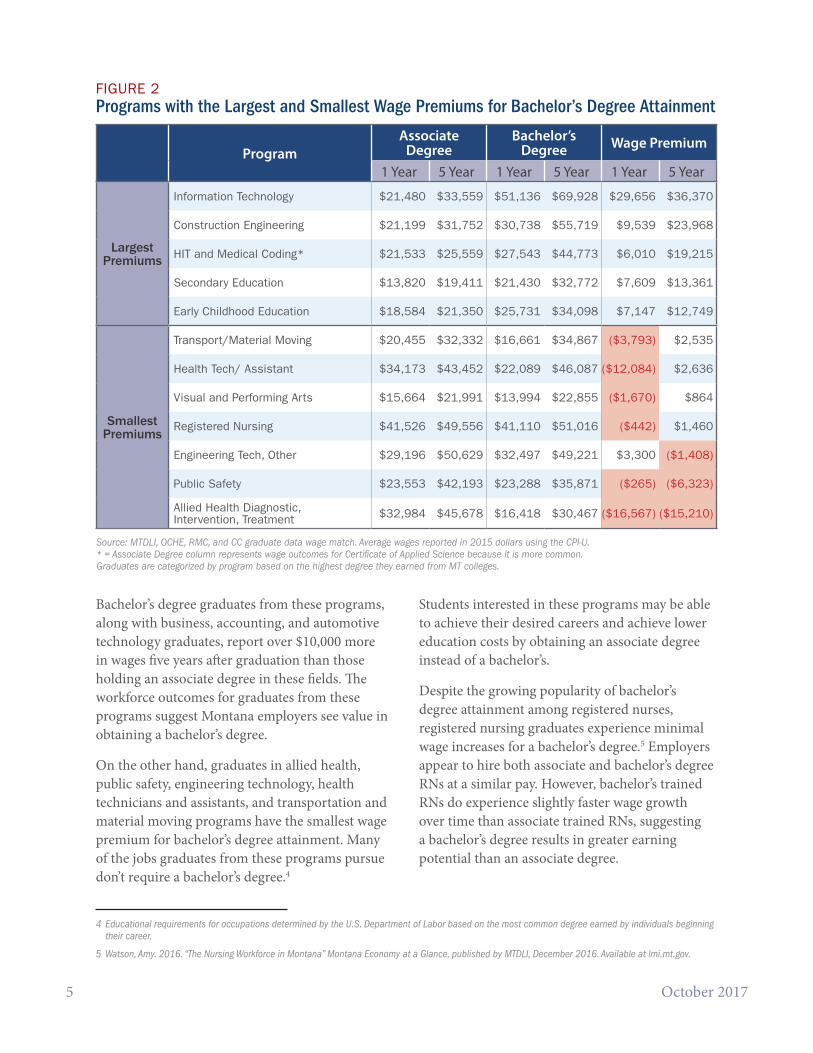
Figure 2 shows the difference in wages attained by associate and bachelor’s degree earners by program for programs with the largest and smallest wage increases for bachelor’s degree attainment.3 In general, programs that train graduates to work in occupations that require a bachelor’s degree have larger wage premiums – the difference between wages of bachelor’s and associate degree earners – than those that do not.
Graduates in education, health information technology, construction engineering, and information technology received the largest wage premium for bachelor’s degree attainment.
Bachelor’s degree majors with income of at least $30,000 a year after graduation:
• Engineering
• Registered Nursing
• Health Science
• Computer & Info Science
• Construction Technology
5 October 2017
Bachelor’s degree graduates from these programs, along with business, accounting, and automotive technology graduates, report over $10,000 more in wages five years after graduation than those holding an associate degree in these fields. The workforce outcomes for graduates from these programs suggest Montana employers see value in obtaining a bachelor’s degree.
On the other hand, graduates in allied health, public safety, engineering technology, health technicians and assistants, and transportation and material moving programs have the smallest wage premium for bachelor’s degree attainment. Many of the jobs graduates from these programs pursue don’t require a bachelor’s degree.4
4 Educational requirements for occupations determined by the U.S. Department of Labor based on the most common degree earned by individuals beginning their career.
5 Watson, Amy. 2016. “The Nursing Workforce in Montana” Montana Economy at a Glance, published by MTDLI, December 2016. Available at lmi.mt.gov.
Students interested in these programs may be able to achieve their desired careers and achieve lower education costs by obtaining an associate degree instead of a bachelor’s.
Despite the growing popularity of bachelor’s degree attainment among registered nurses, registered nursing graduates experience minimal wage increases for a bachelor’s degree.5 Employers appear to hire both associate and bachelor’s degree RNs at a similar pay. However, bachelor’s trained RNs do experience slightly faster wage growth over time than associate trained RNs, suggesting a bachelor’s degree results in greater earning potential than an associate degree.
FIGURE 2Programs with the Largest and Smallest Wage Premiums for Bachelor’s Degree Attainment
ProgramAssociate
DegreeBachelor’s
Degree Wage Premium
1 Year 5 Year 1 Year 5 Year 1 Year 5 Year
Largest Premiums
Information Technology $21,480 $33,559 $51,136 $69,928 $29,656 $36,370
Construction Engineering $21,199 $31,752 $30,738 $55,719 $9,539 $23,968
HIT and Medical Coding* $21,533 $25,559 $27,543 $44,773 $6,010 $19,215
Secondary Education $13,820 $19,411 $21,430 $32,772 $7,609 $13,361
Early Childhood Education $18,584 $21,350 $25,731 $34,098 $7,147 $12,749
Smallest Premiums
Transport/Material Moving $20,455 $32,332 $16,661 $34,867 ($3,793) $2,535
Health Tech/ Assistant $34,173 $43,452 $22,089 $46,087 ($12,084) $2,636
Visual and Performing Arts $15,664 $21,991 $13,994 $22,855 ($1,670) $864
Registered Nursing $41,526 $49,556 $41,110 $51,016 ($442) $1,460
Engineering Tech, Other $29,196 $50,629 $32,497 $49,221 $3,300 ($1,408)
Public Safety $23,553 $42,193 $23,288 $35,871 ($265) ($6,323)
Allied Health Diagnostic, Intervention, Treatment $32,984 $45,678 $16,418 $30,467 ($16,567) ($15,210)
Source: MTDLI, OCHE, RMC, and CC graduate data wage match. Average wages reported in 2015 dollars using the CPI-U. * = Associate Degree column represents wage outcomes for Certificate of Applied Science because it is more common. Graduates are categorized by program based on the highest degree they earned from MT colleges.

Montana Economy at a Glance 6
Montana Department of Labor & Industry
FIGURE 3Workforce Outcomes One-Year After Graduation for Degrees less than Four-Years
Source: DOR, OCHE, RMC, and CC income data match summarized by MTDLI. Income is defined as lines 7,12,17, and 18 on the Montana income tax return, not including farm income. Real average income reported in 2015 dollars using the CPI-U. Only programs with at least ten graduates since 2001 are included. (A)=Associate degree (P)=Postsecondary non-degree award
Graduates from several associate degree programs have better workforce outcomes than the average bachelor’s degree earner. Figure 3 shows the workforce outcomes for associate degree and postsecondary award programs. The horizontal axis represents the percent of graduates filing income taxes one year after graduation, and the vertical axis shows the reported median income for each degree. The size of the bubble corresponds to the number of graduates in each program since 2001. The programs in the upper-right hand corner have better workforce outcomes in Montana a year after graduation than those in the lower-left.
Of the associates degree and post-secondary award programs, health professions degrees (colored red) have some of the best workforce outcomes in Montana. Registered nurses with an associate degree earn a median income of roughly $44,000 one year after graduation. Construction technology graduates have the next highest income, reporting $31,000 a year after graduation. These are followed by graduates in engineering technology, and computer and IT graduates, reporting median wages of $28,000 and $23,000, respectively.
While earning a bachelor’s degree can set graduates up for success in the Montana labor market, there are also lucrative career opportunities for students who pursue an associate degree.
Your Degree Only Goes So Far – Work Experience MattersPerhaps the single best thing a student can do to improve their career prospects after graduation is to work while they are still in school. Graduates with work experience prior to graduation were more likely to be employed in Montana after graduation, and they had higher wages than those without prior connections to the Montana labor market. Figure 4 shows the wage and employment outcomes for incumbent workers before and after graduation, compared to non-incumbent workers.
Establishing a connection to the Montana labor market prior to graduation greatly improves the likelihood a student will find employment in Montana after graduation. Eighty-six percent of incumbent workers were employed in Montana a year after graduation, compared to only about

7 October 2017
FIGURE 4Workforce Outcomes for Incumbent Workers Before and After Graduation
50% of non-incumbent workers. Incumbent workers also had a more consistent work history after graduation. Sixty-three percent of incumbent workers were still employed in Montana five years after graduation, compared to only 33% of non-incumbent workers.
Incumbent workers also benefited from their work experience by earning about $8,000 more than non-incumbent workers a year after graduation. The wage premium decreases over time as non-incumbent workers also gain experience. Five years after graduation, incumbent workers made about $6,000 more than non-incumbent workers did. While major and degree selection has an impact on student’s workforce outcomes, all students can improve their career prospects by gaining work experience prior to graduation.
Conclusion All students must decide which career path to pursue, and their choices will certainly impact their future career trajectory and success. As such, reliable information on student workforce outcomes is critical to making an informed decision. However, a student’s major is only one determinate of future career success. Students can also improve their workforce outcomes by selecting the degree from within their field of interest that is most valuable to employers. Gaining work experience before graduation also improves outcomes, giving students a better understanding of their career options, and building the skills they’ll need to excel in the Montana workforce.
Source: MTDLI, OCHE, RMC, and CC graduate data wage match. Real wages reported in 2015 dollars using the CPI-U.
Want More Information on Workforce Outcomes? The information in this article comes from the report, “Meeting State Worker Demand: A Report on the Labor Market Outcomes for Montana Colleges.” This report addresses the ability of Montana colleges to meet the state’s future workforce needs. The report provides information on the expected job demand, and analyzes whether students in Montana colleges are graduating within in-demand fields, obtaining jobs quickly after graduation, and experiencing wage progression in their post-graduation careers. Download the full report at http://lmi.mt.gov/Publications/PublicationsContainer/meeting-state-worker-demand.

Return in 5 days to:Research & Analysis BureauP.O. Box 1728Helena, MT 59624-1728
Official BusinessPenalty for Private Use $300
66107
COUNTY AND RESERVATION UNEMPLOYMENT RATES – OCTOBER 2017
130 copies of this public document were produced at an estimated cost of $1.16 per copy, for a total cost of $210.60, which includes $150.80 for printing and $59.80 for distribution.
Montana Economy at a Glance Montana Department of Labor & Industry
BLACKFEET 9.8%CROW 17.5%FLATHEAD 4.1%FT. BELKNAP 8.2%FORT PECK 4.9%N. CHEYENNE 12.7%ROCKY BOY’S 11.0%
Not Seasonally Adjusted


![[Wisebirds]2014 social ads market at a glance](https://img.pdfslide.net/doc/110x75/55a77bd71a28abce668b4601/wisebirds2014-social-ads-market-at-a-glance.jpg)