Embed Size (px)
Citation preview
MONTE CARLO - BASED VALIDATION OF THE ENDF/MC~-II/SDX CXLL HOMOGENIZATION PATH
D. C. Wade
Applied Physics Division Argonne National Laboratory
USA
Submitted to:
IAEA/NEACRP Specialist Meeting on Homogenization Methods i n Reactor Physics
Wllrenlingen, Switzerland November 13-15, 1978
TABLE OF CONTENTS
I. Introduction
11. ZPR Cell Homogenization Methods and Codes
A. ZPR Matrix Loadings B. The ETOE-II/MC~-II/SDX Cell Homogenization Path C. Cell Anisotropic Diffusion Coefficients
1. Benoist Method 2. Gelbard Method
D. 3D + lD Modeling Prescriptions
111. The Validation Procedure
A. The VIM Monte Carlo Code B. Strategy of the Validation Procedure
1. Nonleakage Integral Parameter Comparisons 2. Leakage Integral Parameter Comparisons
IV. Asymptotic Homogeneous Cases
A. Zero Leakage Tests; LMFBR Composition B. Non-Zero Leakage Tests; GCFR Composition
1. Small Buckling 2. Large Buckling
V. Asymptotic, Heterogeneous Plate-Cell Lattices
a A. Zero Leakage; True lD W B R Plate Cell B. Monte Carlo Studies of Non-Leakage and Leakage Aspects of
3D + lD Modeling
1. Nonleakage Parameters; Reference and Pure Void Modeling 2. Leakage Parameters; Adequacy of ID Modeling 3, Leakage Parameters; Reference lD Modeling 4. Leakage Parameters; Pure Void lD Modeling
C. Benoist Diffusion Coefficient Method for a lD Slab Cell Containing No True Void Regions
D. Gelbard Diffusion Coefficient Method for a lD Slab Cell Containing Regions of True Void
E. Summary of Plate Cell Results
TI. Asymptotic, Heterogeneous Pin Calandria Cell Lattices
VII. Conclusions and Discusion of Current Activities
A. Epithenual Effects; Asymptotic, Steam-Flooded GCPR Lattices B. Non-Asymptotic Cases C. Modeling of Detectors in Critical Experiments D. Worths and Bilinear Weighting
VIII. Acknowledgements
IX. References
Appendix A: The ETOE-11, MC~-11, and SDX Codes
Appendix B: 3D + 1D Modeling Prescriptions for ZPR Cells.
. Introduction
This paper summarizes the results of a program of validation of the unit cell homogenization prescriptions and codes used for the analysis of Zero Power Reactor (ZPR) fast breeder reactor critical. experiments. The ZPR drawer loading patterns comprise both plate type and pin-calandria type unit cells. A pre- scription is used to convert the three dimensional physical geometry of the drawer loadings into one dimensional calculational models. The ETOE-II/MC~-111 SDX code sequence is used to transform ENDFIB basic nuclear data into unit cell average broad group cross sections based on the 1D models. Cell average, broad group anisotropic diffusion coefficients are generated using the methods of Benoist or of Gelbard. The resulting broad (~10 to 30) group parameters are used in multigroup diffusion and Sn transport calculations of full core XY or RZ models which employ smeared atom densities to represent the contents of the unit cells.
This homogenization path has been extensively validated by detailed com- parisons against results produced by high precision Monte Carlo calculations of the unit cells. These calculations were produced by the VIM continuous-energy Monte Carlo code employing the ENDFIB basic data. The validation effort has systematically progressed from homogeneous, zero-leakage tests through models of infinite arrays of heterogeneous plate or pin-calandria cells subject to an im- posed buckling, and from typical LMFBR compositions stressing the ~ 1 0 0 keV range through steam-flooded GCFR compositions which exhibit a substantial sensi- tivity to the ~ 1 0 0 eV epithermal range. In connection with the leakage aspects of this effort, methods for treating neutron streaming have been developed and validated.
The fast breeder reactor critical experiment application to which the homo- genization procedure and codes are addressed:
stresses the fast energy range, 14.3 MeV to 0.4 eV. No thermal range treatment is provided; and
addresses the composition, temperature, and geometry dependence of resonance reaction rates.
No particular stress has been placed on depletion - e.g., the code package does not include an automatic cell depletion capability or a means to automatically generate depletion-dependent cell average cross section fits or tables.
The emphasis has been placed on producing cell average cross sections which accurately reproduce isotopic and total reaction rates, and direction-dependent leakage rates. Accordingly, a flux, volume atom density weighting for cell homogenization and energy collapse is used. However, these flux weighted cross sections currently are used also for computing material worths and kinetics parameters in the criti- cals analyses. A modest amount of work has gone into investigating the error in computed worths due to the use of flux weighted rather than bilinearly weighted cross sections.
The validation effort, up to this time, has focused on the asymptotic situa- tion - homogeneous compositions or unit cell lattices subject to an imposed buckling. The end result of the validation effort has been to provide a high degree of confidence in the accuracy of our methods, at least in the asymptotic case (far from zone interfaces). Work has only recently started on validating the modeling of zone interfaces.
In the following sections we first describe the unit cells of interest and the 3D + 1D modeling prescription used to convert the cells into calculational models for the cell homogenization calculations. The codes used in the homo- genization are briefly described in an appendix. The validation strategy is then outlined, and the validation results are displayed.
11. ZPR Cell Homogenization Methods and Codes
A. ZPR Matrix Loadings (I) -
The ZPR fast critical assemblies operated by Argonne National Laboratory are split table machines holding lattices of stainless steel tubes with a square cross section, two inches on an edge. These tubes are loaded with stainless steel drawers filled with either plate-type or pin-calandria type unit cell loadings. Typical examples of the tubeldrawerlplate or tubelpin-calandria unit cells are shown in Figs. 1 through 3.
The models for the validation effort have been selected from these ZPR unit cell loadings and have included:
- an LMFBR plate unit cell (Fig. 1) - a GCFR plate unit cell (containing void columns) (Fig. 2) - A sodium-voided LMFBR pin calandria unit cell (Fig. 31, and - a steam-flooded GCFR plate unit cell (Fig. 2 with void (V) replaced by a CH2 steam simulant)
The compositions of one dimensional models of these unit cells are listed in
0 Tables I through IV.
The 2 in. x 2 in. plate and pin calandria cells ,are %1/2 to 2 total mean free paths across for neutrons in the fast energy range. Peak to average fluxes within the cells are %l.3 to 1.4. As an indication of the pro- perties and neutron balance of the cells, Table V shows the neutron balance for the zero leakage homogeneous LMFBR composition.
B, The ETOE-II/MC~-II/SDX Cell Homogenization Path
The ETOE-11/MC2-II/SDX code package1 was developed by the Applied Physics Division at Argonne National Laboratory to process the ENDFIB basic nuclear data into unit cell-averaged multigroup cross sections for application to fast breeder reactor diffusion and transport calculations. ETOE-I1 reformats the ENDFIB data into libraries for Mc2-11 and SDX; MC~-II(~) is a zero dimen- sional do00 ultra fine energy group (ufg) slowing down code which is used to
produce a %200 fine group (fg) library for SDX (which excludes the contributions from heavy element capture and fission resonances); S D X ~ , ~ is a one dimensional cell homogenization code which collapses in space and energy from the %200 fine group level to %I0 to 30 broad group cell average cross sections.
Broad-group microscopic cross sections are composition-dependent because of the composition-dependence of the neutron flux (and current) weight- ing spectrum. Elastic removal and heavy element resonance cross sections are generally the most sensitive to composition due to intermediate element scatter- ing resonances and heavy element resonances. The SDX code is used for composition dependent unit cell homogenization in space and energy. It treats slab or cy- lindrical geometry in one dimension, and is executed at the fine (%ZOO) energy group level such that the energy detail is adequate to "trace out" the higher energy scattering resonances in intermediate mass nuclei. For heavy nuclei cap- ture and fission resonances the SDX energy structure is too coarse for detailed representation of resonances, and the resonance parameters from the ENDF files are used directly for the generation of composition dependent fine group resonance cross sections.
The SDX calculation is designed to:
a. Treat the composition dependence of the resonance absorption cross sections on a plate-by-plate basis (heterogeneous resonance self shielding).
b. Account for the detailed spatial dependence of the flux within the unit cell on a fine group basis, for the purpose of spatial homogenization, and
c. Collapse cross sections over a cell average - fine group spectrum to a broad (%lo to 30) group basis.
The ETOE-~/Mc~-II/ SDX code system was developed on an IBM-370/195, and all programing was done in FORTRAN'. The code system is operational on both IBM and CDC equipment at several U.S. laboratories and is available from the Argonne Code Center and the NEA ISPRA Code Center. The program package includes the MC~-11 and SDX codes with ETOE-11-processed libraries for the ENDFIB Version IV data.
The ETOE-11, MC~-11, and SDX codes are briefly described in Appendix A.
C. Cell Anisotropic Diffusion Coefficients
Experience has shown that the structure of the ZPR unit cells gives rise to anisotropic neutron leakage. This is particularly true in the case of sodium-voided LMFBR and of GCFR cells where the void fraction of the cell is both large (u0-55 v/o) and distributed such as to induce streaming in the Z and Y directions (see Figs. 1 and 2). Two methods are in use to generate aniso- tropic diffusion coefficients at the broad group level; the method of ~enoist', and an extension of his method which was developed to deal with the high buck- lings encountered in fast reactors and the presence of planar void regions (which
.cause the Benoist method to break down). This second (Gelbard) methodlo was developed in connection with the validation work described here.
1. Benoist Method - A utility code, BENOIST, is used in connection with the 1D models of the ZPR celis described in the next section to compute anisotropic diffusion coefficients. The form of the Benoist method employed by the code is a commonly applied one that neglects so-called absorption correction terms for the x-direction coefficients. These terms are omitted in part to avoid double-valued solutionsll for Dl. The group g, unit cell-averaged Benoist dif-
-C
fusion coefficient in coordinate direction, k, is constructed from the formula
g where Vi and 4% are the volumes and group g fluxes in subregions i of the unit
cell, Ag is the transport mean-free path in region j, group g, and J
is the directional probability that source neutrons of group g in region i suffer their first collision in region j. Here !& is the direction cosine.
The BENOIST code works in both plate and pin geometry and uses algor- ithms for generating the directional collision probabilities, which are simple modifications of those used in the SDX cell-homogenization code. The calcula- tions are made on the broad-group level using plate-wise transport cross sections obtained from SDX. The flux in Eq. 1 is assumed to be flat across the cell since it was determined that in our problems this approximation has negligible impact on the Benoist diffusion coefficients.
The Benoist formula cannot be applied when there are totally voided streaming paths. This can be seen from Eq. 1 in which D becomes undefined when the transport mean-free-path goes to infinity in any region. Infinite streaming paths are a concern not only in the ZPR pin calandria and plate geometries but also in voided hexagonal lattices with small pins spaced at large pitch.12
In addition to the above, the Benoist method could be expected to overpredict leakage at the high buckling found in fast reactors because the derivation involves a Taylor series expansion in buckling, neglecting terms of order B ~ . For a homogeneous medium, the Benoist and conventional diffusion coefficients coincide. In a sense, then, some features of diffusion theory are built into the Benoist method. In general, diffusion computations tend to overestimate the leakage more and more as the buckling increases and the Benoist method is no exception.
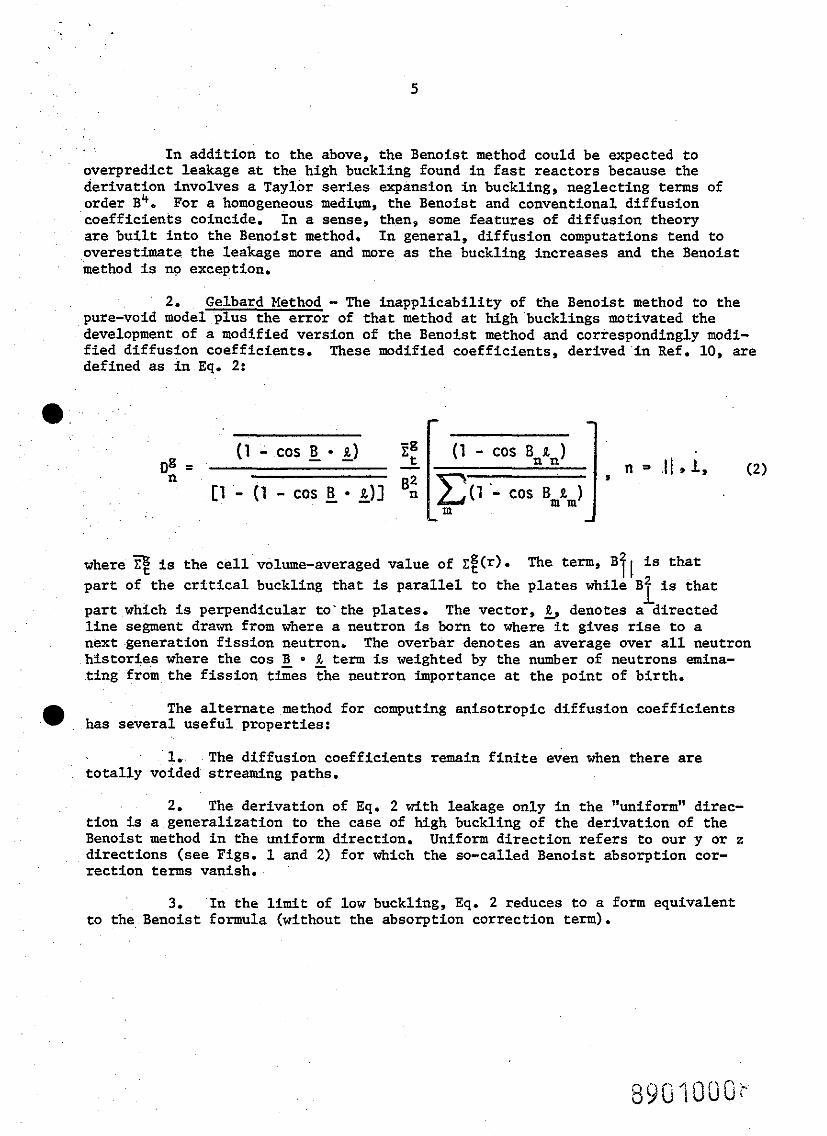
2. Gelbard Method - The inapplicability of the Benoist method to the pure-void model plus the error of that method at high bucklings motivated the development of a modified version of the Benoist method and correspondingly modi- fied diffusion coefficients. These modified coefficients, derived in Ref. 10, are defined as in Eq. 2:
where is the cell volume-averaged value of ~f(r). The term, B is that 7 I part of the critical buckling that is parallel to the plates while B: is that
L part which is perpendicular to'the plates. The vector, & denotes a directed line segment drawn fpom where a neutron is born to where it gives rise to a next generation fission neutron. The overbar denotes an average over all neutron histories where the cos B 0 9, term is weighted by the number of neutrons emina- ting from the fission tges The neutron importance at the point of birth.
The alternate method for computing anisotropic diffusion coefficients has several useful properties:
1. The diffusion coefficients remain finite even when there are totally voided streaming paths.
2. The derivation of Eq. 2 with leakage only in the "uniform1' direc- tion is a generalization to the case of high buckling of the derivation of the Benoist method in the uniform direction. Uniform direction refers to our y or z directions (see Figs. 1 and 2) for which the so-called Benoist absorption cor- rection terms vanish.
3. In the limit of low buckling, Eq. 2 reduces to a form equivalent to the Benoist formula (without the absorption correction term).
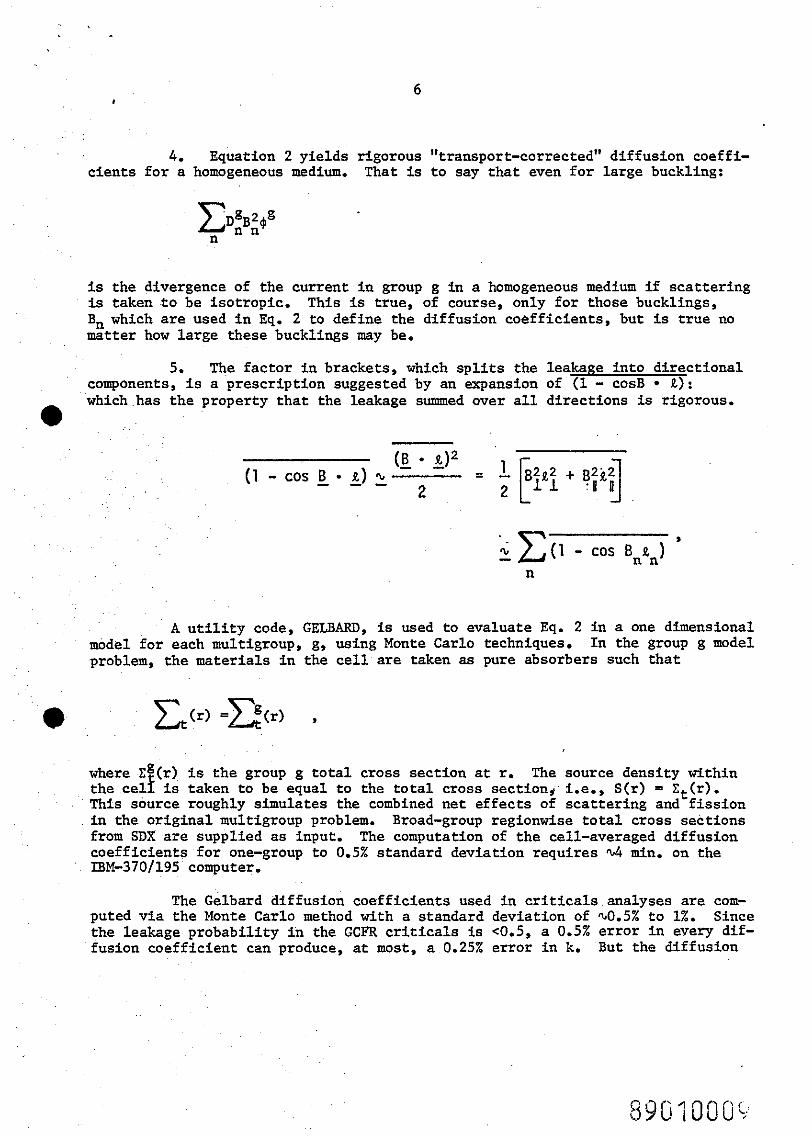
4. Equation 2 yields rigorous "transport-corrected" diffusion coeffi- cients for a homogeneous medium. That is to say that even for large buckling:
is the divergence of the current in group g in a homogeneous medium if scattering is taken to be isotropic. This is true, of course, only for those bucklings, Bn which are used in Eq. 2 to define the diffusion coefficients, but is true no matter how large these bucklings may be.
5. The factor in brackets, which splits the leakage into directional components, is a prescription suggested by an expansion of (1 - cosB %I:
a which has the property that the leakage summed over all directions is rigorous.
A utility code, GELBARD, is used to evaluate Eq. 2 in a one dimensional model for each multigroup, g, using Monte Carlo techniques. In the group g model problem, the materials in the cell are taken as pure absorbers such that
where .Xg(r) is the group g total cross section at r. The source density within the celf is taken to be equal to the total cross section, i.e., S(r) = Ct(r). This source roughly simulates the combined net effects of scattering and fission in the original multigroup problem. Broad-group regionwise total cross sections from SDX are supplied as input. The computation of the cell-averaged diffusion coefficients for one-group to 0.5% standard deviation requires Q4 min. on the 1BM-3701195 computer.
The Gelbard diffusion coefficients used in criticals analyses are com- puted via the Monte Car10 method with a standard deviation of ~0.5% to 1%. Since the leakage probability in the GCFR criticals is <0.5, a 0.5% error in every dif- fusion coefficient can produce, at most, a 0.25% error in k. But the diffusion
coefficient generation calculations in different groups were completely uncor- related, and therefore it is reasonable to expect a good deal of error cancella- tion in the total leakage. If one were to suppose, for example, that the first 16 groups all contribute equally to the net leakage rate, one would conclude that the error in k, produced by the statistical errors in D'S, is only %0.06%. In any case, it seems safe to assume that this particular error in k is sub- stantially smaller than 0.25%.
D. 3D + 1D Modeling Prescriptions
Because the codes available for cell homogenization are based on one dimensional slab or cylindrical geometries, a modeling prescription which trans- forms the three dimensional ZPR matrix tube loadings as shown in Figs. 1 through 3 to a one dimensional calculational model is an essential part of the homogeniza- tion process. However, a modeling that is appropriate for one phenomenon may not preserve properties that are crucial in another process. For example, in computing platewise resonance self shielding, it is important to preserve the absorber to moderator atom ratio within the plate. On the other hand, to compute the flux spectrum, cell average atom densities should be maintained (recall that the cells are approximately one mean free path in extent). As will be shown below, for the generation of diffusion coefficients which preserve leakage rates, it is neces- sary to preserve cell average number densities and to preserve true void regions if they exist.
The 3D + ID modeling prescriptions which are in use for the ZPR cells and which have been validated are described in detail in Appendix B. Briefly, for both the pin calandria and the plate cell, two modelings are used:
a. the "reference" modeling in which the geometry and composition of resonance-isotope-bearing regions are maintained at their physical values and in which the structral materials from the periphery of the physical cell are smeared into the non-resonance-isotope- bearing regions (including void regions) of the lD model, and
a b. the "pure void" modeling which is the same as the "reference" modeling except that if void regions are present in the 3D cell, they are maintained in the 1D model.
The 1D models of pin-calandria cells are one-pin cylindrical cells with associated diluent annuli and a white boundary condition. The ID models of plate cells are an array of infinite slab regions with either periodic or reflective boundary conditions.
111. The Validation Procedure
The key to the successful validation effort has been the availability of high precision Monte Carlo solutions to the unit cell problems against which the homo- genization results can be tested. Given the geometry and composition of the 3D cells and the ENDFIB data, these Monte Carlo methods give a basically exact solu- tion of the Boltzman equation and low-variance estimates of the integral parameters
.of interest. The Monte Carlo solutions have been provided using the VIM code and its associated statistical editing packages.
A. The VIM Monte Carlo Code
The VIM Monte Carlo code13 permits an explicit three dimensional geo- metrical description of the unit cell, using a generalized geometry input processor. Neutron cross sections are derived from the ENDFIB data files and are treated as continuous functions of energy. Resolved resonances are "traced out" by a set of point cross section values suitable for interpolation. Unresolved resonances are treated by a probability table method. During the first part of the validation program, the VIM code solved only down to 10 eV. This, was of course, quite ade- quate for fast breeder work. A thermal range capability has recently been added to VIM, and has been used in the GCFR steam flooded cell homogenization valida- tion work.
B. Strategy of the Validation Procedure
Figure 4 displays the philosophy of the validation effort. Starting from the 3D cell geometry and the ENDFIB cross sections, the 3D + 1D cell modeling and the ETOE-111~~~-II/SDX and BENOIST or GELBARD cell homogenization path is followed to produce values for the cell integrated reaction and leakage rates. This is the path which is to be validated.
Alternately, starting from the 3D geometry and the ENDFIB cross sec- tions, the calculational path through the VIM Monte Carlo code leads to exact values for isotopic and total cell integrated reaction rates and total, direction- dependent cell leakage rates. The agreement of the end products of the two paths serves to validate the MC~-II/SDX homogenization codes and the 3D + 1D modeling procedure for the class of cases considered.
To perform the validation in a way which permitted the isolation and elimination of errors, the class of cases considered has progressed in a system- atic fashion starting at the zero leakage homogeneous case and, to the extent possible, introducing the complexities of heterogeneity, leakage, etc., one at a
0 time.
(1) Nonleakage Integral Parameter Comparisons - The intercomparisons in the zero leakage cases are quite straightforward. The cell integrated and intracell neutron flux and reaction rates-by isotope, reaction type; and energy band, are available from both the reference VIM and the SDX or broad group dif- fusion codes and can be simply intercompared. Similarly, the eigenvalue (which in the zero leakage case is L) can be directly intercompared. The VIM track length estimates provide high precision results even for groupwise, isotopic, reac- tion rates by plate with several hundred thousand neutron histories.
(2) Leakage Integral Parameter Comparison - The validation of the homo- genization of leakage properties is a many faceted problem and necessitated a less - -
straightforward validation procedure.
ii.
iii.
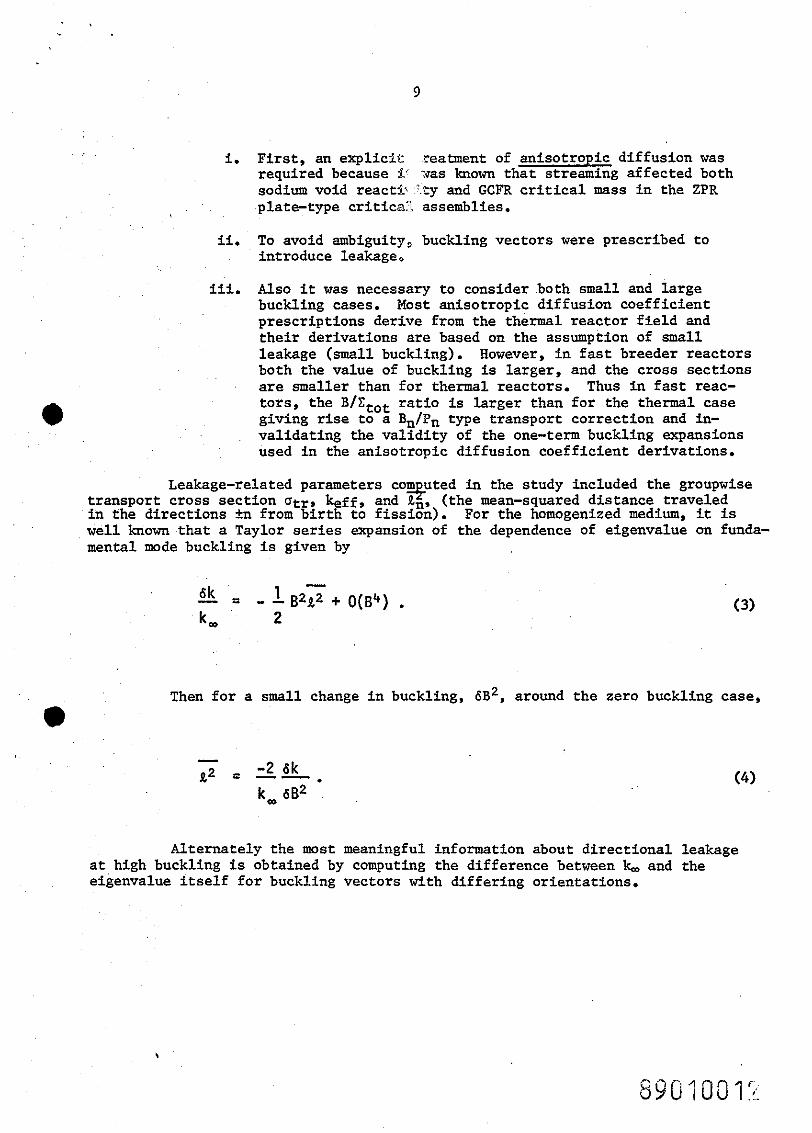
First, an explicit reatment of anisotropic diffusion was required because 2. xas known that streaming affected both sodium void reacti. "ty and GCFR critical mass in the ZPR plate-type critical assemblies.
To avoid ambiguity, buckling vectors were prescribed to introduce leakage,
Also it was necessary to consider both small and large buckling cases. Most anisotropic diffusion coefficient prescriptions derive from the thermal reactor field and their derivations are based on the assumption of small leakage (small buckling). However, in fast breeder reactors both the value of buckling is larger, and the cross sections are smaller than for thermal reactors. Thus in fast reac- tors, the BIZtot ratio is larger than for the thermal case giving rise to a Bn/Pn type transport correction and in- validating the validity of the one-term buckling expansions used in the anisotropic diffusion coefficient derivations.
Leakage-related parameters corn uted in the study included the groupwise 4 transport cross section atrr keff, and $,, (the mean-squared distance traveled in the directions +n from birth to fission). For the homogenized medium, it is well known that a Taylor series expansion of the dependence of eigenvalue on funda- mental mode buckling is given by
6k 1 - - = - - ~~t~ + o ( B ~ ) .
2 (3)
k,
Then for a small change in buckling, 6 ~ ~ , around the zero buckling case,
(4)
Alternately the most meaningful information about directional leakage at high buckling is obtained by computing the difference between k, and the eigenvalue itself for buckling vectors with differing orientations.
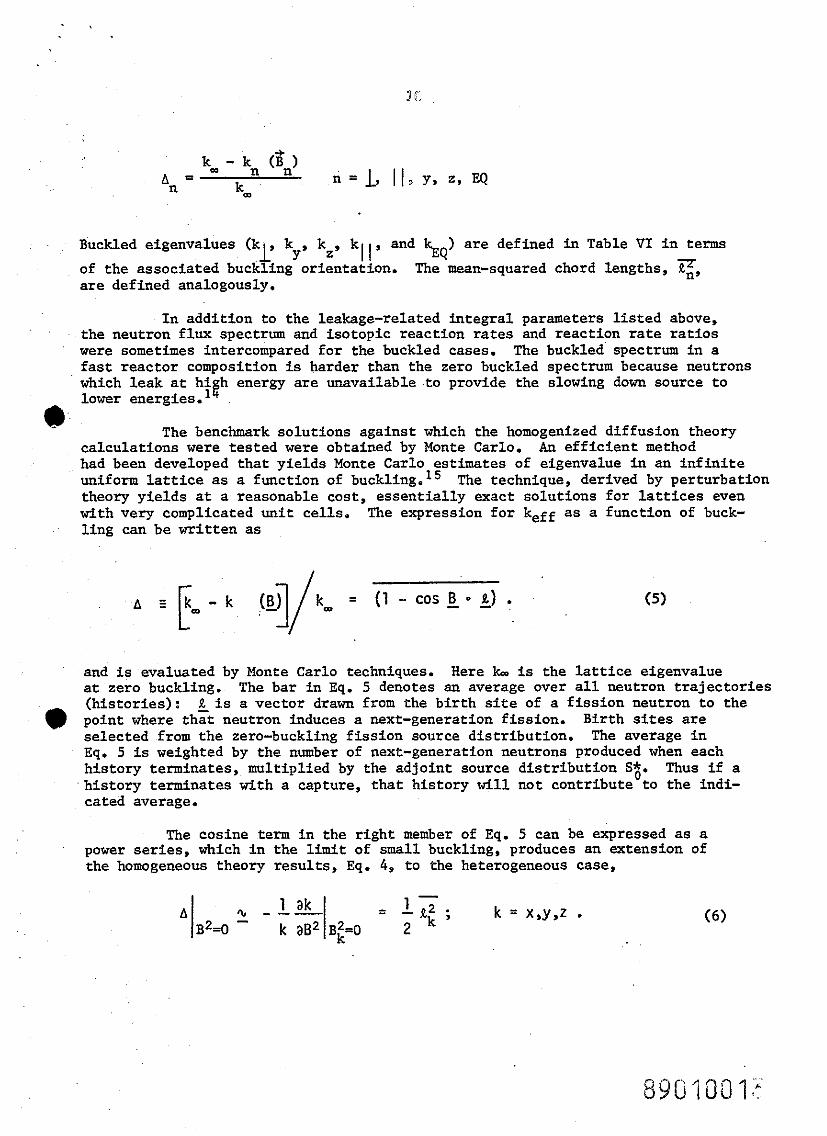
Buckled eigenvalues (kL, ky, kZ, kl , and %Q) are defined in Table VI in terms of the associated buckling orientation. The mean-squared chord lengths, ii;f, are defined analogously.
In addition to the leakage-related integral parameters listed above, the neutron flux spectrum and isotopic reaction rates and reaction rate ratios were sometimes intercompared for the buckled cases. The buckled spectrum in a fast reactor composition is harder than the zero buckled spectrum because neutrons which leak at hi h energy are unavailable to provide the slowing down source to lower energies. 1 & -
@ The benchmark solutions against which the homogenized diffusion theory calculations were tested were obtained by Monte Carlo. An efficient method had been developed that yields Monte Carlo estimates of eigenvalue in an infinite uniform lattice as a function of buckling.15 The technique, derived by perturbation theory yields at a reasonable cost, essentially exact solutions for lattices even with very complicated unit cells. The expression for keff as a function of buck- ling can be written as
and is evaluated by Monte Carlo techniques. Here b is the lattice eigenvalue at zero buckling. The bar in Eq. 5 denotes an average over all neutron trajectories (histories): 2 is a vector drawn from the birth site of a fission neutron to the point where thzt neutron induces a next-generation fission. Birth sites are selected from the zero-buckling fission source distribution. The average in Eq. 5 is weighted by the number of next-generation neutrons produced when each history terminates, multiplied by the adjoint source distribution S3. Thus if a history terminates with a capture, that history will not contribute to the indi- cated average.
The cosine term in the right member of Eq. 5 can be expressed as a power series, which in the limit of small buckling, produces an extension of the homogeneous theory results, Eq. 4, to the heterogeneous case,
The VIM Monte Carlo code was vC ~d to perform the zero-buckling infinite- lattice calculation yielding &, broad-~rsup cross sections, reaction rates, etc. During the VIM calculation, a site tape Tias written containing birth and death coordinates of each neutron and its fission weight at death. A utility code then evaluated Eqs. 5 and 6 using the site tape, to provide the benchmarking leakage indicators at high and low buckling*.
IV. Asymptotic Homogeneous Cases
Homogeneous compositions were treated first to test the basic cross section processing in the codes, independent of the 3D + lD modeling aspect of homo- genization. The nonleakage test calculations were based on an LMFBR composition, were done in 1975, and were based on ENDF/B-111 data. The leakage test calcula- tions were based on a GCFR composition, were done in 1976, and were based on ENDF-IV data.
a A. Zero Leakage Tests; LMFBR Composition
In the first comparison, the zero leakage slowing down equations were solved for the homogenized LMFBR cell composition by VIM, MC'-11, and SDX using ENDF/B-111 data.** The composition is shown in Table I. MC'-11 produced two results -- one using the NRAt and the other using the "exact" RABANL hyper-fine group method in the resolved range.
Table VII shows the results for several integral parameters, and Table VIII shows the isotopic absorption fractions. It is seen that overall, excellent agreement is obtained between the three codes; k,, agrees to four significant figures, and generally agreement on integral parameters is to a percent or better. Though not shown on the tables presented here, it was shown that the cell average neutron spectra agree excellently except in the resolved resonance range - where for this composition there is very little flux.
However, several discrepancies may be identified in the tables. While SDX agrees with MC' on c8/f9, both of them are low relative to VIM.tt This stems from a problem in the VIM treatment of unresolved 2 3 8 ~ capture in the * ENDF/B-111 VIM library: linear - linear interpolation was used on an energy mesh which was coarse enough such that it produced errors relative to log linear interpolation for which the ENDF data were generated. This problem has been
*Subsequent to the validation work described here, a "correlation correction" to Eq. 5 for the case of A, was identified.16,17 This correction, which is
L related to neglecting the effect of buckling on the source shape used in evaluating Eq. 5, was shown in Ref. 16 to have negligible impact on the validation results discussed here.
**Prael and Henryson produced the VIM and MC2-11 results.18 TNRA refers to "Narrow Resonance Approximation". See the description of MC'-11 methods in Appendix A.
ttc8/f9 refers to the ratio of capture rate per atom in 2 3 8 ~ to the fission rate per atom in 2 3 9 ~ ~ .
corrected in the Version IV VLM library. Besides the discrepancy on 2 3 8 ~ capture, MC'-11 and SDX overpredict absorption in structurals (Cr and Fe) because of a failure to self shield their capture resonances. (Only heavy isotopes were treated as resonance absorbers in MC'-11 and SDX for this test.) This affects the neutron balance only slightly;
Table IX compares 2 3 8 ~ capture cross sections produced by the three codes. 'Two MC2-11 solutions are shown: One using the rigorous RABANL "hyper fine group" calculation and the other using the NRA. The use of the NRA below about 750 eV introduces substantial errors in the 2 3 8 ~ capture cross section when compared a ainst VIM or the rigorous form of MC2-11. However, less than 5 percent of 23$ capture takes place below 750 eV in the spectrum of current LMFBR' s .
The net result of the zero leakage, homogeneous comparison was to demonstrate excellent overall agreement between VIM and MC2-II/SDX. The reasons
@ for the existing discrepancies were identified (and were subsequently corrected or minimized).
B. Non-Zero Leakage Tests: GCFR Composition
The homogeneous, nonzero leakage tests were made in 1976. The last column in Table I shows the homogenized cell number densities for the GCFR unit cell for which the homogeneous test case was run. All calculations employed ENDFIB-IV basic nuclear data. Comparisons were run at both low and high buckling; for low buckling, the mean squared cord length from birth to fission F, was used as the parameter for comparison; for high buckling, the parameter Ak = (k, - k(B)) was used.
(1) Small Buckling - was generated for the homogeneous composition by both the VIM and the MC'-II~SDX procedures. The VIM results were based on 30,000 neutron histories. The 27 broad group cross sections used in the dif- fusion theory calculations were obtained by collapsing an unbuckled (B' = 0) 156 group spectrum computed by SDX. utr was collapsed using an inconsistent PI ($/Ctr) weighting. The SDX calculation employed a base library generated @ by MC2-11 by collapsing an unbuckled Q2000 group spectrum computed as the solu- tion of the consistent PI equations.
The results sununarized in Table X show that the diffusion theory procedure underpredicts the mean square cord length, 3, by 1.27% (two standard deviations from the VIM result). A 1.27% underprediction of translates into an eigenvalue overprediction of %0.5% Ak in a GCFR core for which the core leakage probability is ~30%.
To supplement the leakage probability in•’ ormation, (F) , the k, and several spectral indexes were also compared. The results are shown in Table X. The eigenvalues and f8/f9 ratio agree to within the Monte Carlo Carlo lo statistics. Relative to VIM the diffusion theory procedure under- predicts c8/f9 by 0.5% (two standard deviations from the VIM result). This
discrepancy has been noted in the previous section for the zero leakage com- parisons (using Version I11 data) of VIM and Mc2-II/SDX. It is due to dif- ferent ways of treating 2 3 8 ~ capture in VIM and MC2-11, and the deviation is much smaller for the Version IV libraries of VIM and Mc2-11 than it was for the Version I11 libraries.
A number of sensitivity studies were made on the homogeneous model to assess the impact of alternate options in the MC2-11 and SDX cross section collapse codes. Specifically, the B1 and PI options of MC2-11 were used in both their consistent and inconsistent (energy loss upon PI scatter is neglected) forms. The results are summarized in Table XI.
a. roundoff in the MC2-11 edit of k leads to *0.4% un- certainty in 7 ; Cases 2 and 3, which should have identi- cal 7 basically do;
a b. any error in 7 due to the MC2-11 "inconsistent ap roximation % is masked by the roundoff; i.e. the difference in 1 between Cases 3 and 4 is not much larger than 0.4%
c. apparent discrepancies in 'jiZ from Mc2-11 CP1 vs. Monte Carlo is -2.6% which translates to approximately -0.0093 in Ak. There is uncertainty in 7; 0.7% for lo Monte Carlo sta- tistics and for 0.4% for Mc2-11 roundoff. The error, which is still outside statistics, may stem from neglect of Pn n > 1 scattering in MC2-11.
d. Cross section collapse to 27 groups for Cases 2-4 was done with zero buckling and used Mc2-11 only. Cases 5-8 involve an MC~-11 cross section collapse to a 156 group library followed by an SDX collapse to a 27 group library. Then 27 group diffusion theory calculations for buckling at and near zero determined 7. In the last three cases the cross section collapse was done with a buckling near 8.1 x 10'~.
e. The standard procedure in fast criticals analysis is IP1 collapse in both the MC2-11 and SDX codes. None of the cases exactly matches this approach, but we estimate 'ji2 would be 1.3004 based on reducing the Case 5 value by the difference between 7 in Cases 6 vs. 7.
f. The estimated 7 = 3004 from Mc2-II/SDX IP1 differs from the direct MC2-11 value (Case 3) by 1.6%, which is much larger than roundoff can account for. The difference translates to a difference of 1.0.006 in Ak.
An important point obtained from Table XI is that the MC2-11 value of 3 is not exactly preserved by the MC2-II/SDX two-stage cross section
collapse. Even though the IPl approximation is used throughout, the leakage from MC~/SDX is larger than from MC~-11. This could stem from the fact that for direct Mc2-11 collapse to 27 groups, a current weighting of Utr is used, while for the MC2-II/SDX path the following sequence occurs:
a. MC2-11 current weighting of utr for the nonresonance isotopes and of usmooth for the resonance isotopes is done to produce the %I56 group SDX base library;
b. the resonance isotope ua component to utr is calculated in SDX and added to usmoot. to produce a 156 group utr for the resonance isotopes, and
c. an approximate SDX current weighting j 2 9/Etr is used to collapse the isotopic atrls to a broad group level.
(2) Large Buckling -- Leakage for a homogeneous model at a high buckling was compared between VIM and Mc2-11 for the composition shown on Table XII. Here, unlike in the limit of zero buckling, a theoretical difference exists between the B1 and PI leakage rates. Table XI11 shows the results where Ak = (k, - k (B)) is used to isolate the leakage component of the eigenvalue.
a. Consistent B1, the most rigorous Mc2-11 option available, is underpredicting leakage relative to VIM by 1.07% of its value
which is three standard deviations of the VIM result.
b. Alternately, the less exact option, inconsistent P1, is in agreement within statistics due apparently to a cancella- tion of errors.
Among the possible sources of the CB1 Ak error is inadequate repre- sentation of anisotropy in the scattering. This could be remedied by solving higher order Bn equations (allowing higher modes of anisotropic scattering). This option has not yet been explored.
It was found in stud in the large buckling case that broad group t; & non-leakage parameters (fZ8/f4', c2 /f ', keff, etc.) were non-negligibly mispredicted if an unbuckled SDX fine group spectrum were used to collapse to the broad group cross sections.* Thus in all subsequent work, pains were taken to use a SDX collapsing spectrum which is buckled to the degree expected to be encountered in the subsequent broad group calculations.
*Alternately, the broad group results were found to be insensitive to the buck- ling used in the MC2-11 2000 group calculation which produced the SDX $200 group library.
In sununary, the results of the homogeneous leakage probability tests showed that:
(a) at low buckling the MC2-IIISDX codes when run is their usual (inconsistent PI) mode, underpredicted Ak due to leakage by %1% of its value.
(b) While at high buckling the most rigorous form of MC2-11 (consistent B1) underpredicts Ak due to leakage by %I% of
. its value, when run in the inconsistent P1 mode, MC2-11 computes a leakage probability in agreement with Monte Carlo.
(c) Finally, the MC2-II/SDX path yields a slightly different leakage probability than the MC2-11 path alone.
The MC~-II/SDX errors are small, affecting eigenvalues by %0.5% Ak. However they are not negligible. None-the-less it was decided to move on and investigate the heterogeneous case before pressing to further reduce leakage pro- bability errors in the basic MC2-II/SDX algorithms.
V. Asymptotic, Heterogeneous Plate-Cell Lattices
Upon completion of the homogeneous tests, the treatment of heterogeneous cells was undertaken. First a study was made of a true lD slab cell with zero leakage. This test, based on an LMFBR cell, again avoided the 3D + 1D modeling aspect of homogenization and simply addressed the accuracy of the MC2-IIISDX treatment of the intra cell cross sections and flux solution. This is described in Section A, below.
Next, the 3D + ID modeling question was addressed for a GCFR plate cell by comparing Monte Carlo solutions of the 3D cell with Monte Carlo solutions of slab cells constructed according to the 3D + lD modeling prescriptions described in Section 11-D and Appendix B. Both leakage and non-leakage aspects of the model- ing were examined. It was found that both the "reference" and the "pure void" 3D + lD modeling prescriptions described in Section 11-D would adequately pre- serve non-leakage properties of the cell. However, it was found that if void regions existed in the 3D cell, they had to be maintained as true voids in the ID model in order to preserve leakage properties. This latter requirement rules out the use of the BENOIST anisotropic diffusion method for plate cells contain- ing true void, though for non-void cases, the BENOIST method could still be considered. The 3D + 1D modeling tests are described in Section B below.
Based on the above information, two tests were made of the full 3D + lD modeling, Mc2-II~SDX, and anisotropic diffusion coefficient cell homogenization path for plate cells. The first case (discussed in Section C) tested MC2-II/SDX and the BENOIST method for a slab cell containing no true void. The second (discussed in Section D) tested the MC2-II/SDX and GELBARD method for slab cells containing true void. The GCFR cell was used in both cases, and both low and high bucklings were considered. In all cases, Monte Carlo provided the standard of comparison and ENDFIB-IV data were used.
" i t ( ' e p b : t s v l "31?
A. Zero Leakage, True 1D LMFBR Plate Cell
This set of tests were made in 1975 and employed ENDFIB-111 data. The model of the unit cell represented an infinite array of infinite slabs of the composition and thicknesses of the LMFBR unit cell shown in Fig. 1. VIM pro- vided the reference solution. MC~-II was run in the inconsistent P1 mode at zero buckling to provide a 156 group base library for SDX. SDX generated an intra- cell flux distribution and an unbuckled fine group spectrum which was used to collapse to a 27 group cell averaged cross section set. This was then used in a zero leakage 1D diffusion calculation of a homogeneous composition having the cell-averaged number densities.
Table XIV shows the results for several integral arameters: The eigenvalue, and the cell-average 2 3 % ~ absorption/fission ratio, 238U to 239~u fission ratio, and 239~u fission cross section agree to within the VIM statistics. As in the homogeneous case, a disagreement exists in 2 3 8 ~ capture. * Table XV shows that the SDX and VIM cell-integrated spectra agree within statistics down to the resolved resonance range.
Table XVI shows a comparison of isotopic absorption fractions: Good overall agreement is obtained. The 2 3 8 ~ problem is seen, as in the homogeneous case. As in the homogeneous case, SDX overpredicts structural absorption due to the neglect of capture resonance self-shielding for materials of mass <loo. However, only %6% of cell absorptions occur in structurals. Though not shown in the table, when normalized to equal absorptions, total fission production, capture and fission all agree to better than 0.250%.
Table XVII shows the VIM and SDX cell-averaged cross sections for 2 3 8 ~ fission and capture. 2 3 8 ~ fission agrees within statistics except in the high MeV region. 2 3 8 ~ capture is low relative to VIM; - in the unresolved range, it is due mostly to the VIM interpolation problem; in the resolved range it is the combination of the NRA and equivalence theory used in SDX.
The comparison of VIM and SDX shows that overall SDX is producing an accurate solution for a true lD slab heterogeneous cell problem at zero leakage. Several discrepancies are seen which are common to the homogeneous and heterogeneous models. However, the tests have not addressed the non-ledcage probability aspects of the SDX homogenized cross sections or the 3D -+ 1D modeling of the 3D cells. These aspects are discussed next.
B. Monte Carlo Studies of Nonleakage and Leakage Aspects of 3D -+ 1D Modeling
To examine the implications of the relocation of structural material from the cell periphery into the slab regions of a one dimensional model, the 3D +ID modeling was performed to generate lD slab VIM models for comparison with the exact 3D VIM model. The GCFR cell served as the model, and ENDFIB-I11 data were used. Both the "reference modeling" (placing structure from the cell peri- meter in all non-resonance material slabs - including voids) and the "pure void
modeling" (placing structure from the cell perimeter in slab regions excluding resonance material regions and void regions) were examined. The selection of the GCFR model emphasized anisotropic diffusion effects, since as shown in Fig. 2, the cell contains void slots comprising *55 v/o of the cell. The results are shown in Table XVIII.
(1) Nonleakage Parameters; Reference and Pure Void Modeling - The first column of Table XVIII shows that either one of the two modeling prescriptions adequately preserves k. Comparisons of other reaction rate related parameters showed similar agreement and confirmed the conclusions of earlier studies14 that the 3D + 1D modeling relocation of structural material is adequate for nonleakage parameters.
With the demonstration from the previous section that the Mc2-II/SDX homogenization reproduces the VIM results for a ID cell, it may be concluded that the 3D + lD modeling followed by the Mc2-II/SDX homogenization will reproduce the nonleakage parameters of a 3D cell.
(2) Leakage Parameters; Adequacy of 1D Modeling - In the case of leakage properties, the modeling considerations are different. For example, the assembly structure in the xIy planes is different from the structure in the x-z planes. (See Figs. 1 or 2 for coordinate orientations.) The streaming path in the void plane (y-z) is interrupted in the z direction only by the drawer fronts and backs, while in the y direction the stainless-steel matrix structure has a ten-fold larger optical thickness. Thus, the streaming is direction dependent within the void plane. Since no one-dimensional model can account for this difference, it had to be verified that the structural differences do not lead to large differences between y and z leakages. This was confirmed by com- putin * A and A with the three-dimensional model by Monte Carlo: Ay = 8.2935 f 0.8023 and A, = 0.2974 f 0.0024. The two values agree to within one-sigma uncertainties. The expected values of ky and kz differ by 0.0027.
The relatively small difference between y and z leakages suggests that a one-dimensional modeling approach can be acceptably accurate.
(3) Leakage Parameters; Reference 1D Modeling - In row 2 of Table XVIII, results are shown for the "reference" 3D + 1D modeling procedure. It may be seen that leakage perpendicular to the plates is modeled adequately. How- ever, the reference one-dimensional model prediction of leakage parallel to the plates is not good, as shown by the values of TI and A I I. The error in
, I A1 I translates to an error of 0.0123 in kl 1 . 4; A I I error leads to the
I I I I 1 I
degree of anisotropy, A1 I /A 1 , being underestimated by 3.2%. The AEO values, I 1 I
-
which involve leakage both parallel to and perpendicular to the void slots, differ by more than one standard deviation from the three-dimensional Monte Carlo result.
,
Because of the serious leakage underprediction in the void planes, the "reference" one-dimensional modeling is considered unacceptable for the case at hand.
*See Eq. 5 and Table VI for notation.
(4) Leakage Parameters; Pure Void 1D Modeling - It is natural to sus- uect that the smearing of structural material from the periphery of the three- himensional unit cell-into the void slots of the one-dimensional cell model is responsible for the underprediction of streaming with the reference one-dimensional model. Other three- to one-dimensional unit cell modeling prescriptions were examined, and it was found that best results are obtained when no structural material is included in the one-dimensional void slot regions. The procedure for constructing the alternate, "pure-void" one-dimensional model from the three- dimensional cell is identical to the reference procedure except that the extra stainless steel is excluded from the void regions of the original 3D cell as well as from the resonance-isotope-bearing regions.
Monte Carlo results using the "pure-void" one-dimensional model are shown in row 3 of Table XVIII, where they are compared to the three-dimensional model standard. The leakage parameters for the x direction, q, and Al are
L L predicted to within one standard deviation of the expected three-dimensional values. The complete absence of material in the void regions makes ql infinite so that
I I no comparisons can be made; A,, on the other hand, remains finite and in good
I I
agreement with the 3D value. The A1 I discrepancy is much less than one standard I I
deviation, and the one-dimensional k t , is 1.0140 2 0.0041 compared to the limit- I I
ing three-dimensional values: $ = 1.0122 2 0.0037 and kZ = 1.0095 e 0.0037.
The anisotropy measure. A 1 1 /A 1 , s computed to well within the one-sigma I 1 L
uncertainty. Thus, the pure-void one-dimensional model adequately preserves the important leakage properties of the true three-dimensional unit cell.
C. Benoist Diffusion Coefficient Method for a 1D Slab Cell Containing No True Void Regions
A direct consequence of the requirement to maintain true void slab regions in the 1D model of the GCFR in order to preserve leakage properties rules out the use of Benoist diffusion coefficients for that case, since as can be seen from Eq. 1, the Benoist D becomes undefined if any region has zero Ct . Despite the failure of the "reference" modeling to represent the GCFR unit ceh adequately where totally voided regions exist, the accuracy of Benoist anisotropic diffusion leakage predictions for a one-dimensional model having low-density material in some regions is still of considerable practical interest for other problems (e.g., partial sodium voiding in LMFBRs and steam entry in GCFRs). Therefore, it was important to assess the degree of error incurred when the Benoist method is used in systems where low-density (but not complete void) streaming paths exist. For this reason the performance of the Benoist method for the "reference" GCFR one-dimensional model at both low and high buckling was examined.
Monte Carlo, Benoist diffusion theory, and conventional (D = 1/3Ct ) diffusion theory results using the "reference" one-dimensional model and ENDE/B-IV data are compared in Table XIX. The diffusion theory value of k, is very accurate. This reinforces results from earlier phases of the validation effort.
Table X I X shows t h a t both conventional and Benoist d i f fus ion theory chord- length predict ions a r e too low. Recal l t h a t i n the homogeneous va l ida t ion work, approximations i n t he MC~/SDX processing were observed t o r e s u l t i n a 1.27% under- predict ion of p. This same e r ro r is occurring i n the d i f fus ion theory r e s u l t s here and i n subsequent work has been shown t o account f o r a l a rge frac- 2-r t i o n of the P, er ror .
A s expected, the Benoist method r e s u l t s a r e a major improvement over those obtained by conventional di f fusion theory. It is he lpfu l t o examine t he performance of t he Benoist method a t low buckling i n terms of p red ic t ing the leakage component of keff. With B~ = 2 x 10'~ c 1 8 , t he e r ro r i n icm - k i s -0.0004
and i n k, - 1 k l l is -0.0002, where the leakage components, k, - k, a r e %0.015.
View in t h i s perspective, the Benoist method is seen t o be s u f f i c i e n t l y ac- cura te a t low buckling.
The fou r th and f i f t h columns of Table X I X show r e s u l t s a t high buckling. The Benoist method now seems t o overpredict streaming i n t he low-density planes and still underpredicts leakage perpendicular t o the pla tes . (The e r rors , how- ever, a r e only 1.1-112 Monte Carlo standard deviations.) There is a g rea t e r over- predict ion of anisotropy a t high buckling than a t low buckling.
The Benoist method could be expected t o overpredict leakage a t high buckling because t he der iva t ion involves a Taylor series expansion in buckling, neglecting terms of order B ~ . The r e s u l t s seen here support t h i s expectation.
When considered separate ly , t h e e r r o r s i n the leakage components of both k l and k l l a r e j u s t on the border l ine of acceptabi l i ty . Since the e r r o r s a r e I I I
of opposite s ign, however, a degree of cance l la t ion occurs when a buckling vector having components i n both I I and 1 d i r ec t i ons is considered. This i s shown i n the l a s t column of Table XIX, where k, - kEq is displayed. Here, a s a r e s u l t of p a r t i a l l y compensating e r rors , the Benoist r e s u l t is of high accuracy.
For p r a c t i c a l ca lcu la t ions involving no planar s l o t s of t r u e void, the r e s u l t s of t he study show t h a t the Benoist method could be expected t o produce eigenvalues with e r r o r s ranging from a few ten ths of a percent t o f0.5%, de- pending on whether t he leakage i s mostly I I t o o r 1 t o the low-density s lo t s . The e r r o r s apparently stem from a t l e a s t two sources - a carryover of t he
underprediction from the homogeneous case which is a t t r i b u t a b l e t o the MC~-II/SDX otr generation and a tendency to overpredict leakage a t high buckling which is common t o a l l P1 d i f fu s ion methods.
D. Gelbard Diffusion Coefficient Method f o r a I D Slab C e l l Containing Regions of True Void
The Monte Carlo comparisons of 3D and 1 D c e l l ca lcu la t ions showed t h a t void regions must be maintained i n the 3D + 1 D modeling i f leakage r a t e s a r e t o be preserved. However, Benoist D ' s become undefined f o r a s lab c e l l containing pure void regions. This, coupled with t he increasing e r r o r i n t he Benoist method with increasingly high buckling l ed Gelbard t o the development10 of a modified an iso t rop ic d i f fu s ion coe f f i c i en t prescr ipt ion.
This method was tested for the "pure void" lD slab model of the GCFR at both low and high buckling. Results are presented in Table XX. The ENDFIB-IV cross sections were used. The infinite multiplication factor, k, though ap- parently less accurately predicted than it was in previous comparisons is still within statistics.
The alternate diffusion theory method is seen to underpredict leakage at low buckling. The error is only slightly outside the Monte Carlo standard deviation, and the errors in k,- k are similar in sign and magnitude to the Benoist low buckling errors. The accuracy is acceptable and in sharp contrast to the very poor predictions of conventional diffusion theory. Since the alternate method goes over to the Benoist method at low buckling, the similar results are expected. Furthermore, both the Benoist and alternate methods rely on SDX- generated transport or total cross sections, which in the homogeneous model yields a value of which is 1.27% low.
Leakage appears to be underpredicted by the Gelbard coefficients at high buckling by upwards of 1% of its value. The L. - tl 1 and L. - kEg are hl-112 standard deviations low which are on the verge of b&g within statistics. Though not completely satisfactory, these results are a substantial improvement over the conventional diffusion theory solution. Anisotropy, as measured by A1 ,/AI,
I I L is well predicted, being 0.4% low and well within one standard deviation of the Monte Carlo value.
It may be noted here that the overprediction of leakage at high buck- ling which was found both in the homogeneous case and in the heterogeneous case using Benoist diffusion coefficients has been eliminated by the Gelbard method which in its derivation retains the higher order buckling contributions to the dif- fusion coefficient.
The anisotropic diffusion coefficients in the alternate formulation are a function of buckling. The coefficients depend on the direction as well as the magnitude of the buckling vector used to evaluate Eq. 2. Because in full-core problems the buckling may not be accurately known a pr ior i , it is important that the eigenvalue be insensitive to the buckling used in computing the coefficients with Eq. 2. An indication of the sensitivity is given in Table XXI, which shows k~~ as a function of the buckling vector used in Eq. 2. All the diffusion theory calculations listed in Table XXI had a leakage of:
The first three columns show the buckling used in Eq. 2 to generate the values of D. It can be seen that only a modest error in kEQ results when the direction of B is incorrect in the generation of the D's. The last row demonstrates that the eigenvalue error can be substantial if an error in the amplitude of B used in the generation of D's is sufficiently large. However, this 43% error in B~ is much larger than would be expected for the asymptotic region of a critical assembly. The buckling dependence of the anisotropic diffusion coefficients is sufficiently weak to allow accurate calculations for the asymptotic regions of a system.
E. Summary of the Plate Cell Results
The sequence of tests described above has shown that in the asymptotic case, the 3D + 1D modeling of ZPR plate type cells followed by a MC~-II/SDX unit cell homogenization of cell average cross sections and a BENOIST or GELBARD method generation of anisotropic diffusion coefficients will yield broad group
@ diffusion theory group constants which accurately conserve the reaction rates and directional leakage rates given by a Monte Carlo solution of the original 3D cell.
If the original cell contained void columns, it is necessary to use the '"pure void" 3D + 1D modeling and to use the Gelbard diffusion coefficients. If the original cell contained no void columns, the "reference" modeling and the Benoist diffusion coefficients are sufficient though there is a tendency to over- predict leakage at high buckling. In either case the reference modeling is used in connection with the SDX code to yield the cell average cross sections.
The Gelbard diffusion coefficients have the advantage that in the case of high leakage rates (buckling) found in fast reactors, a transport correction is automatically included which tends to eliminate the traditional diffusion theory overprediction (relative to transport theory) of leakage.
VI. Asymptotic, Heterogeneous Pin Calandria Cell Lattices
After completing the plate unit cell homogenization validation, the pin cal- andria case was considered. This was done in 1977 and used ENDFIB-IV basic data files. The unit cell loading selected for the study of pin geometry consisted of a 2 x 2 x 12 in. voided calandria loaded with a 4 x 4 array of 318 in. dia- meter by 6 in. mixed oxide rods (15% Pu02/U02). Figure 3 shows the dimensions of the calandria unit cell. The atom densities of the 1D model are given in Table IV.
This three dimensional calandria unit cell was modeled in full detail for the reference VIM Monte Carlo calculations. For the SDX calculation, the "reference" 3D + 1D modeling of the pin cell was used. As was described in detail in Appendix B, this modeling retains the diameter and composition of the fuel-bearing pin and smears all structure into a remaining annulus around the pin.
Table XXII shows the results of the VIM versus Mc2-II/SDX reaction rate com- parison at zero leakage. It is clear that the combination of the "referencet' 3D + lD modeling and Mc2-II/SDX cell homogenization produce unit cell average reaction rates in excellent agreement with the true 3D pin calandria result. (A separate comparison not displayed here showed excellent agreement between VIM and MC~-IIISDX solutions of an infinite one-pin unit cell -- there- fore the agreement displayed in Table XXII is not a result of a fortuitous cancel- lation of 3D + 1D modeling and Mc2-II/SDX errors).
The last row of Table XXII shows that in opposition to the excellent agree- ment in nonleakage probabilities, the use of the SDX-produced conventional dif- fusion coefficient (D = 113 Ctr) leads to a misprediction of leakage in the limit of zero B ~ .
Thus, Benoist and Gelbard diffusion coefficients were tested for the voided pin calandria. Benoist coefficients were generated using the "reference" lD model. Gelbard coefficients were generated using the "true void" 1D model. The results in both cases were tested against the VIM result for the 3D pin calandria at both low and high buckling. The results are shown in Table XXIII (for high buckling) and Table XXIV for low buckling.
At high buckling, the results of Table XXIII show that the use of Benoist D's consistently (and significantly) underpredicts the Ak/k due to leakage. Al- ternately the use of Gelbard D's generated using the true void one dimensional modeling greatly improves the agreement. In each case, the Ak/k obtained with Gelbard D's is well within VIM statistics.
A number of buckling combinations were considered for the low buckling system. Gelbard diffusion coefficient multipliers were recomputed for each of these sys- tems using the SDX cross sections which were generated with zero buckling. Benoist diffusion coefficients were obtained with the B~ = 0.0 SDX cross sections and the reference one dimensional model. The results are compared in Table XXIV with the results of the VIM calculations.
As noted with the high buckling systems, the 6k due to leakage is underpre- a dicted with the Benoist method. In this case, however, the effect is small and, although the bias (relative to VIM) is larger than the Monte Carlo uncertainties, the overall impact on calculated eigenvalue is not significant. The Benoist dif- fusion coefficients indicate an axial-to-radial asymmetry of 1.013, as compared to 1.047 (f1.7%) from the VIM calculation.
The results given in Table XXIV for the SDXIGELBARD methods at low buckling show that they consistently overpredict the 6k due to leakage. The bias rela- tive to the VIM calculation is comparable in magnitude to the bias obtained with the Benoist method. It produces an insignificant overall impact on the calculated eigenvalue. The Gelbard diffusion coefficients indicate an axial- to radial asymmetry of 1.074, which is 2.6% high relative to VIM.
For systems at low buckling the use of either Benoist or Gelbard diffusion coefficients provides sufficiently accurate results which are a considerable improvement over conventional diffusion theory.
VII. Conclusions and Discussion of Current Activities
The validation tests on ZPR critical assembly plate and pin calandria unit cell homogenization described above have relied on the availability of high- precision Monte Carlo solutions of.unit cell problems with fully-detailed three dimensional geometry and pointwise representation of the ENDFIB neutron cross sections. The 3D + 1D modeling prescriptions followed by the MC~-II/SDX unit cell homogenization followed by the Benoist or the Gelbard anisotropic diffusion coefficient generation which are currently used in ZPR fast criticals experiments analyses have been shown in these tests to be highly accurate. The result of these validation tests has been to foster a high degree of confidence in the correct- ness of methods and codes for predicting reaction and leakage rates in plate and pin calandria unit cells located in an asymptotic spectrum. It is our belief therefore, that for those cases which satisfy the above conditions, experimentall calculational discrepancies can be attributed to either experiment or basic nuc- lear data, but not to methods and codes.
The Monte Carlo-based validation of calculational aspects of fast critical experiment analysis is currently being extended in a number of areas. We briefly discuss the work in progress below.
A. Epithermal Effects: Asymptotic, Steam-Flooded GCFR Lattices
For the 'MFBR and GCFR compositions, the flux in the 1.100 eV range is negligibly small, and errors associated with the use of the NRA contribute insigni- ficantly to the overall neutron balance. However, in the case of steam flooding of the GCFR cells - even at a density of 0.006 gm H20/cc - the epithermal reac- tion rates become non-negligible. Moreover, the introduction of steam into the coolant channels decreases the leakage probability as well. The calculation of the eigenvalue change upon steam entry involves the cancellation of a positive effect due to decreased leakage and a negative effect due to a decreased k, associated which higher neutron absorption for the softer spectrum.
Monte Carlo-based validation studies currently in progress have shown that by use of the RABANL option in SDX, the nonleakage component of the steam worth in asymptotic ZPR plate unit cell lattices can be very well modeled. The use of the "pure void" modeling procedure and the Gelbard diffusion coefficients permits an adequate calculation of the leakage effect. The remaining error in the leakage effect appears to be associated with the neglect of energy lose upon PI scattering events -- i.e., upon the inconsistent P1 assumption required for the diffusion theory form of slowing down equations solved by SDX. (This is a problem which can be corrected only by going to a Pn theory cell homogenization code.)
B. Non-Asymptotic Cases
The cases discussed above have all been directed at asymptotic situations where the cells are assumed imbedded in an infinite lattice of similar cells -- i.e., far from zone interfaces. Little systematic work has yet been done to test the ZPR modeling procedures where gross gradients in flux amplitude and/or spectrum occur across the unit cells.
Several preliminary results are more confusing than illuminating. In one case, an RZ model of a 1250 MWe LMFBR was computed by VIM and by diffusion theory using a 29 group set of cross sections generated using Mc2-11. The model had been used for an NEACRP benchmark comparison calculation19 and consisted of homogeneous inner core, outercore, blanket, and reflector regions. Both VIM and Mc2-11 made use of ENDFIB-IV data. Conventional diffusion coefficients were used in the diffusion theory calculation.
The agreement between the VIM and ~~~-11I~iffusion theory calcula- tions was quite good as shown in Table XXV. The eigenvalue was predicted within 0.0002 Ak by diffusion theory.
Alternately, Monte Carlo, diffusion theory, and s4/P0 transport theory calculations of a ZPR critical mockup of a single-zone LMFBR core sur- rounded by a depleted uranium blanket have produced discrepant eigenvalues. All calculations employed ENDFIB-IV data. The VIM calculation represented the ZPR critical configuration in explicit platewise detail. The RZ diffusion calculation was based on cell average cross sections and Celbard diffusion coefficients generated by the validated methods discussed above. The RZ S4/Po calculation was based on the same cross section set used in the diffusion calculation (but, of course, employed no representation of anisotropic properties of the cell-averaged composition such as is possible in the diffusion calculation using Gelbard D's). The computed eigenvalues are displayed in Table XXVI. Also shown in the table are a corresponding set of eigenvalues generated for a homogeneous RZ benchmark model of a hypothetical core of about the same size and composition as the criti- cal experiment.
While the results .in Table ItarI suggest a trend of Sn overprediction and diffusion theory underprediction of eigenvalue relative to a Monte Carlo standard, the trend is not supported by the results in Table XXV. A systematic examination of a sequence of simplified model problems is planned with an aim to isolate the nature and cause of the discrepancies.
C. Modeling of Detectors in Critical Experiments
Measurements of cell-average reaction rates in ZPR critical experiments are made by two methods. One method is to perform an intracell activation foil traverse using thin foils which are subsequently removed from the cell and counted. From the traverse, a numerical integration can be performed to produce the measured cell integrated reaction rate. The second method is to create a two-inch cubic cavity in the cell and to place in it a small gas flow fission counter so as to achieve an on-line sampling of the fission rate on the fission counter deposit. Capture foils irradiated in the cavity are counted off line to provide corres- ponding capture rates.
Diffusion theory modeling prescriptions for these experiments are in routine use for the ZPR critical experiment analysis. Monte Carlo-based valida- tion of the diffusion theory modeling has established the accuracy of the foil traverse modeling.20 However, Monte Carlo analyses of the cavity measurement modeling procedures21 indicate that the diffusion theory methods currently in use
overestimate the threshold fission rates (e.g., f 28, f 40) and underestimate the 2 3 8 ~ capture rate. A deeper understanding of the causes of these discrepancies and an improved procedure are under current investigation.
D. Worths and Bilinear Weighting
The goal of all the validation work discussed here has been to provide diffusion theory methods which preserve rigorous reaction rates and directional leakage rates. However, the cell-average multigroup cross sections produced to preserve reaction and leakage rates have traditionally been used as well for per- turbation theory worth and kinetics parameter (Beff, A, etc.) calculations.
It is known that for the preservation of reaction rates a flux weighting cell homogenization is required while bilinear weighting is required for the pre- servation of worths and kinetics parameters. Preliminary investigations have been made22 to assess the size of errors introduced in worth calculations by the use of cross sections generated by our flux weighting cell homogenization techni- ques. These studies lead to a tentative conclusion that only materials whose worth is dominated by a net downscatter component are seriously miscalculated using flux weighted cross sections. Additional work in this area is clearly desirable in view of the as-yet unknown origin of the central worth discrepancy* in the ENDFIB-based calculation of ZPR worth measurements. A search is currently in progress for a means of achieving a high precision Monte Carlo standard for material worth calculation^.^^ Until such a standard is available, validation work on diffusion theory worth calculations at the same level of detail as des- cribed above for reaction and leakages rates will be seriously hampered.
VIII. Acknowledgements
The results summarized above derive from the work of the staff of the Applied Physics Division at ANL over a period of about four years. E. Gelbard, H. Henryson 11, R. McKnight, R. Prael, R. Schaefer, and D. Wade have participated in the validation work. The development and coding of the ETOE-11, MC~-11, SDX, and VIM codes have been the responsibility of H. Henryson 11, E. Gelbard, R. Prael, C. Stenberg, B. Toppel, R. Hwang, and L. Milton. In many cases, this summary paper draws verbatum from the original reports of the above individuals. It is a pleasure to acknowledge many helpful discussions with M. Lineberry, C. Beck, and P. Collins throughout the course of the work. The author is grateful to the editors of Nuclear Science and Engineering for permission to reproduce results from Ref. 10. The work was supported by the U.S. ERDA and U.S. DOE.
*The worths of fissile isotopes are traditionally overpredicted by 15 to 20% when ZPR measurements are calculated using ENDFIB-based cross sections.
IX. References
1. B. J. Toppel, H. Henryson 11, and C. A. Stenberg, "ETOE-II/MC~-~/SDX Multigroup Cross Section Processing," RSIC Seminar Workshop on Multi- group Cross Sections, ORNL, March 14, 1978.
2. H. Henryson, 11, B. J. Toppel, and C. G. Stenberg, "MC~-11 A Code to Calculate Fast Neutron Spectra and Multigroup Cross Sections," ANL-8144 (ENDF 239), (June 1976).
3. W. M. Stacey, et al., "A New Space-Dependent Fast-Neutron Multigroup Cross-Section Preparation Capability," Trans. Am. Nucl. Soc., l5, 292 (1972).
4. W. M. Stacey, et al., "Studies of Methods for Fast Neutron Multigroup Cross Section Generation and Their Effect Upon the Neutronics Properties of LMFBR Critical Assemblies," CONF-720901, Proceedings of the ANS National Topical Meeting on New Developments in Reactor Physics and Shielding, Kiamesha Lake, N. Y. (1972).
5. G. DeSaussure and R. B. Perez, "POLLA, A Fortran Program to Convert R-Matrix-Type Multilevel Resonance Parameters for Fissile Nuclei into Equivalent Kupur-Peierls-Type Parameters,'' ORNL-TM-2599 (1969).
6. W. M. Stacey, Jr., "The Effect of Anisotropic Scattering Upon the Elastic Moderation of Fast Neutrons," Nucl. Sci. Eng., 44, 194 (1971).
7. W. M. Stacey, Jr., "Continuous Slowing-Down Theory Applied to Fast Reactor Assemblies," Nucl. Sci. Eng., 41, 381 (1970).
8. R. No Hwang, "Efficient Methods for the Treatment of Resonance Cross Sections," Nucl. Sci. Eng., 52, 157 (1973).
9. P. Benoist, "Streaming Effects and Collision Probabilities in Lattices," Nucl. Sci. Eng., 34, 285, (1968). -
10. E. M. Gelbard, et al., "Calculations of Void Streaming in the Argonne Gas-Cooled Fast Reactor Critical Experiments," Proc. ANS National Topical Meeting on Improved Methods for Analysis of Nuclear Systems, Tucson, Arizona, March 28-30, 1977 (published in Nucl. Sci. Eng., 64, p. 624, October 1977).
11. E. M. Gelbard, "Anisotropic Neutron Diffusion in Lattices of the Zero Power Plutonium Reactor Experiments," Nucl. Sci. Eng., 54, p. 327 (1974).
12. Po Kmler and J. Ligou, "Axial Neutron Streaming in Gas Cooled Fast Reactors," Nucl. Sci. Eng., 54, p. 357 (1974).
13. E. M. Gelbard and R. E. Prael, "Monte Carlo Work at Argonne National Laboratory," Proc. of NEACRP Meeting of a Monte Carlo Study Group, ANL-75-2, Argonne National Laboratory (1975).
14. D. C. Wade and E. M. Gelbard, "Neutron Streaming in Plate Criticals," Proc. of the ANS Topical Conference on Advanced Reactors; Physics, Design, and Economics, Atlanta, Georgia (September 1974).
15. E. M. Gelbard and R. Lell, "Anisotropic Diffusion in the Presence of Voids," Nucl. Sci. Eng., 63, 9 (1977).
16. E. M. Gelbard, "Lattice Eigenvalue as a Function of Buckling: Correc- tion to ~irst-order perturbation Theory," Trans. Am. Nucl. SOC., 27, 390 (1977).
17. E. M. Gelbard and R. P. Hughes, "Lattice Eigenvalue as a Function of Buckling: Correction to First Order Perturbation Theory," (submitted to Nucl. Sci. Eng.).
18. R. E. Prael and H. Henryson 11, "A Comparison of VIM and ~ ~ ~ - 1 1 -- Two Detailed Solutions of the Neutron Slowing Down Problem," Proc., Conference on Nuclear Cross Sections and Technology, Washington, D. C. (19751, and
R. E. Prael, "Cross Section Preparation for the Continuous Energy Monte Carlo Code, VIM," Proc., Conference on Nuclear Cross Sections and Tech- noloty, Washington, D. C. (1975).
19. L. G. LeSage, et al., "Assessment of Nuclear Data Files via Benchmark Calculations - A Preliminary Report on the NEACRP / IAEA International Comparison Calculation of a Large LMFBR," CONF-780401, Proc. of an ANS Topical Meeting, Gatlinburg, Tennessee, April 10-12, 1978.
20. D. C. Wade, M. J. Lineberry, and R. E. Prael, "Monte Carlo Analysis of ZPR Heterogeneity," Trans. Am. Nucl. Soc., 2l, p. 446, (June 1975).
21. R. Johnson, J. Morman, and D. C. Wade, "Heterogeneity Effects on Reaction Rates Measured in the Advanced Fuels Program Oxide Zone Assembly,'' (to be presented at ANS Winter Meeting, November 1978).
22. D. C. Wade and R. G. Bucher, "Conservation of the Adjoint by Use of Bilinear-Weighted Cross Sections and Its Effect on Fast Reactor Calcu- lations," Nucl. Sci. Eng., (October, 1977).
23. E. M. Gelbard, "Experience with Correlated Sampling in Perturbation Computations," Trans. Am. Nucl. Soc., 27, p. 373 (November 1977).
APPENDIX A: THE ETOE-?.I('), MC AND SDX(~,~) CODES
1. ETOE-I1 - The ETOE-I1 program performs six basic functions: 1) reformat data; 2) preprocess "light" element (A = 100) resonance cross sections; 3) screen and preprocess "wide" and "weak" resolved resonances; 4 ) generate ultra-fine- group "floor" cross sections; 5) calculate function tables; and 6) convert all ENDFIB formats to laws which are allowed by MC~-IIISDX.
At user option the ETOE-I1 code calculates resonance cross sections from ENDFIB resonance parameters for all materials of mass less than an input value. Generally a mass of 100 is used. These "light" element resonance cross sections are then combined with.the ENDFIB "floor" cross sections and integrated over ufg ener boundaries (Au 2 0.008) to provide the ufg cross sections required by MC -II/SDX. It is assumed that "light" element resonance cross sections are composition-independent on the ultra-fine-group level.
The ENDFIB formats permit a large number of options in describing the fundamental data but only a subset of the allowed ENDFIB laws are processed by MC2-II/SDX. The ETOE-I1 code processes data given by any of the other laws and prepares these data in a format permitted by MC~-II/SDX. For example, the MC2-II/SDX resolved resonance algorithms assume a single or multilevel Breit- Wigner or a multilevel Adler-Adler description whereas ENDFIB also permits R-Matrix (Reich-Moore) parameters. It is well known that equivalent multi- level Adler-Adler parameters may be derived from these models,' and these equivalent parameters are calculated by ETOE-11.
Since the library files generated by ETOE-I1 are not composition de- pendent, the program need be executed only when new fundamental data become available (e.g., each release of ENDFIB).
2. MC~-11 - Mc2-11 is an ultra fine (%2000) group, zero dimensional slowing down code which, for a given composition, is used to process the ETOE- produced library data into fine (%ZOO) group libraries for the ID cell homo- genization code, SDX. The M~~-II-~enerated SDX libraries exclude the resonance contributions to capture and fission cross sections. (This is the form of MC'-11 0 use which has been validated here.) Alternately, however, for cases which are truly homogeneous, MC2-11 can be used to directly collapse (in energy only) the ETOE-produced ENDFIB libraries to a set of broad group cross sections.
The MC2-11 code solves the neutron slowing-down equations in any of the PI, B1, consistent PI, and consistent B1 approximations and makes use of the extended transport approximation to account for high-order transport and anisotropic scattering effect^.^,' Both the continuous slowing down and multi- group forms of the slowing-down equations are solved using an ufg lethargy structure. The energy boundary between the multigroup and continuous slowing- down formulations is user-specified but must lie above the top of the resolved resonance energy region. This is a consequence of the resonance treatment dis- cussed below. The moderating parameters, in the continuous slowing-down formula- tion may be calculated using either Greuling-Goertzel or Improved Greuling- ~oertzel~ algorithms. Only elastic scattering is treated continuously in the
continuous slowing-down formulation. Inhomogeneous sources along with fission, inelastic and (n,2n) sources are represented in the ufg multigroup form.
The resolved and unresolved resonance calculations of MC2-11 are modeled after the work of wan^.^ ' The resonance algorithms make use of a generalized J*-integral formulation based on the narrow resonance approxima- tion including overlap effects. The J*-integral method provides an efficient means of accounting for resonance effects in the continuous slowing-down formu- lation. The equations are solved for the "asymptotic" neutron slowing-down density ignoring narrow resonances. Then the resonance reaction rates are com- puted using the flux resulting from the asymptotic slowing-down density attentu- ated by absorption in higher energy resonances. The ultra-fine-group flux derived from the attenuated slowing-down is then used in the generation of fine-group cross sections by flux weight group-collapsing methods. Current weighting col- lapse of o is used.
tr
Alternately, for a more rigorous treatment of resolved resonances, a hyper-fine-group (hfg) integral transport capability RABANL, is available at user option. The hfg width is defined to be small compared to the maximum lethargy gain on scattering by the heaviest isotope in the problem. Since hundreds of thousands of hfg may be involved, especially when including resonances of the spxctural materials which occur at tens or hundreds of keV, attention to al- gorithm efficiency was essential in order to permit RABANL to be used for routine calculations. One of the approaches taken was to have ETOE-I1 screen out and preprocess a significant number of the resolved resonances into composi- tion and temperature independent ufg "smooth" cross sections. Resolved resonances suitable for such screening can be characterized as belonging to one of two types. The first are the extremely wide resonances with natural widths much larger than both the corresponding Doppler width and the ufg width. The second type of resonance is typified by the extremely weak resonances belonging to the medium weight nuclei of low natural abundance, or the p-wave resonances of the heavy nuclei.
Options available in MC~-11 include inhomogeneous group-dependent sources, group-dependent buckling, buckling search to critical, and isotope- dependent fission spectrum distributions. The user-specified cross-section file generated by MC2-11 is appropriate for neutronics calculations (z50 groups) or for use in fine group (2200 groups) spectrum calculations. In parti- cular, MC~-11 is used to produce the fine group cross-section library which excludes the resonance contributions to absorption cross sections which is used in the SDX capability described next.
SDX - The SDX code is used for composition dependent unit cell homo- 3. - genization in space and energy. It treats slab or cylindrical geometry in one dimension, and is executed at the fine (*200) energy group level such that the energy detail is adequate to "trace out" the higher energy scattering resonances in intermediate mass nuclei.
The SDX calculation is designed to:
a. Treat the composition dependence of the resonance absorption cross sections on a plate-by-plate basis (heterogeneous resonance self shielding).
b. Account for the detailed spatial dependence of the flux within the unit cell on a fine group basis, for the purpose of spatial homogenization, and
c. Collapse cross sections over a cell average - fine group spectrum to a broad (*I0 to 30) group basis.
The calculation consists of four parts:
a. First, fine group cross sections are produced for each plate in the unit cell. For non resonance elements these are taken from the fine group library produced by MC'-11. For resonance elements the nonabsorption cross sections are taken from the fine group library while the fission and capture cross sections are given as a sum of the "floor" cross section from the smooth library and the resonance cross-section evaluated from the resonance parameters themselves.
The resonance calculation in SDX uses the same program modules as MC'-11. In particular, either the narrow resonance J*-integral treatment or the rigorous RABANL treatment may be used to provide the composition and temperature dependent resonance cross sections. In the went the narrow resonance approximation (NRA) is used, account is taken of all material in the plate and account is taken of all materials i n other plates within the unit cell by use of an equivalence principle. Alternately in the RABANL treatment, the plate and its environment is treated explicitly by a hyper fine group lD collision probability method.
Fine-group resonance cross-sections are calculated assuming a con- stant collision density per unit lethargy in SDX rather than by use of the at- tenuation treatment used in MC'-11. Thus the resonance algorithms employed in the SDX calculation combine a high degree of accuracy with modest computation time.
b. Given the plate-wise, fine group cross sections, the second step in SDX is to solve for the fine group flux by plate within the unit cell. This done in the CALHET module of SDX using a one dimensional integral transport method. Then, using the platewise values of number density and cross sections and the platewise flux obtained by CAL.HET, the cell averaged, fine group, iso- topic cross section, isotope self shielding factor, and cell averaged isotopic number densities, are evaluated. The isotopic self shielding factor accounts for the fact that the flux to which the isotope atoms are subjected equals the cell average flux only in the case where the atoms are uniformly distributed over the cell volume.
Steps a and b are repeated for each unit cell type present in the reactor of interest. This results in a set of fine-group cell-averaged values
f o r i so topic cross section, se l f shielding factor, and number density f o r each unit cel l .
c. Given the c e l l averaged data for each c e l l type, the one- dimensional, f i n e group diffusion theory module, SEFlD, i n SDX is used to generate a f i n e group spectrum over which the f i n e group product of isotopic c e l l average cross sect ion and se l f shielding fac tor is collapsed by f lux weighting to yield a broad group, cell-averaged cross section set. (Transport cross sections are collapsed using an approximate current-weighting: j(E) - O(E)/Ztr(E)). Two types of SEFlD calculation can be run:
i. A fundamental mode calculation in which it is assumed tha t a s ingle c e l l type i s imbedded i n a repeating array of s imilar ce l l s , (a c r i t i c a l buckling search is available), and
ii. A space dependent calculation i n which a one dimensional (2 o r R) model of the reactor is solved which may consist of one o r more c e l l types. Radial segments of the model a r e defined over which cross sections are t o be collapsed. In t h i s way, the influence of the environment on a uni t c e l l ' s spectrum can be accounted for i n generating the broad group cross section set.
d. After collapsing the c e l l averaged cross sections over the SEFlD spectrum, a f ina l , optional, step i n the SDX calculat ion is to collapse the plate-wise cross sections over the SEFD f lux spectrum obtained in Step c. The broad group p l a t e cross sections are f o r use i n generating broad group c e l l anisotropic diffusion coefficients.
APPENDIX B: 3D + 1D MODELING PRESCRIPTIONS FOR ZPR CELLS
The 3D + 1D modeling prescriptions which are in use for the ZPR cells and which have been validated are described below.
1. Pin-Calandria Cells - The pin calandria 3D + 1D modeling prescription for cell homogenization consists of the following steps:
a. for the purpose of the SDX calculation - to produce cell average cross sections - the pin calandria is modeled as a single fuel pin of physical radius and composition. This pin is surrounded by an annular diluent region, which has a volume equivalent to 1/16 the total non-fuel volume in the pin calandria unit cell and has a composition which comprises 1/16 of the non-fuel pin material in the pin calandria. In subsequent discussions this modeling will be called the "reference" modeling for pin cells.
This infinite, two region cylindrical cell is used in SDX to:
i. generate fine group resonance cross sections in the pin,
ii. then do a fine group spatial flux calculation in the cell using integral transport theory and a white boundary condi- tion,
iii. then collapse in space to produce fine group, flux, volume, number density weighted cell average isotopic cross sections.
The cell averaged cross sections are used with cell average number densities to calculate a fine group diffusion theory criticality buckled spectrum which is used to collapse in energy via a flux weight prescription to produce broad group cell average cross sections. (Not only are cell average cross sections generated, but fuel pin cross sections are as well to use in steps (b) and (c) below.)
This modeling retains the proper absorber to moderator atom ratios in the fuel rod and its surroundings for the generation of hetero- geneous resonance self shielded cross sections. It also retains the proper cell average atom concentrations for the spectrum calcu- lation.
b. This same modeling is used to generate the ID model to be used in generating the broad group Benoist anisotropic diffusion coeffi- cients according to Eq. 1. Alternately if the cell had been voided (as in a sodium voided LMFBR or a GCFR);
c. then, for the purposes of generating the broad group Gelbard aniso- tropic diffusion coefficients, the single pin cell of steps (a)
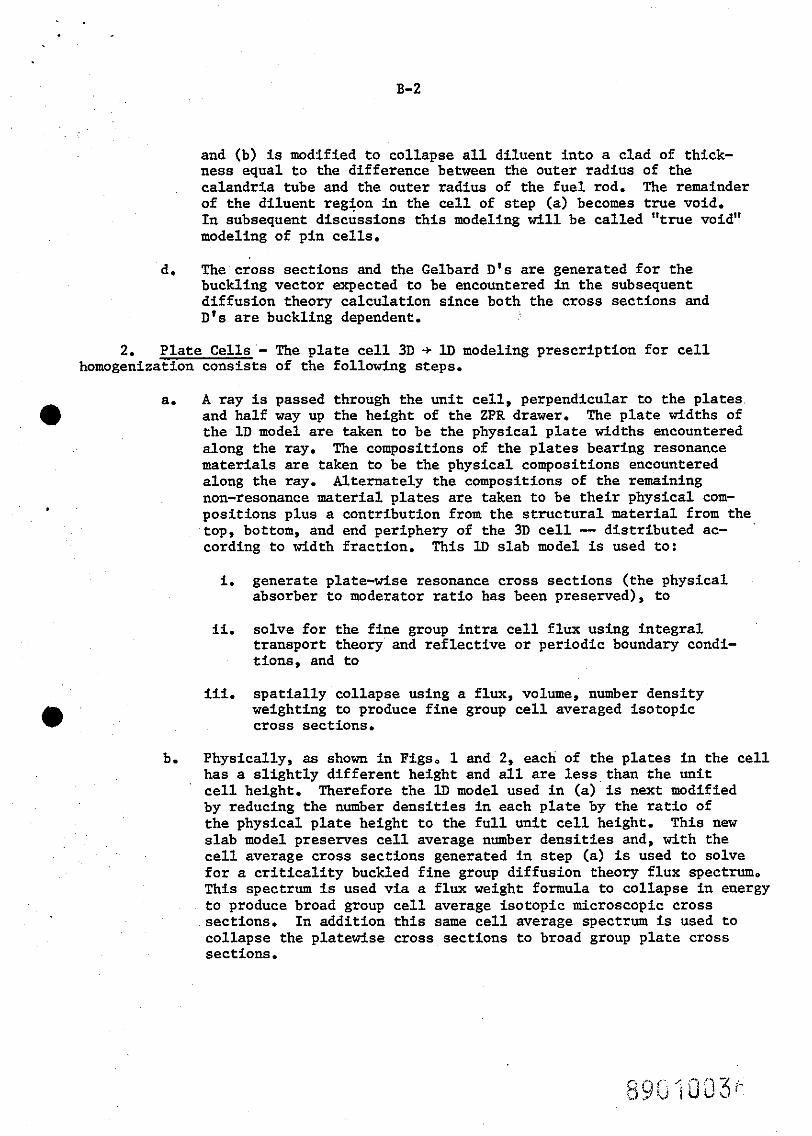
and (b) is modified to collapse all diluent into a clad of thick- ness equal to the difference between the outer radius of the calandria tube and the outer radius of the fuel rod. The remainder of the diluent region in the cell of step (a) becomes true void. In subsequent discussions this modeling will be called "true void" modeling of pin cells.
d. The cross sections and the Gelbard D's are generated for the buckling vector expected to be encountered in the subsequent diffusion theory calculation since both the cross sections and D's are buckling dependent.
2. Plate Cells - The plate cell 30 + lD modeling prescription for cell homogenization consists of the following steps.
0 a. A ray is passed through the unit cell, perpendicular to the plates
and half way up the height of the ZPR drawer. The plate widths of the 1D model are taken to be the physical plate widths encountered along the ray. The compositions of the plates bearing resonance materials are taken to be the physical compositions encountered along the ray. Alternately the compositions of the remaining non-resonance material plates are taken to be their physical com- positions plus a contribution from the structural material from the top, bottom, and end periphery of the 3D cell - distributed ac- cording to width fraction. This lD slab model is used to:
i. generate plate-wise resonance cross sections (the physical absorber to moderator ratio has been preserved), to
ii. solve for the fine group intra cell flux using integral transport theory and reflective or periodic boundary condi- tions, and to
iii. spatially collapse using a flux, volume, number density weighting to produce fine group cell averaged isotopic cross sections.
b. Physically, as shown in Figs, 1 and 2, each of the plates in the cell has a slightly different height and all are less than the unit cell height. Therefore the lD model used in (a) is next modified by reducing the number densities in each plate by the ratio of the physical plate height to the full unit cell height. This new slab model preserves cell average number densities and, with the cell average cross sections generated in step (a) is used to solve for a criticality buckled fine group diffusion theory flux spectrum. This spectrum is used via a flux weight formula to collapse in energy to produce broad group cell average isotopic microscopic cross sections. In addition this same cell average spectrum is used to collapse the platewise cross sections to broad group plate cross sections.
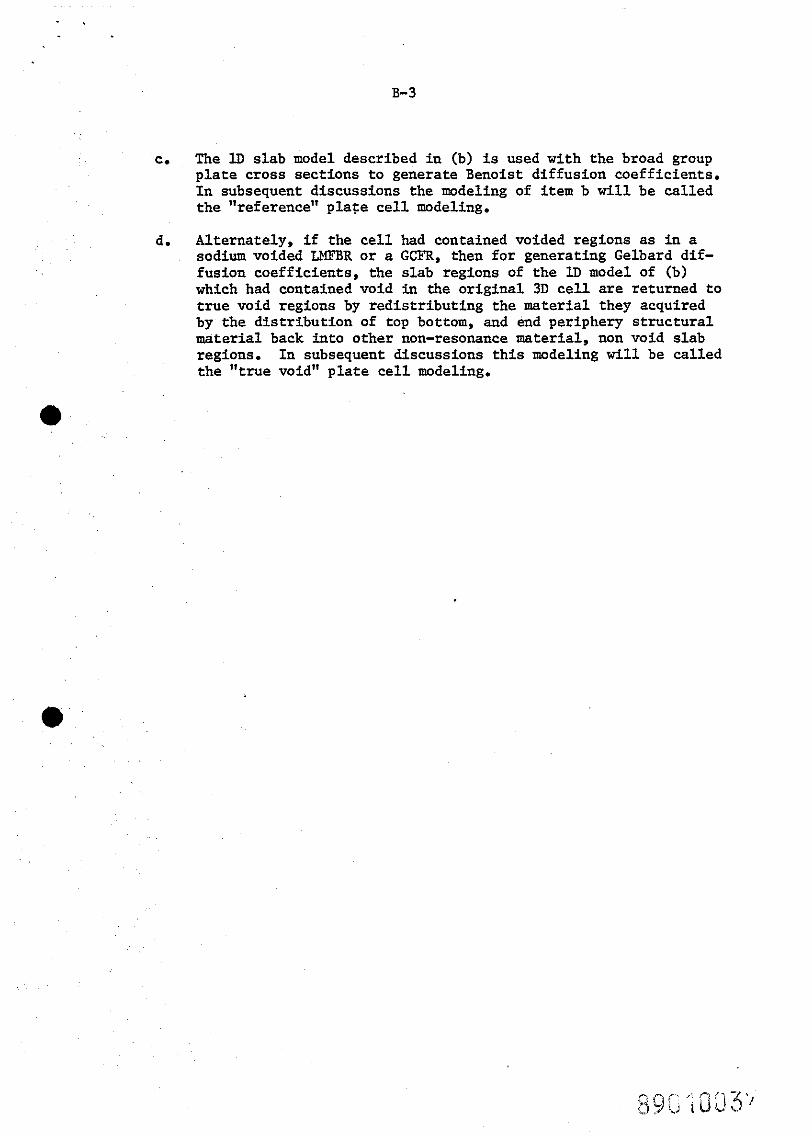
c. The lD slab model described in (b) is used with the broad group plate cross sections to generate Benoist diffusion coefficients. In subsequent discussions the modeling of item b will be called the "reference" plate cell modeling.
d. Alternately, if the cell had contained voided regions as in a sodium voided LMFBR or a GCFR, then for generating Gelbard dif- fusion coefficients, the slab regions of the lD model of (b) which had contained void in the original 3D cell are returned to true void regions by redistributing the material they acquired by the distribution of top bottom, and end periphery structural material back into other non-resonance material, non void slab regions. In subsequent discussions this modeling will be called the "true void" plate cell modeling.
Figure 1
LMFBR Unit Cell (Dimensions i n inches)
SST MATRIX , 0040" WALL
2.095"
CELL (AS BUILT)
UNIT CEl
(height)
1' z (length)
x (width)
F igure 2
GCFR Unit Cell (Dimensions in cm)
CORE
REGION
ii:
End View --
R E 5'5245 = 1.3811 cm. &
R = (22/~)112 = 0.7792 cm.
r = 0.4290 cm.
Fig. 3. ZPR Pin Calandria Unit Ce l l . (A l l dimensions a r e given i n cm.)
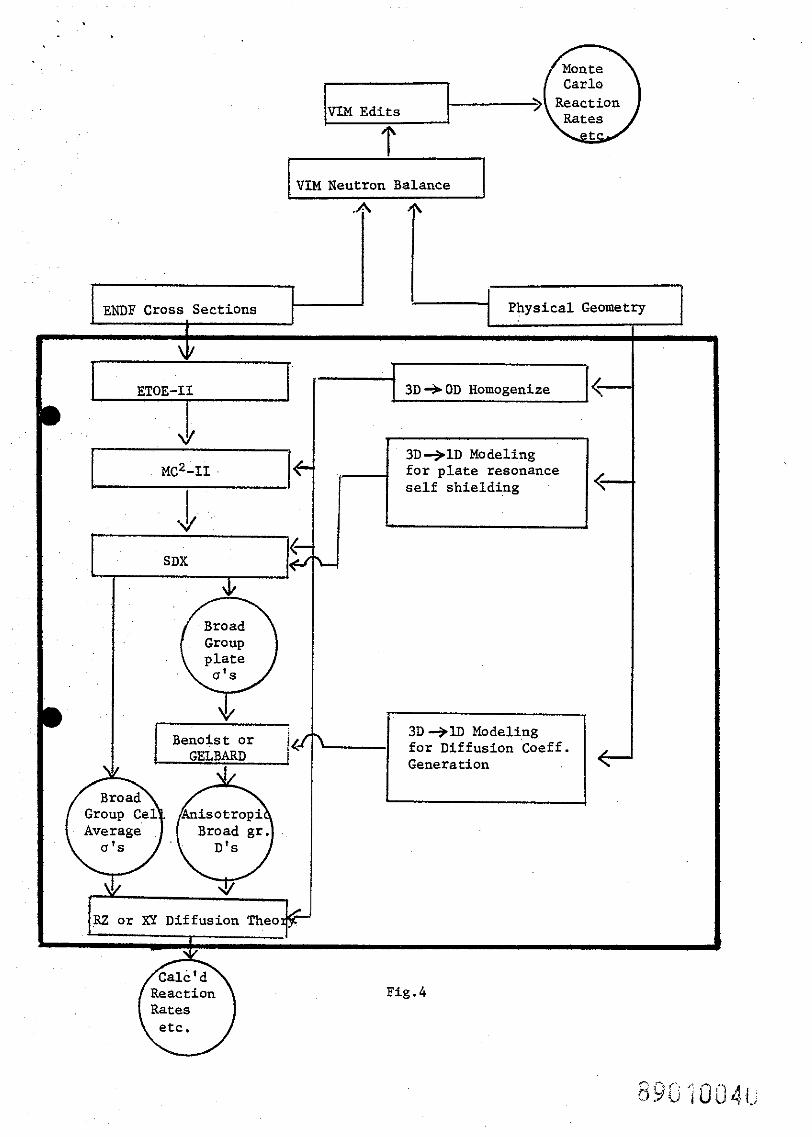
> Reaction Lf-+(-J VIM Neutron Balance
E W F Cross Sections Physical Geometry
1- I--] 3D 3 OD Homogenize <-
3D + I D Modeling f o r p l a t e resonance s e l f shie lding
Broad Group p l a t e
30 3 1 D Modeling f o r Diffusion Coeff. . . Generation
Group Cel Anisotropi ni-1 ~ R Z o r XY Diffusion Theo I I-
Fig. 4
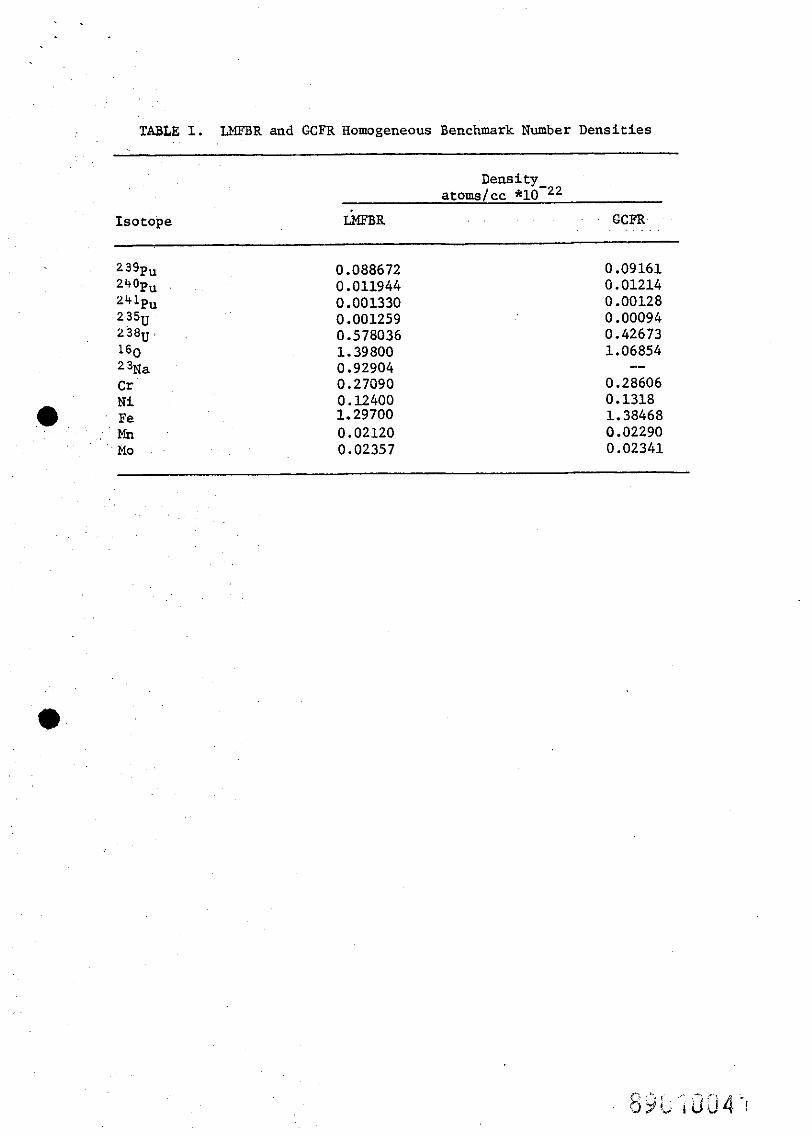
TABLE I. LMFF3R and GCFR Homogeneous Benchmark Number Densities
Density atomslcc
Isotope ~ E ~ F B R GCFR
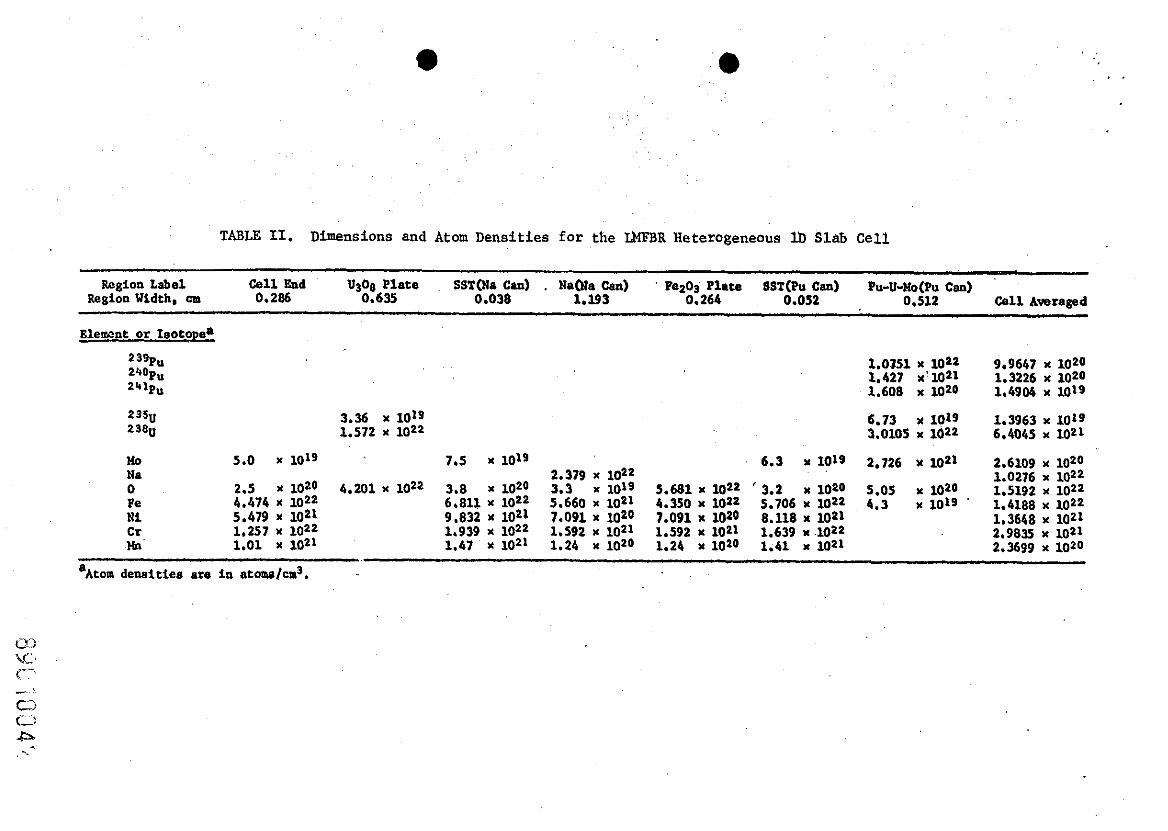
TABLE 11. Dimensions and Atom Densities for the U F B R Heterogeneous lb Slab Cell
Region Label Call End U308 Plate SST(Na Can) . Nama Can) Fez03 Plate SST@u Cm) Pu-U-Ho(Pu Cm) Region Width, cm 0.286 0.635 0.038 1.193 0.264 0.052 0.512 Call Averaged
'~tom densities are in atoms/cm3.
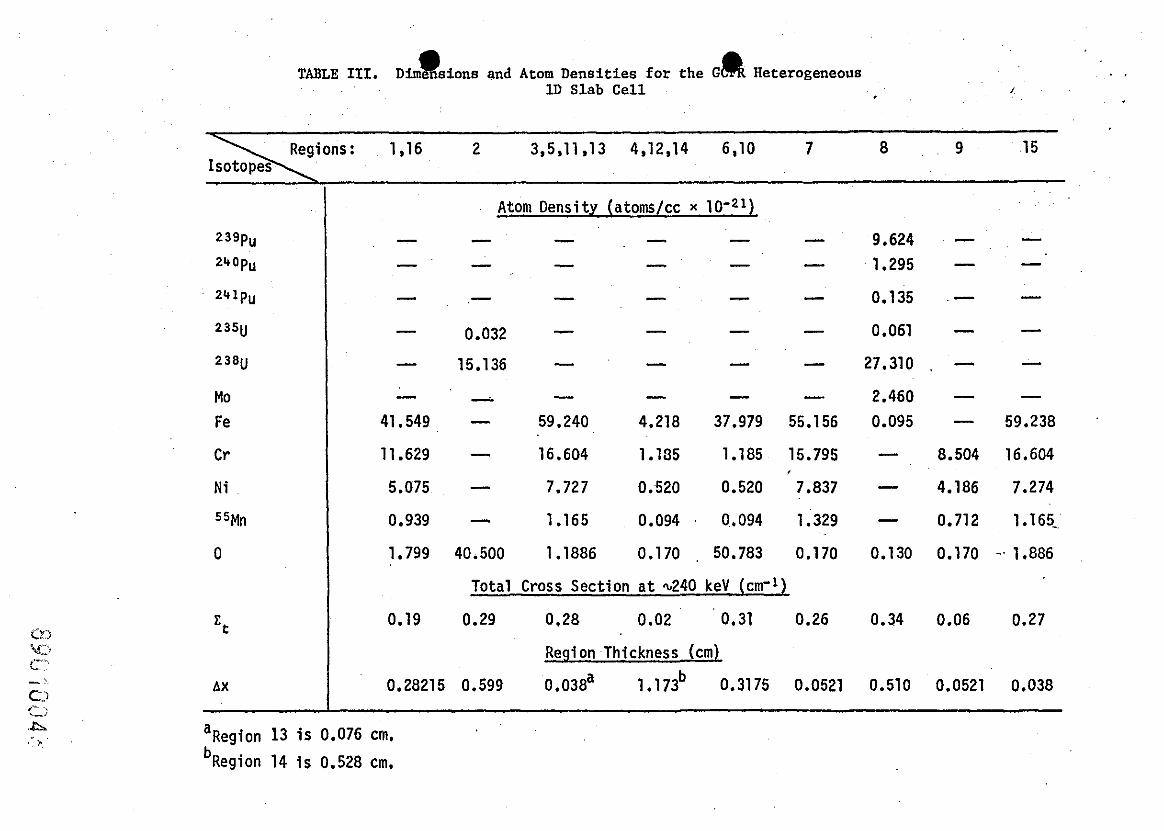
1D Slab Cell R TABLE 111. and Atom Densities for the G Heterogeneous
Atom Density (atoms/cc x
Total Cross Section a t %240 keV (cm'l)
0.29 0.28 0.02 0.31 0.26
Region Thickness (cm)
Regions: 1,16 2 3,5,11 ,13 4,12,14 6,lO 7 8 9 15
i
a ~ e g i o n 13 i s 0.076 Cm.
b ~ e g i o n 14 i s 0.528 cm.
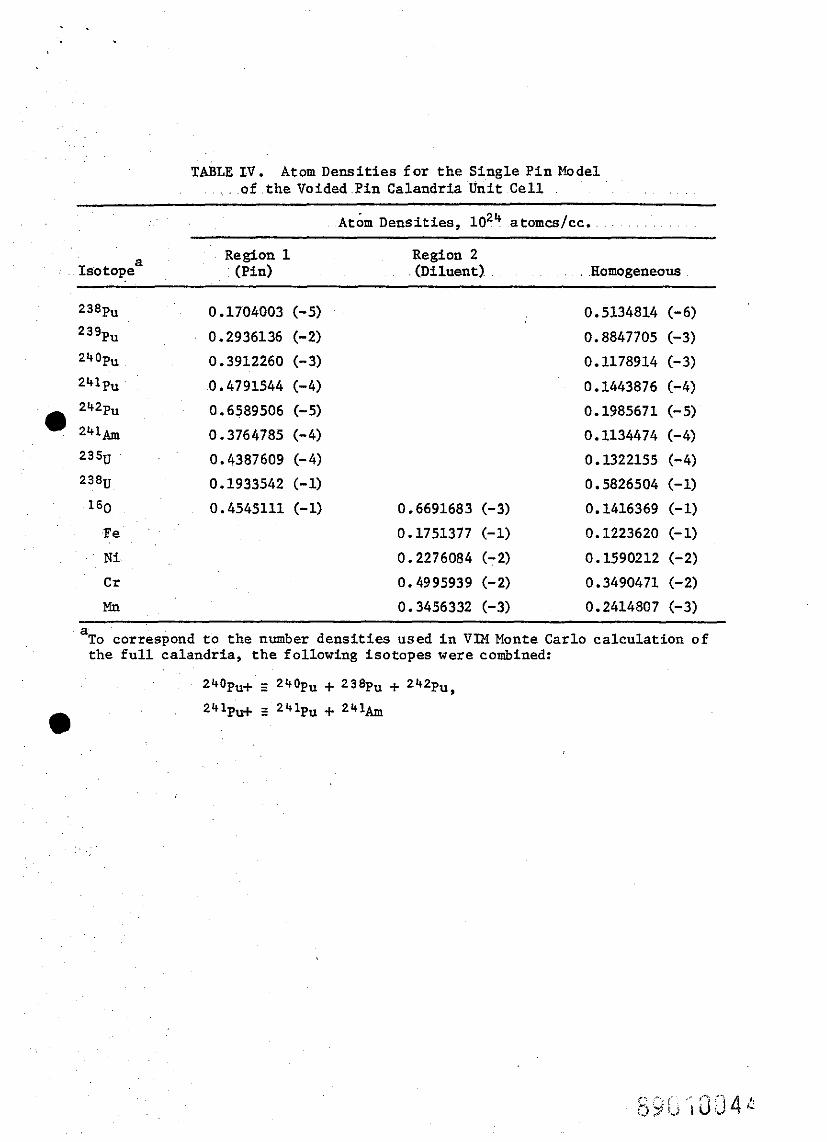
TABLE I V . Atom Dens i t i es f o r t h e S ing le P i n Model of t h e Voided P in Calandria Unit C e l l
tom Densi t ies , loz4 atomcs/cc.
a Region 1 Region 2 Isotope (Pin) (Diluent) Homogeneous
a To correspond t o t he number d e n s i t i e s used i n VIM Monte Carlo ca lcu la t ion o f t he f u l l calandria , t h e following i so topes were combined:
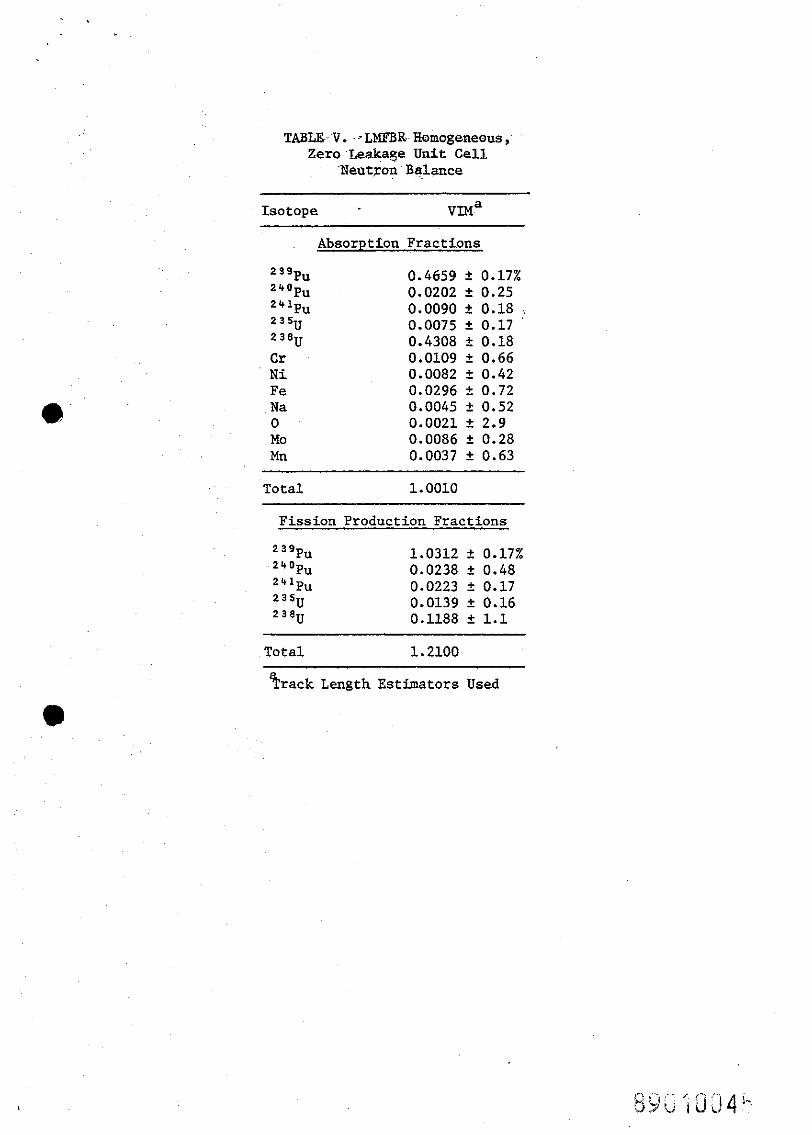
TABLE; "V. - - LMFBR Homogeneous, ZeroLeakage Unit C e l l
Neutron Balance
Isotope V I M ~
Absorptfon Fract ions
2 3 9 ~ u 0.4659 + 0.17% 2 4 0 ~ u 0.0202 i 0.25 2 4 1 ~ u 0.0090 i 0.18 2 3 5 ~ 0.0075 2 0.17 2 3 8 ~ 0.4308 i 0.18
C r 0.0109 i 0.66 N i 0.0082 + 0.42 Fe 0.0296 + 0.72 N a 0.0045 i 0.52 0 0.0021 + 2.9 Mo 0.0086 + 0.28 Mn 0.0037 2 0.63
Total 1.0010
F iss ion Production Fract ions
9 ~ u 1.0312 + 0.17% 2 4 0 ~ u 0.0238 + 0.48 2 4 1 ~ u 0.0223 2 0.17 2 3 . 5 ~ 0.0139 2 0.16 2 3 E U 0.1188 i 1.1
Total 1.2100
Track Length Estimators Used
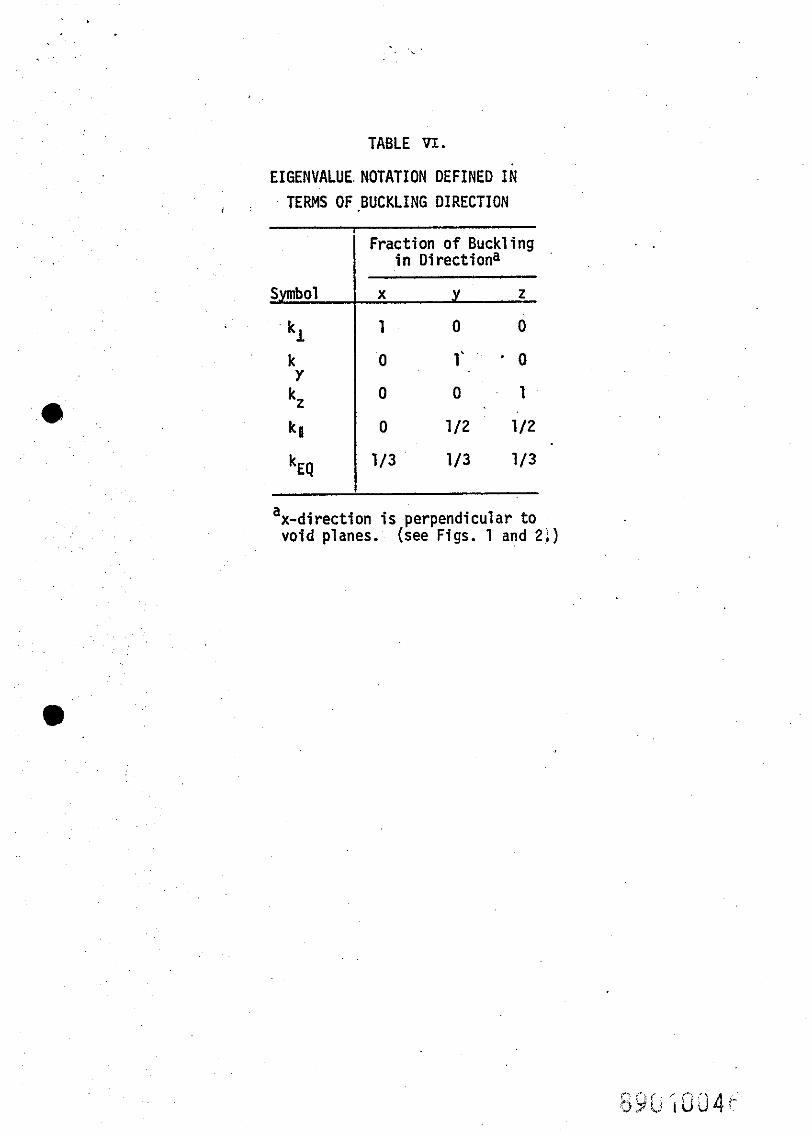
TABLE vl.
EIGENVALUE NOTATION DEFINED IN TERMS OF .BUCKLING DIRECTION
Fraction of Buckling j i n Directions
Symbol
kl k Y
kz
ka
k ~ 9
ax-direction is perpendicular to void planes. (see Figs. 1 and 2;)
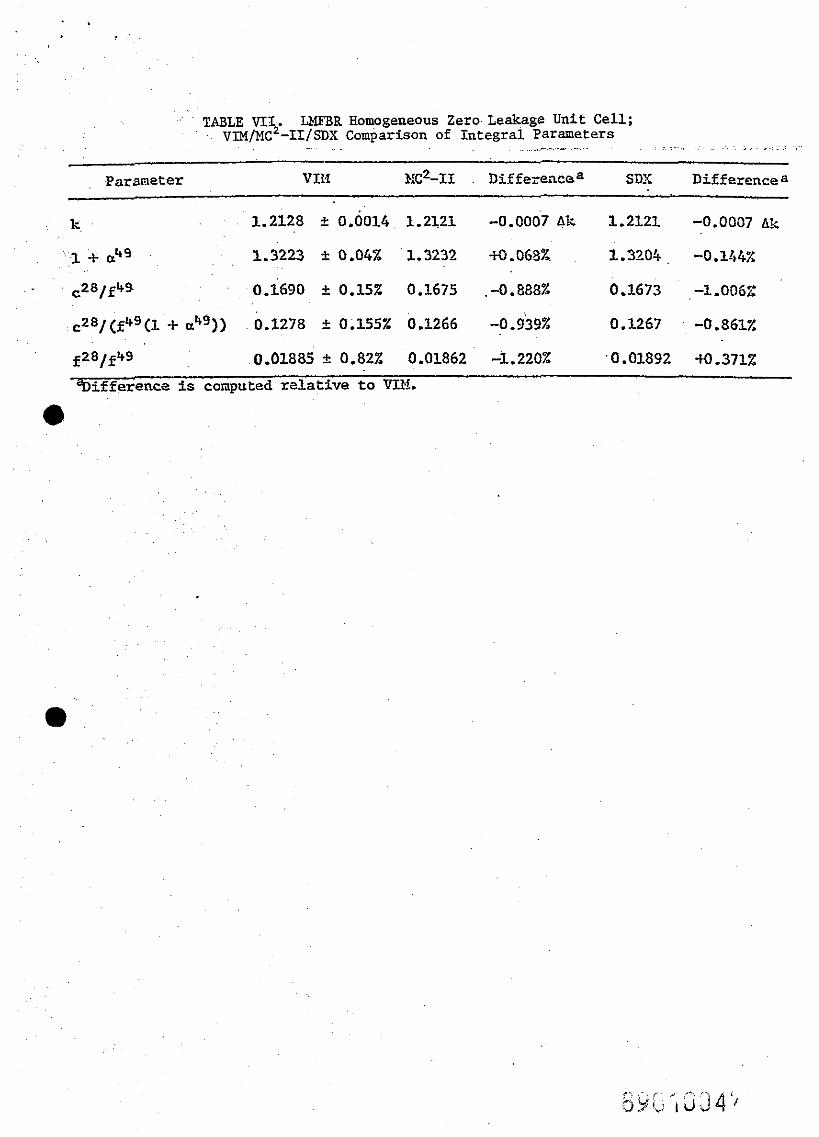
. . ' TABLE VII LMFBR Homogeneous ZeroLeakage Unit Cell;
- VM/MC$-II/SDX Comparison of rntegral Parameters . .~- ~. ~ ~ . ~. . - . . . . . . .~ -, . . . .. . .. .
Parameter -
V I H Hc2-11 . Dif fe;rencea SDX Difference a -
. k. 1.2128 + 0 . 0 0 1 4 1.2121 -0.0007Ak 1.2121 -0.0007&
. .I + &9 1.3223 C 0.047. 1.3232 +0.068% 1.320$ -O.lt&X
.28/f49 0.i690 + 0 . 1 5 ~ 0.1675 .-o.eesz 0.1673 -1.0061:
c28/(f49(1 + ,49)) 0.1278 C 0.155% 0.1266 -0.93% 0.1267 - -0 -861%
fZ8/f 49 0.01885 C 0.82% 0.01862 -1.220Z . O .01892 +0 -3712
%ifference is computed ralative to VIM.
a
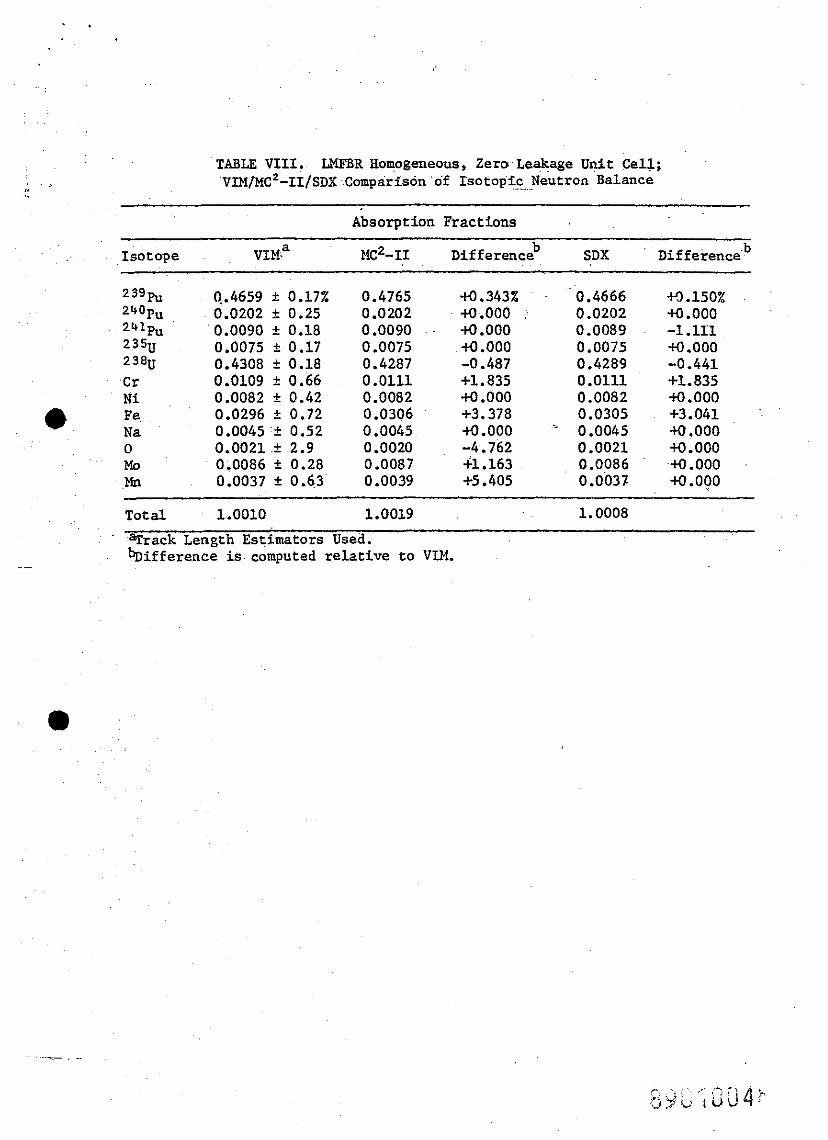
TABLE VIII. LMFBR Hoqogeneous , Zero Leeage Unit Cell; VIM/MC~-II/SDX Comparison 'of rsotopic . Neutron Balance
Absorption Fractions
soto ope VIM? MC*-11 Difference SDX Difference b .b
Total 1.0010 1.0019 1.0008
Cbfrack Length Estimators Used. b i f f e r e n c e is computed relat ive to VIM.
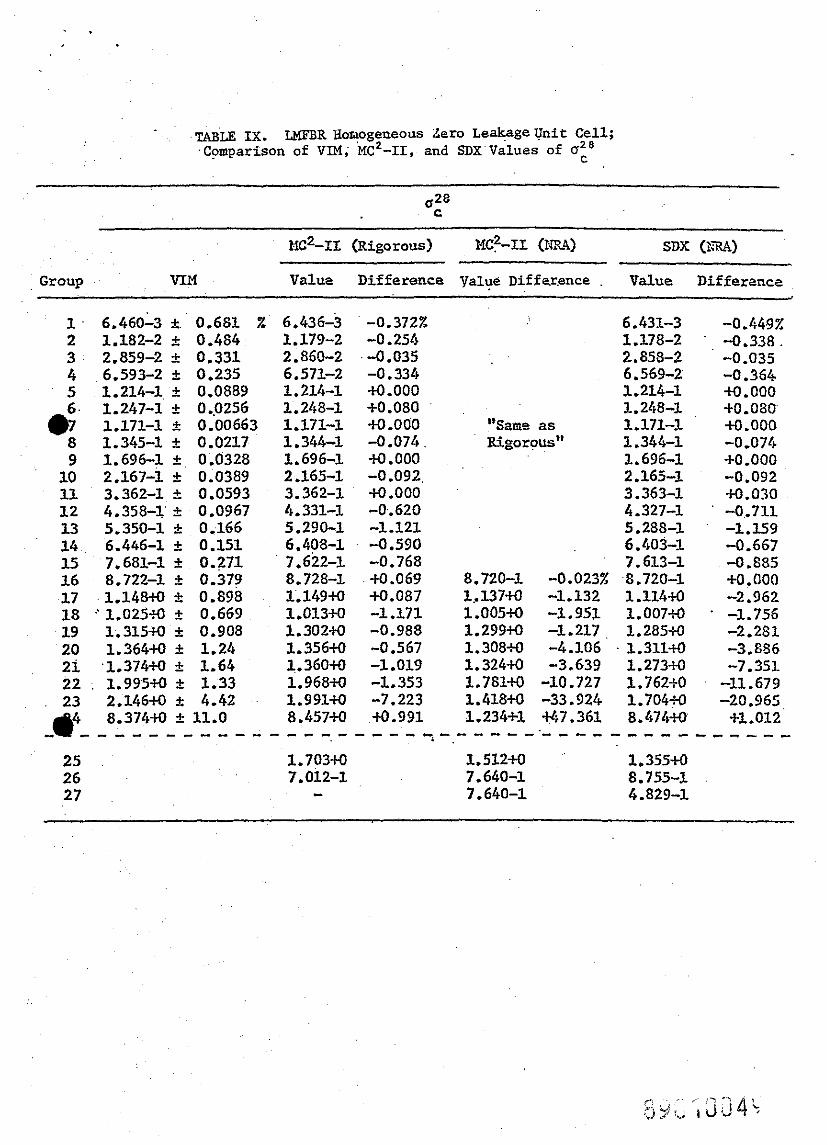
TABLE IX. LMFBR Homogeneous Zero Leakageunit Cell; Comparison of VIM, MC~-11, and SDX Values of 0:'
- - -
a28 C
N c ~ - I X (~igorous) l@-IX SDX (XU)
Group VIM Value Difference value Dif fexence Value Difference 2
"Same as Xigorous"
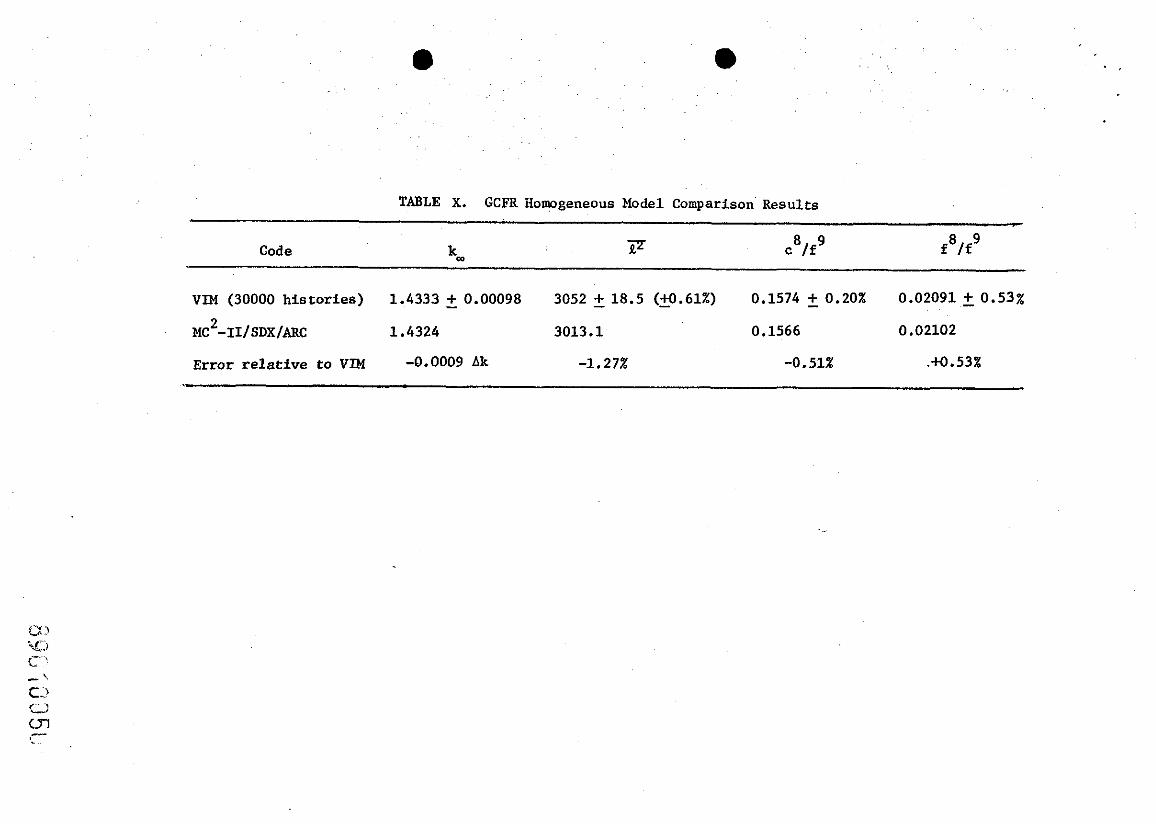
TABLE X. GCFR Homogeneous Model Comparison Results
VIM (30000 h i s t o r i e s ) 1.4333 - + 0.00098 3052 - + 18.5 ( 5 . 6 1 % ) 0.1574 - + 0.20% 0.02091 + 0.53%
MC~-II/SDX/ARC 1.4324 3013.1 0.1566 0.02102
Error r e l a t i v e to VIM -0.0009 Ak -1.27% -0.51% .+0.53%
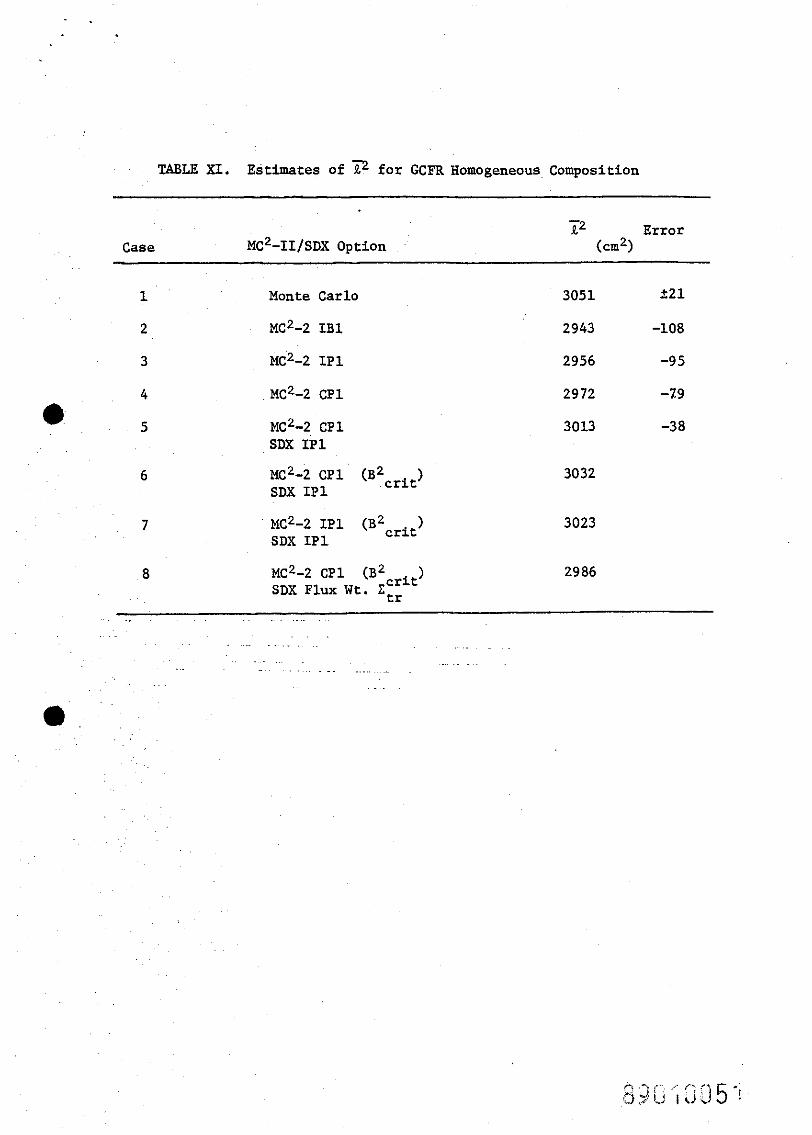
TABLE X I . Estimates of ? for GCFR Homogeneous Composition
T2 Error Case MC2-II/SDX Option (cm2)
1 Monte Carlo 3051 +21
SDX IP1
X2-2 CP1 ( B ~ ~ ~ ~ ~ ) SDX IP1
MC2-2 CP1 ( B ~ ~ ~ ~ ~ ) SDX Flux Wt. Ctr
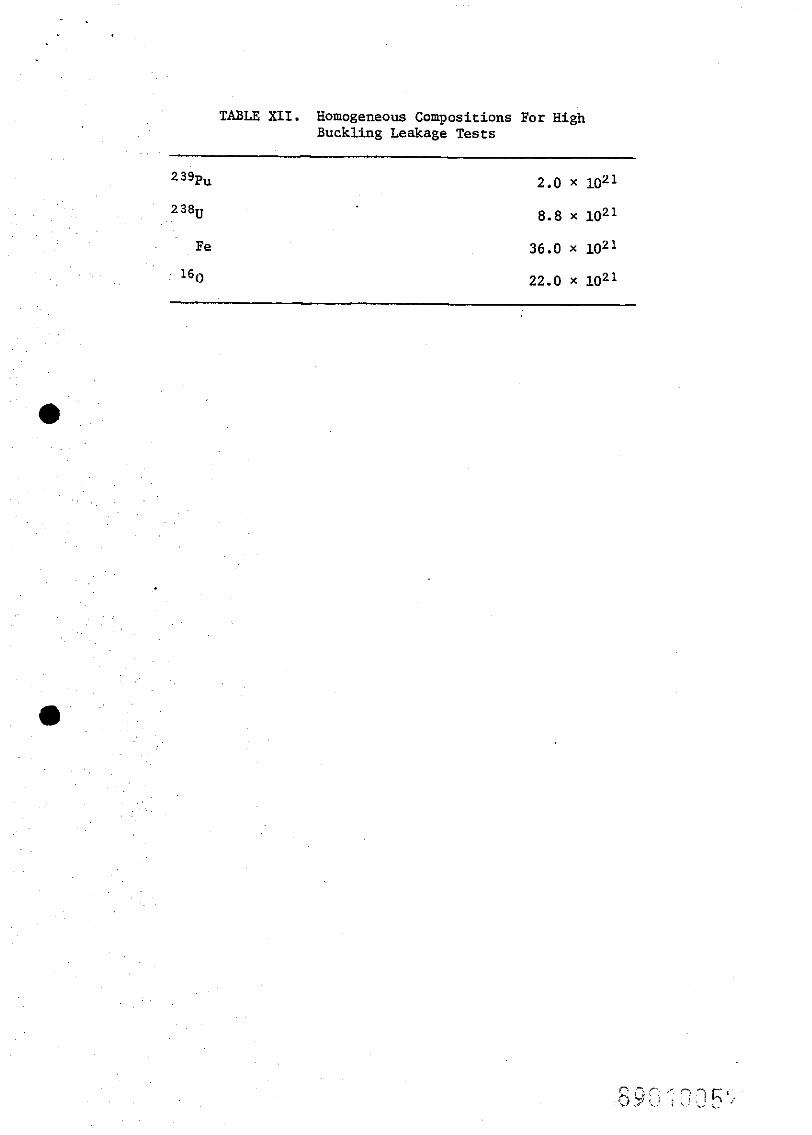
TABLE X I I . Homogeneous Compositions For High Buckling Leakage Tests
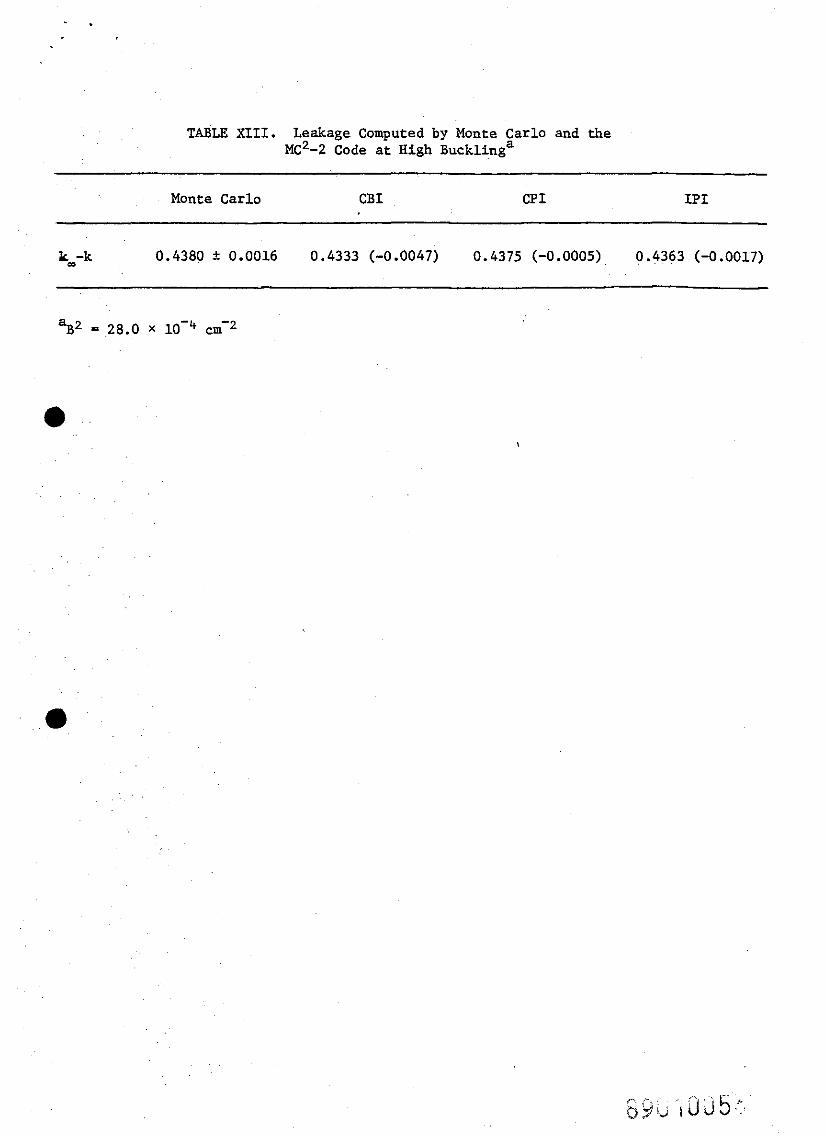
TABLE X I I I . Leakage Computed by Monte Carlo and the MC*-2 Code a t High ~ u c k l i n ~ ~
Monte Carlo C B I CP I IP I
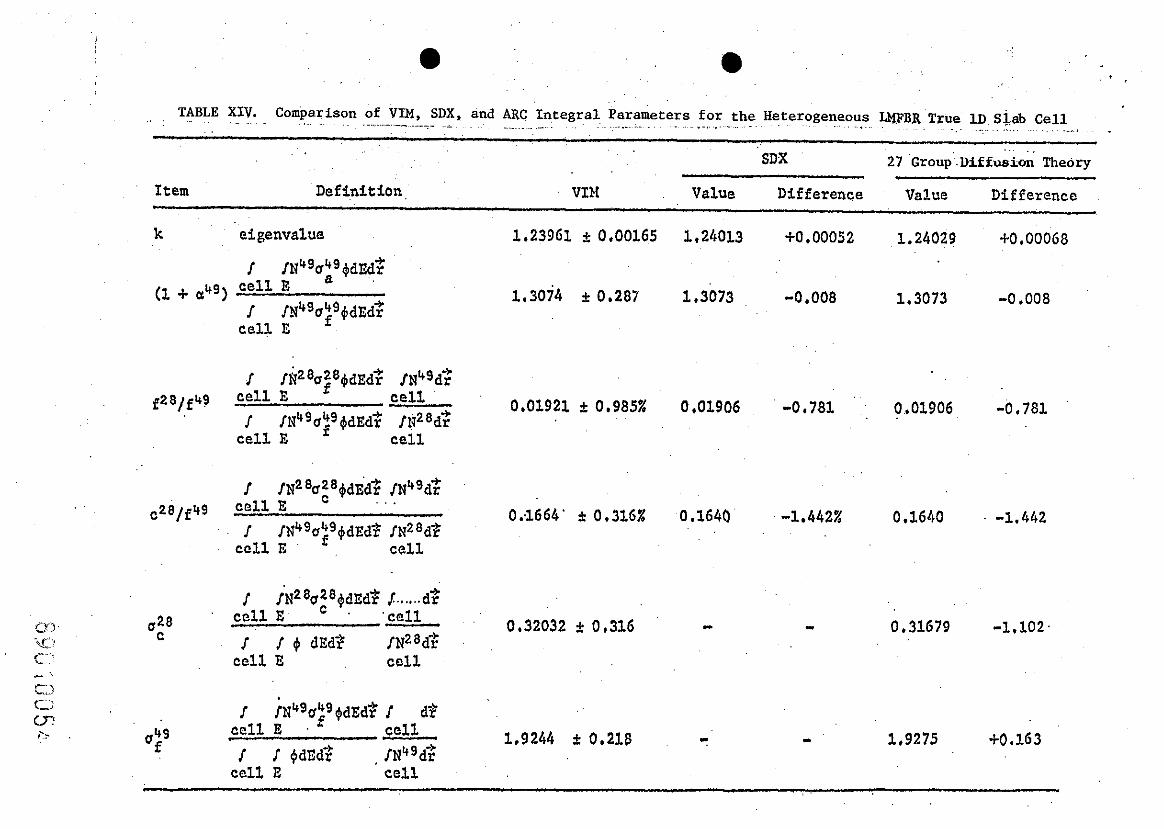
a . . . . I
. .
TABLE XIV. Comparison of VIM, SDX, and ARC Integral parameters for the Heterogeneous W B R True 1~ slab Cell . . . . . . . - . . .~. . . . . . . ..--- . . . . . . . . . . . . . . . . . . . . . . . . . . . . . . . . . . . . . . . . . . . . . . . . . . . . . . . . . . . . . . . . . . . . . . . . . ..'. , . .
. . . . . . SDx 27 ~ r o u p .Diffusion Theory
Item Definition. V I M Value Difference Value Difference
k eigenvalue 1.23961 f 0.00165
j c e l l E a
(1 C 1.3074 + 0.287 I JY49ui9+d~d$
c e l l I2
c e l l E I ' f28/f 49 0,01921 f 0.985%
I !~~~U!~ddEd?? / ~ ~ ~ d $ I ' c e l l E c e l l
c e l l E . . c28/f 49 0.3664' k 0.316%
/ r ~ ~ ~ ~ ! i ~ 6 d ~ d ? IN^^^* c c l l E x ' c c l l
j I N ~ ~ C + I E ~ ~ J...... d3 c e l l E
628 ' c e l l
C 0.32032 f 0,316
r r t$ d ~ d 3 /~*adi? c e l l E c a l l
/ f ~ ~ $ ~ : ~ t $ d ~ d * / d*
u;9 c c l l E . cell. -- 1.9244 k 0.218 I j +d~d$ , / ~ ~ ~ d ?
cell. E c e l l
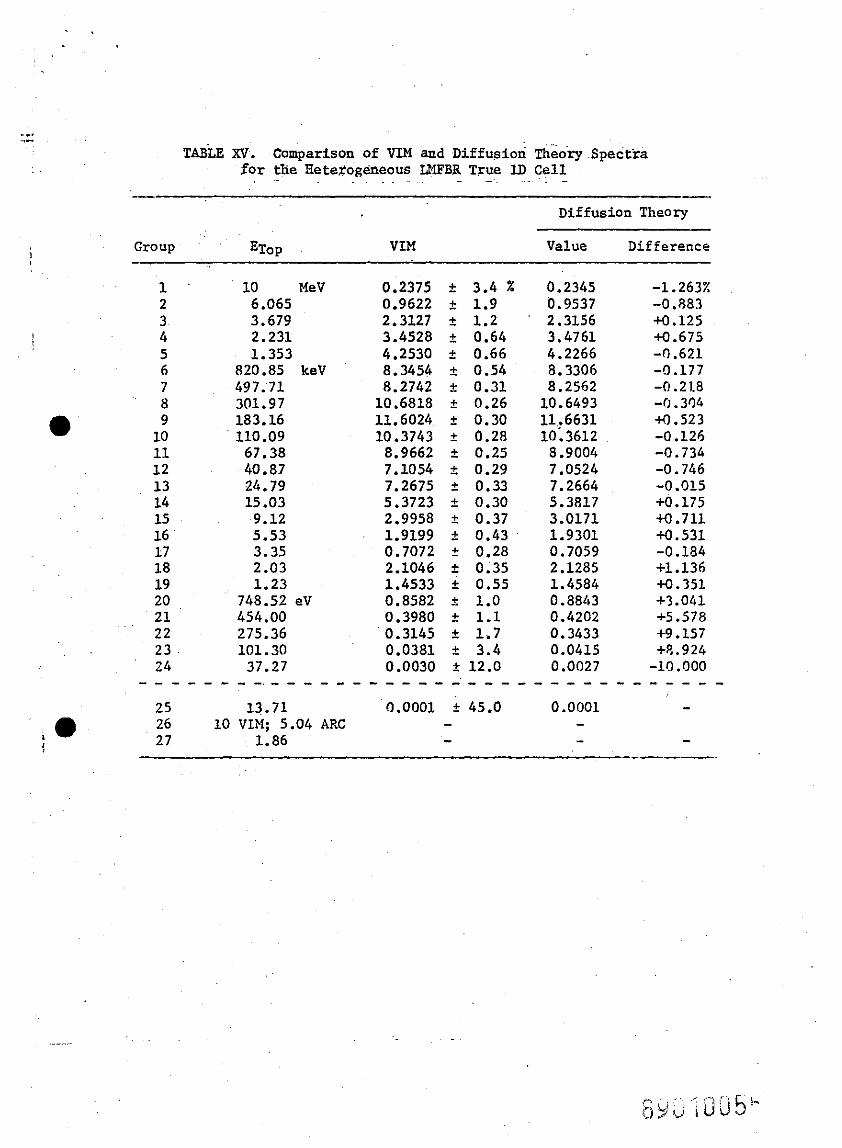
- TABLE XV. Comparison of VIM and Diffusion ~heory Spectra
for the Heterogeneous LMFBR True U) Cell - - -
-- -- Diffusion Theory
Group E ~ o p VIM Value Difference
1 10 MeV 0.2375 t 3.4 % 0.2345 -1.263% 2 6.065 0.9622 + 1.9 0.9537 -0.883 3 3.679 2.3127 1.2 2 .3156 xl.125 4 2.231 3.4528 t 0.64 3.4761 M.675 5 1.353 4.2530 t 0.66 4.2266 -0.621 6 820.85 keV 8.3454 t 0.54 8.3306 -0.177 7 497.71 8.2742 2 0.31 8.2562 -0.218 8 301.97 10.6818 t 0.26 10.6493 -rJ.304 9 183.16 11.6024 t 0.30 11.6631 W.523 10 110.09 10.3743 + 0.28 10;3612 -0 .I26 11 67.38 8.9662 t 0.25 8 .go04 -0.734 12 40.87 7.1054 t 0.29 7.0524 -0.746 13 24.79 7.2675 + 0.33 7.2664 -0.015 14 15 .03 5.3723 f 0.30 5.3817 +0.175 15 9.12 2.9958 + 0.37 3.0171 M.711 16 5.53 1.9199 + 0.43 1.9301 xl.531 17 3.35 0.7072 t 0.28 0.7059 -0.194 18 2.03 2.1046 t 0.35 2.1285 +1.136 19 1.23 1.4533 + 0.55 1.4584 M.351 20 748.52 eV 0.8582 + 1.0 0.8843 +3.041 21 454.00 0.3980 -+ 1.1 0.4202 +5.578 2 2 275.36 0.3145 + 1.7 0.3433 +9.157 2 3 101.30 0.0381 + 3.4 0.0415 +P,.924 2 4 37.27 0.0030 + 12.0 0 .0027 -10 .OOO . . . . . . . . . . . . . . . . . . . . . . . . . . . . . . . . . . . . 25 13.71 0.0001 + 45.0 0.0001 -
, a 26 10 VIM; 5.04 ARC - - 2 7 1.86 - - -
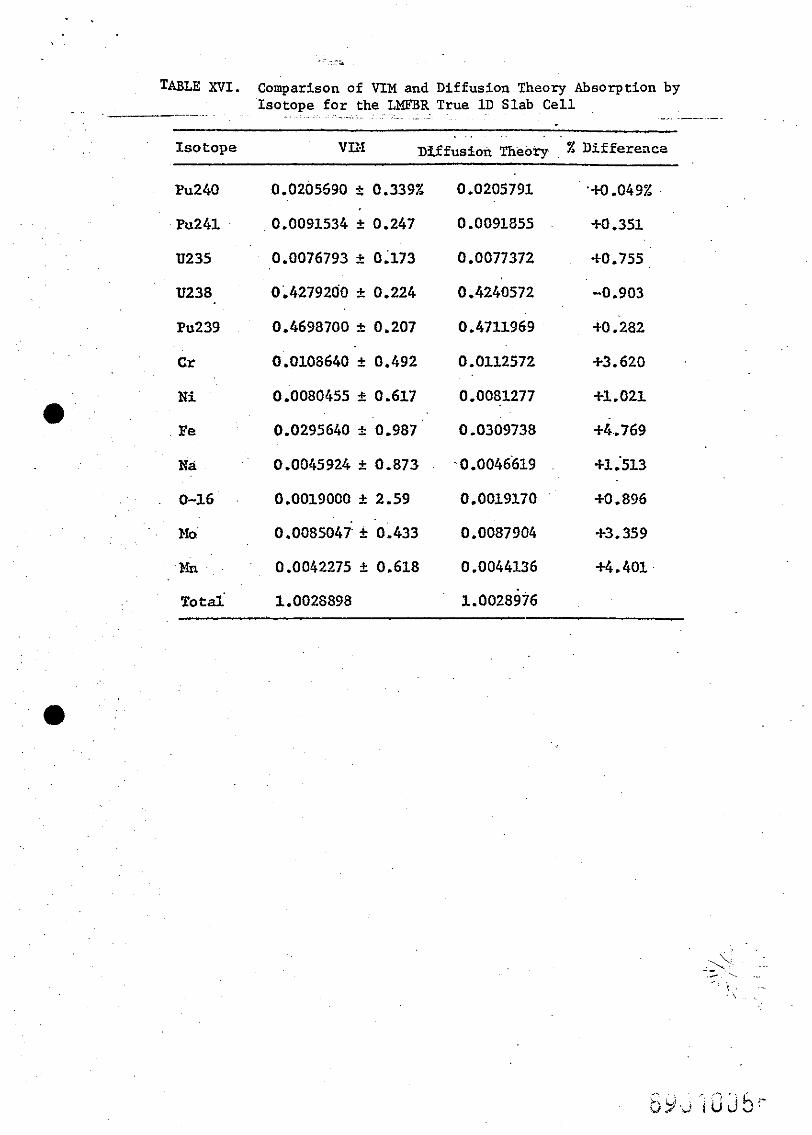
TABLE XVI. Comparison of VIM and Diffusion Theory Absorption by
.---- ... . Isotope f o r the LMFBR True 1 D Slab C e l l
....~ .~ .. . . . . . . . . .... ............
~ .~ ~.
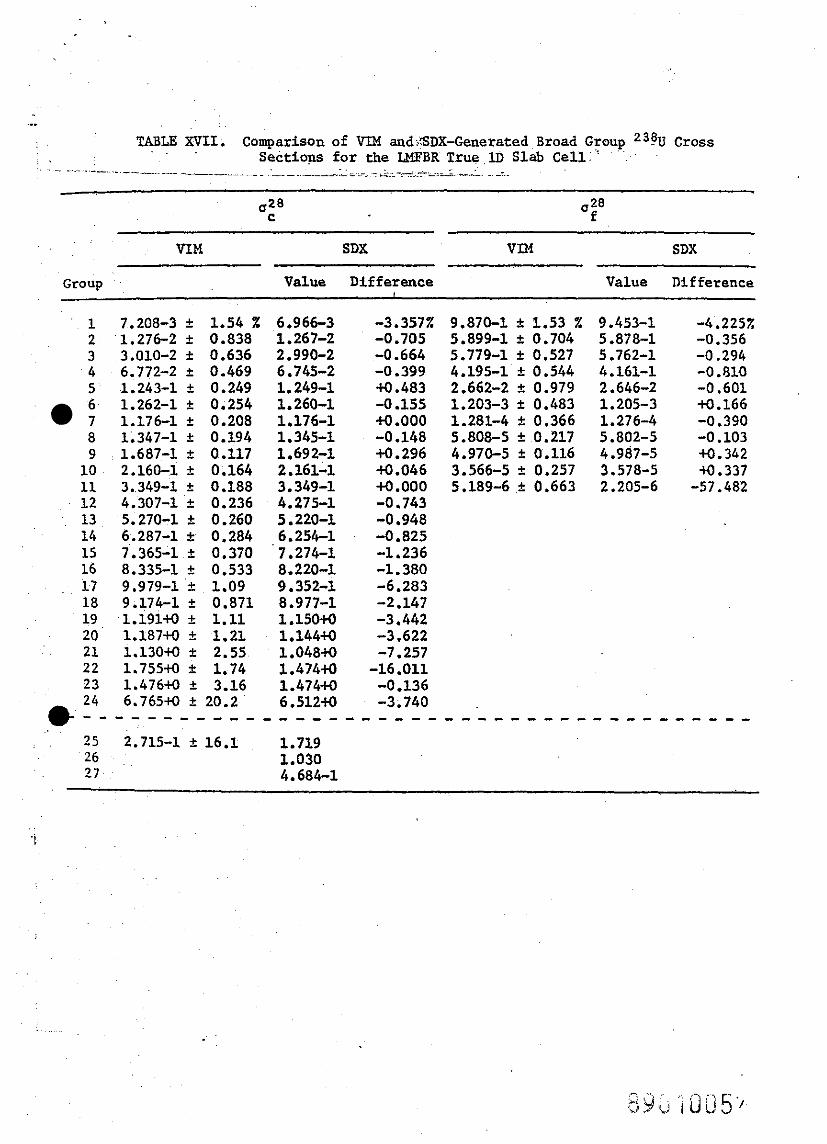
.. TABLE XVII. Comparison of VIM and SDX-Generated Broad Group 2 3 * ~ Cross
Sections f o r the LKFBR True lD Slab C e l l ' - .- -- .. -__a _ ;-.: %__ . A
0 2 8 C
0 28 f
V I M SDX VIM SDX
Group Value Difference Value Difference
1 7.208-3 t 1.54 4 6.966-3 -3.357% 9.870-1 f 1.53 % 9.453-1 -4.2251: 2 1.276-2 t 0.838 1.267-2 -0.705 5.899-1 t 0.704 5.878-1 -0.356 3 3.010-2 f 0.636 2.990-2 -0.664 5.779-1 t 0.527 5.762-1 -0.294 4 6.772-2 t 0.469 6.745-2 -0.399 4.195-1 t 0.544 4.161-1 -0.810 5 1.243-1 t 0.249 1.249-1 tQ.483 2.662-2 t 0.979 2.646-2 -0.601 6 1.262-1 f 0.254 1.260-1 -0.155 1.203-3 t 0.483 1.205-3 M.166 7 1.176-1 t 0.208 1.176-1 tQ.000 1.281-4 t 0.366 1.276-4 -0.390 8 1.347-1 f 0.194 1.345-1 -0.148 5.808-5 t 0.217 5.802-5 -0.103 9 1.687-1 t 0.117 1.692-1 t0.296 4.970-5 t 0.116 4.987-5 tQ.342
10 2.160-1 t 0.164 2.161-1 tQ.046 3.566-5 t 0.257 3.578-5 40.337 11 3.349-1 f 0.188 3.349-1 tQ.000 5.189-6 t 0.663 2.205-6 -57.482 12 4.307-1 t 0.236 4.275-1 -0.743 13 5.270-1 f 0.260 5.220-1 -0.948 14 6.287-1 f 0.284 6.2544 -0.825 15 7.365-1 t 0.370 7.274-1 -1.236 16 8.335-1 t 0.533 8.220-1 -1.380 17 9.979-1t 1.09 9.352-1 -6.283 18 9.174-1 t 0.871 8.977-1 -2.147 19 1 .19140t 1.11 1.150tO -3.442 20 1.1874 t 1.21 1.144tQ -3.622 2 1 1.130+0t 2.55 1.048+0 -7.257 22 1.755+0 t 1.74 1.474-M -16.011 23 1.476+0 t 3.16 1 .4744 -0.136 24 6.76540 r 20.2 6. 512M -3.740 *----------------------------------------- 25 2.715-1 t 16.1 1.719 26 1.030 2 7 4.684-1
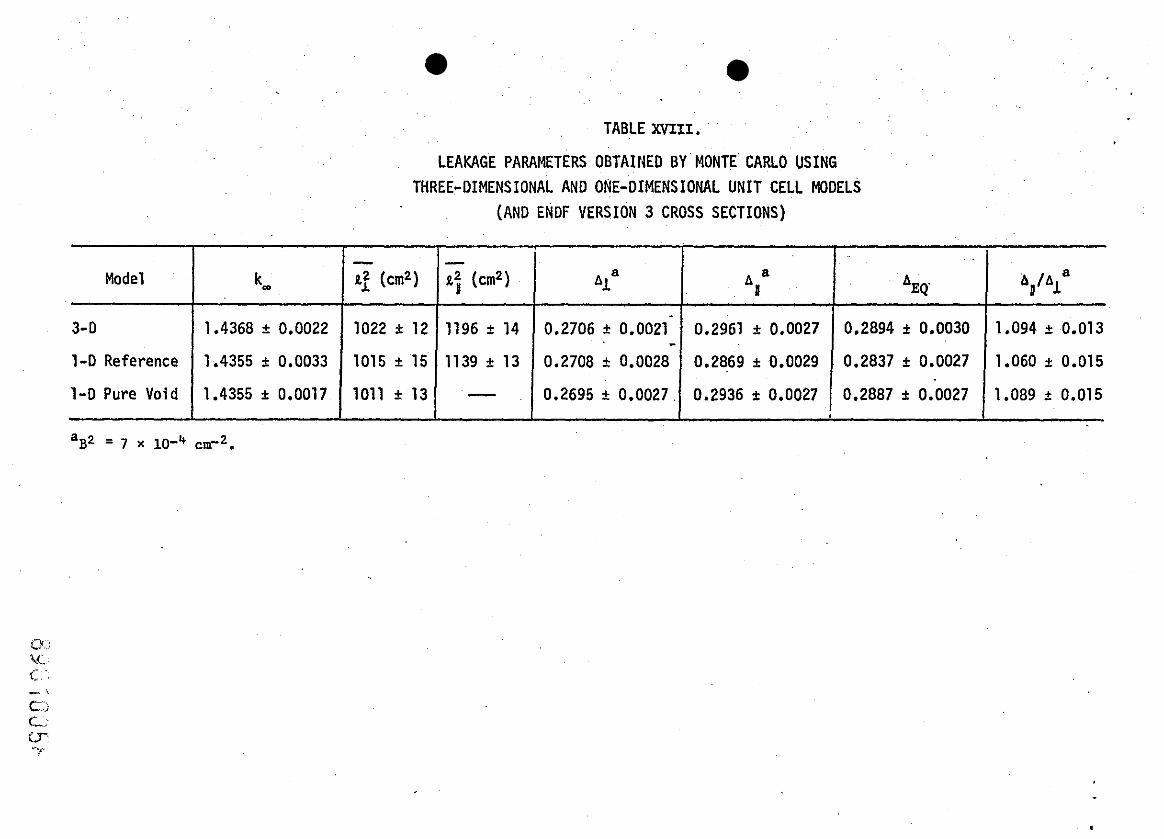
TABLE XVIII.
LEAKAGE PARAMETERS OBTAINED BY MONTE CARL0 USING THREE-DIMENSIONAL AND ONE-DIMENSIONAL UNIT CELL MODELS
(AND ENOF VERSION 3 CROSS SECTIONS)
Model
3-D
I-D Reference
1-0 Pure Void
km
1.4368 t 0.0022
1.4355 0.0033
1.4355 * 0.0017
- 9.f (cm2)
1022 * 12 1015 t 15
1011 t 13
- a: (cm2)
1196 t 14
1139 t 13
-
A a I
0.2961 & 0.0027
0.2869 * 0.0029 0.2936 k 0.0027
%a
0.2706 * 0.0021- - 0.2708 * 0.0028 0.2695 * 0.0027
A EQ'
0.2894 * 0.0030 0.2837 t 0.0027
0.2887 * 0.0027
A ~ A ~ ~
1.094 0.013
1.060 * 0.015 1.089 t 0.015
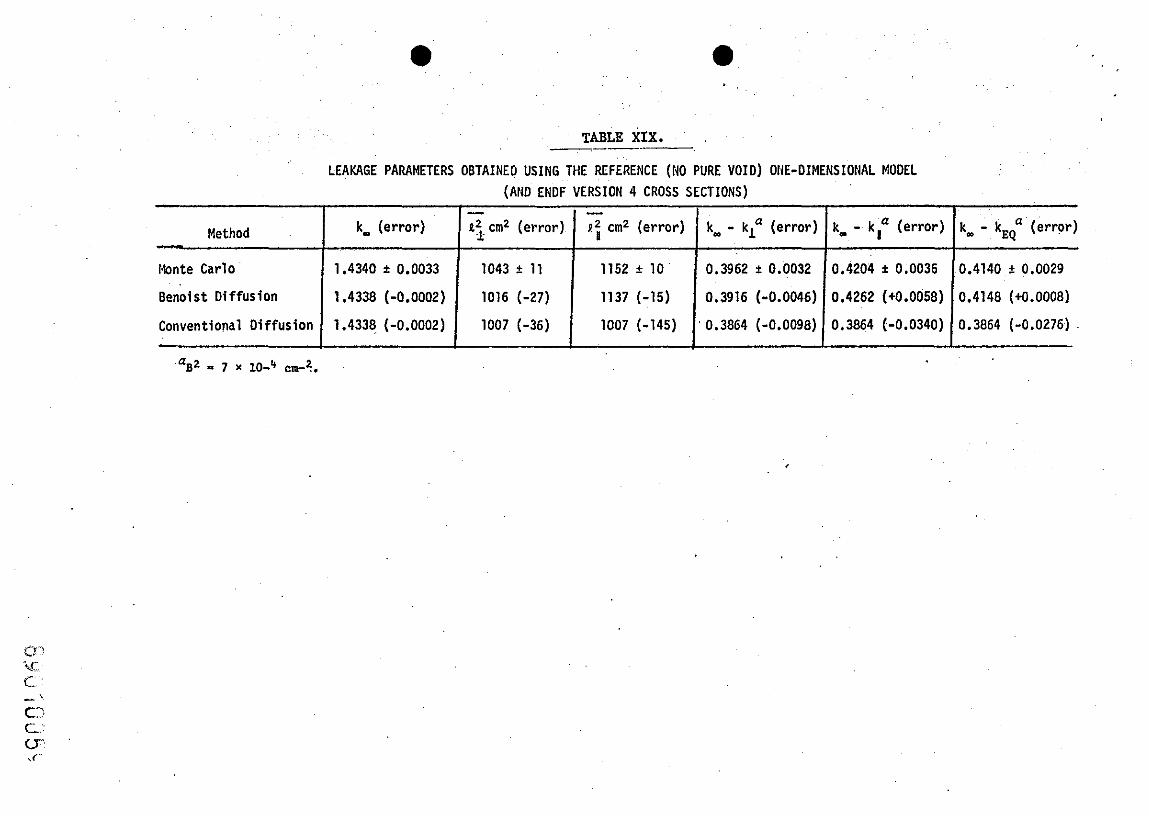
TABU XIX.
LEAKAGE PARAMETERS OBTAINED USING THE REFERENCE (NO PURE VOID) ONE-DIMENSIONAL MODEL
(AND ENOF VERSION 4 CROSS SECTIONS)
Method
Monte Carlo
Benoist Di f fusion
Conventional Di f fus ion - '~2 - 7 x 10⁻⁴ cm-?.
k_ (error)
1.4340 * 0.0033
1.4338 (-0.0002)
1.4338 (-0.0002)
- i2 cm2 (error) I.
1043 i 11
1016 (-27)
1007 (-36)
k_ - k t (er ror )
0.3962 i 0.0032
0.3916 (-0.0046)
0.3864 (-0.0098)
- 9 ; cm2 (er ror )
1152 i 10
1137 (-15)
1007 (-145)
k_ - k l a (error)
0.4204 * 0.0035
0.4262 (t0.0058)
0.3864 (-0.0340)
k_ - kEg a (error)
0.4140 + 0.0029
0.4148 (+0.0008)
0.3864 (-0.0276)
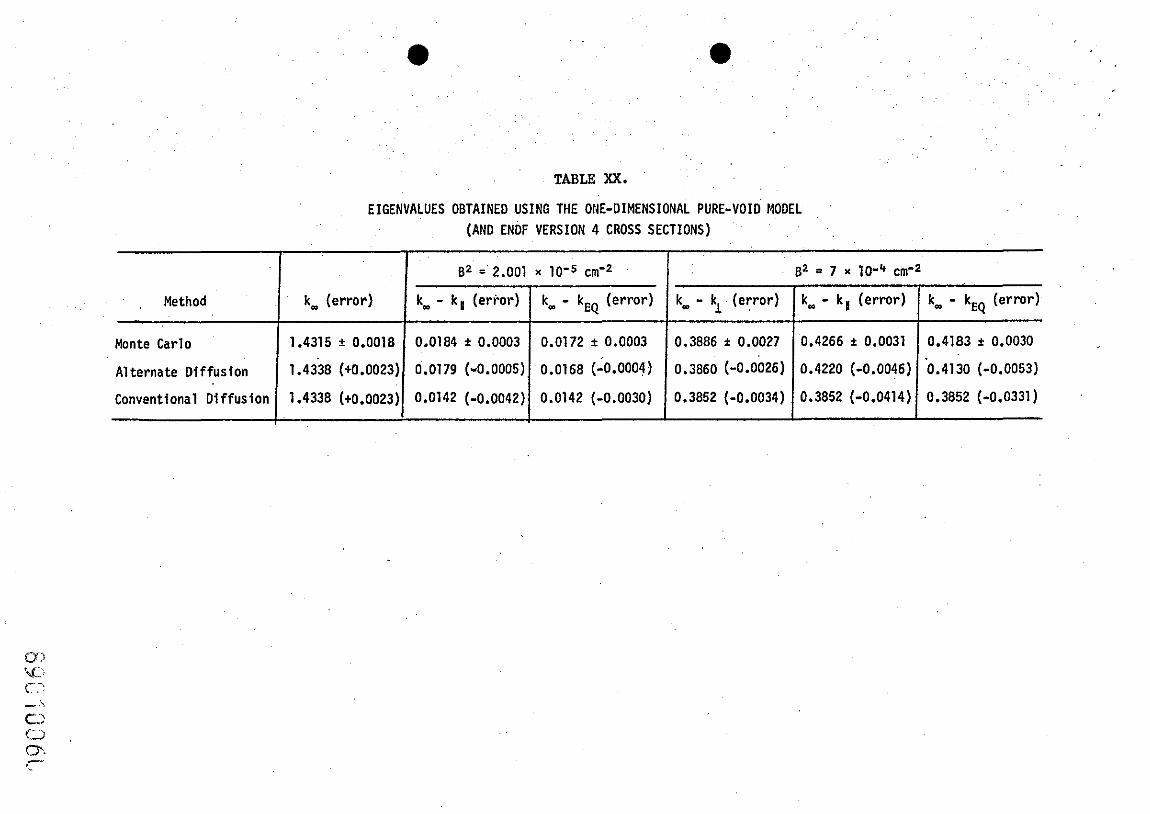
TABLE XX.
EIGENVALUES OBTAINED USING THE ONE-DIMENSIONAL PURE-VOID MODEL , .
(AND ENOF VERSION 4 CROSS SECTIONS)
, Method
Monte Carlo
Alternate Diffusion
Conventional Diffusion
k_ (error)
1.4315 i 0.0018
1.4338 (t0.0023)
1.4338 (t0.0023)
B2 = 2.001 x 10⁻⁵ c V 2 a2 = 7 x lo-' cmm2
k_ - k (error)
0.0184 i 0.0003
0.0179 (-0.0005)
0.0142 (-0.0042)
k_ - kEQ (error)
0.0172 i 0.0003
0.0168 (~0.0004)
0.0142 (-0.0030)
k_ - k (error) EQ
0.4183 i 0.0030
'0.4130 (-0.0053)
0.3852 (-0.0331)
k - k e r r o r
0.3886 t 0.0027
0.3860 (-0.0026)
0.3852 (-0.0034)
k, - k l (error)
0.4266 i 0.0031
0.4220 (-0.0046)
0.3852 (-0.0414)
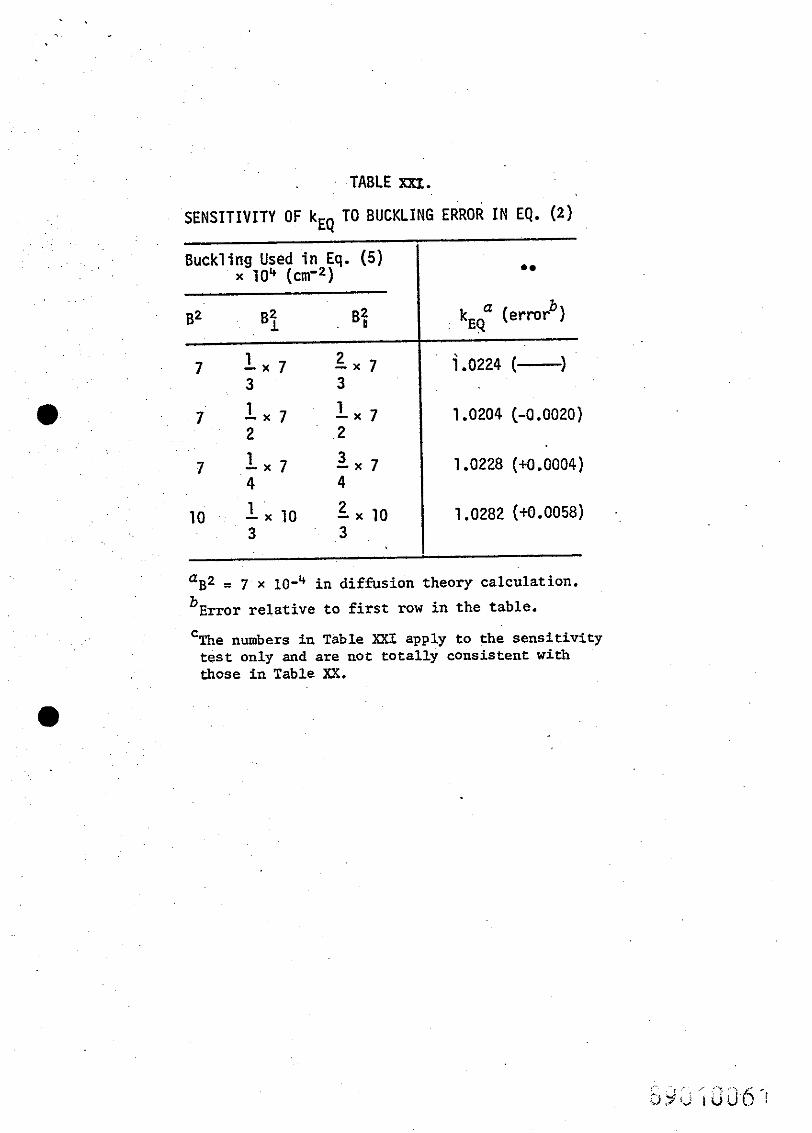
a ~ 2 = 7 x i n diffusion theory calculation.
b ~ r r o r re lat ive t o first row i n the table.
TABLE m.
SENSITIVITY OF xEQ TO BUCKLING ERROR IN EQ. (2)
numbers i n Table XXI apply to the sens i t iv i ty t e s t only and are not to ta l ly consistent with those i n Table XX.
Buckling Used i n Eq. (5) x l o 4
B! 82 Bi
7 1 - x 7 2 - X 7
3 3
b kEQa (error )
i.0224 (-1
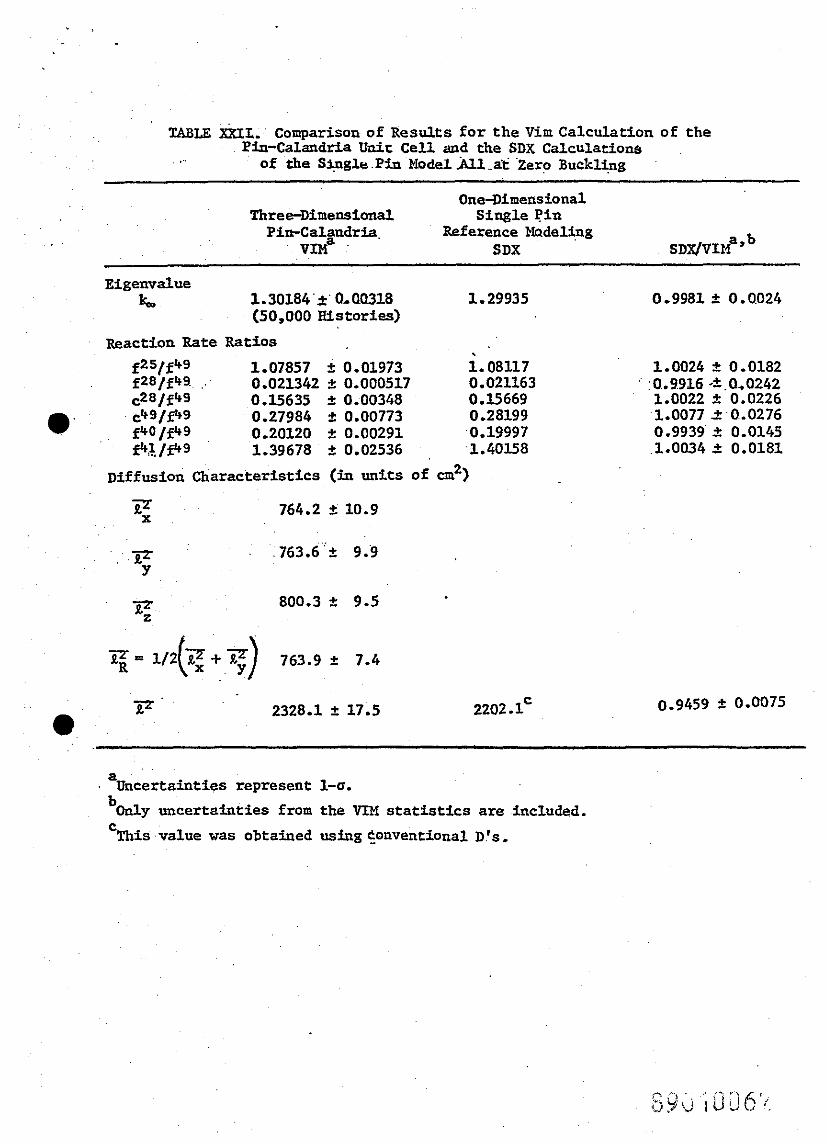
TABLE XXIL. Comparison o Pin-Calandria Un
of the Single
f R e s u l t s f o r t h e Vim Calculat ion o f 1 i r : C e l l aud the SDX calculation^ Pin Model &l ..at Zero Buckling
One-Dimensional Three-Dimensional S ing le P i n
Pin-Calpdria . Reference Ebdeling VIM SDX a,b SDX/VIM
- ---
Eigemdlue k 1.30184 '+ O.QO318 1.29935
(50,000 Histories)
Reaction Rate Rat ios
f25/f49 1.07857 2 0.01973 1.08117 fZf3/f49 0.021342 f 0.000517 0.021163 c28/f49 0.15635 2 0.00348 0.15669
a c49/f49 0.27984 f 0.00773 0.28199 f'+O/f49 0.20120 2 0.00291 0.19997 f4?/f49 1.39678 2 0.02536 1.40158
Diffusion Charac te r i s t i c s ( in u n i t s o f cm2)
a Uncertaint ies represent 1-0.
uncer t a in t i e s from t h e VIM statistics are included. C This value was obtained usingC_onventional D's .
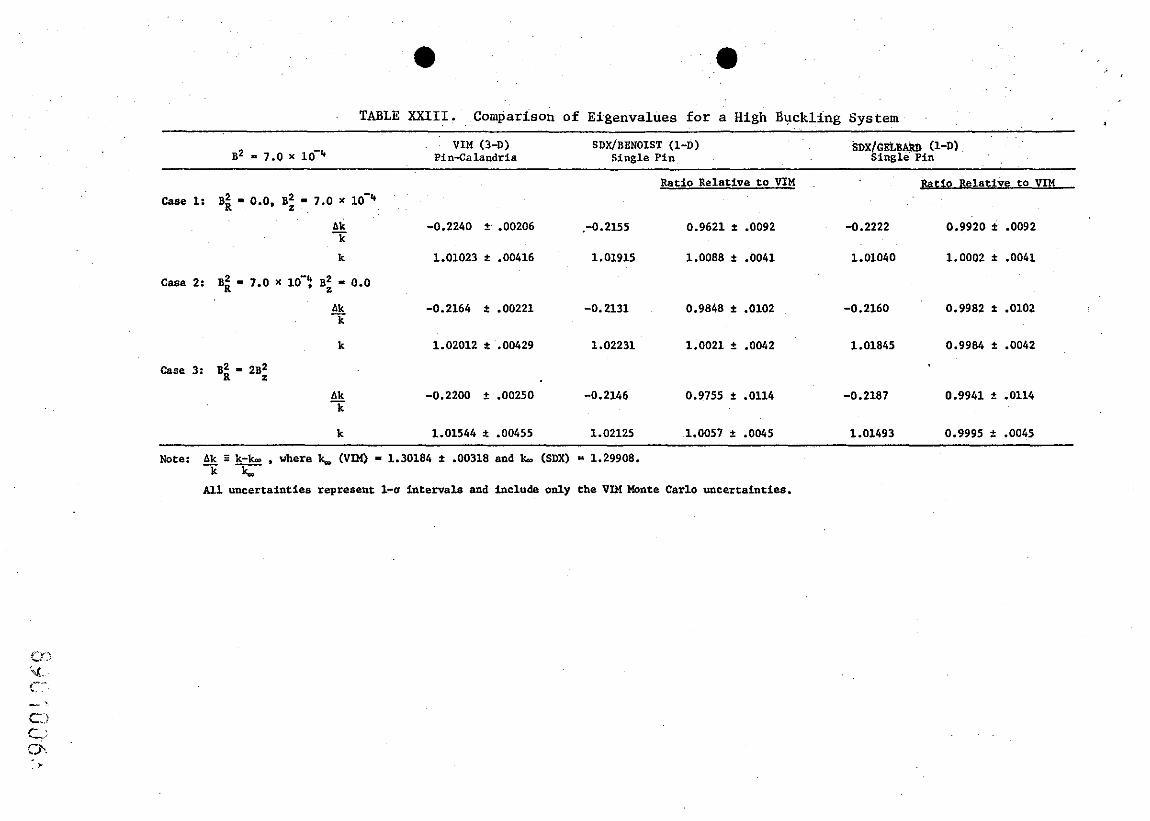
TMLE XXIII. Compar f Eigenvalues for a High Buckling System
VIM (3-D) Pin-Calandria
SDWBENOIST (I-D) Single Pin
S D X / G E L B ~ @-Dl Single Pin
k
Case 2: B: - 7.0 x 10-? B: - 0.0 Ak - k
k
Case 3: B$ - 2~: Ak - k
k
Ratio Relative to VIM patio Relative to VIM
Note: & s & . where k, (VIM) - 1.30184 t .00318 and k, (SDX) - 1.29908. k k
All uncertainties represent 1-0 intervals and include only the VIM Monte Carlo uncertainties.
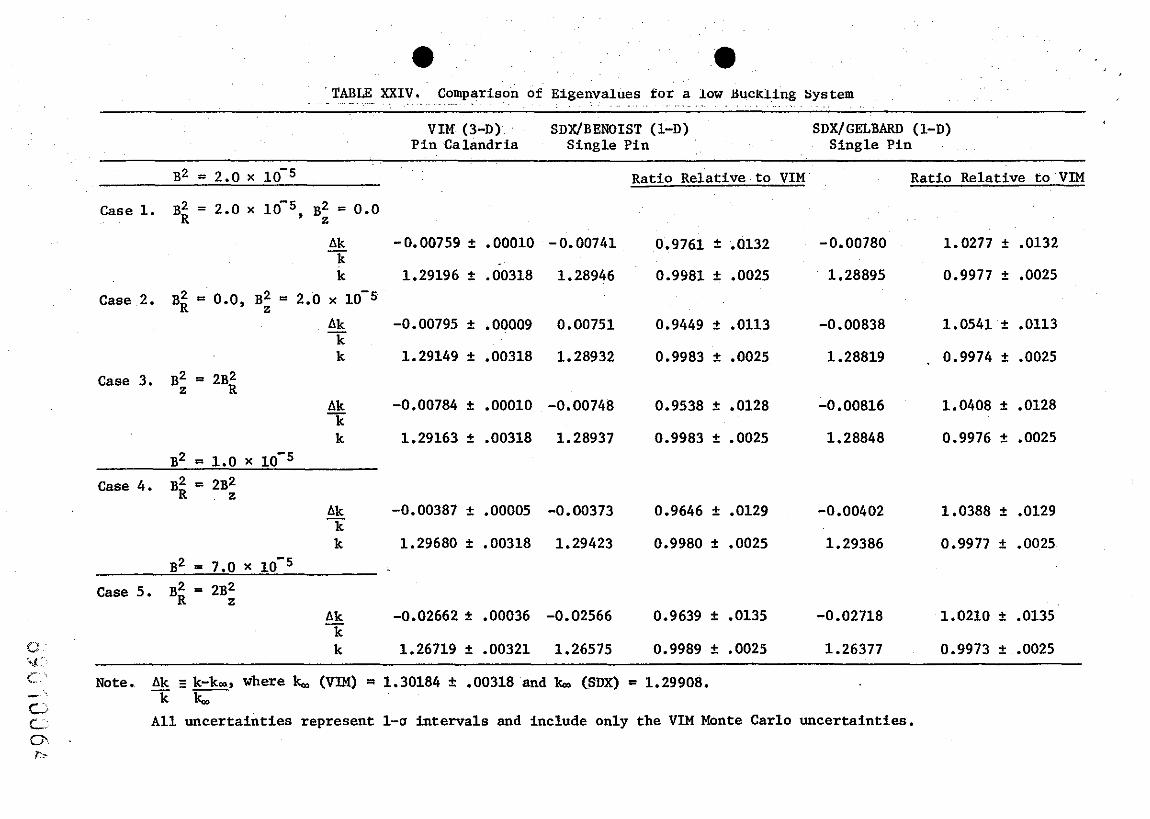
'TABLE XXIV. ~ o m ~ a r i s o d of Eigenvalues f o r a low fiucRling System - ..... . . . . ~ ~ ~ . . . , . . . . . . . . . . - . . . . .
V I M (3-D) S D ~ B E N O I S T (1-D) SDXIGELBARD ( 1-D) P in Ca landr ia Single Pin Single Pin
B~ = 2 . 0 ~ lo-s Ratio Relative t o V I M Ratio Relative t o VIM
Case 1. B2 = 2.0 x B~ = 0.0 R z
Ak - - 0.00759 f .00010 - 0.00741 0.9761 f .0132 -0.00780 1.0277 + .0132 k k 1.29196 f .&318 1.28946 0.9981 + .0025 1.28895 0.9977 + .0025
Case 2. B; 0.0, B: = 2.0 x 10⁻⁵
Ak - -0.00795 f .00009 0.00751 0.9449 + .0113 -0 .00838 1.0541 + .0113 k k 1.29149 + .00318 1.28932 0.9983 f .0025 1.28819 , 0.9974 + .0025
Case 3. B: a 2B2 R
Ak - -0.00784 t .00010 -0.00748 0.9538 f .0128 -0 .00816 1.0408 t .0128 k k 1.29163 f .00318 1.28937 0.9983 + .0025 1.28848 0.9976 f .0025
B~ = 1.0 x 10⁻⁵
Case 4. B; ' 2B2 Z
Ak - -0.00387 + .00005 -0.00373 0.9646 f .0129 -0.00402 1.0388 t .0129 k k 1.29680 + .00318 1.29423 0.9980 + .0025 1.29386 0.9977 + .0025
B2 = 7.0 x
Case 5. B; = 2B2 z
Ak - -0.02662 2 -00036 -0.02566 0.9639 + .0135 -0.02718 1.0210 f .0135 k
C k 1.26719 f .00321 1.26575 0.9989 f .0025 1.26377 0.9973 + .0025 V ' C Note. A& k-km, where k,, (VIM) = 1.30184 f .00318 and km (SDX) = 1.29908. - - r k k,, V
C A l l unce r t a in t i e s represent 1-0 in t e rva l s and include only t he V I M Monte Carlo uncer ta in t ies . 0 I'-
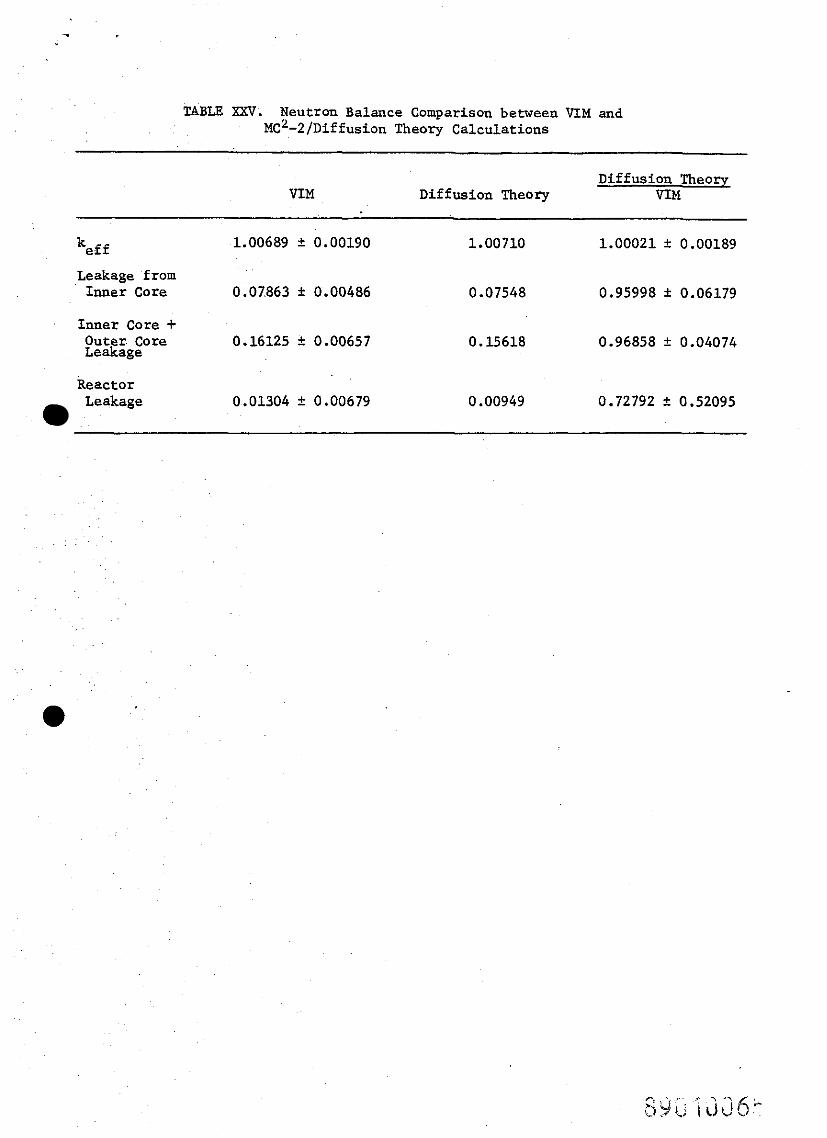
TABLE XXV. Neutron Balance Comparison between VIM and ~ ~ ~ - 2 / D i f fusion Theory Calculations
VIM Diffusion Theory
Diffusion Theory VIM
Leakage from Inner Core 0.07863 f 0.00486
Inner Core + Outer Core Leakage
Reactor Leakage
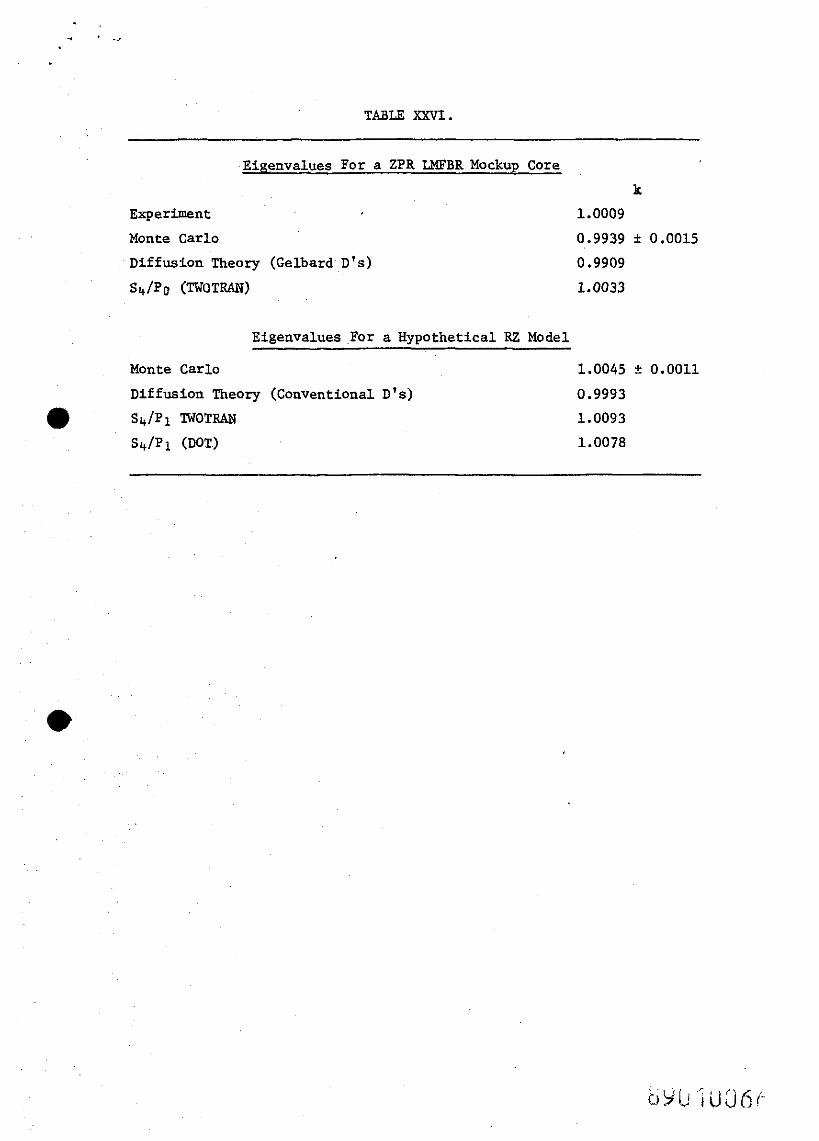
TABLE XXVI.
Experiment
Monte Carlo
Eigenvalues For a ZPR LMFBR Mockup Core
k
Diffusion Theory (Gelbard D's)
SI+/PD (TWOTRAN)
Eigenvalues For a Hypothetical RZ Model
Monte Carlo 1.0045 + 0.0011 Diffusion Theory (Conventional D's) 0.9993
a S4/P1 W T R A N 1.0093 S d P i ( W T ) 1.0078