Embed Size (px)
Citation preview
Monte Carlo simulation of sensitivity and NECR of an entire-bodyPET scanner
Ismet Isnaini • Takashi Obi • Eiji Yoshida •
Taiga Yamaya
Received: 4 June 2013 / Revised: 10 December 2013 / Accepted: 12 December 2013
� Japanese Society of Radiological Technology and Japan Society of Medical Physics 2013
Abstract The current positron emission tomography
(PET) design is aimed toward establishing an entire-body
PET scanner. An entire-body PET scanner is a scanner
whose axial field of view (FOV) covers the whole body of
a patient, whereas whole-body PET scanner can be of any
axial FOV length, but was designed for a whole-body scan.
Despite its high production cost, an entire-body depth-of-
interaction PET scanner offers many benefits, such as
shorter and dynamic PET time acquisition, as well as
higher sensitivity and count rate performance. This PET
scanner may be cost-effective for clinical PET scanners
with high scan throughput. In this work, we evaluated the
sensitivity and count rate performance of a 2-m-long PET
scanner with conventional data acquisition (DAQ) archi-
tecture, using Monte Carlo simulation, and we evaluated
two ring diameters (60 and 80 cm) to reduce the scanner
cost. From simulation of scanning with a 2-m axial FOV,
the sensitivity for a 2-m-long PET scanner of 60 and 80-cm
diameter is around 80 and 68 times higher, respectively,
than that of the conventional PET scanner. In addition, for
the 2-m-long PET scanner with 60-cm diameter, the peak
noise equivalent count rate (NECR) was 843 kcps at
125 MBq, whereas the peak for the 80-cm diameter was
989 kcps at 200 MBq. This shows gains of 15.3 and 17.95,
respectively, in comparison with that of the conventional
PET scanner. The 2-m-long PET scanner with 60-cm ring
diameter could not only reduce the number of detectors by
21 %, but also had a 17 % higher sensitivity compared to
that with an 80-cm ring diameter. On the other hand,
despite the higher sensitivity, the NECR of the 60-cm ring
diameter was smaller than that of the 80-cm ring diameter.
This results from the single data loss due to dead time,
whereas grouping of axially stacked detectors was used in
the conventional DAQ architecture. Parallelization of the
DAQ architecture is therefore important for the 2-m-long
PET scanner to achieve its optimal performance.
Keywords Entire-body PET � Sensitivity � NECR
1 Introduction
Currently, clinical positron emission tomography (PET)
scanners have about 20-cm axial field of view (FOV).
These PET scanners can image the whole body using six or
more bed positions. On the other hand, an entire-body PET
scanner with an extended axial FOV, which can trace
whole-body uptake images at the same time and improve
the sensitivity dynamically, has been desired [1, 2]. We use
a different term entire-body scanner to distinguish between
entire-body and whole-body PET scanner. An entire-body
PET is a PET scanner whose axial FOV covers the whole
body of a patient, while whole-body PET can be of any
FOV length, but was designed for a whole-body scan. In
other words, an entire-body PET scanner can reduce the
scan time dramatically. Eriksson et al. [3, 4] have reported
the feasibility of a PET scan time of sub-minutes using an
extended axial FOV and time-of-flight (TOF) information.
This PET scanner may be cost-effective for clinical use
with a high scan throughput. However, PET detectors are
I. Isnaini � T. Obi
Imaging Science and Engineering Laboratory, Tokyo Institute of
Technology, 4259 Nagatsuta-cho, Midori-ku,
Yokohama 226-8503, Japan
e-mail: [email protected]
E. Yoshida (&) � T. Yamaya
National Institute of Radiological Sciences, 4-9-1 Anagawa,
Inage-ku, Chiba 263-8555, Japan
e-mail: [email protected]
Radiol Phys Technol
DOI 10.1007/s12194-013-0253-y
the main cause of the high production cost of PET scanner
even now. Some researchers have reported an entire-body
PET scanner with cheaper and thinner scintillation detec-
tors to reduce the PET scanner production cost [5], but
unfortunately the efficiency of such detectors is rather low.
In addition, an entire-body PET scanner would have to
process a large amount of data compared to conventional
PET scanners; hence, it would hamper the image con-
struction process.
The entire-body PET scanner also has many oblique
lines of response (LORs). Several characteristics of oblique
LORs, such as poor spatial resolution and decreased sen-
sitivity due to a smaller solid angle fraction and increased
scatter fraction and attenuation [6], should be discussed
carefully. Oblique LORs are able to maintain high spatial
resolution if a depth-of-interaction (DOI) detector is used
[7, 8].
In this work, we focused on an evaluation of the sen-
sitivity and count rate performance of entire-body PET
scanner without an imaging test. We evaluated the sensi-
tivity and count rate performance of a 2-m-long PET
scanner with conventional data acquisition architecture
(DAQ) using Monte Carlo simulation, and we evaluated
two types of ring diameter for reducing the scanner cost. In
addition, we discuss some issues to be resolved for the
feasibility of an entire-body PET scanner. Our simulation
model implements the 4-layered depth-of-interaction (DOI)
PET scanner, but DOI information was not used in this
simulation.
2 Materials and methods
2.1 Simulation setup
The simulations were conducted by use of the GEANT4
application for tomographic emission (GATE) version 6.2,
installed on a 64-bit Linux personal computer (Intel Xeon
X3330 2.66 GHz). A back-to-back photon source was also
used in the simulation to improve the computational effi-
ciency. The time taken for each simulation depends on the
source activity being used and the total time set in the
macro file of GATE programming. For example, a simu-
lation for a source of 400 MBq with a simulation time of
20 ms would last for 2–3 h. The software has been widely
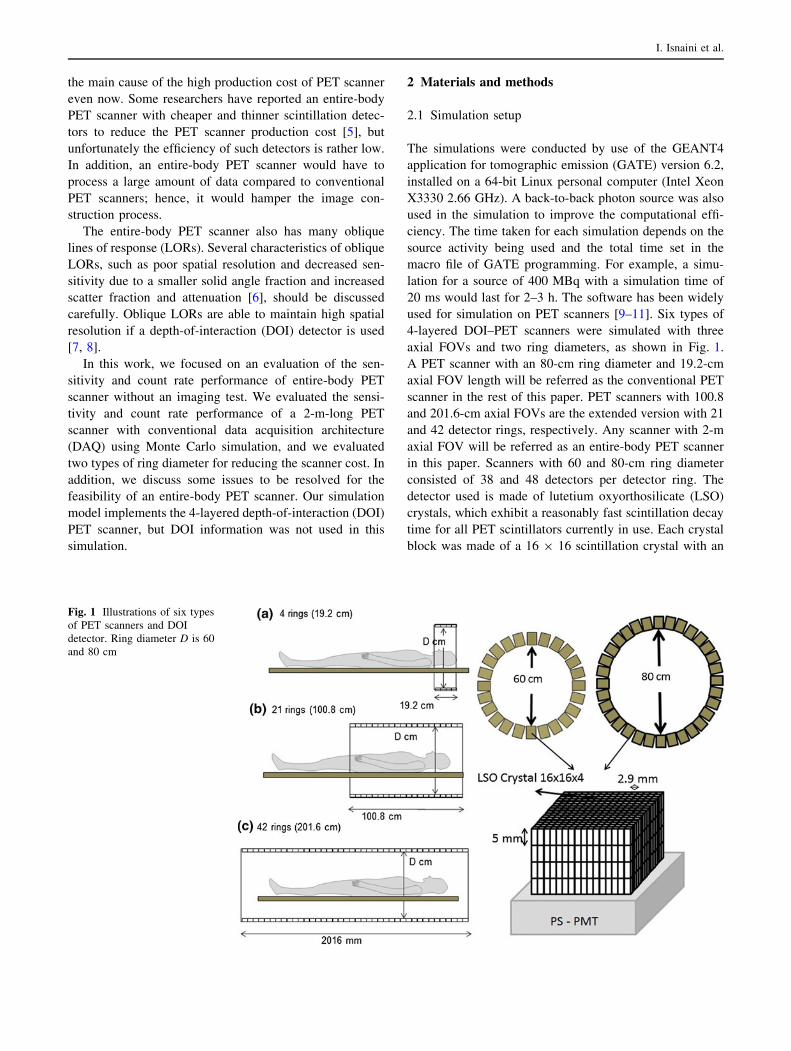
used for simulation on PET scanners [9–11]. Six types of
4-layered DOI–PET scanners were simulated with three
axial FOVs and two ring diameters, as shown in Fig. 1.
A PET scanner with an 80-cm ring diameter and 19.2-cm
axial FOV length will be referred as the conventional PET
scanner in the rest of this paper. PET scanners with 100.8
and 201.6-cm axial FOVs are the extended version with 21
and 42 detector rings, respectively. Any scanner with 2-m
axial FOV will be referred as an entire-body PET scanner
in this paper. Scanners with 60 and 80-cm ring diameter
consisted of 38 and 48 detectors per detector ring. The
detector used is made of lutetium oxyorthosilicate (LSO)
crystals, which exhibit a reasonably fast scintillation decay
time for all PET scintillators currently in use. Each crystal
block was made of a 16 9 16 scintillation crystal with an
Fig. 1 Illustrations of six types
of PET scanners and DOI
detector. Ring diameter D is 60
and 80 cm
I. Isnaini et al.
area dimension of 2.9 9 2.9 mm and a thickness of 5 mm,
arranged in 4 layers. Table 1 shows the specifications of
the six types of entire-body PET scanners. During the
simulation, a paralysable dead time (250 ns) was applied
on the single data for each detector block. Conventionally,
detector blocks are arranged axially into a grouping circuit
with a non-paralysable dead time before judging of coin-
cidence events. However, the single data collision into the
grouping circuit is increased for the entire-body PET
scanner. Single data are applied with non-paralysable dead
time (256 ns) for grouping of axially stacked detectors.
2.2 Sensitivity test
A 175-cm line source of 50 kBq was used in the simula-
tion, and the relative sensitivity for the six types of PET
scanners was measured. The source was set in the center of
the FOV. The number of detected true coincidences was
computed, and system sensitivity profiles with a single-bed
position were calculated, with each measurement time
being 1200 s. Another test is the sensitivity test with
multiple-bed positions, which is calculated with the use of
the same line source. The sensitivity is defined as the total
of true counts for each slice, as in the following formula:
Sensitivity profile with a single bed positioni
¼XSlice
j¼�Slice
Truei;j ð1Þ
Total sensitivity
¼XNo:ofbed
i¼1
Sensitivity profile with single bed position i;
ð2Þ
where i defines the index of number of bed required for
multi-bed acquisition, while slice is the distance of a par-
ticular slice from the center in cm.
Several bed positions were required for a shorter axial
FOV scanner, with different scanning times per bed, as
shown in Table 2. The total axial FOVs and measurement
times for different number of bed positions were 201.8 cm
and 1200 s, respectively. This total scanning time includes
the time taken to shift the bed from one position to another.
For example, in the case of 21 rings scanner, 396 s is the
individual scanning time and the rest of the time is used to
shift the bed twice, about 50 cm away to the next position,
with the assumption that the bed speed is 10 cm/s, the
shifting time is about 5 s. Likewise is for 4 rings scanner.
However, the real calculation time during the simulation
was about 12 h for the 42 rings scanner.
2.3 NECR test
For the noise equivalent count rate (NECR) test, we uti-
lized a solid polyethylene cylinder phantom (175 cm long
and 20 cm in diameter) with a 175-cm line source. This
phantom was a modified version of the NEMA NU-2 2001
standard phantom [12]. The phantom was placed in the
center of the FOV. The NECR was calculated as follows:
NECR ¼ T2
T þ Sþ 2R; ð3Þ
where, T, S, and R are the true, scatter, and random count
rates, respectively. By simply retrieving the true, scatter,
and random counts for different source activities, an NECR
graph was plotted and the peak NECRs was noted. The real
calculation time for a complete NECR graph was about
12 h for the 42 rings. The method of acquiring the scatter,
random, and true count is by counting the number of
occurrences for each event.
3 Results
3.1 Sensitivity
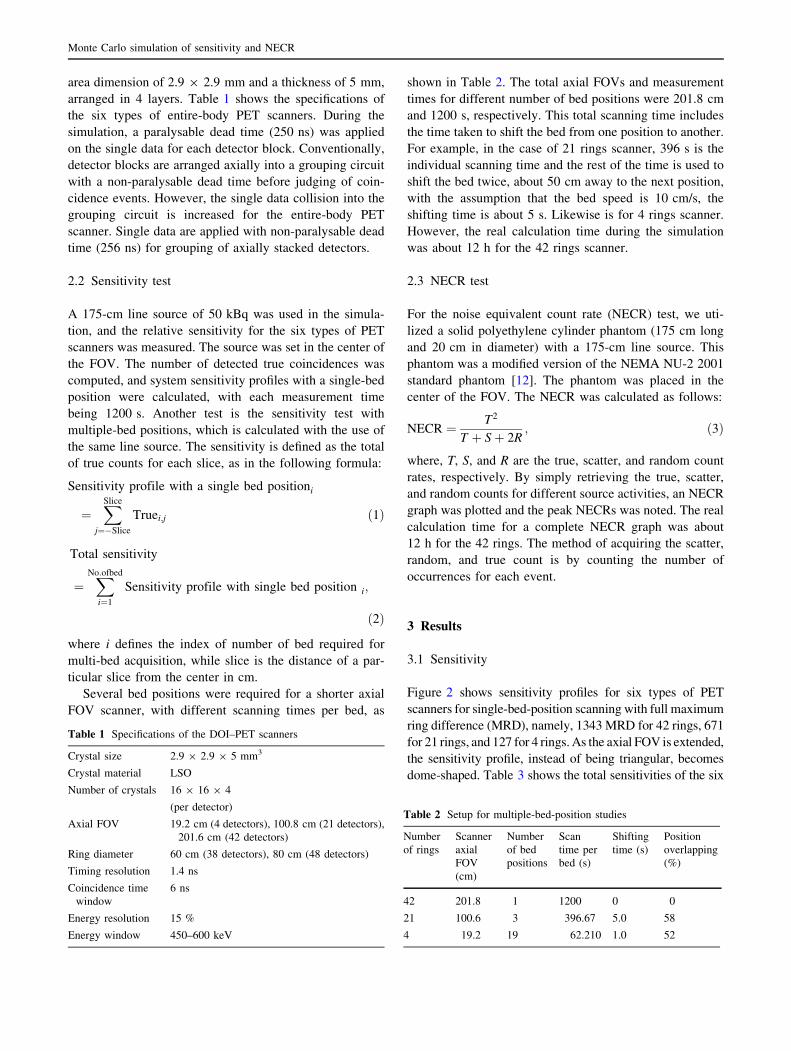
Figure 2 shows sensitivity profiles for six types of PET
scanners for single-bed-position scanning with full maximum
ring difference (MRD), namely, 1343 MRD for 42 rings, 671
for 21 rings, and 127 for 4 rings. As the axial FOV is extended,
the sensitivity profile, instead of being triangular, becomes
dome-shaped. Table 3 shows the total sensitivities of the six
Table 1 Specifications of the DOI–PET scanners
Crystal size 2.9 9 2.9 9 5 mm3
Crystal material LSO
Number of crystals 16 9 16 9 4
(per detector)
Axial FOV 19.2 cm (4 detectors), 100.8 cm (21 detectors),
201.6 cm (42 detectors)
Ring diameter 60 cm (38 detectors), 80 cm (48 detectors)
Timing resolution 1.4 ns
Coincidence time
window
6 ns
Energy resolution 15 %
Energy window 450–600 keV
Table 2 Setup for multiple-bed-position studies
Number
of rings
Scanner
axial
FOV
(cm)
Number
of bed
positions
Scan
time per
bed (s)
Shifting
time (s)
Position
overlapping
(%)
42 201.8 1 1200 0 0
21 100.6 3 396.67 5.0 58
4 19.2 19 62.210 1.0 52
Monte Carlo simulation of sensitivity and NECR
types of PET scanners for single-bed-position scanning. At the
center of the axial FOV, the sensitivity for a 2-m-long PET
scanner of 60-cm diameter was about 5.33 times higher than
for the conventional PET scanner. This means an increase of
approximately 17 % for the same length of scanner (2 m) with
a larger diameter (80 cm).
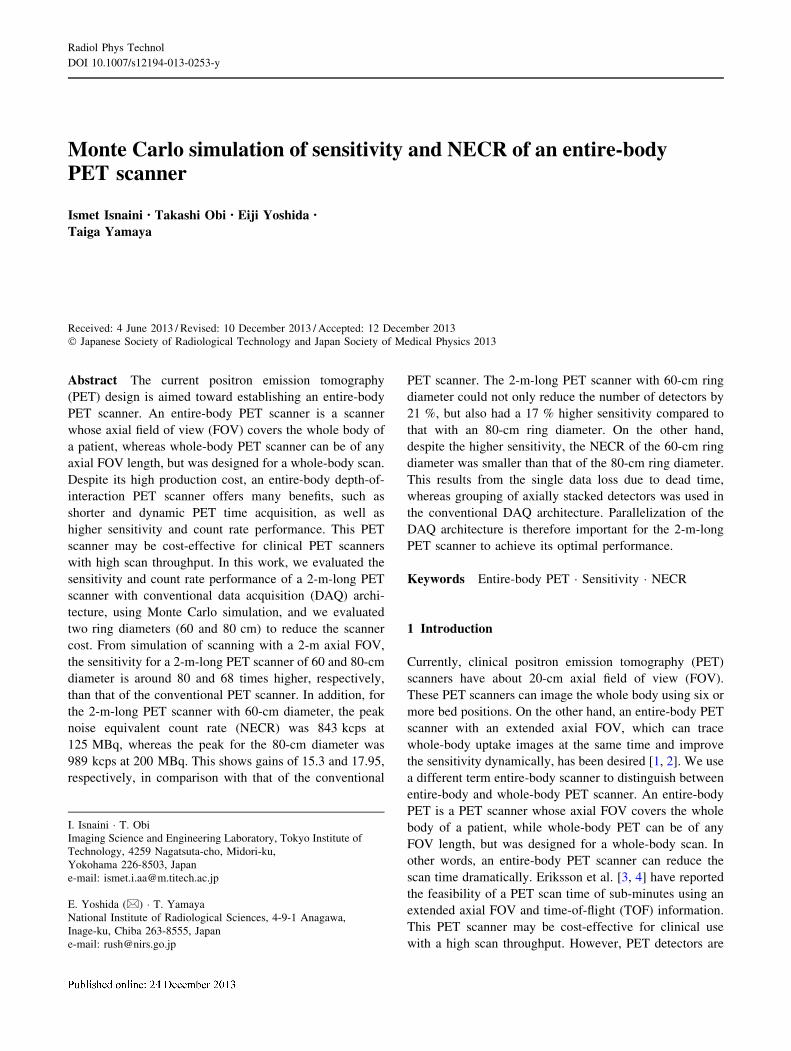
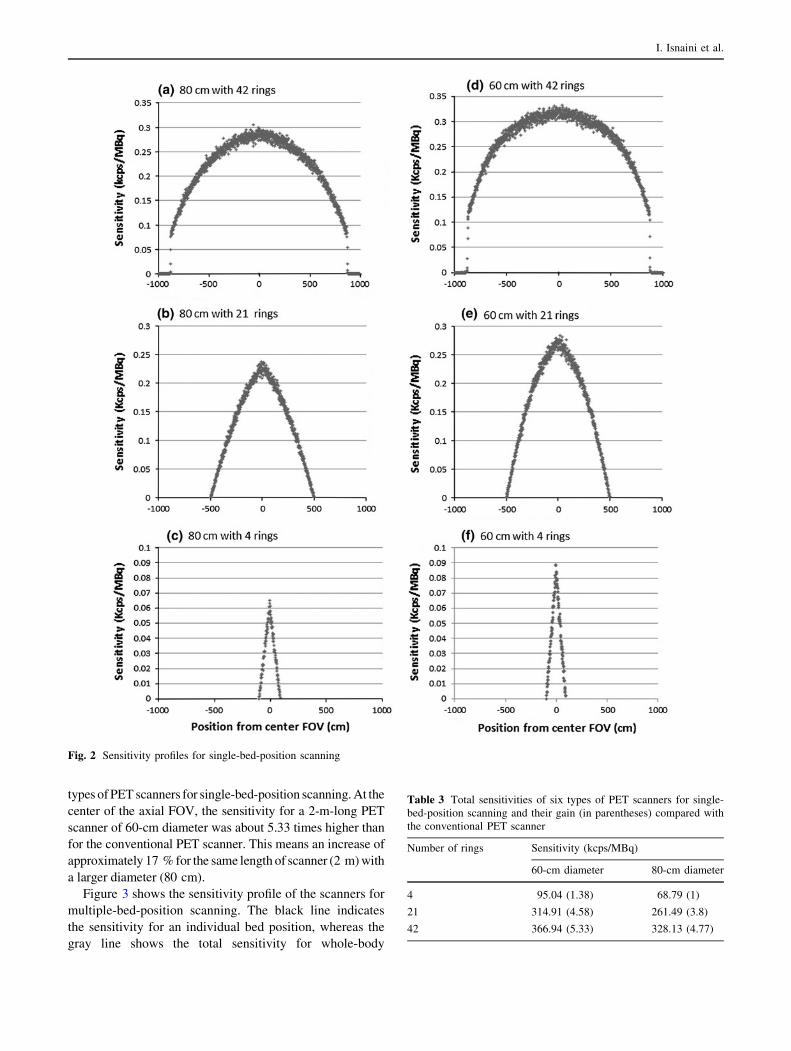
Figure 3 shows the sensitivity profile of the scanners for
multiple-bed-position scanning. The black line indicates
the sensitivity for an individual bed position, whereas the
gray line shows the total sensitivity for whole-body
Fig. 2 Sensitivity profiles for single-bed-position scanning
Table 3 Total sensitivities of six types of PET scanners for single-
bed-position scanning and their gain (in parentheses) compared with
the conventional PET scanner
Number of rings Sensitivity (kcps/MBq)
60-cm diameter 80-cm diameter
4 95.04 (1.38) 68.79 (1)
21 314.91 (4.58) 261.49 (3.8)
42 366.94 (5.33) 328.13 (4.77)
I. Isnaini et al.
scanning. The total sensitivity for a smaller scanner (60 cm
diameter) is almost 80 times higher than that for the con-
ventional PET scanner, as shown in Table 4.
3.2 NECR
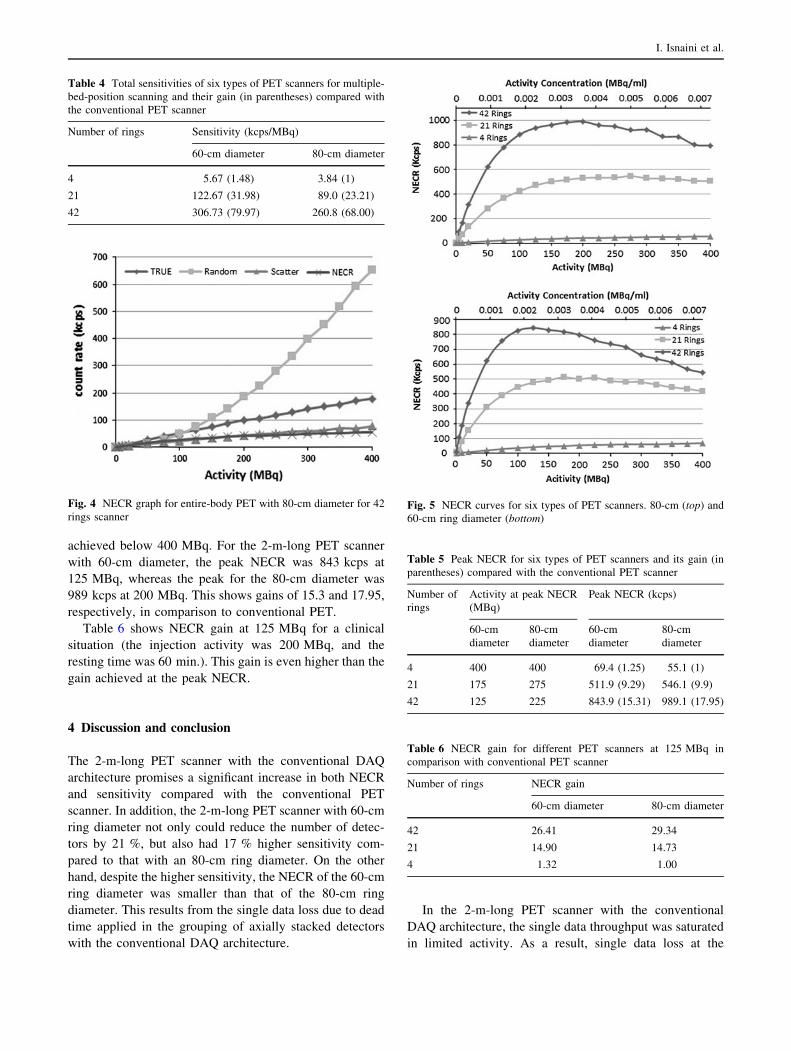
Figure 4 shows the complete NECR graph as well as ran-
dom, true, and scatter count rates for an entire-body PET of
80-cm diameter. As the random count increases especially
at higher activities, the value of the NECR decreases. This
is due to the fact that other count such as true and scatter
count does not have a significant increase on higher
activities.
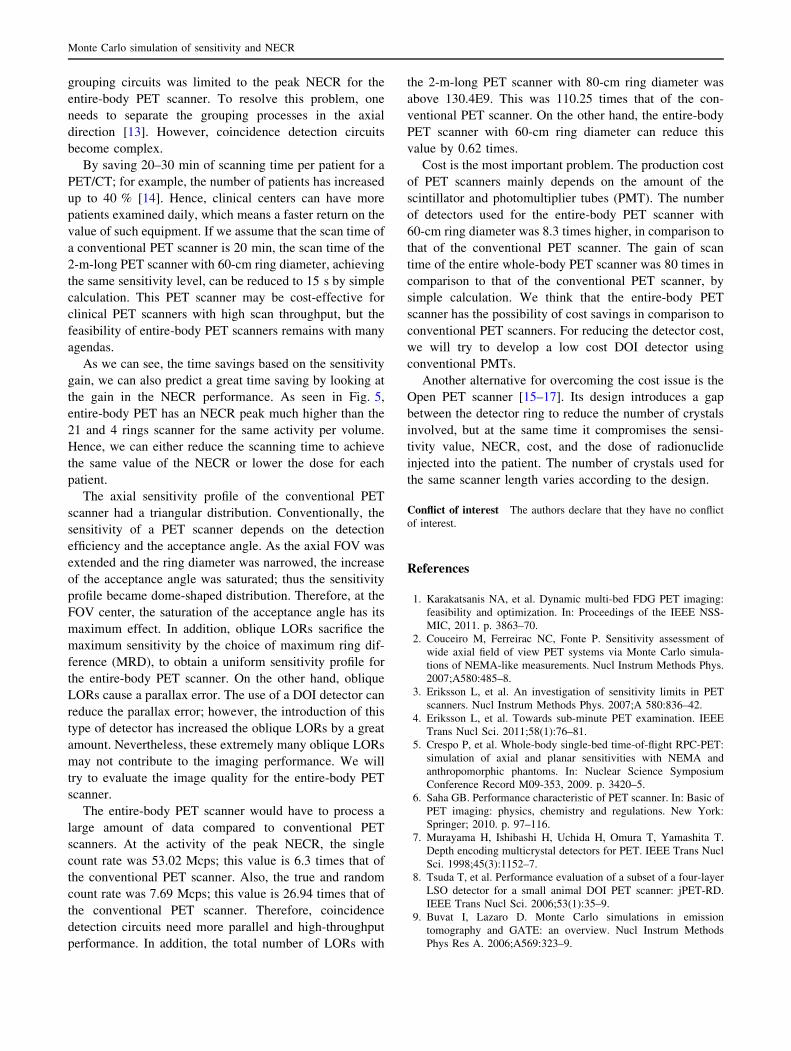
Figure 5 and Table 5 show NECR curves and peak
NECRs for the six types of PET scanners within 400 MBq.
In the case of 4 rings, the NECR maximum value was not
Fig. 3 Sensitivity profiles for multiple-bed-position scanning
Monte Carlo simulation of sensitivity and NECR
achieved below 400 MBq. For the 2-m-long PET scanner
with 60-cm diameter, the peak NECR was 843 kcps at
125 MBq, whereas the peak for the 80-cm diameter was
989 kcps at 200 MBq. This shows gains of 15.3 and 17.95,
respectively, in comparison to conventional PET.
Table 6 shows NECR gain at 125 MBq for a clinical
situation (the injection activity was 200 MBq, and the
resting time was 60 min.). This gain is even higher than the
gain achieved at the peak NECR.
4 Discussion and conclusion
The 2-m-long PET scanner with the conventional DAQ
architecture promises a significant increase in both NECR
and sensitivity compared with the conventional PET
scanner. In addition, the 2-m-long PET scanner with 60-cm
ring diameter not only could reduce the number of detec-
tors by 21 %, but also had 17 % higher sensitivity com-
pared to that with an 80-cm ring diameter. On the other
hand, despite the higher sensitivity, the NECR of the 60-cm
ring diameter was smaller than that of the 80-cm ring
diameter. This results from the single data loss due to dead
time applied in the grouping of axially stacked detectors
with the conventional DAQ architecture.
In the 2-m-long PET scanner with the conventional
DAQ architecture, the single data throughput was saturated
in limited activity. As a result, single data loss at the
Table 4 Total sensitivities of six types of PET scanners for multiple-
bed-position scanning and their gain (in parentheses) compared with
the conventional PET scanner
Number of rings Sensitivity (kcps/MBq)
60-cm diameter 80-cm diameter
4 5.67 (1.48) 3.84 (1)
21 122.67 (31.98) 89.0 (23.21)
42 306.73 (79.97) 260.8 (68.00)
Fig. 4 NECR graph for entire-body PET with 80-cm diameter for 42
rings scannerFig. 5 NECR curves for six types of PET scanners. 80-cm (top) and
60-cm ring diameter (bottom)
Table 5 Peak NECR for six types of PET scanners and its gain (in
parentheses) compared with the conventional PET scanner
Number of
rings
Activity at peak NECR
(MBq)
Peak NECR (kcps)
60-cm
diameter
80-cm
diameter
60-cm
diameter
80-cm
diameter
4 400 400 69.4 (1.25) 55.1 (1)
21 175 275 511.9 (9.29) 546.1 (9.9)
42 125 225 843.9 (15.31) 989.1 (17.95)
Table 6 NECR gain for different PET scanners at 125 MBq in
comparison with conventional PET scanner
Number of rings NECR gain
60-cm diameter 80-cm diameter
42 26.41 29.34
21 14.90 14.73
4 1.32 1.00
I. Isnaini et al.
grouping circuits was limited to the peak NECR for the
entire-body PET scanner. To resolve this problem, one
needs to separate the grouping processes in the axial
direction [13]. However, coincidence detection circuits
become complex.
By saving 20–30 min of scanning time per patient for a
PET/CT; for example, the number of patients has increased
up to 40 % [14]. Hence, clinical centers can have more
patients examined daily, which means a faster return on the
value of such equipment. If we assume that the scan time of
a conventional PET scanner is 20 min, the scan time of the
2-m-long PET scanner with 60-cm ring diameter, achieving
the same sensitivity level, can be reduced to 15 s by simple
calculation. This PET scanner may be cost-effective for
clinical PET scanners with high scan throughput, but the
feasibility of entire-body PET scanners remains with many
agendas.
As we can see, the time savings based on the sensitivity
gain, we can also predict a great time saving by looking at
the gain in the NECR performance. As seen in Fig. 5,
entire-body PET has an NECR peak much higher than the
21 and 4 rings scanner for the same activity per volume.
Hence, we can either reduce the scanning time to achieve
the same value of the NECR or lower the dose for each
patient.
The axial sensitivity profile of the conventional PET
scanner had a triangular distribution. Conventionally, the
sensitivity of a PET scanner depends on the detection
efficiency and the acceptance angle. As the axial FOV was
extended and the ring diameter was narrowed, the increase
of the acceptance angle was saturated; thus the sensitivity
profile became dome-shaped distribution. Therefore, at the
FOV center, the saturation of the acceptance angle has its
maximum effect. In addition, oblique LORs sacrifice the
maximum sensitivity by the choice of maximum ring dif-
ference (MRD), to obtain a uniform sensitivity profile for
the entire-body PET scanner. On the other hand, oblique
LORs cause a parallax error. The use of a DOI detector can
reduce the parallax error; however, the introduction of this
type of detector has increased the oblique LORs by a great
amount. Nevertheless, these extremely many oblique LORs
may not contribute to the imaging performance. We will
try to evaluate the image quality for the entire-body PET
scanner.
The entire-body PET scanner would have to process a
large amount of data compared to conventional PET
scanners. At the activity of the peak NECR, the single
count rate was 53.02 Mcps; this value is 6.3 times that of
the conventional PET scanner. Also, the true and random
count rate was 7.69 Mcps; this value is 26.94 times that of
the conventional PET scanner. Therefore, coincidence
detection circuits need more parallel and high-throughput
performance. In addition, the total number of LORs with
the 2-m-long PET scanner with 80-cm ring diameter was
above 130.4E9. This was 110.25 times that of the con-
ventional PET scanner. On the other hand, the entire-body
PET scanner with 60-cm ring diameter can reduce this
value by 0.62 times.
Cost is the most important problem. The production cost
of PET scanners mainly depends on the amount of the
scintillator and photomultiplier tubes (PMT). The number
of detectors used for the entire-body PET scanner with
60-cm ring diameter was 8.3 times higher, in comparison to
that of the conventional PET scanner. The gain of scan
time of the entire whole-body PET scanner was 80 times in
comparison to that of the conventional PET scanner, by
simple calculation. We think that the entire-body PET
scanner has the possibility of cost savings in comparison to
conventional PET scanners. For reducing the detector cost,
we will try to develop a low cost DOI detector using
conventional PMTs.
Another alternative for overcoming the cost issue is the
Open PET scanner [15–17]. Its design introduces a gap
between the detector ring to reduce the number of crystals
involved, but at the same time it compromises the sensi-
tivity value, NECR, cost, and the dose of radionuclide
injected into the patient. The number of crystals used for
the same scanner length varies according to the design.
Conflict of interest The authors declare that they have no conflict
of interest.
References
1. Karakatsanis NA, et al. Dynamic multi-bed FDG PET imaging:
feasibility and optimization. In: Proceedings of the IEEE NSS-
MIC, 2011. p. 3863–70.
2. Couceiro M, Ferreirac NC, Fonte P. Sensitivity assessment of
wide axial field of view PET systems via Monte Carlo simula-
tions of NEMA-like measurements. Nucl Instrum Methods Phys.
2007;A580:485–8.
3. Eriksson L, et al. An investigation of sensitivity limits in PET
scanners. Nucl Instrum Methods Phys. 2007;A 580:836–42.
4. Eriksson L, et al. Towards sub-minute PET examination. IEEE
Trans Nucl Sci. 2011;58(1):76–81.
5. Crespo P, et al. Whole-body single-bed time-of-flight RPC-PET:
simulation of axial and planar sensitivities with NEMA and
anthropomorphic phantoms. In: Nuclear Science Symposium
Conference Record M09-353, 2009. p. 3420–5.
6. Saha GB. Performance characteristic of PET scanner. In: Basic of
PET imaging: physics, chemistry and regulations. New York:
Springer; 2010. p. 97–116.
7. Murayama H, Ishibashi H, Uchida H, Omura T, Yamashita T.
Depth encoding multicrystal detectors for PET. IEEE Trans Nucl
Sci. 1998;45(3):1152–7.
8. Tsuda T, et al. Performance evaluation of a subset of a four-layer
LSO detector for a small animal DOI PET scanner: jPET-RD.
IEEE Trans Nucl Sci. 2006;53(1):35–9.
9. Buvat I, Lazaro D. Monte Carlo simulations in emission
tomography and GATE: an overview. Nucl Instrum Methods
Phys Res A. 2006;A569:323–9.
Monte Carlo simulation of sensitivity and NECR
10. Jan, et al. GATE: a simulation toolkit for PET and SPECT. Phys
Med Biol. 2004;49:4543–61.
11. Assie K, et al. Monte Carlo simulation in PET and SPECT
instrumentation using GATE. Nucl Instrum Methods Phys Res A.
2004;A527:180–9.
12. Performance measurements of positron emission tomographs,
NEMA standards Pub. NU 2–2007, National Electrical Manu-
facturers Association, Rosslyn, 2007.
13. Yoshida E, Yamaya T, Nishikido F, Inadama N, Murayama H.
Basic study of entire whole-body PET scanners based on the
OpenPET geometry. Nucl Instrum Methods Phys Res. 2010;A
621:576–80.
14. Muhammad WS, Ifigenia T, Nektaria M, Kostas S. Role and cost
effectiveness of PET/CT in management of patients with cancer.
Yale J Bio Med. 2010;83:53–65.
15. Yamaya T, Inaniwa T, Minohara S, Yoshida E, Inadama N,
Nishikido F, Shibuya K, Lam CF, Murayama H. A proposal of an
open PET geometry. Phys Med Biol. 2008;53(3):757–77.
16. Yoshida E, Yamaya T, Shibuya K, Nishikido F, Inadama N,
Murayama H. Simulation study on sensitivity and count rate
characteristics of ‘‘OpenPET’’ geometries. IEEE Trans Nucl Sci.
2010;57(1):111–6.
17. Yoshida E, Yamaya T, Nishikido F, Inadama N and Murayama
H. Feasibility study of entire whole-body PET scanners based on
the OpenPET geometry. In: Proceedings of the IEEE Nuclear
Science Symposium Conference Record, 2009. p. 3628–9.
I. Isnaini et al.