Embed Size (px)
Citation preview
1 | P a g e
Monthly Budget Statement MFMA Section 71 Report JULY 2018
Govan Mbeki Municipality
P a g e | 2
2 | P a g e Section 71 report
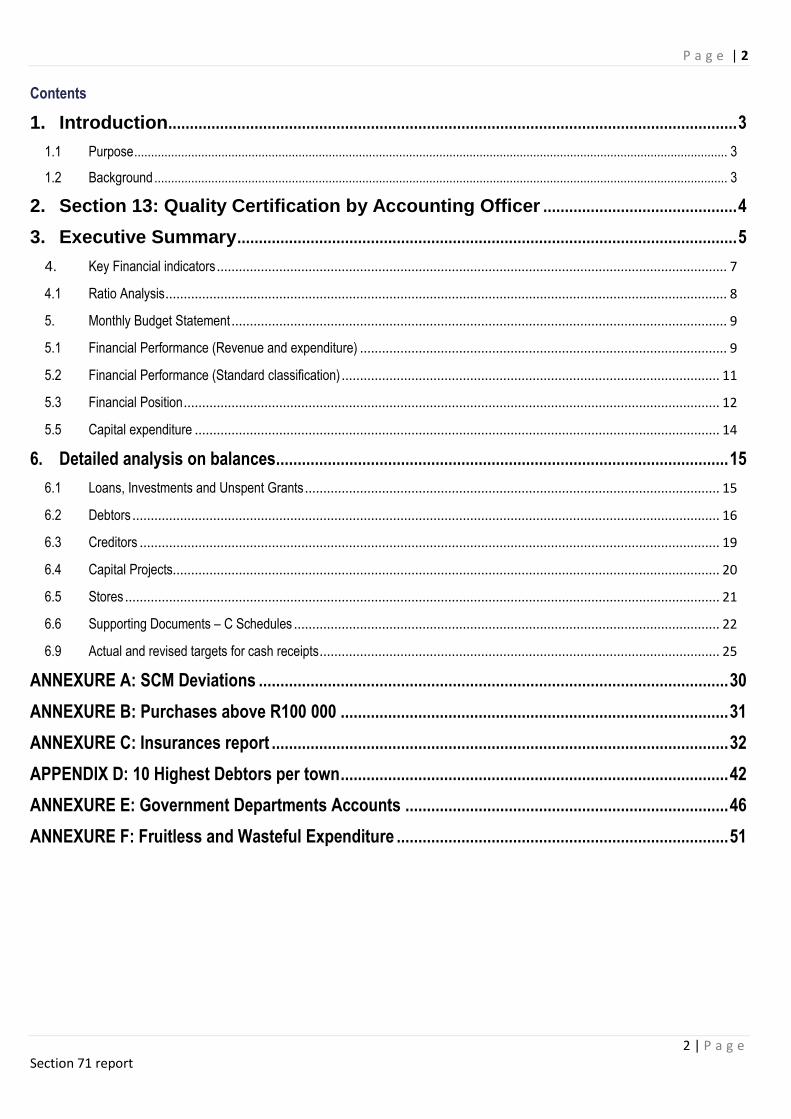
Contents
1. Introduction .................................................................................................................................... 3
1.1 Purpose ................................................................................................................................................................................. 3
1.2 Background ........................................................................................................................................................................... 3
2. Section 13: Quality Certification by Accounting Officer ............................................. 4
3. Executive Summary .................................................................................................................... 5
4. Key Financial indicators ........................................................................................................................................... 7
4.1 Ratio Analysis ......................................................................................................................................................... 8
5. Monthly Budget Statement ....................................................................................................................................... 9
5.1 Financial Performance (Revenue and expenditure) .................................................................................................... 9
5.2 Financial Performance (Standard classification) ....................................................................................................... 11
5.3 Financial Position .................................................................................................................................................. 12
5.5 Capital expenditure ............................................................................................................................................... 14
6. Detailed analysis on balances ......................................................................................................... 15
6.1 Loans, Investments and Unspent Grants ................................................................................................................. 15
6.2 Debtors ................................................................................................................................................................ 16
6.3 Creditors .............................................................................................................................................................. 19
6.4 Capital Projects..................................................................................................................................................... 20
6.5 Stores .................................................................................................................................................................. 21
6.6 Supporting Documents – C Schedules .................................................................................................................... 22
6.9 Actual and revised targets for cash receipts ............................................................................................................. 25
ANNEXURE A: SCM Deviations ............................................................................................................. 30
ANNEXURE B: Purchases above R100 000 .......................................................................................... 31
ANNEXURE C: Insurances report .......................................................................................................... 32
APPENDIX D: 10 Highest Debtors per town .......................................................................................... 42
ANNEXURE E: Government Departments Accounts ........................................................................... 46
ANNEXURE F: Fruitless and Wasteful Expenditure ............................................................................. 51
P a g e | 3
3 | P a g e Section 71 report
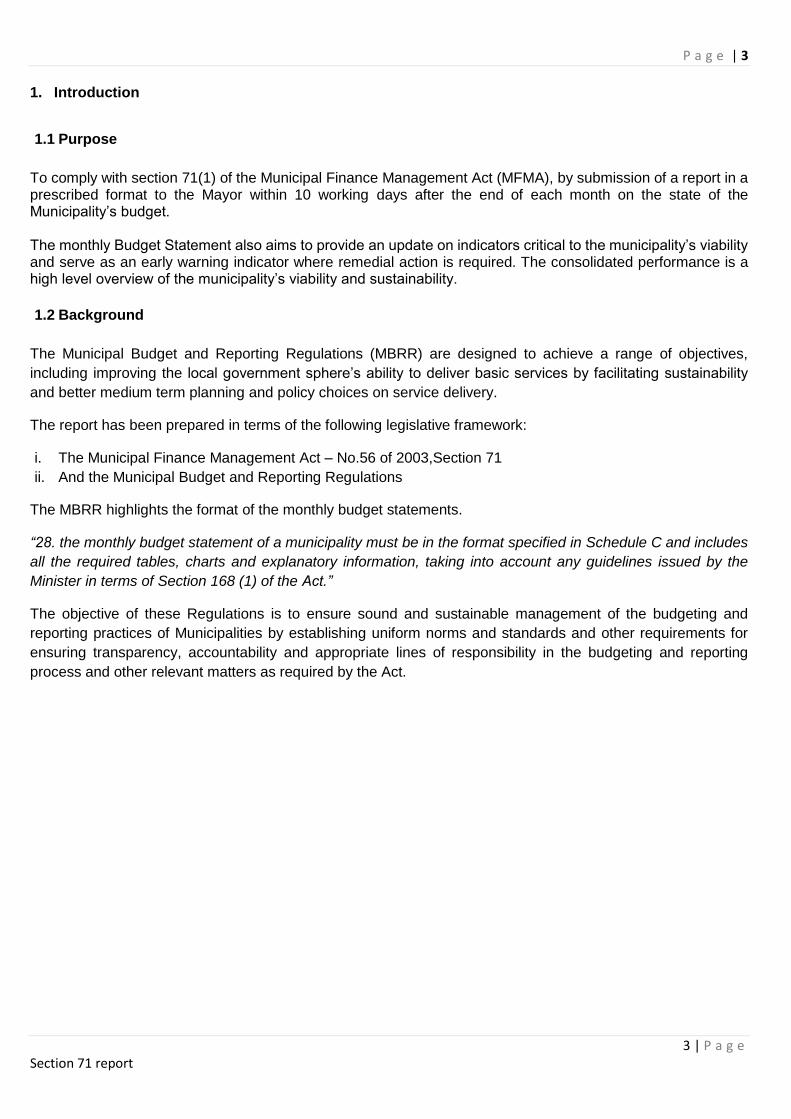
1. Introduction
1.1 Purpose
To comply with section 71(1) of the Municipal Finance Management Act (MFMA), by submission of a report in a prescribed format to the Mayor within 10 working days after the end of each month on the state of the Municipality’s budget. The monthly Budget Statement also aims to provide an update on indicators critical to the municipality’s viability and serve as an early warning indicator where remedial action is required. The consolidated performance is a high level overview of the municipality’s viability and sustainability.
1.2 Background
The Municipal Budget and Reporting Regulations (MBRR) are designed to achieve a range of objectives,
including improving the local government sphere’s ability to deliver basic services by facilitating sustainability
and better medium term planning and policy choices on service delivery.
The report has been prepared in terms of the following legislative framework:
i. The Municipal Finance Management Act – No.56 of 2003,Section 71
ii. And the Municipal Budget and Reporting Regulations
The MBRR highlights the format of the monthly budget statements.
“28. the monthly budget statement of a municipality must be in the format specified in Schedule C and includes
all the required tables, charts and explanatory information, taking into account any guidelines issued by the
Minister in terms of Section 168 (1) of the Act.”
The objective of these Regulations is to ensure sound and sustainable management of the budgeting and
reporting practices of Municipalities by establishing uniform norms and standards and other requirements for
ensuring transparency, accountability and appropriate lines of responsibility in the budgeting and reporting
process and other relevant matters as required by the Act.
P a g e | 4
4 | P a g e Section 71 report
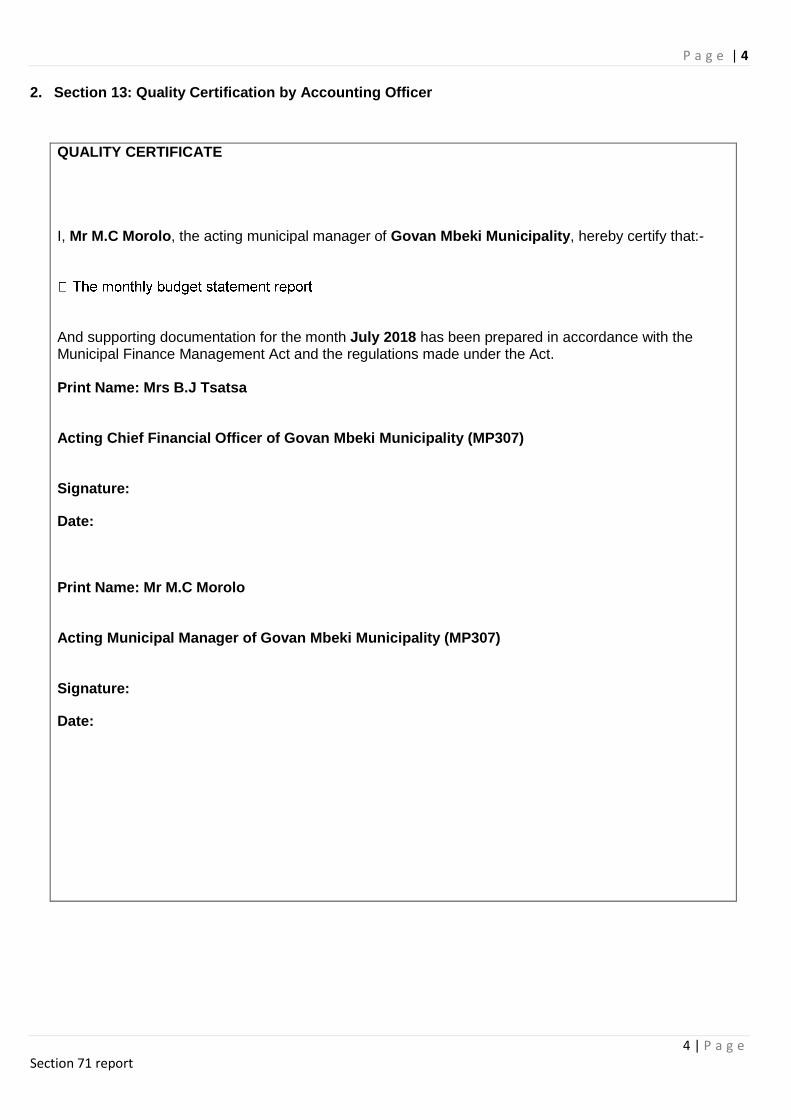
2. Section 13: Quality Certification by Accounting Officer
QUALITY CERTIFICATE I, Mr M.C Morolo, the acting municipal manager of Govan Mbeki Municipality, hereby certify that:-
And supporting documentation for the month July 2018 has been prepared in accordance with the Municipal Finance Management Act and the regulations made under the Act. Print Name: Mrs B.J Tsatsa Acting Chief Financial Officer of Govan Mbeki Municipality (MP307) Signature:
Date:
Print Name: Mr M.C Morolo Acting Municipal Manager of Govan Mbeki Municipality (MP307) Signature:
Date:
P a g e | 5
5 | P a g e Section 71 report
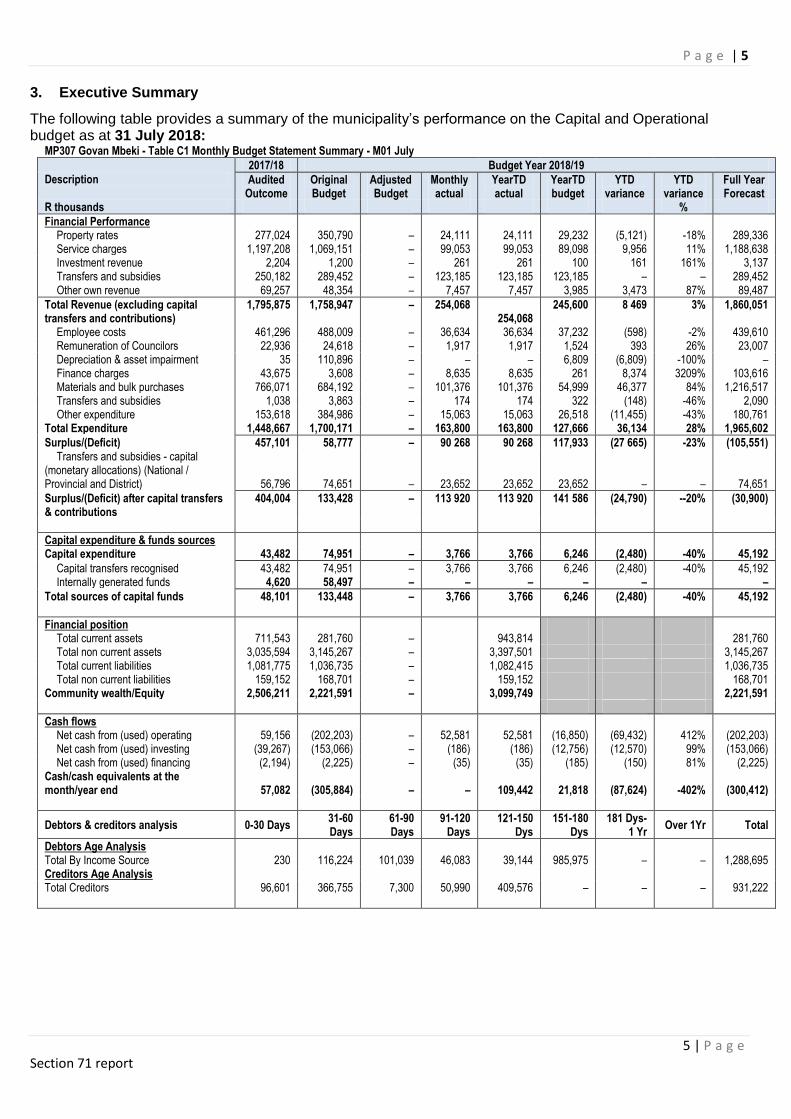
3. Executive Summary
The following table provides a summary of the municipality’s performance on the Capital and Operational budget as at 31 July 2018:
MP307 Govan Mbeki - Table C1 Monthly Budget Statement Summary - M01 July
Description
2017/18 Budget Year 2018/19
Audited Outcome
Original Budget
Adjusted Budget
Monthly actual
YearTD actual
YearTD budget
YTD variance
YTD variance
Full Year Forecast
R thousands %
Financial Performance Property rates 277,024 350,790 – 24,111 24,111 29,232 (5,121) -18% 289,336 Service charges 1,197,208 1,069,151 – 99,053 99,053 89,098 9,956 11% 1,188,638 Investment revenue 2,204 1,200 – 261 261 100 161 161% 3,137 Transfers and subsidies 250,182 289,452 – 123,185 123,185 123,185 – – 289,452 Other own revenue 69,257 48,354 – 7,457 7,457 3,985 3,473 87% 89,487
Total Revenue (excluding capital transfers and contributions)
1,795,875 1,758,947 – 254,068 254,068
245,600 8 469 3% 1,860,051
Employee costs 461,296 488,009 – 36,634 36,634 37,232 (598) -2% 439,610 Remuneration of Councilors 22,936 24,618 – 1,917 1,917 1,524 393 26% 23,007 Depreciation & asset impairment 35 110,896 – – – 6,809 (6,809) -100% – Finance charges 43,675 3,608 – 8,635 8,635 261 8,374 3209% 103,616 Materials and bulk purchases 766,071 684,192 – 101,376 101,376 54,999 46,377 84% 1,216,517 Transfers and subsidies 1,038 3,863 – 174 174 322 (148) -46% 2,090 Other expenditure 153,618 384,986 – 15,063 15,063 26,518 (11,455) -43% 180,761
Total Expenditure 1,448,667 1,700,171 – 163,800 163,800 127,666 36,134 28% 1,965,602
Surplus/(Deficit) 457,101 58,777 – 90 268 90 268 117,933 (27 665) -23% (105,551) Transfers and subsidies - capital
(monetary allocations) (National / Provincial and District) 56,796 74,651 – 23,652 23,652 23,652 – – 74,651
Surplus/(Deficit) after capital transfers & contributions
404,004 133,428 – 113 920 113 920 141 586 (24,790) --20% (30,900)
Capital expenditure & funds sources Capital expenditure 43,482 74,951 – 3,766 3,766 6,246 (2,480) -40% 45,192
Capital transfers recognised 43,482 74,951 – 3,766 3,766 6,246 (2,480) -40% 45,192 Internally generated funds 4,620 58,497 – – – – – –
Total sources of capital funds 48,101 133,448 – 3,766 3,766 6,246 (2,480) -40% 45,192
Financial position Total current assets 711,543 281,760 – 943,814 281,760 Total non current assets 3,035,594 3,145,267 – 3,397,501 3,145,267 Total current liabilities 1,081,775 1,036,735 – 1,082,415 1,036,735 Total non current liabilities 159,152 168,701 – 159,152 168,701
Community wealth/Equity 2,506,211 2,221,591 – 3,099,749 2,221,591
Cash flows Net cash from (used) operating 59,156 (202,203) – 52,581 52,581 (16,850) (69,432) 412% (202,203) Net cash from (used) investing (39,267) (153,066) – (186) (186) (12,756) (12,570) 99% (153,066) Net cash from (used) financing (2,194) (2,225) – (35) (35) (185) (150) 81% (2,225)
Cash/cash equivalents at the month/year end 57,082 (305,884) – – 109,442 21,818 (87,624) -402% (300,412)
Debtors & creditors analysis 0-30 Days 31-60 Days
61-90 Days
91-120 Days
121-150 Dys
151-180 Dys
181 Dys-1 Yr
Over 1Yr Total
Debtors Age Analysis Total By Income Source 230 116,224 101,039 46,083 39,144 985,975 – – 1,288,695 Creditors Age Analysis Total Creditors 96,601 366,755 7,300 50,990 409,576 – – – 931,222
P a g e | 6
6 | P a g e Section 71 report
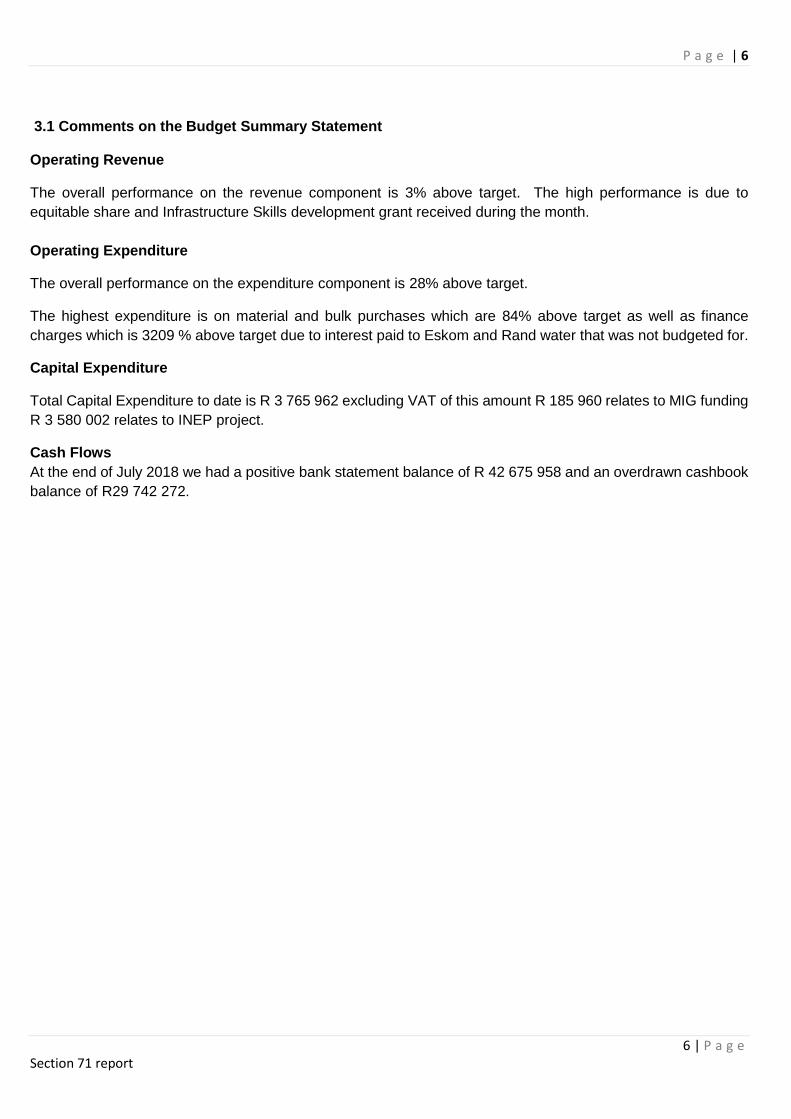
3.1 Comments on the Budget Summary Statement Operating Revenue
The overall performance on the revenue component is 3% above target. The high performance is due to
equitable share and Infrastructure Skills development grant received during the month.
Operating Expenditure
The overall performance on the expenditure component is 28% above target.
The highest expenditure is on material and bulk purchases which are 84% above target as well as finance
charges which is 3209 % above target due to interest paid to Eskom and Rand water that was not budgeted for.
Capital Expenditure
Total Capital Expenditure to date is R 3 765 962 excluding VAT of this amount R 185 960 relates to MIG funding
R 3 580 002 relates to INEP project.
Cash Flows
At the end of July 2018 we had a positive bank statement balance of R 42 675 958 and an overdrawn cashbook
balance of R29 742 272.
P a g e | 7
7 | P a g e Section 71 report
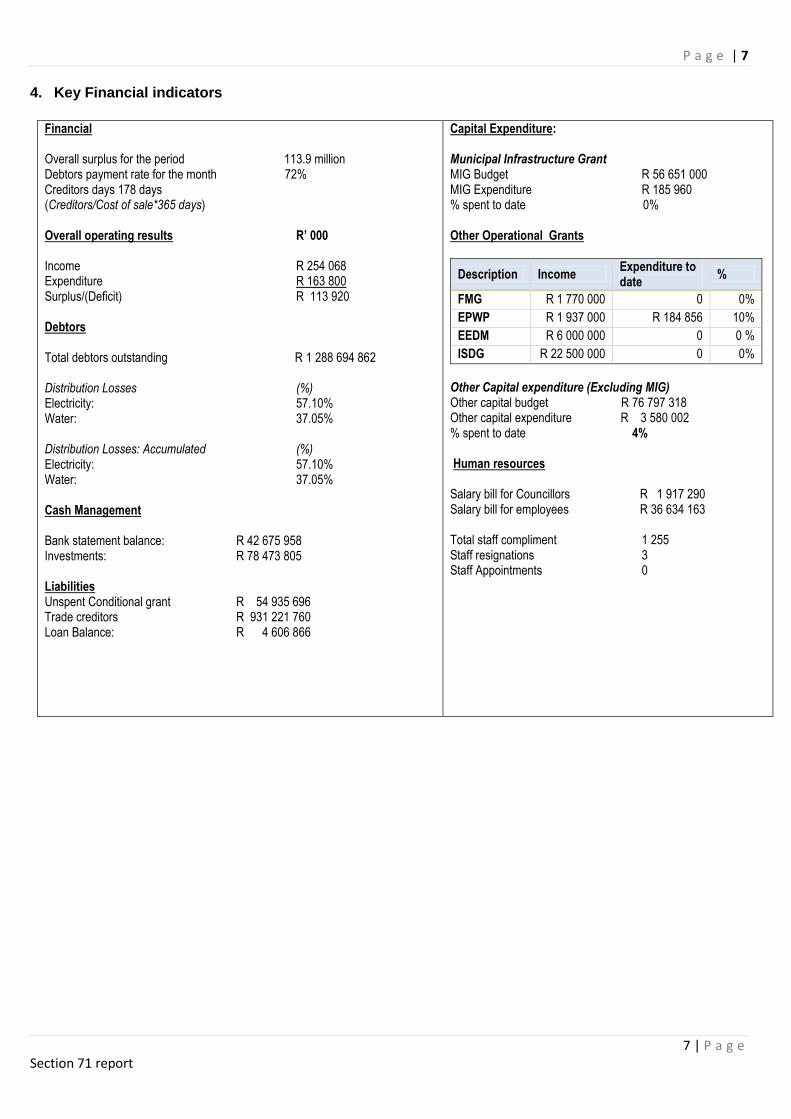
4. Key Financial indicators
Financial Overall surplus for the period 113.9 million Debtors payment rate for the month 72% Creditors days 178 days (Creditors/Cost of sale*365 days) Overall operating results R’ 000 Income R 254 068 Expenditure R 163 800 Surplus/(Deficit) R 113 920 Debtors Total debtors outstanding R 1 288 694 862 Distribution Losses (%) Electricity: 57.10% Water: 37.05% Distribution Losses: Accumulated (%) Electricity: 57.10% Water: 37.05% Cash Management Bank statement balance: R 42 675 958 Investments: R 78 473 805 Liabilities Unspent Conditional grant R 54 935 696 Trade creditors R 931 221 760 Loan Balance: R 4 606 866
Capital Expenditure: Municipal Infrastructure Grant MIG Budget R 56 651 000 MIG Expenditure R 185 960 % spent to date 0% Other Operational Grants
Description Income Expenditure to date
%
FMG R 1 770 000 0 0%
EPWP R 1 937 000 R 184 856 10%
EEDM R 6 000 000 0 0 %
ISDG R 22 500 000 0 0%
Other Capital expenditure (Excluding MIG) Other capital budget R 76 797 318 Other capital expenditure R 3 580 002 % spent to date 4% Human resources Salary bill for Councillors R 1 917 290 Salary bill for employees R 36 634 163 Total staff compliment 1 255 Staff resignations 3 Staff Appointments 0
P a g e | 8
8 | P a g e Section 71 report
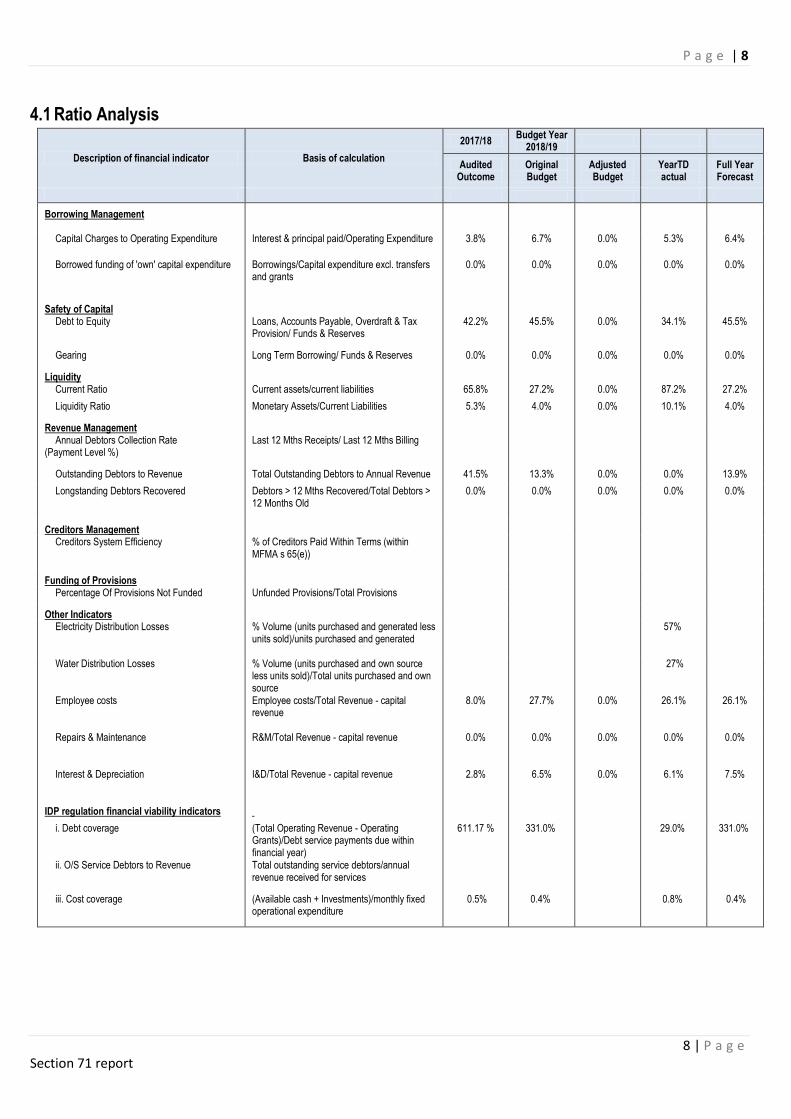
4.1 Ratio Analysis
Description of financial indicator Basis of calculation
2017/18 Budget Year
2018/19
Audited Outcome
Original Budget
Adjusted Budget
YearTD actual
Full Year Forecast
Borrowing Management
Capital Charges to Operating Expenditure Interest & principal paid/Operating Expenditure 3.8% 6.7% 0.0% 5.3% 6.4%
Borrowed funding of 'own' capital expenditure Borrowings/Capital expenditure excl. transfers and grants
0.0% 0.0% 0.0% 0.0% 0.0%
Safety of Capital
Debt to Equity Loans, Accounts Payable, Overdraft & Tax Provision/ Funds & Reserves
42.2% 45.5% 0.0% 34.1% 45.5%
Gearing Long Term Borrowing/ Funds & Reserves 0.0% 0.0% 0.0% 0.0% 0.0%
Liquidity
Current Ratio Current assets/current liabilities 65.8% 27.2% 0.0% 87.2% 27.2%
Liquidity Ratio Monetary Assets/Current Liabilities 5.3% 4.0% 0.0% 10.1% 4.0%
Revenue Management
Annual Debtors Collection Rate (Payment Level %)
Last 12 Mths Receipts/ Last 12 Mths Billing
Outstanding Debtors to Revenue Total Outstanding Debtors to Annual Revenue 41.5% 13.3% 0.0% 0.0% 13.9%
Longstanding Debtors Recovered Debtors > 12 Mths Recovered/Total Debtors > 12 Months Old
0.0% 0.0% 0.0% 0.0% 0.0%
Creditors Management
Creditors System Efficiency % of Creditors Paid Within Terms (within MFMA s 65(e))
Funding of Provisions
Percentage Of Provisions Not Funded Unfunded Provisions/Total Provisions
Other Indicators
Electricity Distribution Losses % Volume (units purchased and generated less units sold)/units purchased and generated
57%
Water Distribution Losses % Volume (units purchased and own source less units sold)/Total units purchased and own source
27%
Employee costs Employee costs/Total Revenue - capital revenue
8.0% 27.7% 0.0% 26.1% 26.1%
Repairs & Maintenance R&M/Total Revenue - capital revenue 0.0% 0.0% 0.0% 0.0% 0.0%
Interest & Depreciation I&D/Total Revenue - capital revenue 2.8% 6.5% 0.0% 6.1% 7.5%
IDP regulation financial viability indicators
i. Debt coverage (Total Operating Revenue - Operating Grants)/Debt service payments due within financial year)
611.17 % 331.0% 29.0% 331.0%
ii. O/S Service Debtors to Revenue Total outstanding service debtors/annual revenue received for services
iii. Cost coverage (Available cash + Investments)/monthly fixed operational expenditure
0.5% 0.4% 0.8% 0.4%
P a g e | 9
9 | P a g e Section 71 report
5.Monthly Budget Statement
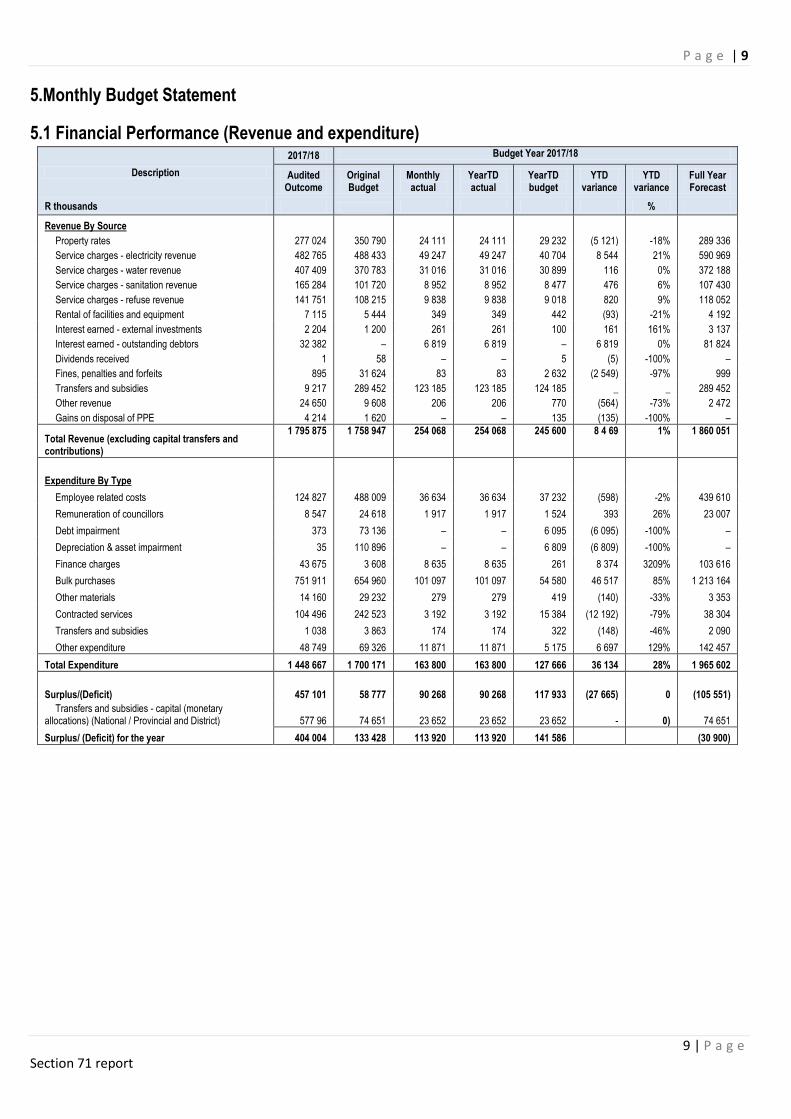
5.1 Financial Performance (Revenue and expenditure)
Description
2017/18 Budget Year 2017/18
Audited Outcome
Original Budget
Monthly actual
YearTD actual
YearTD budget
YTD variance
YTD variance
Full Year Forecast
R thousands %
Revenue By Source
Property rates 277 024 350 790 24 111 24 111 29 232 (5 121) -18% 289 336
Service charges - electricity revenue 482 765 488 433 49 247 49 247 40 704 8 544 21% 590 969
Service charges - water revenue 407 409 370 783 31 016 31 016 30 899 116 0% 372 188
Service charges - sanitation revenue 165 284 101 720 8 952 8 952 8 477 476 6% 107 430
Service charges - refuse revenue 141 751 108 215 9 838 9 838 9 018 820 9% 118 052
Rental of facilities and equipment 7 115 5 444 349 349 442 (93) -21% 4 192
Interest earned - external investments 2 204 1 200 261 261 100 161 161% 3 137
Interest earned - outstanding debtors 32 382 – 6 819 6 819 – 6 819 0% 81 824
Dividends received 1 58 – – 5 (5) -100% –
Fines, penalties and forfeits 895 31 624 83 83 2 632 (2 549) -97% 999
Transfers and subsidies 9 217 289 452 123 185 123 185 124 185 _ _ 289 452
Other revenue 24 650 9 608 206 206 770 (564) -73% 2 472
Gains on disposal of PPE 4 214 1 620 – – 135 (135) -100% –
Total Revenue (excluding capital transfers and contributions)
1 795 875 1 758 947 254 068 254 068 245 600 8 4 69 1% 1 860 051
Expenditure By Type
Employee related costs 124 827 488 009 36 634 36 634 37 232 (598) -2% 439 610
Remuneration of councillors 8 547 24 618 1 917 1 917 1 524 393 26% 23 007
Debt impairment 373 73 136 – – 6 095 (6 095) -100% –
Depreciation & asset impairment 35 110 896 – – 6 809 (6 809) -100% –
Finance charges 43 675 3 608 8 635 8 635 261 8 374 3209% 103 616
Bulk purchases 751 911 654 960 101 097 101 097 54 580 46 517 85% 1 213 164
Other materials 14 160 29 232 279 279 419 (140) -33% 3 353
Contracted services 104 496 242 523 3 192 3 192 15 384 (12 192) -79% 38 304
Transfers and subsidies 1 038 3 863 174 174 322 (148) -46% 2 090
Other expenditure 48 749 69 326 11 871 11 871 5 175 6 697 129% 142 457
Total Expenditure 1 448 667 1 700 171 163 800 163 800 127 666 36 134 28% 1 965 602
Surplus/(Deficit) 457 101 58 777 90 268 90 268 117 933 (27 665) 0 (105 551)
Transfers and subsidies - capital (monetary allocations) (National / Provincial and District) 577 96 74 651 23 652 23 652 23 652 - 0) 74 651
Surplus/ (Deficit) for the year 404 004 133 428 113 920 113 920 141 586 (30 900)
P a g e | 10
10 | P a g e Section 71 report
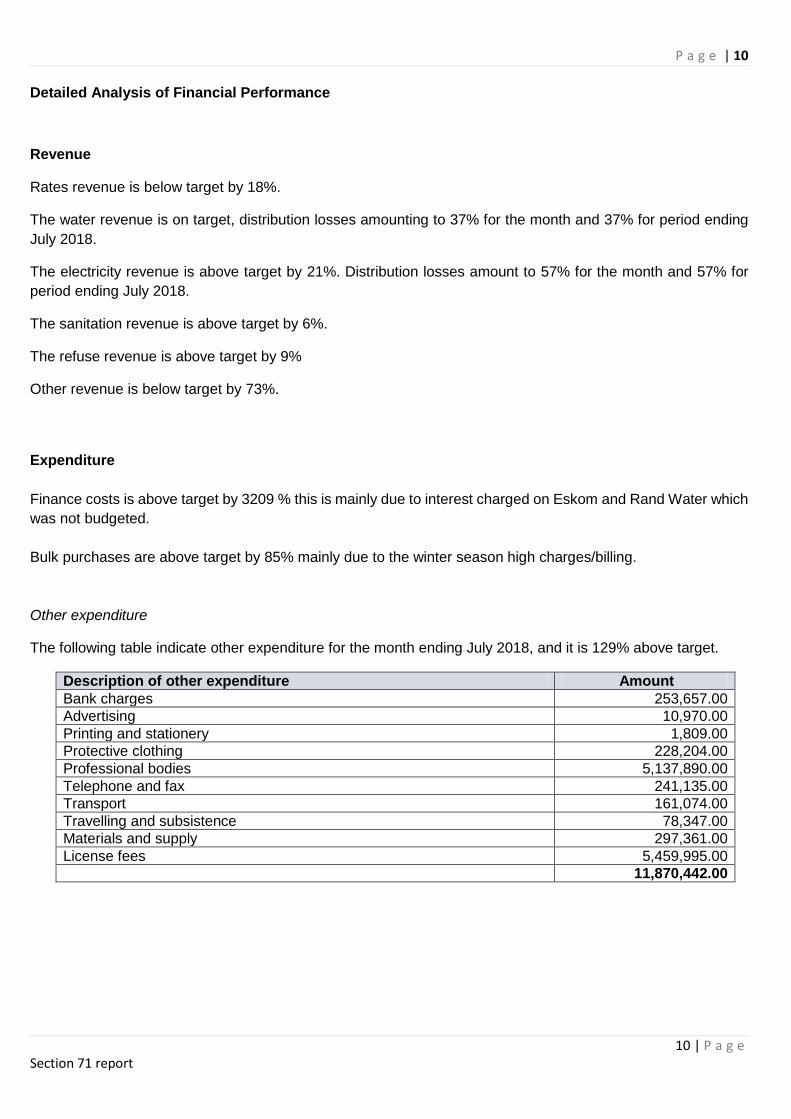
Detailed Analysis of Financial Performance
Revenue
Rates revenue is below target by 18%.
The water revenue is on target, distribution losses amounting to 37% for the month and 37% for period ending
July 2018.
The electricity revenue is above target by 21%. Distribution losses amount to 57% for the month and 57% for
period ending July 2018.
The sanitation revenue is above target by 6%.
The refuse revenue is above target by 9%
Other revenue is below target by 73%.
Expenditure
Finance costs is above target by 3209 % this is mainly due to interest charged on Eskom and Rand Water which
was not budgeted.
Bulk purchases are above target by 85% mainly due to the winter season high charges/billing.
Other expenditure
The following table indicate other expenditure for the month ending July 2018, and it is 129% above target.
Description of other expenditure Amount
Bank charges 253,657.00
Advertising 10,970.00
Printing and stationery 1,809.00
Protective clothing 228,204.00
Professional bodies 5,137,890.00
Telephone and fax 241,135.00
Transport 161,074.00
Travelling and subsistence 78,347.00
Materials and supply 297,361.00
License fees 5,459,995.00
11,870,442.00
P a g e | 11
11 | P a g e Section 71 report
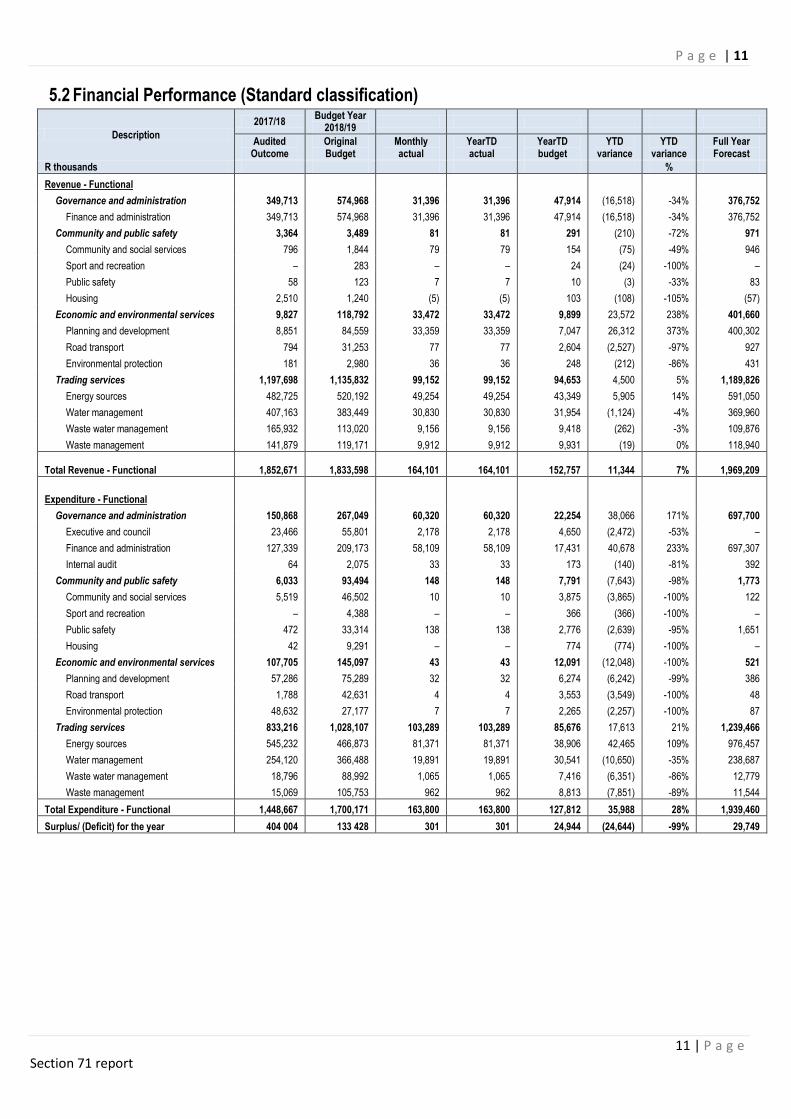
5.2 Financial Performance (Standard classification)
Description
2017/18 Budget Year
2018/19
Audited Outcome
Original Budget
Monthly actual
YearTD actual
YearTD budget
YTD variance
YTD variance
Full Year Forecast
R thousands %
Revenue - Functional
Governance and administration 349,713 574,968 31,396 31,396 47,914 (16,518) -34% 376,752
Finance and administration 349,713 574,968 31,396 31,396 47,914 (16,518) -34% 376,752
Community and public safety 3,364 3,489 81 81 291 (210) -72% 971
Community and social services 796 1,844 79 79 154 (75) -49% 946
Sport and recreation – 283 – – 24 (24) -100% –
Public safety 58 123 7 7 10 (3) -33% 83
Housing 2,510 1,240 (5) (5) 103 (108) -105% (57)
Economic and environmental services 9,827 118,792 33,472 33,472 9,899 23,572 238% 401,660
Planning and development 8,851 84,559 33,359 33,359 7,047 26,312 373% 400,302
Road transport 794 31,253 77 77 2,604 (2,527) -97% 927
Environmental protection 181 2,980 36 36 248 (212) -86% 431
Trading services 1,197,698 1,135,832 99,152 99,152 94,653 4,500 5% 1,189,826
Energy sources 482,725 520,192 49,254 49,254 43,349 5,905 14% 591,050
Water management 407,163 383,449 30,830 30,830 31,954 (1,124) -4% 369,960
Waste water management 165,932 113,020 9,156 9,156 9,418 (262) -3% 109,876
Waste management 141,879 119,171 9,912 9,912 9,931 (19) 0% 118,940
Total Revenue - Functional 1,852,671 1,833,598 164,101 164,101 152,757
11,344 7% 1,969,209
Expenditure - Functional
Governance and administration 150,868 267,049 60,320 60,320 22,254 38,066 171% 697,700
Executive and council 23,466 55,801 2,178 2,178 4,650 (2,472) -53% –
Finance and administration 127,339 209,173 58,109 58,109 17,431 40,678 233% 697,307
Internal audit 64 2,075 33 33 173 (140) -81% 392
Community and public safety 6,033 93,494 148 148 7,791 (7,643) -98% 1,773
Community and social services 5,519 46,502 10 10 3,875 (3,865) -100% 122
Sport and recreation – 4,388 – – 366 (366) -100% –
Public safety 472 33,314 138 138 2,776 (2,639) -95% 1,651
Housing 42 9,291 – – 774 (774) -100% –
Economic and environmental services 107,705 145,097 43 43 12,091 (12,048) -100% 521
Planning and development 57,286 75,289 32 32 6,274 (6,242) -99% 386
Road transport 1,788 42,631 4 4 3,553 (3,549) -100% 48
Environmental protection 48,632 27,177 7 7 2,265 (2,257) -100% 87
Trading services 833,216 1,028,107 103,289 103,289 85,676 17,613 21% 1,239,466
Energy sources 545,232 466,873 81,371 81,371 38,906 42,465 109% 976,457
Water management 254,120 366,488 19,891 19,891 30,541 (10,650) -35% 238,687
Waste water management 18,796 88,992 1,065 1,065 7,416 (6,351) -86% 12,779
Waste management 15,069 105,753 962 962 8,813 (7,851) -89% 11,544
Total Expenditure - Functional 1,448,667 1,700,171 163,800 163,800 127,812 35,988 28% 1,939,460
Surplus/ (Deficit) for the year 404 004 133 428 301 301 24,944 (24,644) -99% 29,749
P a g e | 12
12 | P a g e Section 71 report
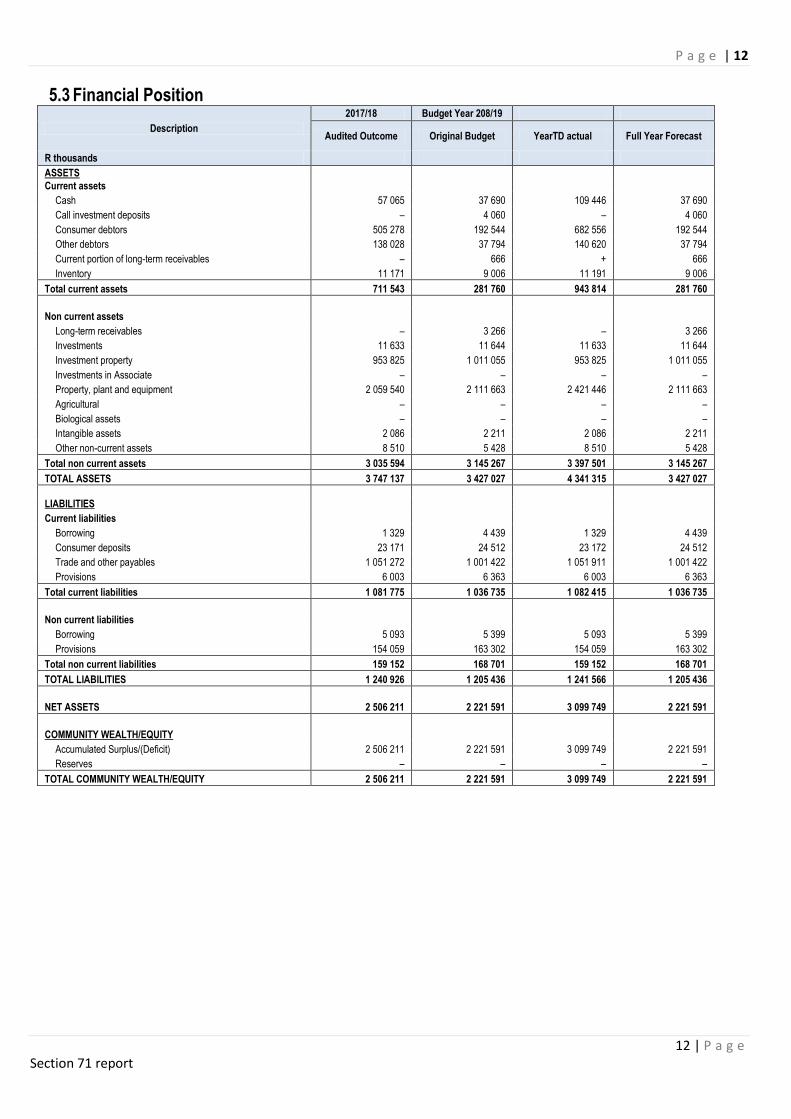
5.3 Financial Position
Description
2017/18 Budget Year 208/19
Audited Outcome Original Budget YearTD actual Full Year Forecast
R thousands
ASSETS
Current assets
Cash 57 065 37 690 109 446 37 690
Call investment deposits – 4 060 – 4 060
Consumer debtors 505 278 192 544 682 556 192 544
Other debtors 138 028 37 794 140 620 37 794
Current portion of long-term receivables – 666 + 666
Inventory 11 171 9 006 11 191 9 006
Total current assets 711 543 281 760 943 814 281 760
Non current assets
Long-term receivables – 3 266 – 3 266
Investments 11 633 11 644 11 633 11 644
Investment property 953 825 1 011 055 953 825 1 011 055
Investments in Associate – – – –
Property, plant and equipment 2 059 540 2 111 663 2 421 446 2 111 663
Agricultural – – – –
Biological assets – – – –
Intangible assets 2 086 2 211 2 086 2 211
Other non-current assets 8 510 5 428 8 510 5 428
Total non current assets 3 035 594 3 145 267 3 397 501 3 145 267
TOTAL ASSETS 3 747 137 3 427 027 4 341 315 3 427 027
LIABILITIES
Current liabilities
Borrowing 1 329 4 439 1 329 4 439
Consumer deposits 23 171 24 512 23 172 24 512
Trade and other payables 1 051 272 1 001 422 1 051 911 1 001 422
Provisions 6 003 6 363 6 003 6 363
Total current liabilities 1 081 775 1 036 735 1 082 415 1 036 735
Non current liabilities
Borrowing 5 093 5 399 5 093 5 399
Provisions 154 059 163 302 154 059 163 302
Total non current liabilities 159 152 168 701 159 152 168 701
TOTAL LIABILITIES 1 240 926 1 205 436 1 241 566 1 205 436
NET ASSETS 2 506 211 2 221 591 3 099 749 2 221 591
COMMUNITY WEALTH/EQUITY
Accumulated Surplus/(Deficit) 2 506 211 2 221 591 3 099 749 2 221 591
Reserves – – – –
TOTAL COMMUNITY WEALTH/EQUITY 2 506 211 2 221 591 3 099 749 2 221 591
P a g e | 13
13 | P a g e Section 71 report
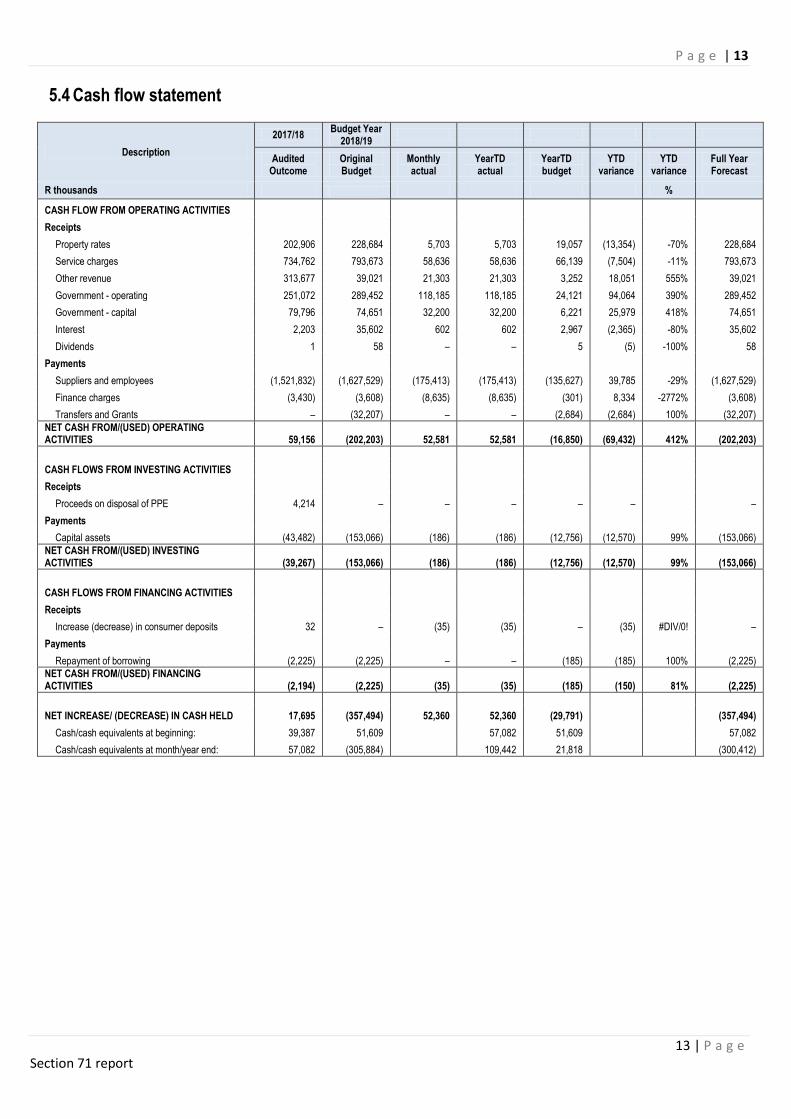
5.4 Cash flow statement
Description
2017/18 Budget Year
2018/19
Audited Outcome
Original Budget
Monthly actual
YearTD actual
YearTD budget
YTD variance
YTD variance
Full Year Forecast
R thousands %
CASH FLOW FROM OPERATING ACTIVITIES
Receipts
Property rates 202,906 228,684 5,703 5,703 19,057 (13,354) -70% 228,684
Service charges 734,762 793,673 58,636 58,636 66,139 (7,504) -11% 793,673
Other revenue 313,677 39,021 21,303 21,303 3,252 18,051 555% 39,021
Government - operating 251,072 289,452 118,185 118,185 24,121 94,064 390% 289,452
Government - capital 79,796 74,651 32,200 32,200 6,221 25,979 418% 74,651
Interest 2,203 35,602 602 602 2,967 (2,365) -80% 35,602
Dividends 1 58 – – 5 (5) -100% 58
Payments
Suppliers and employees (1,521,832) (1,627,529) (175,413) (175,413) (135,627) 39,785 -29% (1,627,529)
Finance charges (3,430) (3,608) (8,635) (8,635) (301) 8,334 -2772% (3,608)
Transfers and Grants – (32,207) – – (2,684) (2,684) 100% (32,207)
NET CASH FROM/(USED) OPERATING ACTIVITIES 59,156 (202,203) 52,581 52,581 (16,850) (69,432) 412% (202,203)
CASH FLOWS FROM INVESTING ACTIVITIES
Receipts
Proceeds on disposal of PPE 4,214 – – – – – –
Payments
Capital assets (43,482) (153,066) (186) (186) (12,756) (12,570) 99% (153,066)
NET CASH FROM/(USED) INVESTING ACTIVITIES (39,267) (153,066) (186) (186) (12,756) (12,570) 99% (153,066)
CASH FLOWS FROM FINANCING ACTIVITIES
Receipts
Increase (decrease) in consumer deposits 32 – (35) (35) – (35) #DIV/0! –
Payments
Repayment of borrowing (2,225) (2,225) – – (185) (185) 100% (2,225)
NET CASH FROM/(USED) FINANCING ACTIVITIES (2,194) (2,225) (35) (35) (185) (150) 81% (2,225)
NET INCREASE/ (DECREASE) IN CASH HELD 17,695 (357,494) 52,360 52,360 (29,791) (357,494)
Cash/cash equivalents at beginning: 39,387 51,609 57,082 51,609 57,082
Cash/cash equivalents at month/year end: 57,082 (305,884) 109,442 21,818 (300,412)
P a g e | 14
14 | P a g e Section 71 report
5.5 Capital expenditure
Vote Description
2017/18 Budget Year
2018/19
Audited Outcome
Original Budget
Monthly actual YearTD actual YearTD budget
YTD variance
YTD varianc
e
Full Year Forecast
R thousands %
Capital Expenditure - Functional Classification
Governance and administration 4 620 16 000 – – 1 333 (1 333) -100% –
Executive and council – 300 – – 25 (25) -100% –
Finance and administration 4 620 15 700 – – 1 308 (1 308) -100% –
Internal audit – – – – – – –
Community and public safety – 5 500 – – 458 (458) -100% –
Community and social services – – – – – – –
Sport and recreation – 4 900 – – 408 (408) -100% –
Public safety – 600 – – 50 (50) -100% –
Economic and environmental services 7 082 11 897 – – 991 (991) -100% –
Planning and development – – – – – –
Road transport 7 082 9 917 – – 826 (826) -100% –
Environmental protection – 1 980 – – 165 (165) -100% –
Trading services 36 984 100 052 3 766 3 766 8 338 (4 572) -55% 45 192
Energy sources 3 087 18 321 3 766 3 766 1 527 2 239 147% 45 192
Water management 14 827 22 131 – – 1 844 (1 844) -100% –
Waste water management 19 070 49 100 – – 4 092 (4 092) -100% –
Waste management – 10 500 – – 875 (875) -100% –
Other – – – – – – –
Total Capital Expenditure - Functional Classification 48 686 133 448 3 766 3 766 11 121 (7 355) -66% 45 192
Funded by:
National Government 44 066 74 951 3 766 3 766 - (2 480) -40% 45 192
Transfers recognised - capital 44 066 74 951 3 766 3 766 6 246 (2 480) -40% 45 192
Public contributions & donations –
Borrowing – – – – – – –
Internally generated funds 4 620 58 497 – – – – –
Total Capital Funding 48 686 133 448 3 766 3 766 6 246 (2 480) -40% 45 192
P a g e | 15
15 | P a g e Section 71 report
6. Detailed analysis on balances
6.1 Loans, Investments and Unspent Grants
Long Term External Loans
The following table indicates the long term loans of council
Details Interest Rate Redeemable Balance Redeemed Interest Balance
01 July 18 30 July 18
DBSA 15,50% 30/09/2019 R 71 153 - R 901 R 72 054
DBSA 15,50% 30/09/2019 R 129 522 - R 1 641 R131 163
DBSA 16,50% 30/09/2019 R 1 140 114 - R 15 338 R 1 155 452
DBSA 8.93% 31/03/2021 R 3 224 279 - R 23 918 R 3 248 197
Total Annuity Loans R 4 565 068 - R 41 799 R 4 606 866
Investments & Call investment deposits
The following table indicates the Investments of council
Category Type Balance Balance
01-July-18 31-July-18
Short term Investment Standard Bank Cheque 38787024(MIG) 278 131 27 545 564
Standard Bank Cheque 38787024 (Emba Sub Station) 362 617 364 434
Standard Bank Current 30195276 2 813 915 2 847 891
Listed Investments Old Mutual Shares 2,187; 60 777 60 777
Old Mutual Shares 30,100 836 479 836 479
Sanlam Shares 2,452 171 812 171 812
Fixed Deposits ABSA Deposit 200644701346 10 563 977 10 634 376
Call Account Standard Bank Call Account 38787024 (009) 19 890 697 36 012 472
Total Investments 34 978 405 78 473 805
Unspent Grants
Grants Unspent 2017/2018
Received 2018/2019
Expenditure TD 2018/2019
Unspent 2018/2018
Extended Public works Programme 277,706.00 - 184,856.00 92,850.00
Financial Management 9,676.00 - - 9,676.00
Integrated National Electrification programme Grant 11,399,028.00 - 3,580,002.00 7,819,026.00
Infrastructure Skills Development Grant - 11,000,000.00 - 11,000,000.00
Energy Efficiency Demand Grant 4,000,000.00 - - 4,000,000.00
Municipal Infrastructure Grant - 27,200,000.00 185,856.00 27,014,144.00
Water Services Infrastructure Grant - 5,000,000.00 - 5,000,000.00
Total
15,686,410.00
43,200,000.00
3,950,714.00
54,935,696.00
P a g e | 16
16 | P a g e Section 71 report
6.2 Debtors
The following table indicates the consumer debtors for the month:
Category Actual Cash For the Month Total Movement
Billing for June 2018 Adjustments
Payment Rate Movement
Payment Rate Billing
Payment 3 553 291.25 0.00 0.00 0% 0%
Deposits -79 577.06 386 493.48 0.00 386 493.48 21% 0%
Agreements -1 033 707.86 693 848.19 0.00 693 848.19 149% 0%
Water -23 153 844.46 14 199 257.29 26 701 745.08 -12502487.79 163% 87%
Electricity -25 490 579.95 39 326 462.73 42 178 855.38 -2852392.65 65% 60%
Loans/old debt -315 705.95 0.00 0.00 0 0% 0%
Rates -17 342 655.40 22 635 675.99 23 521 820.57 -886144.58 77% 74%
Annual rates -5 703 188.94 0.00 0.00 0 0% 0%
Refuse -5 325 522.77 9 886 433.99 9 869 133.80 17300.19 54% 54%
Sewerage -4 665 908.59 8 111 423.74 9 166 237.48 -1054813.74 58% 51%
Miscellaneous -10 781.15 -1 616 758.81 14 367.02 -1631125.83 0% 75%
Miscellaneous(no vat) -580 443.47 291 374.29 290 170.09 1204.2 199% 200%
Vat -9 054 643.89 10 513 367.41 13 190 092.33 -1795343.16 86% 69%
Interest -410 792.87 7 081 273.09 7 382 659.91 -301386.82 6% 6%
Payment advanced -5 356 076.88 0.00 0.00 100% 100%
Total -94 970 137.99 111 508 851.39 132 315 081.66 -19 924 848.51 85% 72%
i. The following table indicates payment rate per month.
Month 2016/17 2017/18 2018/19
July 91% 0% 72%
August 73% 0%
September 86% 0%
October 92% 68%
November 99% -
December 72% 64%
January 79% 79%
February 134% 78%
March 91% 79%
April 65% 84%
May 90% 49%
June 78% 54%
91
73
86
92
99
72
79 13
4
91
65
90
780 0 0
68
64 7
9
78 79 84
49 54
72
0
20
40
60
80
100
120
140
160
2016/2017
2017/2018
2018/2019
Linear (2016/2017)
P a g e | 17
17 | P a g e Section 71 report
ii. The following table indicates the credit control actions taken during the month ending 31 JULY 2018
Category Month ending 31 July 2018
NR Amount
Original Cut Off List 494 5, 022, 965
Cut 476 465, 691
Already Cut 03 75, 934
No Access 15 228, 967
Notices Sent 494 5, 022, 965
Split meter 0 0
No Electricity 0 0
Vacant Stands 0 0
Tampering 0 0
Not Found 01 61, 148
Summary cut offs
Reconnection 34 120, 336
No Response 442 4, 557, 273
Non Payment 18 345, 356
Total 576 5, 022, 964
iii. Indigents
Description July 2018 Total Year to date
Indigent applications received 0 09
Indigent applications Approved 0 0
Indigent Amount Written Off 0 0
Total No. on Database 12819 13174
Indigent Subsidy Granted 11674 11674
Total Amount EQS 82, 514, 028.16 84, 676, 863.40
Free Basic Services-Water
Kilolitres per household 0 0
Kiloliters per household for Indigent 10 10
No. of households 12 819 12 819
No. of kilolitres 65 678 65 678
Total Amount R1 274 153.20 R1 274 153.20
Free Basic Services – Electricity
Units per Indigent households 50 50
No. of households 12 819 12 819
No. of units 180 800 180 800
Total Amount R164 943.84 R164 943.84
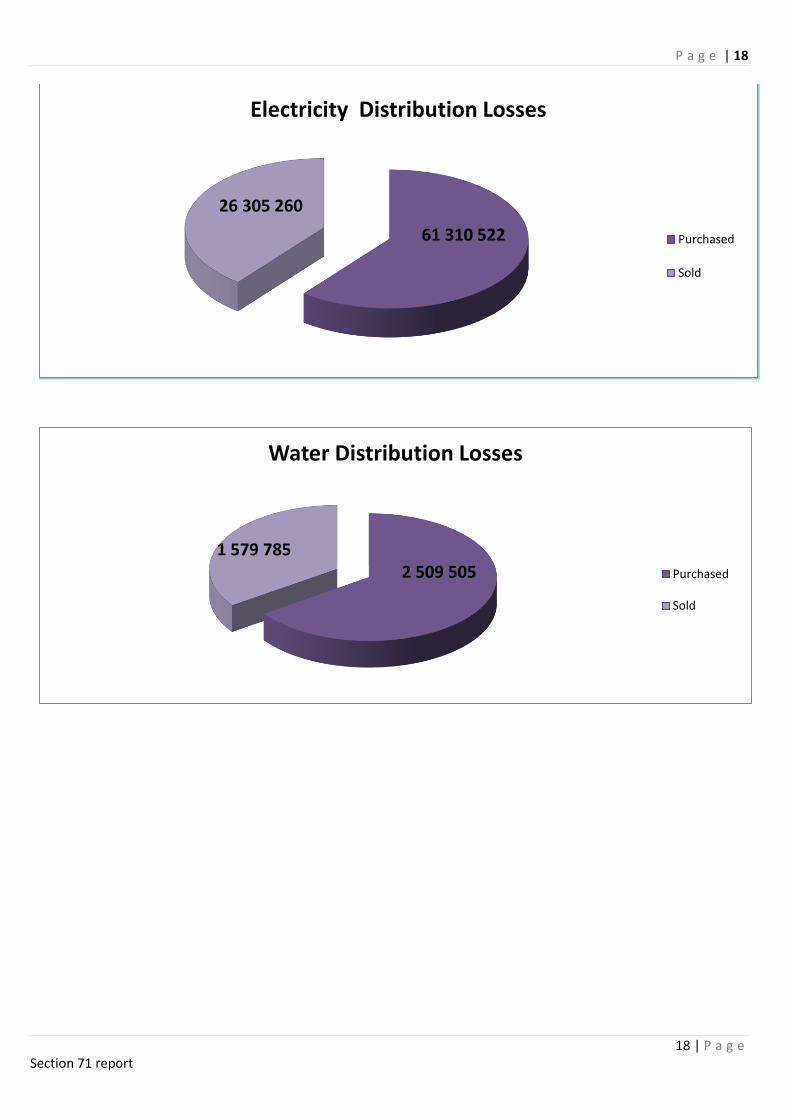
iv. Water and Electricity Distribution Losses July 2018 (KL’s / Units)
Service Purchased Sold Current % Loss Average 17/18 Average 16/17
Electricity 61,310,522 26,305,260 -57.10% -41.98% -47.11%
Water 2,509,505 1,579,785 -37.05% -11.25% -31.53%
Water and Electricity Distribution Losses accumulated: July 2018 (KL’s / Units)
Service Purchased Sold Current % Loss Average 17/18 Average 16/17
Electricity 61,310,522 26,305,260 -57.10% -41.98% -47.11%
Water 2,509,505 1,579,785 -37.05% -11.25% -31.53%
P a g e | 18
18 | P a g e Section 71 report
61 310 522
26 305 260
Electricity Distribution Losses
Purchased
Sold
2 509 5051 579 785
Water Distribution Losses
Purchased
Sold
P a g e | 19
19 | P a g e Section 71 report
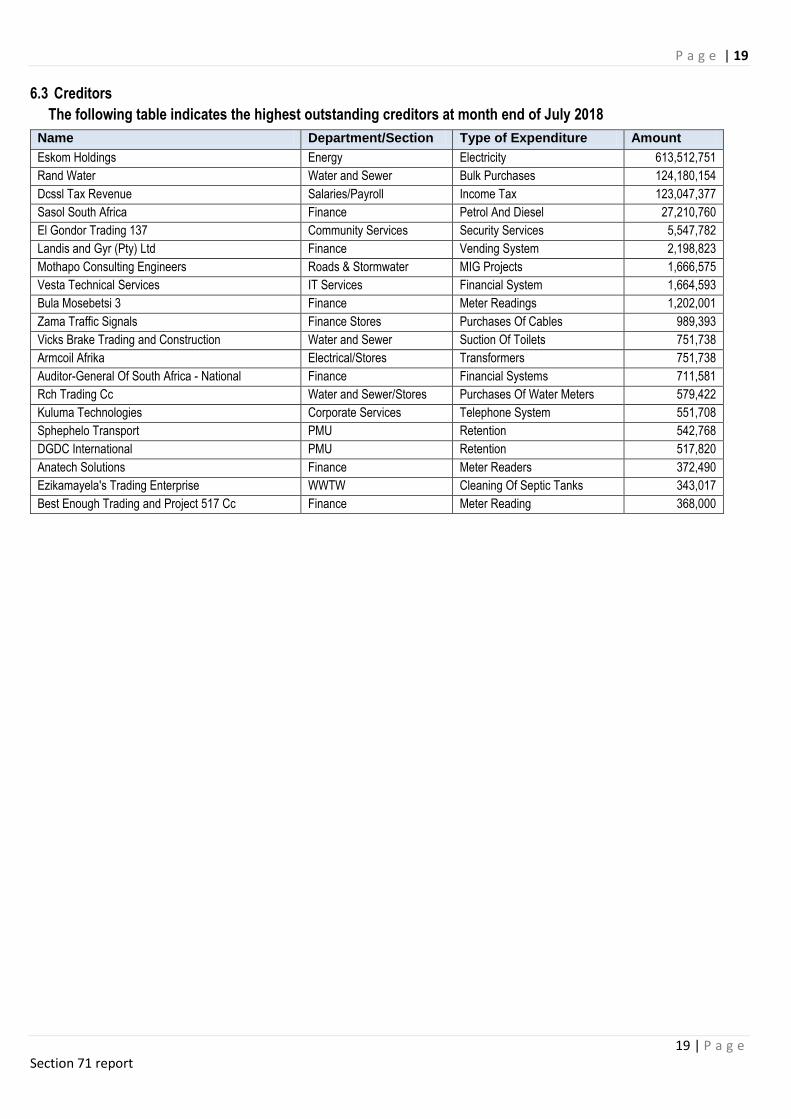
6.3 Creditors
The following table indicates the highest outstanding creditors at month end of July 2018
Name Department/Section Type of Expenditure Amount
Eskom Holdings Energy Electricity 613,512,751
Rand Water Water and Sewer Bulk Purchases 124,180,154
Dcssl Tax Revenue Salaries/Payroll Income Tax 123,047,377
Sasol South Africa Finance Petrol And Diesel 27,210,760
El Gondor Trading 137 Community Services Security Services 5,547,782
Landis and Gyr (Pty) Ltd Finance Vending System 2,198,823
Mothapo Consulting Engineers Roads & Stormwater MIG Projects 1,666,575
Vesta Technical Services IT Services Financial System 1,664,593
Bula Mosebetsi 3 Finance Meter Readings 1,202,001
Zama Traffic Signals Finance Stores Purchases Of Cables 989,393
Vicks Brake Trading and Construction Water and Sewer Suction Of Toilets 751,738
Armcoil Afrika Electrical/Stores Transformers 751,738
Auditor-General Of South Africa - National Finance Financial Systems 711,581
Rch Trading Cc Water and Sewer/Stores Purchases Of Water Meters 579,422
Kuluma Technologies Corporate Services Telephone System 551,708
Sphephelo Transport PMU Retention 542,768
DGDC International PMU Retention 517,820
Anatech Solutions Finance Meter Readers 372,490
Ezikamayela's Trading Enterprise WWTW Cleaning Of Septic Tanks 343,017
Best Enough Trading and Project 517 Cc Finance Meter Reading 368,000
P a g e | 20
20 | P a g e Section 71 report
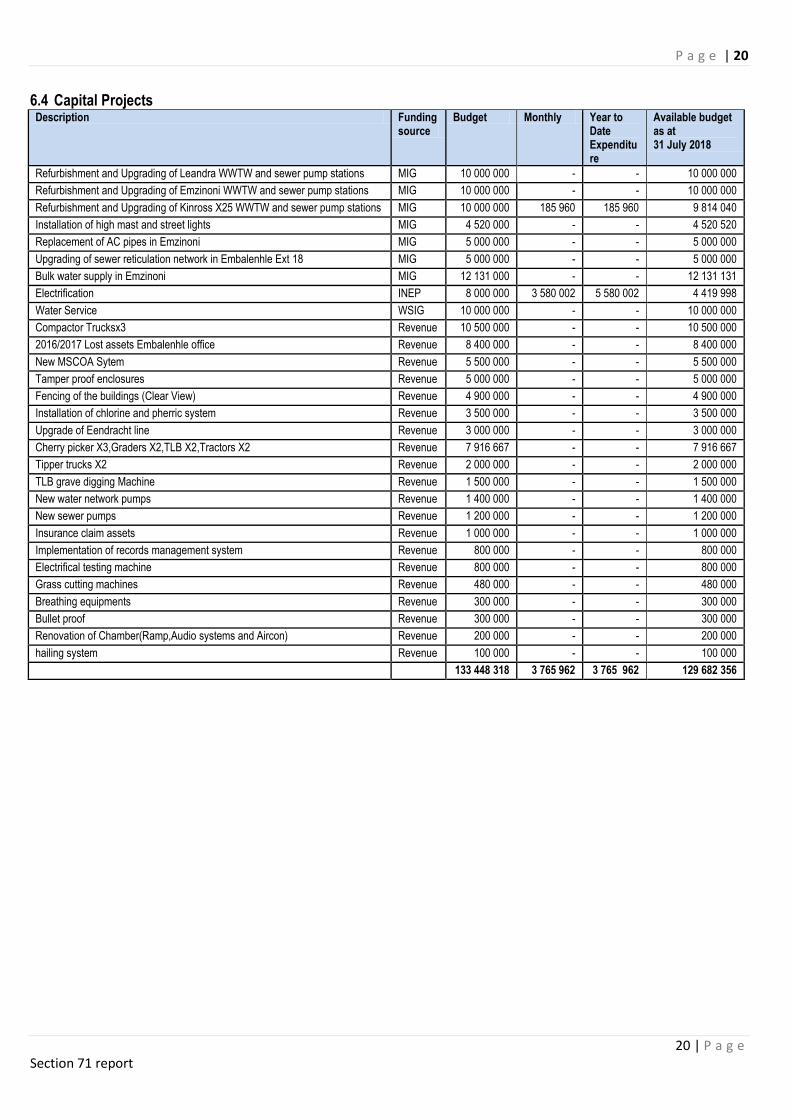
6.4 Capital Projects Description Funding
source Budget Monthly Year to
Date Expenditure
Available budget as at 31 July 2018
Refurbishment and Upgrading of Leandra WWTW and sewer pump stations MIG 10 000 000 - - 10 000 000
Refurbishment and Upgrading of Emzinoni WWTW and sewer pump stations MIG 10 000 000 - - 10 000 000
Refurbishment and Upgrading of Kinross X25 WWTW and sewer pump stations MIG 10 000 000 185 960 185 960 9 814 040
Installation of high mast and street lights MIG 4 520 000 - - 4 520 520
Replacement of AC pipes in Emzinoni MIG 5 000 000 - - 5 000 000
Upgrading of sewer reticulation network in Embalenhle Ext 18 MIG 5 000 000 - - 5 000 000
Bulk water supply in Emzinoni MIG 12 131 000 - - 12 131 131
Electrification INEP 8 000 000 3 580 002 5 580 002 4 419 998
Water Service WSIG 10 000 000 - - 10 000 000
Compactor Trucksx3 Revenue 10 500 000 - - 10 500 000
2016/2017 Lost assets Embalenhle office Revenue 8 400 000 - - 8 400 000
New MSCOA Sytem Revenue 5 500 000 - - 5 500 000
Tamper proof enclosures Revenue 5 000 000 - - 5 000 000
Fencing of the buildings (Clear View) Revenue 4 900 000 - - 4 900 000
Installation of chlorine and pherric system Revenue 3 500 000 - - 3 500 000
Upgrade of Eendracht line Revenue 3 000 000 - - 3 000 000
Cherry picker X3,Graders X2,TLB X2,Tractors X2 Revenue 7 916 667 - - 7 916 667
Tipper trucks X2 Revenue 2 000 000 - - 2 000 000
TLB grave digging Machine Revenue 1 500 000 - - 1 500 000
New water network pumps Revenue 1 400 000 - - 1 400 000
New sewer pumps Revenue 1 200 000 - - 1 200 000
Insurance claim assets Revenue 1 000 000 - - 1 000 000
Implementation of records management system Revenue 800 000 - - 800 000
Electrifical testing machine Revenue 800 000 - - 800 000
Grass cutting machines Revenue 480 000 - - 480 000
Breathing equipments Revenue 300 000 - - 300 000
Bullet proof Revenue 300 000 - - 300 000
Renovation of Chamber(Ramp,Audio systems and Aircon) Revenue 200 000 - - 200 000
hailing system Revenue 100 000 - - 100 000
133 448 318 3 765 962 3 765 962 129 682 356
P a g e | 21
21 | P a g e Section 71 report
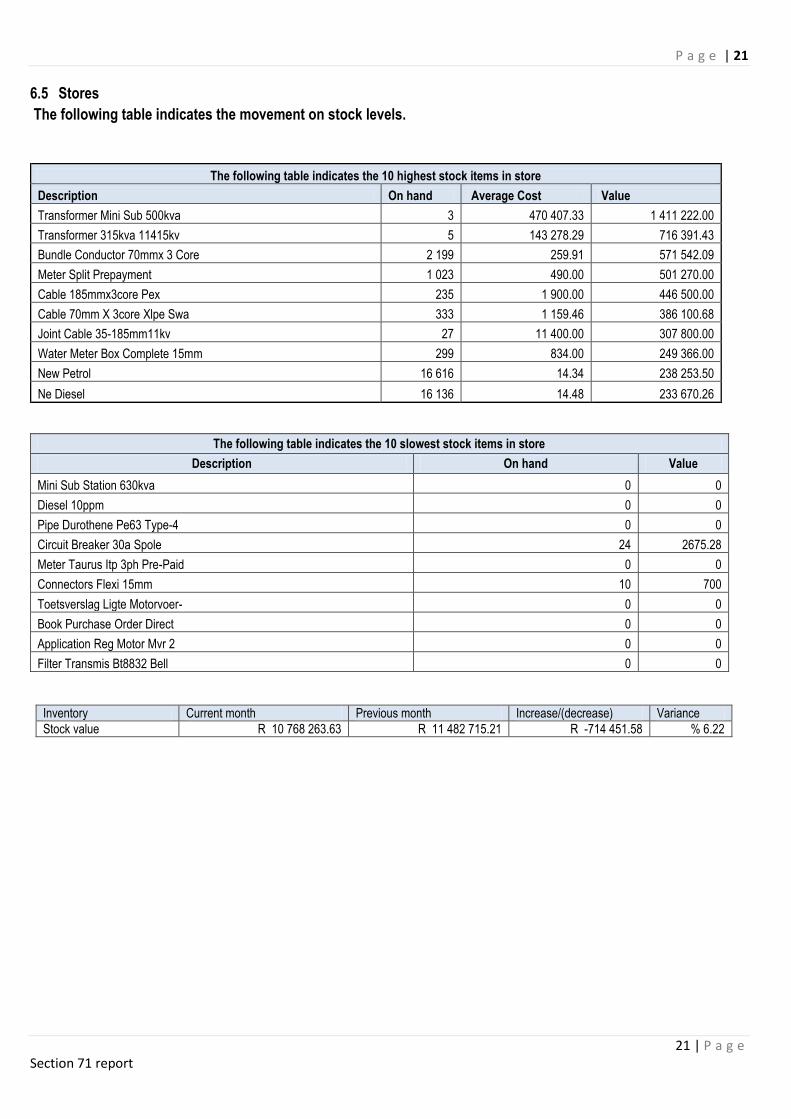
6.5 Stores
The following table indicates the movement on stock levels.
The following table indicates the 10 highest stock items in store
Description On hand Average Cost Value
Transformer Mini Sub 500kva 3 470 407.33 1 411 222.00
Transformer 315kva 11415kv 5 143 278.29 716 391.43
Bundle Conductor 70mmx 3 Core 2 199 259.91 571 542.09
Meter Split Prepayment 1 023 490.00 501 270.00
Cable 185mmx3core Pex 235 1 900.00 446 500.00
Cable 70mm X 3core Xlpe Swa 333 1 159.46 386 100.68
Joint Cable 35-185mm11kv 27 11 400.00 307 800.00
Water Meter Box Complete 15mm 299 834.00 249 366.00
New Petrol 16 616 14.34 238 253.50
Ne Diesel 16 136 14.48 233 670.26
The following table indicates the 10 slowest stock items in store
Description On hand Value
Mini Sub Station 630kva 0 0
Diesel 10ppm 0 0
Pipe Durothene Pe63 Type-4 0 0
Circuit Breaker 30a Spole 24 2675.28
Meter Taurus Itp 3ph Pre-Paid 0 0
Connectors Flexi 15mm 10 700
Toetsverslag Ligte Motorvoer- 0 0
Book Purchase Order Direct 0 0
Application Reg Motor Mvr 2 0 0
Filter Transmis Bt8832 Bell 0 0
Inventory Current month Previous month Increase/(decrease) Variance
Stock value R 10 768 263.63 R 11 482 715.21 R -714 451.58 % 6.22
22 | P a g e
6.6 Supporting Documents – C Schedules
The following are supporting documentation to the C-schedules:
6.6.1 Debtors analysis The following table indicates the consumer debtors as at 31 July 2018. Total outstanding debtors are R1.2 million collections still remain a challenge.
Description
R thousands
NT Code
0-30 Days 31-60 Days 61-90 Days 91-120 Days 121-150 Dys 151-180 Dys 181 Dys-1 Yr Over 1Yr Total
Debtors Age Analysis By Income Source
Trade and Other Receivables from Exchange Transactions - Water 1200 188 28 724 14 665 11 182 12 694 – – 259 289 326 742
Trade and Other Receivables from Exchange Transactions - Electricity 1300 (6) 37 921 14 813 9 480 5 141 – – 81 970 149 318
Receivables from Non-exchange Transactions - Property Rates 1400 28 19 819 6 661 5 016 5 311 – – 60 168 97 005
Receivables from Exchange Transactions - Waste Water Management 1500 (-) 7 321 4 697 3 871 5 761 – – 108 401 130 051
Receivables from Exchange Transactions - Waste Management 1600 3 8 796 5 222 4 672 4 434 – – 62 636 85 764
Receivables from Exchange Transactions - Property Rental Debtors 1700 – – – – – – – – –
Interest on Arrear Debtor Accounts 1810 – – – – – – – – –
Recoverable unauthorised, irregular, fruitless and wasteful expenditure 1820 – – – – – – – – –
Other 1900 17 13 643 54 979 11 861 5 803 – – 413 511 499 814
Total By Income Source 2000 230 116 224 101 039 46 083 39 144 985 975 1 288 695
2016/17 - totals only – – –
Debtors Age Analysis By Customer Group
Organs of State 2200 - 2 519 2 176 1 448 1 162 – – 13 174 20 480
Commercial 2300 (77) 41 502 15 364 5 544 5 091 – – 79 652 147 077
Households 2400 305 64 375 74 560 33 369 29 175 – – 796 227 998 013
Other 2500 1 7 827 8 938 5 722 3 716 – – 96 921 123 126
Total By Customer Group 2600 230 116 224 101 039 46 083 39 144 – – 985 975 1 288 695
P a g e | 23
23 | P a g e Section 71 report
6.6.2 Creditor’s analysis Supporting table provides detail on aged creditors. In terms of the MFMA all creditors should be paid within 30 days of receiving the invoice or statement. For the month of July 2018, R931 million was outstanding and of this 89% is outstanding for more than 30 days. The cash flow challenges continue to affect timeous payments to creditors.
MP307 Govan Mbeki - Supporting Table Monthly Budget Statement - aged creditors - M01 July
Description NT Code
Budget Year 2018/19
0 - 30 Days
31 - 60 Days
61 - 90 Days
91 - 120 Days
121 - 150 Days
151 - 180 Days
181 Days - 1 Year
Over 1 Year
Total R thousands
Creditors Age Analysis By Customer Type Bulk Electricity 0100 37 489 266 958 2 773 45 475 260 817 – – – 613 513
Bulk Water 0200 26 703 96 874 602 0 0 – – – 124 180
PAYE deductions 0300 5 569 – – – – – – – 5 569 VAT (output less input) 0400 – – – – – – – – – Loan repayments 0600 – – – – – – – – – Trade Creditors 0700 22 348 2 344 3 925 5 514 148 738 – – – 182 870
Auditor General 0800 133 578 0 0 20 – – – 732
Other 0900 4 358 – – – – – – – 4 358
Total By Customer Type 1000 96 601 366 755 7 300 50 989 409 576 – – – 931 222
24 | P a g e
6.7 Investment portfolio analysis
Supporting table SC5 displays the Council’s investment portfolio and indicates that R 11 million is currently invested. During the
month of July 2018, no new investments were made. Accrued interest for the month amounts to R 70 340
Investments by maturity Name of institution & investment ID
Period of Investment Yrs/Months
Type of Investment
Expiry date of investment
Accrued interest for the month
Yield for the month 1 (%)
Market value at beginning of the month
Change in market value
Market value at end of the month
R thousands
Municipality Absa Fixed Deposit Fixed Deposit 22/06/2019 70 10 564 10 634 Old Mutual Shares Shares 61 61 Old Mutual Shares Shares 836 836 Sanlam Shares 172 172
Municipality Sub-Total 70 11 633 – 11 703
6.8 Transfer and grant receipts and expenditure Supporting tables SC6 provide detail of grants separately as income, as far as revenue is recognised. On the receipt of grants, the year-to-date actual amounts to R150 million which is mainly the equitable share and the MIG received.
Description 2017/18 Budget Year 2018/19
R thousands Audited
Outcome Original Budget
Adjusted Budget
Monthly actual
YearTD actual
YearTD budget
YTD variance
YTD variance
%
Full Year Forecast
Operating Transfers and Grants National Government: 265,125 307,452 – 123,185 123,185 107,185 – – 297,452
Local Government Equitable Share 218,181 257,245 – 107,185 107,185 107,185 – – 257,245
Finance Management 1,700 1,770 – – – – – – 1,770 Energy Efficiency and Demand Management 4,000 6,000 – – – – – – 6,000 Integrated National Electrification Programme 14,000 8,000 – – – – – – 8,000
EPWP Incentive 4,244 1,937 – – – – – – 1,937
Water Services Operating Subsidy – 10,000 – 5,000 5,000 5,000 – – –
Infrastructure Skills Development 23,000 22,500 – 11,000 11,000 11,000 – – 22,500
Total Operating Transfers and Grants 265,125 307,452 – 123,185 123,185 123,185 – – 297,452
– –
Capital Transfers and Grants – – National Government: 42,796 56,689 – 27,200 27,200 27,200 – – 56,689
Municipal Infrastructure Grant (MIG) 42,796 56,689 – 27,200 27,200 27,200 – – 56,689
Total Capital Transfers and Grants 42,796 56,689 – 27,200 27,200 27,200 – – 56,689 – –
TOTAL RECEIPTS OF TRANSFERS & GRANTS 307,921 364,141 – 150,385 150,385 150,385 – – 354,141
25 | P a g e
6.9 Actual and revised targets for cash receipts Supporting table SC9 provides the detail of the cash flow actual and revised targets - setting out receipts by source and payments by type per month. The monthly receipts and payments were R236 million and R184 million respectively. There is still a big challenge in revenue collection. Revenue enhancement plan is in place to rectify this challenge
Description Budget Year 2018/19
2017/18 Medium Term Revenue & Expenditure Framework
July August Sept October Nov Dec January Feb March April May June Budget Year
2018/19
Budget Year +1 2019/20
Budget Year +2 2020/21 R thousands Outcome Budget Budget Budget Budget Budget Budget Budget Budget Budget Budget Budget
Cash Receipts By Source BC: BC: BC: BC: BC: BC: BB: BB: BB: BB: BB: BB:
Property rates 5,703 19,057 19,057 19,057 19,057 19,057 19,057 19,057 19,057 19,057 19,057 32,411 228,684 242,412 256,956
Service charges - electricity revenue 25,491 29,586 29,586 29,586 29,586 29,586 29,586 29,586 29,586 29,586 29,586 33,682 355,033 376,335 398,915
Service charges - water revenue 23,154 22,479 22,479 22,479 22,479 22,479 22,479 22,479 22,479 22,479 22,479 21,804 269,749 285,934 303,090
Service charges - sanitation revenue 4,666 6,627 6,627 6,627 6,627 6,627 6,627 6,627 6,627 6,627 6,627 8,588 79,522 84,294 89,351
Service charges - refuse 5,326 7,447 7,447 7,447 7,447 7,447 7,447 7,447 7,447 7,447 7,447 9,569 89,368 94,730 100,414
Rental of facilities and equipment 349 454 454 454 454 454 454 454 454 454 454 558 5,444 5,770 6,116
Interest earned - external investments 191 100 100 100 100 100 100 100 100 100 100 9 1,200 1,272 1,348
Interest earned - outstanding debtors 411 2,867 2,867 2,867 2,867 2,867 2,867 2,867 2,867 2,867 2,867 5,323 34,402 36,466 38,654
Dividends received – 5 5 5 5 5 5 5 5 5 5 10 58 62 65
Fines, penalties and forfeits 83 527 527 527 527 527 527 527 527 527 527 971 6,325 6,704 7,107
Transfer receipts - operating 118,185 24,121 24,121 24,121 24,121 24,121 24,121 24,121 24,121 24,121 24,121 (69,943) 289,452 306,819 325,228
Other revenue 20,870 2,271 2,271 2,271 2,271 2,271 2,271 2,271 2,271 2,271 2,271 (16,328) 27,253 28,888 30,621
Cash Receipts by Source 204,429 115,541 115,541 115,541 115,541 115,541 115,541 115,541 115,541 115,541 115,541 26,653 1,386,490 1,469,686 1,557,867
Other Cash Flows by Source
Transfer receipts - capital 32,200 6,221 6,221 6,221 6,221 6,221 6,221 6,221 6,221 6,221 6,221 (19,758) 74,651 79,130 83,878
Increase in consumer deposits (31) 31 – – –
Total Cash Receipts by Source 236,598 121,762 121,762 121,762 121,762 121,762 121,762 121,762 121,762 121,762 121,762 6,925 1,461,141 1,548,816 1,641,745
Cash Payments by Type
Employee related costs 37,259 40,664 40,664 40,664 40,664 40,664 40,664 40,664 40,664 40,664 40,664 44,069 487,967 517,245 548,279
Remuneration of councillors 1,917 1,390 1,390 1,390 1,390 1,390 1,390 1,390 1,390 1,390 1,390 862 16,678 25,849 27,141
Interest paid 8,635 301 301 301 301 301 301 301 301 301 301 (8,033) 3,608 3,824 4,054
Bulk purchases - Electricity 81,331 42,080 42,080 42,080 42,080 42,080 42,080 42,080 42,080 42,080 42,080 2,829 504,960 535,258 567,373
Bulk purchases - Water & Sewer 19,766 25,000 25,000 25,000 25,000 25,000 25,000 25,000 25,000 25,000 25,000 30,234 300,000 318,000 337,080
Other materials 279 – – – – – – – – – – (279) – – –
Contracted services 3,192 7,311 7,311 7,311 7,311 7,311 7,311 7,311 7,311 7,311 7,311 11,430 87,734 92,998 98,578
Grants and subsidies paid - other municipalities – – – – – – – – – – – – – – –
Grants and subsidies paid - other – 2,684 2,684 2,684 2,684 2,684 2,684 2,684 2,684 2,684 2,684 5,368 32,207 34,139 36,188
General expenses 31,668 19,183 19,183 19,183 19,183 19,183 19,183 19,183 19,183 19,183 19,183 6,697 230,190 244,002 258,642
Cash Payments by Type 184,048 138,612 138,612 138,612 138,612 138,612 138,612 138,612 138,612 138,612 138,612 93,176 1,663,344 1,771,315 1,877,335
Other Cash Flows/Payments by Type
Capital assets 186 12,756 12,756 12,756 12,756 12,756 12,756 12,756 12,756 12,756 12,756 25,325 153,066 162,250 171,985
Repayment of borrowing – – 1,113 – – – – – 1,113 – – – 2,225 2,359 2,500
Total Cash Payments by Type 184,233 151,367 152,480 151,367 151,367 151,367 151,367 151,367 152,480 151,367 151,367 118,502 1,818,635 1,935,923 2,051,820
NET INCREASE/(DECREASE) IN CASH HELD 52,365 (29,606) (30,718) (29,606) (29,606) (29,606) (29,606) (29,606) (30,718) (29,606) (29,606) (111,576) (357,494) (387,107) (410,075) Cash/cash equivalents at the month/year
beginning: 57,082 109,446 79,841 49,122 19,517 (10,089) (39,695) (69,301) (98,906) (129,624) (159,230) (188,836) 57,082 (300,412) (687,519)
Cash/cash equivalents at the month/year end: 109,446 79,841 49,122 19,517 (10,089) (39,695) (69,301) (98,906) (129,624) (159,230) (188,836) (300,412) (300,412) (687,519) (1,097,594)
26 | P a g e
6.10 Bank reconciliation:
Bank Reconciliation as at 31 JULY 2018
Cash Book Balance (29 742 212)
Bank Statement Balance 42 675 958
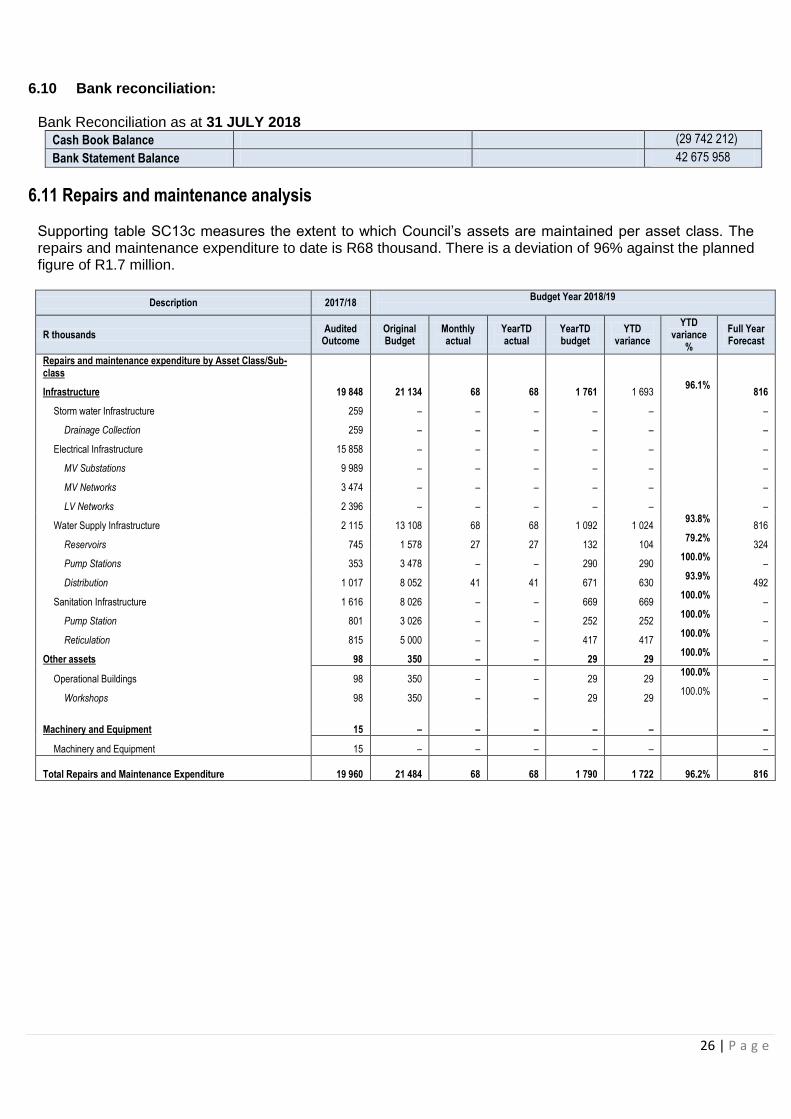
6.11 Repairs and maintenance analysis Supporting table SC13c measures the extent to which Council’s assets are maintained per asset class. The repairs and maintenance expenditure to date is R68 thousand. There is a deviation of 96% against the planned figure of R1.7 million.
Description 2017/18 Budget Year 2018/19
R thousands Audited
Outcome Original Budget
Monthly actual
YearTD actual
YearTD budget
YTD variance
YTD variance
%
Full Year Forecast
Repairs and maintenance expenditure by Asset Class/Sub-class
Infrastructure 19 848 21 134 68 68 1 761 1 693 96.1%
816
Storm water Infrastructure 259 – – – – –
–
Drainage Collection 259 – – – – –
–
Electrical Infrastructure 15 858 – – – – –
–
MV Substations 9 989 – – – – –
–
MV Networks 3 474 – – – – –
–
LV Networks 2 396 – – – – –
–
Water Supply Infrastructure 2 115 13 108 68 68 1 092 1 024 93.8%
816
Reservoirs 745 1 578 27 27 132 104 79.2%
324
Pump Stations 353 3 478 – – 290 290 100.0%
–
Distribution 1 017 8 052 41 41 671 630 93.9%
492
Sanitation Infrastructure 1 616 8 026 – – 669 669 100.0%
–
Pump Station 801 3 026 – – 252 252 100.0%
–
Reticulation 815 5 000 – – 417 417 100.0%
–
Other assets 98 350 – – 29 29 100.0%
–
Operational Buildings 98 350 – – 29 29 100.0%
–
Workshops 98 350 – – 29 29 100.0%
–
Machinery and Equipment 15 – – – – –
–
Machinery and Equipment 15 – – – – –
–
Total Repairs and Maintenance Expenditure 19 960 21 484 68 68 1 790 1 722
96.2% 816
P a g e | 27
27 | P a g e Section 71 report
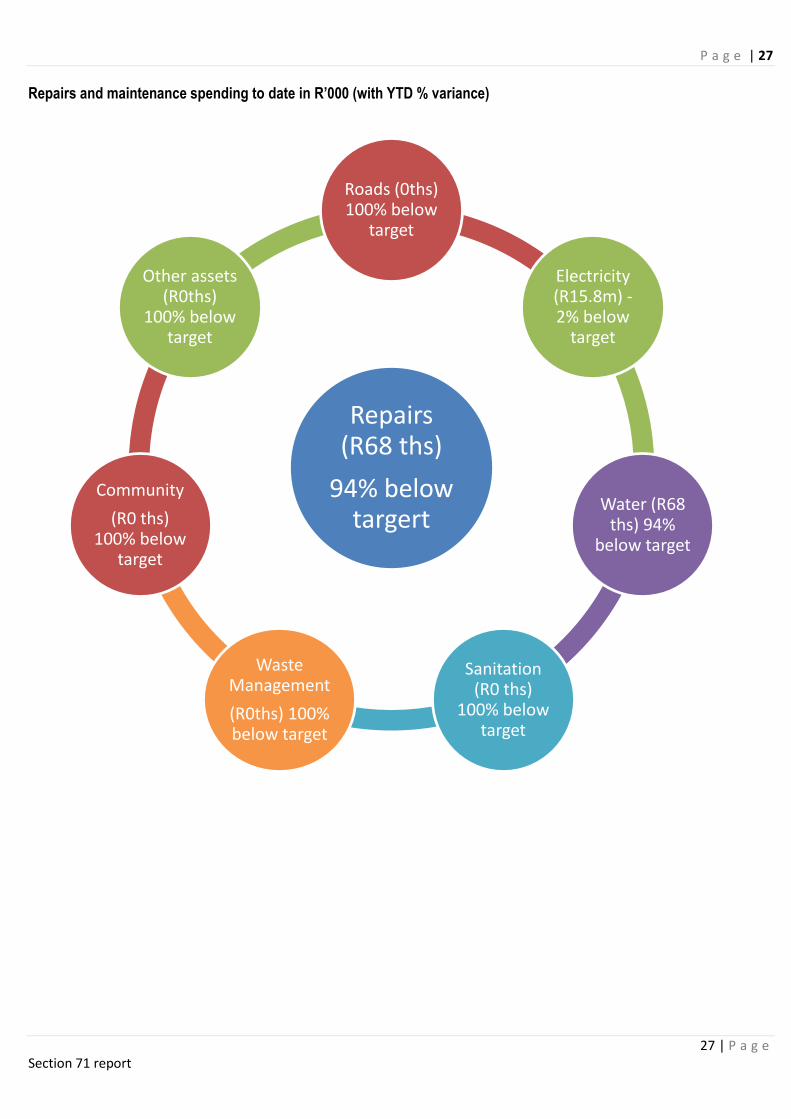
Repairs and maintenance spending to date in R’000 (with YTD % variance)
Repairs (R68 ths)
94% below targert
Roads (0ths) 100% below
target
Electricity (R15.8m) -2% below
target
Water (R68 ths) 94%
below target
Sanitation (R0 ths)
100% below target
Waste Management
(R0ths) 100% below target
Community
(R0 ths) 100% below
target
Other assets (R0ths)
100% below target
28 | P a g e
ANNEXURES TO THE MONTHLY
REPORT
P a g e | 29
29 | P a g e
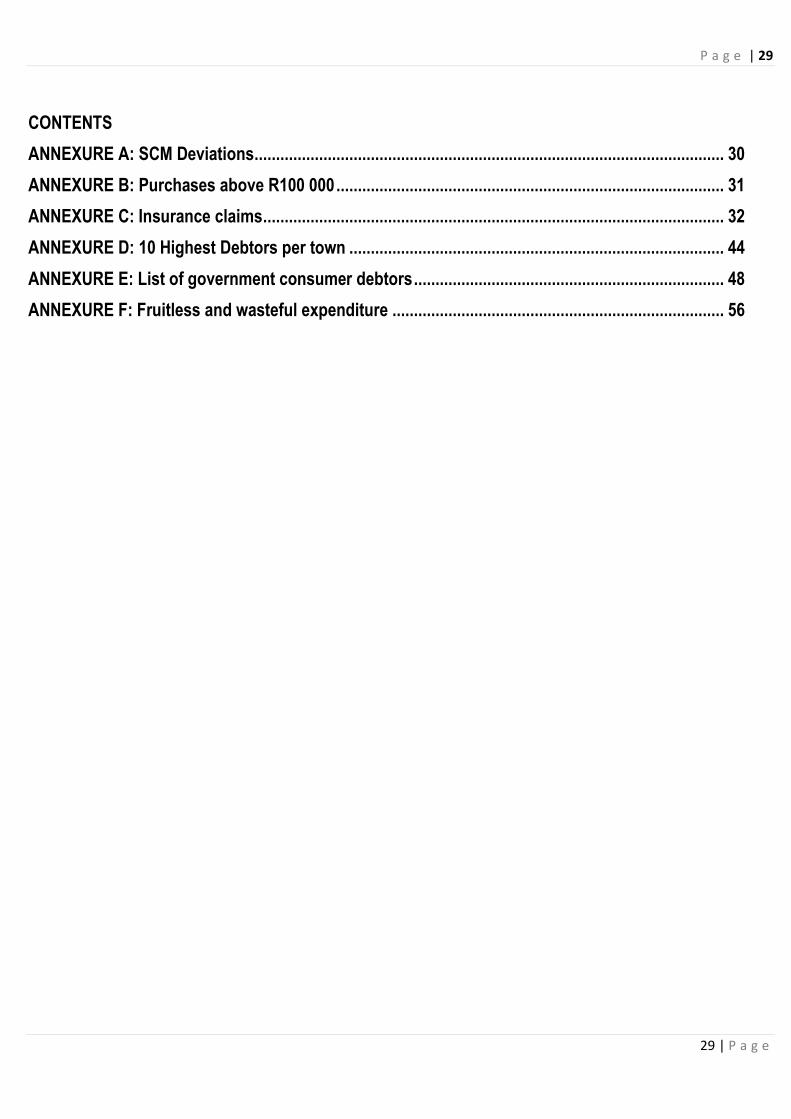
CONTENTS
ANNEXURE A: SCM Deviations ............................................................................................................. 30
ANNEXURE B: Purchases above R100 000 .......................................................................................... 31
ANNEXURE C: Insurance claims ........................................................................................................... 32
ANNEXURE D: 10 Highest Debtors per town ....................................................................................... 44
ANNEXURE E: List of government consumer debtors ........................................................................ 48
ANNEXURE F: Fruitless and wasteful expenditure ............................................................................. 56
30 | P a g e
ANNEXURE A: SCM Deviations
Deviations for the month ended JULY 2018 Date
Req / Company Description Amount Section
No.
Quotes Reason for
MFMA
Order No. Submitted Deviation
Regulation:
Section 36
31/07/2018 788 Ukwakhana Eletrical
Services
Booster Pump Motor At Leandra
Resevoir
R 175 137.87
Water And
Sanitation
1 The Booster Pump Was Not Operational And Resulting In Lower Elevated Area And Internment Supply To High Elevated Area
(1)(a)(i)
11/07/2018 645 Ukwakhana Eletrical
Services
Upgrade Water Pump At Bethal
Resevior
R 126 477.47
Water And
Sanitation
1 The Booster Pump Was Not Operational And Resulting In Lower Elevated Area And Internment Supply To High Elevated Area
(1)(a)(i)
12/07/2018 661 Ukwakhana Eletrical
Services
Pump Station R188 961.76 Water And
Sanitation
1 There Was A Sewer Overflow
That Was Causing Health
Hazards And Pollution To Kinross
Business And Residential Area
(1)(a)(i)
09/09/2018 641 Vuma Konke Transport
And Projects
Hiring Of Vacuum Truck For
Embalenhle
R 291 879.60
Waste Water
Treatment
Works
1 Sucking Of Overflowing Sewer That Polluting The Area Causing Health Hazard To The Community
(1)(a)(i)
25/07/2018 736 Verotest Holdings Mixed Services Day Rate- Office
Hours
R 233 910.00 Energy 1 Cable Fault Location (1)(a)(i)
25/07/2018 736 Verotest Holdings Travelling Hours 6 Hour A Day
R 23 460.00
Energy 1 Cable Fault Location (1)(a)(i)
25/07/2018 736 Verotest Holdings Transport 600km Per Day 10 Days
R 54 855.00 Energy 1 Cable Fault Location (1)(a)(i)
GOODS OR SERVICES PROCURED WHERE IT HAS IMPRACTICAL TO FOLLOW THE OFFICIAL PROCUNEMT PROCESS
12/07/2018 662 CMC Top
Fire
Engine
Cmc Top Fire Engine R 80 542.87 Technical Workshop Section
1 Strip And Quote Repairing Of Transmission
(1)(a)(v)
P a g e | 31
31 | P a g e
ANNEXURE B: Purchases above R100 000
Purchases above R 100,000 for month ended JULY 2018
DATE Order No. DESCRIPTIONS Creditor Name Total Amount
13/07/2018 679 Cleaning Of Septic Tanks At Bethal BV Magujwa Trading And Project R 207 000.00
30/07/2018 783 Fuse 63a12kv Striker Pin Siyabongalebo Trading Enterprise R 108 030.00
06/07/2018 635 Electrical Items – Fuse Carriers Siyabongalebo Trading Enterprise R 108 030.00
03/07/2018 558 C/Breakers 160a-250a Zimbrey Trading Enterprise R 151 923.51
11/07/2018 646 Removed Redundant Pump, Installed Standby Pump To Control The Level Supplied And Installed
Complete New Gorman - Rupp Pump Test And Commission
Ukwakhana Electrical Services R 199 910.74
13/07/2018 683 Hire Of Suction Truck To Clean 190 Septic Tanks In Eendracht Sondie Trading Enterprise R 259 920.00
25/07/2018 737 Pole Mounted Transformers 315kva 11kv Simekhona Business Enterprise R 552 000.00
19/07/2018 714 315kva Pole Mounted TRF 11kv/415v Mavutha Contractors Enterprise R 456 693.75
19/07/2018 713 315 KVA -400 Volts Transformer Bkm Zone28 Enterprise R 185 950.00
12/07/2018 660 315kva 11000v 415v No: 001328556 Transformer Armcoil Afrika R 148 185.94
12/07/2018 659 315kva 11000v 415v No: 0158894m Transformer Armcoil Afrika R 148 185.94
12/07/2018 658 315kva 11000v 415v No: T15537 Transformer Armcoil Afrika R 148 186.32
11/07/2018 648 315kva TRF Pole Mounted 11kv/420v With 12kva Surge Arresters(2off) Mavutha Contractors Enterprise R 376 200.00
05/07/2018 614 Supply, Delivery, Installation, Testing & Commissioning Of Transformer Protection Scheme Relay Izinyosi Trading R 222 502.92
05/07/2018 614 Supply, Delivery, Installation, Testing & Commissioning Of Feeder Protection Scheme Relay Izinyosi Trading R 174 743.76
23/07/2018 733 RFQ 8/3/2-22/2018 Supply & Service Of Fire Extinguisher & Equipment Fire Inc. R 122 675.00
06/07/2018 629 Supply And Delivery Of PPE Clothing For EPWP RFQ 8/3/2-49/2018 Mabutho Amahle Investments R 112 184.00
05/07/2018 605 Supply And Delivery Of EPWP Equipment As Per RFQ 8/3/2-47/2018 BasizeAfrica R 174 190.00
P a g e | 32
32 | P a g e
ANNEXURE C: Insurances report
INSURANCE REPORT FOR 31 JULY 2018
Background
The report entails claims that were lodged, settled and which are still outstanding with the current broker as at 31 July 2018 and all outstanding claims from previous financial years.
1. Claims relating to the current financial year i.e. 2018/2019
During the month of July 2018 of the current financial year, there were six (6) incident of loss that occurred and all six (6) were reported to the insurer; however two (2) falls
within excess.
a) The table below illustrate a list and status of claims lodged:
Reported Date Claim No Description Type Department Claim Amount Excess
Amount
Status
05/07/2018 0063/17 Ripper stolen Building
Combined
Community Services
(Sports, Arts and Culture)
Unknown Unknown Outstanding Proof of
forcible entry and quotation.
09/07/2018 0299/18 CBL187MP Fire Engine scratched Vehicles Community Services
(Fire)
R3 220.00 R10 000.00 Claim falls within excess
R10 000. File closed
23/07/2018 0300/18 FKC025MP Fire engine mirror
damaged
Vehicles Community Services
(Fire)
Unknown Unknown Claim submitted to the
insurer
23/07/2018 0301/18 FMN361MP Damaged Bakkie Vehicles Planning and Development
(Energy)
R12 135.66 R10 000.00 Claim submitted to the
insurer
24/07/2018 0303/18 FYP779MP Damaged Fender Vehicles Community Services
(Fire)
R4 319.25 R5 000.00 Claim fall within excess
R5 000. File closed
31/07/2018 0550/18 YNR265GP Damaged Vehicle Public Liability Community Services, traffic
and road markings
R60 000.00 R50 000.00 Departmental report
outstanding
Total R 79 674.91 R 75 000.00
P a g e | 33
33 | P a g e
b) The table below illustrate claims that were settled during the month of 31 July 2018
Reported date of loss Claim No Description Type Department Amount paid Status
23/04/2018 0292/17 BXD162MP bumped into third
party vehicle
Vehicle Planning &
Development (Energy)
R 12 762.48 Excess paid file closed
paid
Total R 12 762.48
c) Excess payments have been made during the month of 31 July 2018 for claims lodged.
Reported date of loss Claim No Description Type Department Amount paid Status
23/04/2018 0292/17 BXD162MP bumped into third
party vehicle
Vehicle Planning &
Development (Energy)
R 5 000.00 Excess paid file
closed paid
Total R 5000.00
d) The table below illustrates all outstanding claims as at 31 July 2018 for the current financial year.
Reported date of
loss
Claim No Description Type Department Claim Amount Excess
Amount
Status
05/07/2018 0063/17 Ripper stolen Building
Combined
Community Services
(Sports, Arts and Culture)
Unknown Unknown Outstanding Proof of
forcible entry and
quotation.
'23/07/2018 0300/18 FKC025MP Fire engine mirror
damaged
Vehicles Community Services
(Fire)
Unknown Unknown Claim submitted to the
insurer
'23/07/2018 0301/18 FMN361MP Damaged bakkie Vehicles Planning and Development
(Energy)
R12 135.66 R 10 000.00 Claim submitted to the
insurer
31/07/2018 0550/18 YNR265GP Public Liability community services, traffic
and road markings
R 60 000.00 R 50 000.00 Outstanding
departmental report
Total R 72 135.66 R 60 000.00
P a g e | 34
34 | P a g e
2. Claims relating to previous financial years.
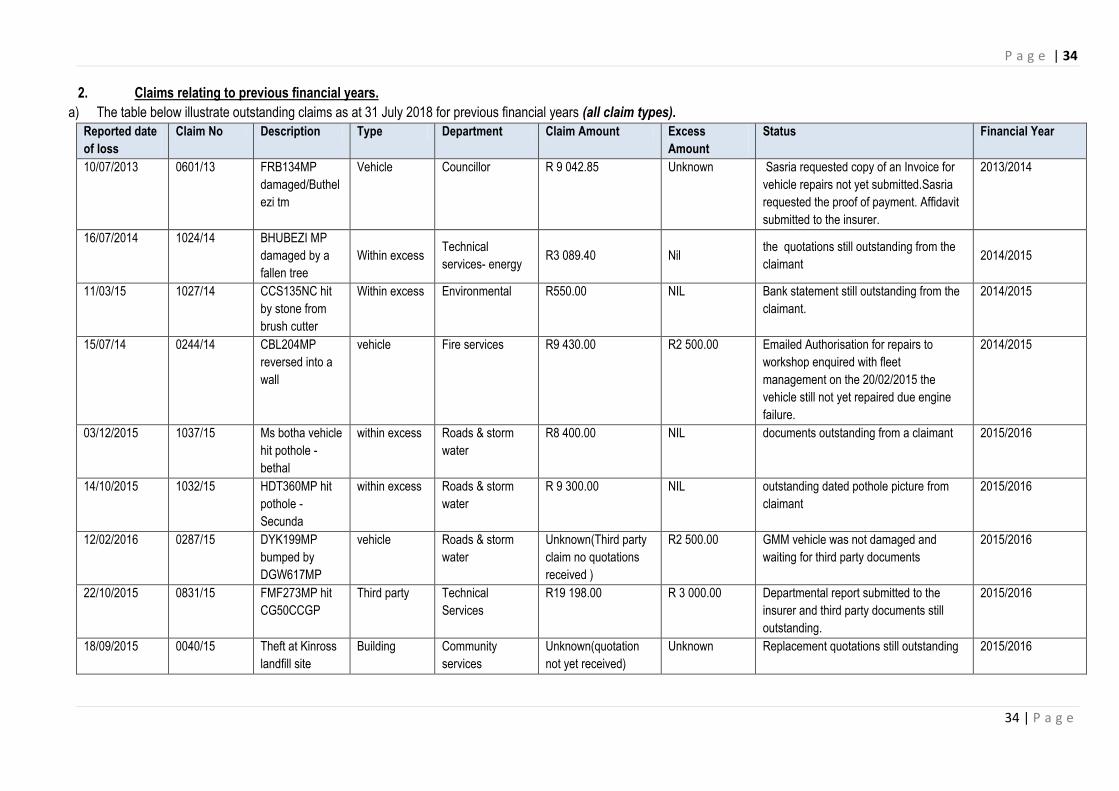
a) The table below illustrate outstanding claims as at 31 July 2018 for previous financial years (all claim types).
Reported date
of loss
Claim No Description Type Department Claim Amount Excess
Amount
Status Financial Year
10/07/2013
0601/13 FRB134MP
damaged/Buthel
ezi tm
Vehicle Councillor R 9 042.85 Unknown Sasria requested copy of an Invoice for
vehicle repairs not yet submitted.Sasria
requested the proof of payment. Affidavit
submitted to the insurer.
2013/2014
16/07/2014 1024/14 BHUBEZI MP
damaged by a
fallen tree
Within excess Technical
services- energy R3 089.40 Nil
the quotations still outstanding from the
claimant 2014/2015
11/03/15 1027/14 CCS135NC hit
by stone from
brush cutter
Within excess Environmental R550.00 NIL Bank statement still outstanding from the
claimant.
2014/2015
15/07/14 0244/14 CBL204MP
reversed into a
wall
vehicle Fire services R9 430.00 R2 500.00 Emailed Authorisation for repairs to
workshop enquired with fleet
management on the 20/02/2015 the
vehicle still not yet repaired due engine
failure.
2014/2015
03/12/2015 1037/15 Ms botha vehicle
hit pothole -
bethal
within excess Roads & storm
water
R8 400.00 NIL documents outstanding from a claimant 2015/2016
14/10/2015 1032/15 HDT360MP hit
pothole -
Secunda
within excess Roads & storm
water
R 9 300.00 NIL outstanding dated pothole picture from
claimant
2015/2016
12/02/2016 0287/15 DYK199MP
bumped by
DGW617MP
vehicle Roads & storm
water
Unknown(Third party
claim no quotations
received )
R2 500.00 GMM vehicle was not damaged and
waiting for third party documents
2015/2016
22/10/2015 0831/15 FMF273MP hit
CG50CCGP
Third party Technical
Services
R19 198.00 R 3 000.00 Departmental report submitted to the
insurer and third party documents still
outstanding.
2015/2016
18/09/2015 0040/15 Theft at Kinross
landfill site
Building Community
services
Unknown(quotation
not yet received)
Unknown Replacement quotations still outstanding 2015/2016
P a g e | 35
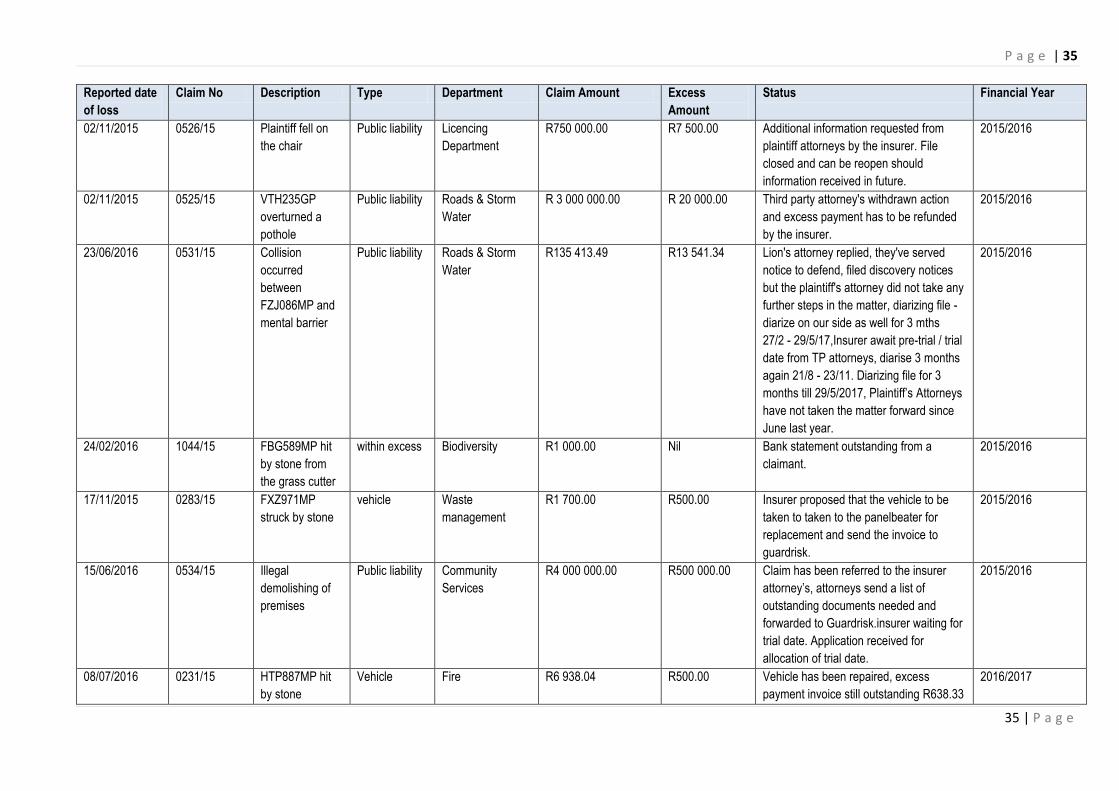
35 | P a g e
Reported date
of loss
Claim No Description Type Department Claim Amount Excess
Amount
Status Financial Year
02/11/2015 0526/15 Plaintiff fell on
the chair
Public liability Licencing
Department
R750 000.00 R7 500.00 Additional information requested from
plaintiff attorneys by the insurer. File
closed and can be reopen should
information received in future.
2015/2016
02/11/2015 0525/15 VTH235GP
overturned a
pothole
Public liability Roads & Storm
Water
R 3 000 000.00 R 20 000.00 Third party attorney's withdrawn action
and excess payment has to be refunded
by the insurer.
2015/2016
23/06/2016 0531/15 Collision
occurred
between
FZJ086MP and
mental barrier
Public liability Roads & Storm
Water
R135 413.49 R13 541.34 Lion's attorney replied, they've served
notice to defend, filed discovery notices
but the plaintiff's attorney did not take any
further steps in the matter, diarizing file -
diarize on our side as well for 3 mths
27/2 - 29/5/17,Insurer await pre-trial / trial
date from TP attorneys, diarise 3 months
again 21/8 - 23/11. Diarizing file for 3
months till 29/5/2017, Plaintiff’s Attorneys
have not taken the matter forward since
June last year.
2015/2016
24/02/2016 1044/15 FBG589MP hit
by stone from
the grass cutter
within excess Biodiversity R1 000.00 Nil Bank statement outstanding from a
claimant.
2015/2016
17/11/2015 0283/15 FXZ971MP
struck by stone
vehicle Waste
management
R1 700.00
R500.00 Insurer proposed that the vehicle to be
taken to taken to the panelbeater for
replacement and send the invoice to
guardrisk.
2015/2016
15/06/2016 0534/15 Illegal
demolishing of
premises
Public liability Community
Services
R4 000 000.00 R500 000.00 Claim has been referred to the insurer
attorney’s, attorneys send a list of
outstanding documents needed and
forwarded to Guardrisk.insurer waiting for
trial date. Application received for
allocation of trial date.
2015/2016
08/07/2016 0231/15 HTP887MP hit
by stone
Vehicle Fire R6 938.04 R500.00 Vehicle has been repaired, excess
payment invoice still outstanding R638.33
2016/2017
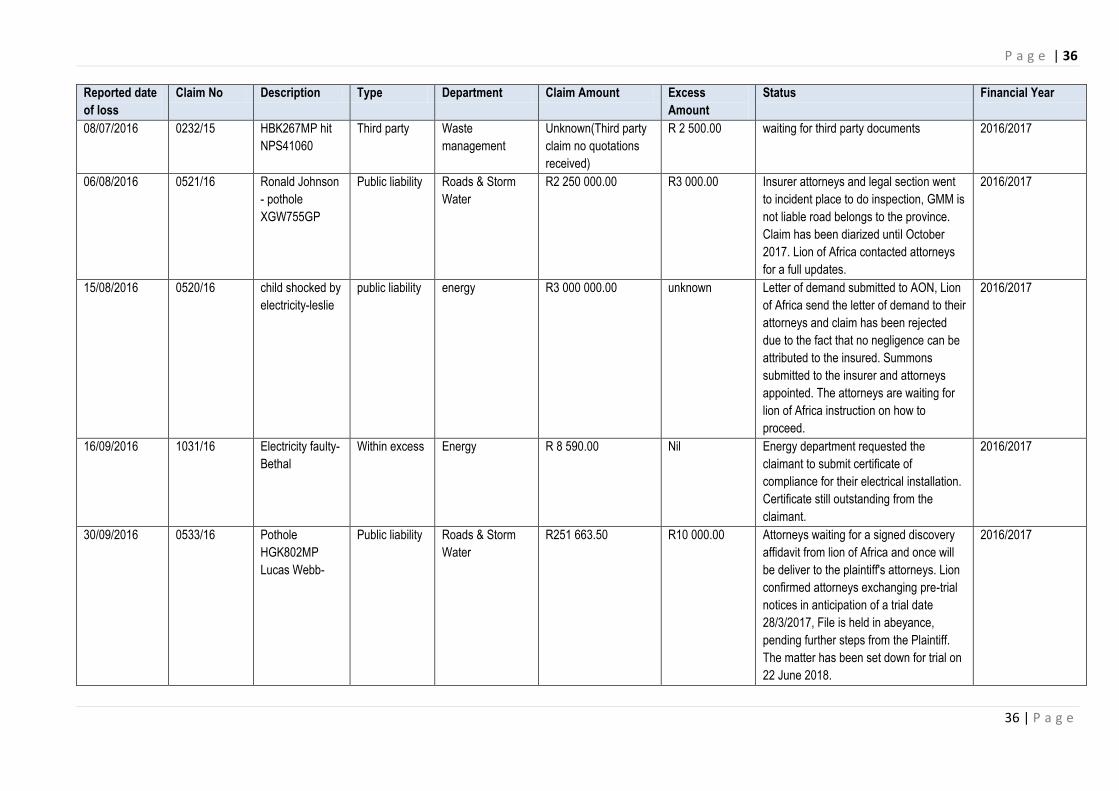
P a g e | 36
36 | P a g e
Reported date
of loss
Claim No Description Type Department Claim Amount Excess
Amount
Status Financial Year
08/07/2016 0232/15 HBK267MP hit
NPS41060
Third party Waste
management
Unknown(Third party
claim no quotations
received)
R 2 500.00 waiting for third party documents 2016/2017
06/08/2016 0521/16 Ronald Johnson
- pothole
XGW755GP
Public liability Roads & Storm
Water
R2 250 000.00 R3 000.00 Insurer attorneys and legal section went
to incident place to do inspection, GMM is
not liable road belongs to the province.
Claim has been diarized until October
2017. Lion of Africa contacted attorneys
for a full updates.
2016/2017
15/08/2016 0520/16 child shocked by
electricity-leslie
public liability energy R3 000 000.00 unknown Letter of demand submitted to AON, Lion
of Africa send the letter of demand to their
attorneys and claim has been rejected
due to the fact that no negligence can be
attributed to the insured. Summons
submitted to the insurer and attorneys
appointed. The attorneys are waiting for
lion of Africa instruction on how to
proceed.
2016/2017
16/09/2016 1031/16 Electricity faulty-
Bethal
Within excess Energy R 8 590.00 Nil Energy department requested the
claimant to submit certificate of
compliance for their electrical installation.
Certificate still outstanding from the
claimant.
2016/2017
30/09/2016 0533/16
Pothole
HGK802MP
Lucas Webb-
Public liability Roads & Storm
Water
R251 663.50 R10 000.00 Attorneys waiting for a signed discovery
affidavit from lion of Africa and once will
be deliver to the plaintiff's attorneys. Lion
confirmed attorneys exchanging pre-trial
notices in anticipation of a trial date
28/3/2017, File is held in abeyance,
pending further steps from the Plaintiff.
The matter has been set down for trial on
22 June 2018.
2016/2017
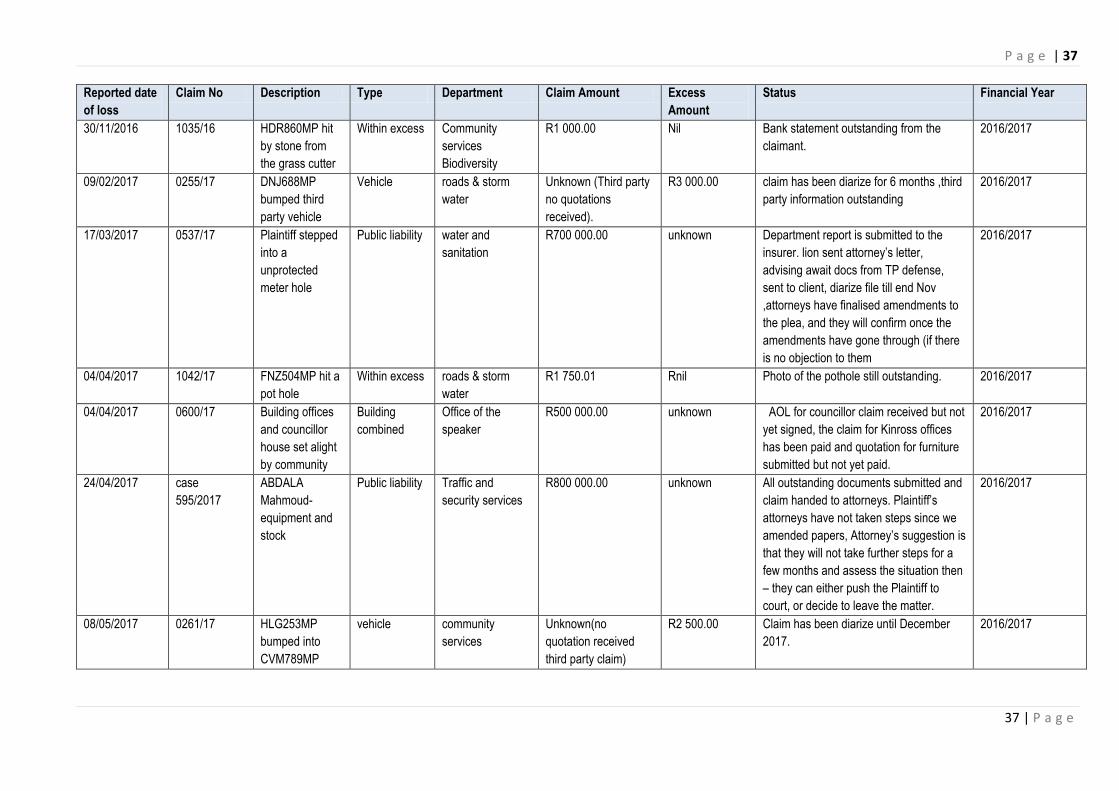
P a g e | 37
37 | P a g e
Reported date
of loss
Claim No Description Type Department Claim Amount Excess
Amount
Status Financial Year
30/11/2016 1035/16 HDR860MP hit
by stone from
the grass cutter
Within excess Community
services
Biodiversity
R1 000.00 Nil Bank statement outstanding from the
claimant.
2016/2017
09/02/2017 0255/17 DNJ688MP
bumped third
party vehicle
Vehicle roads & storm
water
Unknown (Third party
no quotations
received).
R3 000.00 claim has been diarize for 6 months ,third
party information outstanding
2016/2017
17/03/2017 0537/17 Plaintiff stepped
into a
unprotected
meter hole
Public liability water and
sanitation
R700 000.00
unknown Department report is submitted to the
insurer. lion sent attorney’s letter,
advising await docs from TP defense,
sent to client, diarize file till end Nov
,attorneys have finalised amendments to
the plea, and they will confirm once the
amendments have gone through (if there
is no objection to them
2016/2017
04/04/2017 1042/17 FNZ504MP hit a
pot hole
Within excess roads & storm
water
R1 750.01 Rnil Photo of the pothole still outstanding. 2016/2017
04/04/2017 0600/17 Building offices
and councillor
house set alight
by community
Building
combined
Office of the
speaker
R500 000.00 unknown AOL for councillor claim received but not
yet signed, the claim for Kinross offices
has been paid and quotation for furniture
submitted but not yet paid.
2016/2017
24/04/2017
case
595/2017
ABDALA
Mahmoud-
equipment and
stock
Public liability Traffic and
security services
R800 000.00 unknown All outstanding documents submitted and
claim handed to attorneys. Plaintiff’s
attorneys have not taken steps since we
amended papers, Attorney’s suggestion is
that they will not take further steps for a
few months and assess the situation then
– they can either push the Plaintiff to
court, or decide to leave the matter.
2016/2017
08/05/2017 0261/17 HLG253MP
bumped into
CVM789MP
vehicle community
services
Unknown(no
quotation received
third party claim)
R2 500.00 Claim has been diarize until December
2017.
2016/2017
P a g e | 38
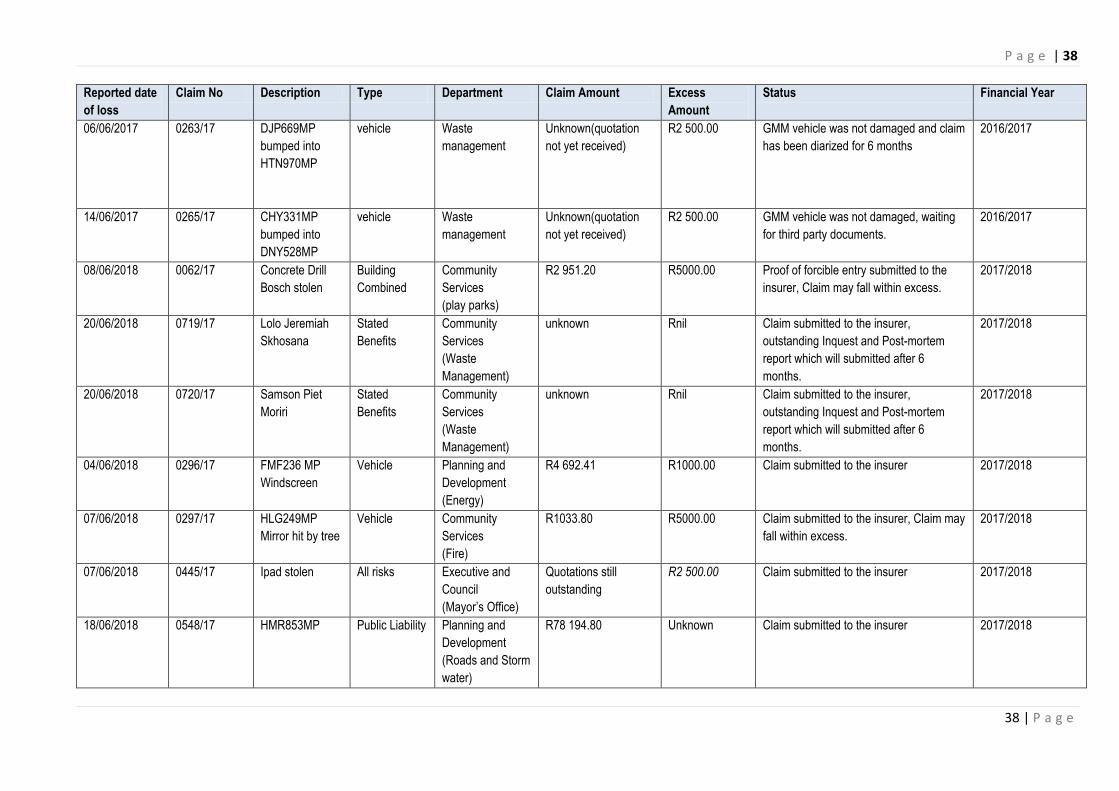
38 | P a g e
Reported date
of loss
Claim No Description Type Department Claim Amount Excess
Amount
Status Financial Year
06/06/2017 0263/17 DJP669MP
bumped into
HTN970MP
vehicle Waste
management
Unknown(quotation
not yet received)
R2 500.00
GMM vehicle was not damaged and claim
has been diarized for 6 months
2016/2017
14/06/2017 0265/17 CHY331MP
bumped into
DNY528MP
vehicle Waste
management
Unknown(quotation
not yet received)
R2 500.00 GMM vehicle was not damaged, waiting
for third party documents.
2016/2017
08/06/2018
0062/17 Concrete Drill
Bosch stolen
Building
Combined
Community
Services
(play parks)
R2 951.20 R5000.00 Proof of forcible entry submitted to the
insurer, Claim may fall within excess.
2017/2018
20/06/2018
0719/17 Lolo Jeremiah
Skhosana
Stated
Benefits
Community
Services
(Waste
Management)
unknown Rnil Claim submitted to the insurer,
outstanding Inquest and Post-mortem
report which will submitted after 6
months.
2017/2018
20/06/2018 0720/17 Samson Piet
Moriri
Stated
Benefits
Community
Services
(Waste
Management)
unknown Rnil Claim submitted to the insurer,
outstanding Inquest and Post-mortem
report which will submitted after 6
months.
2017/2018
04/06/2018 0296/17 FMF236 MP
Windscreen
Vehicle Planning and
Development
(Energy)
R4 692.41 R1000.00 Claim submitted to the insurer 2017/2018
07/06/2018
0297/17 HLG249MP
Mirror hit by tree
Vehicle Community
Services
(Fire)
R1033.80 R5000.00 Claim submitted to the insurer, Claim may
fall within excess.
2017/2018
07/06/2018
0445/17 Ipad stolen All risks Executive and
Council
(Mayor’s Office)
Quotations still
outstanding
R2 500.00 Claim submitted to the insurer 2017/2018
18/06/2018 0548/17 HMR853MP Public Liability Planning and
Development
(Roads and Storm
water)
R78 194.80 Unknown Claim submitted to the insurer 2017/2018
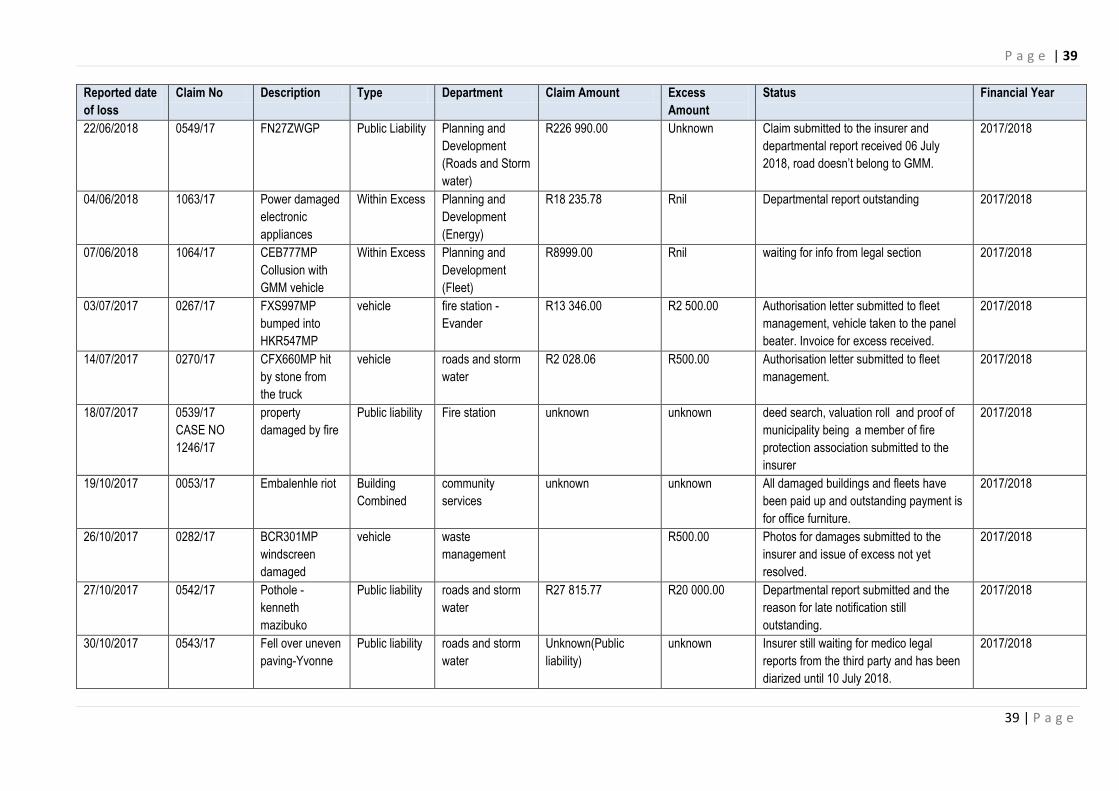
P a g e | 39
39 | P a g e
Reported date
of loss
Claim No Description Type Department Claim Amount Excess
Amount
Status Financial Year
22/06/2018
0549/17
FN27ZWGP Public Liability Planning and
Development
(Roads and Storm
water)
R226 990.00 Unknown Claim submitted to the insurer and
departmental report received 06 July
2018, road doesn’t belong to GMM.
2017/2018
04/06/2018 1063/17 Power damaged
electronic
appliances
Within Excess Planning and
Development
(Energy)
R18 235.78 Rnil Departmental report outstanding 2017/2018
07/06/2018 1064/17 CEB777MP
Collusion with
GMM vehicle
Within Excess Planning and
Development
(Fleet)
R8999.00 Rnil waiting for info from legal section 2017/2018
03/07/2017 0267/17 FXS997MP
bumped into
HKR547MP
vehicle fire station -
Evander
R13 346.00 R2 500.00 Authorisation letter submitted to fleet
management, vehicle taken to the panel
beater. Invoice for excess received.
2017/2018
14/07/2017 0270/17 CFX660MP hit
by stone from
the truck
vehicle roads and storm
water
R2 028.06 R500.00 Authorisation letter submitted to fleet
management.
2017/2018
18/07/2017 0539/17
CASE NO
1246/17
property
damaged by fire
Public liability Fire station unknown unknown deed search, valuation roll and proof of
municipality being a member of fire
protection association submitted to the
insurer
2017/2018
19/10/2017 0053/17 Embalenhle riot Building
Combined
community
services
unknown unknown All damaged buildings and fleets have
been paid up and outstanding payment is
for office furniture.
2017/2018
26/10/2017 0282/17 BCR301MP
windscreen
damaged
vehicle waste
management
R500.00 Photos for damages submitted to the
insurer and issue of excess not yet
resolved.
2017/2018
27/10/2017 0542/17 Pothole -
kenneth
mazibuko
Public liability roads and storm
water
R27 815.77 R20 000.00 Departmental report submitted and the
reason for late notification still
outstanding.
2017/2018
30/10/2017 0543/17 Fell over uneven
paving-Yvonne
Public liability roads and storm
water
Unknown(Public
liability)
unknown Insurer still waiting for medico legal
reports from the third party and has been
diarized until 10 July 2018.
2017/2018
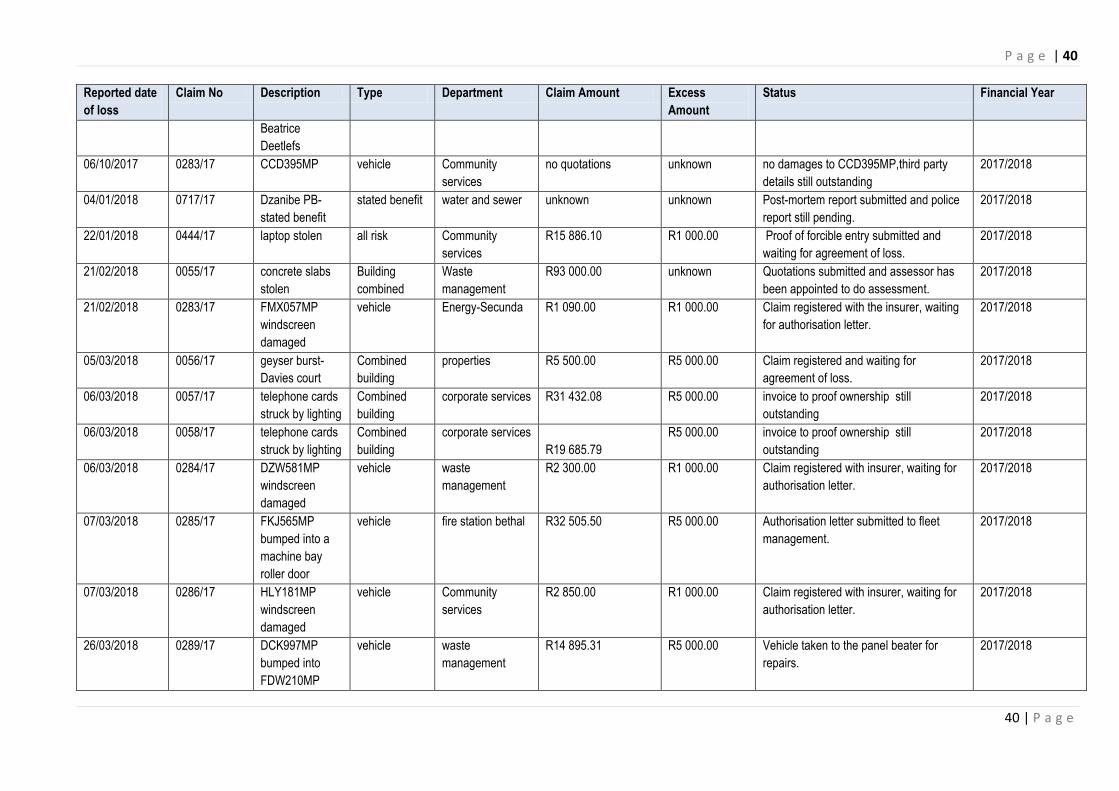
P a g e | 40
40 | P a g e
Reported date
of loss
Claim No Description Type Department Claim Amount Excess
Amount
Status Financial Year
Beatrice
Deetlefs
06/10/2017 0283/17 CCD395MP vehicle Community
services
no quotations unknown no damages to CCD395MP,third party
details still outstanding
2017/2018
04/01/2018 0717/17 Dzanibe PB-
stated benefit
stated benefit water and sewer unknown unknown Post-mortem report submitted and police
report still pending.
2017/2018
22/01/2018 0444/17 laptop stolen all risk Community
services
R15 886.10 R1 000.00 Proof of forcible entry submitted and
waiting for agreement of loss.
2017/2018
21/02/2018 0055/17 concrete slabs
stolen
Building
combined
Waste
management
R93 000.00 unknown Quotations submitted and assessor has
been appointed to do assessment.
2017/2018
21/02/2018 0283/17 FMX057MP
windscreen
damaged
vehicle Energy-Secunda R1 090.00 R1 000.00 Claim registered with the insurer, waiting
for authorisation letter.
2017/2018
05/03/2018 0056/17 geyser burst-
Davies court
Combined
building
properties R5 500.00 R5 000.00 Claim registered and waiting for
agreement of loss.
2017/2018
06/03/2018 0057/17 telephone cards
struck by lighting
Combined
building
corporate services R31 432.08 R5 000.00 invoice to proof ownership still
outstanding
2017/2018
06/03/2018 0058/17 telephone cards
struck by lighting
Combined
building
corporate services
R19 685.79
R5 000.00 invoice to proof ownership still
outstanding
2017/2018
06/03/2018 0284/17 DZW581MP
windscreen
damaged
vehicle waste
management
R2 300.00 R1 000.00 Claim registered with insurer, waiting for
authorisation letter.
2017/2018
07/03/2018 0285/17 FKJ565MP
bumped into a
machine bay
roller door
vehicle fire station bethal R32 505.50 R5 000.00 Authorisation letter submitted to fleet
management.
2017/2018
07/03/2018 0286/17 HLY181MP
windscreen
damaged
vehicle Community
services
R2 850.00 R1 000.00 Claim registered with insurer, waiting for
authorisation letter.
2017/2018
26/03/2018 0289/17 DCK997MP
bumped into
FDW210MP
vehicle waste
management
R14 895.31 R5 000.00 Vehicle taken to the panel beater for
repairs.
2017/2018
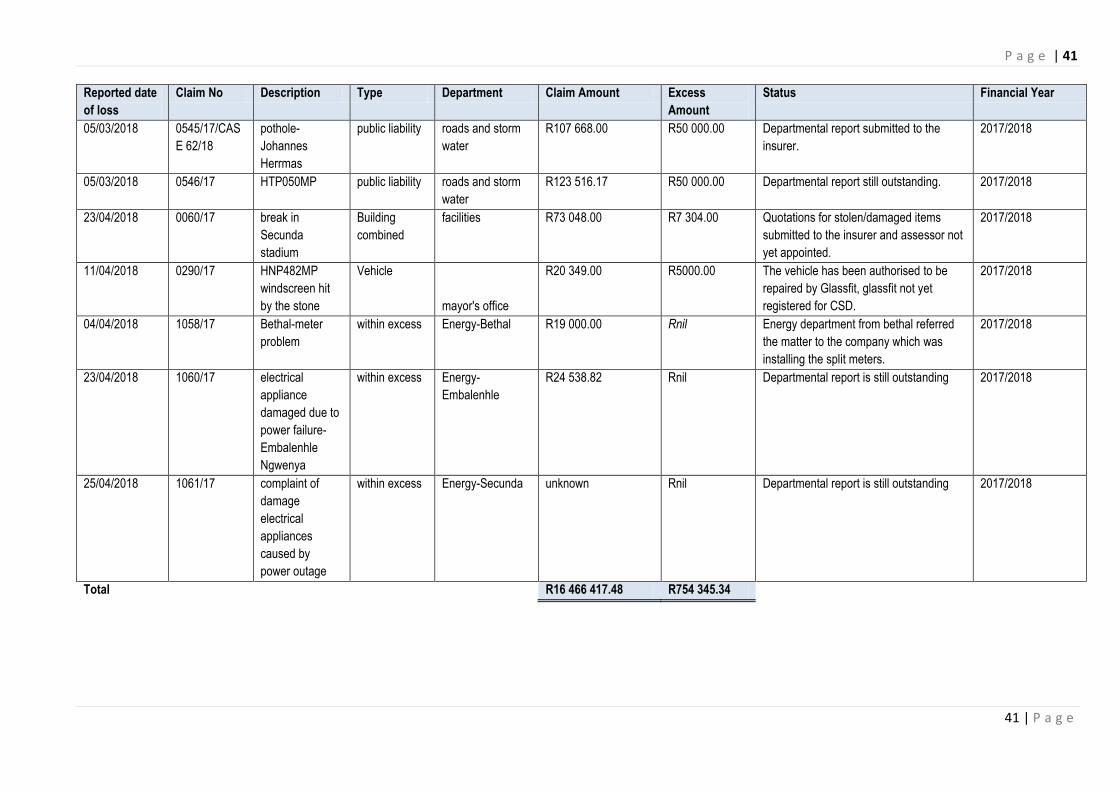
P a g e | 41
41 | P a g e
Reported date
of loss
Claim No Description Type Department Claim Amount Excess
Amount
Status Financial Year
05/03/2018 0545/17/CAS
E 62/18
pothole-
Johannes
Herrmas
public liability roads and storm
water
R107 668.00 R50 000.00 Departmental report submitted to the
insurer.
2017/2018
05/03/2018 0546/17 HTP050MP public liability roads and storm
water
R123 516.17 R50 000.00 Departmental report still outstanding. 2017/2018
23/04/2018
0060/17 break in
Secunda
stadium
Building
combined
facilities R73 048.00 R7 304.00 Quotations for stolen/damaged items
submitted to the insurer and assessor not
yet appointed.
2017/2018
11/04/2018 0290/17 HNP482MP
windscreen hit
by the stone
Vehicle
mayor's office
R20 349.00 R5000.00 The vehicle has been authorised to be
repaired by Glassfit, glassfit not yet
registered for CSD.
2017/2018
04/04/2018 1058/17 Bethal-meter
problem
within excess Energy-Bethal R19 000.00 Rnil Energy department from bethal referred
the matter to the company which was
installing the split meters.
2017/2018
23/04/2018
1060/17 electrical
appliance
damaged due to
power failure-
Embalenhle
Ngwenya
within excess Energy-
Embalenhle
R24 538.82 Rnil Departmental report is still outstanding 2017/2018
25/04/2018 1061/17 complaint of
damage
electrical
appliances
caused by
power outage
within excess Energy-Secunda unknown Rnil Departmental report is still outstanding 2017/2018
Total R16 466 417.48 R754 345.34
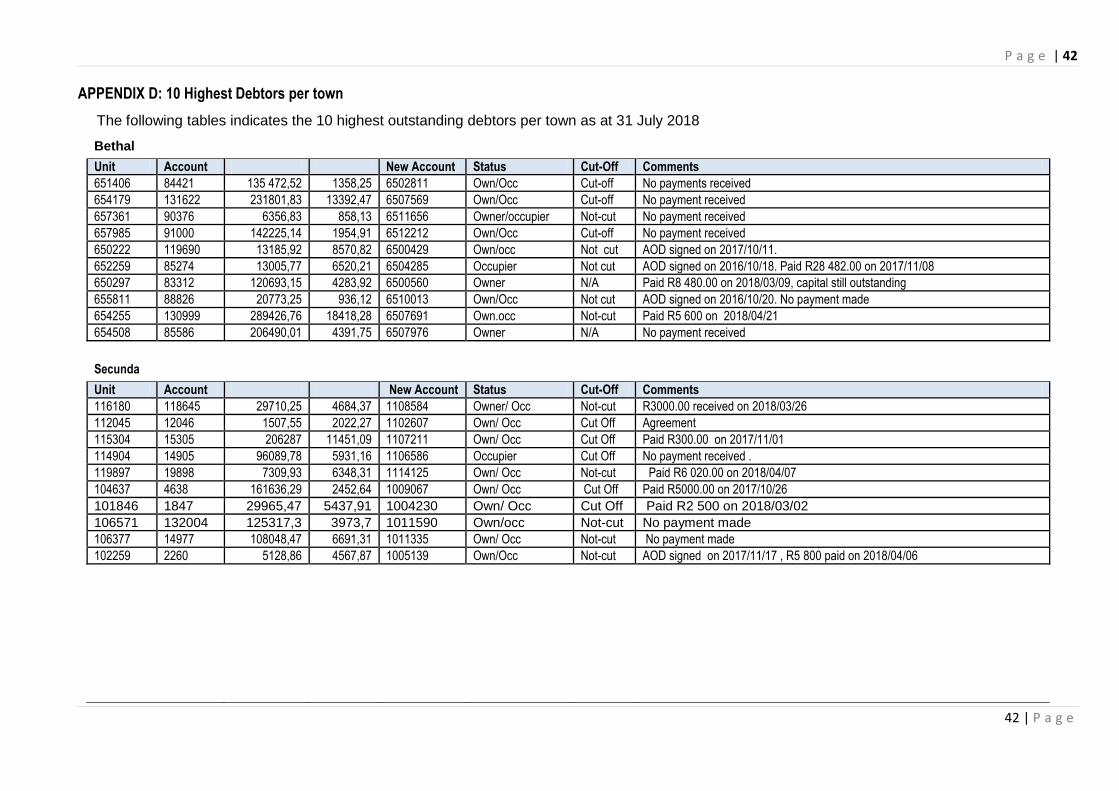
P a g e | 42
42 | P a g e
APPENDIX D: 10 Highest Debtors per town
The following tables indicates the 10 highest outstanding debtors per town as at 31 July 2018
Bethal
Unit Account New Account Status Cut-Off Comments
651406 84421 135 472,52 1358,25 6502811 Own/Occ Cut-off No payments received
654179 131622 231801,83 13392,47 6507569 Own/Occ Cut-off No payment received
657361 90376 6356,83 858,13 6511656 Owner/occupier Not-cut No payment received
657985 91000 142225,14 1954,91 6512212 Own/Occ Cut-off No payment received
650222 119690 13185,92 8570,82 6500429 Own/occ Not cut AOD signed on 2017/10/11.
652259 85274 13005,77 6520,21 6504285 Occupier Not cut AOD signed on 2016/10/18. Paid R28 482.00 on 2017/11/08
650297 83312 120693,15 4283,92 6500560 Owner N/A Paid R8 480.00 on 2018/03/09, capital still outstanding
655811 88826 20773,25 936,12 6510013 Own/Occ Not cut AOD signed on 2016/10/20. No payment made
654255 130999 289426,76 18418,28 6507691 Own.occ Not-cut Paid R5 600 on 2018/04/21
654508 85586 206490,01 4391,75 6507976 Owner N/A No payment received
Secunda
Unit Account New Account Status Cut-Off Comments
116180 118645 29710,25 4684,37 1108584 Owner/ Occ Not-cut R3000.00 received on 2018/03/26
112045 12046 1507,55 2022,27 1102607 Own/ Occ Cut Off Agreement
115304 15305 206287 11451,09 1107211 Own/ Occ Cut Off Paid R300.00 on 2017/11/01
114904 14905 96089,78 5931,16 1106586 Occupier Cut Off No payment received .
119897 19898 7309,93 6348,31 1114125 Own/ Occ Not-cut Paid R6 020.00 on 2018/04/07
104637 4638 161636,29 2452,64 1009067 Own/ Occ Cut Off Paid R5000.00 on 2017/10/26
101846 1847 29965,47 5437,91 1004230 Own/ Occ Cut Off Paid R2 500 on 2018/03/02
106571 132004 125317,3 3973,7 1011590 Own/occ Not-cut No payment made
106377 14977 108048,47 6691,31 1011335 Own/ Occ Not-cut No payment made
102259 2260 5128,86 4567,87 1005139 Own/Occ Not-cut AOD signed on 2017/11/17 , R5 800 paid on 2018/04/06
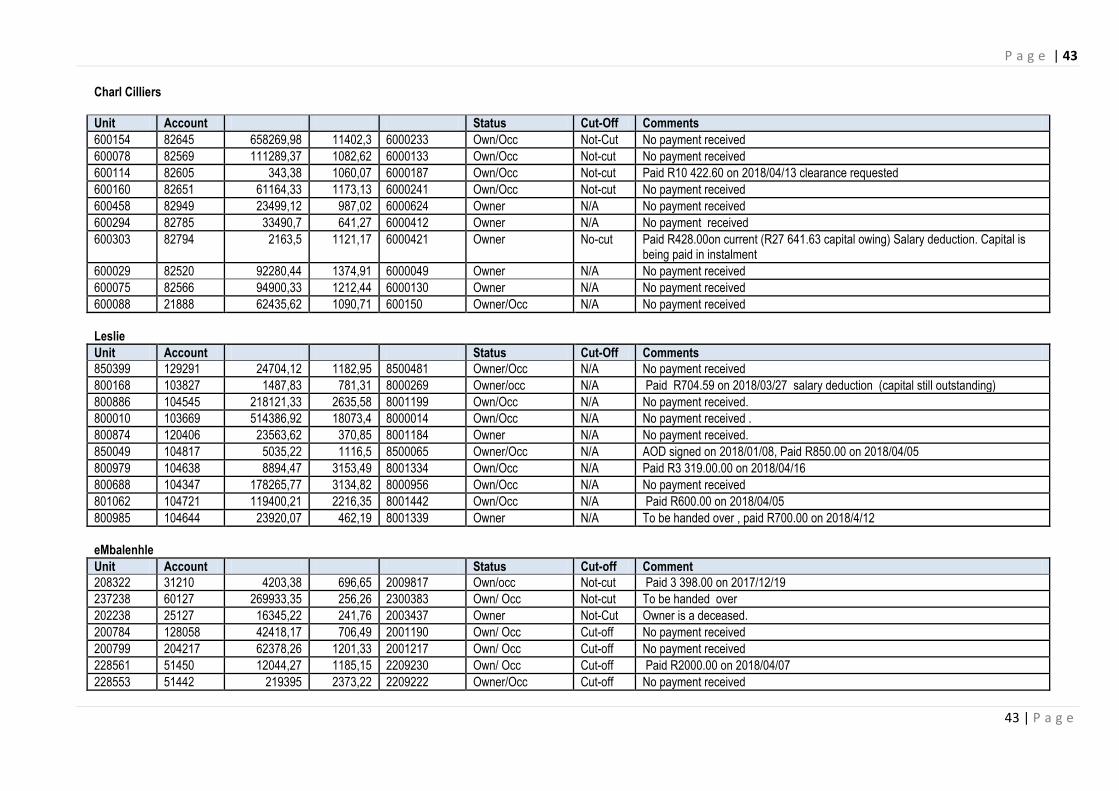
P a g e | 43
43 | P a g e
Charl Cilliers
Unit Account Status Cut-Off Comments
600154 82645 658269,98 11402,3 6000233 Own/Occ Not-Cut No payment received
600078 82569 111289,37 1082,62 6000133 Own/Occ Not-cut No payment received
600114 82605 343,38 1060,07 6000187 Own/Occ Not-cut Paid R10 422.60 on 2018/04/13 clearance requested
600160 82651 61164,33 1173,13 6000241 Own/Occ Not-cut No payment received
600458 82949 23499,12 987,02 6000624 Owner N/A No payment received
600294 82785 33490,7 641,27 6000412 Owner N/A No payment received
600303 82794 2163,5 1121,17 6000421 Owner No-cut Paid R428.00on current (R27 641.63 capital owing) Salary deduction. Capital is being paid in instalment
600029 82520 92280,44 1374,91 6000049 Owner N/A No payment received
600075 82566 94900,33 1212,44 6000130 Owner N/A No payment received
600088 21888 62435,62 1090,71 600150 Owner/Occ N/A No payment received
Leslie
Unit Account Status Cut-Off Comments
850399 129291 24704,12 1182,95 8500481 Owner/Occ N/A No payment received
800168 103827 1487,83 781,31 8000269 Owner/occ N/A Paid R704.59 on 2018/03/27 salary deduction (capital still outstanding)
800886 104545 218121,33 2635,58 8001199 Own/Occ N/A No payment received.
800010 103669 514386,92 18073,4 8000014 Own/Occ N/A No payment received .
800874 120406 23563,62 370,85 8001184 Owner N/A No payment received.
850049 104817 5035,22 1116,5 8500065 Owner/Occ N/A AOD signed on 2018/01/08, Paid R850.00 on 2018/04/05
800979 104638 8894,47 3153,49 8001334 Own/Occ N/A Paid R3 319.00.00 on 2018/04/16
800688 104347 178265,77 3134,82 8000956 Own/Occ N/A No payment received
801062 104721 119400,21 2216,35 8001442 Own/Occ N/A Paid R600.00 on 2018/04/05
800985 104644 23920,07 462,19 8001339 Owner N/A To be handed over , paid R700.00 on 2018/4/12
eMbalenhle
Unit Account Status Cut-off Comment
208322 31210 4203,38 696,65 2009817 Own/occ Not-cut Paid 3 398.00 on 2017/12/19
237238 60127 269933,35 256,26 2300383 Own/ Occ Not-cut To be handed over
202238 25127 16345,22 241,76 2003437 Owner Not-Cut Owner is a deceased.
200784 128058 42418,17 706,49 2001190 Own/ Occ Cut-off No payment received
200799 204217 62378,26 1201,33 2001217 Own/ Occ Cut-off No payment received
228561 51450 12044,27 1185,15 2209230 Own/ Occ Cut-off Paid R2000.00 on 2018/04/07
228553 51442 219395 2373,22 2209222 Owner/Occ Cut-off No payment received
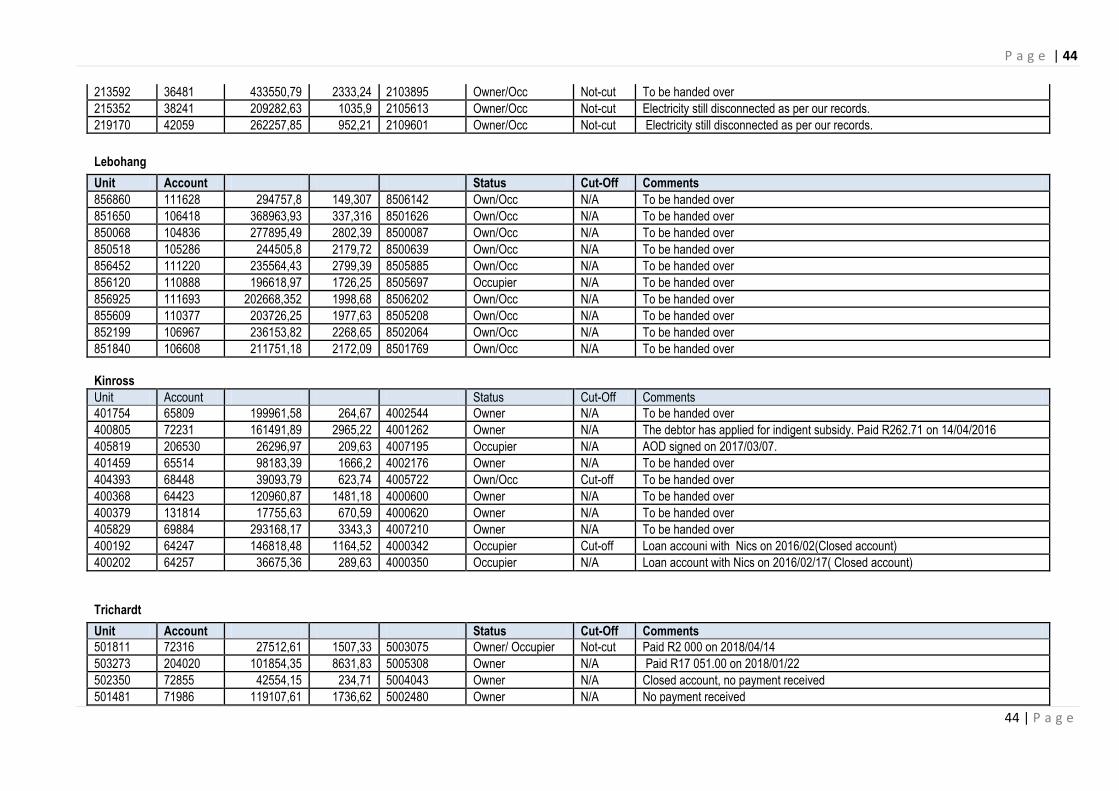
P a g e | 44
44 | P a g e
213592 36481 433550,79 2333,24 2103895 Owner/Occ Not-cut To be handed over
215352 38241 209282,63 1035,9 2105613 Owner/Occ Not-cut Electricity still disconnected as per our records.
219170 42059 262257,85 952,21 2109601 Owner/Occ Not-cut Electricity still disconnected as per our records.
Lebohang
Unit Account Status Cut-Off Comments
856860 111628 294757,8 149,307 8506142 Own/Occ N/A To be handed over
851650 106418 368963,93 337,316 8501626 Own/Occ N/A To be handed over
850068 104836 277895,49 2802,39 8500087 Own/Occ N/A To be handed over
850518 105286 244505,8 2179,72 8500639 Own/Occ N/A To be handed over
856452 111220 235564,43 2799,39 8505885 Own/Occ N/A To be handed over
856120 110888 196618,97 1726,25 8505697 Occupier N/A To be handed over
856925 111693 202668,352 1998,68 8506202 Own/Occ N/A To be handed over
855609 110377 203726,25 1977,63 8505208 Own/Occ N/A To be handed over
852199 106967 236153,82 2268,65 8502064 Own/Occ N/A To be handed over
851840 106608 211751,18 2172,09 8501769 Own/Occ N/A To be handed over
Kinross
Unit Account Status Cut-Off Comments
401754 65809 199961,58 264,67 4002544 Owner N/A To be handed over
400805 72231 161491,89 2965,22 4001262 Owner N/A The debtor has applied for indigent subsidy. Paid R262.71 on 14/04/2016
405819 206530 26296,97 209,63 4007195 Occupier N/A AOD signed on 2017/03/07.
401459 65514 98183,39 1666,2 4002176 Owner N/A To be handed over
404393 68448 39093,79 623,74 4005722 Own/Occ Cut-off To be handed over
400368 64423 120960,87 1481,18 4000600 Owner N/A To be handed over
400379 131814 17755,63 670,59 4000620 Owner N/A To be handed over
405829 69884 293168,17 3343,3 4007210 Owner N/A To be handed over
400192 64247 146818,48 1164,52 4000342 Occupier Cut-off Loan accouni with Nics on 2016/02(Closed account)
400202 64257 36675,36 289,63 4000350 Occupier N/A Loan account with Nics on 2016/02/17( Closed account)
Trichardt
Unit Account Status Cut-Off Comments
501811 72316 27512,61 1507,33 5003075 Owner/ Occupier Not-cut Paid R2 000 on 2018/04/14
503273 204020 101854,35 8631,83 5005308 Owner N/A Paid R17 051.00 on 2018/01/22
502350 72855 42554,15 234,71 5004043 Owner N/A Closed account, no payment received
501481 71986 119107,61 1736,62 5002480 Owner N/A No payment received
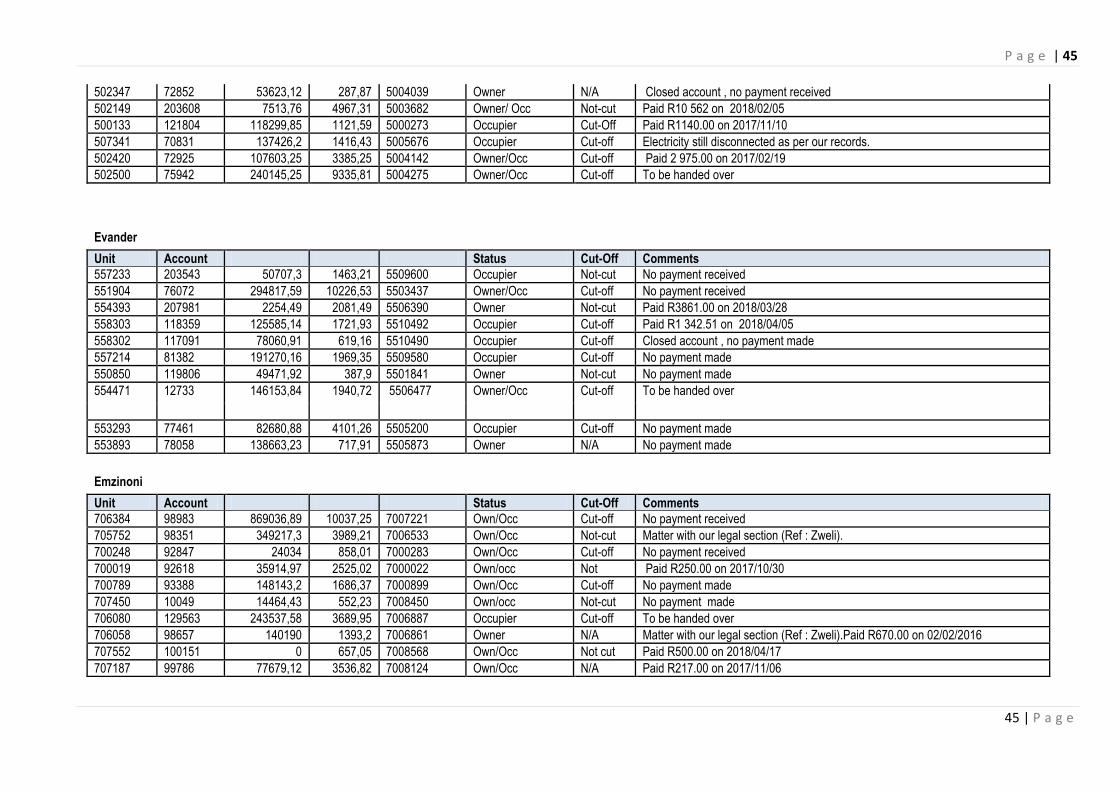
P a g e | 45
45 | P a g e
502347 72852 53623,12 287,87 5004039 Owner N/A Closed account , no payment received
502149 203608 7513,76 4967,31 5003682 Owner/ Occ Not-cut Paid R10 562 on 2018/02/05
500133 121804 118299,85 1121,59 5000273 Occupier Cut-Off Paid R1140.00 on 2017/11/10
507341 70831 137426,2 1416,43 5005676 Occupier Cut-off Electricity still disconnected as per our records.
502420 72925 107603,25 3385,25 5004142 Owner/Occ Cut-off Paid 2 975.00 on 2017/02/19
502500 75942 240145,25 9335,81 5004275 Owner/Occ Cut-off To be handed over
Evander
Unit Account Status Cut-Off Comments
557233 203543 50707,3 1463,21 5509600 Occupier Not-cut No payment received
551904 76072 294817,59 10226,53 5503437 Owner/Occ Cut-off No payment received
554393 207981 2254,49 2081,49 5506390 Owner Not-cut Paid R3861.00 on 2018/03/28
558303 118359 125585,14 1721,93 5510492 Occupier Cut-off Paid R1 342.51 on 2018/04/05
558302 117091 78060,91 619,16 5510490 Occupier Cut-off Closed account , no payment made
557214 81382 191270,16 1969,35 5509580 Occupier Cut-off No payment made
550850 119806 49471,92 387,9 5501841 Owner Not-cut No payment made
554471 12733 146153,84 1940,72 5506477 Owner/Occ Cut-off To be handed over
553293 77461 82680,88 4101,26 5505200 Occupier Cut-off No payment made
553893 78058 138663,23 717,91 5505873 Owner N/A No payment made
Emzinoni
Unit Account Status Cut-Off Comments
706384 98983 869036,89 10037,25 7007221 Own/Occ Cut-off No payment received
705752 98351 349217,3 3989,21 7006533 Own/Occ Not-cut Matter with our legal section (Ref : Zweli).
700248 92847 24034 858,01 7000283 Own/Occ Cut-off No payment received
700019 92618 35914,97 2525,02 7000022 Own/occ Not Paid R250.00 on 2017/10/30
700789 93388 148143,2 1686,37 7000899 Own/Occ Cut-off No payment made
707450 10049 14464,43 552,23 7008450 Own/occ Not-cut No payment made
706080 129563 243537,58 3689,95 7006887 Occupier Cut-off To be handed over
706058 98657 140190 1393,2 7006861 Owner N/A Matter with our legal section (Ref : Zweli).Paid R670.00 on 02/02/2016
707552 100151 0 657,05 7008568 Own/Occ Not cut Paid R500.00 on 2018/04/17
707187 99786 77679,12 3536,82 7008124 Own/Occ N/A Paid R217.00 on 2017/11/06
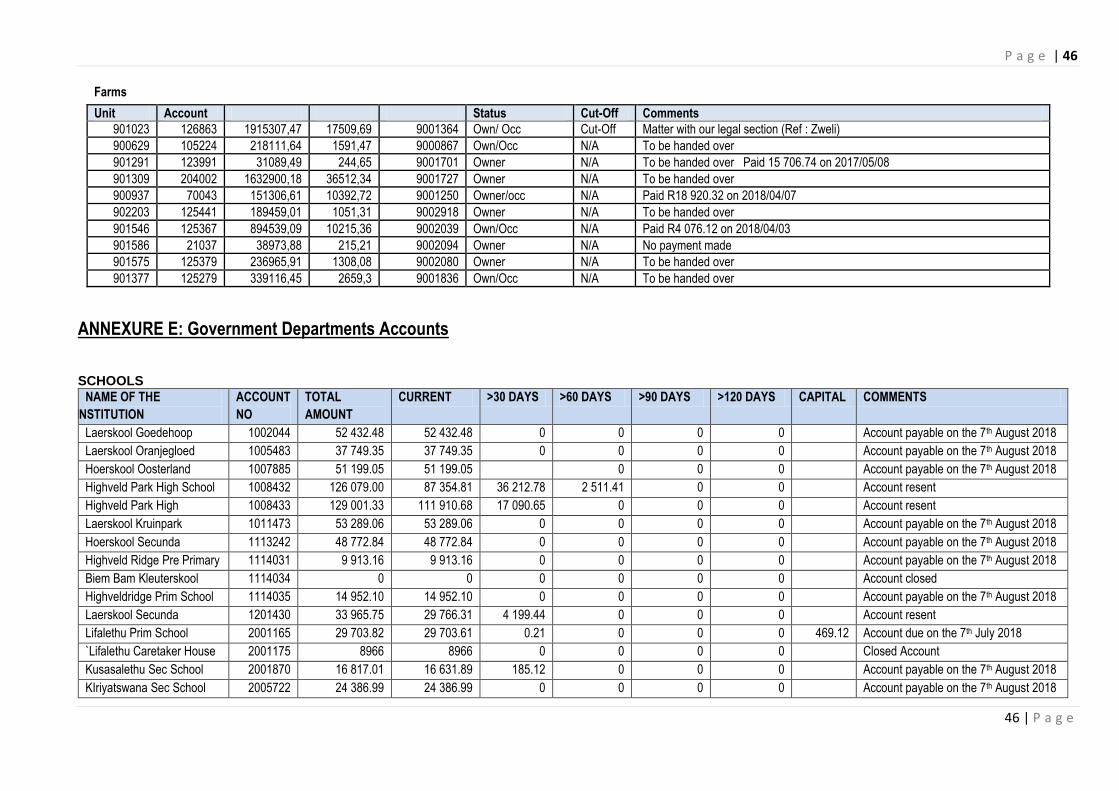
P a g e | 46
46 | P a g e
Farms
Unit Account Status Cut-Off Comments
901023 126863 1915307,47 17509,69 9001364 Own/ Occ Cut-Off Matter with our legal section (Ref : Zweli)
900629 105224 218111,64 1591,47 9000867 Own/Occ N/A To be handed over
901291 123991 31089,49 244,65 9001701 Owner N/A To be handed over Paid 15 706.74 on 2017/05/08
901309 204002 1632900,18 36512,34 9001727 Owner N/A To be handed over
900937 70043 151306,61 10392,72 9001250 Owner/occ N/A Paid R18 920.32 on 2018/04/07
902203 125441 189459,01 1051,31 9002918 Owner N/A To be handed over
901546 125367 894539,09 10215,36 9002039 Own/Occ N/A Paid R4 076.12 on 2018/04/03
901586 21037 38973,88 215,21 9002094 Owner N/A No payment made
901575 125379 236965,91 1308,08 9002080 Owner N/A To be handed over
901377 125279 339116,45 2659,3 9001836 Own/Occ N/A To be handed over
ANNEXURE E: Government Departments Accounts SCHOOLS
NAME OF THE
INSTITUTION
ACCOUNT
NO
TOTAL
AMOUNT
CURRENT >30 DAYS >60 DAYS >90 DAYS >120 DAYS CAPITAL COMMENTS
Laerskool Goedehoop 1002044 52 432.48 52 432.48 0 0 0 0 Account payable on the 7th August 2018
Laerskool Oranjegloed 1005483 37 749.35 37 749.35 0 0 0 0 Account payable on the 7th August 2018
Hoerskool Oosterland 1007885 51 199.05 51 199.05 0 0 0 Account payable on the 7th August 2018
Highveld Park High School 1008432 126 079.00 87 354.81 36 212.78 2 511.41 0 0 Account resent
Highveld Park High 1008433 129 001.33 111 910.68 17 090.65 0 0 0 Account resent
Laerskool Kruinpark 1011473 53 289.06 53 289.06 0 0 0 0 Account payable on the 7th August 2018
Hoerskool Secunda 1113242 48 772.84 48 772.84 0 0 0 0 Account payable on the 7th August 2018
Highveld Ridge Pre Primary 1114031 9 913.16 9 913.16 0 0 0 0 Account payable on the 7th August 2018
Biem Bam Kleuterskool 1114034 0 0 0 0 0 0 Account closed
Highveldridge Prim School 1114035 14 952.10 14 952.10 0 0 0 0 Account payable on the 7th August 2018
Laerskool Secunda 1201430 33 965.75 29 766.31 4 199.44 0 0 0 Account resent
Lifalethu Prim School 2001165 29 703.82 29 703.61 0.21 0 0 0 469.12 Account due on the 7th July 2018
`Lifalethu Caretaker House 2001175 8966 8966 0 0 0 0 Closed Account
Kusasalethu Sec School 2001870 16 817.01 16 631.89 185.12 0 0 0 Account payable on the 7th August 2018
KIriyatswana Sec School 2005722 24 386.99 24 386.99 0 0 0 0 Account payable on the 7th August 2018
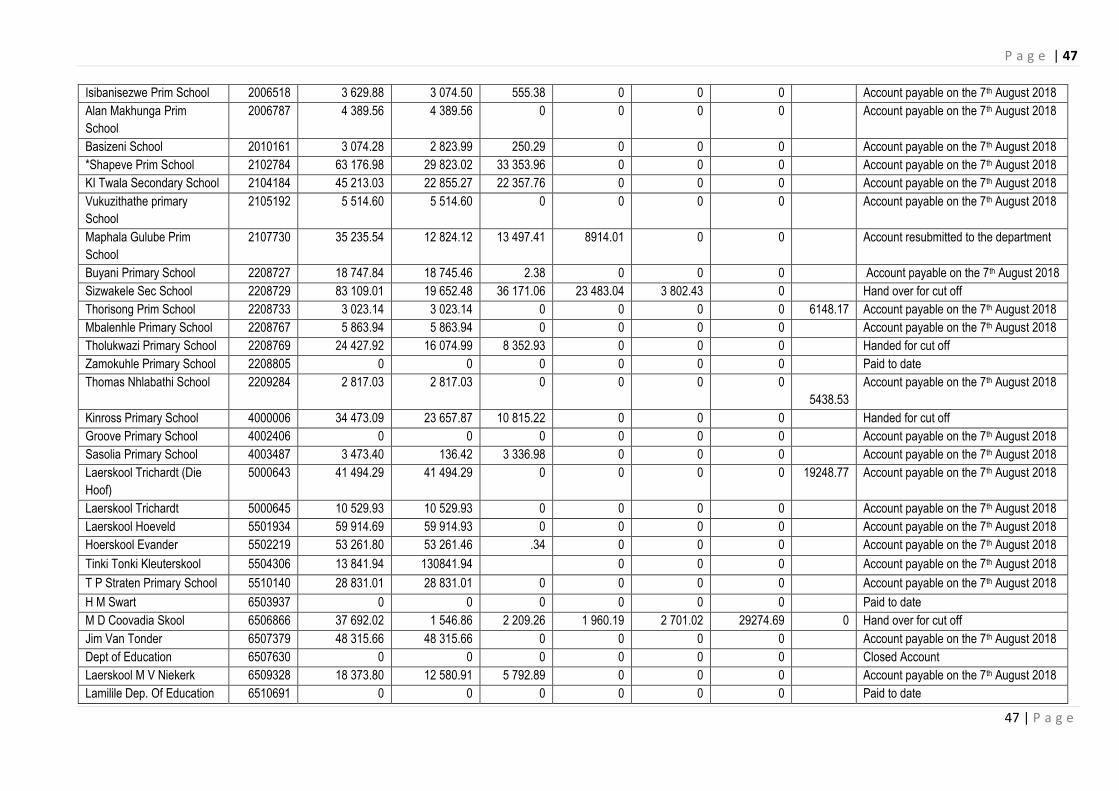
P a g e | 47
47 | P a g e
Isibanisezwe Prim School 2006518 3 629.88 3 074.50 555.38 0 0 0 Account payable on the 7th August 2018
Alan Makhunga Prim
School
2006787 4 389.56 4 389.56 0 0 0 0 Account payable on the 7th August 2018
Basizeni School 2010161 3 074.28 2 823.99 250.29 0 0 0 Account payable on the 7th August 2018
*Shapeve Prim School 2102784 63 176.98 29 823.02 33 353.96 0 0 0 Account payable on the 7th August 2018
KI Twala Secondary School 2104184 45 213.03 22 855.27 22 357.76 0 0 0 Account payable on the 7th August 2018
Vukuzithathe primary
School
2105192 5 514.60 5 514.60 0 0 0 0 Account payable on the 7th August 2018
Maphala Gulube Prim
School
2107730 35 235.54 12 824.12 13 497.41 8914.01 0 0 Account resubmitted to the department
Buyani Primary School 2208727 18 747.84 18 745.46 2.38 0 0 0 Account payable on the 7th August 2018
Sizwakele Sec School 2208729 83 109.01 19 652.48 36 171.06 23 483.04 3 802.43 0 Hand over for cut off
Thorisong Prim School 2208733 3 023.14 3 023.14 0 0 0 0 6148.17 Account payable on the 7th August 2018
Mbalenhle Primary School 2208767 5 863.94 5 863.94 0 0 0 0 Account payable on the 7th August 2018
Tholukwazi Primary School 2208769 24 427.92 16 074.99 8 352.93 0 0 0 Handed for cut off
Zamokuhle Primary School 2208805 0 0 0 0 0 0 Paid to date
Thomas Nhlabathi School 2209284 2 817.03 2 817.03 0 0 0 0
5438.53
Account payable on the 7th August 2018
Kinross Primary School 4000006 34 473.09 23 657.87 10 815.22 0 0 0 Handed for cut off
Groove Primary School 4002406 0 0 0 0 0 0 Account payable on the 7th August 2018
Sasolia Primary School 4003487 3 473.40 136.42 3 336.98 0 0 0 Account payable on the 7th August 2018
Laerskool Trichardt (Die
Hoof)
5000643 41 494.29 41 494.29 0 0 0 0 19248.77 Account payable on the 7th August 2018
Laerskool Trichardt 5000645 10 529.93 10 529.93 0 0 0 0 Account payable on the 7th August 2018
Laerskool Hoeveld 5501934 59 914.69 59 914.93 0 0 0 0 Account payable on the 7th August 2018
Hoerskool Evander 5502219 53 261.80 53 261.46 .34 0 0 0 Account payable on the 7th August 2018
Tinki Tonki Kleuterskool 5504306 13 841.94 130841.94 0 0 0 Account payable on the 7th August 2018
T P Straten Primary School 5510140 28 831.01 28 831.01 0 0 0 0 Account payable on the 7th August 2018
H M Swart 6503937 0 0 0 0 0 0 Paid to date
M D Coovadia Skool 6506866 37 692.02 1 546.86 2 209.26 1 960.19 2 701.02 29274.69 0 Hand over for cut off
Jim Van Tonder 6507379 48 315.66 48 315.66 0 0 0 0 Account payable on the 7th August 2018
Dept of Education 6507630 0 0 0 0 0 0 Closed Account
Laerskool M V Niekerk 6509328 18 373.80 12 580.91 5 792.89 0 0 0 Account payable on the 7th August 2018
Lamilile Dep. Of Education 6510691 0 0 0 0 0 0 Paid to date
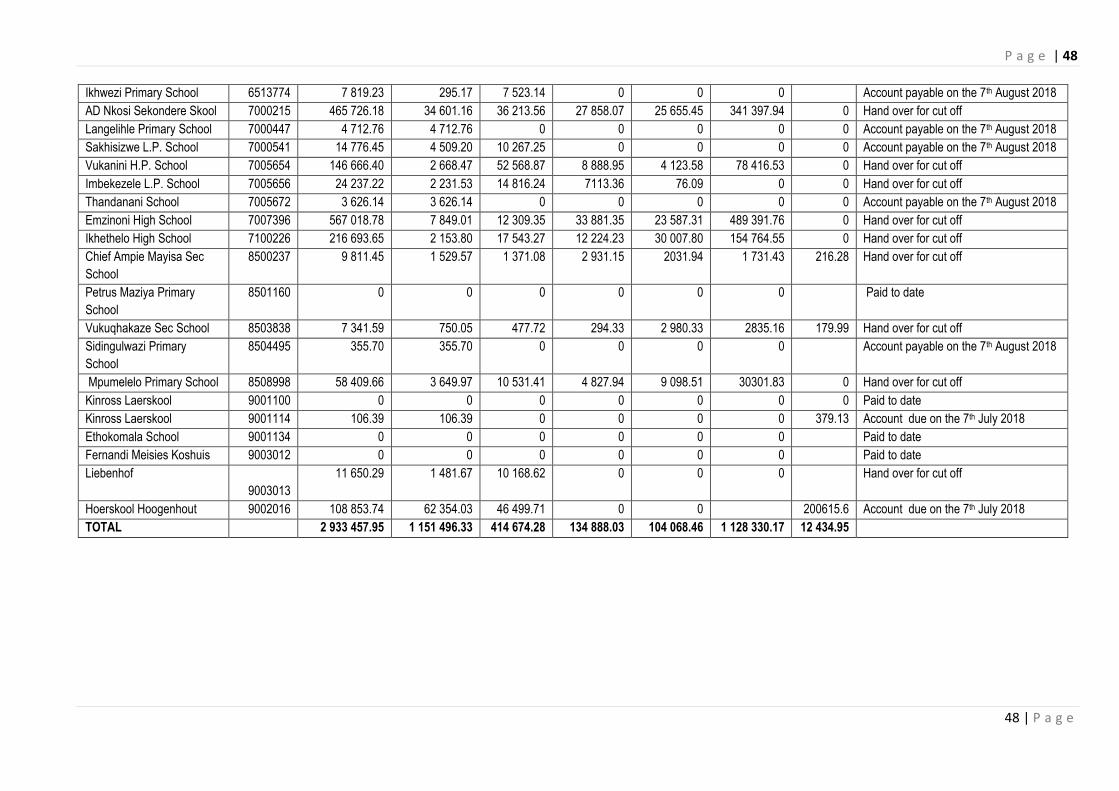
P a g e | 48
48 | P a g e
Ikhwezi Primary School 6513774 7 819.23 295.17 7 523.14 0 0 0 Account payable on the 7th August 2018
AD Nkosi Sekondere Skool 7000215 465 726.18 34 601.16 36 213.56 27 858.07 25 655.45 341 397.94 0 Hand over for cut off
Langelihle Primary School 7000447 4 712.76 4 712.76 0 0 0 0 0 Account payable on the 7th August 2018
Sakhisizwe L.P. School 7000541 14 776.45 4 509.20 10 267.25 0 0 0 0 Account payable on the 7th August 2018
Vukanini H.P. School 7005654 146 666.40 2 668.47 52 568.87 8 888.95 4 123.58 78 416.53 0 Hand over for cut off
Imbekezele L.P. School 7005656 24 237.22 2 231.53 14 816.24 7113.36 76.09 0 0 Hand over for cut off
Thandanani School 7005672 3 626.14 3 626.14 0 0 0 0 0 Account payable on the 7th August 2018
Emzinoni High School 7007396 567 018.78 7 849.01 12 309.35 33 881.35 23 587.31 489 391.76 0 Hand over for cut off
Ikhethelo High School 7100226 216 693.65 2 153.80 17 543.27 12 224.23 30 007.80 154 764.55 0 Hand over for cut off
Chief Ampie Mayisa Sec
School
8500237 9 811.45 1 529.57 1 371.08 2 931.15 2031.94 1 731.43 216.28 Hand over for cut off
Petrus Maziya Primary
School
8501160 0 0 0 0 0 0 Paid to date
Vukuqhakaze Sec School 8503838 7 341.59 750.05 477.72 294.33 2 980.33 2835.16 179.99 Hand over for cut off
Sidingulwazi Primary
School
8504495 355.70 355.70 0 0 0 0 Account payable on the 7th August 2018
Mpumelelo Primary School 8508998 58 409.66 3 649.97 10 531.41 4 827.94 9 098.51 30301.83 0 Hand over for cut off
Kinross Laerskool 9001100 0 0 0 0 0 0 0 Paid to date
Kinross Laerskool 9001114 106.39 106.39 0 0 0 0 379.13 Account due on the 7th July 2018
Ethokomala School 9001134 0 0 0 0 0 0 Paid to date
Fernandi Meisies Koshuis 9003012 0 0 0 0 0 0 Paid to date
Liebenhof
9003013
11 650.29 1 481.67 10 168.62 0 0 0 Hand over for cut off
Hoerskool Hoogenhout 9002016 108 853.74 62 354.03 46 499.71 0 0 200615.6 Account due on the 7th July 2018
TOTAL 2 933 457.95 1 151 496.33 414 674.28 134 888.03 104 068.46 1 128 330.17 12 434.95
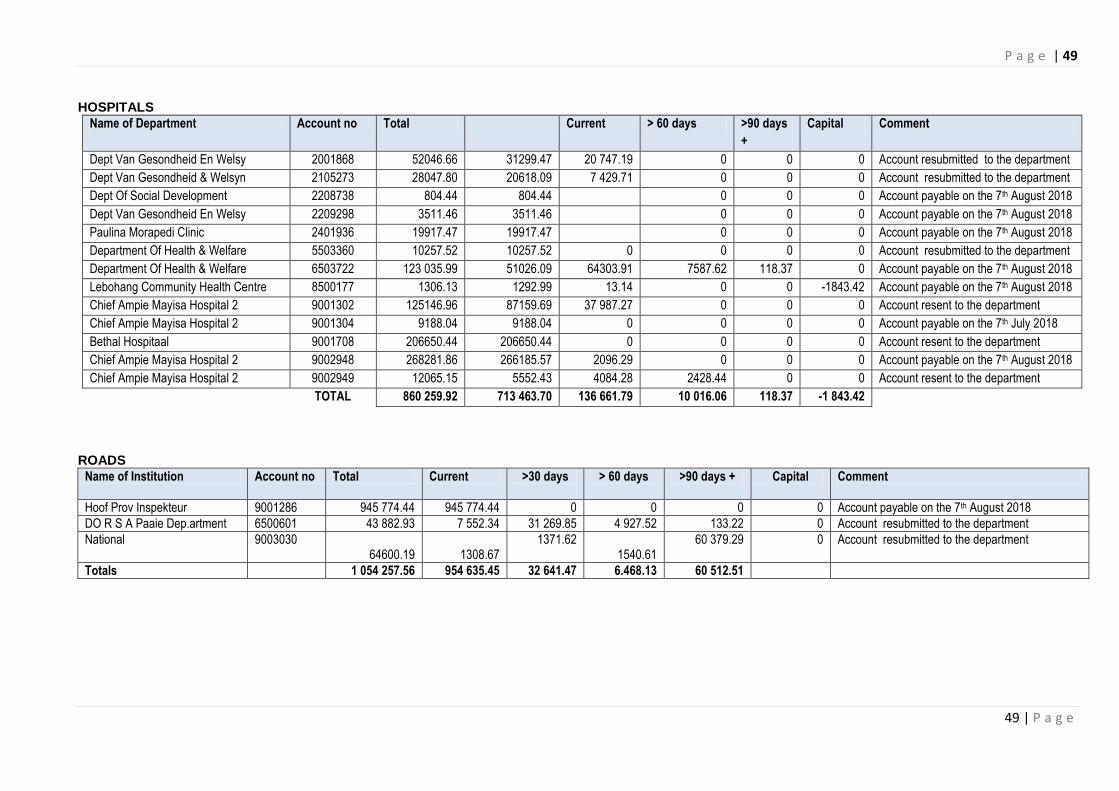
P a g e | 49
49 | P a g e
HOSPITALS
ROADS
Name of Institution Account no Total Current >30 days
> 60 days >90 days + Capital Comment
Hoof Prov Inspekteur 9001286 945 774.44 945 774.44 0 0 0 0 Account payable on the 7th August 2018
DO R S A Paaie Dep.artment 6500601 43 882.93 7 552.34 31 269.85 4 927.52 133.22 0 Account resubmitted to the department
National 9003030 64600.19
1308.67
1371.62 1540.61
60 379.29 0 Account resubmitted to the department
Totals 1 054 257.56 954 635.45 32 641.47 6.468.13 60 512.51
Name of Department Account no Total Current > 60 days >90 days
+
Capital Comment
Dept Van Gesondheid En Welsy 2001868 52046.66 31299.47 20 747.19 0 0 0 Account resubmitted to the department
Dept Van Gesondheid & Welsyn 2105273 28047.80 20618.09 7 429.71 0 0 0 Account resubmitted to the department
Dept Of Social Development 2208738 804.44 804.44 0 0 0 Account payable on the 7th August 2018
Dept Van Gesondheid En Welsy 2209298 3511.46 3511.46 0 0 0 Account payable on the 7th August 2018
Paulina Morapedi Clinic 2401936 19917.47 19917.47 0 0 0 Account payable on the 7th August 2018
Department Of Health & Welfare 5503360 10257.52 10257.52 0 0 0 0 Account resubmitted to the department
Department Of Health & Welfare 6503722 123 035.99 51026.09 64303.91 7587.62 118.37 0 Account payable on the 7th August 2018
Lebohang Community Health Centre 8500177 1306.13 1292.99 13.14 0 0 -1843.42 Account payable on the 7th August 2018
Chief Ampie Mayisa Hospital 2 9001302 125146.96 87159.69 37 987.27 0 0 0 Account resent to the department
Chief Ampie Mayisa Hospital 2 9001304 9188.04 9188.04 0 0 0 0 Account payable on the 7th July 2018
Bethal Hospitaal 9001708 206650.44 206650.44 0 0 0 0 Account resent to the department
Chief Ampie Mayisa Hospital 2 9002948 268281.86 266185.57 2096.29 0 0 0 Account payable on the 7th August 2018
Chief Ampie Mayisa Hospital 2 9002949 12065.15 5552.43 4084.28 2428.44 0 0 Account resent to the department
TOTAL 860 259.92 713 463.70 136 661.79 10 016.06 118.37 -1 843.42
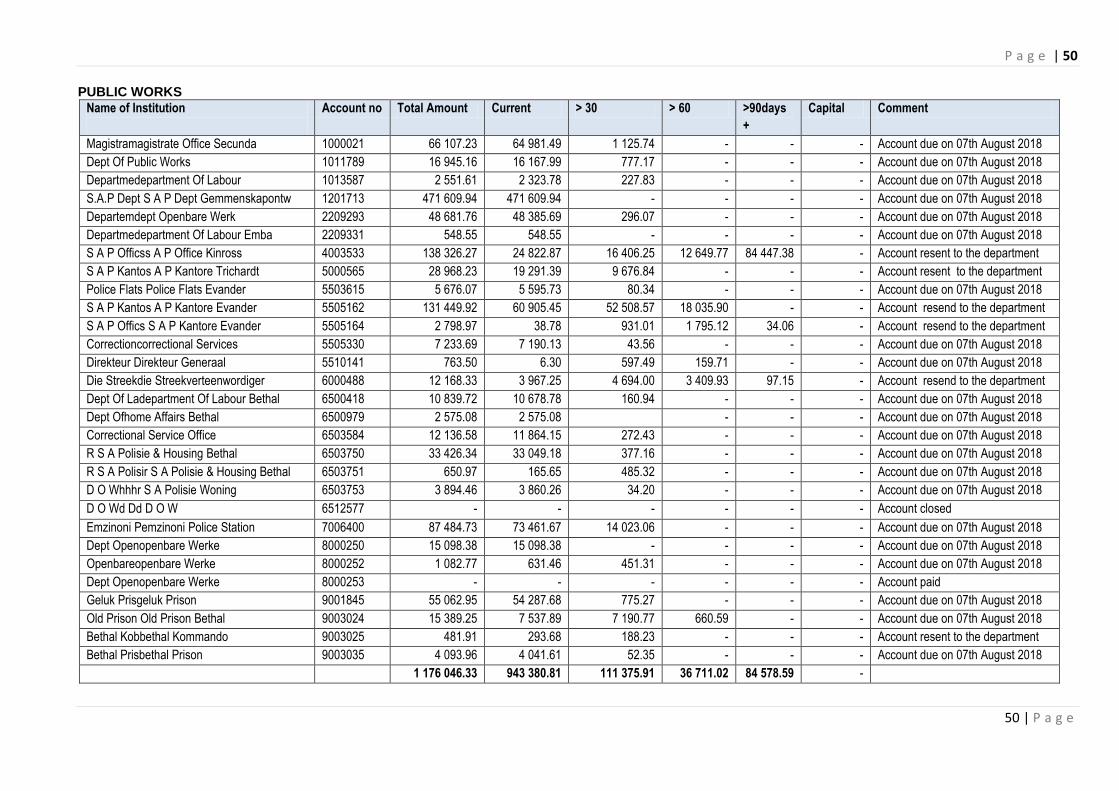
P a g e | 50
50 | P a g e
PUBLIC WORKS
Name of Institution
Account no Total Amount Current > 30 > 60 >90days
+
Capital Comment
Magistramagistrate Office Secunda 1000021 66 107.23 64 981.49 1 125.74 - - - Account due on 07th August 2018
Dept Of Public Works 1011789 16 945.16 16 167.99 777.17 - - - Account due on 07th August 2018
Departmedepartment Of Labour 1013587 2 551.61 2 323.78 227.83 - - - Account due on 07th August 2018
S.A.P Dept S A P Dept Gemmenskapontw 1201713 471 609.94 471 609.94 - - - - Account due on 07th August 2018
Departemdept Openbare Werk 2209293 48 681.76 48 385.69 296.07 - - - Account due on 07th August 2018
Departmedepartment Of Labour Emba 2209331 548.55 548.55 - - - - Account due on 07th August 2018
S A P Officss A P Office Kinross 4003533 138 326.27 24 822.87 16 406.25 12 649.77 84 447.38 - Account resent to the department
S A P Kantos A P Kantore Trichardt 5000565 28 968.23 19 291.39 9 676.84 - - - Account resent to the department
Police Flats Police Flats Evander 5503615 5 676.07 5 595.73 80.34 - - - Account due on 07th August 2018
S A P Kantos A P Kantore Evander 5505162 131 449.92 60 905.45 52 508.57 18 035.90 - - Account resend to the department
S A P Offics S A P Kantore Evander 5505164 2 798.97 38.78 931.01 1 795.12 34.06 - Account resend to the department
Correctioncorrectional Services 5505330 7 233.69 7 190.13 43.56 - - - Account due on 07th August 2018
Direkteur Direkteur Generaal 5510141 763.50 6.30 597.49 159.71 - - Account due on 07th August 2018
Die Streekdie Streekverteenwordiger 6000488 12 168.33 3 967.25 4 694.00 3 409.93 97.15 - Account resend to the department
Dept Of Ladepartment Of Labour Bethal 6500418 10 839.72 10 678.78 160.94 - - - Account due on 07th August 2018
Dept Ofhome Affairs Bethal 6500979 2 575.08 2 575.08 - - - Account due on 07th August 2018
Correctional Service Office 6503584 12 136.58 11 864.15 272.43 - - - Account due on 07th August 2018
R S A Polisie & Housing Bethal 6503750 33 426.34 33 049.18 377.16 - - - Account due on 07th August 2018
R S A Polisir S A Polisie & Housing Bethal 6503751 650.97 165.65 485.32 - - - Account due on 07th August 2018
D O Whhhr S A Polisie Woning 6503753 3 894.46 3 860.26 34.20 - - - Account due on 07th August 2018
D O Wd Dd D O W 6512577 - - - - - - Account closed
Emzinoni Pemzinoni Police Station 7006400 87 484.73 73 461.67 14 023.06 - - - Account due on 07th August 2018
Dept Openopenbare Werke 8000250 15 098.38 15 098.38 - - - - Account due on 07th August 2018
Openbareopenbare Werke 8000252 1 082.77 631.46 451.31 - - - Account due on 07th August 2018
Dept Openopenbare Werke 8000253 - - - - - - Account paid
Geluk Prisgeluk Prison 9001845 55 062.95 54 287.68 775.27 - - - Account due on 07th August 2018
Old Prison Old Prison Bethal 9003024 15 389.25 7 537.89 7 190.77 660.59 - - Account due on 07th August 2018
Bethal Kobbethal Kommando 9003025 481.91 293.68 188.23 - - - Account resent to the department
Bethal Prisbethal Prison 9003035 4 093.96 4 041.61 52.35 - - - Account due on 07th August 2018
1 176 046.33 943 380.81 111 375.91 36 711.02 84 578.59 -
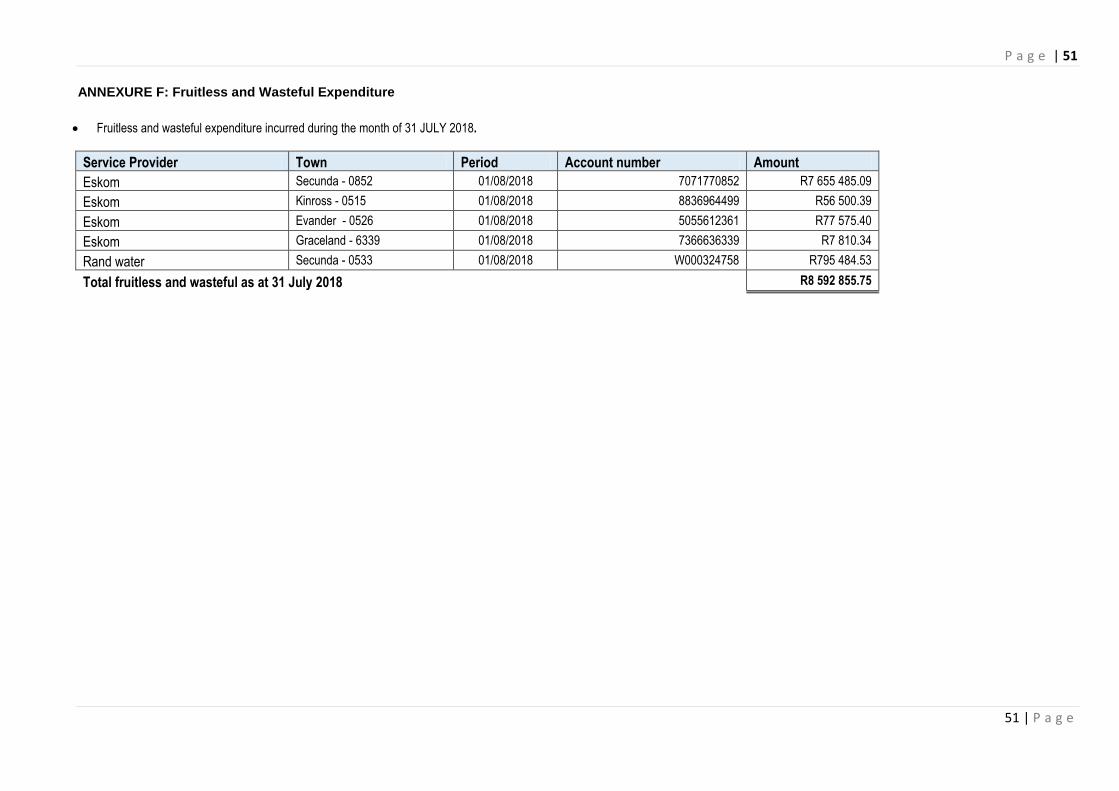
P a g e | 51
51 | P a g e
ANNEXURE F: Fruitless and Wasteful Expenditure
Fruitless and wasteful expenditure incurred during the month of 31 JULY 2018.
Service Provider Town Period Account number Amount
Eskom Secunda - 0852 01/08/2018 7071770852 R7 655 485.09
Eskom Kinross - 0515 01/08/2018 8836964499 R56 500.39
Eskom Evander - 0526 01/08/2018 5055612361 R77 575.40
Eskom Graceland - 6339 01/08/2018 7366636339 R7 810.34
Rand water Secunda - 0533 01/08/2018 W000324758 R795 484.53
Total fruitless and wasteful as at 31 July 2018 R8 592 855.75