Embed Size (px)
Citation preview

GREATER ST. LOUIS
EMPLOYMENT SUMMARY
March 2016 Preliminary Data
Prepared April 27, 2016

Unemployment Rate | PEOPLE Seasonally adjusted
March 2016 February 2016 January 2016
St. Louis MSA 4.7% 4.7% 4.7
Illinois 6.5% 6.4% 6.3%
Missouri 4.2% 4.2% 4.2%
United States 5.0% 4.9% 4.9%
Payroll Employment | JOBS Seasonally adjusted
March 2016 Job Change
Over the Month Percent Change Over the Month
St. Louis MSA 1,355,300 -4,800 -0.4%
Illinois 6,009,000 14,700 0.2%
Missouri 2,798,300 -1,500 -0.1%
United States 143,774,000 215,000 0.1%
OVERVIEW
Monthly Employment Summary | page 2
Source: U.S. Bureau of Labor Statistics1
Source: U.S. Bureau of Labor Statistics2
The St. Louis Region’s adjusted unemployment rate continues to track very closely to the nation. The nation’s seasonally adjusted unemployment rate was 5.0% in March, just above 4.9% posted in February. The region’s seasonally adjusted unemployment rate, holding steady at 4.7% since January, remains just below the nation. Nationally, the preliminary seasonally adjusted nonfarm employment numbers for March saw the addition of 215,000 jobs or a 0.1% increase. The region’s seasonally adjusted payroll employment fell by 4,800 jobs for an over-the-month loss of 0.4%. The region’s not-seasonally adjusted payroll employment data series points to continued job growth. Over-the-year unadjusted job data from March 2015 to March 2016 shows that total employment in the region rose by 22,800 or a 1.7% growth rate. At the same time employment grew by 2.0% nationally (See page 9). This summary is available on the Economic Overview page of the St. Louis Regional Chamber website. http://www.stlregionalchamber.com/regional-data/economy. The next summary will be available June 1, 2016. Please note that the preliminary data presented in this summary is subject to change. This month, the regional unemployment data is provisional and subject to change. One month’s data does not necessarily indicate a trend (See page 8). Please refer to the page 4 to see long term unemployment trends and page 7 to look at nonfarm employment trends since 1990.
ST. LOUIS, MO-IL MSA LABOR FORCE Not seasonally adjusted
MONTHLY ANNUAL AVERAGE
March
2016 (P) March 2015
Percent Change
2015 2014 Percent Change
Total Civilian Labor Force
1,490,985 1,469,120 1.5% 1,481,423 1,457,491 1.6%
Total Employed 1,415,543 1,385,846 2.1% 1,406,552 1,366,121 3.0%
Total Unemployed 75,442 83,274 - 9.4% 74,871 91,370 -18.1%
Unemployment Rate 5.1% 5.7% — 5.1% 6.3% —
UNITED STATES LABOR FORCE Not Seasonally adjusted
Total Civilian Labor Force
158,854,000 156,318,000 1.6% 157,130,000 155,922,000 0.8%
Total Employed 150,738,000 147,635,000 2.1% 148,834,000 146,305,000 1.7%
Total Unemployed 8,116,000 8,683,000 -6.5% 8,296,000 9,617,000 -13.7%
Unemployment Rate 5.1% 5.6% — 5.3% 6.2% —
Source: U.S. Bureau of Labor Statistics4
Labor Force & Unemployment Rates | PEOPLE
Snapshot ST. LOUIS UNEMPLOYMENT
From March 2015 to March 2016, the number of employed persons in the St. Louis region increased by nearly 29,700 while the labor force increased by about 21,900.
Monthly Employment Summary | page 3
MONTHLY ANNUAL AVERAGE
March 2016 (P)
March 2015
Percent Change
2015 2014 Percent Change
Source: U.S. Bureau of Labor Statistics3

U.S. Metros RATE CHANGE
March 2016 unemployment rate compared to March 2015
387 metropolitan areas total
Lower 270 Unchanged 19 Higher 98
JOBLESS RATE Ten areas registered rates of less than 3% Eleven areas registered rates of at least 10%
Source: U.S. Bureau of Labor Statistics5
Source: U.S. Bureau of Labor Statistics6
Note: Monthly data are not seasonally adjusted and March 2016 rates are preliminary
Monthly Employment Summary | page 4
Unemployment Trends | PEOPLE
Snapshot NATIONAL COMPARISON
The region’s unemploy-ment rate continues to track closely with the national unemployment rate.
Unemployment by Peer Markets | PEOPLE
0%
2%
4%
6%
8%
10%
12%2
00
0
200
1
200
2
200
3
200
4
200
5
200
6
200
7
200
8
200
9
201
0
201
1
201
2
201
3
201
4
201
5
201
6
St. Louis MSA U.S.
6.6
%
5.9
%
5.2
%
5.1
%
5.1
%
5.1
%
5.0
%
4.9
%
4.8
%
4.6
%
4.4
%
4.0
%
3.8
%
3.3
%
0%
1%
2%
3%
4%
5%
6%
7%
Chic
ag
o
Pitts
burg
h
Atlanta
Cha
rlott
e
U.S
.
St. L
ou
is
India
nap
olis
Baltim
ore
Cin
cin
nati
Researc
h T
rian
gle
Kan
sas
City
Min
neap
olis
Dallas
Den
ver

Monthly Employment Summary | page 5
Geographic Distribution of Unemployment Rates | PEOPLE
March 2016
Source: U.S. Bureau of Labor Statistics7
Note: Monthly data are not seasonally adjusted and March 2015 rates are preliminary

Monthly Employment Summary | page 6
Civilian Labor Force | PEOPLE
AREA
CURRENT MONTH - March 2016 (P) YEAR AGO - March 2015
Labor Force Employment Unemployment
Labor Force Employment Unemployment
Number Rate Number Rate
United States 158,854,000 150,738,000 8,116,000 5.1% 156,318,000 147,635,000 8,683,000 5.6%
Illinois 6,619,887 6,173,016 446,871 6.8% 6,452,137 6,065,090 387,047 6.0%
Missouri 3,140,914 2,989,791 151,123 4.8% 3,098,397 2,918,435 179,962 5.8%
St. Louis, MO-IL 1,490,985 1,415,543 75,442 5.1% 1,469,120 1,385,846 83,274 5.7%
Missouri Counties
Franklin 53,479 50,847 2,632 4.9% 52,940 49,631 3,309 6.3%
Jefferson 119,379 113,654 5,725 4.8% 118,365 111,196 7,169 6.1%
Lincoln 27,363 25,966 1,397 5.1% 27,123 25,306 1,817 6.7 %
St. Charles 219,433 211,048 8,385 3.8% 216,155 206,094 10,061 4.7%
St. Louis County 543,806 519,796 24,010 4.4% 536,820 508,235 28,585 5.3%
Warren 17,609 16,769 840 4.8% 17,401 16,353 1,048 6.0%
St. Louis City 163,334 154,414 8,920 5.5% 162,146 150,970 11,176 6.9%
Illinois Counties
Bond 8,041 7,518 523 6.5% 7,845 7,416 429 5.5%
Calhoun 2,391 2,211 180 7.5% 2,357 2,184 173 7.3%
Clinton 20,386 19,243 1,143 5.6% 19,913 18,972 941 4.7%
Jersey 11,262 10,485 777 6.9% 11,019 10,338 681 6.2%
Macoupin 23,526 21,818 1,708 7.3% 22,982 21,520 1,462 6.4%
Madison 134,928 125,547 9,381 7.0% 131,255 123,557 7,698 5.9%
Monroe 18,173 17,272 901 5.0% 17,778 17,000 778 4.4%
St. Clair 127,875 118,955 8,920 7.0% 125,021 117,074 7,947 6.4%
Missouri Cities of 25,000 or more
Ballwin 17,441 16,853 588 3.4% 17,154 16,478 676 3.9%
Chesterfield 25,442 24,626 816 3.2% 25,059 24,079 980 3.9%
Florissant 28,985 27,705 1,280 4.4% 28,600 27,089 1,511 5.3%
Hazelwood 14,287 13,557 730 5.1% 14,046 13,255 791 5.6%
Kirkwood 16,156 15,641 515 3.2% 15,909 15,293 616 3.9%
Maryland Hgts. 16,670 16,027 643 3.9% 16,442 15,670 772 4.7%
O'Fallon 48,245 46,654 1,591 3.3% 47,391 45,559 1,832 3.9%
St. Charles 38,721 37,175 1,546 4.0% 38,159 36,302 1,857 4.9%
St. Louis 163,334 154,414 8,920 5.5% 162,146 150,970 11,176 6.9%
St. Peters 34,168 32,991 1,177 3.4% 33,725 32,217 1,508 4.5%
University City 19,357 18,561 796 4.1% 19,119 18,148 971 5.1%
Wentzville 18,689 18,103 586 3.1% 18,350 17,678 672 3.7%
Wildwood 19,513 18,872 641 3.3% 19,203 18,452 751 3.9%
Illinois Cities of 25,000 or more
Alton 11,688 10,752 936 8.0% 11,554 10,582 972 8.4%
Belleville 22,619 21,039 1,580 7.0% 22,058 20,707 1,351 6.1%
Collinsville 13,048 12,141 907 7.0% 12,687 11,949 738 5.8%
East St. Louis 9,033 8,056 977 10.8% 8,850 7,928 922 10.4%
Granite City 13,780 12,372 1,408 10.2% 13,067 12,176 891 6.8%
O'Fallon 13,789 12,990 799 5.8% 13,517 12,784 733 5.4%
Source: U.S. Bureau of Labor Statistics8
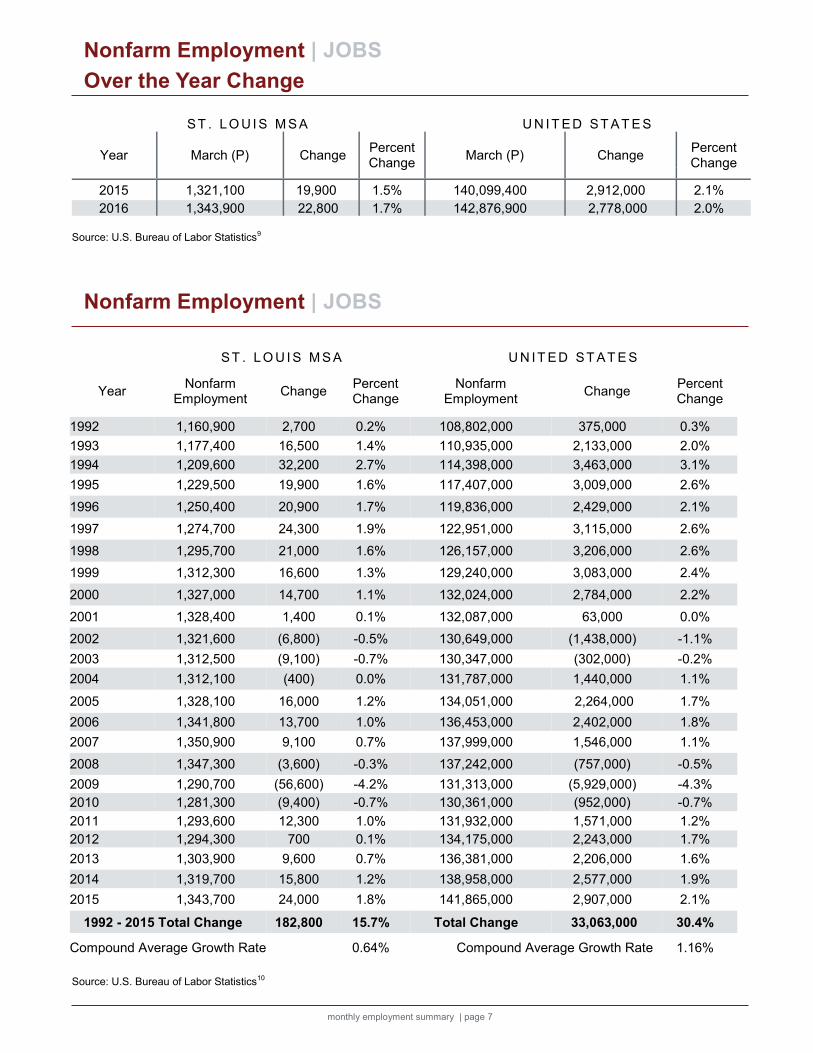
ST . L O U I S M S A U N I T ED ST AT E S
Year Nonfarm
Employment Change
Percent Change
Nonfarm Employment
Change Percent Change
1992 1,160,900 2,700 0.2% 108,802,000 375,000 0.3%
1993 1,177,400 16,500 1.4% 110,935,000 2,133,000 2.0%
1994 1,209,600 32,200 2.7% 114,398,000 3,463,000 3.1%
1995 1,229,500 19,900 1.6% 117,407,000 3,009,000 2.6%
1996 1,250,400 20,900 1.7% 119,836,000 2,429,000 2.1%
1997 1,274,700 24,300 1.9% 122,951,000 3,115,000 2.6%
1998 1,295,700 21,000 1.6% 126,157,000 3,206,000 2.6%
1999 1,312,300 16,600 1.3% 129,240,000 3,083,000 2.4%
2000 1,327,000 14,700 1.1% 132,024,000 2,784,000 2.2%
2001 1,328,400 1,400 0.1% 132,087,000 63,000 0.0%
2002 1,321,600 (6,800) -0.5% 130,649,000 (1,438,000) -1.1%
2003 1,312,500 (9,100) -0.7% 130,347,000 (302,000) -0.2%
2004 1,312,100 (400) 0.0% 131,787,000 1,440,000 1.1%
2005 1,328,100 16,000 1.2% 134,051,000 2,264,000 1.7%
2006 1,341,800 13,700 1.0% 136,453,000 2,402,000 1.8%
2007 1,350,900 9,100 0.7% 137,999,000 1,546,000 1.1%
2008 1,347,300 (3,600) -0.3% 137,242,000 (757,000) -0.5%
2009 1,290,700 (56,600) -4.2% 131,313,000 (5,929,000) -4.3%
2010 1,281,300 (9,400) -0.7% 130,361,000 (952,000) -0.7%
2011 1,293,600 12,300 1.0% 131,932,000 1,571,000 1.2%
2012 1,294,300 700 0.1% 134,175,000 2,243,000 1.7%
2013 1,303,900 9,600 0.7% 136,381,000 2,206,000 1.6%
2014 1,319,700 15,800 1.2% 138,958,000 2,577,000 1.9%
2015 1,343,700 24,000 1.8% 141,865,000 2,907,000 2.1%
1992 - 2015 Total Change 182,800 15.7% Total Change 33,063,000 30.4%
Compound Average Growth Rate 0.64% Compound Average Growth Rate 1.16%
monthly employment summary | page 7
Over the Year Change
Nonfarm Employment | JOBS
ST . L O U I S M S A U N I T ED ST AT E S
Year March (P) Change Percent Change
March (P) Change Percent Change
2015 1,321,100 19,900 1.5% 140,099,400 2,912,000 2.1%
2016 1,343,900 22,800 1.7% 142,876,900 2,778,000 2.0% Source: U.S. Bureau of Labor Statistics9
Nonfarm Employment | JOBS
Source: U.S. Bureau of Labor Statistics10
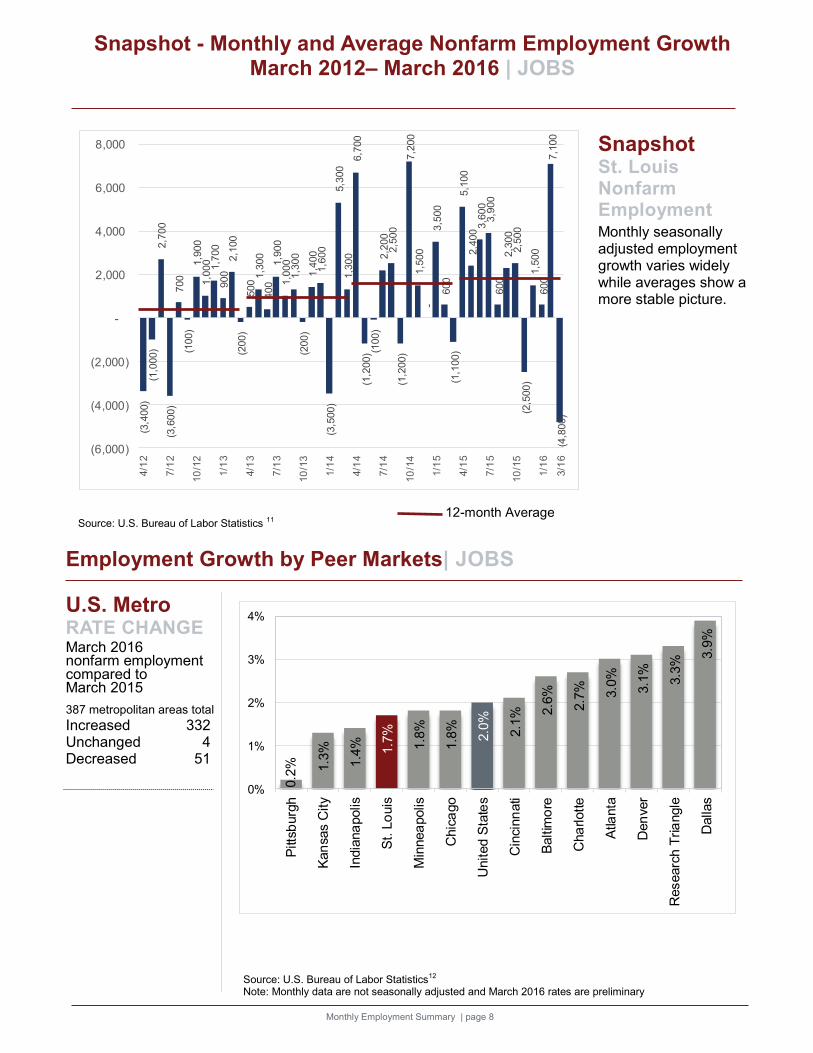
U.S. Metro RATE CHANGE
March 2016 nonfarm employment compared to March 2015
387 metropolitan areas total
Increased 332 Unchanged 4 Decreased 51
Monthly Employment Summary | page 8
Employment Growth by Peer Markets| JOBS
Source: U.S. Bureau of Labor Statistics 11
Source: U.S. Bureau of Labor Statistics12
Note: Monthly data are not seasonally adjusted and March 2016 rates are preliminary
0.2
% 1.3
%
1.4
% 1.7
%
1.8
%
1.8
%
2.0
%
2.1
% 2.6
%
2.7
% 3.0
%
3.1
%
3.3
%
3.9
%
0%
1%
2%
3%
4%
Pitts
burg
h
Kan
sas C
ity
India
na
polis
St. L
ouis
Min
nea
polis
Chic
ago
United S
tate
s
Cin
cin
nati
Baltim
ore
Cha
rlotte
Atla
nta
Den
ver
Researc
h T
ria
ngle
Dallas
Snapshot - Monthly and Average Nonfarm Employment Growth March 2012– March 2016 | JOBS
Snapshot St. Louis Nonfarm Employment
Monthly seasonally adjusted employment growth varies widely while averages show a more stable picture.
(3,4
00)
(1,0
00)
2,7
00
(3,6
00)
700
(100)
1,9
00
1,0
00
1,7
00
900
2,1
00
(200)
500 1
,300
400
1,9
00
1,0
00
1,3
00
(200)
1,4
00
1,6
00
(3,5
00)
5,3
00
1,3
00
6,7
00
(1,2
00) (1
00)
2,2
00
2,5
00
(1,2
00)
7,2
00
1,5
00
-3,5
00
600
(1,1
00)
5,1
00
2,4
00 3
,600
3,9
00
600
2,3
00
2,5
00
(2,5
00)
1,5
00
600
7,1
00
(4,8
00)
(6,000)
(4,000)
(2,000)
-
2,000
4,000
6,000
8,0004/1
2
7/1
2
10
/12
1/1
3
4/1
3
7/1
3
10
/13
1/1
4
4/1
4
7/1
4
10
/14
1/1
5
4/1
5
7/1
5
10
/15
1/1
6
3/1
6
12-month Average
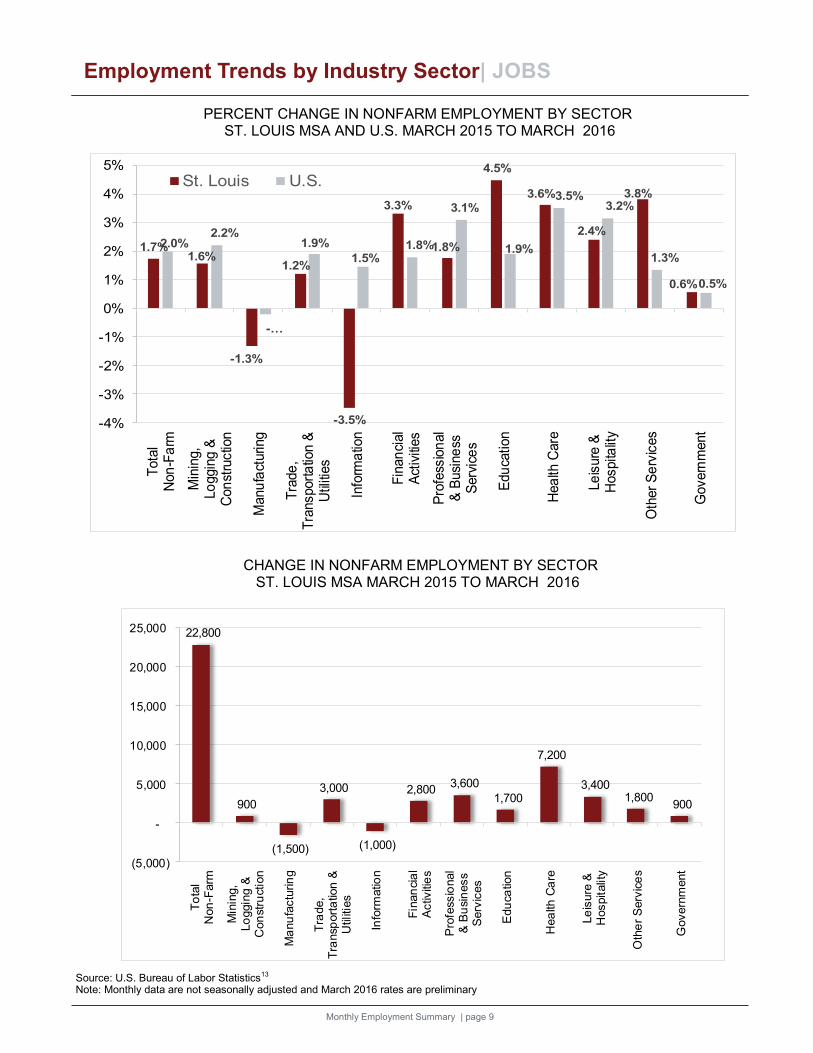
Employment Trends by Industry Sector| JOBS
PERCENT CHANGE IN NONFARM EMPLOYMENT BY SECTOR ST. LOUIS MSA AND U.S. MARCH 2015 TO MARCH 2016
Source: U.S. Bureau of Labor Statistics13 Note: Monthly data are not seasonally adjusted and March 2016 rates are preliminary
CHANGE IN NONFARM EMPLOYMENT BY SECTOR ST. LOUIS MSA MARCH 2015 TO MARCH 2016
Monthly Employment Summary | page 9
1.7%1.6%
-1.3%
1.2%
-3.5%
3.3%
1.8%
4.5%
3.6%
2.4%
3.8%
0.6%
2.0%2.2%
-…
1.9%
1.5%1.8%
3.1%
1.9%
3.5%3.2%
1.3%
0.5%
-4%
-3%
-2%
-1%
0%
1%
2%
3%
4%
5%T
ota
lN
on
-Fa
rm
Min
ing,
Lo
ggin
g &
Con
stru
ctio
n
Manu
fact
uring
Tra
de
,T
ransport
atio
n &
Util
ities
Info
rma
tion
Fin
an
cial
Act
iviti
es
Pro
fess
ion
al
& B
usi
ne
ssS
erv
ice
s
Edu
cation
Hea
lth C
are
Le
isure
&H
ospita
lity
Oth
er
Se
rvic
es
Govern
ment
St. Louis U.S.
22,800
900
(1,500)
3,000
(1,000)
2,800 3,600
1,700
7,200
3,400 1,800
900
(5,000)
-
5,000
10,000
15,000
20,000
25,000
To
tal
Non
-Farm
Min
ing,
Lo
ggin
g &
Con
str
uction
Ma
nu
factu
rin
g
Tra
de,
Tra
nsp
ort
atio
n &
Utilities
Info
rmatio
n
Fin
an
cia
lA
ctiv
itie
s
Pro
fess
ional
& B
usi
ness
Serv
ices
Edu
cation
Hea
lth C
are
Le
isure
&H
ospitalit
y
Oth
er
Serv
ice
s
Govern
ment
Forecast Month
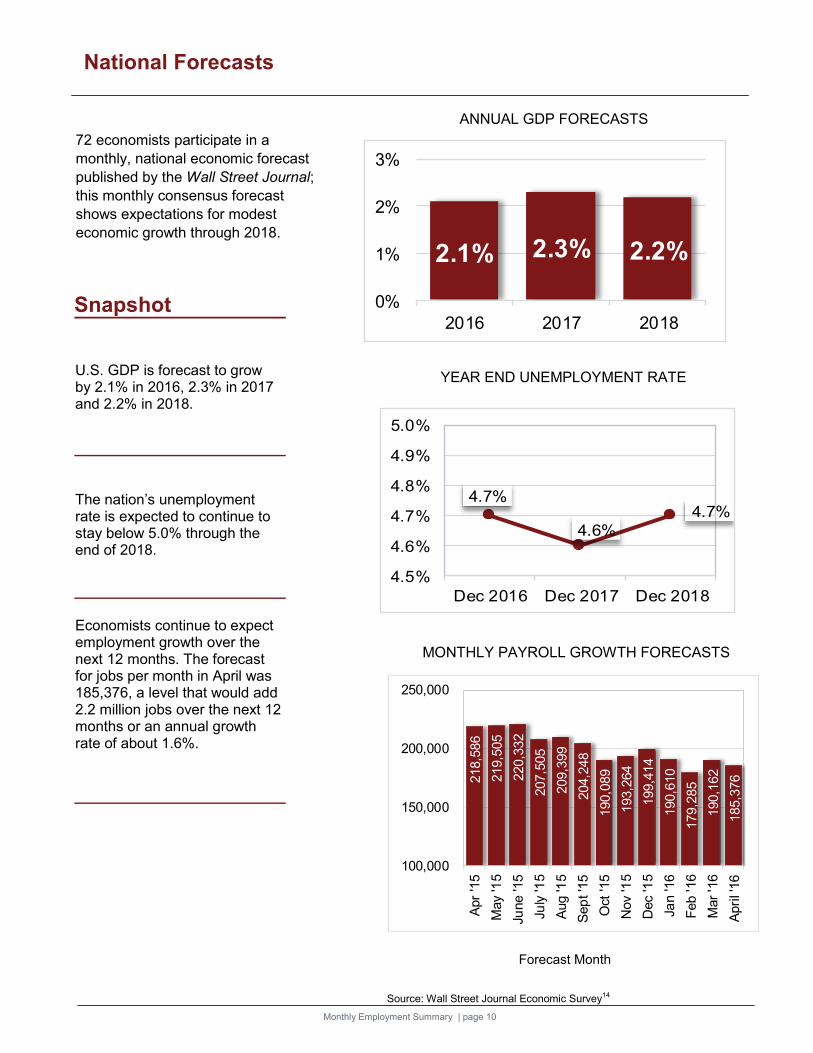
72 economists participate in a
monthly, national economic forecast
published by the Wall Street Journal;
this monthly consensus forecast
shows expectations for modest
economic growth through 2018.
Source: Wall Street Journal Economic Survey14
Snapshot U.S. GDP is forecast to grow by 2.1% in 2016, 2.3% in 2017 and 2.2% in 2018.
The nation’s unemployment rate is expected to continue to stay below 5.0% through the end of 2018.
Economists continue to expect employment growth over the next 12 months. The forecast for jobs per month in April was 185,376, a level that would add 2.2 million jobs over the next 12 months or an annual growth rate of about 1.6%.
YEAR END UNEMPLOYMENT RATE
MONTHLY PAYROLL GROWTH FORECASTS
National Forecasts
ANNUAL GDP FORECASTS
Monthly Employment Summary | page 10
2.1% 2.3% 2.2%
0%
1%
2%
3%
2016 2017 2018
4.7%
4.6%
4.7%
4.5%
4.6%
4.7%
4.8%
4.9%
5.0%
Dec 2016 Dec 2017 Dec 2018
218,5
86
219,5
05
220,3
32
207,5
05
209,3
99
204,2
48
190,0
89
193,2
64
199,4
14
190,6
10
179,2
85
190,1
62
185,3
76
100,000
150,000
200,000
250,000
Apr
'15
May '1
5
Ju
ne '15
Ju
ly '1
5
Aug
'15
Sep
t '1
5
Oct
'15
Nov '1
5
Dec '1
5
Ja
n '16
Feb
'16
Mar
'16
Apri
l '1
6
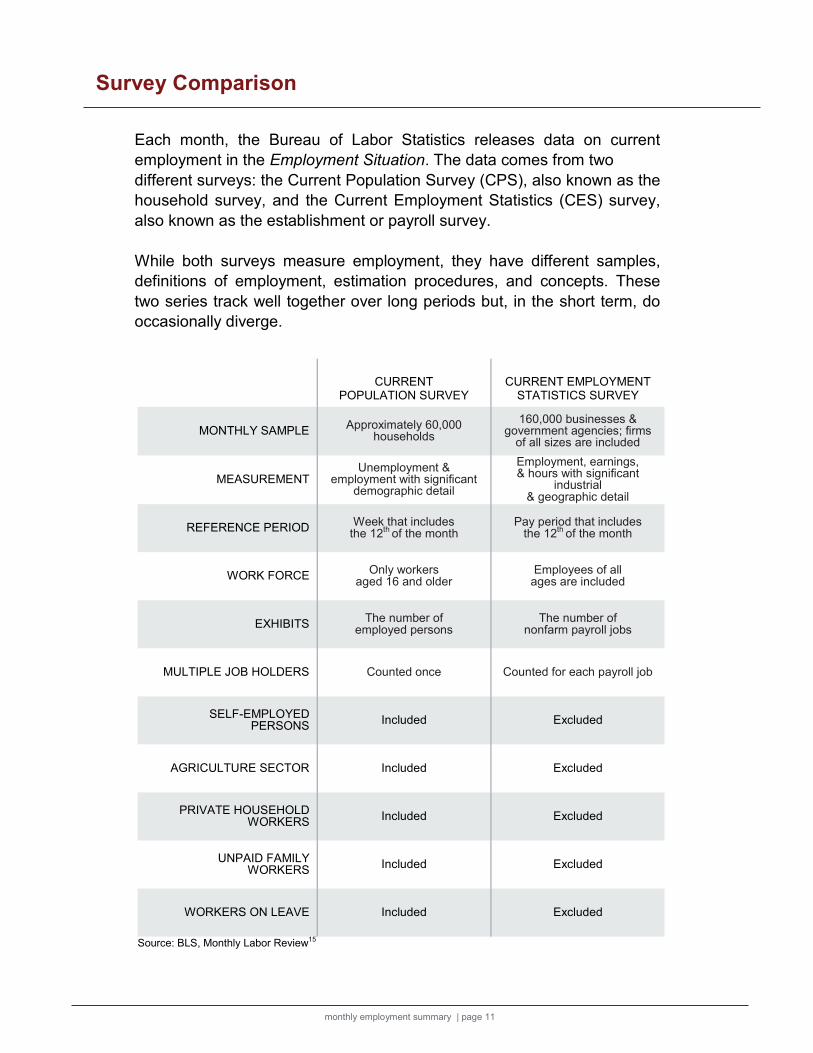
Each month, the Bureau of Labor Statistics releases data on current
employment in the Employment Situation. The data comes from two
different surveys: the Current Population Survey (CPS), also known as the
household survey, and the Current Employment Statistics (CES) survey,
also known as the establishment or payroll survey.
While both surveys measure employment, they have different samples,
definitions of employment, estimation procedures, and concepts. These
two series track well together over long periods but, in the short term, do
occasionally diverge.
CURRENT POPULATION SURVEY
CURRENT EMPLOYMENT STATISTICS SURVEY
MONTHLY SAMPLE Approximately 60,000
households
160,000 businesses & government agencies; firms
of all sizes are included
MEASUREMENT Unemployment &
employment with significant demographic detail
Employment, earnings, & hours with significant
industrial & geographic detail
REFERENCE PERIOD Week that includes
the 12th of the month Pay period that includes
the 12th of the month
WORK FORCE Only workers
aged 16 and older Employees of all
ages are included
EXHIBITS The number of
employed persons The number of
nonfarm payroll jobs
MULTIPLE JOB HOLDERS Counted once Counted for each payroll job
SELF-EMPLOYED PERSONS
Included Excluded
AGRICULTURE SECTOR Included Excluded
PRIVATE HOUSEHOLD WORKERS
Included Excluded
UNPAID FAMILY WORKERS
Included Excluded
WORKERS ON LEAVE Included Excluded
Source: BLS, Monthly Labor Review15
monthly employment summary | page 11
Survey Comparison

Source: Minnesota Department of Employment and Economic Development16
Monthly Employment Summary | page 12
Current Employment Statistics Survey
Local Area Unemployment Statistics Survey
DESCRIPTION DATA SOURCE DEFINITION PROVISIONS
Monthly survey of nonfarm business establishments for the estimation of industry employment, hours & earnings, for the 50 states & 250 metropolitan statistical areas surveyed. The program is a federal-state cooperative program between the U.S. Bureau of Labor Statis-tics & State agencies. The nation-al sample Consists of 400,000 businesses & is the largest survey of its kind. Employed: the count of jobs by place of work rather than of em-ployed persons Industry employment time series
Total number of non-supervisory/production workers
One of the earliest monthly economic indicators released by the government; usually causes immediate reaction in the stock and bond market Average weekly hours earnings View of the nation’s economic health through employment num-bers; earnings trends and wage push inflation through average hourly earnings; and short term fluctuations in demand through average weekly hours of work
Monthly estimates of labor force, employment, and unemployment for state and local areas. The local unemployment estimates are the basis for determining area eligibility for benefits under the Workforce Invest Act & other federal programs.
Cooperative effort between the U.S. Bureau of Labor Statistics & State agencies. Models use both current & historical data from the Current Population Survey, Current Employment Statistics program, & Unemployment Insurance statistics program to provide estimates of employment & unemployment. Persons age 16 or older who, in the survey week, worked for pay or profit, or worked unpaid in a family operated business, or were temporarily absent from their regular jobs. Labor force, employment and unemployment rates Comparative rates Monthly date from 1990 to present Insight into state and local governments’ planning and budgetary decisions Aids in the determination of need for em-ployment and training services Determination of eligibility for federal pro-grams and formula funding

1
“Local Area Unemployment Statistics (LAUS)” , “Smoothed Seasonally Adjusted Metropolitan Area Esti-mates” and “Labor Force Statistics from the Current Population Survey” U.S. Bureau of Labor Statistics, http://www.bls.gov/lau/home.htm#TABLES, Accessed 4/27/16.
2 “Employment, Hours, and Earnings (CES)” U.S Bureau of Labor Statistics, http://www.bls.gov/data/#employment, Accessed 4/27/16.
3
“Local Area Unemployment Statistics (LAUS)” and “Labor Force Statistics from the Current Population Survey” U.S. Bureau of Labor Statistics, http://www.bls.gov/data/#unemployment, Accessed 4/27/16. “Local Area Unemployment Statistics (LAUS) Missouri Economic Research and Information Center, http://www.missourieconomy.org/indicators/laus/default.aspx, Accessed 4/27/16.
4 “Local Area Unemployment Statistics (LAUS)” and “Labor Force Statistics from the Current Population Survey” U.S. Bureau of Labor Statistics, http://www.bls.gov/data/#unemployment, Accessed 4/27/16.
5 “Local Area Unemployment Statistics (LAUS)” and “Labor Force Statistics from the Current Population Survey” U.S. Bureau of Labor Statistics, http://www.bls.gov/data/#unemployment, Accessed 4/27/16.
6 “Metropolitan Area Employment and Unemployment - March 2016” U.S. Bureau of Labor Statistics
http://www.bls.gov/news.release/pdf/metro.pdf, Accessed 4/27/16.
7 “Local Area Unemployment Statistics (LAUS)” and “Labor Force Statistics from the Current Population Survey” U.S. Bureau of Labor Statistics, http://www.bls.gov/data/#unemployment, Accessed 4/27/16.
8 “Local Area Unemployment Statistics (LAUS)” and “Labor Force Statistics from the Current Population Survey” U.S. Bureau of Labor Statistics, http://www.bls.gov/data/#unemployment, Accessed 4/27/16.
9 “Employment, Hours, and Earnings (CES)” U.S Bureau of Labor Statistics, http://data.bls.gov/pdq/querytool.jsp?survey=sm , Accessed 4/27/16.
10 “Employment, Hours, and Earnings (CES)” U.S Bureau of Labor Statistics, http://data.bls.gov/pdq/querytool.jsp?survey=sm , Accessed 4/27/16.
11 “Employment, Hours, and Earnings (CES)” U.S Bureau of Labor Statistics, http://data.bls.gov/pdq/querytool.jsp?survey=sm , Accessed 4/27/16.
12 “Metropolitan Area Employment and Unemployment - March 2016” U.S. Bureau of Labor Statistics
http://www.bls.gov/news.release/pdf/metro.pdf, Accessed 4/27/16.
13 “Employment, Hours, and Earnings (CES)” U.S Bureau of Labor Statistics, http://data.bls.gov/pdq/querytool.jsp?survey=sm , Accessed 4/27/16.
14 “Wall Street Journal Economic Survey: April2016” http://online.wsj.com/public/page/economic-forecasting.html, Accessed 4/27/16.
15 “Understanding the Employment Measures from the CPS and CES Survey” Monthly Labor Review, February 2006, http://www.bls.gov/opub/mlr/2006/02/art2full.pdf, Accessed 5/1/09.
16 Minnesota Department of Employment and Economic Development, http://www.deed.state.mn.us/lmi/Home.htm, Accessed 5/1/09.
Monthly Employment Summary | page 13
Sources

ST. LOUIS REGIONAL CHAMBER O N E M E T R O P O L I T A N S Q U A R E ◦ S U I T E 1 3 0 0 ◦ S T . L O U I S , M O 6 3 1 0 2 ◦ 3 1 4 . 2 3 1 . 5 5 5 5 ◦ W W W . S T L R E G I O N A L C H A M B E R . C O M
THE ST. LOUI S REGIO N AL CHAMBER I S THE CHAMBER OF CO MMERCE AND ECONO MI C DEVELO PMENT ORGANIZATIO N FOR G REATER ST. LOUIS , W HICH INCLUDES 15 COUNTI ES IN MI SSOURI & I LL INOI S.
COMPILED BY
RUTH SERGENIAN
DIRECTOR, ECONOMIC RESEARCH & ANALYSIS
THOMAS WASH ECONOMIC DEVELOPMENT RESEARCH INTERN
PREPARED April 27, 2016
Next release June 1, 2016
NEXT UPDATES • April 2016 data BLS U.S. Level ◦ May 6
BLS State Level ◦ May 20
MO & IL State Labor Market Release ◦ May May 24 and 26
BLS Metro Level ◦ June 1
ST. LOUIS, MO-IL MSA