Embed Size (px)
DESCRIPTION
Monthly highlights no 6 2015
Citation preview
1
ISSN 2314-9671
First sales in Europe:
France: Cuttlefish and seabass The United Kingdom: Scallop and
whiting
Global Supply
Case study: Geographical indications and traditional
specialities in the seafood sector
Consumption: carp and herring
Macroeconomic context
CONTENTS In this issue
January–April 2015 first-sales value is up compared with 2014. By contrast, first-sales volume declined. In the UK, the strong decrease in mackerel first-sales value was responsible for an overall fall in first-sales value, despite increased first-sales value for scallop and haddock. In France, squid and hake drove the increase in first-sales value. Scallop first-sales volume decreased strongly (−32%), leading to a significant rise in first-sales prices (+20%).
As of 4 June 2015, the Russian Federation placed import restrictions on canned fish originating in Estonia and Latvia, expanding the 2014 restrictions on EU fishery products. On 24 June 2015, the Russian Federation announced the extension of the general food embargo on products from the EU, for an additional year.
The number of protected designations of origin (PDOs), protected geographical indications (PGIs) and traditional speciality guaranteed (TSG) registered in the fisheries sector doubled between 2009 and 2015. Forty-one names are now registered, such as “Scottish Farmed Salmon”, “Huîtres Marennes Oléron”, “Mejillón de Galicia” and “Třeboňský Kapr”. In 2010, the sales volume of seafood products with geographical indications was estimated at 111.258 tonnes of which accounted for 1,9% of the wild and farmed seafood produced in the EU.
Product innovation is moving carp from traditional distribution to modern retail chains. Carp is consumed mostly in the home and less often in the food-service sector. Latvian and Lithuanian retail prices of carp are relatively consistent.
Find all data and information and much more on:
www.eumofa.eu
MONTHLY HIGHLIGHTS
No.6/2015
2
MONTHLY HIGHLIGHTS | NO. 6/2015European Market Observatory for Fisheries and Aquaculture Products
1. First sales in Europe
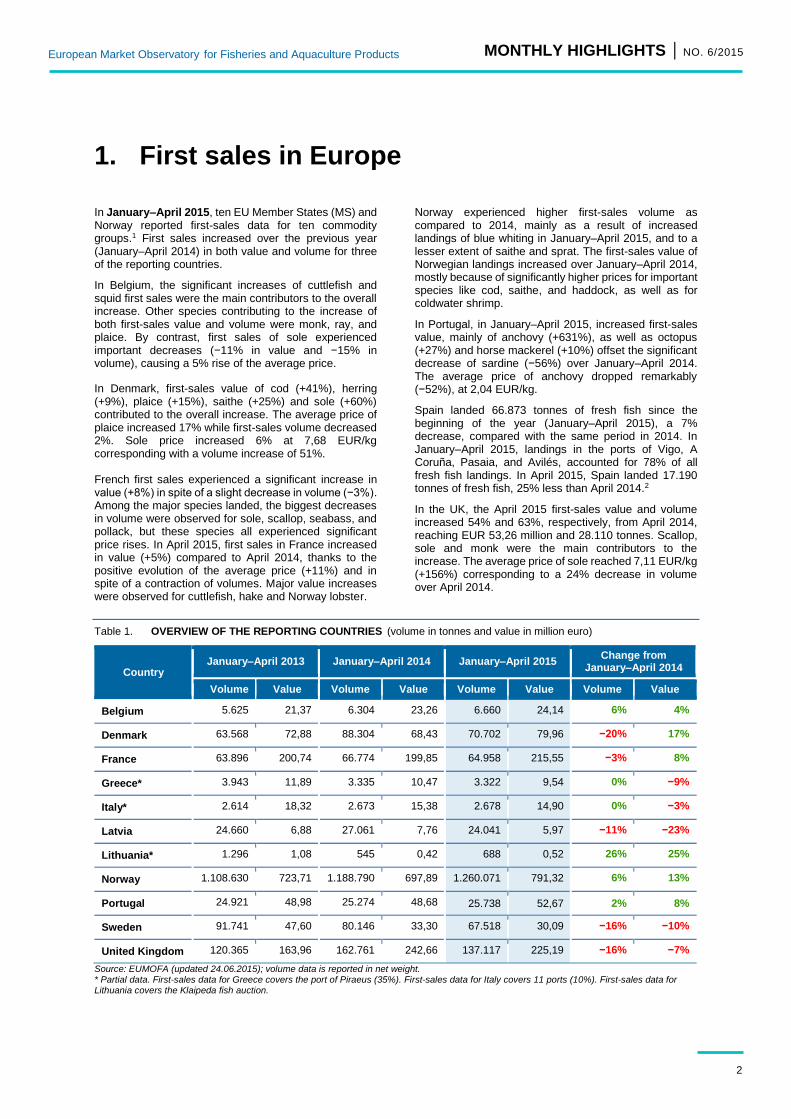
In January–April 2015, ten EU Member States (MS) and Norway reported first-sales data for ten commodity groups.1 First sales increased over the previous year (January–April 2014) in both value and volume for three of the reporting countries.
In Belgium, the significant increases of cuttlefish and squid first sales were the main contributors to the overall increase. Other species contributing to the increase of both first-sales value and volume were monk, ray, and plaice. By contrast, first sales of sole experienced important decreases (−11% in value and −15% in volume), causing a 5% rise of the average price.
In Denmark, first-sales value of cod (+41%), herring (+9%), plaice (+15%), saithe (+25%) and sole (+60%) contributed to the overall increase. The average price of plaice increased 17% while first-sales volume decreased 2%. Sole price increased 6% at 7,68 EUR/kg corresponding with a volume increase of 51%.
French first sales experienced a significant increase in value (+8%) in spite of a slight decrease in volume (−3%). Among the major species landed, the biggest decreases in volume were observed for sole, scallop, seabass, and pollack, but these species all experienced significant price rises. In April 2015, first sales in France increased in value (+5%) compared to April 2014, thanks to the positive evolution of the average price (+11%) and in spite of a contraction of volumes. Major value increases were observed for cuttlefish, hake and Norway lobster.
Norway experienced higher first-sales volume as compared to 2014, mainly as a result of increased landings of blue whiting in January–April 2015, and to a lesser extent of saithe and sprat. The first-sales value of Norwegian landings increased over January–April 2014, mostly because of significantly higher prices for important species like cod, saithe, and haddock, as well as for coldwater shrimp.
In Portugal, in January–April 2015, increased first-sales value, mainly of anchovy (+631%), as well as octopus (+27%) and horse mackerel (+10%) offset the significant decrease of sardine (−56%) over January–April 2014. The average price of anchovy dropped remarkably (−52%), at 2,04 EUR/kg.
Spain landed 66.873 tonnes of fresh fish since the beginning of the year (January–April 2015), a 7% decrease, compared with the same period in 2014. In January–April 2015, landings in the ports of Vigo, A Coruña, Pasaia, and Avilés, accounted for 78% of all fresh fish landings. In April 2015, Spain landed 17.190 tonnes of fresh fish, 25% less than April 2014.2
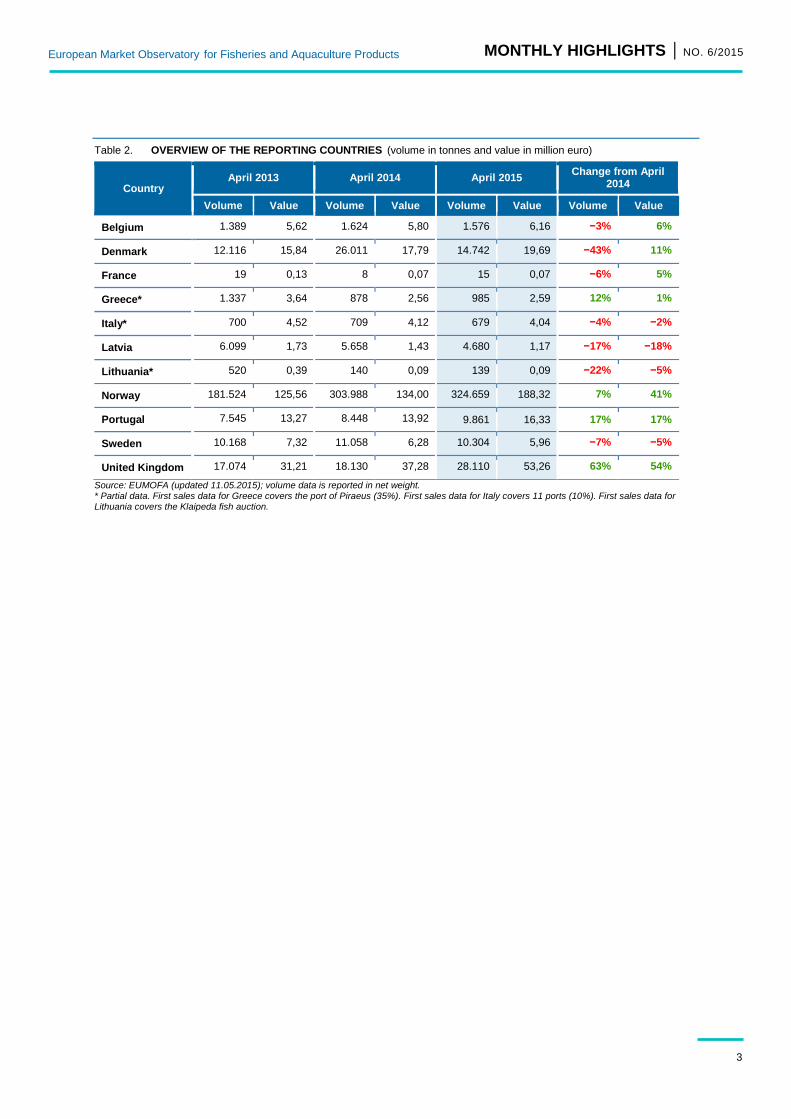
In the UK, the April 2015 first-sales value and volume increased 54% and 63%, respectively, from April 2014, reaching EUR 53,26 million and 28.110 tonnes. Scallop, sole and monk were the main contributors to the increase. The average price of sole reached 7,11 EUR/kg (+156%) corresponding to a 24% decrease in volume over April 2014.
Table 1. OVERVIEW OF THE REPORTING COUNTRIES (volume in tonnes and value in million euro)
Country January–April 2013 January–April 2014 January–April 2015
Change from January–April 2014
Volume Value Volume Value Volume Value Volume Value
Belgium 5.625 21,37 6.304 23,26 6.660 24,14 6% 4%
Denmark 63.568 72,88 88.304 68,43 70.702 79,96 −20% 17%
France 63.896 200,74 66.774 199,85 64.958 215,55 −3% 8%
Greece* 3.943 11,89 3.335 10,47 3.322 9,54 0% −9%
Italy* 2.614 18,32 2.673 15,38 2.678 14,90 0% −3%
Latvia 24.660 6,88 27.061 7,76 24.041 5,97 −11% −23%
Lithuania* 1.296 1,08 545 0,42 688 0,52 26% 25%
Norway 1.108.630 723,71 1.188.790 697,89 1.260.071 791,32 6% 13%
Portugal 24.921 48,98 25.274 48,68 25.738 52,67 2% 8%
Sweden 91.741 47,60 80.146 33,30 67.518 30,09 −16% −10%
United Kingdom 120.365 163,96 162.761 242,66 137.117 225,19 −16% −7%
Source: EUMOFA (updated 24.06.2015); volume data is reported in net weight. * Partial data. First-sales data for Greece covers the port of Piraeus (35%). First-sales data for Italy covers 11 ports (10%). First-sales data for Lithuania covers the Klaipeda fish auction.
MONTHLY HIGHLIGHTS | NO. 6/2015
European Market Observatory for Fisheries and Aquaculture Products
3
Table 2. OVERVIEW OF THE REPORTING COUNTRIES (volume in tonnes and value in million euro)
Country April 2013 April 2014 April 2015
Change from April 2014
Volume Value Volume Value Volume Value Volume Value
Belgium 1.389 5,62 1.624 5,80 1.576 6,16 −3% 6%
Denmark 12.116 15,84 26.011 17,79 14.742 19,69 −43% 11%
France 19 0,13 8 0,07 15 0,07 −6% 5%
Greece* 1.337 3,64 878 2,56 985 2,59 12% 1%
Italy* 700 4,52 709 4,12 679 4,04 −4% −2%
Latvia 6.099 1,73 5.658 1,43 4.680 1,17 −17% −18%
Lithuania* 520 0,39 140 0,09 139 0,09 −22% −5%
Norway 181.524 125,56 303.988 134,00 324.659 188,32 7% 41%
Portugal 7.545 13,27 8.448 13,92 9.861 16,33 17% 17%
Sweden 10.168 7,32 11.058 6,28 10.304 5,96 −7% −5%
United Kingdom 17.074 31,21 18.130 37,28 28.110 53,26 63% 54%
Source: EUMOFA (updated 11.05.2015); volume data is reported in net weight. * Partial data. First sales data for Greece covers the port of Piraeus (35%). First sales data for Italy covers 11 ports (10%). First sales data for Lithuania covers the Klaipeda fish auction.
4
MONTHLY HIGHLIGHTS | NO. 6/2015
European Market Observatory for Fisheries and Aquaculture Products
1.1. FRANCE
French fisheries employ highly diversified fishing techniques and vessels, which allow diversified catches.
The French fishing fleet has about 7.100 vessels, of which more than 4.500 operate in Metropolitan France and 2.600 in the Overseas Territories. Of the vessels fishing in Metropolitan France, 80% are less than 12 m long (netters and trawlers). Out of the Metropolitan fleet, approximately 3.000 vessels operate in the Atlantic, both small-scale vessels and vessels longer than 12 m (mainly trawlers, netters, and dredgers), and 1.500 operate in the Mediterranean, mostly small-scale vessels. The Overseas Territories fleet is composed mainly of small-scale vessels (more than 90%), but also includes vessels longer than 12 m as demersal trawlers, tropical purse-seiners targeting tuna in the South Atlantic and Indian oceans, and vessels using hooks (Reunion).
Most fishing takes place in the North East Atlantic, (81% of total catches of Metropolitan fleets in volume). Then come the Western Indian Ocean and the Eastern-Central Atlantic (both 8%), where tropical tuna fisheries occur. The Mediterranean Sea provides 3% of the catches.
At least 75% in volume of French fishing-fleet catches are landed in France. The remaining are mostly tuna landings in the Indian Ocean (Mauritius, Seychelles) or in Africa. In France, landings occur mainly in the ports of Brittany (47% in volume), in the region of Nord-Pas de Calais (Boulogne), and in Normandy.3
In terms of value, the top five species landed in 2014 were hake, monk, scallop, seabass, and sole. The top three ports in France were Le Guilvinec (with monk as the main species sold), Lorient (monk and Norway lobster), and Boulogne-sur-Mer (squid and sole).
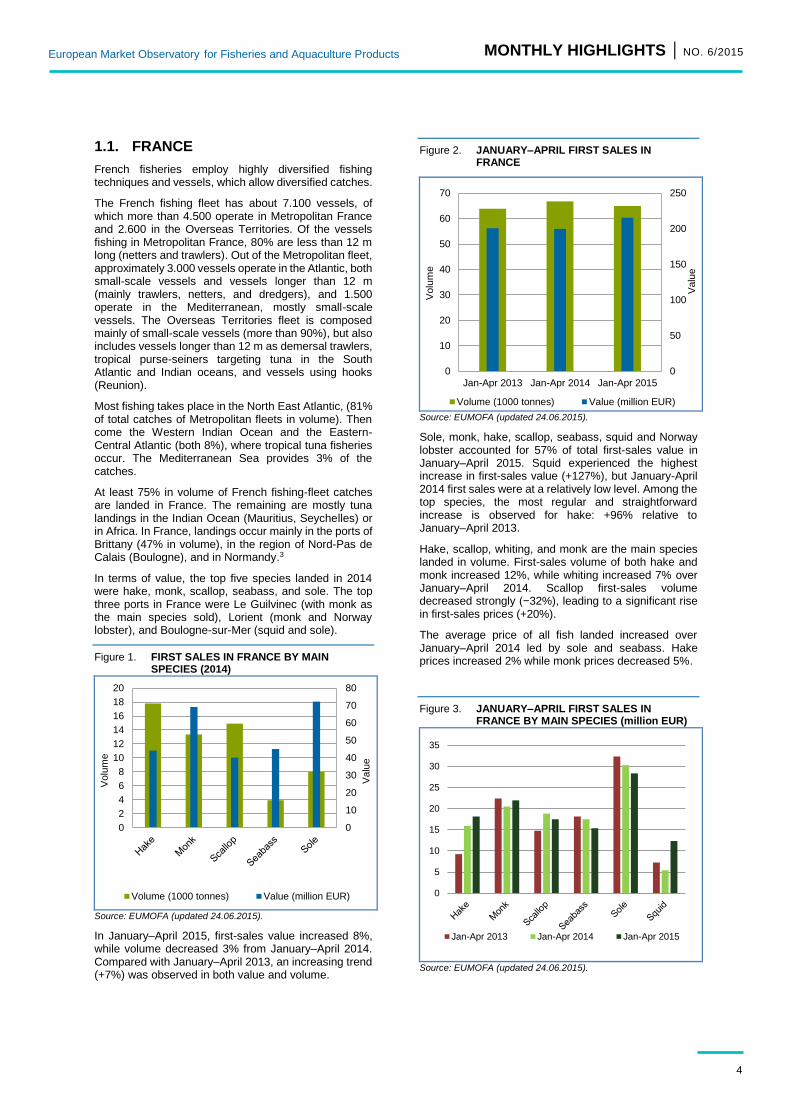
Figure 1. FIRST SALES IN FRANCE BY MAIN SPECIES (2014)
Source: EUMOFA (updated 24.06.2015).
In January–April 2015, first-sales value increased 8%, while volume decreased 3% from January–April 2014. Compared with January–April 2013, an increasing trend (+7%) was observed in both value and volume.
Figure 2. JANUARY–APRIL FIRST SALES IN FRANCE
Source: EUMOFA (updated 24.06.2015).
Sole, monk, hake, scallop, seabass, squid and Norway lobster accounted for 57% of total first-sales value in January–April 2015. Squid experienced the highest increase in first-sales value (+127%), but January-April 2014 first sales were at a relatively low level. Among the top species, the most regular and straightforward increase is observed for hake: +96% relative to January–April 2013.
Hake, scallop, whiting, and monk are the main species landed in volume. First-sales volume of both hake and monk increased 12%, while whiting increased 7% over January–April 2014. Scallop first-sales volume decreased strongly (−32%), leading to a significant rise in first-sales prices (+20%).
The average price of all fish landed increased over January–April 2014 led by sole and seabass. Hake prices increased 2% while monk prices decreased 5%.
Figure 3. JANUARY–APRIL FIRST SALES IN FRANCE BY MAIN SPECIES (million EUR)
Source: EUMOFA (updated 24.06.2015).
0
10
20
30
40
50
60
70
80
0
2
4
6
8
10
12
14
16
18
20
Valu
e
Volu
me
Volume (1000 tonnes) Value (million EUR)
0
50
100
150
200
250
0
10
20
30
40
50
60
70
Jan-Apr 2013 Jan-Apr 2014 Jan-Apr 2015
Valu
e
Volu
me
Volume (1000 tonnes) Value (million EUR)
0
5
10
15
20
25
30
35
Jan-Apr 2013 Jan-Apr 2014 Jan-Apr 2015

5
MONTHLY HIGHLIGHTS | NO. 6/2015
European Market Observatory for Fisheries and Aquaculture Products
1.1.1. CUTTLEFISH
Cuttlefish is distinguished from other cephalopods by the presence of ten tentacles, including two longer ones. The common cuttlefish (Sepia officinalis)
changes its colour according to the environment. It can go from light grey to brown with darker stripes. Cuttlefish is a predator, feeding on shrimp, crustaceans and small fish. While it can grow up to 35 cm long, its most common size is 18–20 cm. Cuttlefish grows very fast and has a short life (approximately two years).
Cuttlefish is fished with trawlnet, trap and line, in temperate and warm waters. The top three ports for cuttlefish landings in 2014 were Les Sables-d'Olonne, La Cotinière (Saint-Pierre-d'Oléron), and La Turballe.
France exports a large part of its production to Italy and Spain.
In January–April 2015, the accumulated first sales of cuttlefish were EUR 9,44 million and 3.565 tonnes. This was an increase in both value (+80%) and volume (+131%), respectively, over January–April last year; the increase in value is mostly due to an increase in volume, as the unit price has decreased.
Figure 4. CUTTLEFISH: FIRST SALES IN FRANCE
Source: EUMOFA (updated 24.06.2015).
Figure 5. CUTTLEFISH: FIRST-SALES PRICE IN FRANCE
Source: EUMOFA (updated 24.06.2015).
The average unit price of cuttlefish in January–April 2015 was 2,65 EUR/kg. This was a significant decrease (−22%) compared with January–April 2014.
0,0
0,5
1,0
1,5
2,0
2,5
3,0
3,5
4,0
0
2
4
6
8
10
12
14
16
Jun
Au
gO
ct
Dec
Fe
bA
pr
Jun
Au
gO
ct
Dec
Fe
bA
pr
Jun
Au
gO
ct
Dec
Fe
bA
pr
2012 2013 2014 2015
Valu
e
Vo
lum
e
Volume (100 tonnes) Value (million EUR)
0,00
1,00
2,00
3,00
4,00
5,00
6,00
Jun
Au
g
Oct
Dec
Feb
Ap
r
Jun
Au
g
Oct
Dec
Feb
Ap
r
Jun
Au
g
Oct
Dec
Feb
Ap
r
2012 2013 2014 2015
EU
R/k
g
6
MONTHLY HIGHLIGHTS | NO. 6/2015
European Market Observatory for Fisheries and Aquaculture Products
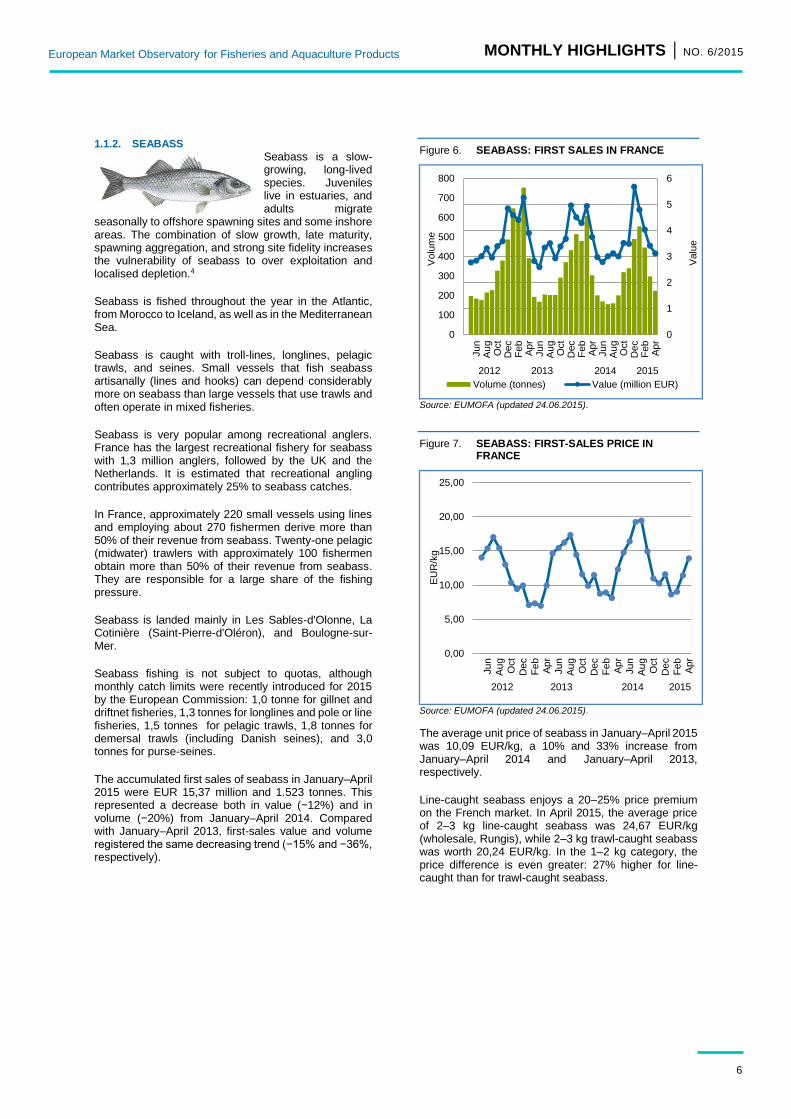
1.1.2. SEABASS
Seabass is a slow-growing, long-lived species. Juveniles live in estuaries, and adults migrate
seasonally to offshore spawning sites and some inshore areas. The combination of slow growth, late maturity, spawning aggregation, and strong site fidelity increases the vulnerability of seabass to over exploitation and localised depletion.4
Seabass is fished throughout the year in the Atlantic, from Morocco to Iceland, as well as in the Mediterranean Sea.
Seabass is caught with troll-lines, longlines, pelagic trawls, and seines. Small vessels that fish seabass artisanally (lines and hooks) can depend considerably more on seabass than large vessels that use trawls and often operate in mixed fisheries.
Seabass is very popular among recreational anglers. France has the largest recreational fishery for seabass with 1,3 million anglers, followed by the UK and the Netherlands. It is estimated that recreational angling contributes approximately 25% to seabass catches.
In France, approximately 220 small vessels using lines and employing about 270 fishermen derive more than 50% of their revenue from seabass. Twenty-one pelagic (midwater) trawlers with approximately 100 fishermen obtain more than 50% of their revenue from seabass. They are responsible for a large share of the fishing pressure.
Seabass is landed mainly in Les Sables-d'Olonne, La Cotinière (Saint-Pierre-d'Oléron), and Boulogne-sur-Mer.
Seabass fishing is not subject to quotas, although monthly catch limits were recently introduced for 2015 by the European Commission: 1,0 tonne for gillnet and driftnet fisheries, 1,3 tonnes for longlines and pole or line fisheries, 1,5 tonnes for pelagic trawls, 1,8 tonnes for demersal trawls (including Danish seines), and 3,0 tonnes for purse-seines.
The accumulated first sales of seabass in January–April 2015 were EUR 15,37 million and 1.523 tonnes. This represented a decrease both in value (−12%) and in volume (−20%) from January–April 2014. Compared with January–April 2013, first-sales value and volume registered the same decreasing trend (−15% and −36%, respectively).
Figure 6. SEABASS: FIRST SALES IN FRANCE
Source: EUMOFA (updated 24.06.2015).
Figure 7. SEABASS: FIRST-SALES PRICE IN FRANCE
Source: EUMOFA (updated 24.06.2015).
The average unit price of seabass in January–April 2015 was 10,09 EUR/kg, a 10% and 33% increase from January–April 2014 and January–April 2013, respectively.
Line-caught seabass enjoys a 20–25% price premium on the French market. In April 2015, the average price of 2–3 kg line-caught seabass was 24,67 EUR/kg (wholesale, Rungis), while 2–3 kg trawl-caught seabass was worth 20,24 EUR/kg. In the 1–2 kg category, the price difference is even greater: 27% higher for line-caught than for trawl-caught seabass.
0
1
2
3
4
5
6
0
100
200
300
400
500
600
700
800
Jun
Au
gO
ct
Dec
Fe
bA
pr
Jun
Au
gO
ct
Dec
Fe
bA
pr
Jun
Au
gO
ct
Dec
Fe
bA
pr
2012 2013 2014 2015
Valu
e
Vo
lum
e
Volume (tonnes) Value (million EUR)
0,00
5,00
10,00
15,00
20,00
25,00Jun
Au
g
Oct
Dec
Feb
Ap
r
Jun
Au
g
Oct
Dec
Feb
Ap
r
Jun
Au
g
Oct
Dec
Feb
Ap
r2012 2013 2014 2015
EU
R/k
g
7
MONTHLY HIGHLIGHTS | NO. 6/2015
European Market Observatory for Fisheries and Aquaculture Products
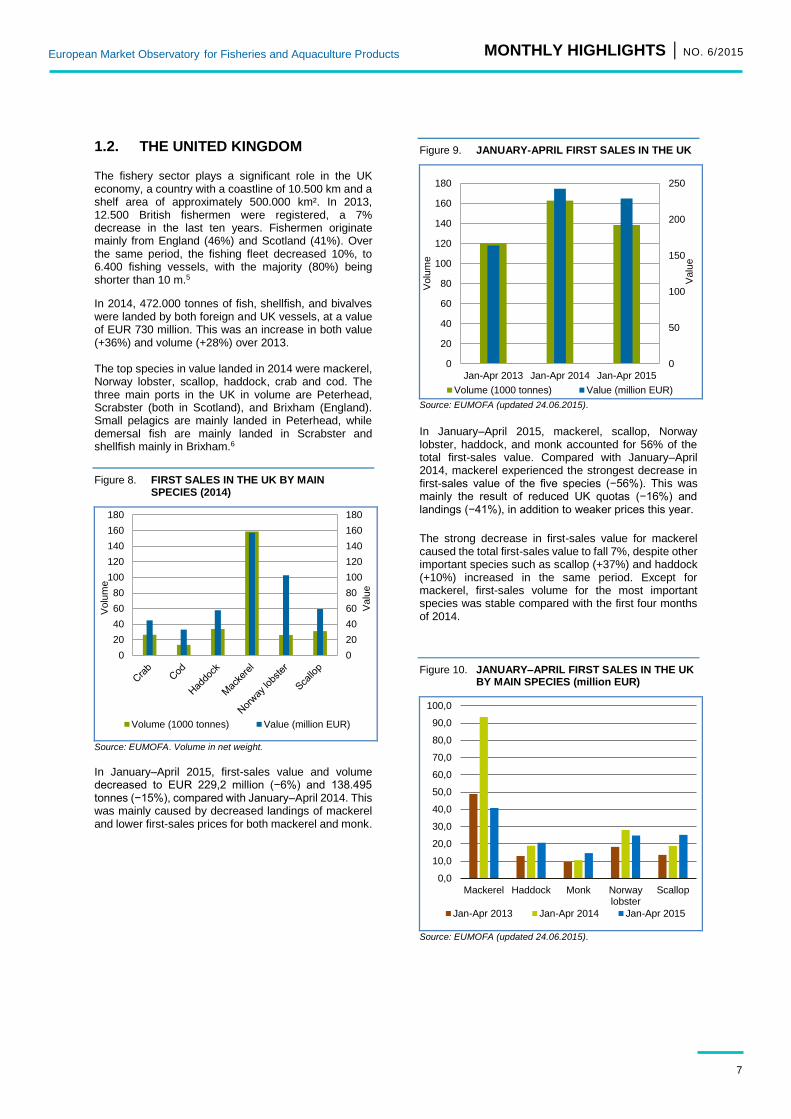
1.2. THE UNITED KINGDOM
The fishery sector plays a significant role in the UK economy, a country with a coastline of 10.500 km and a shelf area of approximately 500.000 km². In 2013, 12.500 British fishermen were registered, a 7% decrease in the last ten years. Fishermen originate mainly from England (46%) and Scotland (41%). Over the same period, the fishing fleet decreased 10%, to 6.400 fishing vessels, with the majority (80%) being shorter than 10 m.5
In 2014, 472.000 tonnes of fish, shellfish, and bivalves were landed by both foreign and UK vessels, at a value of EUR 730 million. This was an increase in both value (+36%) and volume (+28%) over 2013. The top species in value landed in 2014 were mackerel, Norway lobster, scallop, haddock, crab and cod. The three main ports in the UK in volume are Peterhead, Scrabster (both in Scotland), and Brixham (England). Small pelagics are mainly landed in Peterhead, while demersal fish are mainly landed in Scrabster and shellfish mainly in Brixham.6
Figure 8. FIRST SALES IN THE UK BY MAIN SPECIES (2014)
Source: EUMOFA. Volume in net weight.
In January–April 2015, first-sales value and volume decreased to EUR 229,2 million (−6%) and 138.495 tonnes (−15%), compared with January–April 2014. This was mainly caused by decreased landings of mackerel and lower first-sales prices for both mackerel and monk.
Figure 9. JANUARY-APRIL FIRST SALES IN THE UK
Source: EUMOFA (updated 24.06.2015).
In January–April 2015, mackerel, scallop, Norway lobster, haddock, and monk accounted for 56% of the total first-sales value. Compared with January–April 2014, mackerel experienced the strongest decrease in first-sales value of the five species (−56%). This was mainly the result of reduced UK quotas (−16%) and landings (−41%), in addition to weaker prices this year.
The strong decrease in first-sales value for mackerel caused the total first-sales value to fall 7%, despite other important species such as scallop (+37%) and haddock (+10%) increased in the same period. Except for mackerel, first-sales volume for the most important species was stable compared with the first four months of 2014.
Figure 10. JANUARY–APRIL FIRST SALES IN THE UK BY MAIN SPECIES (million EUR)
Source: EUMOFA (updated 24.06.2015).
0
20
40
60
80
100
120
140
160
180
0
20
40
60
80
100
120
140
160
180
Valu
e
Volu
me
Volume (1000 tonnes) Value (million EUR)
0,0
10,0
20,0
30,0
40,0
50,0
60,0
70,0
80,0
90,0
100,0
Mackerel Haddock Monk Norwaylobster
Scallop
Jan-Apr 2013 Jan-Apr 2014 Jan-Apr 2015
0
50
100
150
200
250
0
20
40
60
80
100
120
140
160
180
Jan-Apr 2013 Jan-Apr 2014 Jan-Apr 2015
Valu
e
Volu
me
Volume (1000 tonnes) Value (million EUR)
8
MONTHLY HIGHLIGHTS | NO. 6/2015
European Market Observatory for Fisheries and Aquaculture Products
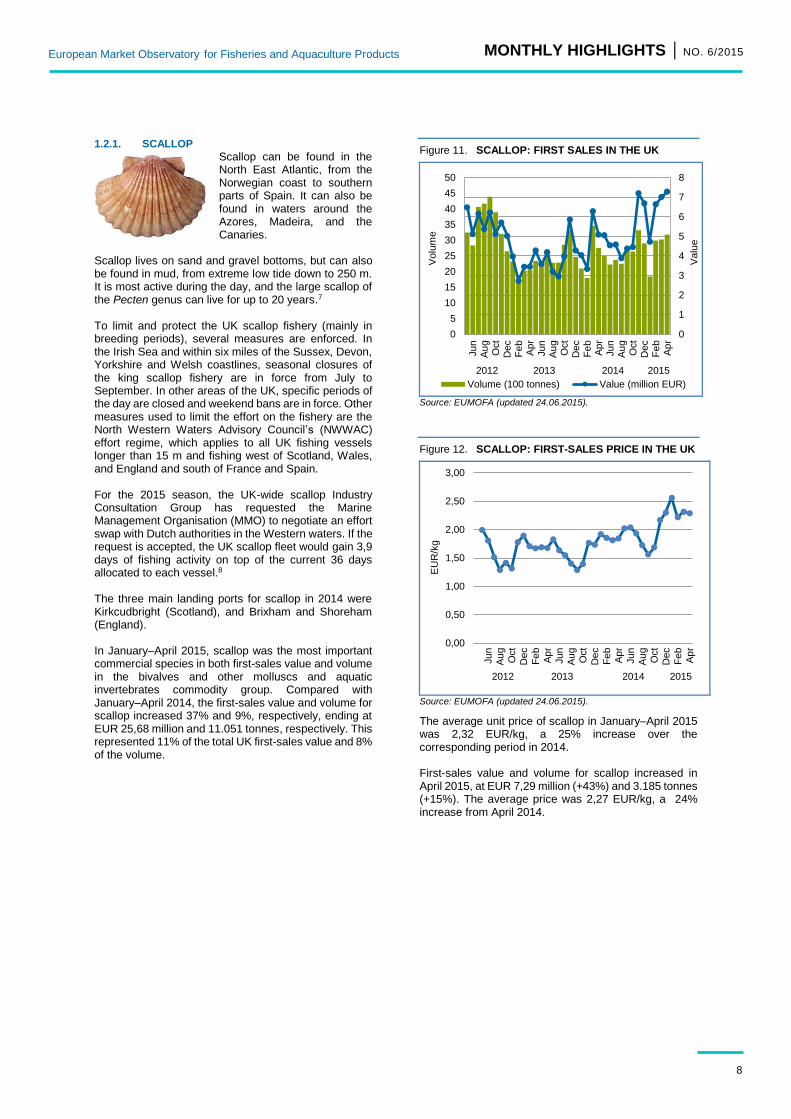
1.2.1. SCALLOP
Scallop can be found in the North East Atlantic, from the Norwegian coast to southern parts of Spain. It can also be found in waters around the Azores, Madeira, and the Canaries.
Scallop lives on sand and gravel bottoms, but can also be found in mud, from extreme low tide down to 250 m. It is most active during the day, and the large scallop of the Pecten genus can live for up to 20 years.7 To limit and protect the UK scallop fishery (mainly in breeding periods), several measures are enforced. In the Irish Sea and within six miles of the Sussex, Devon, Yorkshire and Welsh coastlines, seasonal closures of the king scallop fishery are in force from July to September. In other areas of the UK, specific periods of the day are closed and weekend bans are in force. Other measures used to limit the effort on the fishery are the North Western Waters Advisory Council’s (NWWAC) effort regime, which applies to all UK fishing vessels longer than 15 m and fishing west of Scotland, Wales, and England and south of France and Spain. For the 2015 season, the UK-wide scallop Industry Consultation Group has requested the Marine Management Organisation (MMO) to negotiate an effort swap with Dutch authorities in the Western waters. If the request is accepted, the UK scallop fleet would gain 3,9 days of fishing activity on top of the current 36 days allocated to each vessel.8 The three main landing ports for scallop in 2014 were Kirkcudbright (Scotland), and Brixham and Shoreham (England). In January–April 2015, scallop was the most important commercial species in both first-sales value and volume in the bivalves and other molluscs and aquatic invertebrates commodity group. Compared with January–April 2014, the first-sales value and volume for scallop increased 37% and 9%, respectively, ending at EUR 25,68 million and 11.051 tonnes, respectively. This represented 11% of the total UK first-sales value and 8% of the volume.
Figure 11. SCALLOP: FIRST SALES IN THE UK
Source: EUMOFA (updated 24.06.2015).
Figure 12. SCALLOP: FIRST-SALES PRICE IN THE UK
Source: EUMOFA (updated 24.06.2015).
The average unit price of scallop in January–April 2015 was 2,32 EUR/kg, a 25% increase over the corresponding period in 2014. First-sales value and volume for scallop increased in April 2015, at EUR 7,29 million (+43%) and 3.185 tonnes (+15%). The average price was 2,27 EUR/kg, a 24% increase from April 2014.
0
1
2
3
4
5
6
7
8
0
5
10
15
20
25
30
35
40
45
50
Jun
Au
gO
ct
Dec
Fe
bA
pr
Jun
Au
gO
ct
Dec
Fe
bA
pr
Jun
Au
gO
ct
Dec
Fe
bA
pr
2012 2013 2014 2015
Valu
e
Vo
lum
e
Volume (100 tonnes) Value (million EUR)
0,00
0,50
1,00
1,50
2,00
2,50
3,00
Jun
Au
g
Oct
Dec
Fe
b
Ap
r
Jun
Au
g
Oct
Dec
Fe
b
Ap
r
Jun
Au
g
Oct
Dec
Fe
b
Ap
r2012 2013 2014 2015
EU
R/k
g
9
MONTHLY HIGHLIGHTS | NO. 6/2015
European Market Observatory for Fisheries and Aquaculture Products
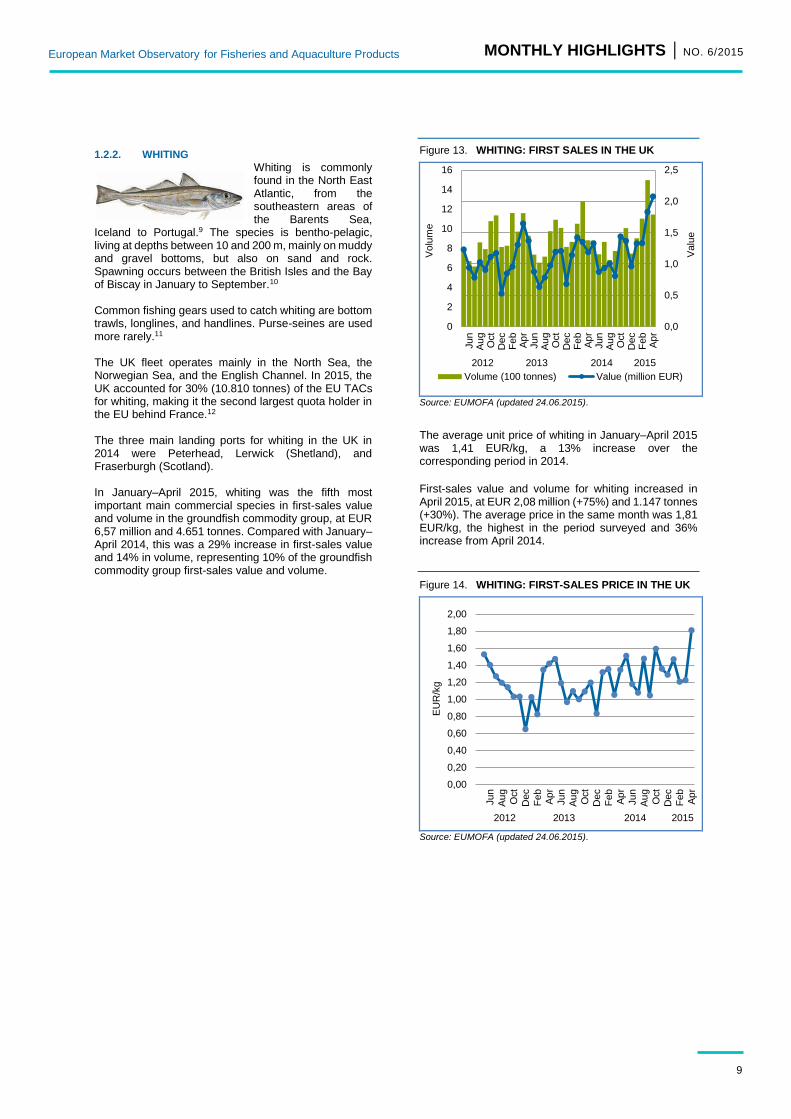
1.2.2. WHITING
Whiting is commonly found in the North East Atlantic, from the southeastern areas of the Barents Sea,
Iceland to Portugal.9 The species is bentho-pelagic, living at depths between 10 and 200 m, mainly on muddy and gravel bottoms, but also on sand and rock. Spawning occurs between the British Isles and the Bay of Biscay in January to September.10 Common fishing gears used to catch whiting are bottom trawls, longlines, and handlines. Purse-seines are used more rarely.11 The UK fleet operates mainly in the North Sea, the Norwegian Sea, and the English Channel. In 2015, the UK accounted for 30% (10.810 tonnes) of the EU TACs for whiting, making it the second largest quota holder in the EU behind France.12 The three main landing ports for whiting in the UK in 2014 were Peterhead, Lerwick (Shetland), and Fraserburgh (Scotland). In January–April 2015, whiting was the fifth most important main commercial species in first-sales value and volume in the groundfish commodity group, at EUR 6,57 million and 4.651 tonnes. Compared with January–April 2014, this was a 29% increase in first-sales value and 14% in volume, representing 10% of the groundfish commodity group first-sales value and volume.
Figure 13. WHITING: FIRST SALES IN THE UK
Source: EUMOFA (updated 24.06.2015).
The average unit price of whiting in January–April 2015 was 1,41 EUR/kg, a 13% increase over the corresponding period in 2014.
First-sales value and volume for whiting increased in April 2015, at EUR 2,08 million (+75%) and 1.147 tonnes (+30%). The average price in the same month was 1,81 EUR/kg, the highest in the period surveyed and 36% increase from April 2014.
Figure 14. WHITING: FIRST-SALES PRICE IN THE UK
Source: EUMOFA (updated 24.06.2015).
0,0
0,5
1,0
1,5
2,0
2,5
0
2
4
6
8
10
12
14
16
Jun
Au
gO
ct
Dec
Fe
bA
pr
Jun
Au
gO
ct
Dec
Fe
bA
pr
Jun
Au
gO
ct
Dec
Fe
bA
pr
2012 2013 2014 2015
Valu
e
Vo
lum
e
Volume (100 tonnes) Value (million EUR)
0,00
0,20
0,40
0,60
0,80
1,00
1,20
1,40
1,60
1,80
2,00
Jun
Au
g
Oct
Dec
Feb
Ap
r
Jun
Au
g
Oct
Dec
Feb
Ap
r
Jun
Au
g
Oct
Dec
Feb
Ap
r
2012 2013 2014 2015
EU
R/k
g
10
MONTHLY HIGHLIGHTS | NO. 6/2015
European Market Observatory for Fisheries and Aquaculture Products
2. Global Supply
Resources / EU / Seabass: The Council of Ministers has set monthly catch limits for commercial vessels fishing seabass. The decision will be in force until 31 December 2015. This represents an additional step in the package of measures the European Commission has proposed for 2015 to halt the decline of the seabass stock and prepare the ground for further management measures in 2016.13 Resources / EU / Bluefin tuna: The Bluefin tuna purse-seine season, which lasted from 26 May to 24 June 2015, ended early of the European purse-seiners. The EU Member States involved in this fishing activity have recalled their purse-seiners because their quotas have been exhausted.14 EU / Liberia / Fisheries Partnership Agreement: The European Union and the Republic of Liberia have reached a Sustainable Fisheries Partnership Agreement, as well as an associated protocol setting out the fishing opportunities for EU vessels. The five-year protocol provides the EU with fishing opportunities for 6.500 tonnes of tuna and other highly migratory species, for 28 purse-seiners and 6 longline vessels.15 Fisheries / Iceland: Icelandic vessels took 144.000 tonnes of fish in May 2015, an increase of 12.500 tonnes over May 2014. The increase was caused by larger catches of flatfish and pelagics, mainly blue whiting, which increased 18%. The total catch increased 22% in the past 12 months.16 Aquaculture / Iceland: Aquaculture production in Iceland has doubled over the past two years, and the growing trend is predicted to accelerate in future. Arctic char and Atlantic salmon are the main species farmed. Production in 2015 is expected to be around 13.700 tonnes, compared with 6.900 tonnes in 2013. The USA is the largest market for Icelandic aquaculture products, followed by the UK and Germany.17
Certification / Fisheries: A UK fishery achieved Marine Stewardship Council (MSC) certification for hake as a sustainable and well-managed fishery.18 An Estonian fishery has been certified sustainable by Friends of the Sea (FOS) for perch, pike-perch, and northern pike from Estonia’s Peipsi Lake.19 Certification / Aquaculture: More than 350 products certified by the Aquaculture Stewardship Council (ASC) are available on the Dutch market. The volume of ASC-certified products in the retail market has increased 66% over the past year.20
Trade / Cuttlefish: In the first quarter of 2015, the EU imported EUR 56 million worth of cuttlefish, 23% less than in the same period of the previous year. Spain, the largest importer, with a 51% share of the EU market, saw its imports increase 16%. Instead, in Italy and France imports decreased 49% and 24% respectively.21
Trade / Norway: Norway’s seafood exports were worth NOK 5,2 billion (EUR 609 million) in May 2015, a 4% increase over May 2014. Salmon exports remained stable, while cod, particularly clipfish (salted and dried fish) and salted fish, have increased. The Portuguese market for clipfish was the most significant contributor to the increase.22
Russian embargo on fishery products: The Russian Federation announced the extension of the embargo on perishable foods from the European Union (EU), which include fish and seafood products, for an additional year. This measure was taken in response to EU decision to extend sanctions against Moscow until 31 January 2016. Previously, the Russian Federation has placed import restrictions on a list of EU fishery products, and, as of 4 June 2015, all canned fish originating in Estonia and Latvia, based on allegation on food safety.23
11
MONTHLY HIGHLIGHTS | NO. 6/2015
European Market Observatory for Fisheries and Aquaculture Products
3. Case study: Geographical indications and
traditional specialities in the seafood sector
3.1. Geographical indications and traditional specialities in the EU
Geographical indications (GIs) and traditional specialities schemes aim to promote and protect local know-how and to highlight specific features of products.
GIs are a type of intellectual property right that apply in the EU to different types of products: agricultural products and foodstuffs, wines, aromatised wines and spirits. Traditional specialities apply to agricultural products and foodstuffs.
There are three types of schemes protecting names of quality products in the EU:
Protected designations of origin (PDOs): the quality or characteristics are essentially or exclusively the result of
a particular geographical environment with its inherent natural and human factors; the production steps all take place in the defined geographical area.
Protected geographical indications (PGIs): the quality, reputation, or other characteristics are essentially
attributable to its geographical origin, and at least one of the production steps takes place in the defined geographical area.
Traditional Speciality Guaranteed (TSG): highlights traditional character, either in the composition or means of production.
The number of names increases each year. Between 1996 and June 2015, 1.280 names of agricultural products and foodstuffs have been protected under these schemes at EU level.
In 2010, the sales value of the GIs registered for agricultural products and foodstuffs, wines, aromatised wines and spirits was estimated at EUR 54,3 billion, accounting for 5,7% of the total food-and-drink sector in the EU27. The main sector was wine, with 56% of the total sales value. Agri-food products accounted for 29% of the total sales. In the agri-food sector, the leading Member States are Italy, Germany, and France.24
Cheese, meat products, and beer accounted for 75% of the sales value, and seafood products accounted for 3% in 2010. Domestic sales remained the main market (78% of sales value), followed by intra-EU trade (16%) and extra-EU trade (6%).
In most cases GIs products achieved a price premium over the corresponding standard products. The value premium for all GIs registered in the agri-food sector was estimated at 55% in 2010; this value premium tented to be higher for processed products than for unprocessed products.
PDO/PGI/TSG products benefit from support for promotion from the European Commission, for instance through promotion programmes for agricultural products and rural development programmes.
3.2. Geographical indications and traditional specialities in the seafood sector
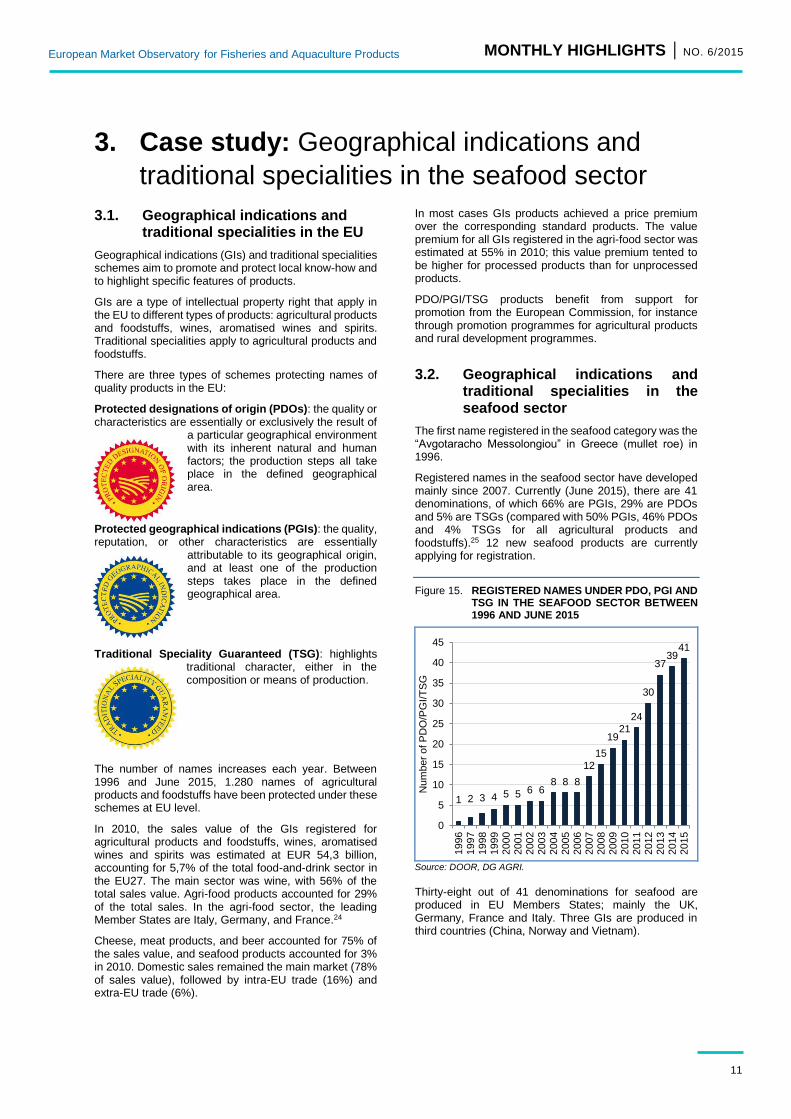
The first name registered in the seafood category was the “Avgotaracho Messolongiou” in Greece (mullet roe) in 1996.
Registered names in the seafood sector have developed mainly since 2007. Currently (June 2015), there are 41 denominations, of which 66% are PGIs, 29% are PDOs and 5% are TSGs (compared with 50% PGIs, 46% PDOs and 4% TSGs for all agricultural products and foodstuffs).25 12 new seafood products are currently applying for registration.
Figure 15. REGISTERED NAMES UNDER PDO, PGI AND TSG IN THE SEAFOOD SECTOR BETWEEN 1996 AND JUNE 2015
Source: DOOR, DG AGRI.
Thirty-eight out of 41 denominations for seafood are produced in EU Members States; mainly the UK, Germany, France and Italy. Three GIs are produced in third countries (China, Norway and Vietnam).
1 2 3 4 5 5 6 68 8 8
12
15
1921
24
30
3739
41
0
5
10
15
20
25
30
35
40
45
1996
1997
1998
1999
2000
2001
2002
2003
2004
2005
2006
2007
2008
2009
2010
2011
2012
2013
2014
2015
Num
ber
of P
DO
/PG
I/T
SG
12
MONTHLY HIGHLIGHTS | NO. 6/2015
European Market Observatory for Fisheries and Aquaculture Products
Table 3. NAMES REGISTERED IN THE SEAFOOD SECTOR IN EACH MS AND THIRD COUNTRIES
EU28
UK (9) Arbroath Smokies, Cornish Sardines, Fal Oyster, Isle of Man Queenies, Lough Neagh Eel, Scottish Farmed Salmon, Scottish Wild Salmon, Traditional Grimsby Smoked Fish, Whitstable oysters
DE (6) Aischgründer Karpfen, Fränkischer Karpfen, Glückstädter Matjes, Holsteiner Karpfen, Oberpfälzer Karpfen, Schwarzwaldforelle
FR (5) Anchois de Collioure, Coquille Saint-Jacques des Côtes d'Armor, Huîtres Marennes Oléron, Moules de Bouchot de la Baie du Mont-Saint-Michel, Moules de Bouchot
IT (5) Acciughe sotto sale del Mar Ligure, Cozza di Scardovari, Salmerino del Trentino, Tinca Gobba Dorata del Pianalto di Poirino, Trote del Trentino
ES (3) Caballa de Andalucia, Mejillón de Galicia, Melva de Andalucia
CZ (2) Pohořelický Kapr, Třeboňský Kapr
FI (2) Kitkan Visas, Puruveden muikku
GR (1) Avgotaracho Messolongiou
IE (1) Clare Island Salmon
LV (1) Carnikavas Nēģi
PL (1) Karp Zatorski
PT (1) Bacalhau de Cura Tradicional Portuguesa
SE (1) Kalix Löjrom
Third countries
CN (1) Yancheng Long Xia
NO (1) Tørrfisk fra Lofoten
VN (1) Phú Quốc
Source: based on DOOR, DG AGRI.
3.3. Economic importance of seafood products under GIs
In 2010 (most recent data available at the EU level), the sales value and volume of the 19 GIs registered were estimated at EUR 443 million and 111.258 tonnes. This accounted for 1,9% of the wild and farmed seafood produced in the EU. 26 A limited number of GIs accounted for a large share of the total sales value. With only seven GIs, the UK and France were responsible for 90% of the sales volume and value.27 Sales have increased since 2010, because 22 new names have been registered.
3.4. Types of seafood products covered by protected names
There is a balance between wild and aquaculture products among the 41 names registered. More than half includes unprocessed products (54%), mainly from aquaculture; 32% covers processed products, mainly
from the fishery sector; and the remaining names (15%) cover both processed and unprocessed products (for example, PGI “Oberpfälzer Karpfen” covers both smoked and fresh carp).
Protected names for wild catches are mainly in the UK (5). Aquaculture products are mainly registered in Germany (5), Italy (4), France (3) and to a lesser extent the UK, and the Czech Republic (2 each).
Table 4. TYPES OF PRODUCTS COVERED BY PROTECTED NAMES IN THE SEAFOOD SECTOR (2015)
Catche
s Aquacultur
e Total
% Total
Unprocessed
7 15 22 54%
Processed 12 1 13 32%
Unprocessed and
Processed 2 4 6 15%
Total 21 20 41 100%
% Total 51% 49% 100%
Source: based on DOOR, DG AGRI.
Processed products include: smoked, dried, cooked, and canned products, fish roe, fish sauce, and seafood preserved in salt, oil, brine, and jelly.
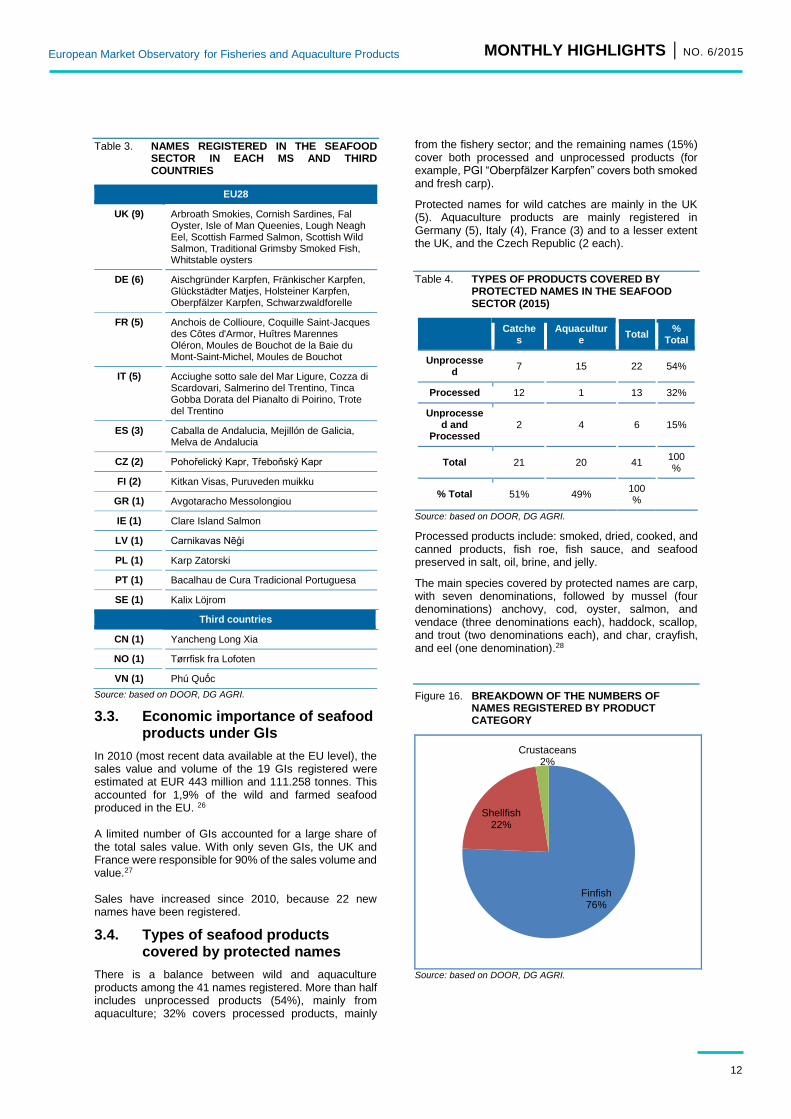
The main species covered by protected names are carp, with seven denominations, followed by mussel (four denominations) anchovy, cod, oyster, salmon, and vendace (three denominations each), haddock, scallop, and trout (two denominations each), and char, crayfish, and eel (one denomination).28
Figure 16. BREAKDOWN OF THE NUMBERS OF NAMES REGISTERED BY PRODUCT CATEGORY
Source: based on DOOR, DG AGRI.
Finfish76%
Shellfish22%
Crustaceans2%
13
MONTHLY HIGHLIGHTS | NO. 6/2015
European Market Observatory for Fisheries and Aquaculture Products
3.5. Definition of geographical area for wild-caught products
The definition of the geographical area is a specific challenge for the 20 GIs covering wild-caught products, compared with the ones covering aquaculture and agricultural products. Indeed, fish travel between areas, species migrate, and stocks fluctuate. Three types of cases can be identified:
the fishing areas are not defined for four PGIs; they all cover processed products; and the geographical area is defined for the processing stage only;
the fishing areas are lakes and/or rivers for six other GIs;
the whole fishing area or part of this area is in the maritime space for the ten remaining GIs. These areas are defined using different methods:
o distance from the coast: for example, the sea-caught “Scottish Wild Salmon” shall be fished “up to 1.500 metres off the Scottish coast”;
o existing fishing areas: for example, the anchovy for the French “Anchois de Collioure” shall be fished in “the Gulfs of Lyons and Gascony, plus Brittany”;
o latitude and longitude: the method is used only for cod of the Norwegian “Tørrfisk fra Lofoten”.
Migration issues may be taken into account in the GI specifications, for example, by defining the period during which fish shall be caught. This is the case for the cod fished for “Tørrfisk fra Lofoten”, which shall be caught between January and April, when mature cod from the Barents Sea travel to the sea around Lofoten and Vesterålen to spawn.
3.6. Focus on some GIs registered in the seafood sector
3.6.1. CARP FARMING: SEVEN GIs IN GERMANY, THE CZECH REPUBLIC, AND POLAND
Carp is the first species covered by the GI scheme: four GIs are registered in Germany, two in the Czech Republic, and one in Poland. The first registered was “Oberpfälzer Karpfen” in Germany in 2002, and the last registered were “Karp Zatorski” (2011) in Poland, and “Fränkischer Karpfen” (2012) and “Aischgründer Karpfen” (2012) in Germany.
Carp is the most important freshwater fish farmed in Poland, the Czech Republic, and Germany with 19.137, 18.969, and 5.521 tonnes, respectively, in 2012. The three Member States accounted for 57% of EU carp production.29
3.6.2. SCOTLAND: FARMED AND WILD SALMON UNDER PGI
Scottish salmon, both farmed and caught products, is covered by the PGIs “Scottish Farmed Salmon” and “Scottish Wild Salmon”.
The production area of Scottish Farmed Salmon is the west coast of mainland Scotland, the Outer Hebrides
(Western Isles), and Orkney and Shetland Islands. Each production stage takes place in the defined area of production. In 2008, the PGI specification was expanded to cover the production of organic salmon, which had developed as a market sector. Scottish salmon production from aquaculture reached 163.234 tonnes in 2013, with a farm gate value of EUR 797 million. Exports reached EUR 530 million in 2013. The main export markets were the USA (EUR 236 million) and France (EUR 91 million). Markets in the Far East and Middle East have been growing. The share of Scottish salmon from aquaculture marketed through the PGI scheme is not given.30
No data is publicly available for PGI “Scottish Wild Salmon”. However, it should be noted that wild catches are of limited importance in the UK salmon sector. The landing of caught salmon reached 4 tonnes in 2013.31
3.6.3. OYSTERS UNDER GIs: “HUÎTRES MARENNES OLÉRON” FROM FRANCE AND “WHITSTABLE OYSTER” AND “FAL OYSTERS” FROM THE UK
“Whitstable oyster” was one of the first GIs registered in the EU in 1997. The two others oysters under GIs were registered in 2009 (“Huîtres Marenne Oléron”) and 2013 (“Fal Oyster”).
“Fal oyster” is a wild fishery. The oysters are only harvested between October and March in the defined area, using traditional non-motorised vessels. “Whitstable Oyster” and “Huîtres Marennes Oléron” are farmed products.
For “Huîtres Marennes Oléron”, the oysters must be packaged within 24 hours of being fished; packaging and dispatch must take place within the identified geographical area. The Poitou-Charentes region, where Marennes Oléron is located, is the leading oyster production area in France with 37.101 tonnes produced in 2012.32
3.7. Other certification schemes in the seafood sector
The EU organic aquaculture production has grown considerably in recent years. The volume certified in the EU reached approximately 35.000 tonnes in 2013, the main producer being Ireland.33
National schemes, such as the French “Label Rouge”, also cover seafood products. This certification recognises top-of-the-range products from an organoleptic point of view. This scheme is notably used by two supply chains also involved in PGIs: “Huître Marennes Oléron” and “Saumon Ecossais”. The EU seafood market also registers development of ecolabels, such as the Marine Stewardship Council (MSC), Friend of the Sea (FOS), GLOBALG.A.P. (Good Agricultural Practice), and the Aquaculture Stewardship Council (ASC). Most of these certification schemes cover seafood products specifically. They focus primarily on environmental issues (management of the resource, production practices) and traceability.

14
MONTHLY HIGHLIGHTS | NO. 6/2015
European Market Observatory for Fisheries and Aquaculture Products
4. Consumption
CARP
The carp, an oily freshwater fish of the Cyprinidae family is farmed extensively throughout Europe. The biggest producing countries are Poland, the Czech Republic, and Hungary. The consumption for carp is generally very low. The species is consumed mainly in Central and Eastern Europe, particularly during festive periods such as Christmas and Easter. It is mostly consumed fresh, whole, gutted, and headed. In addition, the recently developed value-added carp products, such as steaks, cuts, fillets, smoked, minces, salads, facilitated the move of carp products from traditional distribution (e.g. open markets) to modern retail chains, making carp available to larger consumer groups and thus maintaining stable levels of domestic carp consumption.
Carp is consumed mostly at home and less in the food-service sector.
Retail prices of carp are relatively consistent between the EU Member States surveyed, with the exception of Poland, where prices vary considerably.
In Poland, monthly retail prices of fresh carp, whole, have fluctuated between 3,07 and 3,77 EUR/kg in the period January 2012–May 2014, reaching a peak in September 2012. Prices have decreased since then and continue to fluctuate. The prices of carp register lower values during December to February. In December 2014, the retail price reached its lowest value at 3,07 EUR/kg for the past three years, 5% lower than in 2013 and 11% lower than in 2012.
In Latvia, retail prices of fresh carp remained relatively stable, at an average of 3,43 EUR/kg (January 2012–May 2015). After a drop at the beginning of 2012, a slightly increasing trend of the retail price is observed. In June 2014, an increase of 3,54 EUR/kg was registered, a 5% increase over 2013. Since then, the prices of fresh carp have fluctuated between 3,35 EUR/kg and 3,53 EUR/kg.
In Lithuania, the retail prices of live common carp varied little in 2012 and 2013, at an average of 3,47 EUR/kg. They have increased since 2014, and from May 2014 to May 2015, the average price was 3,52 EUR/kg, a 2% increase over the same period a year ago. Since the beginning of the year prices have averaged around 3,55 EUR/kg.
Figure 17. RETAIL PRICES OF CARP (EUR/KG)
Source: EUMOFA (updated 24.06.2015).
2,50
2,70
2,90
3,10
3,30
3,50
3,70
3,90
4,10
4,30
4,50
Jan
Feb
Mar
Ap
r
May
Jun
Jul
Au
g
Se
p
Oct
Nov
Dec
Jan
Feb
Mar
Ap
r
May
Jun
Jul
Au
g
Se
p
Oct
Nov
Dec
Jan
Feb
Mar
Ap
r
May
Jun
Jul
Au
g
Se
p
Oct
Nov
Dec
Jan
Feb
Mar
Ap
r
May
2012 2013 2014 2015
EU
R/k
g
Poland Latvia Lithuania
15
MONTHLY HIGHLIGHTS | NO. 6/2015
European Market Observatory for Fisheries and Aquaculture Products
HERRING
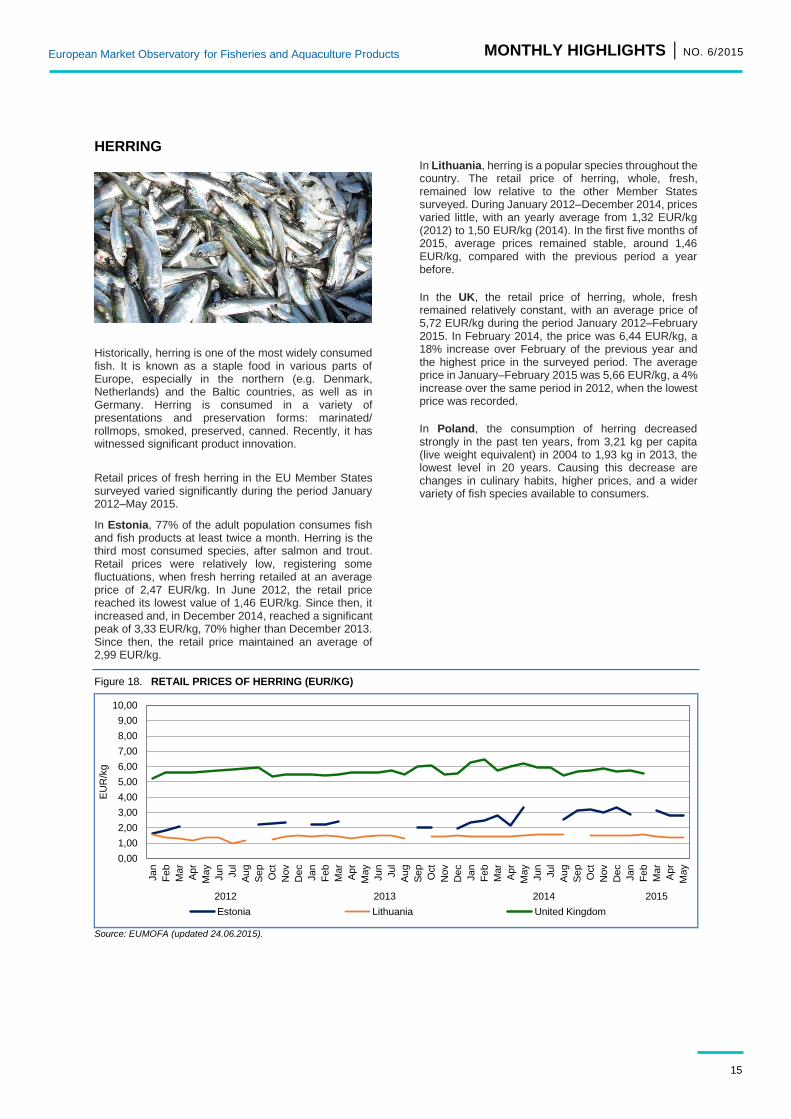
Historically, herring is one of the most widely consumed fish. It is known as a staple food in various parts of Europe, especially in the northern (e.g. Denmark, Netherlands) and the Baltic countries, as well as in Germany. Herring is consumed in a variety of presentations and preservation forms: marinated/ rollmops, smoked, preserved, canned. Recently, it has witnessed significant product innovation.
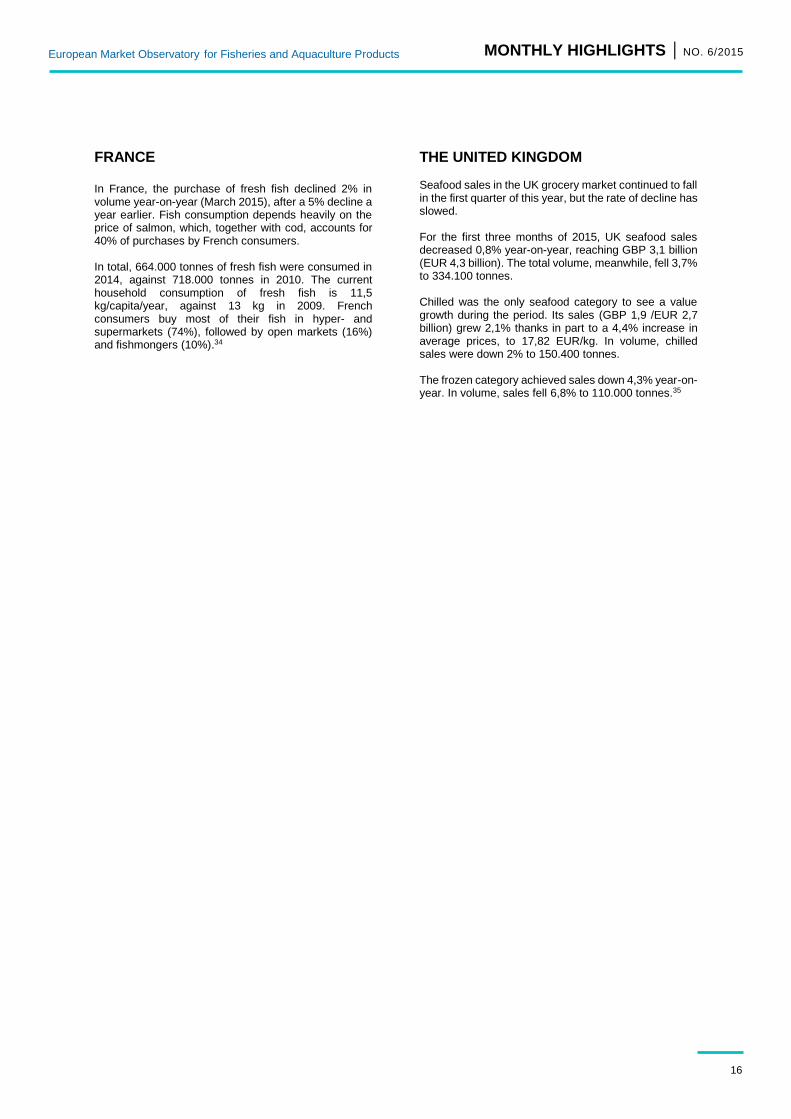
Retail prices of fresh herring in the EU Member States surveyed varied significantly during the period January 2012–May 2015.
In Estonia, 77% of the adult population consumes fish and fish products at least twice a month. Herring is the third most consumed species, after salmon and trout. Retail prices were relatively low, registering some fluctuations, when fresh herring retailed at an average price of 2,47 EUR/kg. In June 2012, the retail price reached its lowest value of 1,46 EUR/kg. Since then, it increased and, in December 2014, reached a significant peak of 3,33 EUR/kg, 70% higher than December 2013. Since then, the retail price maintained an average of 2,99 EUR/kg.
In Lithuania, herring is a popular species throughout the country. The retail price of herring, whole, fresh, remained low relative to the other Member States surveyed. During January 2012–December 2014, prices varied little, with an yearly average from 1,32 EUR/kg (2012) to 1,50 EUR/kg (2014). In the first five months of 2015, average prices remained stable, around 1,46 EUR/kg, compared with the previous period a year before.
In the UK, the retail price of herring, whole, fresh remained relatively constant, with an average price of 5,72 EUR/kg during the period January 2012–February 2015. In February 2014, the price was 6,44 EUR/kg, a 18% increase over February of the previous year and the highest price in the surveyed period. The average price in January–February 2015 was 5,66 EUR/kg, a 4% increase over the same period in 2012, when the lowest price was recorded.
In Poland, the consumption of herring decreased strongly in the past ten years, from 3,21 kg per capita (live weight equivalent) in 2004 to 1,93 kg in 2013, the lowest level in 20 years. Causing this decrease are changes in culinary habits, higher prices, and a wider variety of fish species available to consumers.
Figure 18. RETAIL PRICES OF HERRING (EUR/KG)
Source: EUMOFA (updated 24.06.2015).
0,00
1,00
2,00
3,00
4,00
5,00
6,00
7,00
8,00
9,00
10,00
Ja
n
Feb
Mar
Ap
r
May
Jun
Jul
Au
g
Se
p
Oct
Nov
Dec
Ja
n
Feb
Mar
Ap
r
May
Ju
n
Jul
Au
g
Se
p
Oct
Nov
Dec
Ja
n
Feb
Mar
Ap
r
May
Ju
n
Jul
Au
g
Se
p
Oct
Nov
Dec
Ja
n
Feb
Mar
Ap
r
May
2012 2013 2014 2015
EU
R/k
g
Estonia Lithuania United Kingdom
16
MONTHLY HIGHLIGHTS | NO. 6/2015
European Market Observatory for Fisheries and Aquaculture Products
FRANCE In France, the purchase of fresh fish declined 2% in volume year-on-year (March 2015), after a 5% decline a year earlier. Fish consumption depends heavily on the price of salmon, which, together with cod, accounts for 40% of purchases by French consumers. In total, 664.000 tonnes of fresh fish were consumed in 2014, against 718.000 tonnes in 2010. The current household consumption of fresh fish is 11,5 kg/capita/year, against 13 kg in 2009. French consumers buy most of their fish in hyper- and supermarkets (74%), followed by open markets (16%) and fishmongers (10%).34
THE UNITED KINGDOM Seafood sales in the UK grocery market continued to fall in the first quarter of this year, but the rate of decline has slowed. For the first three months of 2015, UK seafood sales decreased 0,8% year-on-year, reaching GBP 3,1 billion (EUR 4,3 billion). The total volume, meanwhile, fell 3,7% to 334.100 tonnes. Chilled was the only seafood category to see a value growth during the period. Its sales (GBP 1,9 /EUR 2,7 billion) grew 2,1% thanks in part to a 4,4% increase in average prices, to 17,82 EUR/kg. In volume, chilled sales were down 2% to 150.400 tonnes. The frozen category achieved sales down 4,3% year-on-year. In volume, sales fell 6,8% to 110.000 tonnes.35
17
MONTHLY HIGHLIGHTS | NO. 6/2015
European Market Observatory for Fisheries and Aquaculture Products
5. Macroeconomic context
5.1. MARINE FUEL
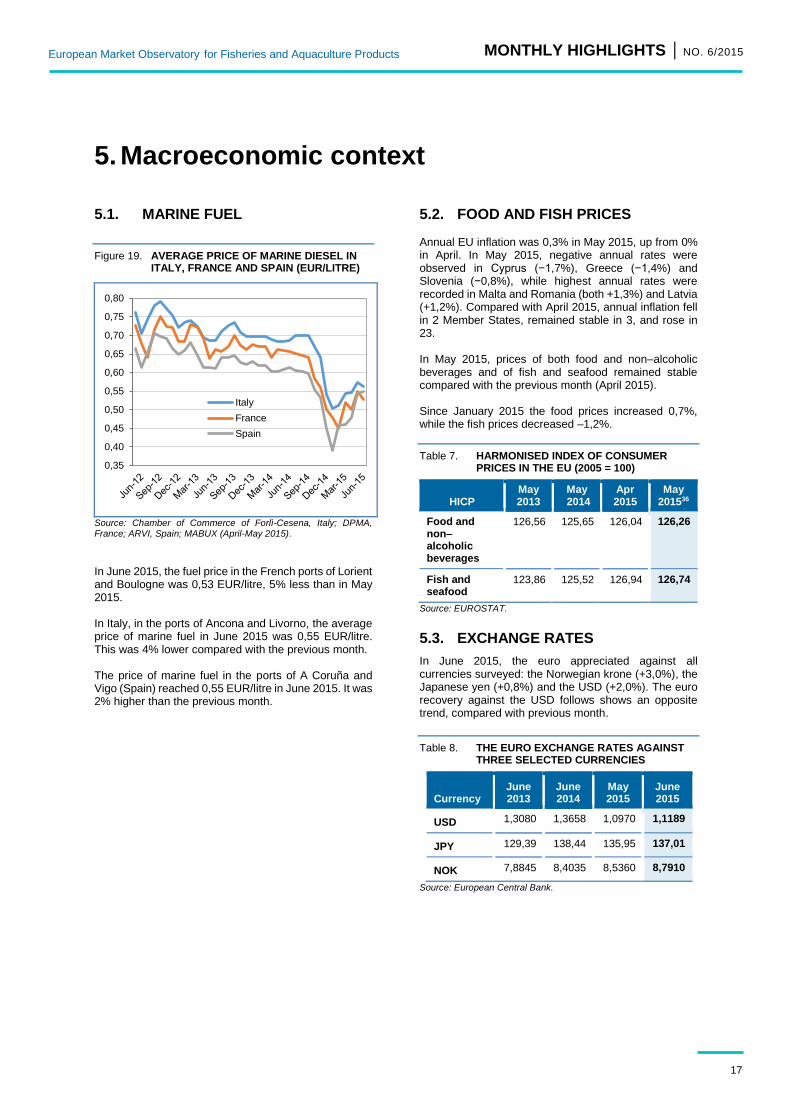
Figure 19. AVERAGE PRICE OF MARINE DIESEL IN ITALY, FRANCE AND SPAIN (EUR/LITRE)
Source: Chamber of Commerce of Forlì-Cesena, Italy; DPMA, France; ARVI, Spain; MABUX (April-May 2015).
In June 2015, the fuel price in the French ports of Lorient and Boulogne was 0,53 EUR/litre, 5% less than in May 2015. In Italy, in the ports of Ancona and Livorno, the average price of marine fuel in June 2015 was 0,55 EUR/litre. This was 4% lower compared with the previous month. The price of marine fuel in the ports of A Coruña and Vigo (Spain) reached 0,55 EUR/litre in June 2015. It was 2% higher than the previous month.
5.2. FOOD AND FISH PRICES Annual EU inflation was 0,3% in May 2015, up from 0% in April. In May 2015, negative annual rates were observed in Cyprus (−1,7%), Greece (−1,4%) and Slovenia (−0,8%), while highest annual rates were recorded in Malta and Romania (both +1,3%) and Latvia (+1,2%). Compared with April 2015, annual inflation fell in 2 Member States, remained stable in 3, and rose in 23. In May 2015, prices of both food and non–alcoholic beverages and of fish and seafood remained stable compared with the previous month (April 2015). Since January 2015 the food prices increased 0,7%, while the fish prices decreased –1,2%.
Table 7. HARMONISED INDEX OF CONSUMER PRICES IN THE EU (2005 = 100)
HICP May 2013
May 2014
Apr 2015
May 201536
Food and non–alcoholic beverages
126,56 125,65 126,04 126,26
Fish and seafood
123,86 125,52 126,94 126,74
Source: EUROSTAT.
5.3. EXCHANGE RATES
In June 2015, the euro appreciated against all currencies surveyed: the Norwegian krone (+3,0%), the Japanese yen (+0,8%) and the USD (+2,0%). The euro recovery against the USD follows shows an opposite trend, compared with previous month.
Table 8. THE EURO EXCHANGE RATES AGAINST THREE SELECTED CURRENCIES
Currency June 2013
June 2014
May 2015
June 2015
USD 1,3080 1,3658 1,0970 1,1189
JPY 129,39 138,44 135,95 137,01
NOK 7,8845 8,4035 8,5360 8,7910
Source: European Central Bank.
0,35
0,40
0,45
0,50
0,55
0,60
0,65
0,70
0,75
0,80
Italy
France
Spain

18
MONTHLY HIGHLIGHTS | NO. 6/2015
European Market Observatory for Fisheries and Aquaculture Products
Figure 20. TREND OF EURO EXCHANGE RATES
Source: European Central Bank.
5.4. EUROPEAN UNION ECONOMIC OVERVIEW
In January–March 2015, the EU GDP grew at a rate of 0,4%, after 0,3% in October–December 2014. The annual GDP growth rate also improved, reaching 1,5% compared with 1,4% growth in October–December 2014, according to a second estimate.
Czech Republic experienced the highest growth: 3,1% during the first quarter of 2015, after 0,4% in the fourth quarter of 2014. Cyprus exited from recession, showing a GDP growth rate of 1,6%. Romania also showed a positive growth rate of 1,6% in January–March 2015, after 1,0% in October–December 2014. The economy improved in Italy, showing a GDP growth rate of +0,3% (the highest since January–March 2011). The UK and Germany continued to grow at the same rate (+0,3%) In France the economy grew 0,6% in January–March 2015, after no growth in October–December 2014. Spain experienced the 7th quarter of consecutive growth (+0,9% in January-March 2015).37
5.5. DEVELOPMENTS IN SELECTED ECONOMIES
In the USA, the economic activity continued to slow down in January–March 2015 with a GDP rate of 0,1%, after 0,5% in Oct–Dec 2014, and 1,2% in Oct–Dec 2014. The adverse weather and disruptions to west coast ports affected the economic activity in the United States.
The economy in Japan is recovering, with a sharp rise in growth in the first quarter of 2015.
In China, the economy has slowed down, with a GDP growth rate of 1,3% in January–March 2015, down from 1,5% in October–December 2014. Both the slowdown in the housing market and the decline in production in many heavy industries influenced the decrease of the growth rate in the first quarter of this year. The economies grew January–March 2015 in India (+2,1%), while the growth rate slowed down in South Africa, reaching 0,3% from +1,0% in the last quarter of previous year. Russia is expected to undergo a deep recession in 2015. Uncertainty is high and business confidence is weak.38
1,05
1,10
1,15
1,20
1,25
1,30
1,35
1,40
1,45
1,50
Jun
/12
Se
p/1
2D
ec/1
2M
ar/
13
Jun
/13
Se
p/1
3D
ec/1
3M
ar/
14
Jun
/14
Se
p/1
4D
ec/1
4M
ar/
15
Jun
/15
USD
90
100
110
120
130
140
150
160
Jun
/12
Se
p/1
2D
ec/1
2M
ar/
13
Jun
/13
Se
p/1
3D
ec/1
3M
ar/
14
Jun
/14
Se
p/1
4D
ec/1
4M
ar/
15
Jun
/15
JPY
7,20
7,40
7,60
7,80
8,00
8,20
8,40
8,60
8,80
9,00
9,20
Jun
/12
Se
p/1
2D
ec/1
2M
ar/
13
Jun
/13
Se
p/1
3D
ec/1
3M
ar/
14
Jun
/14
Se
p/1
4D
ec/1
4M
ar/
15
Jun
/15
NOK

19
MONTHLY HIGHLIGHTS | NO. 6/2015
European Market Observatory for Fisheries and Aquaculture Products
EUMOFA Monthly Highlights is published by the Directorate–General for Maritime Affairs and Fisheries of the European Commission. Editor: European Commission, Directorate–General for Maritime Affairs and Fisheries, Director–General. Disclaimer: Although the Maritime Affairs and Fisheries Directorate General is responsible for the overall production of this publication, the views and conclusions presented in this report reflect the opinion of the author(s) and do not necessarily reflect the opinion of the Commission or its officers. © European Union, 2015 KL–AK–15–006–EN–N Photographs ©Eurofish. Reproduction is authorised, provided the source is acknowledged.
FOR MORE INFORMATION AND COMMENTS:
Directorate–General for Maritime Affairs and Fisheries B–1049 Brussels Tel: +32 229–50101 Email: contact–[email protected]
First sales: EUMOFA. Data analysed refers to the month
January-April 2015 and April 2015.
Global supply: European Commission, Directorate-
General for Maritime Affairs and Fisheries (DG MARE);
European Council; MSC; FOS; ASC; Statistics Iceland;
www.fishupdate.com; EUMOFA; Norwegian Seafood
Council.
Case study: EUMOFA; DOOR; DG AGRI; Scottish
Salmon Producers Organisation; Agreste; EUROSTAT.
Consumption: EUMOFA; Seafish; www.lesechos.fr
Macroeconomic context: EUROSTAT; ECB, Chamber of
Commerce of Forlì-Cesena, Italy; DPMA, France; ARVI, Spain;
MABUX.
The underlying first-sales data is in a separate Annex available
on the EUMOFA website.
THIS REPORT HAS BEEN COMPILED USING EUMOFA DATA AND THE FOLLOWING SOURCES:
The European Market Observatory for Fisheries and
Aquaculture Products (EUMOFA) was developed by the
European Commission, representing one of the tools of the
new Market Policy in the framework of the reform of the
Common Fisheries Policy. [Regulation (EU) No 1379/2013
art. 42].
As a market intelligence tool, EUMOFA provides regular
weekly prices, monthly market trends, and annual structural
data along the supply chain.
The database is based on data provided and validated by
Member States and European institutions. It is available in four
languages: English, French, German, and Spanish.
EUMOFA website is publicly available at the following address:
www.eumofa.eu.
20
MONTHLY HIGHLIGHTS | NO. 6/2015
European Market Observatory for Fisheries and Aquaculture Products
6. Endnotes 1 Bivalves and other molluscs and aquatic invertebrates, cephalopods, crustaceans, flatfish, freshwater fish, groundfish, other marine fish, salmonids, small pelagics, and tuna and tuna-like species.
2 http://www.puertos.es/es-es/estadisticas/Paginas/estadistica_mensual.aspx
3 http://www.developpement-durable.gouv.fr/IMG/pdf/chiffres-cles-2014-V7.pdf
4 http://ices.dk/sites/pub/Publication%20Reports/Advice/Popular%20advice/bss-47_popular.pdf
5 http://www.seafish.org/research-economics/market-insight/market-summary
6 https://www.gov.uk/government/uploads/system/uploads/attachment_data/file/429316/Monthly_UK_Sea_Fisheries_Statistics_-_March_2015.pdf
7 http://www.fao.org/fishery/species/3516/en
8 https://www.gov.uk/government/consultations/consultation-into-conducting-a-scallop-demersal-effort-swap-with-the-netherlands-february-2015
9 http://www.fao.org/fishery/species/3022/en
10 http://www.fao.org/fishery/species/3022/en
11 http://www.seafish.org/media/publications/SeafishResponsibleSourcingGuide_Whiting_201305.pdf
12 DG MARE.
13 http://ec.europa.eu/information_society/newsroom/cf/mare/itemlongdetail.cfm?item_id=24095&subweb=343&lang=en
14 http://ec.europa.eu/information_society/newsroom/cf/mare/itemlongdetail.cfm?item_id=23943&subweb=343&lang=en
15 http://ec.europa.eu/information_society/newsroom/cf/mare/itemlongdetail.cfm?item_id=23850&subweb=343&lang=en
16 http://www.statice.is/Pages/444?NewsID=11264
17 http://www.fishupdate.com/iceland-speeds-up-fish-farming-growth/
18 https://www.msc.org/newsroom/news/cornish-hake-is-msc-certified-as-sustainable?fromsearch=1&isnewssearch=1
19 http://www.friendofthesea.org/news-doc.asp?CAT=1&ID=838&page=
20 http://www.asc-aqua.org/index.cfm?act=update.detail&uid=301&lng=1
21 EUMOFA.
22 http://en.seafood.no/News-and-media/News-archive/Press-releases/Clipfish-contributes-to-record-exports-in-May
23 http://www.consilium.europa.eu/en/meetings/agrifish/2015/06/14/
24 http://ec.europa.eu/agriculture/external-studies/value-gi_en.htm
25 http://ec.europa.eu/agriculture/quality/door/list.html?locale=en
26 AND study for DG AGRI and EUMOFA.
27 Ibidem.
28 The total is higher than 41 because “Traditional Grimsby Smoked Fish” covers both cod and haddock.
29 EUMOFA.
30 Scottish Salmon Producers Organisation, Annual report.
31 EUMOFA.
32 French Ministry for Agriculture, Agreste.
33 EUROSTAT.
34 http://www.lesechos.fr/journal20150611/lec2_industrie_et_services/021126023412-les-menages-francais-levent-le-pied-sur-la-consommation-de-poisson-1127178.php?z22F6meCXxzVRWrO.99
35 Seafish.
36 Estimated provisional.
37 Eurostatistics – Data for short-term economic analysis, Issue number 6/2015. http://ec.europa.eu/eurostat/documents/3217494/6885748/KS-BJ-15-006-EN-N/9952cda7-b9c4-4cc7-a2fb-fc873d67bbb6
38 Ibidem. European Central Bank, Economic Bulletin Issue 4/2015. https://www.ecb.europa.eu/pub/pdf/ecbu/eb201504.en.pdf?1ab1ac390dc60e25297ead66e7930567