Embed Size (px)
Citation preview

Monthly Report9/30/2017Account
Walla Walla County

■ ■ ■ ■
Market Commentary .......................................................................................................................................................................... 1 Account Summary .............................................................................................................................................................................. 2 Total Return ....................................................................................................................................................................................... 5 Portfolio Holdings ............................................................................................................................................................................. 10 NAV .................................................................................................................................................................................................. 19 Disclaimer ........................................................................................................................................................................................ 20

MONTH END COMMENTARY – SEPTEMBER 2017 Yields were higher in September with the two-year Treasury reaching 1.49%, its highest level since October 2008. The total return for the two-year Treasury for the month was a substantially negative -.17%. Also contributing to higher Treasury yields in September were several hawkish comments from Fed members. The Fed is determined to institute one more rate hike this year, barring any geopolitical surprises or weak inflation data. Stocks continued their upward momentum and the Dow Jones Industrial average reached an all-time high.
FOMC: As expected, the Fed kept the federal funds target rate unchanged at between 1.00% and 1.25%. “In view of realized and expected labor market conditions and inflation, the Committee decided to maintain the target range for the federal funds rate at 1 to 1-1/4%.” Also expected was the Fed announcement of the unwinding of its $4.5 trillion balance sheet. This will begin in October as described at the June meeting. The Fed did remark about the current hurricanes, but expressed little concern about the long-term economic effect, “Storm-related disruptions and rebuilding will affect economic activity in the near term, but past experience suggests that the storms are unlikely to materially alter the course of the national economy over the medium term.”
In terms of future forecasts, the FOMC members generally stayed with their forecasts from June. The GDP growth rate forecast was increased from 2.2% to 2.4% this year and from 1.9% to 2.00% in 2019.They also reduced slightly the forecast unemployment rate for 2018 and 2019. The fed funds futures market is currently pricing in a 70% chance of a rate hike in December.
Non-farm Payrolls/Unemployment: Non-farm payrolls increased by 156,000 in August, below a downwardly revised 189,000 in July and lower than market expectations of 180,000. Job gains occurred in manufacturing, construction, professional and technical services, health care and mining. The unemployment rate increased .1% to 4.4% and the participation rate was unchanged at 62.9%. Average hourly earnings were up .1% vs. an increase of .3% in July.
Retail Sales: Retail sales were down .3% from July 2017 and up 3.3% from last year.
GDP: Second quarter GDP was strong, at an as-expected 3.1% annualized rate for the third estimate driven by consumer spending at a 3.3% rate. Non-residential fixed investment at 6.7% was also a strong contributor which offset a 7.3% decline for residential investment. The percentage change in real GDP was revised from the advance estimate, reflecting upward revisions to nonresidential fixed investment that was partly offset by a downward revision to state and local government spending. The report confirmed that the economy was showing solid strength going into the third quarter.
Strategy going forward: GPA will continue to look for opportunities to extend portfolios to within 90% to 100% of each portfolio’s benchmark duration. Credit spreads remain tight. Both taxable municipal bonds and high-quality corporates are trading tight vs. Treasuries as demand remains high for credit investments. We will also look to add callable bonds as spreads between bullets and callables have widened. The debt ceiling has been raised until December 8, 2017. We are currently not seeing any market anomalies in the short Treasury bill market around the December 8th date.
Treasury Yield Curve Total Returns over the last 12 months:* TREASURY BENCHMARK TOTAL RETURNS IN MONTH* 3month bill 0.66 Benchmark Period Return Duration 1 year note 0.60 BAML 0-3 Year Treasury -0.09% 1.402 year note -0.02 BAML 0-5 Year Treasury -0.25% 2.203 year note -0.31 BAML 1-3 Year Treasury -0.16% 1.855 year note -1.94 BAML 1-5 Year Treasury -0.34% 2.65
Changes in the Treasury Market (absolute yield levels): * 09/30/16 07/31/17 08/31/17 09/30/17 Change in
September Change from
Prior Year 3 month bill .28 1.08 .99 1.05 +.06 +.77 6 month bill .43 1.13 1.08 1.19 +.11 +.76 2 year note .76 1.35 1.33 1.49 +.16 +.73 3 year note .88 1.51 1.43 1.62 +.19 +.74
5 year note 1.15 1.84 1.70 1.94 +.24 +.79 10 year 1.60 2.30 2.12 2.33 +.21 +.73
*Source: Bloomberg1

Walla Walla County US Dollar 9/30/2017 logo.jpg Account Summary - SetFixed Income Allocation
Security Type Market Value % Assets
US Agency (USD) 51,560,736.02 59.1
Municipal (USD) 18,236,271.63 20.9
US Treasury (USD) 5,990,871.00 6.9
LGIP State Pool (USD) 5,034,838.90 5.8
Bank or Cash Deposit (USD) 6,395,358.59 7.3
Fixed Income Total 87,218,076.14 100.0
Par Value 87,069,938
Market Value 87,218,076.14
Amortized Book Value 87,432,932.06
Unrealized Gain/Loss -214,855.92
Estimated Annual Cash Flow 1,293,034.81
Fixed Income Totals
Book Yield 1.22
Maturity 1.31
Coupon 1.50
Moody Aa1
S&P AA
Weighted Averages
Walla Walla County
Account Summary9/30/2017
2

Portfolio SummarySeptember 30, 2017
Portfolio Par Total Original Total Adjusted Market Unrealized Yield Mod Eff Bench
Name Amount Cost Cost Value Gain/Loss At Cost Dur Dur Dur Benchmark
Walla Walla County 87,069,938 87,698,138.97 87,432,932.06 87,218,076.14 -214,855.92 1.22 1.26 1.11 1.40 BofA Merrill 0-3 Treasury
TOTAL PORTFOLIO 87,069,938 87,698,138.97 87,432,932.06 87,218,076.14 -214,855.92 1.22 1.26 1.11 1.40
3

Walla Walla County
Accrual Earnings and Activity 9/30/2017
US Dollar
Cost Basis Summary Accrual Earnings SummaryMonth End
Ending 9/30/2017Fiscal
Year-to-Date12/31/2016
Beginning Amortized Cost 87,755,196.04 82,546,461.93
Investment Purchases 6,715,763.46 25,846,594.88
Investment Maturities/Sells/Calls 0.00 (15,711,164.19)
Amortization (18,598.89) (188,111.94)
Change in Cash Equivalents (7,019,428.55) (5,060,559.01)
Realized Gains / Losses 0.00 (289.61)
Ending Amortized Costs 87,432,932.06 87,432,932.06
Month EndEnding 9/30/2017
FiscalYear-to-Date12/31/2016
Amortization/Accretion (18,598.89) (188,111.94)
Interest Earned 101,096.33 897,526.24
Realized Gain (Loss) 0.00 (289.61)
Total Income 82,497.44 709,124.69
Average Portfolio Balance 88,910,988.74 87,268,611.75
Earnings Yield 1.13% 1.09%
MarketValue Summary Interest Earnings SummaryAs of
9/30/2017Ending Market Value 87,218,076.14
Unrealized Gain/Loss (214,855.92)
Net Asset Value (NAV) 0.9975
Month EndEnding 9/30/2017
FiscalYear-to-Date12/31/2016
Beginning Accrued Interest 287,060.28 351,959.68
Coupons Paid 44,581.35 718,613.30
Purchased Accrued Interest (32,419.39) (72,916.78)
Sold Accrued Interest 0.00 227,794.74
Ending Accrued Interest 375,994.66 375,994.66
Interest Earned 101,096.33 897,526.24
4
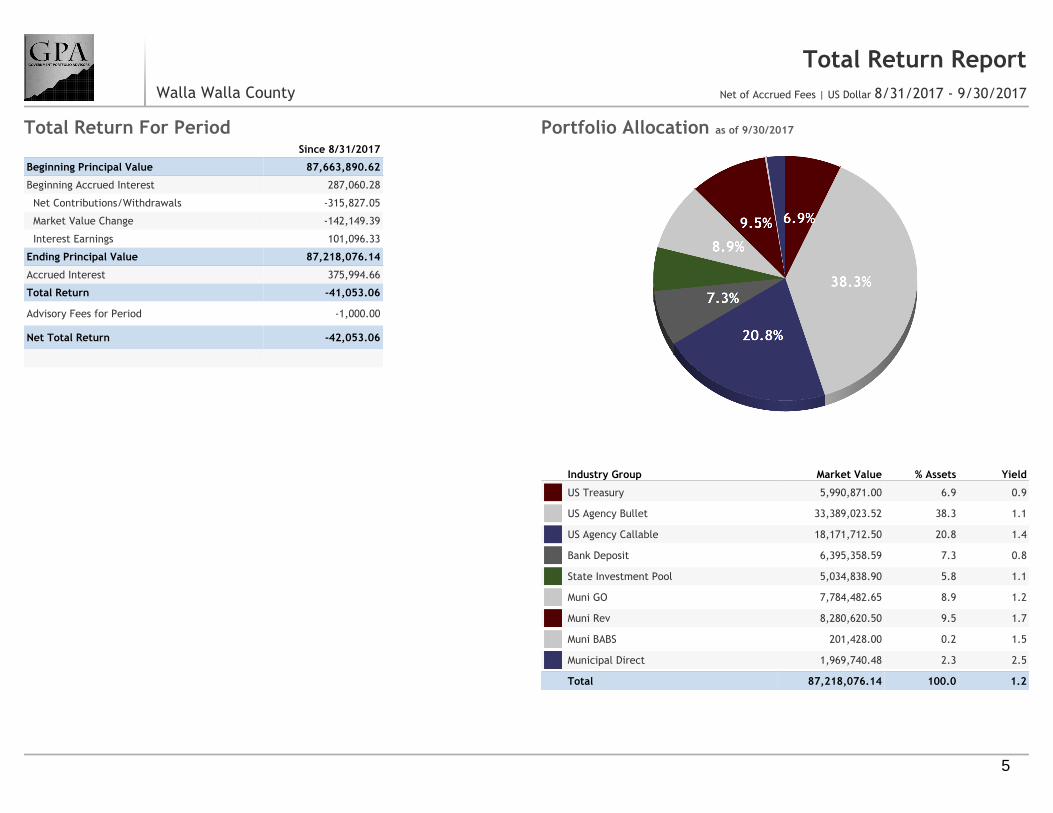
Walla Walla County Net of Accrued Fees | U 8/31/2017 - 9/30/2017 logo.jpg Total Return Report - SPortfolio Allocation as of 9/30/2017
Industry Group Market Value % Assets Yield
US Treasury 5,990,871.00 6.9 0.9
US Agency Bullet 33,389,023.52 38.3 1.1
US Agency Callable 18,171,712.50 20.8 1.4
Bank Deposit 6,395,358.59 7.3 0.8
State Investment Pool 5,034,838.90 5.8 1.1
Muni GO 7,784,482.65 8.9 1.2
Muni Rev 8,280,620.50 9.5 1.7
Muni BABS 201,428.00 0.2 1.5
Municipal Direct 1,969,740.48 2.3 2.5
Total 87,218,076.14 100.0 1.2
Total Return For PeriodSince 8/31/2017
Beginning Principal Value 87,663,890.62
Beginning Accrued Interest 287,060.28
Net Contributions/Withdrawals -315,827.05
Market Value Change -142,149.39
Interest Earnings 101,096.33
Ending Principal Value 87,218,076.14
Accrued Interest 375,994.66
Total Return -41,053.06
Advisory Fees for Period -1,000.00
Net Total Return -42,053.06
Walla Walla County
Total Return ReportNet of Accrued Fees | US Dollar 8/31/2017 - 9/30/2017
5

Walla Walla County Net of Accrued Fees | US D 9/30/2017 logo.jpg Historical P
Time Weighted Return Inception (12/31/2014) to Date
PortfolioMonth
To DateQuarterTo Date
Fiscal YearTo Date
AnnualizedInception
To DateAccount -0.05 0.28 0.84 1.03
Index
ML 0-3 Year Treasury Index -0.09 0.26 0.65 0.68
ML 0-1 Year Treasury 0.07 0.30 0.61 0.50
Performance History
Walla Walla County
Historical PerformanceNet of Accrued Fees | US Dollar 9/30/2017
6

Walla Walla County Net of Accrued Fees | U 8/31/2017 - 9/30/2017 logo.jpg Allocation By Issuer - SPortfolio Allocation as of 9/30/2017
Issuer Market Value % Assets Yield
FEDERAL NATL MTG ASSN 8,981,850.00 10.3 1.0
FEDERAL HOME LOAN BANKS 16,165,858.52 18.5 1.2
FEDERAL FARM CR BKS 8,961,180.00 10.3 1.3
FEDERAL HOME LN MTG CORP 15,197,494.50 17.4 1.1
FEDERAL AGRIC MTG CORP 2,254,353.00 2.6 2.0
UNITED STATES TREAS NTS 5,990,871.00 6.9 0.9
ENERGY NW WA ELEC REVENUE 2,009,300.00 2.3 1.4
GRANT CNTY PUB UTIL 201,428.00 0.2 1.5
UNIV OF WASHINGTON 2,969,169.00 3.4 1.8
ENERGY NORTHWEST WASH ELEC REV 2,032,280.00 2.3 1.8
GRANT CNTY WA PUB UTIL DIST 485,334.65 0.6 2.0
PUYALLUP WASH 389,933.70 0.4 1.3
WA LGIP 5,034,838.90 5.8 1.1
UMPQUA BANK 1,007,634.23 1.2 0.9
ADA & CANYON CNTYS ID JT SD 1,853,319.85 2.1 1.2
BAKER BOYER 1,355,000.00 1.6 0.1
WALLA WALLA COUNTY BONDS 1,969,740.48 2.3 2.5
OREGON SCHOOL BOARD 677,124.00 0.8 1.5
CITY OF TACOMA WA 784,536.85 0.9 1.1
NORTH SLOPE BORO ALASKA 1,262,214.60 1.4 1.1
CA ST PUB WKS BD LS 1,437,650.50 1.6 1.1
TACOMA METROPOLITAN PARK DISTRICT 2,164,240.00 2.5 1.1
WASHINGTON FEDERAL BANK 4,032,724.36 4.6 1.1
Total 87,218,076.14 100.0 1.2
Walla Walla County
Allocation By Issuer8/31/2017 - 9/30/2017
7

Walla Walla County US Dollar 9/30/2017 logo.jpg Maturity & Duration Dist
Maturity Number Market Value% FI
HoldingsAverage
Curr. YldAverageCoupon
AverageDuration
Under 1 Yr 25 42,364,352.54 48.6 1.2 1.161% 0.4
1 Yr - 2 Yrs 18 28,288,077.05 32.4 1.5 1.508% 1.4
2 Yrs - 3 Yrs 4 8,650,057.00 9.9 2.5 2.649% 2.2
3 Yrs - 5 Yrs 3 5,233,651.80 6.0 1.9 1.845% 4.0
5 Yrs - 10 Yrs 4 2,681,937.75 3.1 2.3 2.331% 5.0
Distribution by Maturity Distribution by Maturity
Duration Number Market Value% FI
HoldingsAverage
Curr. YldAverageCoupon
AverageDuration
Under 1 Yr 26 42,880,841.47 49.2 1.2 1.195% 0.4
1 Yr - 2 Yrs 17 27,771,588.12 31.8 1.4 1.461% 1.4
2 Yrs - 3 Yrs 4 8,650,057.00 9.9 2.5 2.649% 2.2
3 Yrs - 5 Yrs 5 7,727,975.80 8.9 2.0 1.981% 4.3
5 Yrs - 10 Yrs 2 187,613.75 0.2 3.2 3.157% 7.3
Distribution by Duration Distribution by Duration
Walla Walla County
Maturity & Duration Distribution9/30/2017
8

Walla Walla County US Dollar 9/30/2017 logo.jpg Ratings Distribution - Se
S&P Rating Number Market Value% FI
HoldingsAverage
YTMAverageCoupon
AverageDuration
AA+ 34 60,119,742.87 68.9 1.4 1.286% 1.3
AA 7 6,725,338.30 7.7 1.4 3.464% 1.3
AA- 3 4,718,704.00 5.4 1.8 2.057% 1.7
N/A 8 13,399,937.97 15.4 1.2 1.187% 0.6
NR 2 2,254,353.00 2.6 2.0 1.953% 3.8
Distribution by S&P Rating Distribution by S&P Rating
Moody Rating Number Market Value% FI
HoldingsAverage
YTMAverageCoupon
AverageDuration
Aaa 33 58,266,423.02 66.8 1.5 1.200% 1.3
Aa1 3 5,894,899.85 6.8 1.5 2.904% 1.4
Aa2 5 6,325,765.95 7.3 1.4 3.305% 1.5
Aa3 2 686,762.65 0.8 1.7 2.700% 0.3
N/A 8 13,399,937.97 15.4 1.2 1.187% 0.6
NR 3 2,644,286.70 3.0 1.9 1.866% 3.2
Distribution by Moody Rating Distribution by Moody Rating
Walla Walla County
Ratings Distribution9/30/2017
9

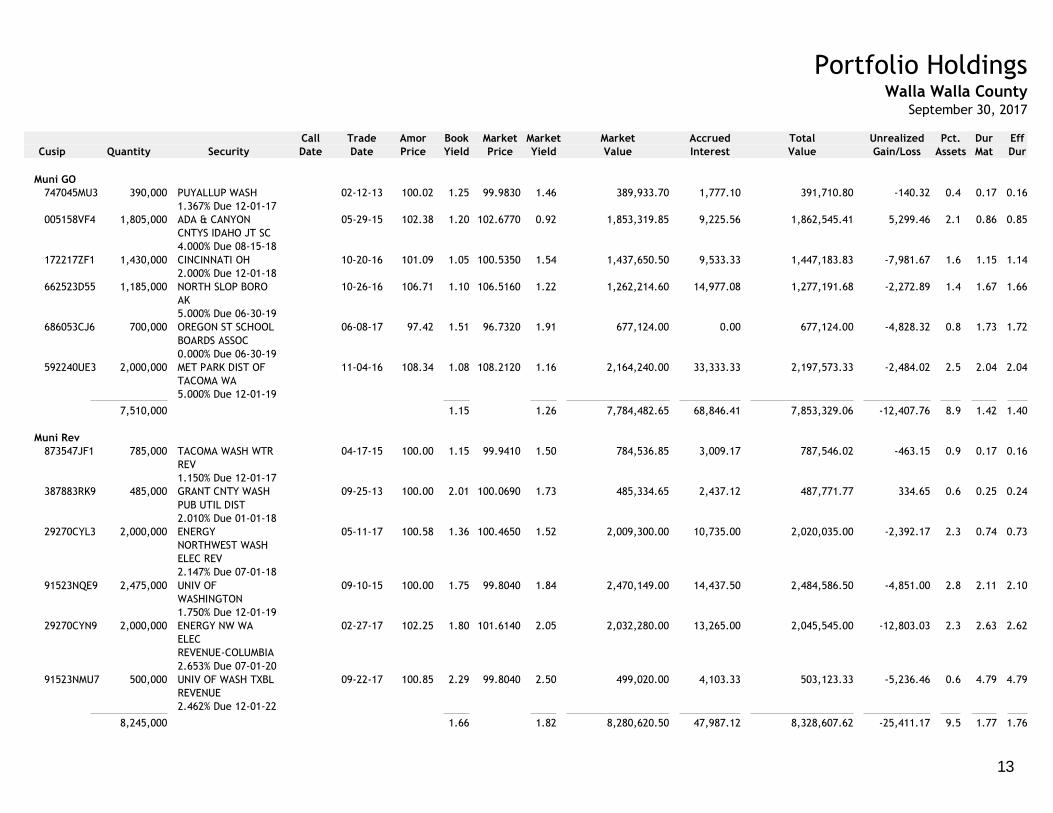
Portfolio HoldingsWalla Walla County
September 30, 2017
Call Trade Amor Book Market Market Market Accrued Total Unrealized Pct. Dur Eff
Cusip Quantity Security Date Date Price Yield Price Yield Value Interest Value Gain/Loss Assets Mat Dur
US Treasury
912828UA6 1,000,000 UNITED STATES
TREAS NTS
04-24-15 99.99 0.71 99.9232 1.08 999,232.00 2,100.41 1,001,332.41 -624.54 1.1 0.17 0.16
0.625% Due 11-30-17
912828VE7 2,000,000 UNITED STATES
TREAS NTS
10-28-15 100.07 0.89 99.8281 1.26 1,996,562.00 6,721.31 2,003,283.31 -4,882.61 2.3 0.66 0.65
1.000% Due 05-31-18
912828A34 3,000,000 UNITED STATES
TREAS NTS
04-24-15 100.23 1.05 99.8359 1.39 2,995,077.00 12,602.46 3,007,679.46 -11,798.56 3.4 1.15 1.14
1.250% Due 11-30-18
6,000,000 0.94 1.30 5,990,871.00 21,424.18 6,012,295.18 -17,305.71 6.9 0.82 0.81
US Agency Bullet
3130A4Q70 2,000,000 FEDERAL HOME
LOAN BANKS
04-08-15 100.03 0.80 99.9867 1.10 1,999,734.00 7,444.44 2,007,178.44 -767.42 2.3 0.13 0.12
1.000% Due 11-17-17
3130A6SA6 2,000,000 FEDERAL HOME
LOAN BANKS
11-17-15 100.00 0.95 99.9834 1.06 1,999,668.00 6,997.78 2,006,665.78 -319.11 2.3 0.13 0.12
0.940% Due 11-17-17
3136G1LZ0 1,000,000 FEDERAL NATL MTG
ASSN
10-28-15 100.00 0.78 99.9260 1.21 999,260.00 2,562.50 1,001,822.50 -695.37 1.1 0.16 0.15
0.750% Due 11-28-17
3137EADN6 1,000,000 FEDERAL HOME LN
MTG CORP
06-11-14 99.87 1.22 99.8831 1.16 998,831.00 1,645.83 1,000,476.83 115.72 1.1 0.28 0.27
0.750% Due 01-12-18
3133EGDN2 2,000,000 FEDERAL FARM CR
BKS
04-19-17 99.92 1.09 99.8888 1.16 1,997,776.00 1,450.00 1,999,226.00 -636.66 2.3 0.42 0.41
0.900% Due 03-02-18
3137EADP1 2,000,000 FEDERAL HOME LN
MTG CORP
10-20-16 100.03 0.81 99.8578 1.20 1,997,156.00 1,166.67 1,998,322.67 -3,410.26 2.3 0.43 0.42
0.875% Due 03-07-18
31315PZZ5 250,000 FEDERAL AGRIC MTG
CORP
11-08-13 99.64 1.61 99.7980 1.23 249,495.00 117.64 249,612.64 383.18 0.3 0.44 0.43
0.770% Due 03-09-18
3134G8XA2 2,000,000 FEDERAL HOME LN
MTG CORP
04-26-16 99.99 1.02 99.7320 1.33 1,994,640.00 8,555.56 2,003,195.56 -5,104.93 2.3 0.81 0.80
1.000% Due 07-27-18
3135G0L68 2,000,000 FEDERAL NATL MTG
ASSN
10-21-16 99.87 0.91 99.5443 1.31 1,990,886.00 2,666.67 1,993,552.67 -6,545.31 2.3 0.82 0.81
0.750% Due 07-27-18
10

Portfolio HoldingsWalla Walla County
September 30, 2017
Call Trade Amor Book Market Market Market Accrued Total Unrealized Pct. Dur Eff
Cusip Quantity Security Date Date Price Yield Price Yield Value Interest Value Gain/Loss Assets Mat Dur
3134G44S4 1,000,000 FEDERAL HOME LN
MTG CORP
05-18-16 100.00 1.00 99.5009 1.43 995,009.00 3,388.89 998,397.89 -4,977.26 1.1 1.15 1.14
1.000% Due 11-29-18
313381GB5 1,000,000 FEDERAL HOME
LOAN BANKS
05-16-16 100.11 0.91 99.5415 1.40 995,415.00 3,361.11 998,776.11 -5,647.61 1.1 1.15 1.14
1.000% Due 11-30-18
3133EFX51 2,000,000 FEDERAL FARM CR
BKS
05-16-16 100.07 0.95 99.3767 1.50 1,987,534.00 4,666.67 1,992,200.67 -13,835.92 2.3 1.25 1.25
1.000% Due 01-07-19
3136G3YL3 2,000,000 FEDERAL NATL MTG
ASSN
08-02-16 99.89 0.98 99.1900 1.52 1,983,800.00 3,300.00 1,987,100.00 -14,023.71 2.3 1.30 1.30
0.900% Due 01-25-19
3133EF3V7 2,000,000 FEDERAL FARM CR
BKS
08-02-16 100.03 0.85 99.2270 1.44 1,984,540.00 2,236.11 1,986,776.11 -16,087.07 2.3 1.36 1.35
0.875% Due 02-15-19
3135G0ZA4 2,000,000 FEDERAL NATL MTG
ASSN
04-19-17 100.87 1.23 100.5563 1.47 2,011,126.00 4,375.00 2,015,501.00 -6,364.68 2.3 1.36 1.36
1.875% Due 02-19-19
3133782M2 2,000,000 FEDERAL HOME
LOAN BANKS
04-19-17 100.33 1.27 100.0425 1.47 2,000,850.00 1,916.67 2,002,766.67 -5,699.43 2.3 1.42 1.41
1.500% Due 03-08-19
313379EE5 2,000,000 FEDERAL HOME
LOAN BANKS
09-27-17 100.21 1.50 100.1652 1.53 2,003,304.00 9,659.72 2,012,963.72 -822.73 2.3 1.67 1.66
1.625% Due 06-14-19
3130ABZX7 1,215,000 FEDERAL HOME
LOAN BANKS
09-28-17 99.80 1.52 99.7328 1.56 1,211,753.52 2,569.72 1,214,323.24 -876.95 1.4 1.82 1.81
1.410% Due 08-07-19
3134G9KF3 2,000,000 FEDERAL HOME LN
MTG CORP
05-18-16 99.93 1.23 99.1694 1.59 1,983,388.00 8,400.00 1,991,788.00 -15,262.72 2.3 2.11 2.10
1.200% Due 11-25-19
3132X0PX3 2,000,000 FEDERAL AGRIC MTG
CORP
02-16-17 100.15 2.06 100.2429 2.04 2,004,858.00 4,433.33 2,009,291.33 1,779.92 2.3 4.17 4.17
2.100% Due 02-23-22
33,465,000 1.12 1.40 33,389,023.52 80,914.31 33,469,937.83 -98,798.34 38.3 1.19 1.18
US Agency Callable
3130A7SQ9 2,000,000 FEDERAL HOME LN
BKS
10-26-17 04-25-16 100.00 0.91 99.8826 1.26 1,997,652.00 3,250.00 2,000,902.00 -2,348.00 2.3 0.32 0.24
0.900% Due 01-26-18
3134G8M71 2,000,000 FEDERAL HOME LN
MTG CORP
11-26-17 04-19-17 100.00 1.05 99.9153 1.26 1,998,306.00 2,041.67 2,000,347.67 -1,694.00 2.3 0.40 0.36
1.050% Due 02-26-18
11

Portfolio HoldingsWalla Walla County
September 30, 2017
Call Trade Amor Book Market Market Market Accrued Total Unrealized Pct. Dur Eff
Cusip Quantity Security Date Date Price Yield Price Yield Value Interest Value Gain/Loss Assets Mat Dur
3135G0XK4 2,000,000 FEDERAL NATL MTG
ASSN
11-25-17 05-30-13 100.00 1.07 99.8389 1.30 1,996,778.00 7,350.00 2,004,128.00 -3,222.00 2.3 0.65 0.63
1.050% Due 05-25-18
3130A96A4 2,000,000 FEDERAL HOME
LOAN BANKS
12-15-17 08-29-16 100.00 1.00 99.7163 1.40 1,994,326.00 5,888.89 2,000,214.89 -5,674.00 2.3 0.70 0.56
1.000% Due 06-15-18
3134G9JK4 1,000,000 FEDERAL HOME LN
MTG CORP
11-26-17 05-16-16 100.00 1.12 99.5379 1.53 995,379.00 3,906.25 999,285.25 -4,621.00 1.1 1.14 1.07
1.125% Due 11-26-18
3134G9MU8 2,000,000 FEDERAL HOME LN
MTG CORP
11-24-17 05-17-16 100.00 1.30 99.6760 1.50 1,993,520.00 9,172.22 2,002,692.22 -6,480.00 2.3 1.62 1.18
1.300% Due 05-24-19
3134GBEW8 2,250,000 FEDERAL HOME LN
MTG CORP
04-26-18 04-12-17 100.00 1.50 99.6118 1.72 2,241,265.50 14,531.25 2,255,796.75 -8,734.50 2.6 1.78 1.26
1.500% Due 07-26-19
3133EF5V5 1,000,000 FEDERAL FARM CR
BKS
10-02-17 09-28-17 99.67 1.53 99.6026 1.57 996,026.00 2,212.50 998,238.50 -713.72 1.1 1.80 1.21
1.350% Due 08-02-19
3130A9Z46 2,000,000 FEDERAL HOME
LOAN BANKS
11-26-17 11-15-16 99.40 1.75 98.1578 2.06 1,963,156.00 11,111.11 1,974,267.11 -24,773.82 2.3 3.97 2.52
1.600% Due 11-26-21
3133EHKT9 2,000,000 FEDERAL FARM CR
BKS
10-25-17 09-21-17 99.90 2.24 99.7652 2.27 1,995,304.00 15,540.00 2,010,844.00 -2,705.53 2.3 4.81 1.74
2.220% Due 11-25-22
18,250,000 1.35 1.59 18,171,712.50 75,003.89 18,246,716.39 -60,966.57 20.8 1.74 1.07
Bank Deposit
SYS117600 1,355,000 BAKER BOYER BANK 12-31-15 100.00 0.10 100.0000 0.10 1,355,000.00 0.00 1,355,000.00 0.00 1.6 0.08 0.05
0.100% Due 10-29-17
SYSUMPQ11 1,007,634 UMPQUA BANK MMF 12-31-15 100.00 0.88 100.0000 0.88 1,007,634.23 0.00 1,007,634.23 0.00 1.2 0.08 0.05
0.880% Due 10-29-17
000WAFED3 4,032,724 WASHINGTON
FEDERAL
03-14-17 100.00 1.05 100.0000 1.05 4,032,724.36 0.00 4,032,724.36 0.00 4.6 0.08 0.05
1.050% Due 10-29-17
6,395,359 0.82 0.82 6,395,358.59 0.00 6,395,358.59 0.00 7.3 0.08 0.05
State Investment Pool
WAPOOL 5,034,839 WASHINGTON LGIP 12-31-15 100.00 1.13 100.0000 1.13 5,034,838.90 0.00 5,034,838.90 0.00 5.8 0.08 0.05
1.129% Due 10-29-17
12
Portfolio HoldingsWalla Walla County
September 30, 2017
Call Trade Amor Book Market Market Market Accrued Total Unrealized Pct. Dur Eff
Cusip Quantity Security Date Date Price Yield Price Yield Value Interest Value Gain/Loss Assets Mat Dur
Muni GO
747045MU3 390,000 PUYALLUP WASH 02-12-13 100.02 1.25 99.9830 1.46 389,933.70 1,777.10 391,710.80 -140.32 0.4 0.17 0.16
1.367% Due 12-01-17
005158VF4 1,805,000 ADA & CANYON
CNTYS IDAHO JT SC
05-29-15 102.38 1.20 102.6770 0.92 1,853,319.85 9,225.56 1,862,545.41 5,299.46 2.1 0.86 0.85
4.000% Due 08-15-18
172217ZF1 1,430,000 CINCINNATI OH 10-20-16 101.09 1.05 100.5350 1.54 1,437,650.50 9,533.33 1,447,183.83 -7,981.67 1.6 1.15 1.14
2.000% Due 12-01-18
662523D55 1,185,000 NORTH SLOP BORO
AK
10-26-16 106.71 1.10 106.5160 1.22 1,262,214.60 14,977.08 1,277,191.68 -2,272.89 1.4 1.67 1.66
5.000% Due 06-30-19
686053CJ6 700,000 OREGON ST SCHOOL
BOARDS ASSOC
06-08-17 97.42 1.51 96.7320 1.91 677,124.00 0.00 677,124.00 -4,828.32 0.8 1.73 1.72
0.000% Due 06-30-19
592240UE3 2,000,000 MET PARK DIST OF
TACOMA WA
11-04-16 108.34 1.08 108.2120 1.16 2,164,240.00 33,333.33 2,197,573.33 -2,484.02 2.5 2.04 2.04
5.000% Due 12-01-19
7,510,000 1.15 1.26 7,784,482.65 68,846.41 7,853,329.06 -12,407.76 8.9 1.42 1.40
Muni Rev
873547JF1 785,000 TACOMA WASH WTR
REV
04-17-15 100.00 1.15 99.9410 1.50 784,536.85 3,009.17 787,546.02 -463.15 0.9 0.17 0.16
1.150% Due 12-01-17
387883RK9 485,000 GRANT CNTY WASH
PUB UTIL DIST
09-25-13 100.00 2.01 100.0690 1.73 485,334.65 2,437.12 487,771.77 334.65 0.6 0.25 0.24
2.010% Due 01-01-18
29270CYL3 2,000,000 ENERGY
NORTHWEST WASH
ELEC REV
05-11-17 100.58 1.36 100.4650 1.52 2,009,300.00 10,735.00 2,020,035.00 -2,392.17 2.3 0.74 0.73
2.147% Due 07-01-18
91523NQE9 2,475,000 UNIV OF
WASHINGTON
09-10-15 100.00 1.75 99.8040 1.84 2,470,149.00 14,437.50 2,484,586.50 -4,851.00 2.8 2.11 2.10
1.750% Due 12-01-19
29270CYN9 2,000,000 ENERGY NW WA
ELEC
REVENUE-COLUMBIA
02-27-17 102.25 1.80 101.6140 2.05 2,032,280.00 13,265.00 2,045,545.00 -12,803.03 2.3 2.63 2.62
2.653% Due 07-01-20
91523NMU7 500,000 UNIV OF WASH TXBL
REVENUE
09-22-17 100.85 2.29 99.8040 2.50 499,020.00 4,103.33 503,123.33 -5,236.46 0.6 4.79 4.79
2.462% Due 12-01-22
8,245,000 1.66 1.82 8,280,620.50 47,987.12 8,328,607.62 -25,411.17 9.5 1.77 1.76
13

Portfolio HoldingsWalla Walla County
September 30, 2017
Call Trade Amor Book Market Market Market Accrued Total Unrealized Pct. Dur Eff
Cusip Quantity Security Date Date Price Yield Price Yield Value Interest Value Gain/Loss Assets Mat Dur
Muni BABS
387883PC9 200,000 GRANT CNTY WASH
PUB UTIL DIST
10-08-14 100.70 1.50 100.7140 1.51 201,428.00 2,180.50 203,608.50 33.63 0.2 0.25 0.24
4.361% Due 01-01-18
Municipal Direct
WWCO1 516,489 WALLA WALLA
COUNTY
10-01-09 100.00 4.00 100.0000 3.60 516,488.93 56,871.17 573,360.10 0.00 0.6 0.97 0.94
4.000% Due 10-01-18
JAIL 2016 1,265,638 WALLA WALLA
COUNTY
12-01-16 100.00 1.82 100.0000 1.79 1,265,637.80 19,195.51 1,284,833.31 0.00 1.5 3.88 3.86
1.820% Due 12-01-21
FAIR12820 89,861 WALLA WALLA
COUNTY
12-08-16 100.00 3.07 100.0000 2.99 89,861.33 2,243.12 92,104.45 0.00 0.1 7.21 7.19
3.067% Due 12-08-26
FAIR2012B 97,752 WALLA WALLA
COUNTY
04-30-17 100.00 3.24 100.0000 3.20 97,752.42 1,328.46 99,080.88 0.00 0.1 7.34 7.32
3.240% Due 04-30-27
1,969,740 2.52 2.39 1,969,740.48 79,638.25 2,049,378.73 0.00 2.3 3.44 3.42
TOTAL 87,069,938 1.22 1.42 87,218,076.14 375,994.66 87,594,070.80 -214,855.92 100.0 1.26 1.11
14

Walla Walla County
Transaction Summary9/1/2017 - 9/30/2017
PurchasesTrade Date Settle Date Quantity Symbol Security
Adj UnitCost
AdjustedTotal Cost
9/21/2017 9/22/2017 2,000,000 3133EHKT9 FEDERAL FARM CR BKS 99.90 1,998,000
2.220% Due 11-25-22
9/22/2017 9/25/2017 500,000 91523NMU7 UNIV OF WASH TXBL REVENUE 100.85 504,270
2.462% Due 12-01-22
9/28/2017 9/29/2017 1,000,000 3133EF5V5 FEDERAL FARM CR BKS 99.67 996,730
1.350% Due 08-02-19
9/28/2017 9/29/2017 1,215,000 3130ABZX7 FEDERAL HOME LOAN BANKS 99.80 1,212,623
1.410% Due 08-07-19
9/27/2017 9/29/2017 2,000,000 313379EE5 FEDERAL HOME LOAN BANKS 100.21 2,004,140
1.625% Due 06-14-19
Total Purchases 6,715,763
InterestTrade Date Settle Date Symbol Security Amount9/2/2017 9/2/2017 3133EGDN2 FEDERAL FARM CR BKS 9,000
0.900% Due 03-02-18
9/7/2017 9/7/2017 3137EADP1 FEDERAL HOME LN MTG CORP 8,750
0.875% Due 03-07-18
9/8/2017 9/8/2017 3133782M2 FEDERAL HOME LOAN BANKS 15,000
1.500% Due 03-08-19
9/9/2017 9/9/2017 31315PZZ5 FEDERAL AGRIC MTG CORP 963
0.770% Due 03-09-18
9/21/2017 9/22/2017 3133EHKT9 FEDERAL FARM CR BKS -14,430
2.220% Due 11-25-22
9/22/2017 9/25/2017 91523NMU7 UNIV OF WASH TXBL REVENUE -3,898
2.462% Due 12-01-22
9/28/2017 9/29/2017 3133EF5V5 FEDERAL FARM CR BKS -2,138
1.350% Due 08-02-19
9/28/2017 9/29/2017 3130ABZX7 FEDERAL HOME LOAN BANKS -2,475
1.410% Due 08-07-19
9/27/2017 9/29/2017 313379EE5 FEDERAL HOME LOAN BANKS -9,479
1.625% Due 06-14-19
15

Walla Walla County
Transaction Summary9/1/2017 - 9/30/2017
InterestTrade Date Settle Date Symbol Security Amount9/30/2017 9/30/2017 SYS117600054 BAKER BOYER BANK 315
0.100% Due 10-29-17
9/30/2017 9/30/2017 SYS117600054 BAKER BOYER BANK 0
0.100% Due 10-29-17
9/30/2017 9/30/2017 SYSUMPQ1 UMPQUA BANK MMF 728
0.880% Due 10-29-17
9/30/2017 9/30/2017 SYSUMPQ1 UMPQUA BANK MMF 0
0.880% Due 10-29-17
9/30/2017 9/30/2017 000WAFED WASHINGTON FEDERAL 3,477
1.050% Due 10-29-17
9/30/2017 9/30/2017 000WAFED WASHINGTON FEDERAL 0
1.050% Due 10-29-17
9/30/2017 9/30/2017 WAPOOL WASHINGTON LGIP 6,348
1.129% Due 10-29-17
9/30/2017 9/30/2017 WAPOOL WASHINGTON LGIP 0
1.129% Due 10-29-17
Total Interest 12,162
ExpensesTrade Date Settle Date Symbol Security Amount9/30/2017 9/30/2017 manfee Management Fee 1,000
Total Expenses 1,000
ContributionsTrade Date Settle Date Quantity Symbol Security
UnitPrice Amount
9/22/2017 9/22/2017 cash CASH ACCOUNT 2,012,430
9/25/2017 9/25/2017 cash CASH ACCOUNT 508,168
9/29/2017 9/29/2017 cash CASH ACCOUNT 4,227,585
9/30/2017 9/30/2017 728 SYSUMPQ1 UMPQUA BANK MMF 100.00 728
0.880% Due 10-29-17
9/30/2017 9/30/2017 3,477 000WAFED WASHINGTON FEDERAL 100.00 3,477
16

Walla Walla County
Transaction Summary9/1/2017 - 9/30/2017
ContributionsTrade Date Settle Date Quantity Symbol Security
UnitPrice Amount
1.050% Due 10-29-17
Total Contributions 6,752,388
WithdrawalsTrade Date Settle Date Quantity Symbol Security
UnitPrice Amount
9/5/2017 9/5/2017 cash CASH ACCOUNT 9,000
9/7/2017 9/7/2017 cash CASH ACCOUNT 8,750
9/8/2017 9/8/2017 cash CASH ACCOUNT 15,000
9/11/2017 9/11/2017 cash CASH ACCOUNT 963
9/30/2017 9/30/2017 30,000 SYS117600054 BAKER BOYER BANK 100.00 30,000
0.100% Due 10-29-17
9/30/2017 9/30/2017 6,993,634 WAPOOL WASHINGTON LGIP 100.00 6,993,634
1.129% Due 10-29-17
Total Withdrawals 7,057,347
17

Oct 2017 Nov 2017 Dec 2017 Jan 2018 Feb 2018 Mar 2018 Apr 2018 May 2018 Jun 2018 Jul 2018 Aug 2018 Sep 2018Core Investments 26,875.00 144,350.00 155,165.65 96,485.25 110,415.75 33,712.50 26,875.00 118,075.00 147,986.25 79,500.00 99,915.75 15,000.00
US Agency (USD) 26,875.00 112,475.00 26,250.00 39,250.00 74,315.75 33,712.50 26,875.00 89,325.00 26,250.00 31,500.00 63,815.75 15,000.00
Municipal (USD) 0.00 0.00 128,915.65 57,235.25 36,100.00 0.00 0.00 0.00 121,736.25 48,000.00 36,100.00 0.00
US Treasury (USD) 0.00 31,875.00 0.00 0.00 0.00 0.00 0.00 28,750.00 0.00 0.00 0.00 0.00
Total 26,875.00 144,350.00 155,165.65 96,485.25 110,415.75 33,712.50 26,875.00 118,075.00 147,986.25 79,500.00 99,915.75 15,000.00
Grand Total 1,054,356.15
10/1/2017 - 9/30/2018
Coupon Cash Flow ProjectionWalla Walla County
18

478 Book Value: $87,432,932.06 Market Value: $87,218,076.14Market Value (NAV): 0.997543Total $ Unrealized Loss: $214,856 Total $ Unrealized Gain: $0
Basis Point Shift Gain (Loss)300 0.940347 0.953603 0.956045 0.958243 0.960231 0.962039 0.967879 (3,650,970)$ 250 0.949704 0.960881 0.962940 0.964793 0.966469 0.967993 0.972917 (3,078,284)$ 200 0.959061 0.968158 0.969834 0.971343 0.972707 0.973948 0.977956 (2,505,599)$ 150 0.968418 0.975436 0.976729 0.977893 0.978945 0.979902 0.982994 (1,932,913)$ 100 0.977775 0.982714 0.983624 0.984443 0.985183 0.985857 0.988033 (1,360,227)$ 50 0.987132 0.989992 0.990519 0.990993 0.991422 0.991811 0.993071 (787,542)$ 0 0.996489 0.997270 0.997413 0.997543 0.997660 0.997766 0.998110 (214,856)$
-50 1.005847 1.004547 1.004308 1.004093 1.003898 1.003721 1.003148 357,830$ -100 1.015204 1.011825 1.011203 1.010643 1.010136 1.009675 1.008187 930,515$ -150 1.024561 1.019103 1.018097 1.017193 1.016374 1.015630 1.013225 1,503,201$ -200 1.033918 0.350000 1.024992 1.023743 1.022612 1.021584 1.018264 2,075,887$ -250 1.043275 1.033658 1.031887 1.030293 1.028850 1.027539 1.023302 2,648,573$ -300 1.052632 1.040936 1.038782 1.036843 1.035088 1.033493 1.028340 3,221,258$
Redemption/Inflow -30% -10% -5% 0% 5% 10% 30%O/S Shares 61,203,052 78,689,639 83,061,285 87,432,932 91,804,579 96,176,225 113,662,812
Shift Upon NAV = NAV - (APM/365) * (Bp/10,000)Dilution Upon NAV= (NAV + Change) / (1+ Change)NAV = Market Value / Book Value* Source: S&P rating matrix
Weighted Average Maturity (days):
NAV and Sensitivity Analysis09/30/17
19

This report is for general informational purposes only and is not intended to provide specific advice or recommendations. Government Portfolio Advisors (GPA) is an investment advisor registered with the Securities and Exchange Commission and is required to maintain a written disclosure statement of our background and business experience. Questions About an Account: GPA's monthly & quarterly reports are intended to detail the investment advisory activity managed by GPA. The custodian bank maintains the control of assets and executes (ie. Settles) all investment transactions. The custodian statement is the official record of security and cash holdings and transactions. GPA recognizes that clients may use these reports to facilitate record keeping and that the custodian bank statement and the GPA report should be reconciled and differences resolved. Many custodians use a settlement date basis which may result in the need to reconcile due to a timing difference.
GPA relies on the information provided by the client's when reporting pool balances, bank balances and other assets that are not held at the client's custodial bank.
Account Control:GPA does not have the authority to withdraw funds from or deposit funds to the custodian. Our clients retain responsibility for their deposit funds to the custodian. Our clients retain responsibility for their internal accounting policies, implementing and enforcing internal controls and generating ledger entries or otherwise recording transactions.
Market Value:Generally, market prices in GPA's reports are derived from closing bid prices as of the last business day of the month as supplied by Interactive Data or Bloomberg. Where prices are not available from generally recognized sources the securities are priced using a yield-based matrix system to arrive at an estimated market value. Prices that fall between data points are interpolated. Non-negotiable FDIC –insured bank certificates of deposit are priced at par. Although GPA believes the prices to be reliable, the values of the securities do not always represent the prices at which the securities could have been bought or sold.
Amortized Cost:The original cost of the principal of the security is adjusted for the amount of the periodic reduction of any discount or premium from the purchase date until the date of the report. Discount or premiums with respect to short term securities (those with less than one year to maturity at time of issuance) is amortized on a straightline basis. Such discount or premium with respect to longer term securities is amortized using a straight-line basis. Financial Situation:In order to better serve you, GPA should be promptly notified of any material change in your investment objective or financial situation.
Callable Securities:Securities subject to redemption prior to maturity may be redeemed in whole or in part before maturity, which could affect the yield represented. Certain call dates may not show up on the report if the call date has passed and it is continuously callable. Bonds purchased at a premium will be amortized to call date versus all others will be amortized to maturity.
Duration:The duration listed on the reports is duration to maturity and duration to call. Effective duration is calculated on Bloomberg and imported into these reports and reflects the OAS duration which incorporates the probability of the bond being called. Effective duration is what GPA compares to the benchmark to reflect current market risk.
Benchmark Duration: The benchmark duration is the historical weighted average of the benchmark duration over monthly periods. GPA is reporting this number as a static amount period over period.
Portfolio:The securities in this portfolio are not guaranteed or otherwise protected by GPA, the FDIC (except for non-negotiable certificates of deposit) or any government agency. Investment in securities involves risks, including the possible loss of the amount invested.
Rating:Information provided for ratings is based upon a good faith inquiry of selected sources, but its accuracy and completeness cannot be guaranteed.
Coupon Payments and Maturities on Weekends:Oftentimes, coupon payments and maturities will occur on a weekend or holiday. GPA will track these payments on an accrual basis, while the custodian bank may track on a cash basis. The accrual basis allocates the earnings in the period earned.
Disclaimer & Terms9/30/2017
20