Embed Size (px)
Citation preview
Monthly Weather Review
Queensland
March 2010

The Monthly Weather Review - Queensland is produced twelve times each year by the Australian Bureau of Meteorology'sQueensland Climate Services Centre.
It is intended to provide a concise but informative overview of the temperatures, rainfall and significant weather events inQueensland for the month.
To keep the Monthly Weather Review as timely as possible, much of the information is based on electronic reports. Although everyeffort is made to ensure the accuracy of these reports, the results can be considered only preliminary until complete quality controlprocedures have been carried out. Major discrepancies will be noted in later issues.
We are keen to ensure that the Monthly Weather Review is appropriate to the needs of its readers. If you have any comments orsuggestions, please do not hesitate to contact us:
By mail
Queensland Climate Services CentreBureau of MeteorologyGPO Box 413Brisbane QLD 4001AUSTRALIA
By telephone
(07) 3239 8700
By email
You may also wish to visit the Bureau's home page, http://www.bom.gov.au.
Units of measurementExcept where noted, temperature is given in degrees Celsius (°C), rainfall in millimetres (mm), and wind speed in kilometres per hour(km/h).
Observation times and periodsEach station in Queensland makes its main observation for the day at 9 am local time. At this time, the precipitation over the past 24hours is determined, and maximum and minimum thermometers are also read and reset. In this publication, the followingconventions are used for assigning dates to the observations made:
Maximum temperatures are for the 24 hours from 9 am on the date mentioned. They normally occur in the afternoon of that day.
Minimum temperatures are for the 24 hours to 9 am on the date mentioned. They normally occur in the early morning of that day.
Daily rainfall is for the 24 hours to 9 am on the date mentioned. This means a significant fraction of the rain may have occurred onthe previous calendar day.
Monthly rainfall is for the period from 9 am on the last day of the previous month to 9 am on the last day of this month.
Maximum daily wind gusts are in the 24 hours from midnight to midnight.
Climatological valuesThe climatological averages shown in the text and tables are generally long-term means based on observations from all availableyears of record, which vary widely from site to site. They are not shown for sites with less than 9 years of record, as they cannot thenbe calculated reliably. Climatological extremes are generally taken from available observations from all available years of record. Thenumber of years can vary substantially from site to site.
Copyright© Commonwealth of Australia 2010This work is copyright. You may download, display, print and reproduce this material in unaltered form only (retaining this notice) foryour personal, non-commercial use or use within your organisation. Apart from any use as permitted under the Copyright Act 1968,all other rights are reserved. Requests and inquiries concerning reproduction and rights should be addressed to CommonwealthCopyright Administration, Attorney General’s Department, Robert Garran Offices, National Circuit, Barton ACT 2600 or posted athttp://www.ag.gov.au/cca.
Product code IDCKGC24R1. Prepared on 30 April 2010. ISSN 1836-3075
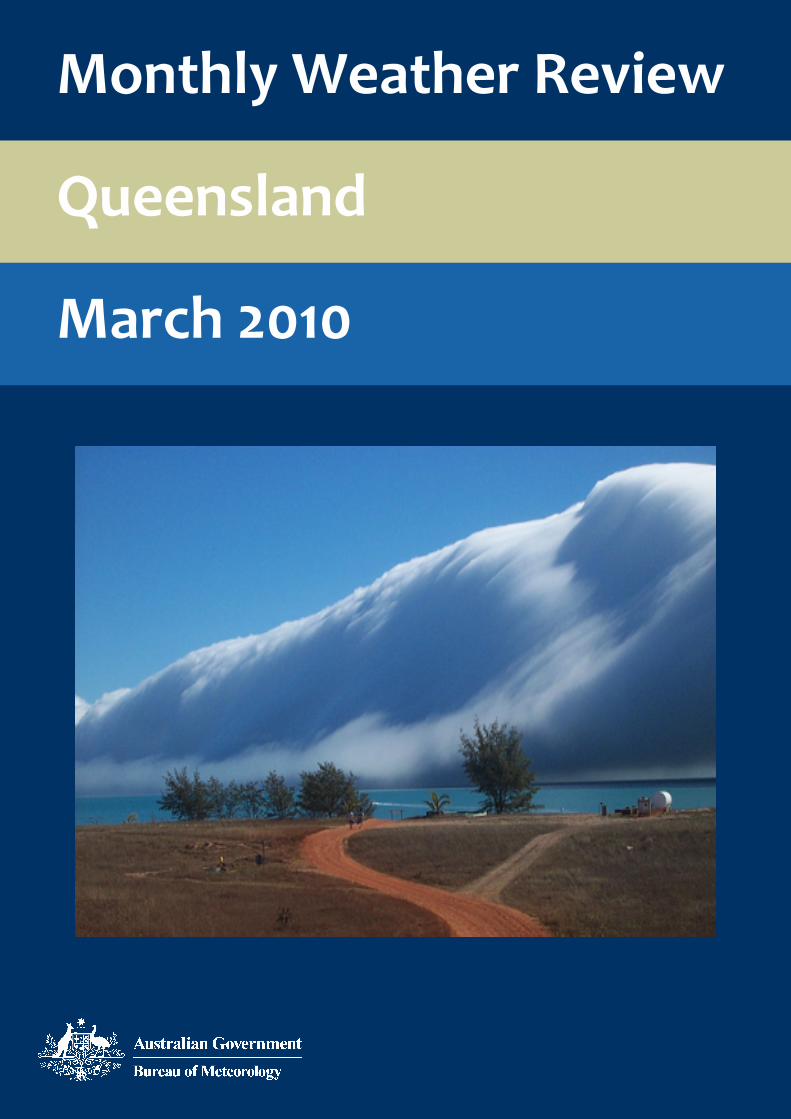
Cover photographMorning Glory off Sweers Island on the Gulf of Carpentaria.Photograph by Lyn and Tex Battle. Used with permission.If you have a photo you think would make a good cover for the Monthly Weather Review, please contact us at the address above.
Monthly Weather Review Queensland March 2010

Overview• Exceptional rainfall event during first week.• 17.1% of Queensland had its wettest March day
on record on the 1st or 2nd.• Widespread flooding in western, southern and
central Queensland.• Severe Tropical Cyclone Ului crossed the east
coast on the 21st.
Extremes in March 2010
Hottest day(Highest daily maximum temperature)
38.6 °C at Julia Creek Airport on the 21stWarmest days on average
(Highest mean daily maximum temperature)35.4 °C at Julia Creek Airport
Coolest days on average(Lowest mean daily maximum temperature)
23.3 °C at ApplethorpeColdest day
(Lowest daily maximum temperature)17.6 °C at Applethorpe on the 2nd
Coldest night(Lowest daily minimum temperature)
9.6 °C at Applethorpe on the 10thCoolest nights on average
(Lowest mean daily minimum temperature)14.2 °C at Applethorpe
Warmest nights on average(Highest mean daily minimum temperature)
26.1 °C at Sweers IslandWarmest night
(Highest daily minimum temperature)29.2 °C at Horn Island on the 3rd
Wettest overall(Highest total rainfall)
1903.0 mm at Bellenden Ker Top StnWettest day
(Highest daily rainfall)452.0 mm at Clark Range Alert on the 21st
Highest wind gust202 km/h at Hamilton Island Airport on the 21st
Monthly Weather Review Queensland March 2010
page 1

Significant weatherSEVERE TROPICAL CYCLONE ULUISevere Tropical Cyclone Ului (pronounced"Oo-l-oo-ie") was initially analysed as a tropical lowsituated in the Pacific Ocean to the north of Vanuatuon the 8th of March. The low then traversed acrossthe northern islands of Vanuatu and into the farnortheast Coral Sea before it developed into atropical cyclone late in the day on the 12th of March.Ului then rapidly intensified over the next couple ofdays into a severe tropical cyclone as it moved in awesterly direction to the south of the SolomonIslands.
From the 15th to the 17th of March, Ului became aslow moving system as it gradually adopted a southto south westerly track. Ului underwent a weakeningphase as the system moved across the Coral Sea dueto a combination of increased wind shear from anupper trough crossing the Tasman Sea and cool seasurface temperatures.
As Ului fell under the influence of an upper ridge onthe 18th of March the system accelerated towardsthe Queensland east coast, and reintensified into asevere tropical cyclone. Severe Tropical Cyclone Uluimade landfall near Airlie Beach on the WhitsundayCoast at approximately 1.30 am on the 21st ofMarch.
Significant wind damage was reported around theCentral Coast and Whitsundays district, mainlybetween Airlie Beach and Mackay. Reports ofdamage include widespread tree damage, large areasof sugarcane destroyed and localised structuraldamage, particularly to roofs. About 50,000 homeslost power following the passage of the system.Many boats were also damaged or destroyed due tothe large seas and swell created by Ului, particularlyaround Shute Harbour near Airlie Beach.
A report in Severe Tropical Cyclone Ului can be foundat: http://www.bom.gov.au/announcements/sevwx/qld/qldtc20100312b.shtml
The strongest wind gusts recorded in Queenslandduring the month were associated with TC Ului. Agust of 202 km/h occurred at Hamilton Island Airporton the 21st, followed by 178 km/h at Hamilton IslandAirport on the 20th, followed by 146 km/h atProserpine Airport on the 21st.
FLOODINGWidespread major flooding developed over the 2ndand 3rd of March on many of the rivers of southerninland Queensland. Major flooding occurred in theDiamantina, Barcoo and Cooper Creek, Bulloo, Paroo,Warrego, Wallam and Mungallala Creeks, Maranoa,Balonne, Condamine, Moonie, Weir and Dawsonriver catchments. Some record flood heightsoccurred in a number of catchments, including theBalonne at St George and Surat, the Paroo at Eulo,Wallam Creek at Bollon, and the Moonie at Thallon.
The Dawson River at Theodore and Moura reachedits highest level since 1956, and the Warrego atCunnamulla its highest since 1990.
A Special Climate Statement can be found at:http://www.bom.gov.au/climate/current/statements/scs20a.pdf and a comprehensive floodreport will be available at: http://www.bom.gov.au/hydro/flood/qld/fld_reports/reports.shtml.
Monthly Weather Review Queensland March 2010
page 2

Synoptic summaryAt the end of February, a monsoon low movedeastwards into southwest Queensland, bringingwidespread heavy rain, first to southwestQueensland on the 28th of February and then the 1stof March, then spreading further east into thesouthern interior on the 1st and 2nd. Moist easterlyflow, combined with a second low which formed offthe coast near Fraser Island, also brought heavy rainto coastal regions of southeast Queensland. Themain low weakened and drifted south after the 2nd.
Early on the 1st of March, a monsoon low movedfrom the southeast Northern Territory, intosouthwest Queensland. Convergence on its southernand eastern flanks brought widespread heavy rain tosouthwest Queensland, spreading further east intothe southern interior during the 1st and 2nd. Themonsoon low extended a developing monsoontrough onto the Queensland east coast north ofFraser Island and an east coast low with gale forcewinds developed on the trough during the 2nd. Theheaviest rainfall was concentrated around theSunshine coast, Wide Bay and Burnett districts inresponse to the development of this system. By the3rd, a high pressure system in the Tasman Seaextended a firm ridge along the Queensland eastcoast to the south of the trough. Winds eased belowgale force in the morning as the east coast lowmoved offshore. Showers/drizzle and light rain areaswith low cloud continued over the southern interiorto the south of the monsoon low and scatteredshowers/drizzle occurred along the south coast.
By the 5th, a low pressure system over New SouthWales extended a weak surface trough into southernand central Queensland. Showers occurred overnorthern and eastern districts increasing to areas ofrain over the central and southern interior, withsome moderate falls about the Sunshine Coast andhinterland and also over the southern interior. Onthe 6th, a low pressure system in the GreatAustralian Bight extended a trough of low pressureover southern Queensland, crossing the coast nearDouble Island Point. A narrow rain band wasassociated with this trough over southeastQueensland on the 6th and 7th.
On the 8th, scattered showers and isolatedthunderstorms occurred about the Central coast andCapricornia districts, Cape York Peninsula and the farnortheast tropical coast. Isolated showers and drizzleareas occurred elsewhere over eastern districts. Onthe 9th, isolated showers and thunderstormsoccurred east of about Normanton to Longreach toTexas, with more scattered activity about Herbertand Lower Burdekin and Central Coast districts. Onthe 10th, scattered showers and storms occurredabout the Tropical and North Tropical Coasts. On the11th, scattered showers occurred along the eastcoast, with more isolated activity in remainingeastern districts. Isolated showers and
thunderstorms occurred in the north and northwestof the state. Scattered showers continued along theeast coast on the 12th.
On the 12th of March, TC Ului developed over the farnortheast Coral Sea. Meanwhile, a large highpressure system near Tasmania was moving slowlyeastwards. The high extended a ridge along most ofthe east coast of Queensland and together thesystems directed fresh to strong and gusty windsalong most of the east coast, gale force in areas attimes. The winds directed showers into most eastcoast districts and the adjacent inland. Fineconditions continued across most of the inland underthe influence of a middle level ridge. Theseconditions generally persisted until severe TC Uluicrossed the Queensland east coast early on the 21st,then continued to move in west south-west directionacross the south-east tropics in a weakening mode,with heavy rain occurring on its southern flank.
On the 22nd, ex-TC Ului was located over northwestQueensland and was moving west. Widespreadshowers and areas of rain continued over thesouthern tropics and central interior due to a moist,convergent wind flowing into the system over theseareas from the east coast. A surface trough lying overthe southern interior produced thunderstorms overthe Warrego. Widespread showers, rain areas andthunderstorms persisted on the 23rd, particularlyover the eastern tropics, as a ridge along the eastQueensland coast produced a moist onshore flowfeeding into the surface trough over easternQueensland. From the 24th, a high in the GreatAustralian Bight directed moderate to freshsoutheasterly trade winds and isolated to scatteredshowers along the east coast, while an upper troughover northern Cape York Peninsula and Torres Straitproduced areas of rain and thunderstorm overnortheastern Queensland, with some heavy fallsoccurring on the 25th.
On the 27th isolated thunderstorms occurred aboutthe Granite Belt.
By the 30th, a high east of New Zealand extended aridge along most of the east coast of Queensland. Aweak trough extended across the west of the stateand linked to a frontal system moving slowlynorthwards along the New South Wales coast. Anupper trough was moving across south-easternAustralia and generated a cloud and rain band overNew South Wales and southern inland borderdistricts of Queensland. TC Paul was located over theeastern part of the Top End of the Northern Territory.Rain bands spiralling into this system affected CapeYork Peninsula and the Gulf of Carpentaria coast.By the 31st, the trough extending from Ex TropicalCyclone Paul into the southeastern interior ofQueensland and then to a low near the New SouthWales coast. This trough produced rain areas andthunderstorms over southeastern parts ofQueensland. A monsoon trough extended from Ex
Monthly Weather Review Queensland March 2010
page 3
Tropical Cyclone Paul into Torres Strait, with the rainbands and thunderstorms developing around Ex TCPaul affecting northern parts of Queensland.
Monthly Weather Review Queensland March 2010
page 4

Daily mean sea level pressure analyses1 March 2010 2 March 2010 3 March 2010
4 March 2010 5 March 2010 6 March 2010
7 March 2010 8 March 2010 9 March 2010
10 March 2010 11 March 2010 12 March 2010
13 March 2010 14 March 2010 15 March 2010
16 March 2010 17 March 2010 18 March 2010
Monthly Weather Review Queensland March 2010
page 5
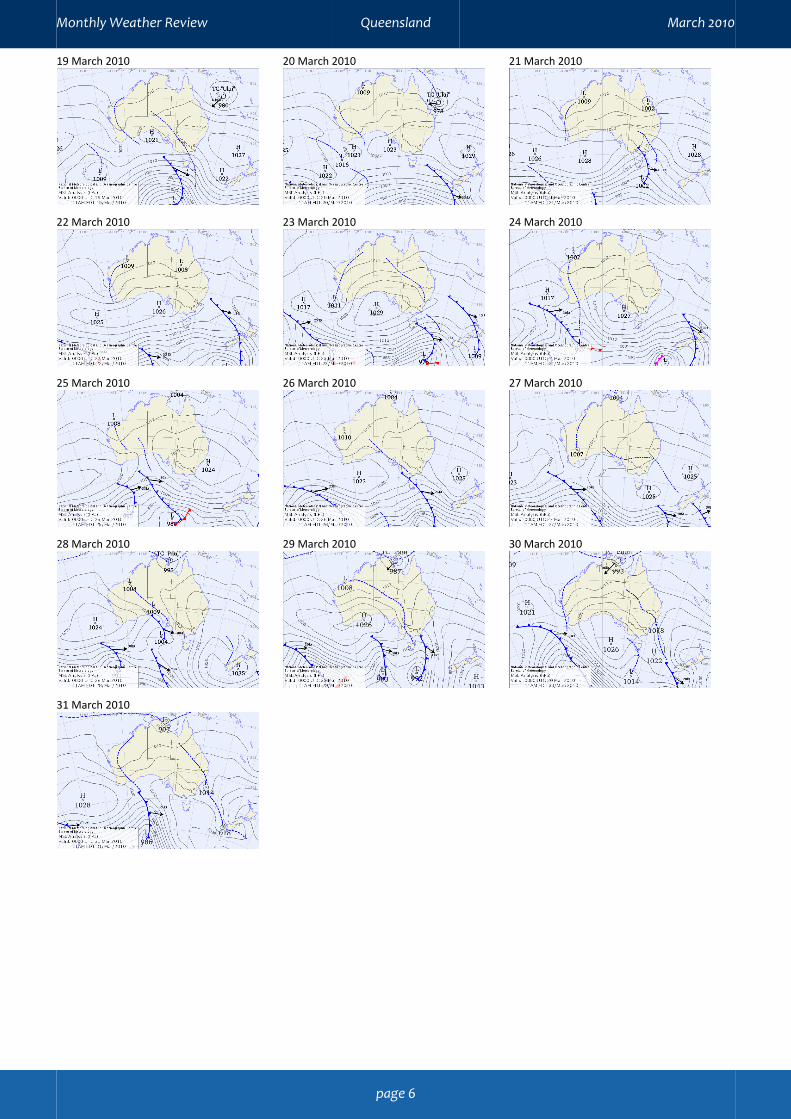
19 March 2010 20 March 2010 21 March 2010
22 March 2010 23 March 2010 24 March 2010
25 March 2010 26 March 2010 27 March 2010
28 March 2010 29 March 2010 30 March 2010
31 March 2010
Monthly Weather Review Queensland March 2010
page 6
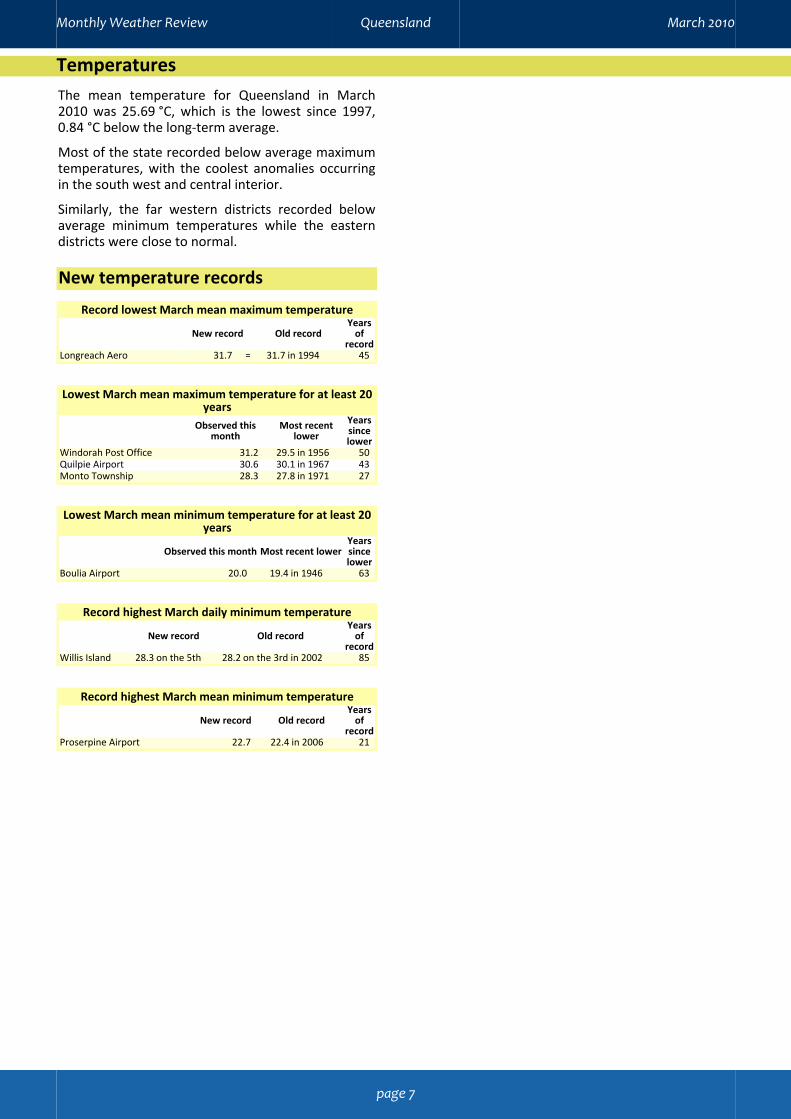
TemperaturesThe mean temperature for Queensland in March2010 was 25.69 °C, which is the lowest since 1997,0.84 °C below the long-term average.
Most of the state recorded below average maximumtemperatures, with the coolest anomalies occurringin the south west and central interior.
Similarly, the far western districts recorded belowaverage minimum temperatures while the easterndistricts were close to normal.
New temperature records
Record lowest March mean maximum temperature
New record Old recordYears
ofrecord
Longreach Aero 31.7 = 31.7 in 1994 45
Lowest March mean maximum temperature for at least 20years
Observed thismonth
Most recentlower
Yearssincelower
Windorah Post Office 31.2 29.5 in 1956 50Quilpie Airport 30.6 30.1 in 1967 43Monto Township 28.3 27.8 in 1971 27
Lowest March mean minimum temperature for at least 20years
Observed this month Most recent lowerYearssincelower
Boulia Airport 20.0 19.4 in 1946 63
Record highest March daily minimum temperature
New record Old recordYears
ofrecord
Willis Island 28.3 on the 5th 28.2 on the 3rd in 2002 85
Record highest March mean minimum temperature
New record Old recordYears
ofrecord
Proserpine Airport 22.7 22.4 in 2006 21
Monthly Weather Review Queensland March 2010
page 7
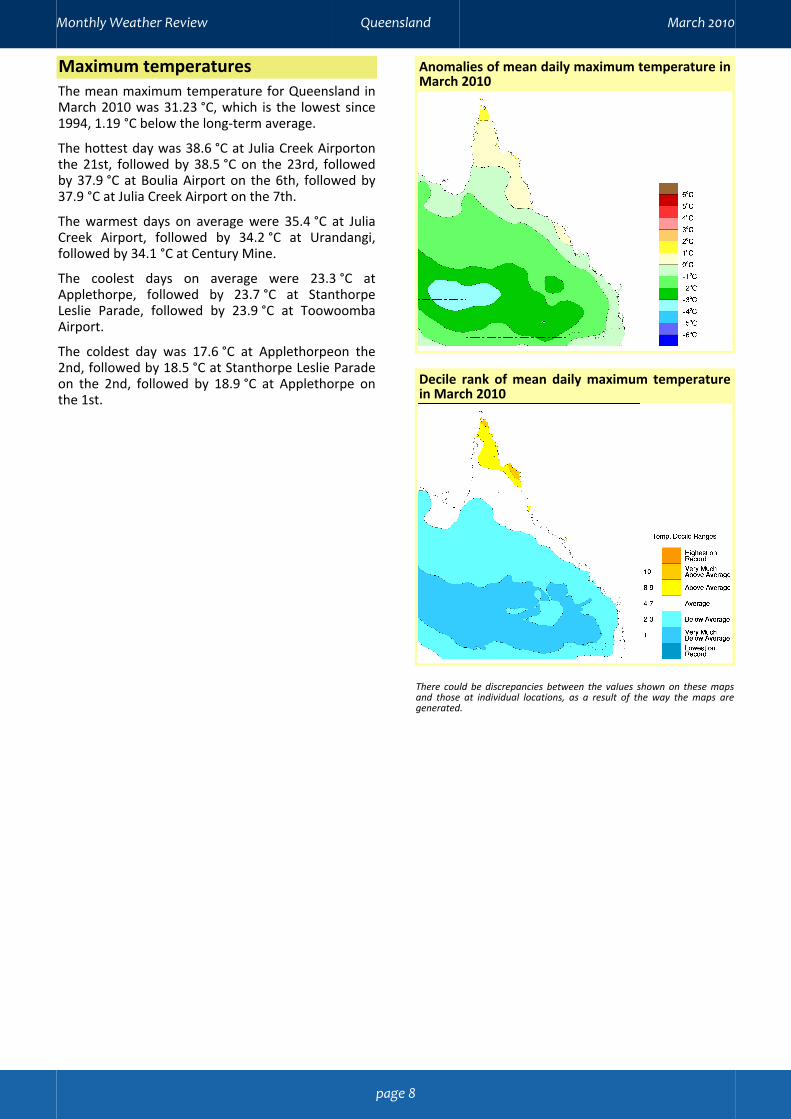
Maximum temperaturesThe mean maximum temperature for Queensland inMarch 2010 was 31.23 °C, which is the lowest since1994, 1.19 °C below the long-term average.
The hottest day was 38.6 °C at Julia Creek Airportonthe 21st, followed by 38.5 °C on the 23rd, followedby 37.9 °C at Boulia Airport on the 6th, followed by37.9 °C at Julia Creek Airport on the 7th.
The warmest days on average were 35.4 °C at JuliaCreek Airport, followed by 34.2 °C at Urandangi,followed by 34.1 °C at Century Mine.
The coolest days on average were 23.3 °C atApplethorpe, followed by 23.7 °C at StanthorpeLeslie Parade, followed by 23.9 °C at ToowoombaAirport.
The coldest day was 17.6 °C at Applethorpeon the2nd, followed by 18.5 °C at Stanthorpe Leslie Paradeon the 2nd, followed by 18.9 °C at Applethorpe onthe 1st.
Anomalies of mean daily maximum temperature inMarch 2010
Decile rank of mean daily maximum temperaturein March 2010
There could be discrepancies between the values shown on these mapsand those at individual locations, as a result of the way the maps aregenerated.
Monthly Weather Review Queensland March 2010
page 8
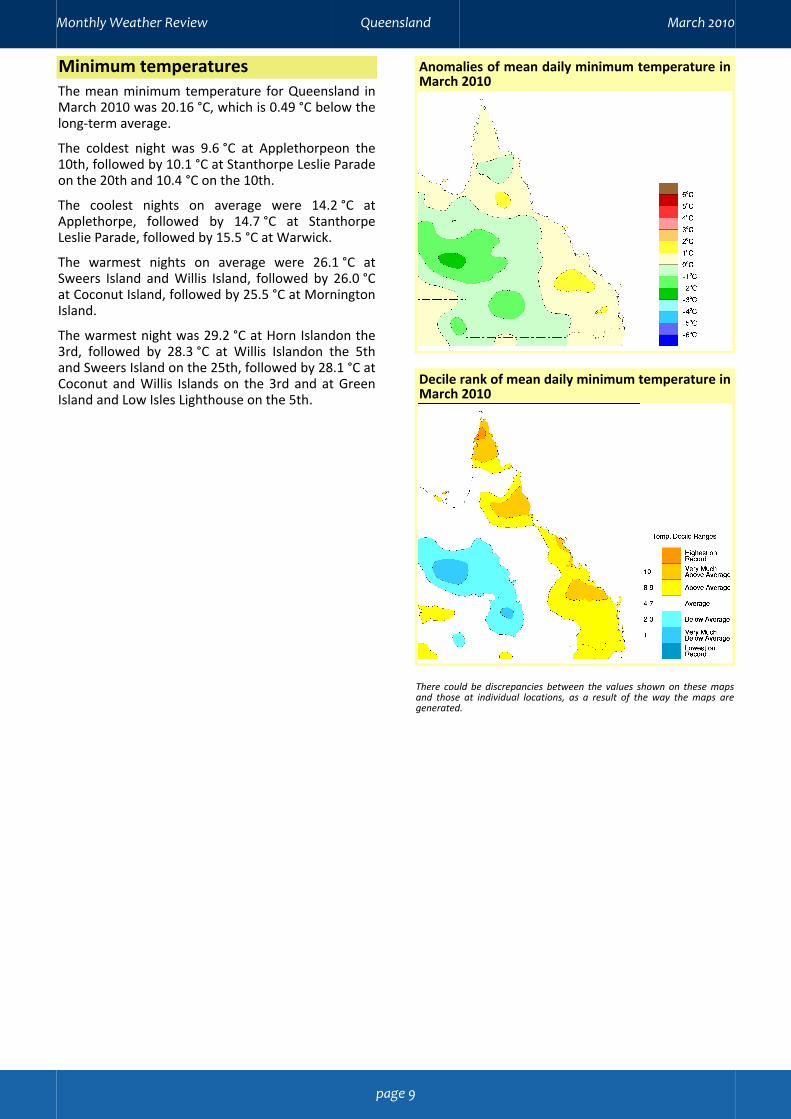
Minimum temperaturesThe mean minimum temperature for Queensland inMarch 2010 was 20.16 °C, which is 0.49 °C below thelong-term average.
The coldest night was 9.6 °C at Applethorpeon the10th, followed by 10.1 °C at Stanthorpe Leslie Paradeon the 20th and 10.4 °C on the 10th.
The coolest nights on average were 14.2 °C atApplethorpe, followed by 14.7 °C at StanthorpeLeslie Parade, followed by 15.5 °C at Warwick.
The warmest nights on average were 26.1 °C atSweers Island and Willis Island, followed by 26.0 °Cat Coconut Island, followed by 25.5 °C at MorningtonIsland.
The warmest night was 29.2 °C at Horn Islandon the3rd, followed by 28.3 °C at Willis Islandon the 5thand Sweers Island on the 25th, followed by 28.1 °C atCoconut and Willis Islands on the 3rd and at GreenIsland and Low Isles Lighthouse on the 5th.
Anomalies of mean daily minimum temperature inMarch 2010
Decile rank of mean daily minimum temperature inMarch 2010
There could be discrepancies between the values shown on these mapsand those at individual locations, as a result of the way the maps aregenerated.
Monthly Weather Review Queensland March 2010
page 9
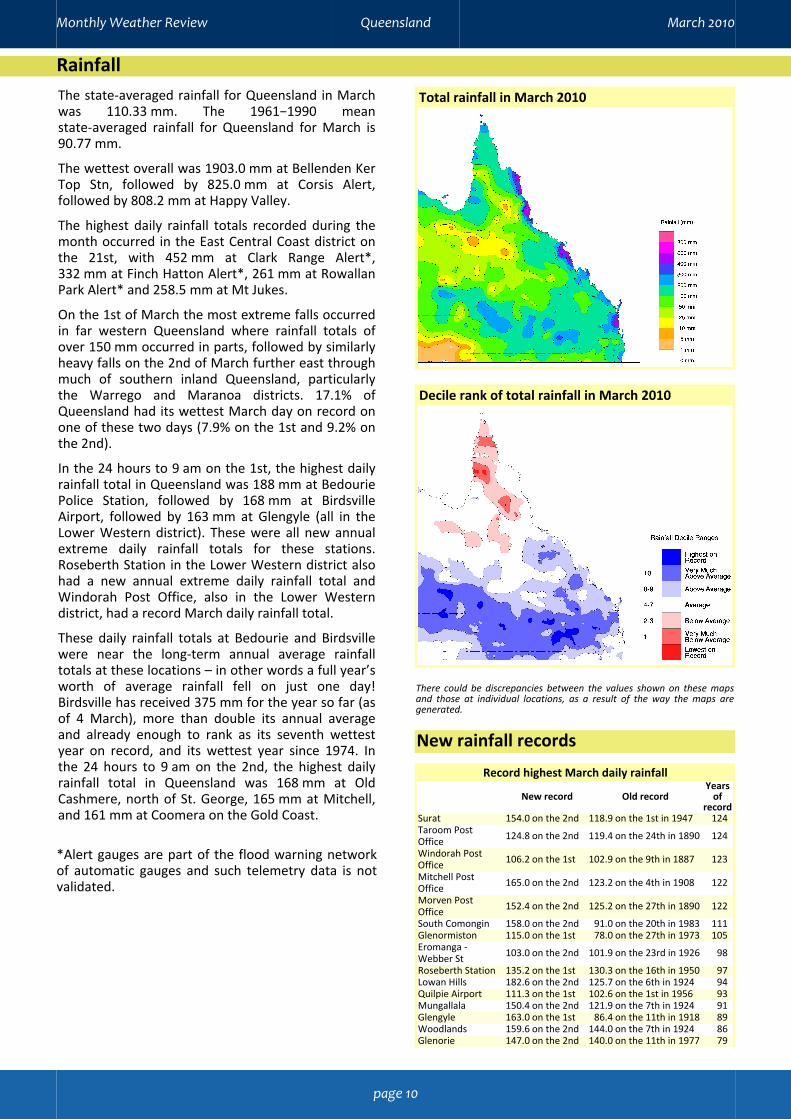
RainfallThe state-averaged rainfall for Queensland in Marchwas 110.33 mm. The 1961−1990 meanstate-averaged rainfall for Queensland for March is90.77 mm.
The wettest overall was 1903.0 mm at Bellenden KerTop Stn, followed by 825.0 mm at Corsis Alert,followed by 808.2 mm at Happy Valley.
The highest daily rainfall totals recorded during themonth occurred in the East Central Coast district onthe 21st, with 452 mm at Clark Range Alert*,332 mm at Finch Hatton Alert*, 261 mm at RowallanPark Alert* and 258.5 mm at Mt Jukes.
On the 1st of March the most extreme falls occurredin far western Queensland where rainfall totals ofover 150 mm occurred in parts, followed by similarlyheavy falls on the 2nd of March further east throughmuch of southern inland Queensland, particularlythe Warrego and Maranoa districts. 17.1% ofQueensland had its wettest March day on record onone of these two days (7.9% on the 1st and 9.2% onthe 2nd).
In the 24 hours to 9 am on the 1st, the highest dailyrainfall total in Queensland was 188 mm at BedouriePolice Station, followed by 168 mm at BirdsvilleAirport, followed by 163 mm at Glengyle (all in theLower Western district). These were all new annualextreme daily rainfall totals for these stations.Roseberth Station in the Lower Western district alsohad a new annual extreme daily rainfall total andWindorah Post Office, also in the Lower Westerndistrict, had a record March daily rainfall total.
These daily rainfall totals at Bedourie and Birdsvillewere near the long-term annual average rainfalltotals at these locations – in other words a full year’sworth of average rainfall fell on just one day!Birdsville has received 375 mm for the year so far (asof 4 March), more than double its annual averageand already enough to rank as its seventh wettestyear on record, and its wettest year since 1974. Inthe 24 hours to 9 am on the 2nd, the highest dailyrainfall total in Queensland was 168 mm at OldCashmere, north of St. George, 165 mm at Mitchell,and 161 mm at Coomera on the Gold Coast.
*Alert gauges are part of the flood warning networkof automatic gauges and such telemetry data is notvalidated.
Total rainfall in March 2010
Decile rank of total rainfall in March 2010
There could be discrepancies between the values shown on these mapsand those at individual locations, as a result of the way the maps aregenerated.
New rainfall records
Record highest March daily rainfall
New record Old recordYears
ofrecord
Surat 154.0 on the 2nd 118.9 on the 1st in 1947 124Taroom PostOffice 124.8 on the 2nd 119.4 on the 24th in 1890 124
Windorah PostOffice 106.2 on the 1st 102.9 on the 9th in 1887 123
Mitchell PostOffice 165.0 on the 2nd 123.2 on the 4th in 1908 122
Morven PostOffice 152.4 on the 2nd 125.2 on the 27th in 1890 122
South Comongin 158.0 on the 2nd 91.0 on the 20th in 1983 111Glenormiston 115.0 on the 1st 78.0 on the 27th in 1973 105Eromanga -Webber St 103.0 on the 2nd 101.9 on the 23rd in 1926 98
Roseberth Station 135.2 on the 1st 130.3 on the 16th in 1950 97Lowan Hills 182.6 on the 2nd 125.7 on the 6th in 1924 94Quilpie Airport 111.3 on the 1st 102.6 on the 1st in 1956 93Mungallala 150.4 on the 2nd 121.9 on the 7th in 1924 91Glengyle 163.0 on the 1st 86.4 on the 11th in 1918 89Woodlands 159.6 on the 2nd 144.0 on the 7th in 1924 86Glenorie 147.0 on the 2nd 140.0 on the 11th in 1977 79
Monthly Weather Review Queensland March 2010
page 10
Record highest March daily rainfall
New record Old recordYears
ofrecord
Glenmorgan PostOffice 159.0 on the 2nd 127.0 on the 8th in 1941 77
Hannaford PostOffice 122.6 on the 2nd 98.0 on the 11th in 1977 71
Meandarra PostOffice 152.0 on the 2nd 109.5 on the 15th in 1937 68
Cheepie PostOffice 110.0 on the 2nd 75.2 on the 15th in 1936 66
Riverslea TM 163.0 on the 22nd 82.6 on the 29th in 1958 65Bedourie PoliceStation 188.4 on the 1st 74.0 on the 19th in 1983 63
Dillalah 146.0 on the 2nd 97.0 on the 3rd in 1999 61Pingine 149.0 on the 2nd 78.0 on the 7th in 1977 60Waverley Downs 181.6 on the 2nd 77.7 on the 23rd in 1963 58Bawnduggie 83.4 on the 2nd 80.0 on the 31st in 1975 54Hereward 115.0 on the 2nd 70.0 on the 26th in 1989 52Auburn 112.0 on the 2nd 111.8 on the 18th in 1959 51Victory Downs 72.0 on the 2nd 58.4 on the 16th in 1979 51Vincent Vale 96.6 on the 6th 88.6 on the 10th in 1995 49Boothulla 131.0 on the 2nd 73.2 on the 2nd in 1936 45Trinidad 77.0 on the 2nd 75.0 on the 2nd in 1999 41Oakey Aero 65.4 on the 2nd 54.0 on the 11th in 1977 40Macalister 69.0 on the 2nd 60.4 on the 6th in 2007 39Namarah 160.4 on the 2nd 90.2 on the 11th in 1977 39Kandimulla 125.2 on the 2nd 95.3 on the 10th in 1977 38Wallen 133.0 on the 2nd 53.2 on the 20th in 1983 36Embreys Bridge 76.2 on the 6th 60.2 on the 27th in 1978 34Mt Stanley Station 85.4 on the 2nd 81.6 on the 16th in 1992 33Bungaban TM 93.2 on the 2nd 88.4 on the 15th in 1926 31Warida 167.4 on the 2nd 95.0 on the 11th in 1977 30"Home"Monogorilby 69.0 on the 3rd 47.2 on the 6th in 2004 28
Tantallon 112.8 on the 2nd 76.4 on the 16th in 1989 28Cherry Park 89.0 on the 2nd 69.0 on the 28th in 2003 26Roma Airport 132.8 on the 2nd 88.8 on the 9th in 1994 25Traighli 89.0 on the 1st 82.0 on the 8th in 2000 23AubignyPurrawunda 84.8 on the 2nd 66.3 on the 8th in 1964 22
Mt Driven 132.0 on the 2nd 63.6 on the 1st in 1999 21Adavale 117.0 on the 2nd 41.0 on the 16th in 1996 20Doraville Station 193.0 on the 21st 87.0 on the 4th in 1994 20
Record highest March total rainfall
New record Old recordYears
ofrecord
Woodlands 263.4 247.2 in 1941 105Wondai Post Office 290.5 278.1 in 1955 99Kurrowah 229.2 190.7 in 1963 94Lowan Hills 282.6 254.0 in 1963 94Dillalah 245.5 191.0 in 1949 81Nindigully 202.4 199.8 in 1962 77Cheriton 242.8 200.9 in 1963 75Charleville Aero 316.0 307.2 in 1956 68Meandarra Post Office 263.5 194.4 in 1963 68Bawnduggie 185.4 170.3 in 1947 64Bedourie Police Station 194.4 192.0 in 1950 64Murralah 227.3 177.6 in 1962 58Waverley Downs 286.0 252.9 in 1963 58Rosehill 295.6 257.4 in 1982 54Hereward 194.8 165.2 in 1989 51Talgai 235.8 154.3 in 1964 51Victory Downs 158.6 157.2 in 1963 51Jackson Community Postal Agency 187.4 172.8 in 1994 48Tingha 164.4 140.4 in 1963 48Vincent Vale 246.2 188.0 in 1963 47Namarah 271.4 166.0 in 1977 45Wansey Downs 154.2 153.0 in 1982 44Oakey Aero 139.0 109.2 in 1979 40Macalister 166.8 149.6 in 2003 39Deepbank 132.5 130.6 in 1982 38Kandimulla 224.4 219.0 in 1982 38Wallen 221.4 72.8 in 1999 36Withcott 183.8 160.7 in 1976 36Embreys Bridge 207.0 122.3 in 1992 33Mt Stanley Station 213.6 127.8 in 1992 32Dingle Dell 181.7 163.7 in 1989 31Warida 241.0 209.2 in 1977 29"Home" Monogorilby 179.2 85.0 in 1994 28Tantallon 184.0 178.2 in 1990 28
Record highest March total rainfall
New record Old recordYears
ofrecord
Cherry Park 228.2 103.0 in 1999 26Roma Airport 197.2 154.3 in 1994 25Wallal Station 288.6 94.0 in 1931 24Haughton Vale 114.0 77.0 in 1996 23Aubigny Purrawunda 199.4 129.0 in 1963 21Mt Driven 241.8 171.0 in 1999 21Tamba 249.4 183.6 in 2004 21Cooby Creek Dam 141.4 100.2 in 2002 20Ripple Downs 170.4 105.0 in 2002 20Yandaran Monduran Road 385.8 348.2 in 1992 20
Highest March total rainfall for at least 20 yearsObserved this
monthMost recent
higher
Yearssince
higherSurat 237.2 384.1 in 1890 120Taroom Post Office 250.2 403.1 in 1890 120Mitchell Post Office 224.2 254.1 in 1910 100Bowenville 152.9 186.2 in 1908 83Mounefontein 202.2 211.6 in 1927 81Tarong 201.0 213.6 in 1937 71Jandowae Post Office 196.2 356.4 in 1941 69Drillham Post Office 170.0 269.3 in 1941 68Morven Post Office 227.8 241.2 in 1941 68Jondaryan Post Office 142.2 209.3 in 1947 63Roseberth Station 140.4 186.0 in 1950 60Windorah Post Office 239.7 498.3 in 1950 60Eromanga - Webber St 213.0 268.3 in 1950 59Katoota 252.0 258.6 in 1941 58Rosedale Post Office 327.2 396.0 in 1952 58Crows Nest 207.0 333.5 in 1955 55Pingine 237.0 290.1 in 1950 55Yarraman Post Office 236.6 257.5 in 1955 55Blackbutt Post Office 225.0 302.6 in 1956 54Bollon Mary St 268.9 482.7 in 1956 54Cunnamulla Post Office 181.8 268.9 in 1956 54Mulga Downs 184.0 274.1 in 1956 54Proston Post Office 180.0 182.0 in 1956 54Quilpie Airport 263.5 310.3 in 1956 54Pechey Forestry 221.0 249.4 in 1956 53Yarraman Upper 229.8 258.0 in 1956 53Goomboorian 384.5 798.5 in 1956 52Cheepie Post Office 209.0 265.4 in 1956 49Glenelg 182.2 189.1 in 1962 48Woodspring 164.0 165.5 in 1962 48Dunollie 143.6 179.3 in 1963 47Esk Post Office 212.2 225.8 in 1963 47Glenorie 314.4 317.5 in 1963 47Horseshoe Lagoon 169.6 361.7 in 1963 47Imbil Post Office 356.0 548.1 in 1963 47Lanark 172.2 246.2 in 1963 47Palmwoods 500.2 749.7 in 1963 47Pampas 160.4 309.8 in 1963 47Quendon 151.6 155.8 in 1963 47Rolleston 180.7 360.1 in 1963 47Toogoolawah Post Office 184.4 302.5 in 1963 47Turallin 239.3 301.3 in 1963 47Barakula Forest Stn 162.2 192.0 in 1964 46Bundaleer 133.2 179.3 in 1964 46Gympie 288.2 403.4 in 1963 46Kenilworth Township 361.5 505.4 in 1963 46Killara 205.6 228.7 in 1963 46La Palma 134.4 138.4 in 1963 46Rosewood Walloon Rd 225.4 257.8 in 1963 46Springside 176.6 196.4 in 1963 46Woleebee Nevasa 153.4 171.7 in 1963 46Dirranbandi High School 160.0 250.2 in 1963 45Kandanga Post Office 311.4 415.1 in 1963 45Kia Ora Sandy Ridges 190.2 195.5 in 1958 45Kilkivan Post Office 240.0 276.8 in 1963 45Mapleton Post Office 559.4 813.3 in 1963 45Montville "Craglands" 588.8 868.8 in 1963 45Somerset Dam 236.2 303.1 in 1964 45Birraban 216.9 374.1 in 1963 44Fernflat 174.0 209.7 in 1958 44Glen Royal 168.1 234.3 in 1963 44Helidon Post Office 170.8 198.0 in 1966 44Cooroy Composite 490.1 604.6 in 1963 43Goombungee Post Office 152.9 193.0 in 1966 43Mungallala 245.4 253.9 in 1963 43
Monthly Weather Review Queensland March 2010
page 11
Highest March total rainfall for at least 20 yearsObserved this
monthMost recent
higher
Yearssince
higherSouth Comongin 239.9 281.9 in 1963 43Hannaford Post Office 189.3 226.0 in 1963 40Nambour Bowling Club 551.3 737.7 in 1963 39Cowley Station 199.0 214.5 in 1969 37Durham Downs 151.0 179.6 in 1971 37Eumundi - Crescent Rd 458.2 468.0 in 1964 37Glenormiston 136.0 142.3 in 1973 37Grandchester Symes St 190.1 225.6 in 1964 37Riverslea TM 207.0 239.3 in 1950 37Cecil Plains Homestead 156.5 200.2 in 1904 36Baratria 135.7 178.0 in 1974 35Eumarella 169.8 170.0 in 1963 34Maleny Tamarind St 588.0 823.0 in 1976 34Beau Maison 184.4 200.0 in 1977 33Landsborough Post Office 539.0 603.0 in 1976 33Mt Whitestone 131.4 136.2 in 1977 33Ourigilla 215.8 225.2 in 1977 33Warkon 152.4 237.2 in 1977 33Peachester 423.9 521.0 in 1976 32Forest Hill 138.9 143.6 in 1978 31Glenmorgan Post Office 206.0 237.4 in 1977 31Te Kowai Exp Stn 551.5 567.8 in 1979 31Traveston 342.0 355.8 in 1976 31Yuleba Garden St 190.4 206.4 in 1979 31Como 474.0 495.1 in 1978 30Dulacca Truck Stop 170.4 184.8 in 1979 30Redlands HRS 283.8 334.6 in 1978 30Perola Park 196.4 205.7 in 1982 28Placid Hills 147.9 249.3 in 1982 28University of QueenslandGatton 135.6 142.5 in 1982 28
Cooranga North 156.6 178.5 in 1976 27Eidsvold Post Office 152.0 154.0 in 1982 27Gatton Allan Street 128.0 216.2 in 1982 27Glenwood 143.4 188.0 in 1982 27Karoola Park 224.4 324.2 in 1982 27Yaamba 270.6 399.0 in 1983 27Eversfield 248.0 249.2 in 1977 26Wallumbilla Post Office 154.1 184.0 in 1979 26Cordalba Store 216.6 222.4 in 1982 25Mount Jukes 617.0 625.0 in 1985 25Bungaban TM 169.0 199.0 in 1927 24Beenham Valley Rd 369.6 386.8 in 1985 23Marnhull 154.8 170.8 in 1989 21Millmerran Post Office 219.0 284.0 in 1989 21Nooyeah Downs 99.6 105.5 in 1988 21Sandy Cape Lighthouse 374.2 377.6 in 1989 21Wallangarra Post Office 127.2 217.8 in 1989 21Watalgan Winfield Rd 261.0 275.2 in 1989 21Yelarbon Post Office 126.6 169.4 in 1989 21Augathella Post Office 138.0 154.5 in 1990 20Eagle Farm Racecourse 217.5 241.8 in 1989 20Glen Etive 136.5 172.0 in 1989 20Havelock 143.3 230.6 in 1990 20Jingi Jingi 214.2 231.3 in 1989 20Kelsey Creek Dittmer Rd 411.0 562.4 in 1990 20Mount Nicholson 225.6 226.8 in 1990 20Rewan Station 147.8 345.6 in 1990 20Roma Peak 256.2 331.4 in 1990 20Springsure Comet St 192.4 262.5 in 1990 20Wyseby 179.4 334.8 in 1990 20
Record lowest March total rainfall
New record Old recordYears
ofrecord
Central Kerry 0.0 = 0.0 in 1980 44Batavia Downs Station 65.2 97.2 in 1994 23
Lowest March total rainfall for at least 20 yearsObserved this
monthMost recent
lower
Yearssincelower
Kilcoy Post Office 7.4 5.8 in 1915 94Moreton TelegraphStation 140.2 79.8 in 1981 22
Monthly Weather Review Queensland March 2010
page 12
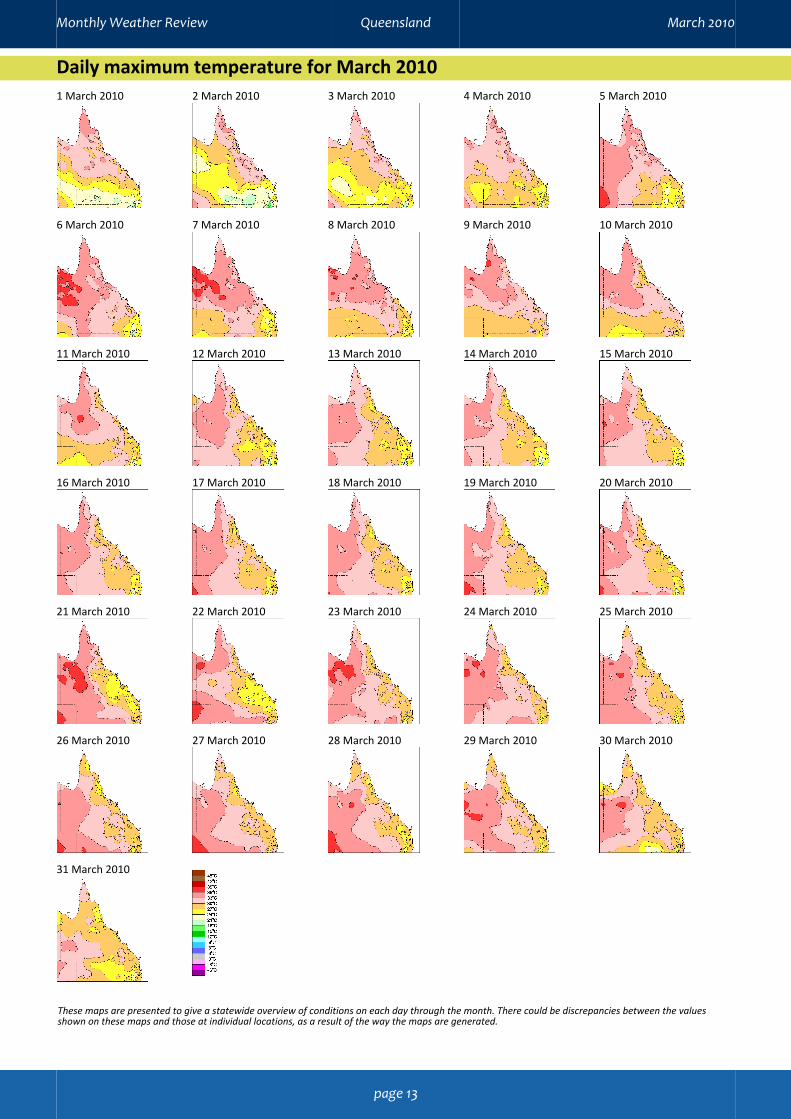
Daily maximum temperature for March 20101 March 2010 2 March 2010 3 March 2010 4 March 2010 5 March 2010
6 March 2010 7 March 2010 8 March 2010 9 March 2010 10 March 2010
11 March 2010 12 March 2010 13 March 2010 14 March 2010 15 March 2010
16 March 2010 17 March 2010 18 March 2010 19 March 2010 20 March 2010
21 March 2010 22 March 2010 23 March 2010 24 March 2010 25 March 2010
26 March 2010 27 March 2010 28 March 2010 29 March 2010 30 March 2010
31 March 2010
These maps are presented to give a statewide overview of conditions on each day through the month. There could be discrepancies between the valuesshown on these maps and those at individual locations, as a result of the way the maps are generated.
Monthly Weather Review Queensland March 2010
page 13

Daily minimum temperature for March 20101 March 2010 2 March 2010 3 March 2010 4 March 2010 5 March 2010
6 March 2010 7 March 2010 8 March 2010 9 March 2010 10 March 2010
11 March 2010 12 March 2010 13 March 2010 14 March 2010 15 March 2010
16 March 2010 17 March 2010 18 March 2010 19 March 2010 20 March 2010
21 March 2010 22 March 2010 23 March 2010 24 March 2010 25 March 2010
26 March 2010 27 March 2010 28 March 2010 29 March 2010 30 March 2010
31 March 2010
These maps are presented to give a statewide overview of conditions on each day through the month. There could be discrepancies between the valuesshown on these maps and those at individual locations, as a result of the way the maps are generated.
Monthly Weather Review Queensland March 2010
page 14

Daily rainfall for March 20101 March 2010 2 March 2010 3 March 2010 4 March 2010 5 March 2010
6 March 2010 7 March 2010 8 March 2010 9 March 2010 10 March 2010
11 March 2010 12 March 2010 13 March 2010 14 March 2010 15 March 2010
16 March 2010 17 March 2010 18 March 2010 19 March 2010 20 March 2010
21 March 2010 22 March 2010 23 March 2010 24 March 2010 25 March 2010
26 March 2010 27 March 2010 28 March 2010 29 March 2010 30 March 2010
31 March 2010
These maps are presented to give a statewide overview of conditions on each day through the month. There could be discrepancies between the valuesshown on these maps and those at individual locations, as a result of the way the maps are generated.
Monthly Weather Review Queensland March 2010
page 15

Summary of observations for Brisbane Airport in March 2010Observations and climatology are from Brisbane Airport; climatological values include those from the "old" site.
Observed this month Climatological valueTemperatureMean daily maximum temperature 27.3 °C 28.1 °CMean daily minimum temperature 20.0 °C 19.5 °CMean temperature 23.7 °C 23.8 °CMean temperature at 9 am 24.9 °C 24.4 °CMean temperature at 3 pm 25.6 °C 26.6 °CHighest temperature 30.1 °C on the 10th 38.3 °C on the 13th in 1965Lowest temperature 17.4 °C on the 25th 10.6 °C on the 30th in 2008Days 30 °C or warmer 2 3.8Days 35 °C or warmer 0 0.1Days 40 °C or warmer 0 0.0Nights 5 °C or cooler 0 0.0Nights 2 °C or cooler 0 0.0HumidityMean relative humidity at 9 am 73 % 70 %Mean relative humidity at 3 pm 68 % 60 %PressureMean MSL pressure at 9 am 1019.1 hPa 1016.2 hPaMean MSL pressure at 3 pm 1016.7 hPa 1013.6 hPaWindStrongest wind gust SSE 57 km/h on the 12th SSE 106 km/h on the 6th in 1985Mean wind speed at 9 am 15 km/h 11 km/hMean wind speed at 3 pm 19 km/h 19 km/hDays with strong wind 0 1.2Days with gales 0 0.3Days with gale-force gusts 0 0.5RainfallTotal precipitation 215.2 mm 126.2 mmNumber of rain days 22 13.6Wettest day 60.6 mm on the 2nd 224.5 mm on the 28th in 1955SunshineMean daily sunshine 5.5 hours 7.7 hoursEvaporationMean daily evaporation 4.8 mm 5.8 mmPhenomenaDays of thunder 2 2.0Days of hail 0 0.1Days of frost 0 0.0Days of fog 0 0.7Days with mist or haze 26 15.5
Monthly Weather Review Queensland March 2010
page 16
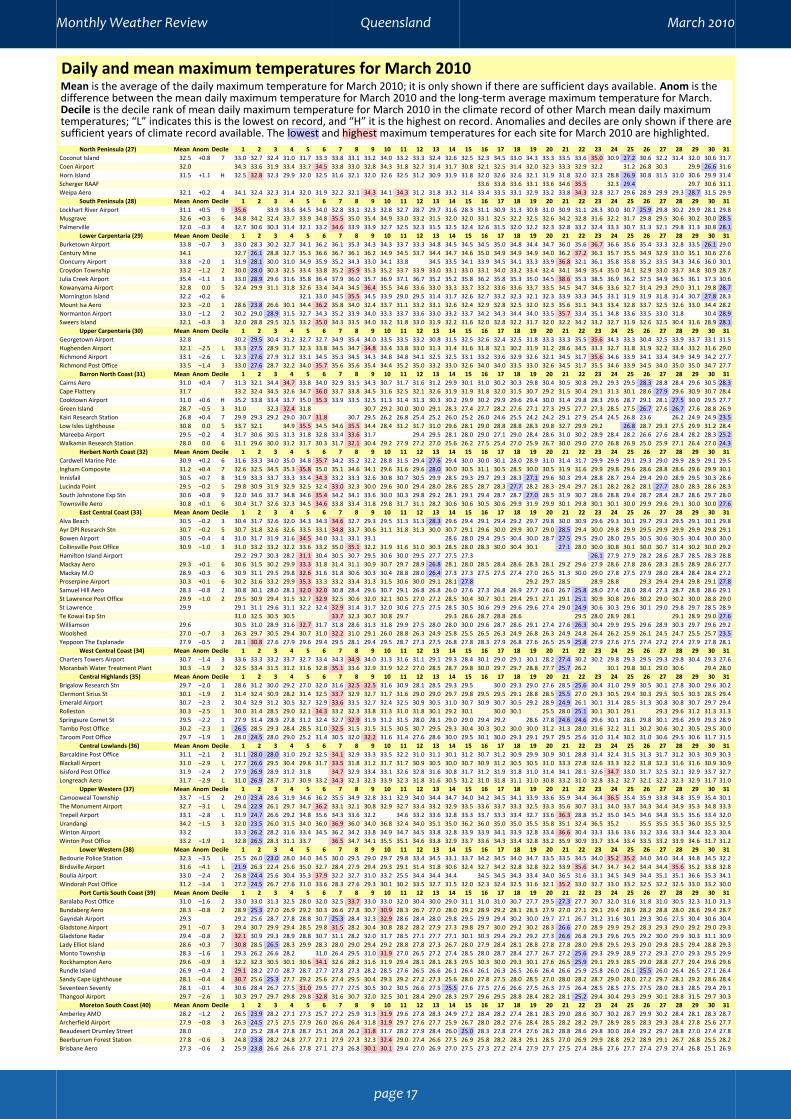
Daily and mean maximum temperatures for March 2010Mean is the average of the daily maximum temperature for March 2010; it is only shown if there are sufficient days available. Anom is thedifference between the mean daily maximum temperature for March 2010 and the long-term average maximum temperature for March.Decile is the decile rank of mean daily maximum temperature for March 2010 in the climate record of other March mean daily maximumtemperatures; “L” indicates this is the lowest on record, and “H” it is the highest on record. Anomalies and deciles are only shown if there aresufficient years of climate record available. The lowest and highest maximum temperatures for each site for March 2010 are highlighted.
North Peninsula (27) Mean Anom Decile 1 2 3 4 5 6 7 8 9 10 11 12 13 14 15 16 17 18 19 20 21 22 23 24 25 26 27 28 29 30 31Coconut Island 32.5 +0.8 7 33.0 32.7 32.4 31.0 31.7 33.3 33.8 33.1 33.2 34.0 33.2 33.3 32.4 32.6 32.5 32.3 34.5 33.0 34.3 33.3 33.5 33.6 35.0 30.9 27.2 30.6 32.2 31.4 32.0 30.6 31.7Coen Airport 32.0 34.3 33.6 31.9 33.4 33.7 34.5 33.8 33.0 32.8 34.3 31.8 32.7 31.4 31.7 30.8 32.1 32.5 31.4 32.0 32.3 33.3 32.9 32.2 31.2 26.8 30.3 29.9 26.6 31.6Horn Island 31.5 +1.1 H 32.5 32.8 32.3 29.9 32.0 32.5 31.6 32.1 32.0 32.6 32.5 31.2 30.9 31.9 31.8 32.0 32.6 32.6 32.1 31.9 31.8 32.0 32.3 28.8 26.9 30.8 31.5 31.0 30.6 29.9 31.4Scherger RAAF 33.6 33.8 33.6 33.1 33.6 34.6 35.5 32.3 29.4 29.7 30.6 31.1Weipa Aero 32.1 +0.2 4 34.1 32.4 32.3 31.4 32.0 31.9 32.2 32.1 34.3 34.1 34.3 31.2 31.8 33.2 31.4 33.4 33.5 33.1 32.9 33.2 33.8 34.3 32.8 32.7 29.6 28.9 29.9 29.3 28.7 31.5 29.9
South Peninsula (28) Mean Anom Decile 1 2 3 4 5 6 7 8 9 10 11 12 13 14 15 16 17 18 19 20 21 22 23 24 25 26 27 28 29 30 31Lockhart River Airport 31.1 +0.5 9 35.6 33.9 33.6 34.5 34.0 32.8 33.1 32.3 32.8 32.7 28.7 29.7 31.6 28.3 31.1 30.9 31.3 30.8 31.0 30.9 31.1 28.3 30.0 30.7 25.9 29.8 30.2 29.9 28.1 29.8Musgrave 32.6 +0.3 6 34.8 34.2 32.4 33.7 33.9 34.8 35.5 35.0 35.4 34.9 33.0 33.2 31.5 32.0 32.0 33.1 32.5 32.2 32.5 32.6 34.2 32.8 31.6 32.2 31.7 29.8 29.5 30.6 30.2 30.0 28.5Palmerville 32.0 −0.3 4 32.7 30.6 30.3 31.4 32.1 33.2 34.6 33.9 33.9 32.7 32.5 32.3 31.5 32.5 32.4 32.6 31.5 32.0 32.2 32.3 32.8 33.2 32.4 33.3 30.7 31.3 32.1 29.8 31.3 30.8 28.1
Lower Carpentaria (29) Mean Anom Decile 1 2 3 4 5 6 7 8 9 10 11 12 13 14 15 16 17 18 19 20 21 22 23 24 25 26 27 28 29 30 31Burketown Airport 33.8 −0.7 3 33.0 28.3 30.2 32.7 34.1 36.2 36.1 35.3 34.3 34.3 33.7 33.3 34.8 34.5 34.5 34.5 35.0 34.8 34.4 34.7 36.0 35.6 36.7 36.6 35.6 35.4 33.3 32.8 33.5 26.1 29.0Century Mine 34.1 32.7 26.1 28.8 32.7 35.3 36.6 36.7 36.1 36.2 34.9 34.5 33.7 34.4 34.7 34.6 35.0 34.9 34.9 34.9 34.0 36.2 37.2 36.3 35.7 35.5 34.9 32.9 33.0 35.1 30.6 27.6Cloncurry Airport 33.8 −2.0 1 31.9 28.1 30.0 31.0 34.9 35.9 35.2 34.3 33.0 34.1 33.8 34.5 33.5 34.1 33.9 34.5 34.1 33.3 33.9 36.8 32.1 36.1 35.8 35.8 35.2 33.5 34.3 34.6 36.0 30.1Croydon Township 33.2 −1.2 2 30.0 28.0 30.3 32.5 33.4 33.8 35.2 35.9 35.3 35.2 33.7 33.9 33.0 33.1 33.0 33.1 34.0 33.2 33.4 32.4 34.1 34.9 35.4 35.0 34.1 32.9 33.0 33.7 34.8 30.9 28.7Julia Creek Airport 35.4 −1.1 3 33.0 28.9 29.6 31.6 35.8 36.4 37.9 36.0 35.7 36.9 37.1 36.7 35.2 35.2 35.8 36.2 35.8 35.3 35.0 34.5 38.6 35.3 38.5 36.9 36.2 37.5 34.9 36.5 36.1 37.3 30.6Kowanyama Airport 32.8 0.0 5 32.4 29.9 31.1 31.8 32.6 33.4 34.4 34.5 36.4 35.5 34.6 33.6 33.0 33.3 33.7 33.2 33.6 33.6 33.7 33.5 34.5 34.7 34.6 33.6 32.7 31.4 29.3 29.0 31.1 29.8 28.7Mornington Island 32.2 +0.2 6 32.1 33.0 34.5 35.5 34.5 33.9 29.0 29.5 31.4 31.7 32.6 32.7 33.2 32.3 32.1 32.3 33.9 33.3 34.5 33.1 31.9 31.9 31.8 31.4 30.7 27.8 28.3Mount Isa Aero 32.3 −2.0 1 28.6 23.8 26.6 30.1 34.4 36.2 35.8 34.0 32.4 33.7 31.1 33.2 33.1 32.6 32.4 32.9 32.8 32.5 32.0 32.3 35.6 31.1 34.3 33.4 32.8 33.7 32.5 32.6 33.0 34.4 28.2Normanton Airport 33.0 −1.2 2 30.2 29.0 28.9 31.5 32.7 34.3 35.2 33.9 34.0 33.3 33.7 33.6 33.0 33.2 33.7 34.2 34.3 34.4 34.0 33.5 35.7 33.4 35.1 34.8 33.6 33.5 33.0 31.8 30.4 28.9Sweers Island 32.1 −0.3 3 32.0 28.8 29.5 32.5 33.2 35.0 34.3 33.5 34.0 33.2 31.8 33.0 31.9 32.2 31.6 32.0 32.8 32.2 31.7 32.0 32.2 34.2 33.2 32.7 31.9 32.6 32.5 30.4 31.6 28.9 28.1
Upper Carpentaria (30) Mean Anom Decile 1 2 3 4 5 6 7 8 9 10 11 12 13 14 15 16 17 18 19 20 21 22 23 24 25 26 27 28 29 30 31Georgetown Airport 32.8 30.2 29.5 30.4 31.2 32.7 32.7 34.9 35.4 34.0 33.5 33.5 33.2 30.8 31.5 32.5 32.6 32.4 32.5 31.8 33.3 33.3 35.5 35.6 34.3 33.3 30.4 32.5 33.9 33.7 33.1 31.5Hughenden Airport 32.1 −2.5 L 33.3 27.5 28.9 31.7 32.3 33.8 34.5 34.7 34.8 33.4 33.8 33.0 31.3 31.4 31.6 31.8 32.1 30.2 31.9 31.2 28.6 34.5 33.3 32.7 31.8 31.9 32.2 33.4 33.2 31.6 29.0Richmond Airport 33.1 −2.6 L 32.3 27.6 27.9 31.2 33.1 34.5 35.3 34.5 34.3 34.8 34.8 34.1 32.5 32.5 33.1 33.2 33.6 32.9 32.6 32.1 34.5 31.7 35.6 34.6 33.9 34.1 33.4 34.9 34.9 34.2 27.7Richmond Post Office 33.5 −1.4 3 33.0 27.6 28.7 32.2 34.0 35.7 35.6 35.6 35.4 34.4 35.2 35.0 33.2 33.0 32.6 34.0 34.0 33.5 33.0 32.6 34.5 31.7 35.5 34.6 33.9 34.5 34.0 35.0 35.0 34.7 27.7
Barron North Coast (31) Mean Anom Decile 1 2 3 4 5 6 7 8 9 10 11 12 13 14 15 16 17 18 19 20 21 22 23 24 25 26 27 28 29 30 31Cairns Aero 31.0 +0.4 7 31.3 32.1 34.4 34.7 33.8 34.0 32.9 33.5 34.3 30.7 31.7 31.6 31.2 29.9 30.1 31.0 30.2 30.3 29.8 30.4 30.5 30.8 29.2 29.3 29.5 28.3 28.8 28.4 29.6 30.5 28.3Cape Flattery 31.7 33.2 32.4 34.5 32.6 34.7 36.0 33.7 33.8 34.5 31.6 32.5 32.1 32.6 31.9 31.9 31.8 32.0 31.5 30.7 29.2 31.5 30.4 29.1 31.3 30.1 28.6 27.9 29.6 30.9 30.7 28.4Cooktown Airport 31.0 +0.6 H 35.2 33.8 33.4 33.7 35.0 35.3 33.9 33.5 32.5 31.3 31.4 31.3 30.3 30.2 29.9 30.2 29.9 29.6 29.4 30.0 31.4 29.8 28.3 29.6 28.7 29.1 28.1 27.5 30.0 29.5 27.7Green Island 28.7 −0.5 3 31.0 32.3 32.4 31.8 30.7 29.2 30.0 30.0 29.1 28.3 27.4 27.7 28.2 27.6 27.1 27.3 29.5 27.7 27.3 28.5 27.5 26.7 27.6 26.7 27.6 28.8 26.9Kairi Research Station 26.8 +0.4 7 29.9 29.3 29.2 29.0 30.7 31.8 30.7 29.5 26.2 26.8 25.4 25.2 26.0 25.2 26.0 24.6 25.5 24.2 24.2 29.1 27.9 25.4 24.5 26.8 23.6 26.2 24.9 24.9 23.5Low Isles Lighthouse 30.8 0.0 5 33.7 32.1 34.9 35.5 34.5 34.6 35.5 34.4 28.4 31.2 31.7 31.0 29.6 28.1 29.0 28.8 28.8 28.3 29.8 32.7 29.9 29.2 26.8 28.7 29.3 27.5 29.9 31.2 28.4Mareeba Airport 29.5 −0.2 4 31.7 30.6 30.5 31.3 31.8 32.8 33.4 33.6 31.7 29.4 29.5 28.1 28.0 29.0 27.1 29.0 28.4 28.6 31.0 30.2 28.9 28.4 28.2 26.6 27.6 28.4 28.2 28.3 25.2Walkamin Research Station 28.0 0.0 6 31.1 29.6 30.0 31.2 31.7 30.3 31.7 32.1 30.4 29.2 27.9 27.2 27.0 25.6 26.2 27.5 25.4 27.0 25.9 26.7 30.0 29.0 27.0 26.8 26.9 25.0 25.9 27.1 26.4 27.0 24.3
Herbert North Coast (32) Mean Anom Decile 1 2 3 4 5 6 7 8 9 10 11 12 13 14 15 16 17 18 19 20 21 22 23 24 25 26 27 28 29 30 31Cardwell Marine Pde 30.9 +0.2 6 31.6 33.3 34.0 35.0 34.8 35.7 34.2 35.2 32.2 28.8 31.5 29.4 27.6 29.4 30.0 30.0 30.1 28.0 28.9 31.0 31.4 31.7 29.9 29.9 29.1 29.3 29.0 29.9 28.9 29.1 29.5Ingham Composite 31.2 +0.4 7 32.6 32.5 34.5 35.3 35.8 35.0 35.1 34.6 34.1 29.6 31.6 29.6 28.0 30.0 30.5 31.1 30.5 28.5 30.0 30.5 31.9 31.6 29.9 29.8 29.6 28.6 28.8 28.6 29.6 29.9 30.1Innisfail 30.5 +0.7 8 31.9 33.3 33.7 33.3 33.4 34.3 33.2 33.3 32.6 30.8 30.7 30.5 29.9 28.5 29.3 29.7 29.3 28.3 27.1 29.6 30.3 29.4 28.8 28.7 29.4 29.4 29.0 28.9 29.5 30.3 28.6Lucinda Point 29.5 −0.2 5 29.8 30.9 31.9 32.9 32.5 32.4 33.0 32.3 30.0 29.6 30.0 29.4 28.0 28.6 28.5 28.7 28.3 27.7 28.2 28.3 29.4 29.7 28.1 28.2 28.2 28.1 27.7 28.0 28.3 28.6 28.3South Johnstone Exp Stn 30.6 +0.8 9 32.0 34.6 33.7 34.8 34.6 35.4 34.2 34.1 33.6 30.0 30.3 29.8 29.2 28.1 29.1 29.4 28.7 28.7 27.0 28.5 31.9 30.7 28.6 28.8 29.4 28.7 28.4 28.7 28.6 29.7 28.0Townsville Aero 30.8 +0.1 6 30.4 31.7 32.6 32.3 34.5 34.6 33.8 33.4 31.8 29.8 31.7 31.1 28.2 30.6 30.6 30.5 30.6 29.9 31.9 29.9 30.1 29.8 30.1 30.1 30.0 29.9 29.6 29.1 30.0 30.0 27.6
East Central Coast (33) Mean Anom Decile 1 2 3 4 5 6 7 8 9 10 11 12 13 14 15 16 17 18 19 20 21 22 23 24 25 26 27 28 29 30 31Alva Beach 30.5 −0.2 3 30.4 31.7 32.6 32.0 34.3 34.3 34.6 32.7 29.3 29.5 31.3 31.3 28.3 29.6 29.4 29.1 29.4 29.2 29.7 29.8 30.0 30.9 29.6 29.3 30.1 29.7 29.3 29.5 29.1 30.1 29.8Ayr DPI Research Stn 30.7 −0.2 5 30.7 31.8 32.6 32.6 33.5 33.1 34.8 33.7 30.6 31.1 31.8 31.3 30.0 30.7 29.1 29.6 30.0 29.9 30.7 29.0 28.5 29.4 30.0 29.8 29.9 29.5 29.9 29.9 29.9 29.8 29.1Bowen Airport 30.5 −0.4 4 31.0 31.7 31.9 31.6 34.5 34.0 33.1 33.1 33.1 28.6 28.0 29.4 29.5 30.4 30.0 28.7 27.5 29.5 29.0 28.0 29.5 30.5 30.6 30.5 30.4 30.0 30.0Collinsville Post Office 30.9 −1.0 3 31.0 33.2 33.2 32.2 33.6 33.2 35.0 35.1 32.2 31.9 31.6 31.0 30.3 28.5 28.0 28.3 30.0 30.4 30.1 27.1 28.0 30.0 30.8 30.1 30.0 30.7 31.4 30.2 30.0 29.2Hamilton Island Airport 29.2 29.7 30.3 28.2 31.1 30.4 30.5 30.7 29.5 30.6 30.0 29.5 27.7 27.5 27.3 26.1 27.9 27.9 28.2 28.6 28.7 28.5 28.3 28.8Mackay Aero 29.3 +0.1 6 30.6 31.5 30.2 29.9 33.3 31.8 31.4 31.1 30.9 30.7 29.7 28.9 26.8 28.1 28.0 28.5 28.4 28.6 28.3 28.1 29.2 29.6 27.9 28.6 27.8 28.6 28.3 28.5 28.9 28.6 27.7Mackay M.O 28.9 +0.3 6 30.9 31.1 29.5 29.8 32.6 31.6 31.8 30.6 30.3 30.4 28.8 28.0 26.4 27.3 27.3 27.5 27.5 27.4 27.0 26.5 31.3 30.0 29.0 27.8 27.5 27.9 28.0 28.4 28.4 28.4 27.2Proserpine Airport 30.3 +0.1 6 30.2 31.6 33.2 29.9 35.3 33.3 33.2 33.4 31.3 31.5 30.6 30.0 29.1 28.1 27.8 29.2 29.7 28.5 28.9 28.8 29.3 29.4 29.4 29.8 29.1 27.8Samuel Hill Aero 28.3 −0.8 2 30.8 30.1 28.0 28.1 32.0 32.0 30.8 28.4 29.6 30.7 29.1 26.8 26.8 26.0 27.6 27.3 26.8 26.9 27.7 26.0 26.7 25.8 28.0 27.4 28.0 28.4 27.3 28.7 28.8 28.6 29.1St Lawrence Post Office 29.9 −1.0 2 29.5 30.9 29.4 31.5 32.7 32.9 32.5 30.6 32.0 32.1 30.5 27.0 27.2 28.5 30.4 30.7 30.1 29.4 29.1 27.1 29.1 25.1 30.9 30.8 29.6 30.2 29.0 30.2 30.0 28.8 29.0St Lawrence 29.9 29.1 31.1 29.6 31.1 32.2 32.4 32.9 31.4 31.7 32.0 30.6 27.5 27.5 28.5 30.5 30.6 29.9 29.6 29.6 27.4 29.0 24.9 30.6 30.3 29.6 30.1 29.0 29.8 29.7 28.5 28.9Te Kowai Exp Stn 31.0 32.5 30.5 30.5 33.7 32.3 30.7 30.8 29.7 29.3 28.6 28.7 28.8 28.6 29.5 28.0 28.9 28.1 29.1 28.9 29.0 27.6Williamson 29.6 30.5 31.0 28.9 31.6 32.7 31.7 31.8 28.6 31.3 31.8 29.9 27.5 28.0 28.0 30.0 29.6 28.7 28.6 29.1 27.4 27.6 26.3 30.4 29.9 29.5 29.6 28.9 30.3 29.7 29.6 29.2Woolshed 27.0 −0.7 3 26.3 29.7 30.5 29.4 30.7 31.0 32.2 31.0 29.1 26.0 28.8 26.3 24.9 25.8 25.5 26.5 26.3 24.9 26.8 26.3 24.9 24.8 26.4 26.2 25.9 26.1 24.5 24.7 25.5 25.7 23.5Yeppoon The Esplanade 27.9 −0.5 2 28.1 30.8 27.6 27.9 29.6 29.4 29.5 28.1 29.4 29.5 28.7 27.3 27.5 26.8 27.8 28.3 27.9 26.8 27.6 26.5 25.9 25.8 27.9 27.6 27.5 27.4 27.2 27.4 27.9 27.8 28.1
West Central Coast (34) Mean Anom Decile 1 2 3 4 5 6 7 8 9 10 11 12 13 14 15 16 17 18 19 20 21 22 23 24 25 26 27 28 29 30 31Charters Towers Airport 30.7 −1.4 3 33.6 33.3 33.2 33.7 32.7 33.4 34.3 34.9 34.0 31.3 31.6 31.1 29.1 29.3 28.4 30.1 29.0 29.1 30.1 28.2 27.4 30.2 30.2 29.8 29.3 29.5 29.3 29.8 30.4 29.3 27.6Moranbah Water Treatment Plant 30.3 −1.9 2 32.5 33.4 31.5 31.2 31.6 32.8 35.1 33.6 32.9 31.9 32.2 27.0 28.5 28.7 29.8 30.0 29.7 29.7 28.8 27.7 25.7 26.2 30.1 29.8 30.1 29.0 30.6 29.4 28.0
Central Highlands (35) Mean Anom Decile 1 2 3 4 5 6 7 8 9 10 11 12 13 14 15 16 17 18 19 20 21 22 23 24 25 26 27 28 29 30 31Brigalow Research Stn 29.7 −2.0 1 28.6 31.2 30.0 29.2 27.0 32.0 31.6 32.5 32.5 31.6 30.9 28.1 28.5 29.3 29.5 30.0 29.3 29.0 27.6 28.5 25.6 30.4 31.0 29.9 30.5 30.1 27.8 30.0 29.6 30.2Clermont Sirius St 30.1 −1.9 2 31.4 32.4 30.9 28.2 31.4 32.5 33.7 32.9 32.7 31.7 31.6 29.0 29.0 29.7 29.8 29.5 29.5 29.1 28.8 28.5 25.5 27.0 29.3 30.5 29.4 30.3 29.5 30.5 30.3 28.5 29.4Emerald Airport 30.7 −2.3 2 30.4 32.9 31.2 30.5 32.7 32.9 33.6 33.5 32.7 32.4 32.5 30.9 30.5 31.0 30.7 30.9 30.7 30.5 29.2 28.9 24.9 26.1 30.1 31.4 28.5 31.3 30.8 30.8 30.7 29.7 29.4Rolleston 30.3 −2.5 1 30.0 31.4 28.5 29.0 32.1 34.3 33.2 32.3 33.8 31.3 31.0 31.8 30.1 29.2 30.1 30.0 30.1 25.5 28.0 25.1 30.1 30.1 29.1 29.3 29.6 31.2 31.3 31.3Springsure Comet St 29.5 −2.2 1 27.9 31.4 28.9 27.8 31.2 32.4 32.7 32.9 31.9 31.2 31.5 28.0 28.1 29.0 29.0 29.4 29.2 28.6 27.8 24.6 24.6 29.6 30.1 28.6 29.8 30.1 29.6 29.9 29.3 28.9Tambo Post Office 30.2 −2.3 1 26.5 28.5 29.3 28.4 28.5 31.0 32.5 31.5 31.5 31.5 30.5 30.7 29.5 29.3 30.4 30.3 30.2 30.0 30.0 31.2 31.3 28.0 31.6 32.2 31.1 30.2 30.6 30.2 30.5 29.5 30.0Taroom Post Office 29.7 −1.9 1 28.0 24.5 28.0 29.0 25.2 31.4 30.5 32.0 32.2 31.6 31.4 27.6 28.6 30.0 29.5 30.1 30.0 29.3 29.1 29.7 29.5 25.6 31.0 31.4 30.2 31.0 30.6 29.5 30.6 31.7 31.5
Central Lowlands (36) Mean Anom Decile 1 2 3 4 5 6 7 8 9 10 11 12 13 14 15 16 17 18 19 20 21 22 23 24 25 26 27 28 29 30 31Barcaldine Post Office 31.1 −2.1 2 31.1 28.0 28.0 31.0 29.2 32.5 34.1 32.9 33.3 33.5 32.2 31.0 31.1 30.1 31.2 30.7 31.2 30.9 29.9 30.9 30.1 28.8 31.4 32.4 31.5 31.3 31.7 31.2 30.3 30.9 30.3Blackall Airport 31.0 −2.9 L 27.7 26.6 29.5 30.4 29.8 31.7 33.5 31.8 31.2 31.7 31.7 30.9 30.5 30.0 30.7 30.9 31.2 30.5 30.5 31.0 33.3 27.8 32.6 33.3 32.2 31.8 32.3 31.6 31.6 30.9 30.9Isisford Post Office 31.9 −2.4 2 27.9 26.9 28.9 31.2 31.8 34.7 32.9 33.4 33.1 32.6 32.8 31.6 30.8 31.7 31.2 31.9 31.8 31.0 31.4 34.1 28.1 32.6 34.7 33.0 31.7 32.5 32.1 32.9 33.7 32.7Longreach Aero 31.7 −2.9 L 31.0 26.9 28.7 31.7 30.9 33.2 34.3 32.3 32.3 33.9 32.3 31.8 31.6 30.5 31.2 31.0 31.8 31.1 31.0 30.8 33.2 31.0 32.8 33.2 32.7 32.1 32.2 32.3 32.9 31.7 31.0
Upper Western (37) Mean Anom Decile 1 2 3 4 5 6 7 8 9 10 11 12 13 14 15 16 17 18 19 20 21 22 23 24 25 26 27 28 29 30 31Camooweal Township 33.7 −1.5 2 29.0 23.4 28.6 31.9 34.6 36.2 35.5 34.9 32.8 33.1 32.9 34.0 34.4 34.7 34.0 34.2 34.5 34.1 33.9 33.6 35.9 34.4 36.4 36.5 35.4 35.9 33.8 34.8 35.9 35.4 30.1The Monument Airport 32.7 −3.1 L 29.4 22.9 26.1 29.7 34.7 36.2 33.1 32.1 30.8 32.9 32.7 33.4 33.2 32.9 33.5 33.6 33.7 33.3 32.5 33.3 35.6 30.7 33.1 34.0 33.7 34.3 34.4 34.9 35.3 34.8 33.3Trepell Airport 33.1 −2.8 L 31.9 24.7 26.6 29.2 34.8 35.6 34.3 33.6 32.2 34.6 33.2 33.6 32.8 33.3 33.7 33.3 33.4 32.7 33.6 36.3 28.8 35.2 35.0 34.5 34.6 34.8 35.5 35.6 33.4 32.0Urandangi 34.2 −1.5 3 32.0 23.5 26.0 31.5 34.0 36.0 36.9 36.0 34.0 36.8 32.4 34.0 35.1 35.0 36.2 36.0 35.0 35.0 35.5 35.8 35.1 32.4 36.5 35.2 35.5 35.5 35.5 36.0 35.5 32.5Winton Airport 33.2 33.3 26.2 28.2 31.6 33.4 34.5 36.2 34.2 33.8 34.9 34.7 34.5 33.8 32.8 33.9 33.9 34.1 33.9 32.8 33.4 36.6 30.4 33.3 33.6 33.6 33.2 33.6 33.3 34.4 32.3 30.4Winton Post Office 33.2 −1.9 1 32.8 26.5 28.3 31.1 33.7 36.5 34.7 34.1 35.5 35.1 34.6 33.8 32.9 33.7 33.6 34.3 33.4 32.8 33.2 35.9 30.9 33.7 33.4 33.4 33.5 33.2 33.9 34.6 31.7 31.2
Lower Western (38) Mean Anom Decile 1 2 3 4 5 6 7 8 9 10 11 12 13 14 15 16 17 18 19 20 21 22 23 24 25 26 27 28 29 30 31Bedourie Police Station 32.3 −3.5 L 25.5 26.0 23.0 28.0 34.0 34.5 30.0 29.5 29.0 29.7 29.8 33.4 34.5 33.1 33.7 34.2 34.5 34.0 34.7 33.5 33.5 34.5 34.0 35.2 35.2 34.0 34.0 34.4 34.8 34.5 32.2Birdsville Airport 31.6 −4.1 L 21.9 26.3 22.4 25.6 35.0 32.7 28.4 27.9 29.4 29.3 29.1 31.4 31.8 30.6 32.4 32.7 34.2 32.8 32.8 32.2 33.9 35.6 34.7 34.7 34.2 34.4 34.4 35.6 35.2 33.8 32.8Boulia Airport 33.0 −2.4 2 26.8 24.4 25.6 30.4 35.3 37.9 32.2 32.7 31.0 33.2 25.5 34.4 34.4 34.4 34.5 34.5 34.3 33.4 34.0 36.5 31.6 33.1 34.5 34.9 34.4 35.1 35.1 36.6 35.3 34.1Windorah Post Office 31.2 −3.4 1 27.2 24.5 26.7 27.6 31.0 33.6 28.3 27.6 29.3 30.1 30.2 33.5 32.7 31.5 32.0 32.3 32.4 32.5 31.6 32.1 35.2 33.0 32.7 33.0 33.2 32.5 32.2 32.5 33.0 33.2 30.0
Port Curtis South Coast (39) Mean Anom Decile 1 2 3 4 5 6 7 8 9 10 11 12 13 14 15 16 17 18 19 20 21 22 23 24 25 26 27 28 29 30 31Baralaba Post Office 31.0 −1.6 2 33.0 33.0 31.3 32.5 28.0 32.0 32.5 33.7 33.0 33.0 32.0 30.4 30.0 29.0 31.1 31.0 31.0 30.7 27.7 29.5 27.3 27.7 30.7 32.0 31.6 31.8 31.0 30.5 32.3 31.0 31.3Bundaberg Aero 28.3 −0.8 2 28.9 25.3 27.0 26.9 29.2 30.3 26.6 27.8 30.7 30.9 28.3 26.7 27.0 28.0 29.2 28.9 29.2 28.1 28.3 27.9 27.0 27.1 29.1 29.4 28.9 28.2 28.8 28.0 28.6 29.4 28.7Gayndah Airport 29.3 29.2 25.6 28.7 27.8 28.8 30.7 25.3 28.4 32.3 32.9 28.6 28.4 28.0 29.8 29.5 29.9 29.4 30.2 30.0 29.7 27.1 26.7 31.2 31.6 30.1 29.3 30.6 27.5 30.4 30.6 30.4Gladstone Airport 29.1 −0.7 3 29.4 30.7 29.9 29.4 28.5 29.8 31.5 28.2 30.4 30.8 28.2 28.2 27.9 27.3 29.8 29.7 30.0 29.2 30.2 28.3 26.6 27.0 28.9 29.9 29.2 28.3 29.3 29.0 29.2 29.0 29.3Gladstone Radar 29.4 −0.8 2 32.1 30.9 29.3 28.9 28.8 30.7 31.1 28.2 32.0 31.7 28.5 27.1 27.7 27.1 30.1 30.3 29.4 29.2 29.2 27.3 26.6 26.8 29.3 29.6 29.5 29.2 30.0 29.9 30.3 31.1 30.9Lady Elliot Island 28.6 +0.3 7 30.8 28.5 26.5 28.3 29.9 28.3 28.0 29.0 29.4 29.2 28.8 27.8 27.3 26.7 28.0 27.9 28.4 28.1 28.8 27.8 27.8 28.0 29.8 29.5 29.3 29.0 29.8 28.5 29.4 28.8 29.3Monto Township 28.3 −1.6 1 29.3 26.2 26.6 28.2 31.0 26.4 29.5 31.0 31.9 27.0 26.5 27.2 27.4 28.5 28.0 28.7 28.4 27.7 26.7 27.2 25.6 29.3 29.9 28.9 27.2 29.3 27.0 29.3 29.5 29.9Rockhampton Aero 29.6 −0.9 3 32.2 32.3 30.5 30.1 30.6 34.1 32.6 28.2 31.6 31.9 29.4 28.1 28.1 28.3 29.5 30.3 30.0 29.3 30.1 27.6 26.5 25.9 29.1 29.3 28.5 29.0 28.8 27.7 29.4 29.6 29.6Rundle Island 26.9 −0.4 2 29.1 28.2 27.0 28.7 28.7 27.7 27.8 27.3 28.2 28.5 27.6 26.5 26.6 26.1 26.4 26.1 26.3 26.5 26.6 26.4 26.6 25.9 25.8 26.0 26.1 25.5 26.0 26.4 26.5 27.1 26.4Sandy Cape Lighthouse 28.1 −0.4 4 30.7 25.6 25.3 27.7 29.2 25.6 27.4 29.5 30.4 29.3 29.2 27.2 27.3 25.6 28.0 27.8 27.5 28.0 28.5 27.0 28.0 28.2 28.7 29.0 28.0 27.2 29.7 28.1 29.2 28.6 28.4Seventeen Seventy 28.1 −0.1 4 30.6 28.4 26.7 27.5 31.0 29.5 27.7 27.5 30.5 30.2 30.5 26.6 27.5 25.5 27.6 27.5 27.6 26.6 27.5 26.3 27.5 26.4 28.5 28.5 27.5 27.5 28.0 28.3 28.5 29.4 29.1Thangool Airport 29.7 −2.6 1 30.3 29.7 29.7 29.8 29.8 32.8 31.6 30.7 32.0 32.5 30.1 28.4 29.0 28.3 29.7 29.6 29.5 28.8 28.4 28.2 28.1 25.2 29.4 30.4 29.3 29.9 30.1 28.8 31.5 29.7 30.3
Moreton South Coast (40) Mean Anom Decile 1 2 3 4 5 6 7 8 9 10 11 12 13 14 15 16 17 18 19 20 21 22 23 24 25 26 27 28 29 30 31Amberley AMO 28.2 −1.2 2 26.5 23.9 28.2 27.1 27.3 25.7 27.2 25.9 31.3 31.9 29.6 27.8 28.3 24.9 27.2 28.4 28.2 27.4 28.1 28.3 29.0 28.6 30.7 30.2 28.7 29.9 30.2 28.4 28.1 28.3 28.7Archerfield Airport 27.9 −0.8 3 26.3 24.5 27.5 27.5 27.9 26.0 26.6 26.4 31.8 31.9 29.7 27.6 27.7 25.9 26.7 28.0 28.2 27.6 28.4 28.5 28.2 28.2 29.7 28.9 28.5 28.3 29.3 28.4 27.8 25.6 27.7Beaudesert Drumley Street 28.0 27.0 25.2 28.4 27.8 28.7 25.1 26.8 26.2 31.8 31.7 28.2 27.9 28.4 26.0 25.0 28.3 27.8 27.4 27.6 28.2 28.8 28.6 29.8 30.0 28.4 29.2 29.7 28.8 27.0 27.4 27.8Beerburrum Forest Station 27.8 −0.6 3 24.8 23.8 28.2 24.8 27.7 27.1 27.9 27.3 32.3 32.4 29.0 27.4 26.6 27.5 26.9 25.8 28.2 28.3 29.1 28.5 27.0 26.9 29.9 28.8 29.2 28.9 29.1 26.7 28.8 25.5 28.2Brisbane Aero 27.3 −0.6 2 25.9 23.8 26.6 26.6 27.8 27.1 27.3 26.8 30.1 30.1 29.4 27.0 26.9 27.0 27.5 27.3 27.2 27.4 27.9 27.7 27.5 27.4 28.6 27.6 27.7 27.4 27.9 27.4 26.8 25.1 26.9
Monthly Weather Review Queensland March 2010
page 17

Daily and mean maximum temperatures for March 2010Mean is the average of the daily maximum temperature for March 2010; it is only shown if there are sufficient days available. Anom is thedifference between the mean daily maximum temperature for March 2010 and the long-term average maximum temperature for March.Decile is the decile rank of mean daily maximum temperature for March 2010 in the climate record of other March mean daily maximumtemperatures; “L” indicates this is the lowest on record, and “H” it is the highest on record. Anomalies and deciles are only shown if there aresufficient years of climate record available. The lowest and highest maximum temperatures for each site for March 2010 are highlighted.Brisbane 28.2 −0.7 2 26.4 23.9 27.2 27.0 28.5 27.0 27.2 27.2 32.6 33.1 30.0 28.1 27.4 27.5 28.0 28.3 28.4 27.9 28.6 28.4 28.2 28.5 30.0 29.1 28.8 28.7 29.1 28.6 27.8 26.1 27.5Cape Moreton Lighthouse 26.6 +0.6 8 23.3 24.4 26.5 25.4 27.4 27.4 28.1 27.8 28.3 29.3 25.8 25.3 25.0 25.8 26.3 25.6 25.9 26.0 27.1 26.7 26.1 25.8 27.6 27.3 26.9 27.1 27.7 27.2 28.8 26.5 26.2Coolangatta 28.0 +0.9 9 24.9 26.7 28.2 28.0 28.6 28.7 29.0 28.1 30.6 30.4 28.8 27.3 27.8 26.5 25.7 27.4 27.8 27.6 28.0 28.1 29.0 28.0 28.8 28.2 28.4 27.9 28.1 28.2 28.1 27.8 27.5Double Island Point Lighthouse 27.4 +0.7 8 28.3 24.0 24.5 26.6 27.1 25.6 26.7 29.2 29.5 30.5 26.1 25.2 25.7 26.9 27.6 26.9 26.6 27.2 26.9 28.6 26.9 27.3 27.6 27.4 28.4 28.7 28.4 28.4 29.2 29.0 28.6Gold Coast Seaway 28.1 +0.4 6 24.5 25.6 27.4 27.7 28.0 26.7 29.6 28.1 32.8 29.7 30.5 27.2 27.3 25.4 26.9 27.7 27.3 27.5 28.1 28.3 29.2 29.1 29.1 28.3 28.0 28.0 28.6 28.6 29.6 27.9 28.0Gympie 27.6 −1.7 1 27.6 24.7 26.4 25.6 26.6 25.3 26.7 26.8 31.9 31.9 26.5 26.8 25.4 27.5 26.9 26.1 27.2 27.6 28.2 28.4 27.3 26.3 29.7 28.6 28.7 28.6 28.9 27.7 29.3 28.9 28.6Hervey Bay Airport 28.3 −0.6 1 30.4 25.0 26.9 26.6 29.3 26.2 27.7 28.5 30.8 30.7 29.3 27.0 26.9 28.2 28.7 28.6 28.3 27.5 27.3 28.7 27.4 27.0 29.1 29.5 28.4 28.4 28.7 28.6 29.0 29.4 29.0Hinze Dam 24.7 24.4 26.5 26.0 27.4 26.3 32.1 29.5 28.0 26.1 23.7 26.5 26.6 25.8 28.0 28.0 28.5 27.5 27.0 28.6 26.2 27.7 27.0Jimna Forestry 24.6 −1.4 1 24.8 21.3 24.1 22.8 23.9 23.1 22.8 25.1 28.4 29.1 26.3 23.9 22.6 23.3 21.7 22.7 24.2 23.4 25.1 23.6 24.9 23.5 27.3 26.4 25.6 25.9 26.5 25.5 25.2 26.0 24.7Kingaroy Airport 26.1 −2.2 2 25.6 22.4 26.3 24.4 25.5 25.8 22.8 26.1 29.1 29.7 27.2 25.5 24.7 25.0 24.3 25.9 25.2 25.0 26.4 25.1 25.1 23.7 28.3 28.1 27.4 27.9 27.3 26.3 27.9 28.0 27.4Logan City Water Treatment 27.9 −0.4 3 25.9 25.1 27.6 27.4 28.0 25.7 27.2 26.2 32.5 31.2 29.5 28.0 27.0 27.0 26.6 27.3 27.3 27.2 28.0 27.7 29.0 28.5 29.2 28.4 27.8 28.2 29.4 28.5 27.2 27.5Maleny Tamarind St 24.1 −1.0 2 23.2 20.4 24.0 21.4 23.4 22.6 23.8 24.0 29.2 28.2 25.0 24.2 21.4 24.0 21.8 22.2 23.8 23.6 25.8 24.4 23.8 23.0 26.6 26.2 25.2 24.6 25.0 23.0 24.8 25.0 24.2Maroochydore Aero 27.4 −0.2 3 25.7 25.2 27.2 26.5 27.2 26.9 28.5 29.5 29.1 30.3 26.8 25.9 27.8 24.5 26.6 27.3 27.4 28.6 28.0 27.8 25.6 28.2 28.2 28.0 27.4 27.2 27.5 27.4 27.6 27.1Maryborough 28.4 −0.8 2 29.1 24.5 26.0 26.1 29.3 26.5 26.8 28.7 30.9 31.9 27.6 28.0 27.0 28.4 29.2 27.7 28.5 27.9 28.1 29.5 27.5 26.8 29.8 29.5 28.8 28.3 29.4 29.3 29.7 29.8Nambour DPI - Hillside 26.9 25.0 23.4 26.5 25.8 26.0 26.2 27.4 27.2 30.3 30.6 25.8 26.5 24.9 26.7 23.3 25.3 27.1 27.0 28.4 28.1 27.4 25.8 29.9 28.5 27.7 28.2 28.0 26.1 28.0 26.9 27.2Point Lookout 28.8 +0.5 8 28.9 24.9 27.5 28.2 27.7 27.8 29.4 30.6 29.6 30.9 29.7 28.2 28.2 29.0 28.4 27.2 27.3 29.4 30.0 30.1 29.2 28.0 31.0 28.9 29.7 29.4 30.0 29.6 28.1 27.0Rainbow Beach 27.3 −0.5 2 27.8 23.8 25.1 26.4 26.9 26.3 26.7 28.4 29.2 29.8 28.1 26.6 26.1 27.2 27.9 26.3 27.2 27.0 27.3 28.0 26.8 26.6 28.1 27.7 27.6 27.8 28.1 27.2 27.9 28.0 28.1Redcliffe 27.2 25.4 26.2 26.2 27.4 27.2 28.2 27.9 29.5 29.8 28.7 26.7 26.8 27.0 26.4 26.4 27.1 26.6 27.7 27.2 27.1 26.7 28.2 27.2 27.6 27.4 28.0 27.4 27.2 25.1 26.8Redlands HRS 25.4 24.5 27.4 27.3 27.4 27.5 28.0 32.0 29.7 29.6 27.2 27.0 27.3 27.9 27.5 28.5 27.4 29.8 28.0 27.8 28.7 28.1 27.5 27.6Tewantin RSL Park 27.2 −0.2 4 26.2 25.6 26.9 26.2 27.2 27.8 28.3 28.6 29.7 30.4 25.5 26.8 26.0 26.9 26.3 23.9 26.6 26.8 27.1 27.3 27.1 26.5 28.2 28.1 27.3 26.8 27.4 27.3 27.9 28.1 28.0Toolara (Kelly) 27.9 −1.7 1 27.8 23.5 25.5 25.1 26.8 24.6 25.3 27.3 31.2 32.7 24.3 25.1 26.3 28.2 28.6 25.7 28.2 27.8 29.6 30.2 24.8 26.2 30.7 30.3 30.0 28.8 30.7 28.5 30.7 31.6 29.7University of Queensland Gatton 28.3 −1.2 2 26.0 23.6 28.3 26.6 27.0 25.9 26.7 26.6 31.3 32.8 29.4 27.8 28.8 26.3 27.8 28.5 28.7 27.4 28.5 28.8 29.0 28.4 30.1 30.1 29.4 29.4 29.4 28.6 28.1 30.1 28.6
East Darling Downs (41) Mean Anom Decile 1 2 3 4 5 6 7 8 9 10 11 12 13 14 15 16 17 18 19 20 21 22 23 24 25 26 27 28 29 30 31Applethorpe 23.3 −0.6 3 18.9 17.6 20.6 22.3 21.7 19.1 23.3 22.8 25.7 26.9 22.7 20.7 21.4 20.6 22.8 22.9 22.7 23.1 24.1 23.0 26.9 27.3 25.1 25.3 24.3 26.0 26.9 24.7 25.4 26.4 21.5Dalby Airport 28.1 −2.1 1 25.4 22.7 25.7 27.4 27.8 27.4 25.1 29.9 29.6 30.2 29.9 26.7 27.6 26.8 28.1 29.2 28.6 28.0 27.9 28.6 29.4 26.6 30.7 30.0 28.6 28.7 29.7 28.6 29.5 30.1 26.9Goondiwindi Airport 29.5 −1.5 1 22.1 23.0 28.6 29.4 22.8 26.6 27.5 30.4 30.4 31.0 31.6 30.1 28.6 29.1 29.5 29.4 29.6 29.6 30.2 30.1 32.5 33.6 33.3 32.6 30.6 31.5 32.3 31.4 31.1 30.5 26.1Inglewood Forest 28.6 −2.0 1 22.7 23.7 28.2 28.9 25.7 25.3 26.5 30.0 29.4 29.4 30.8 27.9 27.9 27.1 28.3 28.8 28.7 28.8 29.1 29.0 31.3 32.3 30.8 30.7 29.8 30.3 30.6 30.5 29.4 30.5 25.3Oakey Aero 26.5 −2.2 1 24.0 22.0 25.4 25.1 25.0 24.9 25.4 27.1 28.8 29.2 27.3 25.2 26.0 24.2 26.1 26.3 26.6 25.5 25.9 27.2 27.8 27.9 28.7 28.1 27.5 27.6 28.4 27.6 27.1 28.2 26.8Stanthorpe Leslie Parade 23.7 −1.2 2 19.8 18.5 20.9 22.3 22.0 21.0 23.8 22.7 27.4 28.0 23.9 21.1 21.7 20.6 22.8 23.2 23.5 22.7 23.7 22.9 28.5 27.3 25.0 25.4 23.8 27.0 27.3 24.4 26.9 26.0 22.1Texas Post Office 29.4 −1.8 2 22.4 24.8 28.6 30.2 29.0 26.5 28.5 29.8 30.7 30.7 30.2 27.8 27.5 28.0 29.3 29.1 29.5 30.0 30.6 31.7 32.5 33.9 30.6 31.2 29.9 30.8 31.3 30.4 30.1 30.6 25.0Toowoomba Airport 23.9 −2.3 L 21.1 19.0 22.8 23.3 21.2 21.0 23.2 24.6 26.7 27.0 25.3 23.0 23.8 21.0 23.3 24.0 24.0 23.2 22.9 24.1 24.2 24.9 26.6 25.7 24.9 24.8 25.5 24.5 25.4 24.9Warwick 26.2 −1.5 1 22.7 23.6 26.6 25.6 24.9 23.0 24.6 25.4 28.5 29.7 25.5 24.3 24.7 24.1 25.3 25.7 25.3 25.8 24.9 26.4 28.9 29.0 28.5 28.2 27.3 28.4 29.5 27.6 26.8 27.2 24.0
West Darling Downs (42) Mean Anom Decile 1 2 3 4 5 6 7 8 9 10 11 12 13 14 15 16 17 18 19 20 21 22 23 24 25 26 27 28 29 30 31Miles Constance Street 28.8 −2.6 L 26.3 23.6 27.3 27.3 22.8 28.3 28.2 31.4 30.8 29.2 30.1 27.9 27.7 28.0 29.2 29.0 29.4 28.6 28.8 29.0 29.6 29.1 30.4 31.2 29.8 30.4 30.6 30.3 31.4 27.4
Maranoa (43) Mean Anom Decile 1 2 3 4 5 6 7 8 9 10 11 12 13 14 15 16 17 18 19 20 21 22 23 24 25 26 27 28 29 30 31Injune Post Office 28.6 −2.3 1 26.1 26.0 24.4 27.2 29.9 30.9 31.1 32.2 30.2 29.2 30.1 25.3 27.1 27.1 28.0 28.7 27.9 27.7 28.0 28.7 27.2 26.1 30.4 31.5 29.0 29.1 29.8 29.1 28.7 30.4 28.3Mitchell Post Office 29.4 −1.7 3 25.5 23.0 25.1 28.8 31.1 30.6 33.9 31.9 29.9 29.1 30.5 26.5 27.5 28.0 29.1 29.0 28.8 29.0 29.3 29.6 31.0 29.7 31.4 32.3 30.5 30.2 31.5 30.8 31.5 30.8 26.0Roma Airport 28.8 −2.6 1 25.9 21.9 25.4 26.8 29.0 29.9 31.0 31.3 29.3 29.2 30.3 26.5 27.1 27.8 28.1 28.6 28.6 28.6 28.8 29.4 31.1 28.5 30.5 32.4 29.9 30.1 29.9 30.3 29.7 26.6St George Airport 28.8 −3.3 L 20.9 20.0 24.3 28.3 28.8 29.6 31.2 30.7 28.3 28.1 30.1 28.4 27.7 28.1 28.5 28.8 28.8 29.5 28.9 29.3 31.2 31.4 31.6 32.3 30.1 30.3 31.2 30.3 30.3 29.4 26.1Surat 29.0 −2.8 1 23.2 21.7 26.0 28.6 27.9 29.7 29.4 30.4 29.2 29.1 30.6 28.9 27.9 28.1 28.9 29.2 29.2 28.7 29.1 29.2 31.6 27.8 31.2 32.6 30.4 30.2 31.1 30.9 30.8 30.6 25.4
Warrego (44) Mean Anom Decile 1 2 3 4 5 6 7 8 9 10 11 12 13 14 15 16 17 18 19 20 21 22 23 24 25 26 27 28 29 30 31Bollon Mary St 29.0 −3.0 1 22.1 20.8 22.2 26.5 28.3 30.3 31.1 29.0 28.0 27.9 29.2 29.2 28.4 28.5 29.5 29.5 29.4 30.2 29.8 30.3 31.6 31.8 31.7 32.8 31.8 31.9 32.2 31.9 32.1 26.1 25.5Charleville Aero 29.2 −2.8 1 24.1 26.2 27.5 27.7 29.5 30.8 32.5 29.3 29.2 28.6 28.3 26.3 27.7 28.3 29.6 29.7 29.3 29.5 28.8 29.6 32.8 30.1 30.9 30.9 30.8 29.9 30.4 30.9 30.5 29.7 25.6Cunnamulla Post Office 29.5 −2.9 1 20.9 20.8 22.7 29.4 28.2 31.3 32.4 28.3 28.1 27.6 27.6 30.0 28.7 28.8 30.3 30.7 30.8 30.7 29.9 31.1 32.0 32.7 31.8 32.1 33.6 32.5 32.5 32.5 33.1 25.6 27.4
Far Southwest (45) Mean Anom Decile 1 2 3 4 5 6 7 8 9 10 11 12 13 14 15 16 17 18 19 20 21 22 23 24 25 26 27 28 29 30 31Ballera Gas Field 30.9 22.3 21.9 26.4 31.7 33.8 27.6 27.3 27.9 27.0 26.8 32.4 31.9 30.9 30.9 32.2 31.9 32.7 32.4 31.8 33.5 34.6 33.6 32.7 34.4 34.4 33.4 34.2 34.7 31.6 31.4Quilpie Airport 30.6 −2.9 1 22.0 23.1 25.1 30.8 31.0 32.8 33.2 28.7 29.0 29.3 29.1 31.3 31.5 30.4 31.5 31.6 31.5 31.5 31.0 31.0 35.0 34.0 32.7 32.5 33.2 32.5 31.0 32.0 32.6 32.0 26.5Thargomindah Airport 30.4 −3.5 L 21.1 20.3 24.5 29.5 29.8 32.4 28.5 27.2 28.7 27.4 28.1 31.6 30.3 30.7 31.5 31.7 32.1 32.4 31.9 32.1 33.6 34.5 33.3 32.5 34.4 34.1 33.5 34.0 30.4 30.0
Monthly Weather Review Queensland March 2010
page 18

Daily and mean minimum temperatures for March 2010Mean is the average of the daily minimum temperature for March 2010; it is only shown if there are sufficient days available. Anom is thedifference between the mean daily minimum temperature for March 2010 and the long-term average minimum temperature for March.Decile is the decile rank of mean daily minimum temperature for March 2010 in the climate record of other March mean daily minimumtemperatures; “L” indicates this is the lowest on record, and “H” it is the highest on record. Anomalies and deciles are only shown if there aresufficient years of climate record available. The lowest and highest minimum temperatures for each site for March 2010 are highlighted.
North Peninsula (27) Mean Anom Decile 1 2 3 4 5 6 7 8 9 10 11 12 13 14 15 16 17 18 19 20 21 22 23 24 25 26 27 28 29 30 31Coconut Island 26.0 +0.2 8 26.5 27.6 28.1 25.4 25.7 26.4 27.8 27.2 25.2 24.4 26.0 25.1 26.1 24.5 26.4 25.6 25.7 26.9 26.8 26.3 26.8 26.2 27.5 26.8 24.7 23.7 25.8 24.4 25.9 23.6 26.2Coen Airport 23.7 24.8 25.2 24.7 24.6 23.6 23.6 24.4 24.7 24.8 23.6 23.6 23.8 24.3 22.5 23.8 22.4 22.9 23.5 23.3 22.1 22.3 21.5 24.9 25.1 23.6 22.9 23.5 23.8 23.3Horn Island 25.4 +0.4 9 25.9 26.8 29.2 25.3 25.3 25.0 24.8 23.6 24.4 24.5 25.5 25.7 25.6 25.5 24.4 25.6 26.9 27.2 26.4 27.0 26.1 25.7 26.8 25.4 23.2 23.5 26.6 22.8 25.2 24.1 24.8Scherger RAAF 23.5 22.7 23.2 22.9 22.2 23.4 24.7 25.1 22.9 24.2 24.6Weipa Aero 24.1 +0.3 8 25.1 26.7 25.9 25.3 25.0 24.0 23.1 24.2 23.5 24.3 24.8 23.1 23.8 23.3 22.6 23.3 23.8 23.4 23.4 23.2 22.4 23.9 23.8 25.5 24.9 22.9 23.6 24.0 24.6 24.2 24.8
South Peninsula (28) Mean Anom Decile 1 2 3 4 5 6 7 8 9 10 11 12 13 14 15 16 17 18 19 20 21 22 23 24 25 26 27 28 29 30 31Lockhart River Airport 23.9 +0.5 9 23.8 25.8 25.2 24.1 23.9 25.1 25.1 22.9 22.4 23.1 24.2 24.2 23.1 23.7 23.8 24.4 24.0 24.5 23.0 21.9 22.2 25.1 24.2 24.7 23.7 23.6 23.5 24.2 24.5 23.7Musgrave 23.1 +0.7 9 24.0 24.8 25.6 25.5 24.1 24.0 24.0 23.7 23.0 24.9 24.2 23.0 22.6 21.2 21.2 21.1 21.6 21.4 20.0 20.5 21.9 22.9 23.8 22.5 23.4 23.6 23.8 23.5 23.9 24.1 23.0Palmerville 22.1 +0.3 6 24.2 25.0 24.6 24.3 22.7 21.3 21.7 23.1 21.5 22.0 22.7 21.2 19.9 21.9 21.9 19.7 20.6 20.6 21.3 18.4 21.0 22.4 23.5 20.5 21.3 22.6 23.0 23.1 23.0 23.1 22.5
Lower Carpentaria (29) Mean Anom Decile 1 2 3 4 5 6 7 8 9 10 11 12 13 14 15 16 17 18 19 20 21 22 23 24 25 26 27 28 29 30 31Burketown Airport 23.6 0.0 5 25.3 23.9 21.3 22.7 23.6 24.9 23.5 23.8 23.4 21.6 24.8 25.0 24.4 25.9 22.1 22.1 21.9 23.0 22.0 21.1 22.1 25.5 24.0 26.3 24.9 24.5 25.3 24.6 23.7 23.3 22.5Century Mine 22.9 26.0 21.3 20.8 20.8 20.4 21.6 20.1 21.9 23.8 20.9 24.0 24.5 24.4 22.1 22.9 21.6 23.3 22.6 22.1 21.7 25.8 23.2 26.2 25.3 22.5 23.9 24.0 23.2 23.1 21.7Cloncurry Airport 22.1 −0.3 3 24.1 20.3 20.6 19.0 19.9 19.7 19.0 19.6 20.2 18.6 22.6 23.8 23.0 22.0 21.5 22.3 22.2 21.8 20.8 24.1 24.4 23.9 24.4 22.3 23.2 23.6 23.0 23.8 23.1 26.2Croydon Township 23.5 +0.2 6 24.6 23.9 22.6 22.5 23.3 23.8 23.3 22.5 24.0 23.3 23.5 23.7 24.1 23.9 23.0 23.6 23.1 21.3 22.0 20.7 23.2 25.9 25.0 23.8 23.4 24.7 24.7 23.7 24.9 23.8 23.7Julia Creek Airport 20.3 −0.2 5 25.2 21.5 19.8 19.1 18.5 19.0 16.2 18.0 17.1 16.4 22.9 21.8 23.5 20.0 18.6 18.2 18.4 19.3 17.7 17.9 20.8 23.3 24.1 22.2 18.9 20.9 20.2 19.7 22.8 22.4 25.0Kowanyama Airport 23.6 −0.1 3 26.5 22.2 23.1 23.5 23.3 23.6 23.7 24.3 23.2 24.5 23.6 24.1 23.7 23.0 22.4 23.7 23.3 22.7 22.1 22.9 21.4 23.1 25.6 23.9 24.8 24.5 23.8 24.2 24.1 24.0 23.5Mornington Island 25.5 +0.9 9 26.6 26.7 26.6 26.1 25.8 26.5 26.1 22.7 24.4 26.2 25.3 25.2 25.4 26.0 25.2 24.1 24.1 28.0 24.3 26.3 27.6 26.3 24.8 25.2 26.5 23.4 22.4Mount Isa Aero 21.3 −0.4 4 23.3 18.6 19.3 18.2 17.9 17.1 17.2 20.2 21.2 19.8 22.8 23.1 24.2 24.3 19.4 22.0 20.2 23.2 20.1 19.3 19.4 23.0 23.7 24.2 22.0 23.4 22.1 22.6 22.1 22.2 24.6Normanton Airport 24.4 0.0 5 24.4 23.8 22.2 24.7 24.9 25.4 25.5 23.9 24.5 22.6 23.9 26.3 25.0 25.7 23.8 23.9 23.5 23.8 23.4 22.7 23.8 26.5 24.9 25.7 24.5 25.9 26.0 23.5 24.6 23.7Sweers Island 26.1 +0.3 8 25.3 25.2 24.3 24.8 27.0 27.0 27.4 28.0 26.7 26.1 25.9 26.9 27.1 27.4 27.0 25.6 25.9 26.0 24.9 25.8 25.8 27.9 26.9 25.3 28.3 26.8 25.7 24.4 25.1 24.3 23.9
Upper Carpentaria (30) Mean Anom Decile 1 2 3 4 5 6 7 8 9 10 11 12 13 14 15 16 17 18 19 20 21 22 23 24 25 26 27 28 29 30 31Georgetown Airport 22.6 23.9 23.6 22.5 21.8 20.7 20.1 19.8 22.0 24.2 24.2 23.3 22.8 21.3 20.8 20.8 21.0 21.4 22.5 23.5 24.7 24.3 22.4 23.6 23.3 22.9 23.9 23.6 23.2Hughenden Airport 20.4 −0.8 4 23.5 22.4 21.5 21.7 18.5 19.0 17.5 16.5 18.9 21.6 21.3 21.2 21.4 20.1 18.9 19.3 18.8 18.3 18.0 18.8 23.4 22.3 23.0 20.9 19.5 20.4 21.7 19.7 20.8 21.9 22.7Richmond Airport 19.9 −1.0 3 24.0 21.3 20.8 20.0 18.7 20.0 18.2 17.6 16.0 20.8 21.6 20.0 21.6 20.0 19.9 17.4 17.6 17.4 16.7 18.3 21.3 22.2 22.9 21.7 17.9 21.9 20.6 18.6 20.2 20.4 22.6Richmond Post Office 20.2 −0.5 4 24.6 21.5 21.1 19.9 18.7 20.4 19.4 19.2 16.9 22.7 22.1 20.3 20.2 19.6 19.4 18.8 18.2 18.4 17.1 18.0 21.5 22.3 22.4 21.3 18.1 20.2 21.0 19.8 20.7 21.2 22.5
Barron North Coast (31) Mean Anom Decile 1 2 3 4 5 6 7 8 9 10 11 12 13 14 15 16 17 18 19 20 21 22 23 24 25 26 27 28 29 30 31Cairns Aero 23.7 +0.7 10 24.7 25.9 26.7 24.9 26.4 23.8 22.6 23.1 23.3 24.7 23.9 24.3 23.5 21.3 23.2 23.0 22.8 22.4 23.1 21.7 21.9 24.1 23.3 23.8 23.5 23.2 23.2 23.9 24.2 24.6 24.3Cape Flattery 24.1 24.7 26.5 25.5 23.9 24.8 23.9 23.8 24.4 23.0 24.1 25.1 23.4 25.7 23.6 23.7 24.0 24.0 24.1 23.6 22.8 22.3 24.2 24.6 23.8 24.4 24.6 23.9 24.1 25.1 24.7 21.7Cooktown Airport 24.0 +0.2 8 24.6 25.7 26.0 25.2 23.8 23.9 23.0 24.0 23.3 24.2 25.0 25.9 24.8 23.7 23.2 22.9 22.8 23.3 22.4 21.9 21.2 22.9 24.7 25.1 24.9 24.1 24.3 24.3 24.7 24.2 22.9Green Island 24.9 +0.1 6 26.8 25.9 27.0 28.1 26.8 26.1 25.0 27.3 24.1 24.1 24.2 22.9 24.5 23.9 22.7 23.1 24.5 25.1 24.5 24.2 24.8 23.9 24.0 24.5 24.7 25.1 25.2Kairi Research Station 19.2 +0.8 8 20.9 21.3 21.6 19.9 18.9 17.8 17.8 17.2 20.5 20.1 19.0 18.1 18.7 18.9 18.5 18.5 18.7 16.6 18.0 18.5 20.2 19.7 20.0 19.0 19.8 19.5 19.8 19.9 19.1Low Isles Lighthouse 25.3 +0.2 6 26.9 28.0 27.5 28.1 27.3 26.9 27.7 27.2 26.9 23.7 26.0 23.9 23.7 24.7 23.5 24.5 24.0 23.4 24.5 24.7 25.5 24.4 23.8 24.3 24.6 24.8 24.3 24.3Mareeba Airport 21.0 +0.6 9 22.4 22.9 23.5 21.3 20.4 20.3 19.5 19.8 19.7 22.2 21.0 20.3 20.4 20.0 21.0 20.5 19.8 19.9 19.4 20.3 21.9 21.8 21.4 21.4 21.2 21.6 21.7 21.9 21.4Walkamin Research Station 20.2 +0.7 9 21.7 22.7 23.0 20.8 20.8 19.7 18.9 18.4 19.8 21.3 21.0 20.3 19.7 19.5 19.7 19.2 19.4 19.4 19.0 19.1 19.3 20.2 20.7 21.0 20.2 20.5 19.8 20.5 20.4 20.8 20.2
Herbert North Coast (32) Mean Anom Decile 1 2 3 4 5 6 7 8 9 10 11 12 13 14 15 16 17 18 19 20 21 22 23 24 25 26 27 28 29 30 31Cardwell Marine Pde 23.4 +1.5 10 24.7 25.6 25.9 24.0 24.1 23.8 23.4 20.9 24.5 24.4 24.0 22.9 22.8 22.2 22.5 22.9 23.4 23.9 22.7 21.4 22.8 24.1 23.2 22.9 23.1 22.9 23.5 24.0 23.9 23.2 23.0Ingham Composite 22.7 +0.5 8 24.2 25.1 24.8 24.4 24.2 23.3 23.0 21.1 22.7 23.6 23.2 21.7 23.4 22.4 20.4 20.7 23.1 19.8 20.5 21.4 22.9 24.3 20.5 22.3 20.8 23.4 24.0 22.0 24.6 22.8 22.3Innisfail 23.4 +1.3 10 24.4 25.8 25.5 24.5 24.5 23.3 23.0 22.6 23.2 23.4 23.4 23.3 22.8 23.0 22.1 22.4 23.1 21.4 21.6 22.8 23.8 23.6 21.9 24.3 23.9 23.3 23.3 23.2 24.1 23.3 23.6Lucinda Point 24.5 −0.2 3 25.0 26.1 28.0 26.2 27.3 25.4 26.3 24.3 24.4 23.9 26.3 22.8 23.8 23.4 23.3 24.2 24.2 25.1 22.2 22.1 22.7 26.4 22.8 23.4 23.7 23.1 24.1 24.8 24.4 25.0 25.7South Johnstone Exp Stn 23.0 +1.1 10 24.1 24.6 24.2 23.7 22.8 22.0 22.2 20.9 22.8 21.6 22.9 24.2 22.5 22.7 22.8 22.4 22.4 22.5 21.4 23.0 23.5 22.5 24.2 23.8 23.1 23.1 23.1 24.0 22.7 22.9Townsville Aero 23.6 +0.7 8 25.0 26.4 25.8 25.4 26.0 24.1 24.3 24.4 25.5 23.8 24.7 22.7 22.6 22.0 22.7 21.5 22.1 21.9 22.4 22.8 23.7 24.2 20.6 22.2 22.4 24.0 24.0 22.5 24.6 23.6 23.0
East Central Coast (33) Mean Anom Decile 1 2 3 4 5 6 7 8 9 10 11 12 13 14 15 16 17 18 19 20 21 22 23 24 25 26 27 28 29 30 31Alva Beach 23.1 +0.2 6 25.0 26.8 25.6 25.0 25.6 23.6 23.8 24.5 24.5 22.9 23.3 22.7 22.6 21.0 20.8 20.8 21.1 21.0 20.8 20.9 23.4 24.3 21.8 21.7 21.9 22.4 22.3 22.0 25.3 24.8 24.6Ayr DPI Research Stn 22.3 +0.9 9 24.3 25.2 25.3 25.2 24.9 22.6 22.6 24.7 24.0 22.9 23.0 22.1 22.0 19.9 21.0 19.8 19.9 20.8 20.5 20.3 22.9 23.9 21.1 20.7 20.4 21.5 21.3 21.1 22.3 22.2 22.8Bowen Airport 23.1 +0.3 7 24.5 25.8 23.7 25.5 24.6 22.4 26.4 24.2 24.7 21.9 22.3 21.0 21.0 20.9 23.0 22.8 22.2 22.0 22.5 22.2 22.8 22.5 23.0 21.6 22.9Collinsville Post Office 20.2 +0.2 5 21.6 21.5 23.3 22.8 24.2 20.8 21.8 24.4 22.9 22.6 21.2 20.4 20.5 17.4 20.0 17.1 17.3 18.3 18.9 18.5 19.5 21.0 18.4 17.7 17.6 18.0 18.4 18.5 20.2 20.6Hamilton Island Airport 25.2 25.7 26.6 25.6 26.3 26.1 26.1 25.2 25.2 26.1 23.7 22.2 21.6 22.1 22.9 22.8 22.1 23.9 24.2 24.3 24.7 23.5 23.0 23.4Mackay Aero 22.7 +0.8 8 22.8 24.8 24.4 25.0 24.7 22.4 22.7 23.8 23.9 25.1 23.4 23.1 21.4 20.4 20.8 22.0 20.7 21.0 21.4 21.5 23.1 24.7 23.1 22.1 22.3 22.3 21.6 22.0 22.0 21.8 22.5Mackay M.O 22.8 +0.5 8 22.8 25.2 24.8 26.0 24.9 23.4 23.4 24.1 25.2 25.4 24.4 23.4 21.4 21.2 21.1 21.8 20.7 21.1 21.2 21.5 18.8 18.2 23.3 22.7 23.1 22.8 22.5 23.2 22.4 22.6 23.0Proserpine Airport 22.7 +1.3 H 23.5 25.3 24.1 24.4 23.6 21.8 23.4 24.5 24.6 23.2 22.2 21.5 21.4 21.1 20.5 22.2 22.6 23.0 21.9 22.1 22.0 22.1 22.3 21.9 22.2Samuel Hill Aero 21.9 +1.5 H 24.0 24.4 22.4 23.3 24.8 22.9 22.7 24.3 22.8 21.9 22.3 21.8 21.6 20.6 21.2 20.6 20.8 20.2 21.6 21.4 23.6 24.0 20.1 21.4 21.2 20.2 20.7 19.5 18.9 20.5St Lawrence Post Office 22.2 +1.1 10 23.8 25.8 23.9 24.2 25.2 23.3 24.4 25.0 23.6 23.5 23.2 22.4 22.5 19.5 19.9 20.5 20.9 20.9 19.7 21.3 22.5 24.0 21.7 21.1 20.6 21.6 20.8 21.0 21.0 20.7 20.5St Lawrence 22.2 23.4 25.2 23.6 24.1 25.3 23.1 24.3 25.1 24.1 23.8 23.2 22.5 22.6 20.0 20.2 20.6 20.8 20.9 19.7 21.1 22.4 24.0 22.0 21.1 20.2 21.8 20.4 20.9 21.3 20.6 20.7Te Kowai Exp Stn 22.5 25.0 24.3 24.2 24.1 21.7 23.1 23.5 22.7 21.4 20.0 20.6 20.8 20.8 20.6 16.4 21.4 21.0 21.5 20.5 20.5 21.2Williamson 22.2 24.7 25.3 23.3 23.5 24.9 24.5 24.4 24.3 24.3 23.0 22.9 21.7 21.6 20.6 20.3 20.9 20.7 20.3 19.5 20.6 23.3 23.5 22.1 20.8 20.6 21.5 20.6 21.1 21.9 20.5 20.7Woolshed 19.5 0.0 5 21.3 22.8 21.6 21.8 21.2 17.8 17.8 16.8 20.9 20.3 20.9 20.2 18.9 17.1 18.8 18.4 19.2 17.5 17.1 17.5 19.7 21.5 17.7 19.5 19.3 19.7 19.1 19.3 20.0 19.9 20.1Yeppoon The Esplanade 22.7 +0.3 7 25.3 23.9 20.8 23.1 24.2 23.6 23.9 24.3 23.8 26.2 23.5 21.4 22.8 20.6 21.0 21.9 20.8 21.5 22.0 23.3 24.1 21.6 21.4 22.4 21.3 21.7 22.4 22.5 23.4 22.4
West Central Coast (34) Mean Anom Decile 1 2 3 4 5 6 7 8 9 10 11 12 13 14 15 16 17 18 19 20 21 22 23 24 25 26 27 28 29 30 31Charters Towers Airport 20.9 +0.1 5 23.4 24.8 22.2 23.7 23.1 21.4 21.0 18.8 24.3 21.6 21.7 21.1 20.7 18.7 20.0 17.8 19.4 19.3 18.8 20.0 22.2 21.7 20.9 20.6 18.1 19.5 19.8 19.4 20.5 20.9 21.9Moranbah Water Treatment Plant 20.7 +0.5 7 22.2 24.9 23.7 23.4 22.8 20.8 22.6 23.6 22.5 22.5 22.4 20.7 20.6 18.2 19.1 18.0 18.6 19.2 17.7 19.3 21.1 22.1 21.1 17.9 18.8 18.4 18.5 19.5 19.1
Central Highlands (35) Mean Anom Decile 1 2 3 4 5 6 7 8 9 10 11 12 13 14 15 16 17 18 19 20 21 22 23 24 25 26 27 28 29 30 31Brigalow Research Stn 19.7 +1.0 9 23.3 23.2 19.8 22.0 22.0 20.5 22.5 23.5 20.5 22.2 18.5 21.1 17.5 17.6 17.8 18.0 16.5 18.0 18.0 21.6 22.3 19.6 18.5 17.6 17.5 17.3 18.1 18.8 18.1 20.1Clermont Sirius St 19.7 +0.3 6 22.1 24.4 22.1 22.0 22.6 20.2 20.0 22.8 21.7 22.3 21.2 20.0 19.9 17.0 17.8 17.3 18.5 18.0 16.6 17.5 20.5 21.4 20.4 18.1 18.2 17.4 17.1 17.4 18.8 19.1 19.3Emerald Airport 20.2 −0.1 3 22.5 24.3 22.0 22.4 22.2 21.8 21.1 23.6 22.6 22.9 19.8 21.7 18.6 17.8 17.8 17.4 19.2 18.7 17.8 18.5 21.6 22.3 20.6 19.0 18.7 17.6 18.2 18.4 19.4 17.7 19.3Rolleston 19.8 +1.4 9 22.2 21.8 20.8 21.4 21.5 21.8 21.4 23.7 22.4 23.3 20.6 20.6 20.8 15.4 17.8 17.0 18.9 17.4 20.6 20.8 20.2 20.4 18.4 16.8 15.5 17.2 18.7 18.2 18.3Springsure Comet St 19.3 +0.5 6 21.3 22.8 20.7 20.9 20.8 19.1 19.4 21.6 21.3 21.9 19.0 21.6 18.0 18.6 17.7 16.9 18.8 18.9 18.0 20.4 21.1 19.6 16.8 17.9 16.1 16.6 16.5 19.1 17.1 19.0Tambo Post Office 17.2 −0.3 5 22.4 21.5 21.0 20.0 19.4 17.6 15.3 17.9 16.8 18.5 17.3 16.9 16.5 14.4 15.5 13.8 14.0 14.2 13.9 13.8 19.4 22.1 19.0 17.1 17.0 14.3 15.2 14.0 19.8 16.1 18.2Taroom Post Office 18.9 +0.8 8 22.1 21.1 20.6 21.9 21.2 20.0 22.5 22.9 21.7 21.2 18.2 19.2 16.0 16.0 16.8 15.6 15.2 16.5 15.9 15.6 20.4 22.0 20.8 19.0 17.5 16.0 16.4 16.8 19.0 17.2 19.9
Central Lowlands (36) Mean Anom Decile 1 2 3 4 5 6 7 8 9 10 11 12 13 14 15 16 17 18 19 20 21 22 23 24 25 26 27 28 29 30 31Barcaldine Post Office 20.3 −0.5 4 23.8 21.6 21.3 21.6 19.4 19.4 19.4 20.9 19.0 21.5 21.7 21.0 20.2 19.1 18.9 19.5 19.6 18.7 18.9 18.4 19.4 23.2 21.9 18.9 19.4 19.1 20.3 19.4 20.9 22.8 19.8Blackall Airport 19.0 −0.9 3 23.5 21.2 21.3 20.8 19.4 18.0 17.5 19.5 17.2 20.5 21.4 19.0 18.9 17.8 16.8 17.0 16.8 17.4 17.1 16.5 22.5 23.1 21.5 18.8 18.9 16.8 17.7 16.9 18.8 18.9 18.7Isisford Post Office 19.7 −0.6 4 19.2 20.7 20.8 19.0 19.5 18.6 20.4 17.4 20.8 22.2 20.6 19.7 19.3 18.4 18.4 18.7 17.6 16.5 17.3 22.7 23.9 22.0 19.6 19.9 18.9 19.1 18.1 19.6 20.7 20.4Longreach Aero 19.1 −1.2 3 23.7 21.2 20.8 19.9 18.8 18.3 17.3 18.6 15.7 18.7 21.0 19.4 19.3 17.9 18.3 17.0 17.5 17.1 18.0 17.7 20.2 23.5 21.4 18.3 18.4 18.6 19.5 17.5 19.6 21.3 18.5
Upper Western (37) Mean Anom Decile 1 2 3 4 5 6 7 8 9 10 11 12 13 14 15 16 17 18 19 20 21 22 23 24 25 26 27 28 29 30 31Camooweal Township 21.1 −0.6 4 22.5 19.1 19.7 18.1 21.2 19.1 19.5 20.5 19.8 18.0 22.0 22.9 21.6 22.1 19.8 21.1 19.9 20.6 21.0 19.5 19.4 24.4 24.7 24.0 21.4 20.8 20.7 21.3 23.3 22.8 24.6The Monument Airport 20.2 −1.4 3 24.2 17.8 18.5 18.4 20.1 18.8 19.4 17.6 15.8 15.6 20.7 21.3 21.3 22.1 20.1 19.1 20.0 19.7 19.7 18.6 19.5 23.3 22.9 21.6 18.9 20.3 21.2 21.9 20.7 24.0 22.7Trepell Airport 19.8 −1.6 2 24.1 18.4 19.6 19.1 18.3 19.1 17.4 15.3 15.7 21.6 22.2 19.2 19.0 19.1 19.1 18.4 18.5 17.9 19.8 22.3 23.0 21.1 18.5 20.3 20.4 20.5 21.8 22.4 22.4Urandangi 19.3 −1.7 1 21.1 18.0 18.5 18.0 20.0 18.5 18.0 17.0 17.5 18.0 18.0 17.7 20.0 18.9 18.2 18.0 19.0 18.5 18.0 17.0 18.0 24.0 24.4 25.0 18.9 19.0 19.1 22.1 22.3 19.1Winton Airport 19.6 24.5 20.0 20.4 20.1 18.7 19.8 16.9 18.8 16.8 18.8 22.5 19.6 22.5 19.2 18.0 17.5 17.6 17.8 17.7 17.1 21.6 22.9 21.8 20.3 19.1 19.3 19.9 18.6 19.8 20.8 20.3Winton Post Office 20.5 −0.5 4 24.0 20.5 21.0 20.5 20.0 21.0 18.8 19.3 20.6 20.3 21.2 22.8 19.8 19.4 18.9 19.9 18.9 18.9 18.8 22.4 23.2 22.2 20.9 20.2 20.4 20.9 19.3 19.9 21.4 20.8
Lower Western (38) Mean Anom Decile 1 2 3 4 5 6 7 8 9 10 11 12 13 14 15 16 17 18 19 20 21 22 23 24 25 26 27 28 29 30 31Bedourie Police Station 20.8 −0.8 2 22.2 18.5 18.5 19.2 20.8 19.5 20.0 18.5 18.5 19.0 18.7 21.9 23.1 21.7 20.8 21.3 20.8 21.0 20.2 19.1 21.2 23.7 24.2 23.0 20.0 21.3 21.9 21.8 21.6 21.8 22.0Birdsville Airport 21.5 −0.1 5 19.3 19.0 21.0 19.5 21.0 21.4 19.4 18.0 18.1 19.8 17.4 18.2 20.8 23.6 24.0 23.7 24.6 24.1 24.2 22.9 22.4 23.5 24.2 22.1 20.5 22.5 23.5 22.2 21.7 22.9 21.6Boulia Airport 20.0 −1.8 1 23.0 16.7 17.4 17.8 18.8 18.4 16.2 17.9 17.9 18.0 17.9 16.4 21.5 21.1 20.3 19.9 20.2 20.0 21.4 18.8 21.4 23.9 21.8 22.2 21.3 20.4 22.0 21.3 21.9 21.1 23.3Windorah Post Office 20.3 −0.8 4 23.0 20.8 19.7 19.6 20.8 20.6 21.9 18.0 17.6 18.5 20.0 18.2 22.1 20.2 19.6 20.4 20.5 20.0 19.0 19.1 20.3 23.3 23.0 20.7 18.4 21.2 20.0 20.7 20.5 20.8 20.0
Port Curtis South Coast (39) Mean Anom Decile 1 2 3 4 5 6 7 8 9 10 11 12 13 14 15 16 17 18 19 20 21 22 23 24 25 26 27 28 29 30 31Baralaba Post Office 20.5 +1.2 9 24.3 24.3 21.3 22.8 22.2 22.0 23.2 24.2 21.7 22.6 21.2 21.3 18.3 18.7 18.7 18.3 18.3 18.9 19.5 18.7 22.0 22.5 20.5 19.0 18.3 17.2 18.0 19.0 18.7 18.5 20.1Bundaberg Aero 21.0 +1.1 9 24.1 22.4 22.1 21.6 23.0 22.0 21.9 22.6 22.3 22.4 22.5 21.1 20.2 18.9 19.8 19.7 19.2 18.9 20.3 20.2 22.7 22.4 20.7 20.5 19.1 20.4 18.7 20.8 19.9 19.9 21.1Gayndah Airport 19.3 23.3 21.5 21.3 21.4 22.6 21.1 21.8 21.5 19.7 21.6 21.7 20.0 16.7 18.4 17.6 19.1 16.5 17.3 19.1 18.3 22.7 22.0 17.1 17.7 16.1 17.0 14.6 18.2 16.9 17.4 19.2Gladstone Airport 22.3 +0.7 9 25.3 23.8 21.9 23.7 24.3 22.2 24.3 22.8 23.1 23.2 23.6 22.8 21.9 21.1 21.3 21.2 22.0 21.1 20.7 22.5 22.7 24.2 21.6 20.9 22.3 21.3 21.1 21.7 20.6 21.3 21.1Gladstone Radar 22.0 +0.5 8 25.1 22.8 21.2 23.0 23.7 22.0 24.0 22.1 23.2 23.9 23.6 22.0 21.0 20.3 20.7 20.8 21.1 20.3 20.0 21.5 22.2 23.7 22.1 21.6 21.5 21.2 21.4 21.4 21.3 21.2 21.9Lady Elliot Island 23.9 +0.5 9 25.3 23.7 24.4 24.9 23.4 24.9 23.7 24.0 25.7 25.4 23.0 22.7 22.7 23.9 20.9 22.2 22.8 23.5 24.9 25.1 24.1 24.0 23.6 24.6 24.1 24.5 22.6 24.0Monto Township 18.3 +1.1 8 22.2 22.0 20.1 20.4 21.6 20.4 21.6 19.6 20.3 20.0 18.4 15.3 16.9 17.1 17.5 14.7 16.0 16.9 16.9 20.6 21.6 16.6 16.2 15.2 14.2 15.8 18.4 17.2 16.7 17.9Rockhampton Aero 22.1 +1.3 10 25.2 25.3 22.4 24.0 24.1 23.8 24.6 23.6 23.5 23.6 23.5 21.7 21.1 19.4 20.4 20.2 20.3 21.0 20.1 21.0 22.4 23.8 21.8 20.7 20.7 20.9 20.7 21.7 20.8 20.5 21.8Rundle Island 23.0 −0.7 1 26.1 23.6 22.5 23.4 24.6 24.7 25.5 25.1 23.5 26.2 22.7 22.8 22.0 20.8 20.7 22.9 21.0 21.1 20.6 21.8 23.4 24.8 23.7 22.7 21.6 23.3 22.1 21.3 21.0 23.4 23.7Sandy Cape Lighthouse 22.0 +0.3 7 23.6 22.0 22.3 21.9 23.2 20.1 21.8 23.2 23.4 23.8 22.3 21.5 19.8 20.7 20.4 22.2 20.5 20.6 20.8 22.3 23.7 22.8 23.6 22.6 22.6 20.6 21.9 21.1 22.2 20.9 22.6Seventeen Seventy 21.7 +0.3 8 25.0 23.0 21.5 21.8 22.9 22.5 23.5 23.0 22.9 22.2 23.5 22.0 20.0 19.0 19.7 20.2 20.3 19.5 21.5 21.3 22.5 24.0 22.1 21.5 21.0 20.9 20.8 21.5 21.0 22.0 21.2Thangool Airport 18.8 +1.2 9 23.1 22.8 21.1 22.2 23.0 20.1 23.0 22.3 19.2 20.4 19.7 20.1 16.9 18.1 17.5 17.0 16.0 15.0 16.3 14.8 22.0 22.3 17.7 16.4 16.4 15.6 16.3 17.0 16.1 15.6 17.6
Moreton South Coast (40) Mean Anom Decile 1 2 3 4 5 6 7 8 9 10 11 12 13 14 15 16 17 18 19 20 21 22 23 24 25 26 27 28 29 30 31Amberley AMO 18.2 +0.5 7 22.4 19.5 19.7 19.6 21.2 22.1 21.1 21.3 18.9 21.4 19.6 20.0 16.1 17.9 16.5 15.0 15.2 16.6 16.3 15.6 19.6 18.4 17.9 17.8 14.0 16.7 14.8 17.3 18.1 16.3 17.2Archerfield Airport 19.2 +1.0 9 22.8 20.2 20.2 20.8 22.4 22.4 21.6 22.0 19.3 21.9 20.2 19.8 17.9 17.5 16.3 16.7 17.0 18.0 17.8 17.3 19.7 18.6 19.3 18.0 15.7 19.0 15.7 18.4 20.4 17.6 19.7Beaudesert Drumley Street 17.8 21.9 19.1 18.7 20.2 18.7 21.8 21.1 21.1 18.5 21.3 18.3 19.2 16.8 17.5 17.1 14.7 15.5 14.6 16.5 15.3 18.0 16.8 17.3 17.5 13.6 16.6 14.3 17.5 17.7 16.7 17.9Beerburrum Forest Station 19.2 +0.8 9 22.2 20.9 20.1 21.0 21.1 22.9 20.7 21.6 18.9 21.2 20.9 19.5 17.6 18.0 16.9 18.0 16.4 18.0 18.2 17.4 20.0 19.4 18.0 19.2 17.0 17.9 15.9 18.6 19.5 18.8 18.2Brisbane Aero 20.0 +0.6 7 21.9 21.0 21.2 21.5 22.8 23.4 22.6 22.7 20.2 22.3 21.5 19.7 18.0 17.8 17.6 18.5 17.5 17.8 18.4 19.3 20.7 20.0 19.9 19.4 17.4 19.9 17.7 20.2 20.2 19.4 21.0
Monthly Weather Review Queensland March 2010
page 19
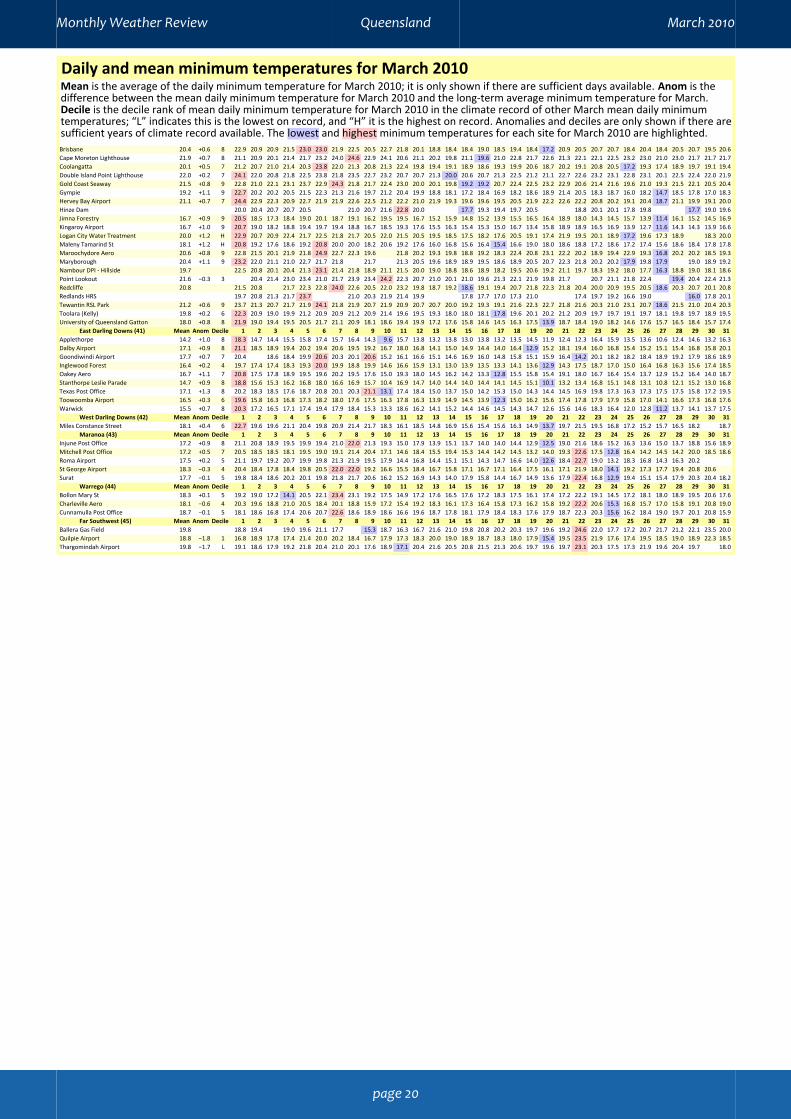
Daily and mean minimum temperatures for March 2010Mean is the average of the daily minimum temperature for March 2010; it is only shown if there are sufficient days available. Anom is thedifference between the mean daily minimum temperature for March 2010 and the long-term average minimum temperature for March.Decile is the decile rank of mean daily minimum temperature for March 2010 in the climate record of other March mean daily minimumtemperatures; “L” indicates this is the lowest on record, and “H” it is the highest on record. Anomalies and deciles are only shown if there aresufficient years of climate record available. The lowest and highest minimum temperatures for each site for March 2010 are highlighted.Brisbane 20.4 +0.6 8 22.9 20.9 20.9 21.5 23.0 23.0 21.9 22.5 20.5 22.7 21.8 20.1 18.8 18.4 18.4 19.0 18.5 19.4 18.4 17.2 20.9 20.5 20.7 20.7 18.4 20.4 18.4 20.5 20.7 19.5 20.6Cape Moreton Lighthouse 21.9 +0.7 8 21.1 20.9 20.1 21.4 21.7 23.2 24.0 24.6 22.9 24.1 20.6 21.1 20.2 19.8 21.1 19.6 21.0 22.8 21.7 22.6 21.3 22.1 22.1 22.5 23.2 23.0 21.0 23.0 21.7 21.7 21.7Coolangatta 20.1 +0.5 7 21.2 20.7 21.0 21.4 20.3 23.8 22.0 21.3 20.8 21.3 22.4 19.8 19.4 19.1 18.9 18.6 19.3 19.9 20.6 18.7 20.2 19.1 20.8 20.5 17.2 19.3 17.4 18.9 19.7 19.1 19.4Double Island Point Lighthouse 22.0 +0.2 7 24.1 22.0 20.8 21.8 22.5 23.8 21.8 23.5 22.7 23.2 20.7 20.7 21.3 20.0 20.6 20.7 21.3 22.5 21.2 21.1 22.7 22.6 23.2 23.1 22.8 23.1 20.1 22.5 22.4 22.0 21.9Gold Coast Seaway 21.5 +0.8 9 22.8 21.0 22.1 23.1 23.7 22.9 24.3 21.8 21.7 22.4 23.0 20.0 20.1 19.8 19.2 19.2 20.7 22.4 22.5 23.2 22.9 20.6 21.4 21.6 19.6 21.0 19.3 21.5 22.1 20.5 20.4Gympie 19.2 +1.1 9 22.7 20.2 20.2 20.5 21.5 22.3 21.3 21.6 19.7 21.2 20.4 19.9 18.8 18.1 17.2 18.4 16.9 18.2 18.6 18.9 21.4 20.5 18.3 18.7 16.0 18.2 14.7 18.5 17.8 17.0 18.3Hervey Bay Airport 21.1 +0.7 7 24.4 22.9 22.3 20.9 22.7 21.9 21.9 22.6 22.5 21.2 22.2 21.0 21.9 19.3 19.6 19.6 19.5 20.5 21.9 22.2 22.6 22.2 20.8 20.2 19.1 20.4 18.7 21.1 19.9 19.1 20.0Hinze Dam 20.0 20.4 20.7 20.7 20.5 21.0 20.7 21.6 22.8 20.0 17.7 19.3 19.4 19.7 20.5 18.8 20.1 20.1 17.8 19.8 17.7 19.0 19.6Jimna Forestry 16.7 +0.9 9 20.5 18.5 17.3 18.4 19.0 20.1 18.7 19.1 16.2 19.5 19.5 16.7 15.2 15.9 14.8 15.2 13.9 15.5 16.5 16.4 18.9 18.0 14.3 14.5 15.7 13.9 11.4 16.1 15.2 14.5 16.9Kingaroy Airport 16.7 +1.0 9 20.7 19.0 18.2 18.8 19.4 19.7 19.4 18.8 16.7 18.5 19.3 17.6 15.5 16.3 15.4 15.3 15.0 16.7 13.4 15.8 18.9 18.9 16.5 16.9 13.9 12.7 11.6 14.3 14.3 13.9 16.6Logan City Water Treatment 20.0 +1.2 H 22.9 20.7 20.9 22.4 21.7 22.5 21.8 21.7 20.5 22.0 21.5 20.5 19.5 18.5 17.5 18.2 17.6 20.5 19.1 17.4 21.9 19.5 20.1 18.9 17.2 19.6 17.3 18.9 18.3 20.0Maleny Tamarind St 18.1 +1.2 H 20.8 19.2 17.6 18.6 19.2 20.8 20.0 20.0 18.2 20.6 19.2 17.6 16.0 16.8 15.6 16.4 15.4 16.6 19.0 18.0 18.6 18.8 17.2 18.6 17.2 17.4 15.6 18.6 18.4 17.8 17.8Maroochydore Aero 20.6 +0.8 9 22.8 21.5 20.1 21.9 21.8 24.9 22.7 22.3 19.6 21.8 20.2 19.3 19.8 18.8 19.2 18.3 22.4 20.8 23.1 22.2 20.2 18.9 19.4 22.9 19.3 16.8 20.2 20.2 18.5 19.3Maryborough 20.4 +1.1 9 23.2 22.0 21.1 21.0 22.7 21.7 21.8 21.7 21.3 20.5 19.6 18.9 18.9 19.5 18.6 18.9 20.5 20.7 22.3 21.8 20.2 20.2 17.9 19.8 17.9 19.0 18.9 19.2Nambour DPI - Hillside 19.7 22.5 20.8 20.1 20.4 21.3 23.1 21.4 21.8 18.9 21.1 21.5 20.0 19.0 18.8 18.6 18.9 18.2 19.5 20.6 19.2 21.1 19.7 18.3 19.2 18.0 17.7 16.3 18.8 19.0 18.1 18.6Point Lookout 21.6 −0.3 3 20.4 21.4 23.0 23.4 21.0 21.7 23.9 23.4 24.2 22.3 20.7 21.0 20.1 21.0 19.6 21.3 22.1 21.9 19.8 21.7 20.7 21.1 21.8 22.4 19.4 20.4 22.4 21.3Redcliffe 20.8 21.5 20.8 21.7 22.3 22.8 24.0 22.6 20.5 22.0 23.2 19.8 18.7 19.2 18.6 19.1 19.4 20.7 21.8 22.3 21.8 20.4 20.0 20.9 19.5 20.5 18.6 20.3 20.7 20.1 20.8Redlands HRS 19.7 20.8 21.3 21.7 23.7 21.0 20.3 21.9 21.4 19.9 17.8 17.7 17.0 17.3 21.0 17.4 19.7 19.2 16.6 19.0 16.0 17.8 20.1Tewantin RSL Park 21.2 +0.6 9 23.7 21.3 20.7 21.7 21.9 24.1 21.8 21.9 20.7 21.9 20.9 20.7 20.7 20.0 19.2 19.3 19.1 21.6 22.3 22.7 21.8 21.6 20.3 21.0 23.1 20.7 18.6 21.5 21.0 20.4 20.3Toolara (Kelly) 19.8 +0.2 6 22.3 20.9 19.0 19.9 21.2 20.9 20.9 21.2 20.9 21.4 19.6 19.5 19.3 18.0 18.0 18.1 17.8 19.6 20.1 20.2 21.2 20.9 19.7 19.7 19.1 19.7 18.1 19.8 19.7 18.9 19.5University of Queensland Gatton 18.0 +0.8 8 21.9 19.0 19.4 19.5 20.5 21.7 21.1 20.9 18.1 18.6 19.4 19.9 17.2 17.6 15.8 14.6 14.5 16.3 17.5 13.9 18.7 18.4 19.0 18.2 14.6 17.6 15.7 16.5 18.4 15.7 17.4
East Darling Downs (41) Mean Anom Decile 1 2 3 4 5 6 7 8 9 10 11 12 13 14 15 16 17 18 19 20 21 22 23 24 25 26 27 28 29 30 31Applethorpe 14.2 +1.0 8 18.3 14.7 14.4 15.5 15.8 17.4 15.7 16.4 14.3 9.6 15.7 13.8 13.2 13.8 13.0 13.8 13.2 13.5 14.5 11.9 12.4 12.3 16.4 15.9 13.5 13.6 10.6 12.4 14.6 13.2 16.3Dalby Airport 17.1 +0.9 8 21.1 18.5 18.9 19.4 20.2 19.4 20.6 19.5 19.2 16.7 18.0 16.8 14.1 15.0 14.9 14.4 14.0 16.4 12.9 15.2 18.1 19.4 16.0 16.8 15.4 15.2 15.1 15.4 16.8 15.8 20.1Goondiwindi Airport 17.7 +0.7 7 20.4 18.6 18.4 19.9 20.6 20.3 20.1 20.6 15.2 16.1 16.6 15.1 14.6 16.9 16.0 14.8 15.8 15.1 15.9 16.4 14.2 20.1 18.2 18.2 18.4 18.9 19.2 17.9 18.6 18.9Inglewood Forest 16.4 +0.2 4 19.7 17.4 17.4 18.3 19.3 20.0 19.9 18.8 19.9 14.6 16.6 15.9 13.1 13.0 13.9 13.5 13.3 14.1 13.6 12.9 14.3 17.5 18.7 17.0 15.0 16.4 16.8 16.3 15.6 17.4 18.5Oakey Aero 16.7 +1.1 7 20.8 17.5 17.8 18.9 19.5 19.6 20.2 19.5 17.6 15.0 19.3 18.0 14.5 16.2 14.2 13.3 12.8 15.5 15.8 15.4 19.1 18.0 16.7 16.4 15.4 13.7 12.9 15.2 16.4 14.0 18.7Stanthorpe Leslie Parade 14.7 +0.9 8 18.8 15.6 15.3 16.2 16.8 18.0 16.6 16.9 15.7 10.4 16.9 14.7 14.0 14.4 14.0 14.4 14.1 14.5 15.1 10.1 13.2 13.4 16.8 15.1 14.8 13.1 10.8 12.1 15.2 13.0 16.8Texas Post Office 17.1 +1.3 8 20.2 18.3 18.5 17.6 18.7 20.8 20.1 20.3 21.1 13.1 17.4 18.4 15.0 13.7 15.0 14.2 15.3 15.0 14.3 14.4 14.5 16.9 19.8 17.3 16.3 17.3 17.5 17.5 15.8 17.2 19.5Toowoomba Airport 16.5 +0.3 6 19.6 15.8 16.3 16.8 17.3 18.2 18.0 17.6 17.5 16.3 17.8 16.3 13.9 14.9 14.5 13.9 12.3 15.0 16.2 15.6 17.4 17.8 17.9 17.9 15.8 17.0 14.1 16.6 17.3 16.8 17.6Warwick 15.5 +0.7 8 20.3 17.2 16.5 17.1 17.4 19.4 17.9 18.4 15.3 13.3 18.6 16.2 14.1 15.2 14.4 14.6 14.5 14.3 14.7 12.6 15.6 14.6 18.3 16.4 12.0 12.8 11.2 13.7 14.1 13.7 17.5
West Darling Downs (42) Mean Anom Decile 1 2 3 4 5 6 7 8 9 10 11 12 13 14 15 16 17 18 19 20 21 22 23 24 25 26 27 28 29 30 31Miles Constance Street 18.1 +0.4 6 22.7 19.6 19.6 21.1 20.4 19.8 20.9 21.4 21.7 18.3 16.1 18.5 14.8 16.9 15.6 15.4 15.6 16.3 14.9 13.7 19.7 21.5 19.5 16.8 17.2 15.2 15.7 16.5 18.2 18.7
Maranoa (43) Mean Anom Decile 1 2 3 4 5 6 7 8 9 10 11 12 13 14 15 16 17 18 19 20 21 22 23 24 25 26 27 28 29 30 31Injune Post Office 17.2 +0.9 8 21.1 20.8 18.9 19.5 19.9 19.4 21.0 22.0 21.3 19.3 15.0 17.9 13.9 15.1 13.7 14.0 14.0 14.4 12.9 12.5 19.0 21.6 18.6 15.2 16.3 13.6 15.0 13.7 18.8 15.6 18.9Mitchell Post Office 17.2 +0.5 7 20.5 18.5 18.5 18.1 19.5 19.0 19.1 21.4 20.4 17.1 14.6 18.4 15.5 19.4 15.3 14.4 14.2 14.5 13.2 14.0 19.3 22.6 17.5 12.8 16.4 14.2 14.5 14.2 20.0 18.5 18.6Roma Airport 17.5 +0.2 5 21.1 19.7 19.2 20.7 19.9 19.8 21.3 21.9 19.5 17.9 14.4 16.8 14.4 15.1 15.1 14.3 14.7 16.6 14.0 12.6 18.4 22.7 19.0 13.2 18.3 16.8 14.3 16.3 20.2St George Airport 18.3 −0.3 4 20.4 18.4 17.8 18.4 19.8 20.5 22.0 22.0 19.2 16.6 15.5 18.4 16.7 15.8 17.1 16.7 17.1 16.4 17.5 16.1 17.1 21.9 18.0 14.1 19.2 17.3 17.7 19.4 20.8 20.6Surat 17.7 −0.1 5 19.8 18.4 18.6 20.2 20.1 19.8 21.8 21.7 20.6 16.2 15.2 16.9 14.3 14.0 17.9 15.8 14.4 16.7 14.9 13.6 17.9 22.4 16.8 12.9 19.4 15.1 15.4 17.9 20.3 20.4 18.2
Warrego (44) Mean Anom Decile 1 2 3 4 5 6 7 8 9 10 11 12 13 14 15 16 17 18 19 20 21 22 23 24 25 26 27 28 29 30 31Bollon Mary St 18.3 +0.1 5 19.2 19.0 17.2 14.1 20.5 22.1 23.4 23.1 19.2 17.5 14.9 17.2 17.6 16.5 17.6 17.2 18.3 17.5 16.1 17.4 17.2 22.2 19.1 14.5 17.2 18.1 18.0 18.9 19.5 20.6 17.6Charleville Aero 18.1 −0.6 4 20.3 19.6 18.8 21.0 20.5 18.4 20.1 18.8 15.9 17.2 15.4 19.2 18.3 16.1 17.3 16.4 15.8 17.3 16.2 15.8 19.2 22.2 20.6 15.3 16.8 15.7 17.0 15.8 19.1 20.8 19.0Cunnamulla Post Office 18.7 −0.1 5 18.1 18.6 16.8 17.4 20.6 20.7 22.6 18.6 18.9 18.6 16.6 19.6 18.7 17.8 18.1 17.9 18.4 18.3 17.6 17.9 18.7 22.3 20.3 15.6 16.2 18.4 19.0 19.7 20.1 20.8 15.9
Far Southwest (45) Mean Anom Decile 1 2 3 4 5 6 7 8 9 10 11 12 13 14 15 16 17 18 19 20 21 22 23 24 25 26 27 28 29 30 31Ballera Gas Field 19.8 18.8 19.4 19.0 19.6 21.1 17.7 15.3 18.7 16.3 16.7 21.6 21.0 19.8 20.8 20.2 20.3 19.7 19.6 19.2 24.6 22.0 17.7 17.2 20.7 21.7 21.2 22.1 23.5 20.0Quilpie Airport 18.8 −1.8 1 16.8 18.9 17.8 17.4 21.4 20.0 20.2 18.4 16.7 17.9 17.3 18.3 20.0 19.0 18.9 18.7 18.3 18.0 17.9 15.4 19.5 23.5 21.9 17.6 17.4 19.5 18.5 19.0 18.9 22.3 18.5Thargomindah Airport 19.8 −1.7 L 19.1 18.6 17.9 19.2 21.8 20.4 21.0 20.1 17.6 18.9 17.1 20.4 21.6 20.5 20.8 21.5 21.3 20.6 19.7 19.6 19.7 23.1 20.3 17.5 17.3 21.9 19.6 20.4 19.7 18.0
Monthly Weather Review Queensland March 2010
page 20
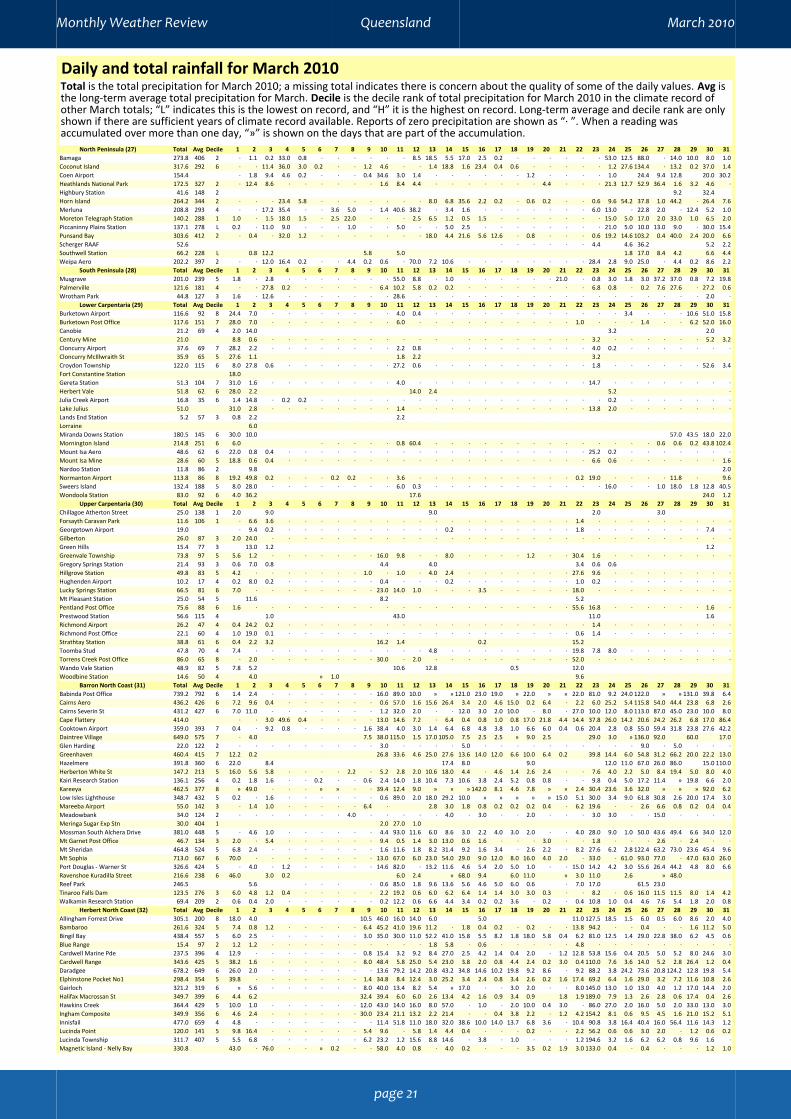
Daily and total rainfall for March 2010Total is the total precipitation for March 2010; a missing total indicates there is concern about the quality of some of the daily values. Avg isthe long-term average total precipitation for March. Decile is the decile rank of total precipitation for March 2010 in the climate record ofother March totals; “L” indicates this is the lowest on record, and “H” it is the highest on record. Long-term average and decile rank are onlyshown if there are sufficient years of climate record available. Reports of zero precipitation are shown as “· ”. When a reading wasaccumulated over more than one day, “»” is shown on the days that are part of the accumulation.
North Peninsula (27) Total Avg Decile 1 2 3 4 5 6 7 8 9 10 11 12 13 14 15 16 17 18 19 20 21 22 23 24 25 26 27 28 29 30 31Bamaga 273.8 406 2 · 1.1 0.2 33.0 0.8 · · · · · · 8.5 18.5 5.5 17.0 2.5 0.2 · · · · · · 53.0 12.5 88.0 · 14.0 10.0 8.0 1.0Coconut Island 317.6 292 6 · · 11.4 36.0 3.0 0.2 · · 1.2 4.6 · · 1.4 18.8 1.6 23.4 0.4 0.6 · · · · · 1.2 27.6 134.4 · 13.2 0.2 37.0 1.4Coen Airport 154.4 · 1.8 9.4 4.6 0.2 · · · 0.4 34.6 3.0 1.4 · · · · · · 1.2 · · · · 1.0 24.4 9.4 12.8 20.0 30.2Heathlands National Park 172.5 327 2 · 12.4 8.6 · · · · · · 1.6 8.4 4.4 · · · · · · · 4.4 · · · 21.3 12.7 52.9 36.4 1.6 3.2 4.6 ·Highbury Station 41.6 148 2 9.2 32.4Horn Island 264.2 344 2 · · · 23.4 5.8 · · · · · · · 8.0 6.8 35.6 2.2 0.2 · 0.6 0.2 · · 0.6 9.6 54.2 37.8 1.0 44.2 · 26.4 7.6Merluna 208.8 293 4 · · 17.2 35.4 · · 3.6 5.0 · 1.4 40.6 38.2 · 3.4 1.6 · · · · · · · 6.0 13.0 · 22.8 2.0 · 12.4 5.2 1.0Moreton Telegraph Station 140.2 288 1 1.0 · 1.5 18.0 1.5 · 2.5 22.0 · · · 2.5 6.5 1.2 0.5 1.5 · · · · · · · 15.0 5.0 17.0 2.0 33.0 1.0 6.5 2.0Piccaninny Plains Station 137.1 278 L 0.2 · 11.0 9.0 · · · 1.0 · · 5.0 · · 5.0 2.5 · · · · · · · · 21.0 5.0 10.0 13.0 9.0 · 30.0 15.4Punsand Bay 303.6 412 2 · 0.4 · 32.0 1.2 · · · · · · · 18.0 4.4 21.6 5.6 12.6 · 0.8 · · · 0.6 19.2 14.6 103.2 0.4 40.0 2.4 20.0 6.6Scherger RAAF 52.6 · · · · · · 4.4 4.6 36.2 5.2 2.2Southwell Station 66.2 228 L 0.8 12.2 5.8 5.0 1.8 17.0 8.4 4.2 6.6 4.4Weipa Aero 202.2 397 2 · · 12.0 16.4 0.2 · · 4.4 0.2 0.6 · 70.0 7.2 10.6 · · · · · · · · 28.4 2.8 9.0 25.0 · 4.4 0.2 8.6 2.2
South Peninsula (28) Total Avg Decile 1 2 3 4 5 6 7 8 9 10 11 12 13 14 15 16 17 18 19 20 21 22 23 24 25 26 27 28 29 30 31Musgrave 201.0 239 5 1.8 · 2.8 · · · · · · · 55.0 8.8 · 1.0 · · · · · · 21.0 · 0.8 3.0 1.8 3.0 37.2 37.0 0.8 7.2 19.8Palmerville 121.6 181 4 · · 27.8 0.2 · · · · · 6.4 10.2 5.8 0.2 0.2 · · · · · · · · 6.8 0.8 · 0.2 7.6 27.6 · 27.2 0.6Wrotham Park 44.8 127 3 1.6 · 12.6 · · · · · · · 28.6 · · · · · · · · · · · · · · · · · · 2.0 ·
Lower Carpentaria (29) Total Avg Decile 1 2 3 4 5 6 7 8 9 10 11 12 13 14 15 16 17 18 19 20 21 22 23 24 25 26 27 28 29 30 31Burketown Airport 116.6 92 8 24.4 7.0 · · · · · · · · 4.0 0.4 · · · · · · · · · · · · 3.4 · · · 10.6 51.0 15.8Burketown Post Office 117.6 151 7 28.0 7.0 · · · · · · · · 6.0 · · · · · · · · · · 1.0 · · · 1.4 · · 6.2 52.0 16.0Canobie 21.2 69 4 2.0 14.0 3.2 2.0Century Mine 21.0 8.8 0.6 · · · · · · · · · · · · · · · · · · · 3.2 · · · · · · 5.2 3.2Cloncurry Airport 37.6 69 7 28.2 2.2 · · · · · · · · 2.2 0.8 · · · · · · · · · 4.0 0.2 · · · · · · ·Cloncurry McIllwraith St 35.9 65 5 27.6 1.1 1.8 2.2 3.2Croydon Township 122.0 115 6 8.0 27.8 0.6 · · · · · · · 27.2 0.6 · · · · · · · · · · 1.8 · · · · · · 52.6 3.4Fort Constantine Station 18.0Gereta Station 51.3 104 7 31.0 1.6 · · · · · · · · 4.0 · · · · · · · · · · · 14.7 · · · · · · · ·Herbert Vale 51.8 62 6 28.0 2.2 14.0 2.4 5.2 ·Julia Creek Airport 16.8 35 6 1.4 14.8 · 0.2 0.2 · · · · · · · · · · · · · · · · · · 0.2 · · · · · · ·Lake Julius 51.0 31.0 2.8 · · · · · · · · 1.4 · · · · · · · · · · · 13.8 2.0 · · · · · · ·Lands End Station 5.2 57 3 0.8 2.2 2.2Lorraine 6.0Miranda Downs Station 180.5 145 6 30.0 10.0 57.0 43.5 18.0 22.0Mornington Island 214.8 251 6 6.0 · · · · · 0.8 60.4 · · · · · · · · · · · · · · 0.6 0.6 0.2 43.8 102.4Mount Isa Aero 48.6 62 6 22.0 0.8 0.4 · · · · · · · · · · · · · · · · · · · 25.2 0.2 · · · · · · ·Mount Isa Mine 28.6 60 5 18.8 0.6 0.4 · · · · · · · · · · · · · · · · · · · 6.6 0.6 · · · · · · 1.6Nardoo Station 11.8 86 2 9.8 2.0Normanton Airport 113.8 86 8 19.2 49.8 0.2 · · · 0.2 0.2 · · 3.6 · · · · · · · · · · 0.2 19.0 · · · · 11.8 · 9.6Sweers Island 132.4 188 5 8.0 28.0 · · · · · · · · 6.0 0.3 · · · · · · · · · · · 16.0 · · 1.0 18.0 1.8 12.8 40.5Wondoola Station 83.0 92 6 4.0 36.2 17.6 24.0 1.2
Upper Carpentaria (30) Total Avg Decile 1 2 3 4 5 6 7 8 9 10 11 12 13 14 15 16 17 18 19 20 21 22 23 24 25 26 27 28 29 30 31Chillagoe Atherton Street 25.0 138 1 2.0 9.0 9.0 2.0 3.0Forsayth Caravan Park 11.6 106 1 · 6.6 3.6 · · · · · · · · · · · · · · · · · · 1.4 · · · · · · · · ·Georgetown Airport 19.0 · 9.4 0.2 · · · · · · · · · · 0.2 · · · · · · · 1.8 · · · · · · · 7.4 ·Gilberton 26.0 87 3 2.0 24.0 · · · · · · · · · · · · · · · · · · · · · · · · · · · · ·Green Hills 15.4 77 3 13.0 1.2 1.2Greenvale Township 73.8 97 5 5.6 1.2 · · · · · · · 16.0 9.8 · · 8.0 · · · · 1.2 · · 30.4 1.6 · · · · · · · ·Gregory Springs Station 21.4 93 3 0.6 7.0 0.8 4.4 4.0 3.4 0.6 0.6Hillgrove Station 49.8 83 5 4.2 · · · · · · · 1.0 · 1.0 · 4.0 2.4 · · · · · · · 27.6 9.6 · · · · · · · ·Hughenden Airport 10.2 17 4 0.2 8.0 0.2 · · · · · · 0.4 · · · 0.2 · · · · · · · 1.0 0.2 · · · · · · · ·Lucky Springs Station 66.5 81 6 7.0 · · · · · · · · 23.0 14.0 1.0 · · · 3.5 · · · · · 18.0 · · · · · · · · ·Mt Pleasant Station 25.0 54 5 11.6 8.2 5.2Pentland Post Office 75.6 88 6 1.6 · · · · · · · · · · · · · · · · · · · · 55.6 16.8 · · · · · · 1.6 ·Prestwood Station 56.6 115 4 1.0 43.0 11.0 1.6Richmond Airport 26.2 47 4 0.4 24.2 0.2 · · · · · · · · · · · · · · · · · · · 1.4 · · · · · · · ·Richmond Post Office 22.1 60 4 1.0 19.0 0.1 · · · · · · · · · · · · · · · · · · 0.6 1.4 · · · · · · · ·Strathtay Station 38.8 61 6 0.4 2.2 3.2 16.2 1.4 0.2 15.2Toomba Stud 47.8 70 4 7.4 · · · · · · · · · · · 4.8 · · · · · · · · 19.8 7.8 8.0 · · · · · · ·Torrens Creek Post Office 86.0 65 8 · 2.0 · · · · · · · 30.0 · 2.0 · · · · · · · · · 52.0 · · · · · · · · ·Wando Vale Station 48.9 82 5 7.8 5.2 10.6 12.8 0.5 12.0Woodbine Station 14.6 50 4 4.0 » 1.0 9.6
Barron North Coast (31) Total Avg Decile 1 2 3 4 5 6 7 8 9 10 11 12 13 14 15 16 17 18 19 20 21 22 23 24 25 26 27 28 29 30 31Babinda Post Office 739.2 792 6 1.4 2.4 · · · · · · · 16.0 89.0 10.0 » » 121.0 23.0 19.0 » 22.0 » » 22.0 81.0 9.2 24.0 122.0 » » 131.0 39.8 6.4Cairns Aero 436.2 426 6 7.2 9.6 0.4 · · · · · · 0.6 57.0 1.6 15.6 26.4 3.4 2.0 4.6 15.0 0.2 6.4 · 2.2 6.0 25.2 5.4 115.8 54.0 44.4 23.8 6.8 2.6Cairns Severin St 431.2 427 6 7.0 11.0 · · · · · · · 1.2 32.0 2.0 · · 12.0 3.0 2.0 10.0 · 8.0 · 27.0 10.0 12.0 8.0 113.0 87.0 45.0 23.0 10.0 8.0Cape Flattery 414.0 · · 3.0 49.6 0.4 · · · · 13.0 14.6 7.2 · 6.4 0.4 0.8 1.0 0.8 17.0 21.8 4.4 14.4 37.8 26.0 14.2 20.6 24.2 26.2 6.8 17.0 86.4Cooktown Airport 359.0 393 7 0.4 · 9.2 0.8 · · · · 1.6 38.4 4.0 3.0 1.4 6.4 6.8 4.8 3.8 1.0 6.6 6.0 0.4 0.6 20.4 2.8 0.8 55.0 59.4 31.8 23.8 27.6 42.2Daintree Village 649.0 575 7 · 4.0 7.5 38.0 115.0 1.5 17.0 105.0 7.5 2.5 2.5 » 9.0 2.5 29.0 3.0 » 136.0 92.0 60.0 17.0Glen Harding 22.0 122 2 · · · · · · · · · 3.0 · · · · 5.0 · · · · · · · · · · 9.0 · 5.0 · · ·Greenhaven 460.4 415 7 12.2 0.2 26.8 33.6 4.6 25.0 27.6 13.6 14.0 12.0 6.6 10.0 6.4 0.2 39.8 14.4 6.0 54.8 31.2 66.2 20.0 22.2 13.0Hazelmere 391.8 360 6 22.0 8.4 17.4 8.0 9.0 12.0 11.0 67.0 26.0 86.0 15.0 110.0Herberton White St 147.2 213 5 16.0 5.6 5.8 · · · · 2.2 · 5.2 2.8 2.0 10.6 18.0 4.4 · 4.6 1.4 2.6 2.4 · · 7.6 4.0 2.2 5.0 8.4 19.4 5.0 8.0 4.0Kairi Research Station 136.1 256 4 0.2 1.8 1.6 · · 0.2 · · 0.6 2.4 14.0 1.8 10.4 7.3 10.6 3.8 2.4 5.2 0.8 0.8 · · 9.8 0.4 5.0 17.2 11.4 » 19.8 6.6 2.0Kareeya 462.5 377 8 » 49.0 · · · » » · · 39.4 12.4 9.0 » » » 142.0 8.1 4.6 7.8 » » 2.4 30.4 23.6 3.6 32.0 » » » 92.0 6.2Low Isles Lighthouse 348.7 432 5 0.2 · 1.6 · · · · · · 0.6 89.0 2.0 18.0 29.2 10.0 » » » » » 15.0 5.1 30.0 3.4 9.0 61.8 30.8 2.6 20.0 17.4 3.0Mareeba Airport 55.0 142 3 · 1.4 1.0 · · · · · 6.4 · 2.8 3.0 1.8 0.8 0.2 0.2 0.2 0.4 · 6.2 19.6 · · 2.6 6.6 0.8 0.2 0.4 0.4Meadowbank 34.0 124 2 · · · · · · · 4.0 · · · · · 4.0 · 3.0 · · 2.0 · · · 3.0 3.0 · · 15.0 · · · ·Meringa Sugar Exp Stn 30.0 404 1 2.0 27.0 1.0Mossman South Alchera Drive 381.0 448 5 · 4.6 1.0 · · · · · · 4.4 93.0 11.6 6.0 8.6 3.0 2.2 4.0 3.0 2.0 · · 4.0 28.0 9.0 1.0 50.0 43.6 49.4 6.6 34.0 12.0Mt Garnet Post Office 46.7 134 3 2.0 · 5.4 · · · · · · 9.4 0.5 1.4 3.0 13.0 0.6 1.6 · · · 3.0 · · 1.8 · · · 2.6 · 2.4 · ·Mt Sheridan 464.8 524 5 6.8 2.4 · · · · · · · 1.6 11.6 1.8 8.2 31.4 9.2 1.6 3.4 · 2.6 2.2 · 8.2 27.6 6.2 2.8 122.4 63.2 73.0 23.6 45.4 9.6Mt Sophia 713.0 667 6 70.0 · · · · · · · · 13.0 67.0 6.0 23.0 54.0 29.0 9.0 12.0 8.0 16.0 4.0 2.0 · 33.0 · 61.0 93.0 77.0 · 47.0 63.0 26.0Port Douglas - Warner St 326.6 424 5 · 4.0 · 1.2 · · · · · 14.6 82.0 · 13.2 11.6 4.6 5.4 2.0 5.0 1.0 · · 15.0 14.2 4.2 3.0 55.6 26.4 44.2 4.8 8.0 6.6Ravenshoe Kuradilla Street 216.6 238 6 46.0 3.0 0.2 6.0 2.4 » 68.0 9.4 6.0 11.0 » 3.0 11.0 2.6 » 48.0Reef Park 246.5 5.6 · · · · 0.6 85.0 1.8 9.6 13.6 5.6 4.6 5.0 6.0 0.6 · 7.0 17.0 61.5 23.0Tinaroo Falls Dam 123.5 276 3 6.0 4.8 1.2 0.4 · · · · · 2.2 19.2 0.6 6.0 6.2 6.4 1.4 1.4 3.0 3.0 0.3 · · 8.2 · 0.6 16.0 11.5 11.5 8.0 1.4 4.2Walkamin Research Station 69.4 209 2 0.6 0.4 2.0 · · · · · · 0.2 12.2 0.6 6.6 4.4 3.4 0.2 0.2 3.6 · 0.2 · 0.4 10.8 1.0 0.4 4.6 7.6 5.4 1.8 2.0 0.8
Herbert North Coast (32) Total Avg Decile 1 2 3 4 5 6 7 8 9 10 11 12 13 14 15 16 17 18 19 20 21 22 23 24 25 26 27 28 29 30 31Allingham Forrest Drive 305.1 200 8 18.0 4.0 10.5 46.0 16.0 14.0 6.0 5.0 11.0 127.5 18.5 1.5 6.0 0.5 6.0 8.6 2.0 4.0Bambaroo 261.6 324 5 7.4 0.8 1.2 · · · · · 6.4 45.2 41.0 19.6 11.2 · 1.8 0.4 0.2 · 0.2 · · 13.8 94.2 · · 0.4 · · 1.6 11.2 5.0Bingil Bay 438.4 557 5 6.0 2.5 · · · · · · 3.0 35.0 30.0 11.0 52.2 41.0 15.8 5.5 8.2 1.8 18.0 5.8 0.4 6.2 81.0 12.5 1.4 29.0 22.8 38.0 6.2 4.5 0.6Blue Range 15.4 97 2 1.2 1.2 · · · · · · · · · · 1.8 5.8 · 0.6 · · · · · 4.8 · · · · · · · · ·Cardwell Marine Pde 237.5 396 4 12.9 · · · · · · · 0.8 15.4 3.2 9.2 8.4 27.0 2.5 4.2 1.4 0.4 2.0 · 1.2 12.8 53.8 15.6 0.4 20.5 5.0 5.2 8.0 24.6 3.0Cardwell Range 343.6 425 5 38.2 1.6 · · · · · · 8.0 48.4 5.8 25.0 5.4 23.0 3.8 2.0 0.8 4.4 2.4 0.2 3.0 0.4 110.0 7.6 3.6 14.0 5.2 2.8 26.4 1.2 0.4Daradgee 678.2 649 6 26.0 2.0 · · · · · · · 13.6 79.2 14.2 20.8 43.2 34.8 14.6 10.2 19.8 9.2 8.6 · 9.2 88.2 3.8 24.2 73.6 20.8 124.2 12.8 19.8 5.4Elphinstone Pocket No1 298.4 354 5 39.8 · · · · · · · 1.4 34.8 8.4 12.4 3.0 25.2 3.4 2.4 0.8 3.4 2.6 0.2 1.6 17.4 69.2 6.4 1.6 29.0 3.2 7.2 11.6 10.8 2.6Gairloch 321.2 319 6 » 5.6 · · · · · · 8.0 40.0 13.4 8.2 5.4 » 17.0 · · 3.0 2.0 · · 8.0 145.0 13.0 1.0 13.0 4.0 1.2 17.0 14.4 2.0Halifax Macrossan St 349.7 399 6 4.4 6.2 32.4 39.4 6.0 6.0 2.6 13.4 4.2 1.6 0.9 3.4 0.9 1.8 1.9 189.0 7.9 1.3 2.6 2.8 0.6 17.4 0.4 2.6Hawkins Creek 364.4 429 5 10.0 1.0 · · · · · · 12.0 43.0 14.0 16.0 8.0 57.0 · 1.0 · 2.0 10.0 0.4 3.0 · 86.0 27.0 2.0 16.0 5.0 2.0 33.0 13.0 3.0Ingham Composite 349.9 356 6 4.6 2.4 · · · · · · 30.0 23.4 21.1 13.2 2.2 21.4 · · 0.4 3.8 2.2 · 1.2 4.2 154.2 8.1 0.6 9.5 4.5 1.6 21.0 15.2 5.1Innisfail 477.0 659 4 4.8 · · · · · · · · 11.4 51.8 11.0 18.0 32.0 38.6 10.0 14.0 13.7 6.8 3.6 · 10.4 90.8 3.8 16.4 40.4 16.0 56.4 11.6 14.3 1.2Lucinda Point 120.0 141 5 9.8 16.4 · · · · · · 5.4 9.6 · 5.8 1.4 4.4 0.4 · · · 0.2 · · 2.2 56.2 0.6 0.6 3.0 2.0 · 1.2 0.6 0.2Lucinda Township 311.7 407 5 5.5 6.8 · · · · · · 6.2 23.2 1.2 15.6 8.8 14.6 · 3.8 · 1.0 · · · 1.2 194.6 3.2 1.6 6.2 6.2 0.8 9.6 1.6 ·Magnetic Island - Nelly Bay 330.8 43.0 · 76.0 · · » 0.2 · · 58.0 4.0 0.8 · 4.0 0.2 · · · 3.5 0.2 1.9 3.0 133.0 0.4 · 0.4 · · · 1.2 1.0
Monthly Weather Review Queensland March 2010
page 21
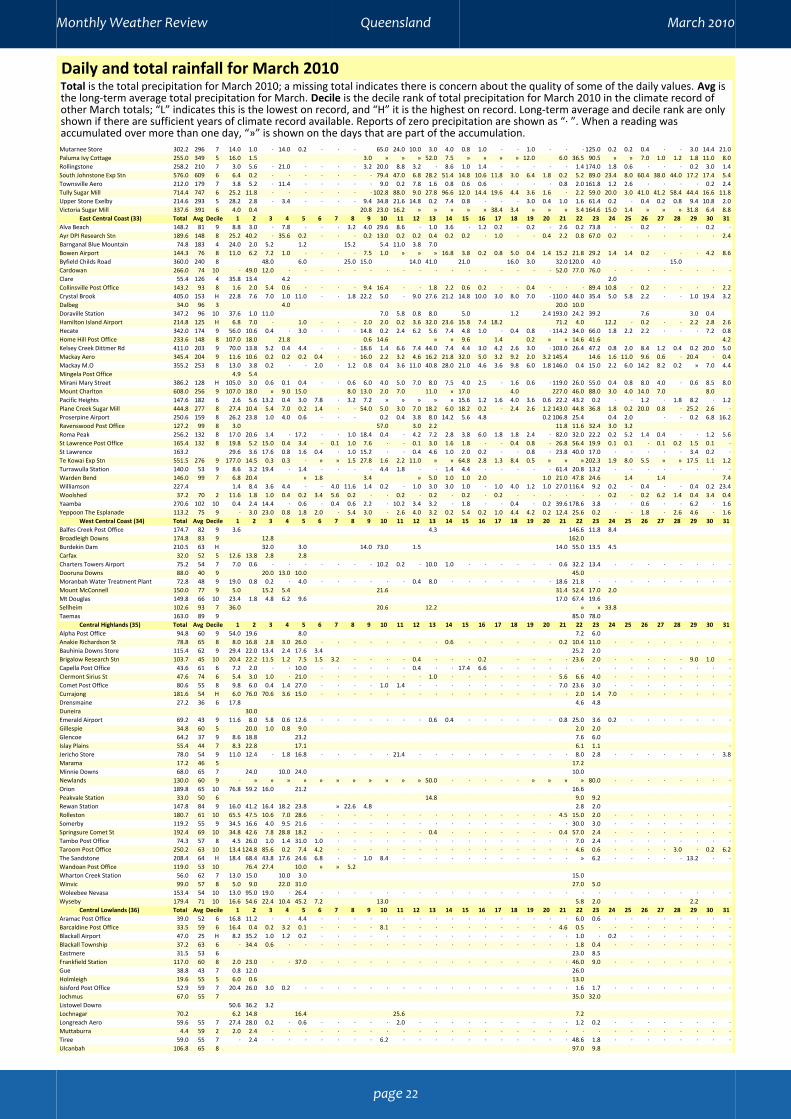
Daily and total rainfall for March 2010Total is the total precipitation for March 2010; a missing total indicates there is concern about the quality of some of the daily values. Avg isthe long-term average total precipitation for March. Decile is the decile rank of total precipitation for March 2010 in the climate record ofother March totals; “L” indicates this is the lowest on record, and “H” it is the highest on record. Long-term average and decile rank are onlyshown if there are sufficient years of climate record available. Reports of zero precipitation are shown as “· ”. When a reading wasaccumulated over more than one day, “»” is shown on the days that are part of the accumulation.Mutarnee Store 302.2 296 7 14.0 1.0 · 14.0 0.2 · · · 65.0 24.0 10.0 3.0 4.0 0.8 1.0 · · 1.0 · · · 125.0 0.2 0.2 0.4 · · 3.0 14.4 21.0Paluma Ivy Cottage 255.0 349 5 16.0 1.5 3.0 » » » 52.0 7.5 » » » » 12.0 6.0 36.5 90.5 » » 7.0 1.0 1.2 1.8 11.0 8.0Rollingstone 258.2 210 7 3.0 5.6 · 21.0 · · · · 3.2 20.0 8.8 3.2 · 8.6 1.0 1.4 · · · · · 1.4 174.0 1.8 0.6 · · · 0.2 3.0 1.4South Johnstone Exp Stn 576.0 609 6 6.4 0.2 · · · · · · · 79.4 47.0 6.8 28.2 51.4 14.8 10.6 11.8 3.0 6.4 1.8 0.2 5.2 89.0 23.4 8.0 60.4 38.0 44.0 17.2 17.4 5.4Townsville Aero 212.0 179 7 3.8 5.2 · 11.4 · · · · · 9.0 0.2 7.8 1.6 0.8 0.6 0.6 · · · · 0.8 2.0 161.8 1.2 2.6 · · · · 0.2 2.4Tully Sugar Mill 714.4 747 6 25.2 11.8 · · · · · · · 102.8 88.0 9.0 27.8 96.6 12.0 14.4 19.6 4.4 3.6 1.6 · 2.2 59.0 20.0 3.0 41.0 41.2 58.4 44.4 16.6 11.8Upper Stone Exelby 214.6 293 5 28.2 2.8 · 3.4 · · · · 9.4 34.8 21.6 14.8 0.2 7.4 0.8 · · · 3.0 0.4 1.0 1.6 61.4 0.2 · 0.4 0.2 0.8 9.4 10.8 2.0Victoria Sugar Mill 337.6 391 6 4.0 0.4 20.8 23.0 16.2 » » » » » 38.4 3.4 » » » 3.4 164.6 15.0 1.4 » » » 31.8 6.4 8.8
East Central Coast (33) Total Avg Decile 1 2 3 4 5 6 7 8 9 10 11 12 13 14 15 16 17 18 19 20 21 22 23 24 25 26 27 28 29 30 31Alva Beach 148.2 81 9 8.8 3.0 · 7.8 · · · 3.2 4.0 29.6 8.6 · 1.0 3.6 · 1.2 0.2 · 0.2 · 2.6 0.2 73.8 · · 0.2 · · · 0.2 ·Ayr DPI Research Stn 189.6 148 8 25.2 40.2 · 35.6 0.2 · · · 0.2 13.0 0.2 0.2 0.4 0.2 0.2 · 1.0 · · 0.4 2.2 0.8 67.0 0.2 · · · · · · 2.4Barnganal Blue Mountain 74.8 183 4 24.0 2.0 5.2 1.2 15.2 5.4 11.0 3.8 7.0Bowen Airport 144.3 76 8 11.0 6.2 7.2 1.0 · · · · 7.5 1.0 » » » 16.8 3.8 0.2 0.8 5.0 0.4 1.4 15.2 21.8 29.2 1.4 1.4 0.2 · · · 4.2 8.6Byfield Childs Road 360.0 240 8 48.0 6.0 25.0 15.0 14.0 41.0 21.0 16.0 3.0 32.0 120.0 4.0 15.0Cardowan 266.0 74 10 · 49.0 12.0 · · · · · · · · · · · · · · · · · 52.0 77.0 76.0 · · · · · · · ·Clare 55.4 126 4 35.8 13.4 4.2 2.0Collinsville Post Office 143.2 93 8 1.6 2.0 5.4 0.6 · · · · 9.4 16.4 · · 1.8 2.2 0.6 0.2 · · 0.4 · · · 89.4 10.8 · 0.2 · · · · 2.2Crystal Brook 405.0 153 H 22.8 7.6 7.0 1.0 11.0 · · 1.8 22.2 5.0 · 9.0 27.6 21.2 14.8 10.0 3.0 8.0 7.0 · 110.0 44.0 35.4 5.0 5.8 2.2 · · 1.0 19.4 3.2Dalbeg 34.0 96 3 4.0 20.0 10.0Doraville Station 347.2 96 10 37.6 1.0 11.0 7.0 5.8 0.8 8.0 5.0 1.2 2.4 193.0 24.2 39.2 7.6 3.0 0.4Hamilton Island Airport 214.8 125 H 6.8 7.0 · 1.0 · · · 2.0 2.0 0.2 3.6 32.0 23.6 15.8 7.4 18.2 71.2 4.0 12.2 · 0.2 · · 2.2 2.8 2.6Hecate 342.0 174 9 56.0 10.6 0.4 · 3.0 · · · 14.8 0.2 2.4 6.2 5.6 7.4 4.8 1.0 · 0.4 0.8 · 114.2 34.0 66.0 1.8 2.2 2.2 · · · 7.2 0.8Home Hill Post Office 233.6 148 8 107.0 18.0 21.8 0.6 14.6 » » 9.6 1.4 0.2 » » 14.6 41.6 4.2Kelsey Creek Dittmer Rd 411.0 203 9 70.0 13.8 5.2 0.4 4.4 · · · 18.6 1.4 6.6 7.4 44.0 7.4 4.4 3.0 4.2 2.6 3.0 · 103.0 26.4 47.2 0.8 2.0 8.4 1.2 0.4 0.2 20.0 5.0Mackay Aero 345.4 204 9 11.6 10.6 0.2 0.2 0.2 0.4 · · 16.0 2.2 3.2 4.6 16.2 21.8 32.0 5.0 3.2 9.2 2.0 3.2 145.4 14.6 1.6 11.0 9.6 0.6 · 20.4 · 0.4Mackay M.O 355.2 253 8 13.0 3.8 0.2 · · 2.0 · 1.2 0.8 0.4 3.6 11.0 40.8 28.0 21.0 4.6 3.6 9.8 6.0 1.8 146.0 0.4 15.0 2.2 6.0 14.2 8.2 0.2 » 7.0 4.4Mingela Post Office 4.9 5.4Mirani Mary Street 386.2 128 H 105.0 3.0 0.6 0.1 0.4 · · 0.6 6.0 4.0 5.0 7.0 8.0 7.5 4.0 2.5 · 1.6 0.6 · 119.0 26.0 55.0 0.4 0.8 8.0 4.0 · 0.6 8.5 8.0Mount Charlton 608.0 256 9 107.0 18.0 » 9.0 15.0 8.0 13.0 2.0 7.0 11.0 » 17.0 4.0 227.0 46.0 88.0 3.0 4.0 14.0 7.0 8.0Pacific Heights 147.6 182 6 2.6 5.6 13.2 0.4 3.0 7.8 · 3.2 7.2 » » » » » 15.6 1.2 1.6 4.0 3.6 0.6 22.2 43.2 0.2 · · 1.2 · 1.8 8.2 · 1.2Plane Creek Sugar Mill 444.8 277 8 27.4 10.4 5.4 7.0 0.2 1.4 · · 54.0 5.0 3.0 7.0 18.2 6.0 18.2 0.2 · 2.4 2.6 1.2 143.0 44.8 36.8 1.8 0.2 20.0 0.8 · 25.2 2.6 ·Proserpine Airport 250.6 159 8 26.2 23.8 1.0 4.0 0.6 · · · 0.2 0.4 3.8 8.0 14.2 5.6 4.8 0.2 106.8 25.4 0.4 2.0 · · 0.2 6.8 16.2Ravenswood Post Office 127.2 99 8 3.0 57.0 3.0 2.2 11.8 11.6 32.4 3.0 3.2Roma Peak 256.2 132 8 17.0 20.6 1.4 · 17.2 · · 1.0 18.4 0.4 · 4.2 7.2 2.8 3.8 6.0 1.8 1.8 2.4 · 82.0 32.0 22.2 0.2 5.2 1.4 0.4 · · 1.2 5.6St Lawrence Post Office 165.4 132 8 19.8 5.2 15.0 0.4 3.4 · 0.1 1.0 7.6 · · 0.1 3.0 1.6 1.8 · · 0.4 0.8 · 26.8 56.4 19.9 0.1 0.1 · 0.1 0.2 1.5 0.1 ·St Lawrence 163.2 29.6 3.6 17.6 0.8 1.6 0.4 · 1.0 15.2 · · 0.4 4.6 1.0 2.0 0.2 · · 0.8 · 23.8 40.0 17.0 · · · · · 3.4 0.2 ·Te Kowai Exp Stn 551.5 276 9 177.0 14.5 0.3 0.3 · » » 1.5 27.8 1.6 2.2 11.0 » » 64.8 2.8 1.3 8.4 0.5 » » » 202.3 1.9 8.0 5.5 » » 17.5 1.1 1.2Turrawulla Station 140.0 53 9 8.6 3.2 19.4 · 1.4 · · · · 4.4 1.8 · · 1.4 4.4 · · · · · 61.4 20.8 13.2 · · · · · · · ·Warden Bend 146.0 99 7 6.8 20.4 » 1.8 3.4 » 5.0 1.0 1.0 2.0 1.0 21.0 47.8 24.6 1.4 1.4 7.4Williamson 227.4 1.4 8.4 3.6 4.4 · · 4.0 11.6 1.4 0.2 · 1.0 3.0 3.0 1.0 · 1.0 4.0 1.2 1.0 27.0 116.4 9.2 0.2 · 0.4 · · 0.4 0.2 23.4Woolshed 37.2 70 2 11.6 1.8 1.0 0.4 0.2 3.4 5.6 0.2 · · 0.2 · 0.2 · 0.2 · 0.2 · · · · · · 0.2 · 0.2 6.2 1.4 0.4 3.4 0.4Yaamba 270.6 102 10 0.4 2.4 14.4 · 0.6 · 0.4 0.6 2.2 · 10.2 3.4 3.2 · 1.8 · · 0.4 · 0.2 39.6 178.6 3.8 · · 0.6 · · 6.2 · 1.6Yeppoon The Esplanade 113.2 75 9 · 3.0 23.0 0.8 1.8 2.0 · 5.4 3.0 · 2.6 4.0 3.2 0.2 5.4 0.2 1.0 4.4 4.2 0.2 12.4 25.6 0.2 · · 1.8 · 2.6 4.6 · 1.6
West Central Coast (34) Total Avg Decile 1 2 3 4 5 6 7 8 9 10 11 12 13 14 15 16 17 18 19 20 21 22 23 24 25 26 27 28 29 30 31Balfes Creek Post Office 174.7 82 9 3.6 4.3 146.6 11.8 8.4Broadleigh Downs 174.8 83 9 12.8 162.0Burdekin Dam 210.5 63 H 32.0 3.0 14.0 73.0 1.5 14.0 55.0 13.5 4.5Carfax 32.0 52 5 12.6 13.8 2.8 2.8Charters Towers Airport 75.2 54 7 7.0 0.6 · · · · · · · 10.2 0.2 · 10.0 1.0 · · · · · · 0.6 32.2 13.4 · · · · · · · ·Dooruna Downs 88.0 40 9 20.0 13.0 10.0 45.0Moranbah Water Treatment Plant 72.8 48 9 19.0 0.8 0.2 · 4.0 · · · · · · 0.4 8.0 · · · · · · · 18.6 21.8 · · · · · · · · ·Mount McConnell 150.0 77 9 5.0 15.2 5.4 21.6 31.4 52.4 17.0 2.0Mt Douglas 149.8 66 10 23.4 1.8 4.8 6.2 9.6 17.0 67.4 19.6Sellheim 102.6 93 7 36.0 20.6 12.2 » » 33.8Taemas 163.0 89 9 85.0 78.0
Central Highlands (35) Total Avg Decile 1 2 3 4 5 6 7 8 9 10 11 12 13 14 15 16 17 18 19 20 21 22 23 24 25 26 27 28 29 30 31Alpha Post Office 94.8 60 9 54.0 19.6 8.0 7.2 6.0Anakie Richardson St 78.8 65 8 8.0 16.8 2.8 3.0 26.0 · · · · · · · · 0.6 · · · · · · 0.2 10.4 11.0 · · · · · · · ·Bauhinia Downs Store 115.4 62 9 29.4 22.0 13.4 2.4 17.6 3.4 25.2 2.0Brigalow Research Stn 103.7 45 10 20.4 22.2 11.5 1.2 7.5 1.5 3.2 · · · · 0.4 · · · 0.2 · · · · 23.6 2.0 · · · · · 9.0 1.0 ·Capella Post Office 43.6 61 6 7.2 2.0 · · 10.0 · · · · · · 0.4 · · 17.4 6.6 · · · · · · · · · · · · · · ·Clermont Sirius St 47.6 74 6 5.4 3.0 1.0 · 21.0 · · · · · · · 1.0 · · · · · · · 5.6 6.6 4.0 · · · · · · · ·Comet Post Office 80.6 55 8 9.8 6.0 0.4 1.4 27.0 · · · · 1.0 1.4 · · · · · · · · · 7.0 23.6 3.0 · · · · · · · ·Currajong 181.6 54 H 6.0 76.0 70.6 3.6 15.0 · · · · · · · · · · · · · · · · 2.0 1.4 7.0 · · · · · · ·Drensmaine 27.2 36 6 17.8 4.6 4.8Duneira 30.0Emerald Airport 69.2 43 9 11.6 8.0 5.8 0.6 12.6 · · · · · · · 0.6 0.4 · · · · · · 0.8 25.0 3.6 0.2 · · · · · · ·Gillespie 34.8 60 5 20.0 1.0 0.8 9.0 2.0 2.0Glencoe 64.2 37 9 8.6 18.8 23.2 7.6 6.0Islay Plains 55.4 44 7 8.3 22.8 17.1 6.1 1.1 ·Jericho Store 78.0 54 9 11.0 12.4 · 1.8 16.8 · · · · · 21.4 · · · · · · · · · · 8.0 2.8 · · · · · · · 3.8Marama 17.2 46 5 17.2Minnie Downs 68.0 65 7 24.0 10.0 24.0 10.0Newlands 130.0 60 9 · » » » » » » » » » » » 50.0 · · · · · » » » » 80.0 · · · · · · · ·Orion 189.8 65 10 76.8 59.2 16.0 21.2 16.6Peakvale Station 33.0 50 6 14.8 9.0 9.2Rewan Station 147.8 84 9 16.0 41.2 16.4 18.2 23.8 » 22.6 4.8 2.8 2.0 ·Rolleston 180.7 61 10 65.5 47.5 10.6 7.0 28.6 · · · · · · · · · · · · · · · 4.5 15.0 2.0 · · · · · · · ·Somerby 119.2 55 9 34.5 16.6 4.0 9.5 21.6 · · · · · · · · · · · · · · · · 30.0 3.0 · · · · · · · ·Springsure Comet St 192.4 69 10 34.8 42.6 7.8 28.8 18.2 · · · · · · · 0.4 · · · · · · · 0.4 57.0 2.4 · · · · · · · ·Tambo Post Office 74.3 57 8 4.5 26.0 1.0 1.4 31.0 1.0 · · · · · · · · · · · · · · · 7.0 2.4 · · · · · · · ·Taroom Post Office 250.2 63 10 13.4 124.8 85.6 0.2 7.4 4.2 · · · · · · · · · · · · · · · 4.6 0.6 · · · · 3.0 · 0.2 6.2The Sandstone 208.4 64 H 18.4 68.4 43.8 17.6 24.6 6.8 · · 1.0 8.4 · · · · · · · · · · · » 6.2 · · · · · 13.2 · ·Wandoan Post Office 119.0 53 10 76.4 27.4 10.0 » » 5.2Wharton Creek Station 56.0 62 7 13.0 15.0 10.0 3.0 15.0Winvic 99.0 57 8 5.0 9.0 22.0 31.0 27.0 5.0Woleebee Nevasa 153.4 54 10 13.0 95.0 19.0 · 26.4 · · · · · · · · · · · · · · · · · · · · · · · · · ·Wyseby 179.4 71 10 16.6 54.6 22.4 10.4 45.2 7.2 13.0 5.8 2.0 2.2
Central Lowlands (36) Total Avg Decile 1 2 3 4 5 6 7 8 9 10 11 12 13 14 15 16 17 18 19 20 21 22 23 24 25 26 27 28 29 30 31Aramac Post Office 39.0 52 6 16.8 11.2 · · 4.4 · · · · · · · · · · · · · · · · 6.0 0.6 · · · · · · · ·Barcaldine Post Office 33.5 59 6 16.4 0.4 0.2 3.2 0.1 · · · · 8.1 · · · · · · · · · · 4.6 0.5 · · · · · · · · ·Blackall Airport 47.0 25 H 8.2 35.2 1.0 1.2 0.2 · · · · · · · · · · · · · · · · 1.0 · 0.2 · · · · · · ·Blackall Township 37.2 63 6 · 34.4 0.6 · · · · · · · · · · · · · · · · · · 1.8 0.4 · · · · · · · ·Eastmere 31.5 53 6 23.0 8.5Frankfield Station 117.0 60 8 2.0 23.0 · · 37.0 · · · · · · · · · · · · · · · · 46.0 9.0 · · · · · · · ·Gue 38.8 43 7 0.8 12.0 26.0Holmleigh 19.6 55 5 6.0 0.6 13.0Isisford Post Office 52.9 59 7 20.4 26.0 3.0 0.2 · · · · · · · · · · · · · · · · · 1.6 1.7 · · · · · · · ·Jochmus 67.0 55 7 35.0 32.0Listowel Downs 50.6 36.2 3.2Lochnagar 70.2 6.2 14.8 16.4 25.6 7.2Longreach Aero 59.6 55 7 27.4 28.0 0.2 · 0.6 · · · · · 2.0 · · · · · · · · · · 1.2 0.2 · · · · · · · ·Muttaburra 4.4 59 2 2.0 2.4 · · · · · · · · · · · · · · · · · · · · · · · · · · · · ·Tiree 59.0 55 7 · 2.4 · · · · · · · 6.2 · · · · · · · · · · · 48.6 1.8 · · · · · · · ·Ulcanbah 106.8 65 8 97.0 9.8
Monthly Weather Review Queensland March 2010
page 22
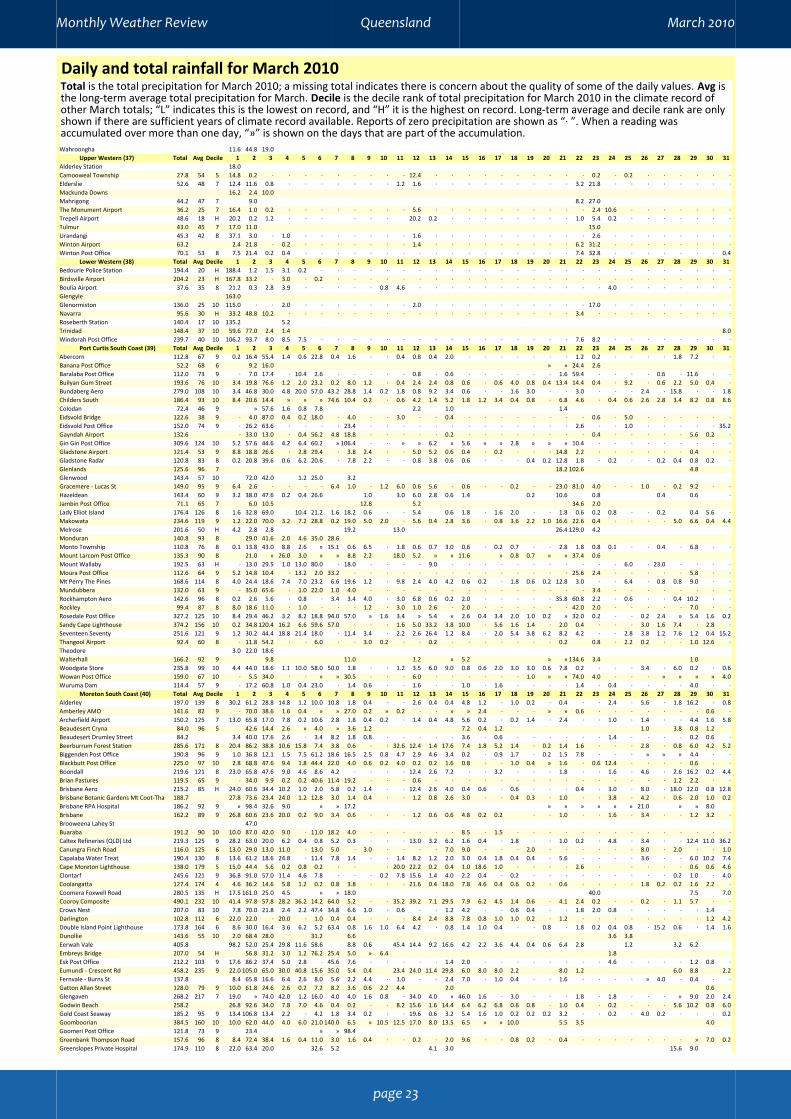
Daily and total rainfall for March 2010Total is the total precipitation for March 2010; a missing total indicates there is concern about the quality of some of the daily values. Avg isthe long-term average total precipitation for March. Decile is the decile rank of total precipitation for March 2010 in the climate record ofother March totals; “L” indicates this is the lowest on record, and “H” it is the highest on record. Long-term average and decile rank are onlyshown if there are sufficient years of climate record available. Reports of zero precipitation are shown as “· ”. When a reading wasaccumulated over more than one day, “»” is shown on the days that are part of the accumulation.Wahroongha 11.6 44.8 19.0
Upper Western (37) Total Avg Decile 1 2 3 4 5 6 7 8 9 10 11 12 13 14 15 16 17 18 19 20 21 22 23 24 25 26 27 28 29 30 31Alderley Station 18.0Camooweal Township 27.8 54 5 14.8 0.2 · · · · · · · · · 12.4 · · · · · · · · · · 0.2 · 0.2 · · · · · ·Elderslie 52.6 48 7 12.4 11.6 0.8 · · · · · · · 1.2 1.6 · · · · · · · · · 3.2 21.8 · · · · · · · ·Mackunda Downs 16.2 2.4 10.0Mahrigong 44.2 47 7 9.0 8.2 27.0The Monument Airport 36.2 25 7 16.4 1.0 0.2 · · · · · · · · 5.6 · · · · · · · · · · 2.4 10.6 · · · · · · ·Trepell Airport 48.6 18 H 20.2 0.2 1.2 · · · · · · 20.2 0.2 · · · · · · · · 1.0 5.4 0.2 · · · · · · ·Tulmur 43.0 45 7 17.0 11.0 15.0Urandangi 45.3 42 8 37.1 3.0 · 1.0 · · · · · · · 1.6 · · · · · · · · · · 2.6 · · · · · · · ·Winton Airport 63.2 2.4 21.8 · 0.2 · · · · · · · 1.4 · · · · · · · · · 6.2 31.2 · · · · · · · ·Winton Post Office 70.1 53 8 7.5 21.4 0.2 0.4 · · · · · · · · · · · · · · · · · 7.4 32.8 · · · · · · · 0.4
Lower Western (38) Total Avg Decile 1 2 3 4 5 6 7 8 9 10 11 12 13 14 15 16 17 18 19 20 21 22 23 24 25 26 27 28 29 30 31Bedourie Police Station 194.4 20 H 188.4 1.2 1.5 3.1 0.2 · · · · · · · · · · · · · · · · · · · · · · · · · ·Birdsville Airport 204.2 23 H 167.8 33.2 · 3.0 · 0.2 · · · · · · · · · · · · · · · · · · · · · · · · ·Boulia Airport 37.6 35 8 21.2 0.3 2.8 3.9 · · · · · 0.8 4.6 · · · · · · · · · · · · 4.0 · · · · · · ·Glengyle 163.0Glenormiston 136.0 25 10 115.0 · · 2.0 · · · · · · · 2.0 · · · · · · · · · · 17.0 · · · · · · · ·Navarra 95.6 30 H 33.2 48.8 10.2 · · · · · · · · · · · · · · · · · · 3.4 · · · · · · · · ·Roseberth Station 140.4 17 10 135.2 5.2Trinidad 148.4 37 10 59.6 77.0 2.4 1.4 8.0Windorah Post Office 239.7 40 10 106.2 93.7 8.0 8.5 7.5 · · · · · · · · · · · · · · · · 7.6 8.2 · · · · · · · ·
Port Curtis South Coast (39) Total Avg Decile 1 2 3 4 5 6 7 8 9 10 11 12 13 14 15 16 17 18 19 20 21 22 23 24 25 26 27 28 29 30 31Abercorn 112.8 67 9 0.2 16.4 55.4 1.4 0.6 22.8 0.4 1.6 · · 0.4 0.8 0.4 2.0 · · · · · · · 1.2 0.2 · · · · 1.8 7.2 · ·Banana Post Office 52.2 68 6 9.2 16.0 » » 24.4 2.6Baralaba Post Office 112.0 73 9 · 7.0 17.4 · 10.4 2.6 · · · · · 0.8 · 0.6 · · · · · · 1.6 59.4 · · · · 0.6 · 11.6 · ·Builyan Gum Street 193.6 76 10 3.4 19.8 76.6 1.2 2.0 23.2 0.2 8.0 1.2 · 0.4 2.4 2.4 0.8 0.6 · 0.6 4.0 0.8 0.4 13.4 14.4 0.4 · 9.2 · 0.6 2.2 5.0 0.4 ·Bundaberg Aero 279.0 108 10 3.4 46.8 30.0 4.8 20.0 57.0 43.2 28.8 1.4 0.2 1.8 0.8 9.2 3.4 0.6 · · 1.6 3.0 · · 3.0 · · · 2.4 · 15.8 · · 1.8Childers South 186.4 93 10 8.4 20.6 14.4 » » » 74.6 10.4 0.2 · 0.6 4.2 1.4 5.2 1.8 1.2 3.4 0.4 0.8 · 6.8 4.6 · 0.4 0.6 2.6 2.8 3.4 8.2 0.8 8.6Colodan 72.4 46 9 » 57.6 1.6 0.8 7.8 2.2 1.0 1.4Eidsvold Bridge 122.6 38 9 · 4.0 87.0 0.4 0.2 18.0 · 4.0 · · 3.0 · · 0.4 · · · · · · · · 0.6 · 5.0 · · · · · ·Eidsvold Post Office 152.0 74 9 · 26.2 63.6 · · · · 23.4 · · · · · · · · · · · · · 2.6 · · 1.0 · · · · · 35.2Gayndah Airport 132.6 · 33.0 13.0 · 0.4 56.2 4.8 18.8 · · · · · 0.2 · · · · · · · · 0.4 · · · · · 5.6 0.2 ·Gin Gin Post Office 309.6 124 10 5.2 57.6 44.6 4.2 6.4 60.2 » 106.4 · · » » 6.2 » 5.6 » » 2.8 » » » 10.4 · · · · · · · · ·Gladstone Airport 121.4 53 9 8.8 18.8 26.6 · 2.8 29.4 · 3.8 2.4 · · 5.0 5.2 0.6 0.4 · 0.2 · · · 14.8 2.2 · · · · · · 0.4 · ·Gladstone Radar 120.8 83 8 0.2 20.8 39.6 0.6 6.2 20.6 · 7.8 2.2 · · 0.8 3.8 0.6 0.6 · · · 0.4 0.2 12.8 1.8 · 0.2 · · 0.2 0.4 0.8 0.2 ·Glenlands 125.6 96 7 18.2 102.6 4.8Glenwood 143.4 57 10 72.0 42.0 1.2 25.0 3.2Gracemere - Lucas St 149.0 95 9 6.4 2.6 · · · · 6.4 1.0 · 1.2 6.0 0.6 5.6 · 0.6 · · 0.2 · · 23.0 81.0 4.0 · · 1.0 · 0.2 9.2 · ·Hazeldean 143.4 60 9 3.2 38.0 47.6 0.2 0.4 26.6 1.0 3.0 6.0 2.8 0.6 1.4 0.2 10.6 0.8 0.4 0.6 ·Jambin Post Office 71.1 65 7 6.0 10.5 12.8 5.2 34.6 2.0Lady Elliot Island 176.4 126 8 1.6 32.8 69.0 10.4 21.2 1.6 18.2 0.6 · · 5.4 0.6 1.8 · 1.6 2.0 · · 1.8 0.6 0.2 0.8 · · 0.2 0.4 5.6 ·Makowata 234.6 119 9 1.2 22.0 70.0 3.2 7.2 28.8 0.2 19.0 5.0 2.0 · 5.6 0.4 2.8 3.6 · 0.8 3.6 2.2 1.0 16.6 22.6 0.4 · · · · 5.0 6.6 0.4 4.4Melrose 201.6 50 H 4.2 2.8 2.8 19.2 13.0 26.4 129.0 4.2Monduran 140.8 93 8 29.0 41.6 2.0 4.6 35.0 28.6Monto Township 110.8 76 8 0.1 13.8 43.0 8.8 2.6 » 15.1 0.6 6.5 · 1.8 0.6 0.7 3.0 0.6 · 0.2 0.7 · · 2.8 1.8 0.8 0.1 · · 0.4 · 6.8 · ·Mount Larcom Post Office 135.3 90 8 21.0 » 26.0 3.0 » » 8.8 2.2 18.0 5.2 » » 11.6 » 0.8 0.7 » » 37.4 0.6Mount Wallaby 192.5 63 H · 13.0 29.5 1.0 13.0 80.0 · 18.0 · · · · 9.0 · · · · · · · · · · · 6.0 · 23.0 · · · ·Moura Post Office 112.6 64 9 5.2 14.8 10.4 · 13.2 2.0 33.2 · · · · · · · · · · · · · · 25.6 2.4 · · · · · 5.8 · ·Mt Perry The Pines 168.6 114 8 4.0 24.4 18.6 7.4 7.0 23.2 6.6 19.6 1.2 · 9.8 2.4 4.0 4.2 0.6 0.2 · 1.8 0.6 0.2 12.8 3.0 · · 6.4 · 0.8 0.8 9.0 · ·Mundubbera 132.0 63 9 · 35.0 65.6 · 1.0 22.0 1.0 4.0 · · · · · · · · · · · · · · 3.4 · · · · · · · ·Rockhampton Aero 142.6 96 8 0.2 2.6 5.6 · 0.8 · 3.4 3.4 4.0 · 3.0 6.8 0.6 0.2 2.0 · · · · · 35.8 60.8 2.2 · 0.6 · · 0.4 10.2 · ·Rockley 99.4 87 8 8.0 18.6 11.0 · 1.0 · · · 1.2 · 3.0 1.0 2.6 · 2.0 · · · · · · 42.0 2.0 · · · · · 7.0 · ·Rosedale Post Office 327.2 125 10 8.4 29.4 46.2 3.2 8.2 18.8 94.0 57.0 » 1.6 3.4 » 5.4 » 2.6 0.4 3.4 2.0 1.0 0.2 » 32.0 0.2 · · 0.2 2.4 » 5.4 1.6 0.2Sandy Cape Lighthouse 374.2 156 10 0.2 34.8 120.4 16.2 6.6 59.6 57.0 · · · 1.6 5.0 33.2 3.8 10.0 · 5.6 1.6 1.4 · 2.0 0.4 · · · 3.0 1.6 7.4 · 2.8 ·Seventeen Seventy 251.6 121 9 1.2 30.2 44.4 18.8 21.4 18.0 · 11.4 3.4 · 2.2 2.6 26.4 1.2 8.4 · 2.0 5.4 3.8 6.2 8.2 4.2 · · 2.8 3.8 1.2 7.6 1.2 0.4 15.2Thangool Airport 92.4 60 8 · 11.8 54.2 · · 6.0 · · 3.0 0.2 · · 0.2 · · · · · · · 0.2 0.8 · 2.2 0.2 · · 1.0 12.6 ·Theodore 3.0 22.0 18.6Walterhall 166.2 92 9 9.8 11.0 1.2 » 5.2 » » 134.6 3.4 1.0Woodgate Store 235.8 99 10 4.4 44.0 18.6 1.1 10.0 58.0 50.0 1.8 · · 1.2 3.5 6.0 9.0 0.8 0.6 2.0 3.0 3.0 0.6 7.8 0.2 · · · 3.4 · 6.0 0.2 · 0.6Wowan Post Office 159.0 67 10 · 5.5 34.0 · · » » 30.5 · · · 6.0 · · · · · · 1.0 » » 74.0 4.0 · · · » » » » 4.0Wuruma Dam 114.4 57 9 · 17.2 60.8 1.0 0.4 23.0 · 1.4 0.6 · · 1.6 · · 1.0 · 1.6 · · · · 1.4 · 0.4 · · · · 4.0 · ·
Moreton South Coast (40) Total Avg Decile 1 2 3 4 5 6 7 8 9 10 11 12 13 14 15 16 17 18 19 20 21 22 23 24 25 26 27 28 29 30 31Alderley 197.0 139 8 30.2 61.2 28.8 14.8 1.2 10.0 10.8 1.8 0.4 · · 2.6 0.4 0.4 4.8 1.2 · 1.0 0.2 · 0.4 · · 2.4 · 5.6 · 1.8 16.2 · 0.8Amberley AMO 141.6 82 9 · 70.0 38.6 1.6 0.4 » » 27.0 0.2 » 0.2 · · » » 2.4 · · · » » 0.6 · · · · · · · 0.6 ·Archerfield Airport 150.2 125 7 13.0 65.8 17.0 7.8 0.2 10.6 2.8 1.8 0.4 0.2 · 1.4 0.4 4.8 5.6 0.2 · 0.2 1.4 · 2.4 · · 1.0 · 1.4 · · 4.4 1.6 5.8Beaudesert Cryna 84.0 96 5 42.6 14.4 2.6 » 4.0 » 3.6 1.2 7.2 0.4 1.2 1.0 3.8 0.8 1.2Beaudesert Drumley Street 84.2 3.4 40.0 17.6 2.6 · 3.4 8.2 1.8 0.8 · · · · · 3.6 · 0.6 · · · · · · 1.4 · · · · 0.2 0.6 ·Beerburrum Forest Station 285.6 171 8 20.4 86.2 38.8 10.6 15.8 7.4 3.8 0.6 · · 32.6 12.4 1.4 17.6 7.4 1.8 5.2 1.4 · 0.2 1.4 1.6 · · · 2.8 · 0.8 6.0 4.2 5.2Biggenden Post Office 190.8 96 9 1.0 36.8 12.1 1.5 7.5 61.2 18.6 16.5 2.5 0.8 4.7 2.9 4.6 3.4 0.2 · 0.9 1.7 · 0.2 1.5 7.8 · · · » » » 4.4 · ·Blackbutt Post Office 225.0 97 10 2.8 68.8 47.6 9.4 1.8 44.4 22.0 4.0 0.6 0.2 4.0 0.2 0.2 1.6 0.8 · · 1.0 0.4 » 1.6 · 0.6 12.4 · · · · 0.6 · ·Boondall 219.6 121 8 23.0 65.8 47.6 9.0 4.6 8.6 4.2 · · · · 12.4 2.6 7.2 · · 3.2 · · · 1.8 · · 1.6 · 4.6 · 2.6 16.2 0.2 4.4Brian Pastures 119.5 65 9 · 34.0 9.9 0.2 0.2 40.6 11.4 19.2 · · · 0.6 · · · · · · · · · · · · · · · 1.2 2.2 · ·Brisbane Aero 215.2 85 H 24.0 60.6 34.4 10.2 1.0 2.0 5.8 0.2 1.4 · · 12.4 2.6 4.0 0.4 0.6 · 0.6 · · · 0.4 · 3.0 · 8.0 · 18.0 12.0 0.8 12.8Brisbane Botanic Gardens Mt Coot-Tha 188.7 27.8 73.6 23.4 24.0 1.2 12.8 3.0 1.4 0.4 · · 1.2 0.8 2.6 3.0 · · 0.4 0.3 · 1.0 · · 3.8 · 4.2 · 0.6 2.0 1.0 0.2Brisbane RPA Hospital 186.2 92 9 » 98.4 32.6 9.0 » » 17.2 » » » » » » 21.0 » » 8.0Brisbane 162.2 89 9 26.8 60.6 23.6 20.0 0.2 9.0 3.4 0.6 · · · 1.2 0.6 0.6 4.8 0.2 0.2 · · 1.0 · · 1.6 · 3.4 · · 1.2 3.2 ·Brooweena Lahey St 47.0Buaraba 191.2 90 10 10.0 87.0 42.0 9.0 · 11.0 18.2 4.0 · · · · · · 8.5 · 1.5 · · · · · · · · · · · · · ·Caltex Refineries (QLD) Ltd 219.3 125 9 28.2 63.0 20.0 6.2 0.4 0.8 5.2 0.3 · · · 13.0 3.2 6.2 1.6 0.4 · 1.8 · · 1.0 0.2 · 4.8 · 3.4 · · 12.4 11.0 36.2Canungra Finch Road 116.0 125 6 13.0 29.0 13.0 11.0 · 13.0 5.0 · 3.0 · · · · 7.0 9.0 · · · 2.0 · · · · · · 8.0 · 2.0 · · 1.0Capalaba Water Treat 190.4 130 8 13.6 61.2 18.6 24.8 · 11.4 7.8 1.4 · · 1.4 8.2 1.2 2.0 3.0 0.4 1.8 0.4 0.4 · 5.6 · · · · 3.6 · · 6.0 10.2 7.4Cape Moreton Lighthouse 138.0 179 5 15.0 44.4 5.6 0.2 0.8 0.2 · · · 20.0 22.2 0.2 0.4 1.0 18.6 1.0 · · · · 2.6 · · · · · 0.6 0.6 4.6Clontarf 245.6 121 9 36.8 91.0 57.0 11.4 4.6 7.8 · · · 0.2 7.8 15.6 1.4 4.0 2.2 0.4 · 0.2 · · · · · · · · · 0.2 1.0 · 4.0Coolangatta 127.4 174 4 4.6 36.2 14.6 5.8 1.2 0.2 0.8 3.8 · · · 21.6 0.4 18.0 7.8 4.6 0.4 0.6 0.2 · 0.6 · · · · 1.8 0.2 0.2 1.6 2.2 ·Coomera Foxwell Road 280.5 135 H 17.5 161.0 25.0 4.5 » » 18.0 40.0 7.5 7.0Cooroy Composite 490.1 232 10 41.4 97.8 57.8 28.2 36.2 14.2 64.0 5.2 · · 35.2 39.2 7.1 29.5 7.9 6.2 4.5 1.4 0.6 · 4.1 2.4 0.2 · · 0.2 · 1.1 5.7 · ·Crows Nest 207.0 83 10 7.8 70.0 21.8 2.4 2.2 47.4 34.8 6.6 1.0 · 0.6 · · 1.2 4.2 · · 0.6 0.4 · · 1.8 2.0 0.8 · · · · · 1.4 ·Darlington 102.8 112 6 22.0 22.0 · 20.0 · 1.0 0.4 0.4 · · · 8.4 2.4 8.8 7.8 0.8 1.0 1.0 0.2 · 1.2 · · · · · · · · 1.2 4.2Double Island Point Lighthouse 173.8 164 6 8.6 30.0 16.4 3.6 6.2 5.2 63.4 0.8 1.6 1.0 6.4 4.2 · 0.8 1.4 1.0 0.4 · · 0.8 · 1.8 0.2 0.4 0.8 · 15.2 0.6 · 1.4 1.6Dunollie 143.6 55 10 2.0 68.4 28.0 31.2 6.6 3.6 3.8Eerwah Vale 405.8 98.2 52.0 25.4 29.8 11.6 58.6 8.8 0.6 45.4 14.4 9.2 16.6 4.2 2.2 3.6 4.4 0.4 0.6 6.4 2.8 1.2 3.2 6.2Embreys Bridge 207.0 54 H 56.8 31.2 3.0 1.2 76.2 25.4 5.0 » 6.4 1.8Esk Post Office 212.2 103 9 17.6 86.2 37.4 5.0 2.8 · 45.6 7.6 · · · · · 1.4 2.0 · · · · · · · · 4.6 · · · · 1.2 0.8 ·Eumundi - Crescent Rd 458.2 235 9 22.0 105.0 65.0 30.0 40.8 15.6 35.0 5.4 0.4 23.4 24.0 11.4 29.8 6.0 8.0 8.0 2.2 8.0 1.2 6.0 8.8 2.2Fernvale - Burns St 137.8 8.4 65.8 16.6 6.4 2.6 8.0 5.6 2.2 4.4 · 1.0 · · 2.4 7.0 · 1.0 0.4 · · 1.6 · · · · » 4.0 · 0.4 · ·Gatton Allan Street 128.0 79 9 10.0 61.8 24.6 2.6 0.2 7.2 8.2 3.6 0.6 2.2 4.4 2.0 0.6Glengaven 268.2 217 7 19.0 » 74.0 42.0 1.2 16.0 4.0 4.0 1.6 0.8 · 34.0 4.0 » 46.0 1.6 · 3.0 · · · 1.8 · 1.8 · · · » 9.0 2.0 2.4Godwin Beach 258.2 26.8 92.6 34.0 7.8 7.0 4.6 0.4 0.2 · · 8.2 15.6 1.6 14.4 6.4 6.2 6.8 0.6 0.8 · 1.0 0.4 · 0.2 · · · 5.6 10.2 0.8 6.0Gold Coast Seaway 185.2 95 9 13.4 106.8 13.4 2.2 · 4.2 1.8 3.4 0.2 · · 19.6 0.6 3.2 5.4 1.6 1.0 0.2 0.2 0.2 3.2 · · 0.2 · 4.0 0.2 · · · 0.2Goomboorian 384.5 160 10 10.0 62.0 44.0 4.0 6.0 21.0 140.0 6.5 » 10.5 12.5 17.0 8.0 13.5 6.5 » » 10.0 5.5 3.5 4.0Goomeri Post Office 121.8 73 9 23.4 » » 98.4Greenbank Thompson Road 157.6 96 8 8.4 72.4 38.4 1.6 0.4 11.0 3.0 1.6 0.4 · · 0.2 · 2.0 9.6 · · 0.8 0.2 · 0.4 · · · · · · · » 7.0 0.2Greenslopes Private Hospital 174.9 110 8 22.0 63.4 20.0 32.6 5.2 4.1 3.0 15.6 9.0
Monthly Weather Review Queensland March 2010
page 23

Daily and total rainfall for March 2010Total is the total precipitation for March 2010; a missing total indicates there is concern about the quality of some of the daily values. Avg isthe long-term average total precipitation for March. Decile is the decile rank of total precipitation for March 2010 in the climate record ofother March totals; “L” indicates this is the lowest on record, and “H” it is the highest on record. Long-term average and decile rank are onlyshown if there are sufficient years of climate record available. Reports of zero precipitation are shown as “· ”. When a reading wasaccumulated over more than one day, “»” is shown on the days that are part of the accumulation.Gympie 288.2 143 9 6.6 60.0 41.8 3.6 6.0 43.4 77.8 5.0 2.0 · 15.6 5.4 0.6 8.6 3.0 0.2 0.8 1.2 0.8 · 1.4 0.6 · · 0.2 · · 1.4 2.0 0.2 ·Harrisville Post Office 120.4 87 8 10.6 51.8 21.4 2.0 · 0.6 10.6 3.8 1.4 · · · · · 10.8 · · · · · · · · 4.0 · 3.0 · · · 0.4 ·Hervey Bay Airport 218.0 108 9 0.8 56.6 23.4 5.0 6.2 16.2 38.8 1.4 · · · 20.0 2.8 7.0 0.8 4.0 7.8 6.4 0.4 0.4 5.2 0.6 0.2 · 2.0 11.4 · 0.2 0.4 · ·Highvale 199.6 124 8 19.8 73.6 27.8 » 17.0 25.0 12.2 2.4 0.6 · 5.2 1.0 1.0 1.0 3.6 · · 0.6 0.4 · 0.6 · · · · 4.2 · 0.8 2.6 · 0.2Hilltop Gardens 224.4 118 9 32.5 84.0 43.0 20.0 0.6 8.6 5.0 3.0 0.4 1.8 1.2 0.3 5.0 1.0 0.4 1.2 1.4 1.0 5.0 8.4 0.6 ·Hinze Dam 140.6 144 6 12.8 39.6 15.2 8.8 · » » 22.2 1.4 · · 0.8 » » 20.6 · · 0.6 1.8 » » 0.4 · · · 7.4 » » 4.0 0.4 4.6Howard Post Office 210.4 126 9 18.2 44.4 15.6 5.8 10.8 » » 69.2 · · 6.8 2.8 » » 12.4 1.0 » » 2.2 · » 8.4 · · 0.8 3.6 » » 7.8 · 0.6Imbil Post Office 356.0 146 10 47.0 85.9 53.6 4.2 8.8 16.3 82.0 16.6 0.6 3.8 11.0 10.6 1.5 » 6.0 0.6 1.5 · 3.0 · 2.4 · · · · · · · 0.6 · ·Jimna Forestry 224.4 77 H 3.6 74.4 43.0 3.8 2.8 17.4 41.6 7.6 · 0.2 0.2 12.0 · 5.0 1.6 6.6 0.2 1.4 0.6 · 1.6 · · 0.2 0.2 · · 0.2 · 0.2 ·Kandanga Post Office 311.4 150 10 112.4 69.0 56.0 23.0 12.4 0.6 20.0 11.0 1.4 » 5.2 0.4Karalee 171.6 24.0 66.2 21.1 12.2 0.4 17.2 9.1 2.9 0.9 · · · · 6.6 6.0 · · 0.8 · · 2.8 · · · · 1.2 · 0.2 · · ·Kenilworth Township 361.5 172 10 58.0 66.5 68.0 9.5 6.0 11.0 59.5 11.0 0.4 · 22.0 9.0 1.0 11.0 5.0 6.0 1.8 1.2 0.4 · 1.0 1.6 · 5.0 0.6 0.2 · 0.4 1.2 2.0 2.2Kilkivan Post Office 240.0 94 10 2.8 73.4 15.8 1.5 0.8 » 106.6 12.4 2.0 0.1 11.8 0.9 · 1.3 2.2 · 3.2 0.9 0.2 · 0.4 2.2 0.3 · · · · · 1.2 · ·Kingaroy Airport 183.2 48 H 1.0 53.2 36.2 1.2 0.6 67.2 13.0 6.0 0.6 0.2 · 0.2 0.2 0.4 0.8 · · 0.2 0.2 · 0.2 · 0.6 0.6 · · 0.2 0.2 · 0.2 ·Kingfisher Bay Resort 305.8 136 H · 39.0 52.0 23.2 39.2 19.0 40.6 2.6 0.5 · » 22.8 11.8 3.8 2.8 5.2 6.3 5.8 1.2 0.8 12.0 · · · · 15.8 0.8 0.6 · · ·Lake Cooroibah(Pines Av) 419.2 183 H 12.8 104.6 66.0 27.6 30.8 5.0 55.6 2.0 0.2 · 22.8 12.4 1.8 15.8 6.4 14.4 14.2 1.0 1.0 · 1.2 1.0 0.8 · · 0.4 1.8 9.2 2.2 8.2 ·Lake Manchester 147.0 103 8 16.0 61.0 18.0 10.0 · · · 22.6 1.0 · · · · · 13.0 · · · · · · 2.0 · · · 2.4 · · · 1.0 ·Lanark 172.2 59 10 1.6 57.0 44.0 50.0 7.0 3.4 1.6 7.6Landsborough Post Office 539.0 241 10 65.2 118.6 70.8 28.6 34.6 » » » 67.0 · » 70.6 » » » 43.2 5.0 1.4 » » » » » 11.2 » » » » 11.0 » 11.8Lawnton Colonial Drive 271.0 126 10 23.0 76.6 69.6 19.8 5.4 19.0 5.0 0.2 0.6 · 11.0 10.0 1.2 5.2 2.6 0.6 · 0.6 · · 1.6 0.2 · 9.0 · 3.4 » 5.0 · 1.2 0.2Lindfield 242.6 143 9 1.8 83.2 42.6 8.0 4.6 7.2 43.0 7.8 2.4 4.2 2.2 9.8 0.4 7.4 4.6 1.2 0.6 3.4 0.2 · 2.6 0.8 · · · · · 0.4 0.6 · 3.6Logan City Water Treatment 147.1 114 8 10.3 68.0 20.8 1.8 0.6 13.4 2.6 0.3 0.3 · · 3.4 1.2 10.4 5.0 1.0 · 1.5 1.4 · 1.2 · · · · 0.5 · 0.5 » 2.4 0.5Long Pocket CSIRO Lab 179.0 101 9 22.4 64.4 20.0 17.2 20.0 5.0 0.8 2.8 2.0 6.8 6.2 1.6 1.6 0.4 4.0 1.2 2.2 0.4Lowood Don St 120.8 90 8 9.8 56.4 19.2 11.2 0.8 9.0 · 5.4 1.2 · 3.4 · · 2.6 · · · · · · 1.2 · · · · 0.6 · · · · ·Lumeah 76.8 90 5 4.0 42.0 16.8 0.6 · 2.0 · · · · · · · · 2.0 5.0 0.8 · · · · · · · · · · 3.0 · · 0.6Maclean Bridge 149.8 88 9 41.6 52.8 20.2 5.2 · 8.2 0.4 1.2 0.2 · · · · 3.4 9.4 0.2 · 1.2 0.8 · 1.0 · · 0.8 · 1.2 · · 1.6 0.2 0.2Maleny Tamarind St 588.0 288 10 13.2 109.6 63.2 30.8 44.6 27.8 101.0 8.4 1.0 · 18.4 43.2 4.4 25.4 5.6 38.8 5.6 2.8 1.2 0.2 8.8 7.2 · 1.6 0.2 0.8 · 2.2 4.6 0.4 17.0Mango Hill 239.2 126 9 19.6 81.4 67.8 14.8 3.8 13.2 · 0.8 · · 3.0 15.4 0.6 4.0 3.4 0.6 · 1.2 · · · 1.2 · 0.6 · · · · 5.2 · 2.6Manly Railway Station 92.7 134 5 28.6 10.0 8.4 2.2 14.4 5.8 1.3 11.0 11.0Maroochydore Aero 394.6 137 H 7.2 143.6 64.0 10.2 24.0 · 23.0 · · 35.8 14.8 12.0 2.6 31.8 7.0 · 1.2 0.2 3.8 0.4 0.2 · · · · 4.4 3.4 0.8 4.2Maroon Dam 96.5 80 7 8.2 24.0 15.6 2.8 0.3 7.0 6.2 5.0 3.6 · · · · · 1.8 0.6 · · · · · · · · · 7.1 · 4.1 · 10.2 ·Maryborough 220.8 156 8 3.0 56.2 20.2 13.8 20.4 26.4 25.8 3.8 0.6 · 7.8 5.8 1.0 4.6 1.4 0.4 1.4 2.0 1.6 1.0 9.4 1.0 · 0.2 0.8 7.0 2.4 0.8 2.0 · ·Miami Bardon Ave 175.4 185 6 · · 95.4 9.6 · · · 10.4 · · · 13.6 · · 35.0 4.8 · · 4.2 · · · · · · · · · 2.4 · ·Miva 250.0 90 H 24.8 63.0 14.6 1.0 3.2 42.0 51.0 8.4 0.8 3.0 17.4 1.2 9.2 1.0 0.4 1.0 0.2 0.2 3.2 2.0 2.4Moogerah Dam 115.8 91 8 16.8 28.0 20.0 4.2 · 9.6 13.0 4.2 2.0 · · · · · 11.2 · · · · · · · · 1.6 · · · · · 5.2 ·Morayfield Mark St 263.4 154 8 » » » 173.6 » 22.2 4.4 3.6 » » » 27.4 1.2 » 7.8 » » 4.0 » » 3.8 » » » » » » » 5.6 3.0 6.8Mount Joseph 237.0 112 9 0.8 37.0 19.2 1.2 » 77.6 48.4 18.4 0.6 10.6 3.0 4.6 0.4 3.8 0.8 0.2 0.4 1.2 3.2 1.4 0.4 3.4 0.4Mt Binga 266.6 62 H · 97.0 37.0 1.4 5.0 78.4 29.2 4.6 0.8 · · · · · 4.0 · · · · · 3.0 0.6 · 3.8 · · · · 1.8 · ·Mt Glorious Fahey Rd 23.8 99.4 42.6Mt Nebo Post Office 275.8 156 9 22.6 80.8 20.2 43.6 8.6 42.8 21.2 3.6 0.4 · · 2.4 1.2 5.4 5.4 · · 2.6 1.4 · 1.4 1.0 · · · 6.2 0.2 0.6 3.2 1.0 ·Mt Tamborine Fern St 230.2 189 7 26.6 48.8 22.4 12.4 0.6 35.8 22.6 2.8 4.2 · · · 0.4 12.4 6.4 · · 1.2 2.0 · 2.0 · · · · 11.8 · 10.2 2.0 3.4 2.2Mt Tarampa 110.2 65 9 8.6 60.0 22.4 6.4 3.8 4.8 1.0 3.2Nambour DPI - Hillside 540.2 15.0 159.8 77.8 16.4 42.8 12.2 72.6 3.6 0.4 · 40.6 26.8 8.2 15.4 10.4 7.0 2.4 3.0 0.2 · 2.2 2.6 · 1.6 0.2 · 0.2 3.6 14.2 · 1.0Nanango Wills St 8.0 51.6 26.6 2.8 2.2 42.6 30.8 6.4 1.0 2.4 · 0.6 · 0.8 3.2 1.2 · 1.2 0.3 · 1.2 · 1.0 0.2Narangba - Browns Crk Road 267.2 116 H 17.8 83.4 70.4 18.4 7.6 8.4 4.6 1.2 · · 25.2 8.2 0.8 5.0 1.6 0.4 1.2 1.0 · · 2.0 · · 0.4 · 0.6 · 2.4 6.4 · 0.2Nerang Gilston Rd 184.3 202 6 9.2 53.0 29.2 12.4 · 13.8 3.4 3.2 · · · 5.0 3.6 14.8 7.2 1.3 · 2.6 · · · · · · · 12.2 · · · · 13.4Ormiston College 245.8 136 8 16.0 63.4 35.0 25.4 8.0 9.6 1.0 1.6 25.0 » 9.0 5.4 1.8 3.4 4.0 1.0 7.0 2.2 8.0 19.0Oxenford (Oberon Way) 264.0 183 8 13.8 115.8 26.4 5.2 · 11.0 4.6 2.2 0.4 · · 5.8 1.8 10.8 14.2 1.4 0.4 1.6 1.0 0.2 5.2 0.2 · 0.2 · 4.0 · 2.8 2.8 0.4 31.8Palmwoods 500.2 240 10 14.2 110.0 97.6 17.6 36.8 13.0 63.2 5.2 27.0 34.6 8.4 7.4 8.8 5.4 2.4 7.0 3.2 2.8 35.6Peachester 423.9 229 10 12.0 131.0 62.0 22.2 41.0 25.0 43.0 1.0 1.2 26.0 17.5 » 16.5 4.0 1.6 2.2 4.5 0.2 4.5 2.0 2.0 4.5Pechey Forestry 221.0 91 10 13.0 74.2 25.6 4.2 2.0 » » 86.2 2.0 8.6 0.3 1.0 0.5 3.4Point Lookout 252.2 121 H 10.1 102.6 31.1 2.1 0.2 19.2 4.4 · · · 8.4 15.0 0.4 4.0 5.6 16.3 7.3 0.2 · · 1.6 1.4 · 14.9 · · · · 5.6 · 1.8Proston Post Office 180.0 67 10 68.4 29.0 1.4 52.4 17.6 5.0 6.2Rainbow Beach 304.8 129 H 2.4 52.2 49.6 25.6 8.0 19.8 68.8 3.4 · · 4.2 13.6 4.2 7.4 5.4 12.8 3.0 0.4 0.4 1.4 0.6 4.8 · · 7.2 · 3.2 6.2 · 0.2 ·Redcliffe 190.2 29.4 92.6 10.6 2.4 8.4 · 0.2 0.2 · 8.8 11.4 1.4 6.4 4.2 0.4 · 0.4 · · · 0.6 0.2 · · · · 0.2 4.0 1.2 7.2Redlands HRS 283.8 163 9 69.0 62.0 27.8 34.6 · » » 11.0 0.2 · · 19.2 » » 8.8 4.0 5.4 0.2 0.4 » » 4.4 · · · 5.4 » » 12.4 0.4 18.6Somerset Dam 236.2 112 10 14.0 77.0 66.0 12.0 1.0 5.4 44.0 5.0 0.5 1.0 0.4 0.3 1.0 0.6 0.4 1.2 1.0 0.8 2.6 2.0Southport Ridgeway Ave 135.8 24.0 2.4 · 4.0 2.0 1.8 · · · 9.4 2.0 6.2 2.4 0.4 · 1.4 0.4 · 0.4 · · · · 20.4 · · 0.4 · ·Springbrook Road 326.0 248 8 38.0 39.0 23.0 34.0 3.0 24.0 8.6 5.4 3.0 · · 55.0 2.0 22.0 25.0 6.0 3.6 4.0 3.0 1.0 0.8 · · · 2.0 1.0 · 3.0 2.2 17.0 0.4Tarome 137.8 95 8 6.0 33.0 17.4 2.8 · 14.2 16.4 9.4 1.0 · 6.0 · · · 12.6 0.8 · · · · · · 0.6 3.2 · · · 0.4 · 14.0 ·Tewantin RSL Park 369.8 181 H 7.8 103.0 65.6 20.8 44.6 4.4 16.8 5.8 · · 25.6 11.4 0.8 16.4 1.2 16.4 15.0 1.8 0.2 0.2 3.0 0.8 · · · · 0.8 · 0.8 6.4 0.2Tiaro Post Office 235.0 97 H 8.6 32.0 17.4 4.4 9.8 37.6 40.0 12.0 1.4 · 18.6 7.4 2.2 10.6 1.8 2.4 8.0 0.6 0.8 2.6 3.6 5.0 0.6 · 3.2 · · 3.8 0.6 · ·Tomewin - Tallowood 267.6 235 7 9.2 67.6 34.6 12.4 1.8 11.2 3.2 3.4 0.6 · · 30.4 5.2 33.6 15.0 12.4 1.6 0.6 6.4 · · · 0.6 · · · · 9.0 7.0 1.2 0.6Toogoolawah Post Office 184.4 88 10 5.2 69.0 46.0 3.6 2.6 9.2 » 36.6 6.2 · · · · · 3.0 · · · · · · · · 0.2 · 1.6 · · · 1.2 ·Toolara (Kelly) 355.2 117 H 23.8 46.0 27.4 7.6 15.6 36.0 112.4 9.2 0.2 · 8.4 19.8 4.0 18.8 1.8 5.0 3.2 1.8 1.6 1.2 1.8 5.0 · · · · · 2.8 1.6 0.2 ·Tuan Creek Forest Stn 299.2 159 9 4.0 50.0 23.0 15.0 29.6 » » 107.4 0.4 · 5.0 11.4 » » 11.0 3.6 3.6 7.0 1.2 2.4 8.2 3.2 · 0.8 1.6 » » 5.6 5.2 · ·University of Queensland Gatton 135.6 78 9 8.8 53.8 28.2 2.6 0.2 15.0 6.0 3.2 0.4 1.4 0.6 · · 2.2 · · · · 0.2 · 0.2 0.2 · 11.6 0.2 0.2 · · · 0.6 ·Wivenhoe Dam 113.6 50 9 8.4 58.0 16.4 4.4 1.4 4.8 3.6 1.8 3.4 · · · · 2.2 1.4 · · · · · · · · · · 5.6 · 0.2 · 0.4 1.6Woodford Stanmore 338.2 142 H 34.2 98.8 42.8 15.0 28.0 21.4 33.0 3.6 1.0 · 7.4 4.8 · 7.0 7.2 · · 8.4 · · 4.8 4.6 · 4.8 · · · · 7.8 2.6 1.0Woolooga 216.4 90 10 5.4 69.0 25.0 67.4 39.4 10.2Yarraman Post Office 236.6 83 10 6.2 78.0 43.0 4.4 1.0 » » 97.0 0.8 » » 1.0 3.8 » » 0.8 0.6
East Darling Downs (41) Total Avg Decile 1 2 3 4 5 6 7 8 9 10 11 12 13 14 15 16 17 18 19 20 21 22 23 24 25 26 27 28 29 30 31Applethorpe 101.4 67 8 4.8 43.0 22.0 1.8 · 13.4 3.0 5.0 0.4 0.2 · · 1.4 0.2 1.2 0.2 · · · · · · 3.2 0.4 0.2 · · · · · 1.0Ballandean Post Office 83.8 61 8 9.4 29.0 10.0 13.0 » 4.6 0.8 3.0 9.6 4.4Beardy Junction 76.0 57 7 11.0 24.4 3.4 · · 21.0 1.4 » 1.6 · · · · · · · · · · · · · 5.2 · · · · 2.6 · · 5.4Beruna 132.0 42 H » 92.0 » » 26.0 14.0Cambooya Post Office 118.4 68 9 7.0 66.0 17.2 · · » » 19.2 · 5.6 · · · · 0.6 · · · · · · · · · · · · · · · 2.8Chinchilla Water Treatment Plant 110.2 62 9 1.4 76.0 · · · 29.0 1.4 1.6 · · · · · · · · · · · · · · · · · · · · · 0.8 ·Clifton Post Office 84.8 63 7 7.4 39.0 14.4 » » 15.2 4.0 3.0 1.8Cooby Creek Dam 141.4 44 H 14.0 55.0 11.4 2.4 36.2 5.6 2.6 0.6 2.2 1.4 0.2 9.8Coolmunda Dam 132.5 50 10 12.4 35.0 25.0 · · 37.5 · 0.2 4.0 · · · · · 1.6 · · · · · · · 12.0 · · · · · · · 4.8Dalby Airport 174.2 44 H 6.6 83.8 23.4 0.2 · 39.8 1.2 2.6 · · · · · · · · · · · · · · · 9.8 · · · · · · 6.8Dalveen 138.3 78 9 6.2 55.0 30.0 4.8 · 0.2 17.0 0.8 7.8 0.6 · · 1.8 · 2.6 · · 0.4 0.4 0.2 · 0.4 3.6 · · · · 2.0 0.1 · 4.4Dunmore State Forest 155.0 61 10 84.0 22.5 45.0 3.5Ellangowan 117.2 59 9 11.0 52.8 18.0 · · 20.0 · 3.0 · · · · · · · · · · · · · · · 5.2 · · · · · · 7.2Felton 118.9 51 9 10.8 58.5 12.0 · · 20.0 0.6 3.6 · · · · · · 4.2 · · · · · · · · 2.0 · · · · · · 7.2Glenelg 182.2 54 10 38.2 28.0 25.2 · · 34.4 1.4 2.2 12.4 · · · · · · · · · · · · · 37.6 · · · · 2.8 · · ·Glenlyon Dam 120.1 58 9 31.0 27.0 5.8 · · 28.0 5.0 0.8 1.0 · · · · · · · · · · · · · 10.0 · 3.0 · · 4.8 · 0.2 3.5Goondiwindi Airport 153.4 52 H 14.4 61.2 21.6 · 0.8 29.8 1.4 · · · · · · · · · · · · · · · · · · · · · · · 24.2Haden Post Office 75.6 13.0Inglewood Forest 154.0 55 9 19.8 63.2 22.0 · · 40.6 0.4 · 0.6 · · · · · 0.2 · · · · · · · 4.4 · · · · · · · 2.8Inglewood Post Office 114.5 58 9 » 71.0 25.6 17.9Jandowae Post Office 196.2 63 10 7.2 73.8 27.4 · · 40.8 22.2 3.2 · · · · · · · · · · · · · · 0.2 21.4 · · · · · · ·Jondaryan Post Office 142.2 57 10 8.0 53.0 21.2 42.0 4.4 4.6 1.4 7.6Killarney Post Office 83.6 76 7 1.6 29.8 19.8 6.4 · 10.6 10.0 0.6 · · · · 1.8 · 1.0 · · · · · · 0.6 0.6 · · · · 0.8 · · ·Leslie Dam 76.0 55 8 8.2 29.0 18.2 0.2 · 6.4 · 4.4 · · · · · · · · · · · · · · 0.6 6.6 · · · · · · 2.4Macalister 166.8 47 H 8.0 69.0 28.0 · · 35.6 9.0 3.6 · · · · · · · · · · · · · · · 3.4 · · · · · 2.0 8.2Maryvale 82.5 81 6 15.0 29.2 14.0 1.4 8.0 5.9 1.0 0.2 · · · · · · 2.6 · · · 0.4 · · · · 4.0 · · · · 0.8 · ·Millmerran Post Office 219.0 63 10 12.0 74.0 24.0 3.0 · 48.0 1.0 3.0 · · · · · · · · · · · · · · · · · · · · · · 54.0Mt Kynoch 288.4 81 H 16.2 90.4 44.8 6.8 3.8 64.6 36.0 14.2 0.4 1.8 0.2 · · 2.6 6.6 · · · · · · · · · · · · · · · ·Oakey Aero 139.0 45 H 7.4 65.4 13.2 1.0 · 42.6 1.6 4.2 · 0.2 · · · 0.4 0.8 · · · · · · · · 2.0 0.2 · · · · · ·Oakington 82.2 67 7 4.6 30.6 14.6 1.2 · 15.4 10.8 1.0 · · · · 0.2 · 0.4 0.2 · 0.6 0.2 · · · 0.4 · · 0.8 · 1.0 0.2 · ·Pittsworth 69.6 62 7 11.8 » » » 40.0 8.0 1.8 8.0Pratten 23.0 61 3 8.0 15.0Pratten 87.0 52 8 10.4 32.2 17.0 0.4 · 9.8 · 3.8 · · · · · · · · · · · · · · 1.0 7.2 · · · · · · 5.2
Monthly Weather Review Queensland March 2010
page 24
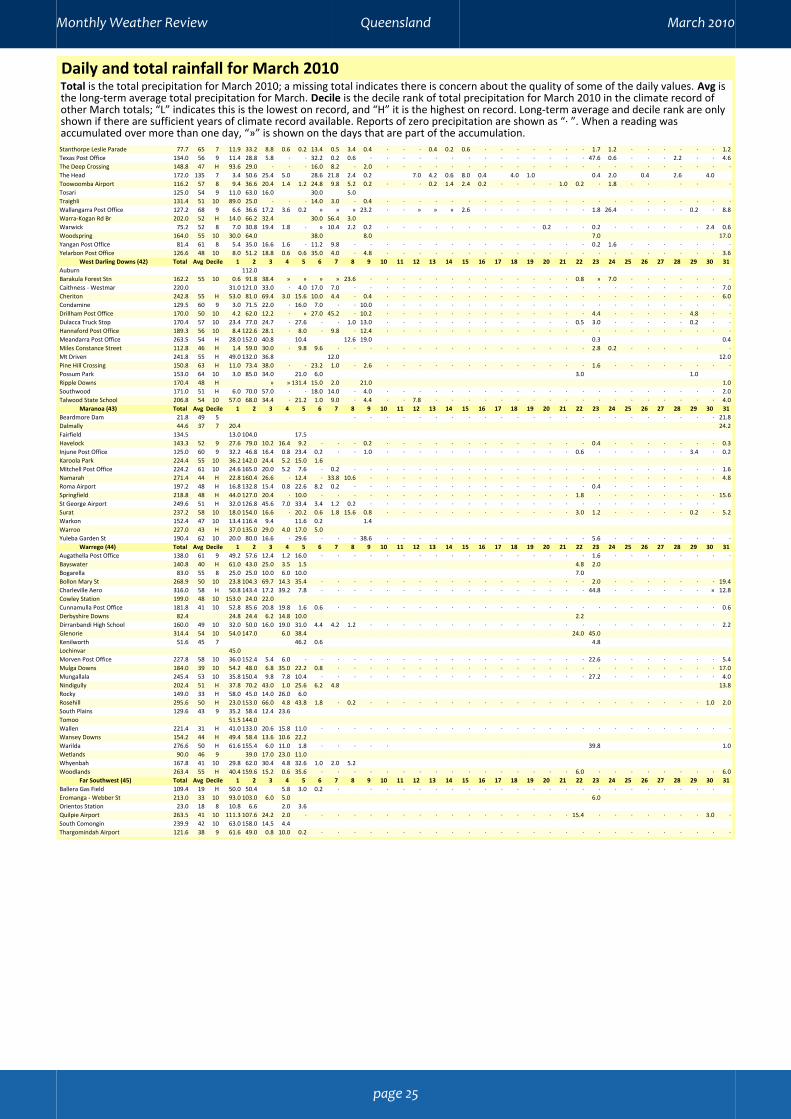
Daily and total rainfall for March 2010Total is the total precipitation for March 2010; a missing total indicates there is concern about the quality of some of the daily values. Avg isthe long-term average total precipitation for March. Decile is the decile rank of total precipitation for March 2010 in the climate record ofother March totals; “L” indicates this is the lowest on record, and “H” it is the highest on record. Long-term average and decile rank are onlyshown if there are sufficient years of climate record available. Reports of zero precipitation are shown as “· ”. When a reading wasaccumulated over more than one day, “»” is shown on the days that are part of the accumulation.Stanthorpe Leslie Parade 77.7 65 7 11.9 33.2 8.8 0.6 0.2 13.4 0.5 3.4 0.4 · · · 0.4 0.2 0.6 · · · · · · · 1.7 1.2 · · · · · · 1.2Texas Post Office 134.0 56 9 11.4 28.8 5.8 · · 32.2 0.2 0.6 · · · · · · · · · · · · · · 47.6 0.6 · · · 2.2 · · 4.6The Deep Crossing 148.8 47 H 93.6 29.0 · · · 16.0 8.2 · 2.0 · · · · · · · · · · · · · · · · · · · · · ·The Head 172.0 135 7 3.4 50.6 25.4 5.0 28.6 21.8 2.4 0.2 7.0 4.2 0.6 8.0 0.4 4.0 1.0 0.4 2.0 0.4 2.6 4.0Toowoomba Airport 116.2 57 8 9.4 36.6 20.4 1.4 1.2 24.8 9.8 5.2 0.2 · · · 0.2 1.4 2.4 0.2 · · · · 1.0 0.2 · 1.8 · · · · ·Tosari 125.0 54 9 11.0 63.0 16.0 30.0 5.0Traighli 131.4 51 10 89.0 25.0 · · · 14.0 3.0 · 0.4 · · · · · · · · · · · · · · · · · · · · · ·Wallangarra Post Office 127.2 68 9 6.6 36.6 17.2 3.6 0.2 » » » 23.2 · · » » » 2.6 · · · · · · · 1.8 26.4 · · · · 0.2 · 8.8Warra-Kogan Rd Br 202.0 52 H 14.0 66.2 32.4 30.0 56.4 3.0Warwick 75.2 52 8 7.0 30.8 19.4 1.8 · » 10.4 2.2 0.2 · · · · · · · · · · 0.2 · · 0.2 · · · · · · 2.4 0.6Woodspring 164.0 55 10 30.0 64.0 38.0 8.0 7.0 17.0Yangan Post Office 81.4 61 8 5.4 35.0 16.6 1.6 · 11.2 9.8 · · · · · · · · · · · · · · · 0.2 1.6 · · · · · · ·Yelarbon Post Office 126.6 48 10 8.0 51.2 18.8 0.6 0.6 35.0 4.0 · 4.8 · · · · · · · · · · · · · · · · · · · · · 3.6
West Darling Downs (42) Total Avg Decile 1 2 3 4 5 6 7 8 9 10 11 12 13 14 15 16 17 18 19 20 21 22 23 24 25 26 27 28 29 30 31Auburn 112.0Barakula Forest Stn 162.2 55 10 0.6 91.8 38.4 » » » » 23.6 · · · · · · · · · · · · · 0.8 » 7.0 · · · · · · ·Caithness - Westmar 220.0 31.0 121.0 33.0 · 4.0 17.0 7.0 · · · · · · · · · · · · · · · · · · · · · · · 7.0Cheriton 242.8 55 H 53.0 81.0 69.4 3.0 15.6 10.0 4.4 · 0.4 · · · · · · · · · · · · · · · · · · · · · 6.0Condamine 129.5 60 9 3.0 71.5 22.0 · 16.0 7.0 · · 10.0 · · · · · · · · · · · · · · · · · · · · · ·Drillham Post Office 170.0 50 10 4.2 62.0 12.2 · » 27.0 45.2 · 10.2 · · · · · · · · · · · · · 4.4 · · · · · 4.8 · ·Dulacca Truck Stop 170.4 57 10 23.4 77.0 24.7 · 27.6 · · 1.0 13.0 · · · · · · · · · · · · 0.5 3.0 · · · · · 0.2 · ·Hannaford Post Office 189.3 56 10 8.4 122.6 28.1 · 8.0 · 9.8 · 12.4 · · · · · · · · · · · · · · · · · · · · · ·Meandarra Post Office 263.5 54 H 28.0 152.0 40.8 10.4 12.6 19.0 0.3 0.4Miles Constance Street 112.8 46 H 1.4 59.0 30.0 · 9.8 9.6 · · · · · · · · · · · · · · · · 2.8 0.2 · · · · · ·Mt Driven 241.8 55 H 49.0 132.0 36.8 12.0 12.0Pine Hill Crossing 150.8 63 H 11.0 73.4 38.0 · · 23.2 1.0 · 2.6 · · · · · · · · · · · · · 1.6 · · · · · · · ·Possum Park 153.0 64 10 3.0 85.0 34.0 21.0 6.0 3.0 1.0Ripple Downs 170.4 48 H » » 131.4 15.0 2.0 21.0 1.0Southwood 171.0 51 H 6.0 70.0 57.0 · · 18.0 14.0 · 4.0 · · · · · · · · · · · · · · · · · · · · · 2.0Talwood State School 206.8 54 10 57.0 68.0 34.4 · 21.2 1.0 9.0 · 4.4 · · 7.8 · · · · · · · · · · · · · · · · · · 4.0
Maranoa (43) Total Avg Decile 1 2 3 4 5 6 7 8 9 10 11 12 13 14 15 16 17 18 19 20 21 22 23 24 25 26 27 28 29 30 31Beardmore Dam 21.8 49 5 · · · · · · · · · · · · · · · · · · · · · · · 21.8Dalmally 44.6 37 7 20.4 24.2Fairfield 134.5 13.0 104.0 17.5Havelock 143.3 52 9 27.6 79.0 10.2 16.4 9.2 · · · 0.2 · · · · · · · · · · · · · 0.4 · · · · · · · 0.3Injune Post Office 125.0 60 9 32.2 46.8 16.4 0.8 23.4 0.2 · · 1.0 · · · · · · · · · · · · 0.6 · · · · · · 3.4 · 0.2Karoola Park 224.4 55 10 36.2 142.0 24.4 5.2 15.0 1.6Mitchell Post Office 224.2 61 10 24.6 165.0 20.0 5.2 7.6 · 0.2 · · · · · · · · · · · · · · · · · · · · · · · 1.6Namarah 271.4 44 H 22.8 160.4 26.6 · 12.4 · 33.8 10.6 · · · · · · · · · · · · · · · · · · · · · · 4.8Roma Airport 197.2 48 H 16.8 132.8 15.4 0.8 22.6 8.2 0.2 · · · · · · · · · · · · · · · 0.4 · · · · · ·Springfield 218.8 48 H 44.0 127.0 20.4 · 10.0 · · · · · · · · · · · · · · · · 1.8 · · · · · · · · 15.6St George Airport 249.6 51 H 32.0 126.8 45.6 7.0 33.4 3.4 1.2 0.2 · · · · · · · · · · · · · · · · · · · · · ·Surat 237.2 58 10 18.0 154.0 16.6 · 20.2 0.6 1.8 15.6 0.8 · · · · · · · · · · · · 3.0 1.2 · · · · · 0.2 · 5.2Warkon 152.4 47 10 13.4 116.4 9.4 11.6 0.2 1.4Warroo 227.0 43 H 37.0 135.0 29.0 4.0 17.0 5.0Yuleba Garden St 190.4 62 10 20.0 80.0 16.6 · 29.6 · · · 38.6 · · · · · · · · · · · · · 5.6 · · · · · · · ·
Warrego (44) Total Avg Decile 1 2 3 4 5 6 7 8 9 10 11 12 13 14 15 16 17 18 19 20 21 22 23 24 25 26 27 28 29 30 31Augathella Post Office 138.0 61 9 49.2 57.6 12.4 1.2 16.0 · · · · · · · · · · · · · · · · · 1.6 · · · · · · · ·Bayswater 140.8 40 H 61.0 43.0 25.0 3.5 1.5 4.8 2.0Bogarella 83.0 55 8 25.0 25.0 10.0 6.0 10.0 7.0Bollon Mary St 268.9 50 10 23.8 104.3 69.7 14.3 35.4 · · · · · · · · · · · · · · · · · 2.0 · · · · · · · 19.4Charleville Aero 316.0 58 H 50.8 143.4 17.2 39.2 7.8 · · · · · · · · · · · · · · · · · 44.8 · · · · · · » 12.8Cowley Station 199.0 48 10 153.0 24.0 22.0Cunnamulla Post Office 181.8 41 10 52.8 85.6 20.8 19.8 1.6 0.6 · · · · · · · · · · · · · · · · · · · · · · · · 0.6Derbyshire Downs 82.4 24.8 24.4 6.2 14.8 10.0 2.2Dirranbandi High School 160.0 49 10 32.0 50.0 16.0 19.0 31.0 4.4 4.2 1.2 · · · · · · · · · · · · · · · · · · · · · · 2.2Glenorie 314.4 54 10 54.0 147.0 6.0 38.4 24.0 45.0Kenilworth 51.6 45 7 46.2 0.6 4.8Lochinvar 45.0Morven Post Office 227.8 58 10 36.0 152.4 5.4 6.0 · · · · · · · · · · · · · · · · · · 22.6 · · · · · · · 5.4Mulga Downs 184.0 39 10 54.2 48.0 6.8 35.0 22.2 0.8 · · · · · · · · · · · · · · · · · · · · · · · · 17.0Mungallala 245.4 53 10 35.8 150.4 9.8 7.8 10.4 · · · · · · · · · · · · · · · · · 27.2 · · · · · · · 4.0Nindigully 202.4 51 H 37.8 70.2 43.0 1.0 25.6 6.2 4.8 13.8Rocky 149.0 33 H 58.0 45.0 14.0 26.0 6.0Rosehill 295.6 50 H 23.0 153.0 66.0 4.8 43.8 1.8 · 0.2 · · · · · · · · · · · · · · · · · · · · · 1.0 2.0South Plains 129.6 43 9 35.2 58.4 12.4 23.6Tomoo 51.5 144.0Wallen 221.4 31 H 41.0 133.0 20.6 15.8 11.0 · · · · · · · · · · · · · · · · · · · · · · · · · ·Wansey Downs 154.2 44 H 49.4 58.4 13.6 10.6 22.2Warilda 276.6 50 H 61.6 155.4 6.0 11.0 1.8 · · · · · 39.8 1.0Wetlands 90.0 46 9 39.0 17.0 23.0 11.0Whyenbah 167.8 41 10 29.8 62.0 30.4 4.8 32.6 1.0 2.0 5.2Woodlands 263.4 55 H 40.4 159.6 15.2 0.6 35.6 · · · · · · · · · · · · · · · · 6.0 · · · · · · · · 6.0
Far Southwest (45) Total Avg Decile 1 2 3 4 5 6 7 8 9 10 11 12 13 14 15 16 17 18 19 20 21 22 23 24 25 26 27 28 29 30 31Ballera Gas Field 109.4 19 H 50.0 50.4 5.8 3.0 0.2 · · · · · · · · · · · · · · · · · · · · · · ·Eromanga - Webber St 213.0 33 10 93.0 103.0 6.0 5.0 6.0Orientos Station 23.0 18 8 10.8 6.6 2.0 3.6Quilpie Airport 263.5 41 10 111.3 107.6 24.2 2.0 · · · · · · · · · · · · · · · · · 15.4 · · · · · · · 3.0 ·South Comongin 239.9 42 10 63.0 158.0 14.5 4.4Thargomindah Airport 121.6 38 9 61.6 49.0 0.8 10.0 0.2 · · · · · · · · · · · · · · · · · · · · · · · · · ·
Monthly Weather Review Queensland March 2010
page 25