Embed Size (px)
Citation preview
Morbidity and Mortality in Morbidity and Mortality in People with Serious Mental People with Serious Mental
IllnessIllness
National Association of State Mental Health Program National Association of State Mental Health Program DirectorsDirectors
Medical Directors CouncilMedical Directors CouncilJuly 2006July 2006

OverviewOverview-- THE PROBLEMTHE PROBLEM
Increased Morbidity and Mortality Associated with Increased Morbidity and Mortality Associated with Serious Mental Illness (SMI)Serious Mental Illness (SMI)
Increased Morbidity and Mortality Largely Due to Increased Morbidity and Mortality Largely Due to Preventable Medical Conditions Preventable Medical Conditions
Metabolic Disorders, Cardiovascular Disease, Diabetes MellitusMetabolic Disorders, Cardiovascular Disease, Diabetes MellitusHigh Prevalence of Modifiable Risk Factors (Obesity, Smoking)High Prevalence of Modifiable Risk Factors (Obesity, Smoking)Epidemics within Epidemics (e.g., Diabetes, Obesity)Epidemics within Epidemics (e.g., Diabetes, Obesity)
Some Psychiatric Medications Contribute to RiskSome Psychiatric Medications Contribute to Risk
Established Monitoring and Treatment Guidelines to Established Monitoring and Treatment Guidelines to Lower Risk Are Underutilized in SMI PopulationsLower Risk Are Underutilized in SMI Populations
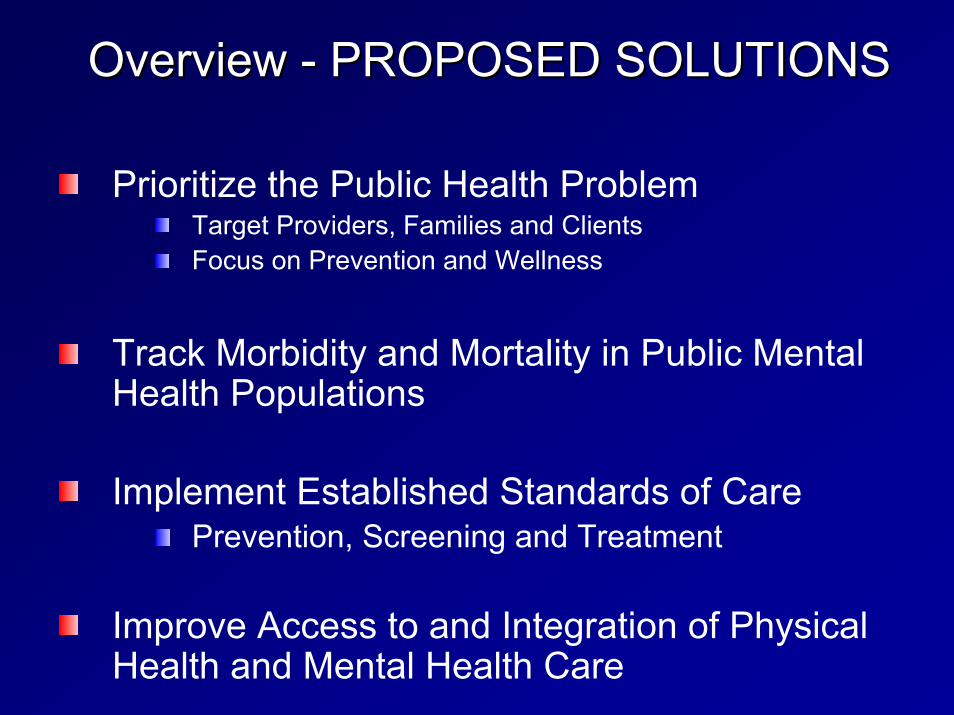
Overview Overview -- PROPOSED SOLUTIONSPROPOSED SOLUTIONS
Prioritize the Public Health ProblemTarget Providers, Families and ClientsFocus on Prevention and Wellness
Track Morbidity and Mortality in Public Mental Health Populations
Implement Established Standards of CarePrevention, Screening and Treatment
Improve Access to and Integration of Physical Health and Mental Health Care
Why Should we be Concerned About Why Should we be Concerned About Morbidity and Mortality?Morbidity and Mortality?
Recent data from several states have Recent data from several states have found that found that people with serious mental people with serious mental illness served by our public mental illness served by our public mental health systems die, on average, at least health systems die, on average, at least 25 years earlier that the general 25 years earlier that the general populationpopulation. .
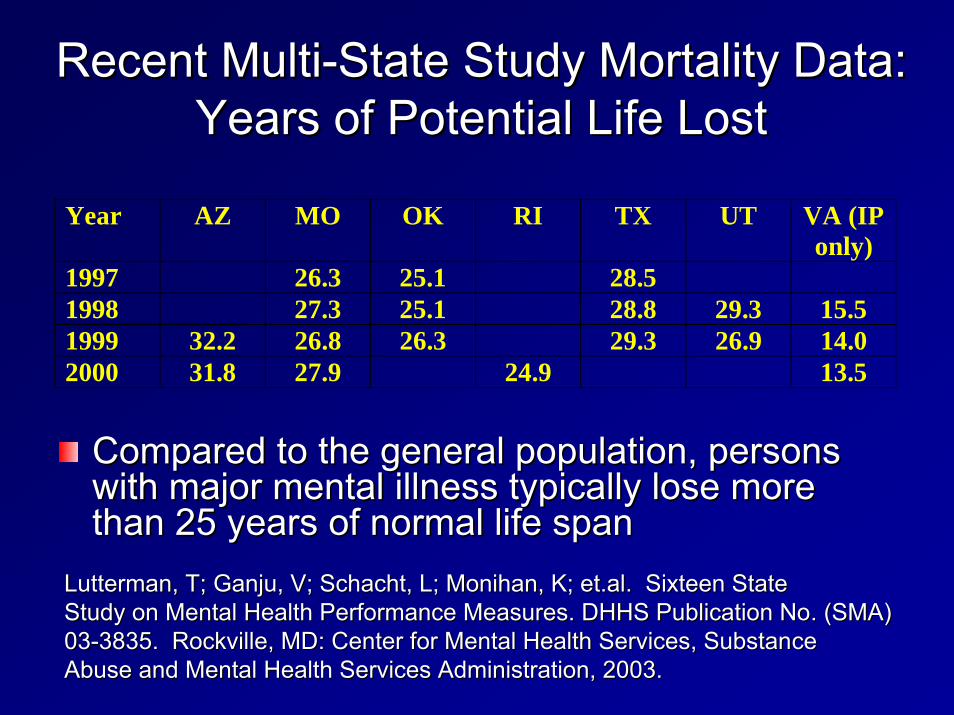
Recent MultiRecent Multi--State Study Mortality Data: State Study Mortality Data: Years of Potential Life LostYears of Potential Life Lost
Compared to the general population, persons Compared to the general population, persons with major mental illness typically lose more with major mental illness typically lose more than 25 years of normal life spanthan 25 years of normal life span
Year AZ MO OK RI TX UT VA (IP only)
1997 26.3 25.1 28.5 1998 27.3 25.1 28.8 29.3 15.5 1999 32.2 26.8 26.3 29.3 26.9 14.0 2000 31.8 27.9 24.9 13.5
LuttermanLutterman, T; , T; GanjuGanju, V; Schacht, L; , V; Schacht, L; MonihanMonihan, K; , K; et.alet.al. Sixteen State. Sixteen StateStudy on Mental Health Performance Measures. DHHS Publication NoStudy on Mental Health Performance Measures. DHHS Publication No. (SMA). (SMA)0303--3835. Rockville, MD: Center for Mental Health Services, Substan3835. Rockville, MD: Center for Mental Health Services, SubstanceceAbuse and Mental Health Services Administration, 2003.Abuse and Mental Health Services Administration, 2003.

Ohio StudyOhio Study--19981998--20022002Mean Years of Potential Life lost Mean Years of Potential Life lost
20,018 persons discharged, 608 deaths20,018 persons discharged, 608 deathsCause M F NAll 31.8 32.5 32.0Intentional self-harm (suicide) 41.4 42.7 41.7Assault (homicide) 42.3 35.8 41.6Accidents (unintentional injuries) 39.5 43.1 40.4Symptoms, signs, & abnormal 32.8 35.0 clinical & laboratory findings, NEC Diabetes mellitus 25.8 37.2 30.2Pneumonia & Influenza 29.4 25.0 28.3Diseases of heart 27.7 26.6 27.3Cerebrovascular diseases 20.7 32.8 25.5Malignant neoplasms (cancers) 24.3 26.9 25.3Chronic lower respiratory diseases 18.6 24.1 21.1
33.4
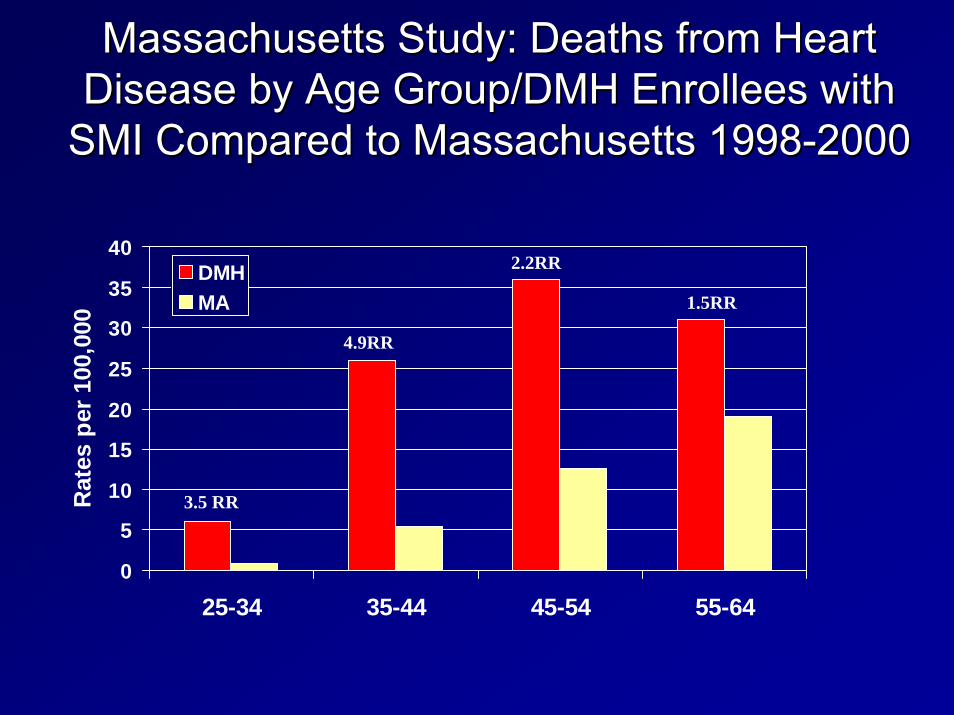
Massachusetts Study: Deaths from Heart Massachusetts Study: Deaths from Heart Disease by Age Group/DMH Enrollees with Disease by Age Group/DMH Enrollees with
SMI Compared to Massachusetts 1998SMI Compared to Massachusetts 1998--20002000
0
5
10
15
20
25
30
35
40
25-34 35-44 45-54 55-64
Rat
es p
er 1
00,0
00
DMHMA
3.5 RR
4.9RR
2.2RR
1.5RR

Maine Study Results: Comparison of Health Maine Study Results: Comparison of Health Disorders Between SMI & NonDisorders Between SMI & Non--SMI GroupsSMI Groups
59.4
33.930 28.6 28.4
22.8 21.716.5
11.5 11.16.3 5.9
0
10
20
30
40
50
60
70
80
Skeletal- Connective
Gastro-Intestinal
Obesity/Dyslipid
COPDInfectious Disease
Hypertension
Dental Disorders
DiabetesCancer
Heart Disease
Pneumonia/Influenza
Liver Disease
Perc
ent M
embe
rs
SMI (N=9224)Non-SMI (N=7352)

Ohio StudyOhio StudyLeading Causes of DeathLeading Causes of Death
Cause ICD-9 Codes ICD-10 Codes M F N %390-398, 402, I00-09, I11, 83 43404, 410-429 I13, I20-51
X60-84, 84 24Y87.0
E800-869, V01-X59, 61 22E880-929 Y85-86
Malignant neoplasms (cancers) 140-208 C00-C97 27 17 44 7.2Symptoms, signs, & abnormal 23 9 clinical & laboratory findings, NECChronic lower respiratory diseases 490-494, 496 J40-J47 17 14 31 5.1Diabetes mellitus 250 E10-14 11 7 18 3.0Pneumonia & Influenza 480-487 J10-18 12 4 16 2.6
430-434, 6 4436-438
X85-Y09, 9 1Y87.1
Accidents (unintentional injuries) 83
20.7
Intentional self-harm (suicide) E950-959 108 17.8
Diseases of heart 126
13.7
780-799 R00-99 32 5.3
Cerebrovascular diseases I60-69 10 1.6
Assault (homicide) E960-969 10 1.6
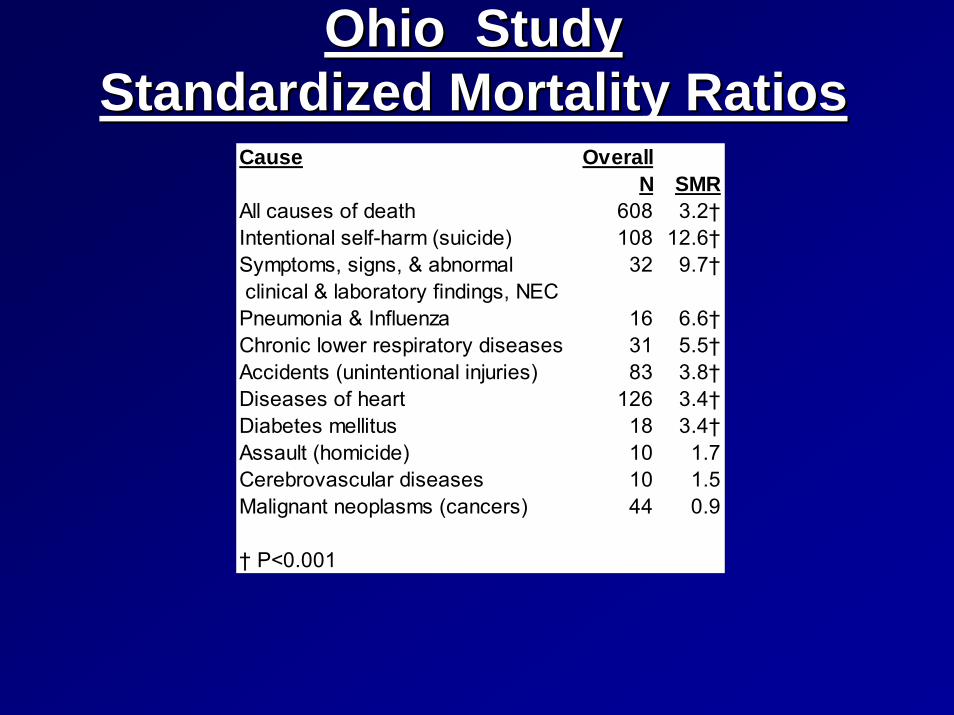
Ohio StudyOhio StudyStandardized Mortality RatiosStandardized Mortality Ratios
Cause OverallN SMR
All causes of death 608 3.2†Intentional self-harm (suicide) 108 12.6†Symptoms, signs, & abnormal 32 9.7† clinical & laboratory findings, NECPneumonia & Influenza 16 6.6†Chronic lower respiratory diseases 31 5.5†Accidents (unintentional injuries) 83 3.8†Diseases of heart 126 3.4†Diabetes mellitus 18 3.4†Assault (homicide) 10 1.7Cerebrovascular diseases 10 1.5Malignant neoplasms (cancers) 44 0.9
† P<0.001
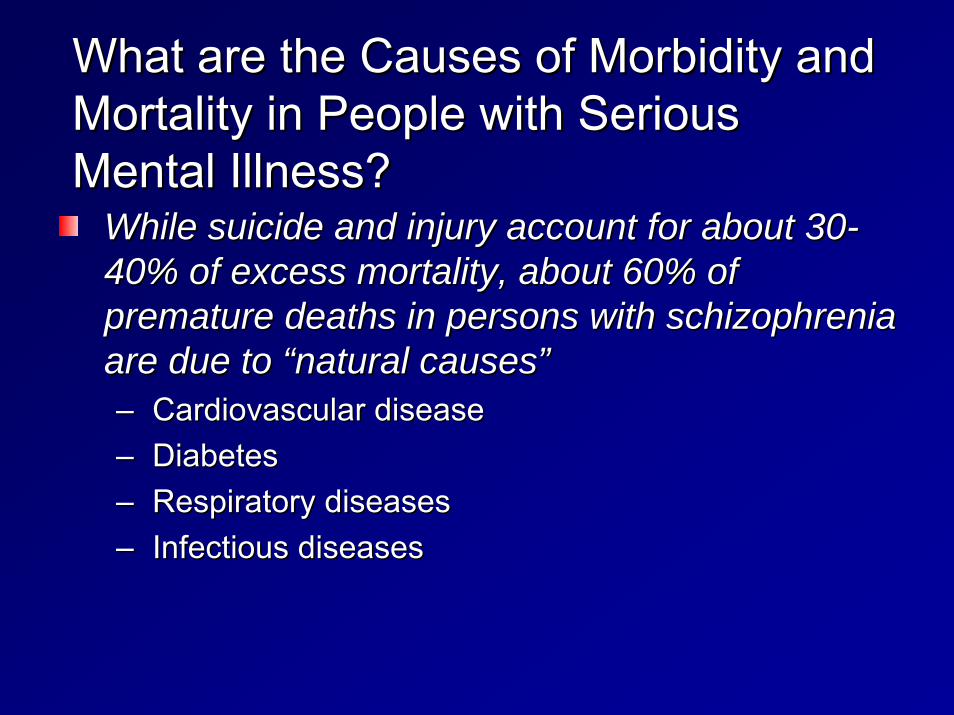
What are the Causes of Morbidity and What are the Causes of Morbidity and Mortality in People with Serious Mortality in People with Serious Mental Illness?Mental Illness?
While suicide and injury account for about 30While suicide and injury account for about 30--40% of excess mortality, about 40% of excess mortality, about 60% of 60% of premature deaths in persons with schizophrenia premature deaths in persons with schizophrenia are due to are due to ““natural causesnatural causes””–– Cardiovascular diseaseCardiovascular disease–– DiabetesDiabetes–– Respiratory diseasesRespiratory diseases–– Infectious diseasesInfectious diseases

Osby U et al. Schizophr Res. 2000;45:21-28.
Schizophrenia: Schizophrenia: Natural Causes of DeathNatural Causes of Death
Higher standardized mortality rates than the general Higher standardized mortality rates than the general population from:population from:–– Diabetes Diabetes 2.7x2.7x–– Cardiovascular diseaseCardiovascular disease 2.3x2.3x–– Respiratory diseaseRespiratory disease 3.2x3.2x–– Infectious diseases Infectious diseases 3.4x3.4x
Cardiovascular disease associated with the largest Cardiovascular disease associated with the largest number of deaths number of deaths –– 2.3 X the largest cause of death in the general population 2.3 X the largest cause of death in the general population

Cardiovascular risk factors Cardiovascular risk factors ––overviewoverview
BMI = body mass index; TC = total cholesterol; DM = diabetes mellitus; HTN = hypertension.Wilson PWF et al. Circulation. 1998;97:1837–1847.
0
2
4
6
8
10
12
14
HTNDMSmokingBMI >27 TC >220
Single Risk Factors
Multiple Risk Factors
Odd
s ra
tios
Smoking+ BMI
2
Smoking+ BMI
+ TC >220
3
Smoking+ BMI
+ TC >220+ DM
4
Smoking+ BMI
+ TC >220+ DM + HTN
5The Framingham Study
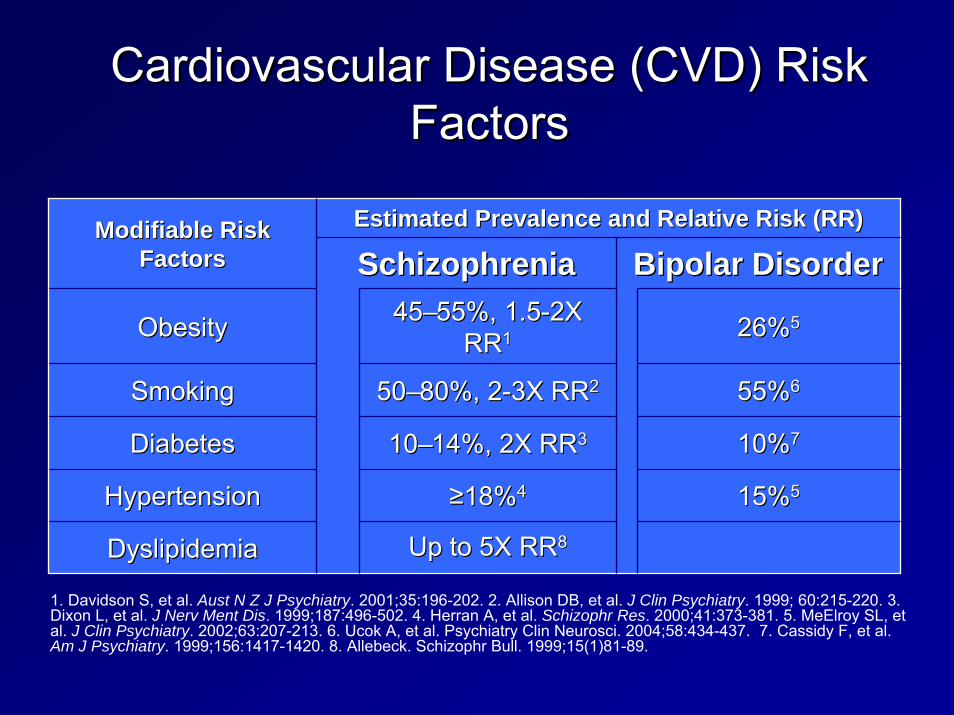
Cardiovascular Disease (CVD) Risk Cardiovascular Disease (CVD) Risk FactorsFactors
Estimated Prevalence and Relative Risk (RR)Estimated Prevalence and Relative Risk (RR)Modifiable Risk Modifiable Risk FactorsFactors SchizophreniaSchizophrenia Bipolar DisorderBipolar Disorder
ObesityObesity 4545––55%, 1.555%, 1.5--2X 2X RRRR11 26%26%55
5050––80%, 280%, 2--3X RR3X RR22 55%55%66
10%10%77
15%15%55
1010––14%, 2X RR14%, 2X RR33
≥≥18%18%44
Up to 5X Up to 5X RRRR88
SmokingSmoking
DiabetesDiabetes
HypertensionHypertension
DyslipidemiaDyslipidemia
1. Davidson S, et al. Aust N Z J Psychiatry. 2001;35:196-202. 2. Allison DB, et al. J Clin Psychiatry. 1999; 60:215-220. 3. Dixon L, et al. J Nerv Ment Dis. 1999;187:496-502. 4. Herran A, et al. Schizophr Res. 2000;41:373-381. 5. MeElroy SL, et al. J Clin Psychiatry. 2002;63:207-213. 6. Ucok A, et al. Psychiatry Clin Neurosci. 2004;58:434-437. 7. Cassidy F, et al. Am J Psychiatry. 1999;156:1417-1420. 8. Allebeck. Schizophr Bull. 1999;15(1)81-89.

Allison DB et al. J Clin Psychiatry. 1999;60:215-220.
Perc
e nt
Perc
e nt
< 18.518.5-20 20-22 22-24 24-26 26-28 28-30 30-32 32-34 > 340
10
20
30
No schizophreniaSchizophrenia
ObeseOverweightAcceptable Under-weight
BMI RangeBMI Range
BMI Distributions for General Population BMI Distributions for General Population and Those With Schizophrenia (1989)and Those With Schizophrenia (1989)

Mental Disorders and SmokingMental Disorders and Smoking•• Higher prevalence (56Higher prevalence (56--88% for patients 88% for patients
with schizophrenia) of cigarette smoking with schizophrenia) of cigarette smoking (overall U.S. prevalence 25%)(overall U.S. prevalence 25%)
•• More toxic exposure for patients who More toxic exposure for patients who smoke (more cigarettes, larger portion smoke (more cigarettes, larger portion consumed)consumed)
•• Smoking is associated with increased Smoking is associated with increased insulin resistanceinsulin resistance
•• Similar prevalence in bipolar disorderSimilar prevalence in bipolar disorderGeorge TP et al. Nicotine and tobacco use in schizophrenia. In: Meyer JM, Nasrallah HA, eds. Medical Illness and Schizophrenia. American Psychiatric Publishing, Inc. 2003; Ziedonis D, Williams JM, Smelson D. Am J Med Sci. 2003(Oct);326(4):223-330

50-59 y60-69 y
70-74 y
05
1015202530
Diagnosed Diabetes, General PopulationDiagnosed Diabetes, Schizophrenic Patients
Harris et al. Diabetes Care. 1998; 21:518.Mukherjee et al. Compr Psychiatry. 1996; 37(1):68-73.
Schizophrenic:General: 50-59 y
60-74 y75+ y
Percent of population
Prevalence of Diagnosed Diabetes in General Population Versus Schizophrenic Population
Hypothesized Reasons Why There Hypothesized Reasons Why There May Be More Type 2 Diabetes in May Be More Type 2 Diabetes in
People With SchizophreniaPeople With Schizophrenia
Genetic link between schizophrenia and Genetic link between schizophrenia and diabetesdiabetesImpact of lifestyleImpact of lifestyleMedication effect increasing insulin Medication effect increasing insulin resistance by impacting insulin receptor resistance by impacting insulin receptor or postreceptor functionor postreceptor functionDrug effect on caloric intake or Drug effect on caloric intake or expenditure (obesity, activity)expenditure (obesity, activity)

How Does This Relate to What is How Does This Relate to What is Happening in the General Population?Happening in the General Population?
There is an There is an ““epidemicepidemic”” of obesity and diabetes, of obesity and diabetes, increasing risk of multiple medical conditions increasing risk of multiple medical conditions and cardiovascular disease.and cardiovascular disease.–– Obesity Obesity –– Diabetes Diabetes –– Metabolic SyndromeMetabolic Syndrome–– Cardiovascular DiseaseCardiovascular Disease
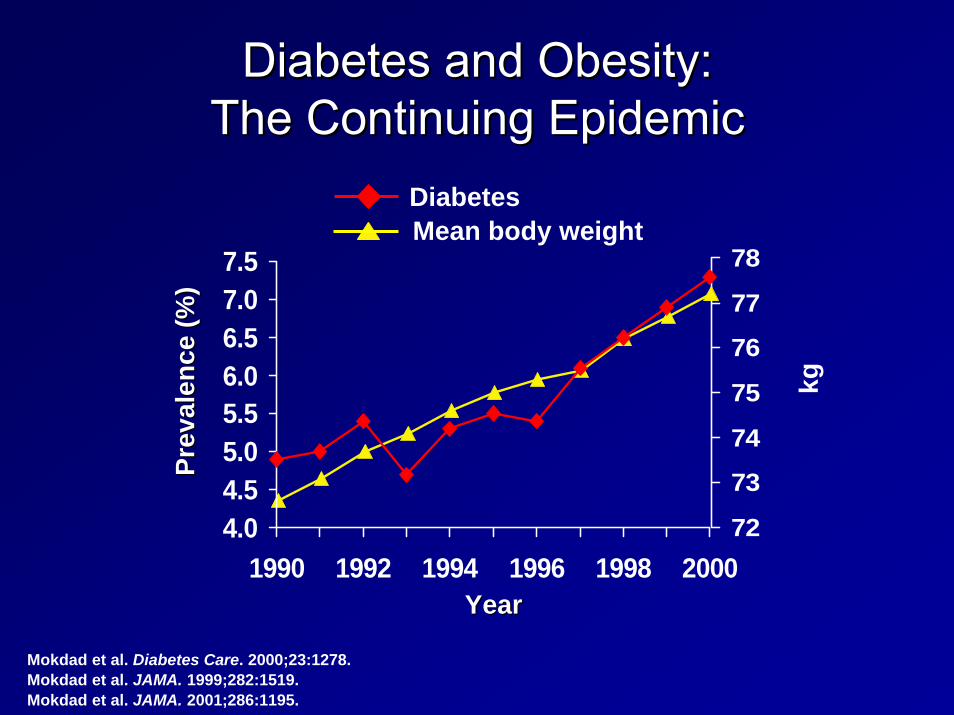
Mokdad et al. Diabetes Care. 2000;23:1278.Mokdad et al. JAMA. 1999;282:1519.Mokdad et al. JAMA. 2001;286:1195.
72
73
74
75
76
77
78
4.04.55.05.56.06.57.07.5
1990 1992 1994 1996 1998 2000
Prev
alen
ce (%
)Pr
eval
ence
(%)
DiabetesMean body weight
YearYear
kg
Diabetes and Obesity: Diabetes and Obesity: The Continuing EpidemicThe Continuing Epidemic

Behavioral Risk Factor Surveillance System, CDC.
1996
2003
(*BMI ≥30, or about 30 lbs overweight for 5’4” person)
Obesity Trends* Among US AdultsObesity Trends* Among US AdultsBRFSS, 1991, 1996, 2003BRFSS, 1991, 1996, 2003
1991
No Data <10% 10%-14% 15%-19% 20%-24% ≥ 25%

No Data Less than 4% 4% to 6% Above 6%
Mokdad et al. Diabetes Care. 2000;23:1278-1283.
Diabetes and Gestational Diabetes Trends: Diabetes and Gestational Diabetes Trends: US Adults, BRFSS 1990US Adults, BRFSS 1990

Mokdad et al. Diabetes Care. 2000;23:1278-1283.
Diabetes and Gestational Diabetes Trends: Diabetes and Gestational Diabetes Trends: US Adults, BRFSS 1995US Adults, BRFSS 1995
No Data Less than 4% 4% to 6% Above 6%

Mokdad et al. Diabetes Care. 2001;24:412.
Diabetes and Gestational Diabetes Trends: Diabetes and Gestational Diabetes Trends: US Adults, BRFSS 1999US Adults, BRFSS 1999
No Data Less than 4% 4% to 6% Above 6%

Mokdad et al. JAMA. 2001;286(10).
Diabetes and Gestational Diabetes Trends: Diabetes and Gestational Diabetes Trends: US Adults, BRFSS 2000US Adults, BRFSS 2000
No Data Less than 4% 4% to 6% Above 6%
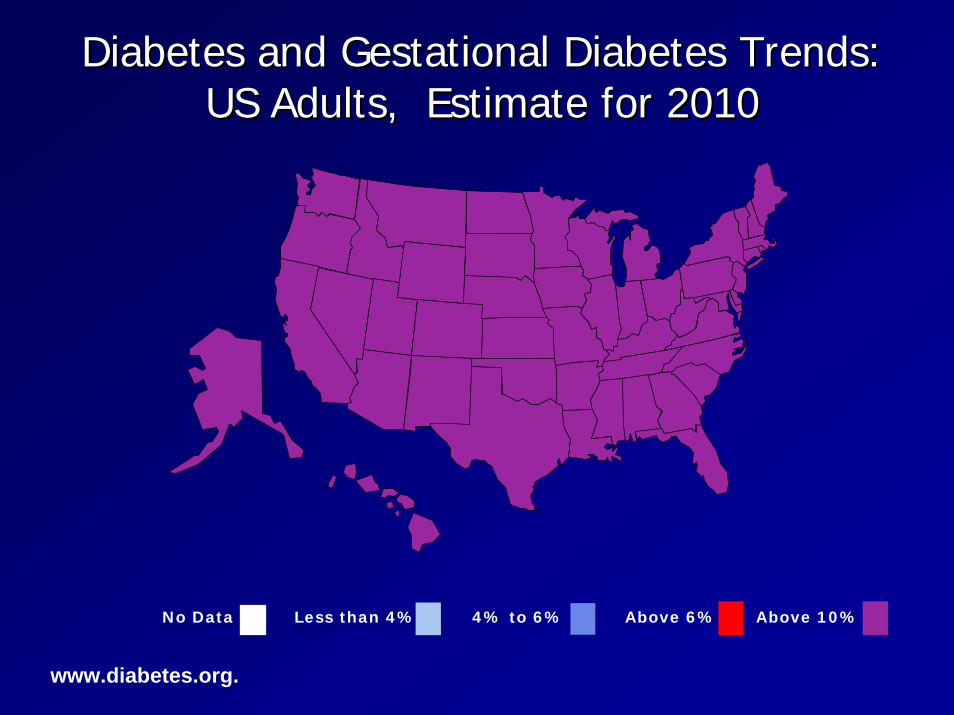
www.diabetes.org.
No Data Less than 4% 4% to 6% Above 6% Above 10%
Diabetes and Gestational Diabetes Trends: Diabetes and Gestational Diabetes Trends: US Adults, Estimate for 2010US Adults, Estimate for 2010

Men and Women, Age 45-74 Years
% w
ith d
iabe
tes
Harris et al. Diabetes. 1987;36:523.Flegal et al. Diabetes Care. 1991;14(suppl 3):628. Knowler et al. Diabetes Care. 1993;16(suppl 1):216. Fujimoto et al. Diabetes Res Clin Pract. 1991;13:119. Fujimoto et al. Diabetes. 1987;36:721.
0
10
20
30
40
50
PimaPuerto Rican
MexicanAmerican
AfricanAmerican
JapaneseAmerican
CubanAmerican
European
US Diabetes Prevalence US Diabetes Prevalence by Ethnic Groupby Ethnic Group

Adapted from: International Diabetes Center (IDC). Available at:www.parknicollet.com/diabetes/disease/diagnosing.cfm. Accessed March 26, 2006.
Years of Diabetes
Relative β-Cell Function
100 (%)
-20 -10 0 10 20 30
PlasmaGlucose
Insulin Resistance
Insulin Level
126 (mg/dL)
Uncontrolled Obesity IGT Diabetes Hyperglycemia
Fasting Glucose
Post-Meal Glucose
IGT = impaired glucose tolerance.
Natural History of Type 2 DiabetesNatural History of Type 2 Diabetes

18%
17%
12%
8%
4%
0% 2% 4% 6% 8% 10% 12% 14% 16% 18% 20%
Retinopathy
Cardiovascular
Absent Foot Pulses
Absent Reflexes
Urine Albumin
PrevalencePrevalenceDagogo-Jack et al. Arch Int Med. 1997;157:1802-1817.
Prevalence of Diabetic Tissue Damage at Diagnosis of Type 2
Diabetes

0
10
20
30
40
50
Fata
l or n
onfa
tal M
I (%
)
3.5%
18.6% 20.2%
45.0%
Haffner SM et al. N Engl J Med. 1998;339:229-234.
Equivalent MI Risk Levels
No Prior MI Prior MI No Prior MI Prior MINondiabetic Subjects Type 2 Diabetic Subjects
(n = 1373) (n = 1059)
Diabetes is a CVD Risk Equivalent to Diabetes is a CVD Risk Equivalent to Previous Myocardial InfarctionPrevious Myocardial Infarction

ADA ADA CardiometabolicCardiometabolic Risk InitiativeRisk Initiative
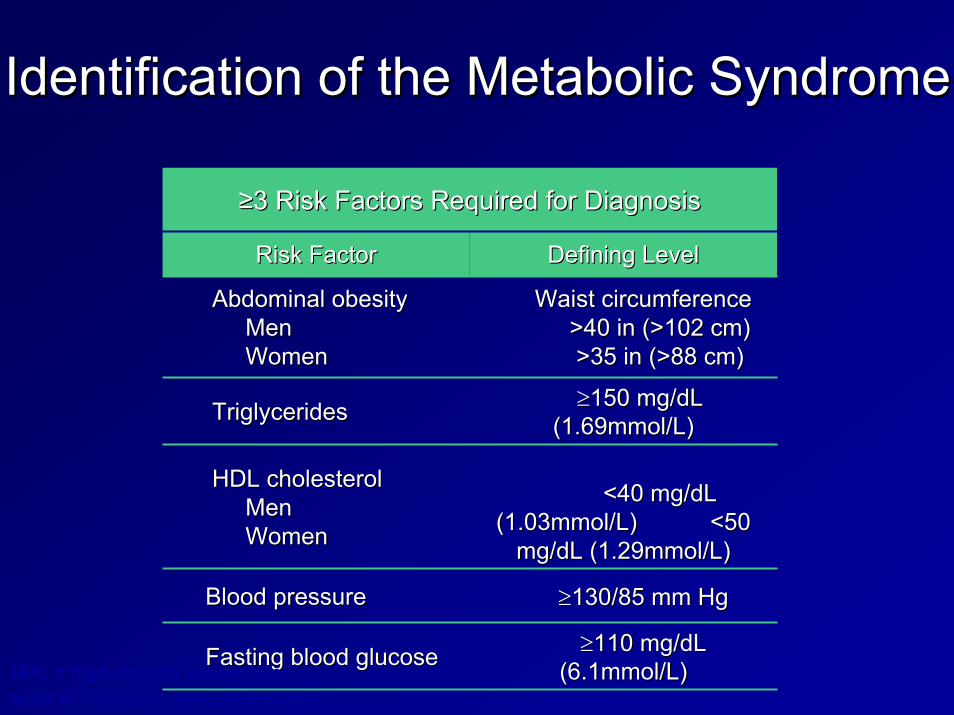
Identification of the Metabolic SyndromeIdentification of the Metabolic Syndrome
≥≥3 Risk Factors Required for Diagnosis3 Risk Factors Required for Diagnosis
Risk FactorRisk Factor Defining LevelDefining Level
Abdominal obesity Abdominal obesity Men Men WomenWomen
Waist circumference Waist circumference >40 in (>102 cm) >40 in (>102 cm) >35 in (>88 cm)>35 in (>88 cm)
TriglyceridesTriglycerides ≥≥150 mg/150 mg/dLdL(1.69mmol/L)(1.69mmol/L)
HDL cholesterol HDL cholesterol Men Men WomenWomen
<40 mg/dL <40 mg/dL (1.03mmol/L) <50 (1.03mmol/L) <50
mg/mg/dLdL (1.29mmol/L)(1.29mmol/L)
Blood pressureBlood pressure ≥≥130/85 mm Hg130/85 mm Hg
Fasting blood glucoseFasting blood glucose ≥≥110 mg/110 mg/dLdL(6.1mmol/L)(6.1mmol/L)HDL = high-density lipoprotein.
NCEP III. Circulation. 2002;106:3143-3421.

CHD Risk Increases with Increasing CHD Risk Increases with Increasing Number of Metabolic Syndrome Risk Number of Metabolic Syndrome Risk
Factors Factors
Sattar et al, Circulation, 2003;108:414-419Whyte et al, American Diabetes Association, 2001Adapted from Ridker, Circulation 2003;107:393Adapted from Ridker, Circulation 2003;107:393--397397
00.51
1.52
2.53
3.54
4.55
5.56
6.57
one two three four
Rel
ativ
e R
isk

Comparison of Metabolic Syndrome and Individual Criterion Prevalence in Fasting CATIE Subjects and
Matched NHANES III Subjects
Males CATIE NHANES p N=509 N=509
Females CATIE NHANES p N=180 N=180
Metabolic Syndrome Prevalence
36.0% 19.7% .0001 51.6% 25.1% .0001
Waist Circumference Criterion 35.5% 24.8% .0001 76.3% 57.0% .0001
Triglyceride Criterion 50.7% 32.1% .0001 42.3% 19.6% .0001
HDL Criterion 48.9% 31.9% .0001 63.3% 36.3% .0001
BP Criterion 47.2% 31.1% .0001 46.9% 26.8% .0001
Glucose Criterion 14.1% 14.2% .9635 21.7% 11.2% .0075
Meyer et al., Presented at APA annual meeting, May 21-26, 2005. McEvoy JP et al. Schizophr Res. 2005;(August 29).

0
10
20
30
40
50
60
70
Prev
alen
ce (%
)
Healthy Overweight Obese Healthy Overweight Obese
N=12,363“Overweight” = BMI 25-29.9“Obese” = BMI ≥30 (National Heart, Lung, and Blood Institute, Obesity Guidelines)
MenMen WomenWomen
Prevalence of Metabolic Syndrome According Prevalence of Metabolic Syndrome According to BMI in the Adult General Populationto BMI in the Adult General Population
Park et al. Arch Intern Med. 2003;163:427.

Modifiable Risk Factors Affected Modifiable Risk Factors Affected by by PsychotropicsPsychotropics
Overweight / ObesityOverweight / ObesityInsulin resistanceInsulin resistanceDiabetes/Diabetes/hyperglycaemiahyperglycaemiaDyslipidemiaDyslipidemia
Newcomer JW. CNS Drugs 2005;19(Supp 1):1.93.
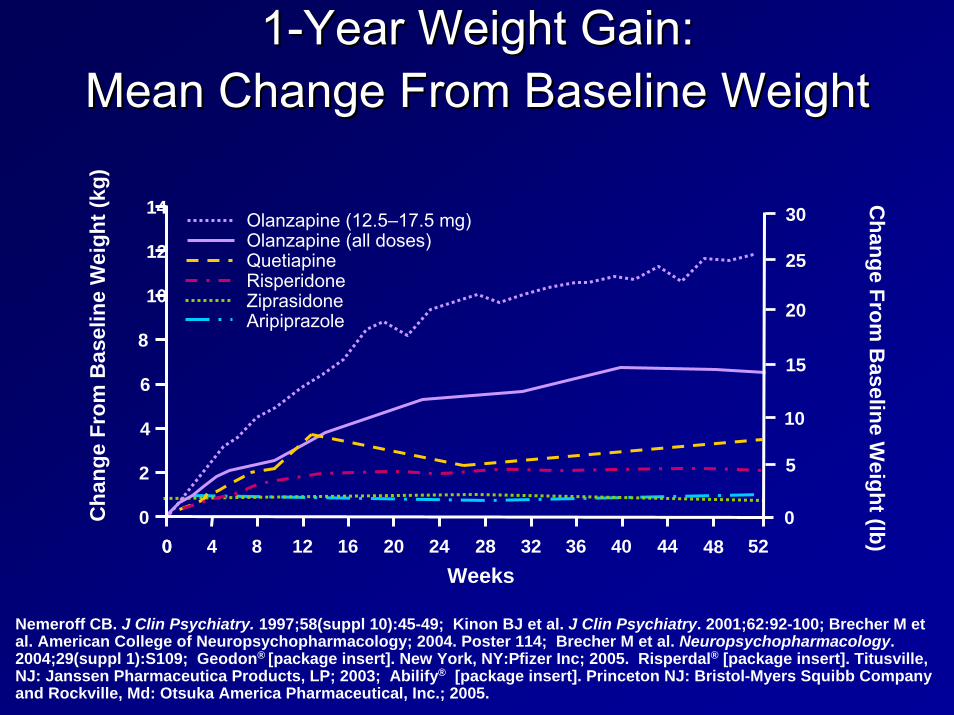
11--Year Weight Gain: Year Weight Gain: MMeanean Change From Baseline WeightChange From Baseline Weight
Change From
Baseline W
eight (lCha
nge
From
Bas
elin
e W
eigh
tb)
Weeks
(kg)
52484440363228242016128400
Olanzapine (12.5–17.5 mg)Olanzapine (all doses)QuetiapineRisperidoneZiprasidoneAripiprazole
0
5
10
15
20
25
30
0
2
4
6
8
10
12
14
Nemeroff CB. J Clin Psychiatry. 1997;58(suppl 10):45-49; Kinon BJ et al. J Clin Psychiatry. 2001;62:92-100; Brecher M et al. American College of Neuropsychopharmacology; 2004. Poster 114; Brecher M et al. Neuropsychopharmacology. 2004;29(suppl 1):S109; Geodon® [package insert]. New York, NY:Pfizer Inc; 2005. Risperdal® [package insert]. Titusville, NJ: Janssen Pharmaceutica Products, LP; 2003; Abilify® [package insert]. Princeton NJ: Bristol-Myers Squibb Company and Rockville, Md: Otsuka America Pharmaceutical, Inc.; 2005.

CATIE Trial Results: CATIE Trial Results: Weight Gain Per Month Weight Gain Per Month
TreatmentTreatment
NEJM 2005 353:1209-1223
-1
0
1
2
OLZOLZ RISRIS PERPERQUETQUET ZIPZIP
Wei
ght g
ain
(lb) p
er m
onth
Wei
ght g
ain
(lb) p
er m
onth

Conventionals OlanzapineRisperidone
-25
-20
-15
-10
-5
0
5
LS M
ean
Cha
nge
(lb)
49 53 584540363227231914106
*
***
***
**
**
***
*P<0.05**P<0.01
***P<0.0001
Switched from
Weiden P et al. Presented APA 2004.
Change in Weight From Baseline Change in Weight From Baseline 58 Weeks After Switch to Low Weight 58 Weeks After Switch to Low Weight
Gain AgentGain Agent

Modifiable Risk Factors Affected Modifiable Risk Factors Affected by by PsychotropicsPsychotropics
Overweight / ObesityOverweight / ObesityInsulin resistanceInsulin resistanceDiabetes/Diabetes/hyperglycaemiahyperglycaemiaDyslipidemiaDyslipidemia
Newcomer JW. CNS Drugs 2005;19(Supp 1):1.93.

Randomized Clinical TrialsRandomized Clinical Trials
•• Insulin resistanceInsulin resistance•• Fasting lipidsFasting lipids•• Fasting or postFasting or post--load glucose and load glucose and
insulininsulin•• Metabolic syndromeMetabolic syndrome
Growing number of studies measure drug effects on the following:

CATIE Results: CATIE Results: Metabolic Changes From BaselineMetabolic Changes From Baseline
-20
-15
-10
-5
0
5
10
15
20
25
30
35
40
45
OLZOLZ RISRIS PERPERQUETQUET ZIPZIP
9.4
-8.2
1.3
-1.3
6.6
40.5
21.2
-2.4
9.2
-16.5
Cholesterol (mg/dL)
Triglycerides (mg/dL)
NEJM 2005 353:1209-1223

CATIE Results: CATIE Results: Metabolic Changes From BaselineMetabolic Changes From Baseline
NEJM 2005 353:1209-1223
0
2
4
6
8
10
12
14Glucose (mg/dL)
Glycosylated HB (%)
13.7
0.11
2.9
0.0
5.4
0.07
6.6
0.04
7.5
0.4
OLZOLZ RISRIS PERPERQUETQUET ZIPZIP

American Diabetes Association, American Psychiatric AssociationAmerican Diabetes Association, American Psychiatric Association, , American Association of Clinical Endocrinologists, North AmericaAmerican Association of Clinical Endocrinologists, North American n
Association for the Study of Obesity:Association for the Study of Obesity:Consensus Conference on Antipsychotic Drugs and Consensus Conference on Antipsychotic Drugs and
Risk of Obesity and DiabetesRisk of Obesity and Diabetes
+ = increased effect; + = increased effect; -- = no effect; D = discrepant results. = no effect; D = discrepant results.
DrugDrug Weight GainWeight Gain Diabetes RiskDiabetes Risk DyslipidemiaDyslipidemia
clozapineclozapine + + ++ + + ++ ++olanzapineolanzapine + + ++ + + ++ ++risperidonerisperidone + ++ + DD DDquetiapinequetiapine + ++ + DD DDaripiprazolearipiprazole +/+/-- -- --ziprasidoneziprasidone +/+/-- -- --
Diabetes Care 27:596-601, 2004

ADA/APA/AACE/NAASO Consensus on ADA/APA/AACE/NAASO Consensus on Antipsychotic Drugs and Obesity and Antipsychotic Drugs and Obesity and
Diabetes: Monitoring ProtocolDiabetes: Monitoring Protocol**
*More frequent assessments may be warranted based on *More frequent assessments may be warranted based on clinical statusclinical status Diabetes Care. 27:596-601, 2004
StartStart 4 wks4 wks 8 wks8 wks 12 wk12 wk qtrlyqtrly 12 mos.12 mos. 5 yrs.5 yrs.
Personal/family Personal/family HxHx XX XXWeight (BMI)Weight (BMI) XX XX XX XX XXWaist Waist circumferencecircumference
XX XX
Blood pressureBlood pressure XX XX XXFasting glucoseFasting glucose XX XX XXFasting lipid profileFasting lipid profile XX XX XXXX


Problem: Problem: SMI and Reduced Use of Medical ServicesSMI and Reduced Use of Medical Services
Fewer routine preventive services (Druss Fewer routine preventive services (Druss 2002)2002)Worse diabetes care (Desai 2002, Frayne Worse diabetes care (Desai 2002, Frayne 2006)2006)Lower rates of cardiovascular procedures Lower rates of cardiovascular procedures (Druss 2000)(Druss 2000)

Access and Quality of CareAccess and Quality of Care
SMI may be a health risk factor because of:SMI may be a health risk factor because of:
–– Patient factorsPatient factors, e.g.: amotivation, fearfulness, , e.g.: amotivation, fearfulness, homelessness, victimization/trauma, resources, homelessness, victimization/trauma, resources, advocacy, unemployment, incarceration, social advocacy, unemployment, incarceration, social instability, IV drug use, etcinstability, IV drug use, etc
–– Provider factorsProvider factors: Comfort level and attitude of : Comfort level and attitude of healthcare providers, coordination between mental healthcare providers, coordination between mental health and general health care, stigma,health and general health care, stigma,
–– System factorsSystem factors: Funding, fragmentation: Funding, fragmentation

Hennekens CH. Circulation. 1998;97:1095-1102.
Goals: Lower Risk for CVDGoals: Lower Risk for CVD
Blood cholesterol Blood cholesterol –– 10% 10% ↓↓ = 30% = 30% ↓↓ in CHD (200in CHD (200--180)180)
High blood pressure (> 140 SBP or 90 DBP)High blood pressure (> 140 SBP or 90 DBP)–– 44--6 mm Hg 6 mm Hg ↓↓ = 16% = 16% ↓↓ in CHD; 42% in CHD; 42% ↓↓ in strokein stroke
Cigarette smoking cessationCigarette smoking cessation–– 50%50%--70% 70% ↓↓ in CHDin CHDMaintenance of ideal body weight (BMI = 25) Maintenance of ideal body weight (BMI = 25) –– 35%35%--55% 55% ↓↓ in CHDin CHD
Maintenance of active lifestyle (20Maintenance of active lifestyle (20--min walk daily)min walk daily)–– 35%35%--55% 55% ↓↓ in CHDin CHD

Survival Following MyocardialSurvival Following MyocardialInfarctionInfarction
88,241 Medicare patients, 65 years of 88,241 Medicare patients, 65 years of age and older, hospitalized for MIage and older, hospitalized for MIMortality increased byMortality increased by–– 19%: any mental disorder19%: any mental disorder–– 34%: schizophrenia34%: schizophreniaIncreased mortality explained by Increased mortality explained by measures of quality of caremeasures of quality of care
Druss BG et al. Arch Gen Psychiatry. 2001;58:565-572.

Disparities in care: impact of mental Disparities in care: impact of mental illness on diabetes managementillness on diabetes management
313,586 Veteran Health Authority patients with diabetes76,799 (25%) had mental health conditions (1999)
Frayne et al. Arch Intern Med. 2005;165:2631-2638
Depression
Anxiety
Psychosis
Mania
Substance use disorder
Personality disorder
0.8 1.0 1.2 1.4 1.6
No HbA test done
0.8 1.0 1.2 1.4 1.6
No LDL test done
0.8 1.0 1.2 1.4 1.6
No Eye examination
done
0.8 1.0 1.2 1.4 1.6
No Monitoring
0.8 1.0 1.2 1.4 1.6
Poor glycemiccontrol
0.8 1.0 1.2 1.4 1.6
Poor lipemiccontrol
Odds ratio for:

Why Should we be Concerned About Why Should we be Concerned About Morbidity and Mortality?Morbidity and Mortality?
Recent data from several states have Recent data from several states have found that found that people with serious mental people with serious mental illness served by our public mental illness served by our public mental health systems die, on average, at least health systems die, on average, at least 25 years earlier that the general 25 years earlier that the general populationpopulation. .

Overview Overview -- PROPOSED SOLUTIONSPROPOSED SOLUTIONS
Prioritize the Public Health ProblemTarget Providers, Families and ClientsFocus on Prevention and Wellness
Track Morbidity and Mortality in Public Mental Health Populations
Implement Established Standards of CarePrevention, Screening and Treatment
Improve Access to and Integration of Physical Health and Mental Health Care

Recommendations Recommendations NATIONAL LEVEL
1. Seek federal designation of people with SMI as a distinct at-risk health disparities population. Establish co-ordinated mental health and general health care as a national healthcare priority.
2. Establish a committee at the federal level to recommend changes to national surveillance activities that will incorporate information about health status in the population with SMI.
Consider representation from SAMHSA, Medicaid , the Centers for Disease Control and Prevention, state MH authorities / NASMHPD,and experts This may include the IOM project and other national surveys.

RecommendationsRecommendationsNATIONAL LEVEL
3. Share information widely about physical health risks in persons with SMI to encourage awareness and advocacy. Educate the health care community. Encourage consumers and family members to advocate for wellness approaches as part of recovery.
Recommendations Recommendations STATE LEVEL
1. Seek state designation of people with SMI as BOTH an at-risk and a health disparities population.
2. Establish co-ordinated mental health and general health care as a state healthcare priority.
3. Education and advocacy policy makersfundersprovidersindividuals, family, community

RecommendationsRecommendationsSTATE LEVEL
4. Require, regulate and lead Behavioral Health provider systems to screen, assess and treat both mental health and general health care issues. Provide for
staffingtimerecord keepingreimbursementlinkage with physical healthcare providers
5.5. Funding Funding
6. Promote co-ordinated and integrated mental health and physical health care for persons with SMI.
See 11th NASMHPD Technical Paper: Integrating Mental Health and Primary Care.

RecommendationsRecommendationsSTATE LEVEL
5. Develop a quality improvement (QI) process that supports increased access to physical healthcare and ensures appropriate prevention, screening and treatment services.
Target common causes of increased mortality and chronic medical illness in the SMI population
Include all key stakeholders: state agencies, practitioners, individuals and their families, academic and training institutions in QI planning and review
A key component : training and technical assistance for practitioners in both mental health and primary health fields
RecommendationsLOCAL AGENCY / CLINICIAN
1. BH providers shall provide quality medical care and mental health care
Screen for general health with priority for high risk conditions
Offer prevention and intervention especially for modifiable riskfactors (obesity, abnormal glucose and lipid levels, high blood pressure, smoking, alcohol and drug use, etc.)
Prescribers will screen, monitor and intervene for medication risk factors related to treatment of SMI (e.g. risk of metabolic syndrome with use of second generation anti-psychotics)
Treatment per practice guidelines, e.g heart disease, diabetes,smoking cessation, use of novel anti-psychotics.
LOCAL AGENCY / CLINICIAN Recommendations
2. Care coordination Models
l Assure that there is a specific practitioner in the MH system who is identified as the responsible party for each person’s medical health care needs being addressed and who assures coordination all services.
Routine sharing of clinical information with other providers (primary and specialty healthcare providers as well as mental health providers
Care integration where services are co-located

LOCAL AGENCY / CLINICIAN RECOMMENDATIONS
3. Support consumer wellness and empowerment to improve personal mental and physical well-being
educate / share information to make healthy choices regarding nutrition, tobacco use, exercise, implications of psychotropic drugsteach /support wellness self-management skillsteach /support decision making skillsmotivational interviewing techniquesImplement a physical health Wellness approach that is consistent with Recovery principles, including supports for smoking cessation, good nutrition, physical activity and healthyweight.attend to cultural and language needs

Overview Overview -- PROPOSED SOLUTIONSPROPOSED SOLUTIONS
Prioritize the Public Health ProblemTarget Providers, Families and ClientsFocus on Prevention and Wellness
Track Morbidity and Mortality in Public Mental Health Populations
Implement Established Standards of CarePrevention, Screening and Treatment
Improve Access to and Integration of Physical Health and Mental Health Care

Full report available atFull report available athttp://www.nasmhpd.org/general_files/publicatiohttp://www.nasmhpd.org/general_files/publications/med_directors_pubs/Technical%20Report%2ns/med_directors_pubs/Technical%20Report%20on%20Morbidity%20and%20Mortaility%200on%20Morbidity%20and%20Mortaility%20--%20Final%2011%20Final%2011--06.pdf06.pdf
Recommended Citation for Information in Recommended Citation for Information in this Slide Show (except where specified this Slide Show (except where specified citation is noted):citation is noted):–– NASMHPD (2006), NASMHPD (2006), NASMHPD Medical Directors NASMHPD Medical Directors
Council Technical Report: Morbidity and Mortality in Council Technical Report: Morbidity and Mortality in People with Serious Mental Illness People with Serious Mental Illness (Editors: Parks, J.; (Editors: Parks, J.; SvendsenSvendsen, D.; Singer, P.; , D.; Singer, P.; FotiFoti, M.) Alexandria, VA: , M.) Alexandria, VA: NASMHPD, October 2006NASMHPD, October 2006