Embed Size (px)
Citation preview
PooDaHas
MtE
A
RESEARCH
Research and Professional Briefs
More Nutritious Food Is Served in Child-CareHomes Receiving Higher Federal Food Subsidies
PABLO MONSIVAIS, PhD, MPH; SHANNON KIRKPATRICK, MPH, RD; DONNA B. JOHNSON, PhD, RDfmJ
CAfiCCpTcsttfpqfwbc
Cgerlc2tm
ncfltwtifs
MSF
ABSTRACTThe US Department of Agriculture’s Child and AdultCare Food Program (CACFP) serves 2.3 million childrenby providing monetary subsidies for food to participatingchild-care providers. This cross-sectional study tested thehypothesis that higher reimbursement rates for food re-sult in higher food expenditures and higher nutritionalquality of foods served in family child-care homes partic-ipating in CACFP. Sixty family home child-care providerswere recruited in 2008-2009 from King County, Washing-ton. Half the sample received higher reimbursements andthe other half received the lower rates. Participants pro-vided a 5-day menu of meals/snacks served and foodshopping receipts. The nutritional quality of foods servedwas assessed from portion-standardized menus. Nutri-tional quality was quantified as the mean adequacy(mean percent of dietary reference intake) for seven nu-trients of concern for child health. Food expenditureswere calculated by linking menus with receipts. Student’st tests for independent samples and general linear modelswere used to test for between-group differences. The twogroups of providers were socioeconomically and demo-graphically similar with comparable professional back-grounds. However, higher reimbursement providershad significantly greater menu expenditures than thelower reimbursement group ($2.36 vs $1.96/child/day;P�0.031). Reimbursement level was not associated witha difference in calories, but menus of higher reimburse-ment providers showed a significantly higher mean nu-tritional adequacy (64.5% vs 56.3%; P�0.033). The find-ing that reimbursement rates were positively associatedwith food expenditures and the nutritional quality of
. Monsivais is acting assistant professor of Epidemiol-gy, and S. Kirkpatrick is a research assistant, Schoolf Public Health, University of Washington, Seattle.. B. Johnson is an associate professor, Interdisciplin-ry Program in Nutritional Sciences and Department ofealth Services, University of Washington, and associ-te director, Center for Public Health Nutrition, Univer-ity of Washington, Seattle.
Address correspondence to: Pablo Monsivais, PhD,PH, School of Public Health, University of Washing-
on, 305 Raitt Hall, Box 353410, Seattle, WA 98195.-mail: [email protected] accepted: October 22, 2010.Copyright © 2011 by the American Dietetic
ssociation.0002-8223/$36.00
pdoi: 10.1016/j.jada.2011.02.007
© 2011 by the American Dietetic Association
oods served suggests that raising CACFP reimburse-ents can improve child nutrition.Am Diet Assoc. 2011;111:721-726.
More than 2.3 million children across the UnitedStates receive meals and snacks in child-care pro-grams that participate in the Child and Adult
are Food Program (CACFP) of the US Department ofgriculture (USDA), at a cost of $2.3 billion dollars inscal year 2008 (1). About 27% of the children in theACFP are cared for in family child-care homes (1).ACFP issues monetary reimbursements to child-careroviders for the meals and snacks they serve to children.o qualify for reimbursements, meals and snacks mustonform to specific food-based meal patterns. In eachtate, CACFP guidelines may also specify some nutri-ional characteristics of foods and beverages servedhrough lists of “creditable,” or reimbursement-eligible,oods. Although limits on sugar and fat content are em-hasized through the creditable food lists, CACFP re-uirements do not explicitly address nutritional targetsor the overall menu. Foods actually served to childrenithin CACFP requirements might vary considerably inoth nutrient and energy density, depending on the foodshosen within the food patterns (2).Since welfare reform in 1996, reimbursements in
ACFP have followed a two-tier system designed to tar-et resources to the neediest child-care providers. In gen-ral, providers can qualify for the higher reimbursementates (Tier 1) if they personally meet low-income guide-ines or if they live in a low-income area (3). Otherwise,are providers receive the lower (Tier 2) rate. In 2009-010, the Tier 2 rate of reimbursement was less than halfhe reimbursement for Tier 1 providers serving the sameeals (4).Lower reimbursement rates may adversely affect child
utrition if care providers economize by selecting lessostly foods. Observational and modeling studies haveound that lower-cost foods and diets are associated withower nutritional quality (5-9), and a recent study showedhat higher micronutrient intakes by preschool childrenere associated with higher food costs (10). The aim of
he present study was to test whether differences in re-mbursement rates were associated with differences inood expenditures and the nutritional quality of foodserved in CACFP family child-care homes.
ETHODStudy Participantsor this cross-sectional study, a sample of 60 child-care
roviders in King County, Washington, was recruitedJournal of the AMERICAN DIETETIC ASSOCIATION 721
cwtad
FEdcfetoSAWf
mtppf(tfm
SMaperhtfttuam
between July 2008 and September 2009. Eligible provid-ers had to be currently part of CACFP, reside within KingCounty and in either of two strata: lower and higherreimbursement. Lower-reimbursement participants re-ceived the standard Tier 2 rate from sponsoring agenciesin King County. High-reimbursement participants weredrawn from two groups, ie, Tier 2 providers who weresponsored by the city of Seattle, which paid these provid-ers at a higher (Tier 1) reimbursement rate; and provid-ers who did not personally meet low-income requirementsbut who had been classified as Tier 1 on the basis of theirneighborhood’s socioeconomic profile. Thirty providers ineach strata were recruited. Contact information of pro-viders was furnished by the Office of the Superintendantof Public Instruction, which is responsible for CACFPthroughout Washington. All procedures were reviewedand approved by the University of Washington HumanSubjects Division and written consent was obtained fromparticipants.
Recruitment and Study ProceduresAfter initially announcing the study in child-care organi-zation newsletters, invitation letters were mailed to thehomes of eligible participants. Of 321 invitation lettersmailed, 95 elicited responses. Of these, 75 met eligibilitycriteria and 63 completed the study. Three were subse-quently excluded for failing to follow study protocols.Data on each provider’s professional, demographic, andsocioeconomic characteristics were collected with in-per-son surveys.
Menu AnalysesAll menus were initially analyzed for adherence toCACFP meal component requirements. Adherence wasdefined as the percentage of required food and beveragegroups served at breakfast, lunch, and two snacks foreach menu day. Subsequent analyses were conductedafter excluding all beverages on the grounds that CACFPonly provides reimbursements for milk or 100% fruitjuice. By contrast, regulations give less specific guidancearound food, so care providers have greater discretion inselecting foods that comply with CACFP food patternrequirements. Milk served with breakfast cereals was notexcluded. The exclusion of juice from the present analysescould introduce bias because providers are allowed tosubstitute juice for whole fruit at some meals. However,in the present sample, juice was used at a similar ratebetween groups, as described below.
All reported foods were standardized to portion sizesappropriate for children 3 to 5 years, as specified byCACFP. For menu items that did not have recommendedserving sizes (eg, butter, condiments, sweets), portionswere standardized to a fixed level. For example, butterand ketchup were standardized at 1⁄2 teaspoon. Ice creamwas standardized as one-half of a MyPyramid serving (33g) (11). Menu items were analyzed for nutrient composi-tion with FoodProcessor SQL dietary assessment soft-ware (version 10.5.0, 2008, ESHA Research, Salem, OR).
Menu Nutrient Characterization and Adequacy ScoreThe nutritional quality of menus was quantified using a
mean adequacy ratio (MAR) (12,13). The MAR was based t722 May 2011 Volume 111 Number 5
on seven nutrients of specific concern for child health.The selection of these nutrients was guided by the 2005Dietary Guidelines for Americans (14) and by the peer-reviewed literature on nutrient deficiencies in children.These were magnesium (14), potassium (14), zinc (15-18),iron (15,17,19), vitamin E (18,20,21), folate (18,22) andtotal fiber (14,23). Two other nutrients of concern, cal-cium (14,17,22,24) and vitamin D (18,19,25) were ex-cluded from this MAR because milk, a key source of thesenutrients, was excluded along with all beverages.
The MAR was computed as the average of percent dailyreference intakes for the seven nutrients in 1,000 kcalenergy. The daily reference intake for each nutrient wasbased on the Institute of Medicine’s standards for chil-dren aged 4 to 8 years as follows: vitamin E, 7 mg; iron, 10mg; magnesium, 130 mg; potassium, 3,800 mg; zinc, 5 mg;folate, 200 �g; and fiber, 25 g. Menus that met or ex-eeded the recommended levels for these seven nutrientsould have a MAR of �100%. Menus were also charac-
erized in terms of percent energy from macronutrientsnd in energy density, calculated as available energyivided by the weight (kcal/g) of foods served (5,26,27).
ood Expendituresxpenditures were computed for each provider’s stan-ardized 5-day menu by linking each food served with theorresponding provider’s food shopping receipts collectedor 4 weeks. On average, each provider’s receipts providedxpenditure data for 80% of the foods and beverages onheir menus. The balance of prices was drawn from eitherther providers’ receipts or from the Web sites of localafeway supermarkets (Safeway Inc, Pleasanton, CA),mazon Fresh (an Internet-only food retailer [Seattle,A]), or Sam’s Wholesale Club (Bentonville, AR), three
ood sources used by the present sample of providers.The expenditure for each food item was computed byultiplying the gram weight served (standardized por-
ion) by the ratio of the purchase price over total gramsurchased, correcting for edible portion (28). For exam-le, the expenditure associated with a half-cup portion ofresh apple purchased for $1.49/pound was 54.5 g�$1.49/454 g�0.76)�$0.235. Portion expenditures were totaledo create a daily expenditure. Mean daily expendituresor each provider were computed based on all 5 days ofenus.
tatistical Analysiseans and standard deviations were computed to char-
cterize the energy and nutrient characteristics of allrovider menus. Menu energy, grams, MAR, and menuxpenditures were all normally distributed, so paramet-ic statistics were used in testing for differences betweenigher and lower reimbursement providers. Student’s tests for independent samples were used to test for dif-erences in menu nutrient characteristics and expendi-ures between the groups. In further analyses of MAR,he key dependent variable, a general linear model wassed to test for differences between the two groups whiledjusting for covariates. Covariates in the general linearodel were energy and the care provider’s age, educa-
ional attainment, household income, number of children

wbspMepc
m$cepiTdctw
femgfbpl
in care, and years of experience in child care. All analyseswere conducted using SPSS (version 18.0 for Mac, 2009,IBM, Chicago, IL).
RESULTS AND DISCUSSIONParticipant CharacteristicsAll 60 participating child-care providers were women, andthe higher and lower reimbursement groups were similar interms of demographic and socioeconomic characteristics.Table 1 shows age, race, education completed and house-hold income in the two groups and in the total sample. Table1 also shows that the present sample had substantial pro-fessional experience and that was similar between groups.
Five-Day MenusThe majority of child-care providers in this sample (38 of60) served breakfast, lunch, and two snacks each day.The proportion of providers who followed this pattern wassimilar in the higher- (18 of 30) and lower-reimbursementgroup (20 of 30). Most providers served breakfast (52 of60) and all served lunch. None served evening snacks orsupper. Menus showed strong adherence to CACFP foodpattern guidelines. For all participants, menus provideda mean (�standard error of the mean) of 96.6% (�3.8%)of foods and milk servings required in CACFP meal pat-terns. Adherence was similar between high-reimbursement(97.1%�0.6%) and lower-reimbursement (96.1%�0.8%)providers (P�0.271). Juice was not served on a daily
Table 1. Demographic, socioeconomic, anAdult Care Food Program home child-careoverall
Low
Demographics 4™™Agea (y) 46.5
4™™Non-Hispanic white 23Non-Hispanic black 0All other races or mixed race 7Hispanic of any race 3Household income ($/y)b
�60,000 960,000-99,999 10�100,000 11Highest education completedHigh school graduate 3Some college 20Four-year college graduate or higher 7Professional characteristics 4™™Years in professional child care 13.3Years in CACFPc 12.1Number of children in care 7.8
aTwo providers (one from each group) did not report agbOne provider did not report income.cCAFCP�Child and Adult Care Food Program.
basis, with a mean frequency of 3.0 (�0.4) servings per j
eek, and the number of servings per week was similaretween the two groups. High reimbursement providerserved juice an average of 3.3 (�0.6) vs 2.6 (�0.5) timeser week for the lower-reimbursement group (P�0.407).oreover, in both groups, the same proportion of provid-
rs (10 of 30) served no juice at all during the 5-day menueriod. The remaining analyses were conducted after ex-luding juice and all other beverages.Average monetary expenditures on standardized 5-dayenus varied widely. Food expenditures ranged from
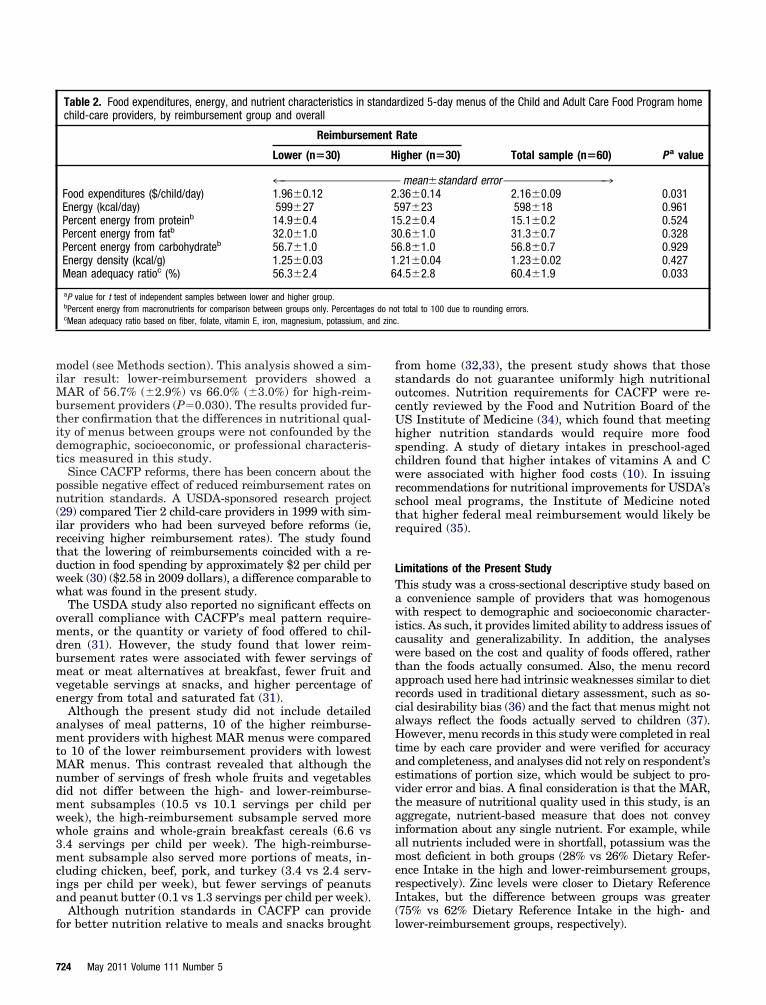
1.00 to $4.26/child/day, with a mean of $2.16 (�$0.09)/hild/day. Higher reimbursement providers spent an av-rage of $0.40/child/day more than lower-reimbursementroviders. Food expenditures and nutritional character-stics associated with the 5-day menus are summarized inable 2. Energy and nutrient composition of the stan-ardized menus also varied widely. The total daily energyontent ranged from 307 to 1,157 kcal, but energy con-ent, macronutrient composition, and energy densityere similar between groups.The nutritional quality of menus, defined as the MAR
or seven nutrients, varied substantially among provid-rs, ranging from 37.1% to 110.0%. Between groups, theean MAR was higher in the higher reimbursement
roup and t tests showed significance (P�0.033). To testor the possibility that the differences in MAR might haveeen confounded by demographic, socioeconomic, and/orrofessional characteristics that differed between theower- and higher-reimbursement groups, covariate-ad-
fessional characteristics of the Child andider sample, by reimbursement group and
mbursement Rate
Total (n � 60)�30) Higher (n�30)
™™™ mean�standard deviation ™™™™™™™349.9�8.4 48.2�8.6
™™™™™™™™™™™™™ n ™™™™™™™™™™™™™™™™323 46
3 34 111 4
12 2110 20
7 18
1 421 418 15
™™™ mean�standard deviation ™™™™™™™315.2�8.9 14.3�8.711.2�7.8 11.6�8.3
8.0�2.8 7.9�3.0
d proprov
Rei
er (n
™™™™�8.6™™™™
™™™™�8.6�8.9�3.2
e.
usted means were estimated using a general linear
May 2011 ● Journal of the AMERICAN DIETETIC ASSOCIATION 723
nd zinc
model (see Methods section). This analysis showed a sim-ilar result: lower-reimbursement providers showed aMAR of 56.7% (�2.9%) vs 66.0% (�3.0%) for high-reim-bursement providers (P�0.030). The results provided fur-ther confirmation that the differences in nutritional qual-ity of menus between groups were not confounded by thedemographic, socioeconomic, or professional characteris-tics measured in this study.
Since CACFP reforms, there has been concern about thepossible negative effect of reduced reimbursement rates onnutrition standards. A USDA-sponsored research project(29) compared Tier 2 child-care providers in 1999 with sim-ilar providers who had been surveyed before reforms (ie,receiving higher reimbursement rates). The study foundthat the lowering of reimbursements coincided with a re-duction in food spending by approximately $2 per child perweek (30) ($2.58 in 2009 dollars), a difference comparable towhat was found in the present study.
The USDA study also reported no significant effects onoverall compliance with CACFP’s meal pattern require-ments, or the quantity or variety of food offered to chil-dren (31). However, the study found that lower reim-bursement rates were associated with fewer servings ofmeat or meat alternatives at breakfast, fewer fruit andvegetable servings at snacks, and higher percentage ofenergy from total and saturated fat (31).
Although the present study did not include detailedanalyses of meal patterns, 10 of the higher reimburse-ment providers with highest MAR menus were comparedto 10 of the lower reimbursement providers with lowestMAR menus. This contrast revealed that although thenumber of servings of fresh whole fruits and vegetablesdid not differ between the high- and lower-reimburse-ment subsamples (10.5 vs 10.1 servings per child perweek), the high-reimbursement subsample served morewhole grains and whole-grain breakfast cereals (6.6 vs3.4 servings per child per week). The high-reimburse-ment subsample also served more portions of meats, in-cluding chicken, beef, pork, and turkey (3.4 vs 2.4 serv-ings per child per week), but fewer servings of peanutsand peanut butter (0.1 vs 1.3 servings per child per week).
Although nutrition standards in CACFP can provide
Table 2. Food expenditures, energy, and nutrient characteristics in schild-care providers, by reimbursement group and overall
Reimbursem
Lower (n�30)
4™™™™™™™™™™™™™™™™Food expenditures ($/child/day) 1.96�0.12Energy (kcal/day) 599�27Percent energy from proteinb 14.9�0.4Percent energy from fatb 32.0�1.0Percent energy from carbohydrateb 56.7�1.0Energy density (kcal/g) 1.25�0.03Mean adequacy ratioc (%) 56.3�2.4
aP value for t test of independent samples between lower and higher group.bPercent energy from macronutrients for comparison between groups only. PercentagescMean adequacy ratio based on fiber, folate, vitamin E, iron, magnesium, potassium, a
for better nutrition relative to meals and snacks brought
724 May 2011 Volume 111 Number 5
from home (32,33), the present study shows that thosestandards do not guarantee uniformly high nutritionaloutcomes. Nutrition requirements for CACFP were re-cently reviewed by the Food and Nutrition Board of theUS Institute of Medicine (34), which found that meetinghigher nutrition standards would require more foodspending. A study of dietary intakes in preschool-agedchildren found that higher intakes of vitamins A and Cwere associated with higher food costs (10). In issuingrecommendations for nutritional improvements for USDA’sschool meal programs, the Institute of Medicine notedthat higher federal meal reimbursement would likely berequired (35).
Limitations of the Present StudyThis study was a cross-sectional descriptive study based ona convenience sample of providers that was homogenouswith respect to demographic and socioeconomic character-istics. As such, it provides limited ability to address issues ofcausality and generalizability. In addition, the analyseswere based on the cost and quality of foods offered, ratherthan the foods actually consumed. Also, the menu recordapproach used here had intrinsic weaknesses similar to dietrecords used in traditional dietary assessment, such as so-cial desirability bias (36) and the fact that menus might notalways reflect the foods actually served to children (37).However, menu records in this study were completed in realtime by each care provider and were verified for accuracyand completeness, and analyses did not rely on respondent’sestimations of portion size, which would be subject to pro-vider error and bias. A final consideration is that the MAR,the measure of nutritional quality used in this study, is anaggregate, nutrient-based measure that does not conveyinformation about any single nutrient. For example, whileall nutrients included were in shortfall, potassium was themost deficient in both groups (28% vs 26% Dietary Refer-ence Intake in the high and lower-reimbursement groups,respectively). Zinc levels were closer to Dietary ReferenceIntakes, but the difference between groups was greater(75% vs 62% Dietary Reference Intake in the high- and
rdized 5-day menus of the Child and Adult Care Food Program home
Rate
Total sample (n�60) P a valueigher (n�30)
mean�standard error ™™™™™™™™™™™™™™™™™3.36�0.14 2.16�0.09 0.03197�23 598�18 0.9615.2�0.4 15.1�0.2 0.5240.6�1.0 31.3�0.7 0.3286.8�1.0 56.8�0.7 0.929.21�0.04 1.23�0.02 0.4274.5�2.8 60.4�1.9 0.033
t total to 100 due to rounding errors..
tanda
ent
H
™™™™2513516
do no
lower-reimbursement groups, respectively).
CONCLUSIONSResults of this study suggest that policies that improveCACFP reimbursement rates should be considered aspart of comprehensive initiatives to improve childhoodnutrition. Improving the nutrition guidance can also helpby giving child-care providers the information to priori-tize some foods over others. Dietetics practitioners andnutrition scientists can provide the needed guidance, andobjective, nutrient-based metrics are useful for this effort(38,39). Meanwhile, further research will be needed toidentify food spending and menu patterns that providefor optimal child nutrition at the most affordable cost.
STATEMENT OF POTENTIAL CONFLICT OF INTEREST:No potential conflict of interest was reported by the au-thors.
FUNDING/SUPPORT: Supported by a grant from theRobert Wood Johnson Foundation’s Healthy Eating Re-search Program, RWJF-63046.
ACKNOWLEDGEMENTS: We thank Anju Aggarwal,MS; Louise Carter, PhD; Adam Drewnowski, PhD; andJutta Joesch, PhD, for their helpful comments and discus-sions during the course of this project. We are also gratefulfor assistance in conducting this study from Rita Hagan,Shauna Pirotin, Rachael Stovall, Joanna Vong, and M. Te-resa Tran.
References1. Federal Food Programs, The Child and Adult Care Food Program.
http://www.frac.org/html/federal_food_programs/programs/cacfp.html.Accessed February 24, 2010.
2. Kumagai S. Towards Healthier Meals and Snacks at King CountyChild Care: “Fuel & Play the Healthy Way” Menu Evaluation. Seattle,WA: University of Washington; Thesis, Masters in Public Health,Nutritional Sciences Program, 2005.
3. US Department of Agriculture. Economic Research Service. Effects ofCACFP Meal Reimbursement Tiering: Major Findings of the FamilyChild Care Homes Legislative Changes Study. Washington, DC: USDepartment of Agriculture, Economic Research Service; 2002.
4. Child and Adult Care Food Program. National average payment rates,day care home food service payment rates, and administrative reim-bursement rates for sponsoring organizations of day care homes forthe period July 1, 2009 through June 30, 2010. In: Department ofAgriculture Food and Nutrition Service, ed. 74. Washington, DC:Government Publications Office; 2009:34295-34296.
5. Monsivais P, Drewnowski A. Lower-energy-density diets are associatedwith higher monetary costs per kilocalorie and are consumed by womenof higher socioeconomic status. J Am Diet Assoc. 2009;109:814-822.
6. Murakami K, Sasaki S, Okubo H, Takahashi Y, Hosoi Y, Itabashi M.Monetary costs of dietary energy reported by young Japanese women:Association with food and nutrient intake and body mass index.Public Health Nutr. 2007;10:1430-1439.
7. Darmon N, Ferguson EL, Briend A. Impact of a cost constraint onnutritionally adequate food choices for French women: An analysis bylinear programming. J Nutr Educ Behav. 2006;38:82-90.
8. Schröder H, Marrugat J, Covas MI. High monetary costs of dietarypatterns associated with lower body mass index: A population-basedstudy. Int J Obes (Lond). 2006;30:1574-1579.
9. Maillot M, Darmon N, Darmon M, Lafay L, Drewnowski A. Nutrient-dense food groups have high energy costs: An econometric approach tonutrient profiling. J Nutr. 2007;137:1815-1820.
10. Rauber F, Vitolo MR. Nutritional quality and food expenditure inpreschool children. J Pediatr. 2009;85:536-540.
11. Center for Nutrition Policy and Promotion. MyPyramid.gov. Alexan-dria, VA: Center for Nutrition Policy and Promotion, US Departmentof Agriculture; 2005. http://purl.access.gpo.gov/GPO/LPS60027. Ac-cessed March 6, 2009.
12. Guthrie H, Scheer J. Validity of a dietary score for assessing nutrient
adequacy. J Am Diet Assoc. 1981;78:241-245.13. Madden J, Yoder M. Program evaluation: Food stamps and commod-
ity distribution in rural areas of Central Pennsylvania. Penn Agr ExpSta Bull. 1972;78:1-119.
14. US Dietary Guidelines Advisory Committee. The Report of the DietaryGuidelines Advisory Committee on Dietary Guidelines for Americans,2005. Washington, DC: US Department of Health and Human Ser-vices; 2004.
15. Briley ME, Jastrow S, Vickers J, Roberts-Gray C. Dietary intake atchild-care centers and away: Are parents and care providers workingas partners or at cross-purposes? J Am Diet Assoc. 1999;99:950-954.
16. Briefel RR, Bialostosky K, Kennedy-Stephenson J, McDowell MA,Ervin RB, Wright JD. Zinc intake of the US population: Findings fromthe third National Health and Nutrition Examination Survey, 1988-1994. J Nutr. 2000;130:1367S-1373S.
17. Roberts SB, Heyman MB. Micronutrient shortfalls in young children’sdiets: Common, and owing to inadequate intakes both at home and atchild care centers. Nutr Rev. 2000;58:27-29.
18. Skinner JD, Carruth BR, Houck KS, Bounds W, Morris M, Cox DR,Moran J 3rd, Coletta F. Longitudinal study of nutrient and foodintakes of white preschool children aged 24 to 60 months. J Am DietAssoc. 1999;99:1514-1521.
19. Suskind DL. Nutritional deficiencies during normal growth. PediatrClin North Am. 2009;56:1035-1053.
20. Drewel BT, Giraud DW, Davy SR, Driskell JA. Less than adequatevitamin E status observed in a group of preschool boys and girls livingin the United States. J Nutr Biochem. 2006;17:132-138.
21. US Department of Health and Human Services. The Report of theDietary Guidelines Advisory Committee on Dietary Guidelines forAmericans, 2005. Washington, DC: US Department of Health andHuman Services; 2005.
22. Hoerr SL, Horodynski MA, Lee SY, Henry M. Predictors of nutritionaladequacy in mother-toddler dyads from rural families with limitedincomes. J Am Diet Assoc. 2006;106:1766-1773.
23. Kranz S, Mitchell DC, Siega-Riz AM, Smiciklas-Wright H. Dietaryfiber intake by American preschoolers is associated with more nutri-ent-dense diets. J Am Diet Assoc. 2005;105:221-225.
24. Ballew C, Kuester S, Serdula M, Bowman B, Dietz W. Nutrientintakes and dietary patterns of young children by dietary fat intakes.J Pediatr. 2000;136:181-187.
25. Salamoun MM, Kizirian AS, Tannous RI, Nabulsi MM, Choucair MK,Deeb ME, El-Hajj Fuleihan GA. Low calcium and vitamin D intake inhealthy children and adolescents and their correlates. Eur J ClinNutr. 2005;59:177-184.
26. Ledikwe JH, Blanck HM, Khan LK, Serdula MK, Seymour JD, TohillBC, Rolls BJ. Low-energy-density diets are associated with high dietquality in adults in the United States. J Am Diet Assoc. 2006;106:1172-1180.
27. Kant AK, Graubard BI. Secular trends in the association of socio-economic position with self-reported dietary attributes and biomark-ers in the US population: National Health and Nutrition ExaminationSurvey (NHANES) 1971-1975 to NHANES 1999-2002. Public HealthNutr. 2007;10:158-167.
28. US Department of Agriculture. Food Yields Summarized by DifferentStages of Preparation. Washington, DC: US Department of Agricul-ture; 1975.
29. US Department of Agriculture, Economic Research Service. Familychild care homes and the CACFP participation after reimbursementtiering: An interim report of the Family Child Care Homes LegislativeChanges Study, 1999. http://www.ers.usda.gov/publications/fanrr3/.Accessed April 5, 2010.
30. Hamilton W, Burstein N, Crepinsek MK. Reimbursement Tiering inthe CACFP: Summary Report to Congress on the Family Child CareHomes Legislative Changes Study. Washington, DC: US Departmentof Agriculture; March 2002:FANRR-22.
31. Crepinsek MK, Burstein NR, Lee EB, Kennedy SD, Hamilton WL.Meals Offered by Tier 2 CACFP Family Child Care Providers: Effectsof Lower Meal Reimbursements. A Report to Congress on the FamilyChild Care Homes Legislative Changes Study. Washington, DC: USDepartment of Agriculture; March 2002.
32. Bruening KS, Gilbride JA, Passannante MR, McClowry S. Dietaryintake and health outcomes among young children attending 2 urbanday-care centers. J Am Diet Assoc. 1999;99:1529-1535.
33. Sweitzer SJ, Briley ME, Robert-Gray C. Do sack lunches provided byparents meet the nutritional needs of young children who attend childcare? J Am Diet Assoc. 2009;109:141-144.
34. Child and Adult Care Food Program: Aligning Dietary Guidance forAll. Consensus Study: Institute of Medicine, National Academy of
Sciences. Washington, DC: National Academies Press; November2010.May 2011 ● Journal of the AMERICAN DIETETIC ASSOCIATION 725
3
3
3
35. Institute of Medicine. Committee on Nutrition Standards for NationalSchool Lunch and Breakfast Programs. In: Stallings VA, Suitor CW,Taylor CL, eds. School Meals: Building Blocks for Healthy Children.Washington, DC: National Academies Press; 2009.
6. Hebert JR, Clemow L, Pbert L, Okene IS, Okene JK. Social desirabil-
ity bias in dietary self-report may compromise the validity of dietaryintake measures. Int J Epidemiol. 1995;24:389-398.726 May 2011 Volume 111 Number 5
7. Fleischhacker S, Cason KL, Achterberg C. “You had peas today?”: Apilot study comparing a Head Start child-care center’s menu with theactual food served. J Am Diet Assoc. 2006;106:277-280.
8. Drewnowski A, Fulgoni V. Nutrient profiling of foods: Creating anutrient-rich food index. Nutr Rev. 2008;66:23-39.
39. Drewnowski A. Concept of a nutritious food: Toward a nutrient den-sity score. Am J Clin Nutr. 2005;82:721-732.