Embed Size (px)
Citation preview
More on gdb for MySQL DBAsor
Using gdb to study MySQL internals and as a last resort
Valerii Kravchuk, MySQL Support [email protected]

www.percona.com
Who am I?
Valerii (aka Valeriy) Kravchuk:● MySQL Support Engineer in MySQL AB, Sun and Oracle, 2005 - 2012
○ Bugs Verification Team all this time○ Support issues related to bugs, crashes, InnoDB, performance...○ Trainings (mostly informal) for new team members○ All kinds of decision making committees…
● Principal Support Engineer in Percona, 2012 - 2016○ Did more or less the same as before, but better (I hope)...○ Plus I tried to speak and write about MySQL in publi
● Independent since January 27, 2016● http://mysqlentomologist.blogspot.com - my blog about MySQL (mostly
bugs)● https://www.facebook.com/valerii.kravchuk - my Facebook page, a lot about
MySQL (mostly bugs…)● http://bugs.mysql.com - my personal playground. 28 bugs reported since
February, 2015
www.percona.com
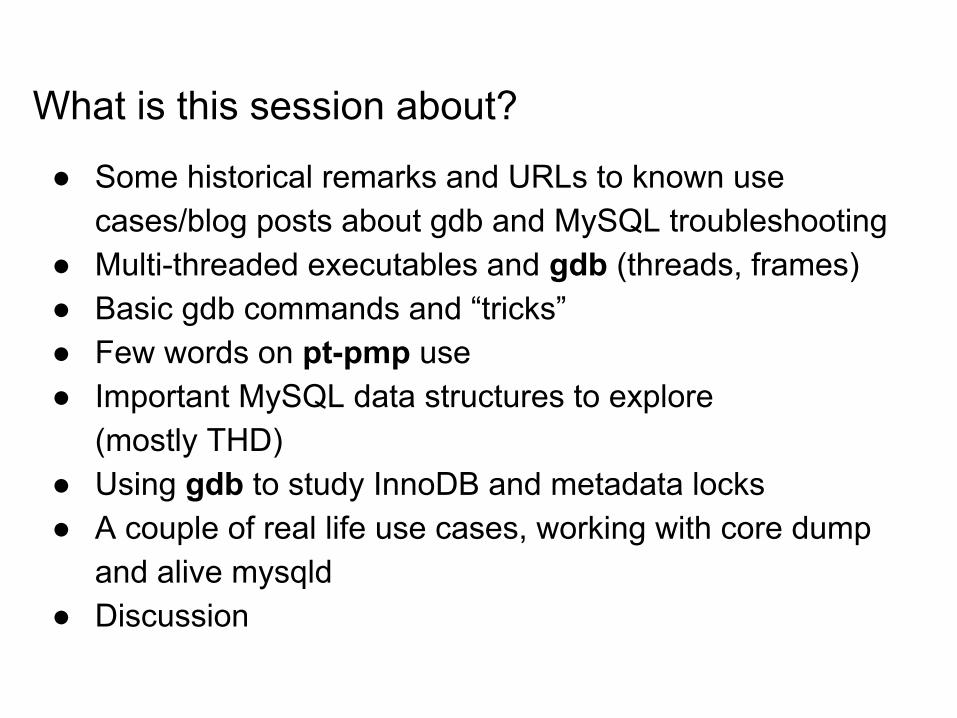
What is this session about?
● Some historical remarks and URLs to known use cases/blog posts about gdb and MySQL troubleshooting
● Multi-threaded executables and gdb (threads, frames)● Basic gdb commands and “tricks”● Few words on pt-pmp use● Important MySQL data structures to explore
(mostly THD)● Using gdb to study InnoDB and metadata locks● A couple of real life use cases, working with core dump
and alive mysqld● Discussion
www.percona.com
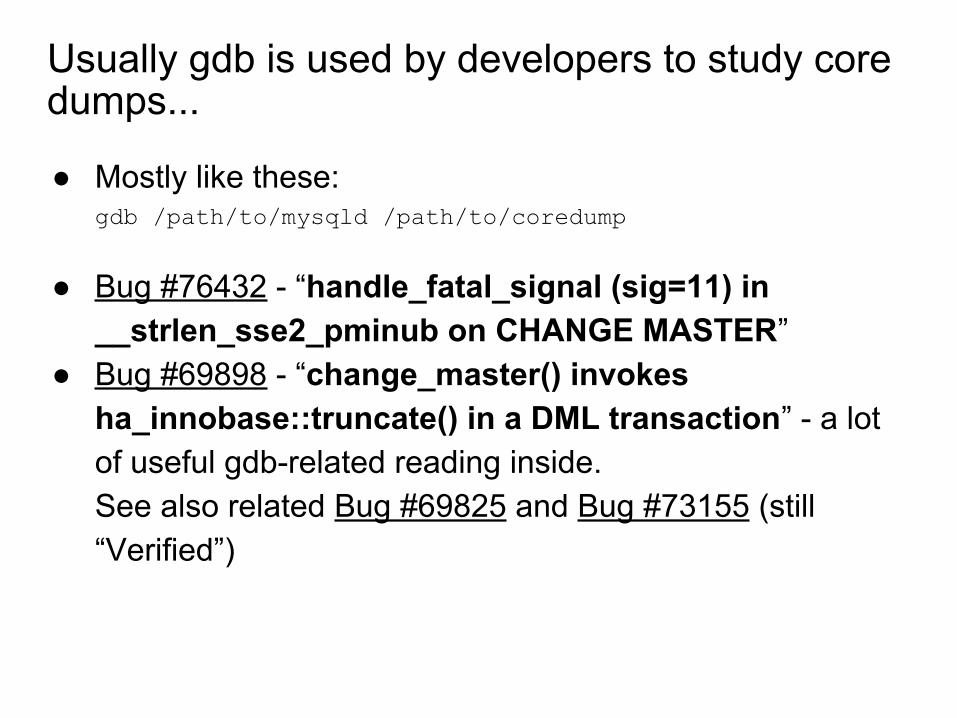
Usually gdb is used by developers to study core dumps...
● Mostly like these:gdb /path/to/mysqld /path/to/coredump
● Bug #76432 - “handle_fatal_signal (sig=11) in __strlen_sse2_pminub on CHANGE MASTER”
● Bug #69898 - “change_master() invokes ha_innobase::truncate() in a DML transaction” - a lot of useful gdb-related reading inside. See also related Bug #69825 and Bug #73155 (still “Verified”)
www.percona.com
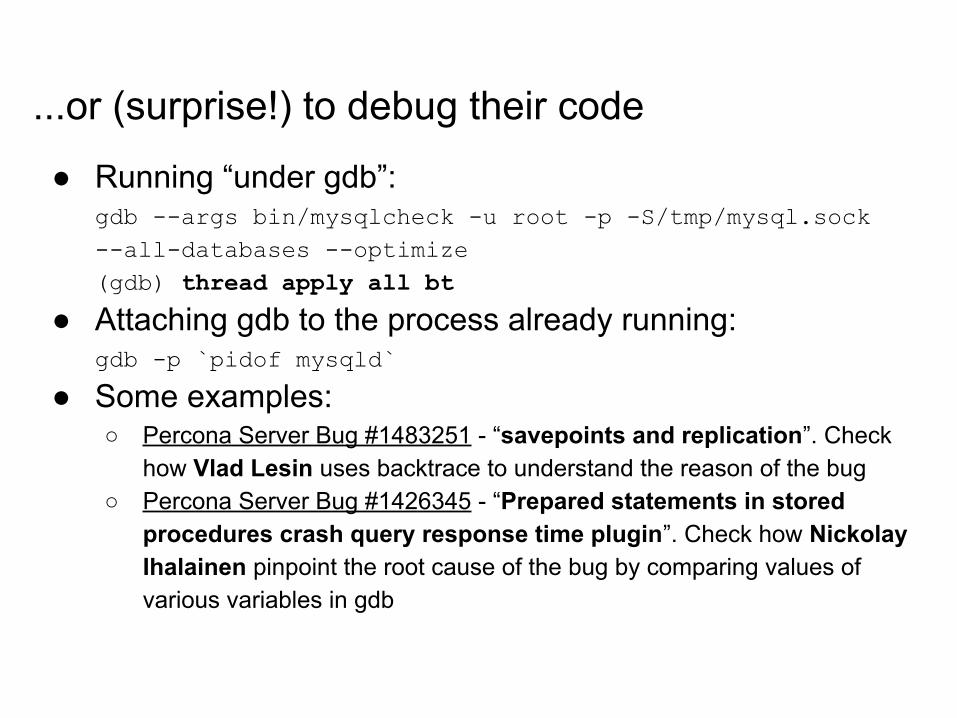
...or (surprise!) to debug their code
● Running “under gdb”:gdb --args bin/mysqlcheck -u root -p -S/tmp/mysql.sock --all-databases --optimize(gdb) thread apply all bt
● Attaching gdb to the process already running:gdb -p `pidof mysqld`
● Some examples:○ Percona Server Bug #1483251 - “savepoints and replication”. Check
how Vlad Lesin uses backtrace to understand the reason of the bug○ Percona Server Bug #1426345 - “Prepared statements in stored
procedures crash query response time plugin”. Check how Nickolay Ihalainen pinpoint the root cause of the bug by comparing values of various variables in gdb
www.percona.com
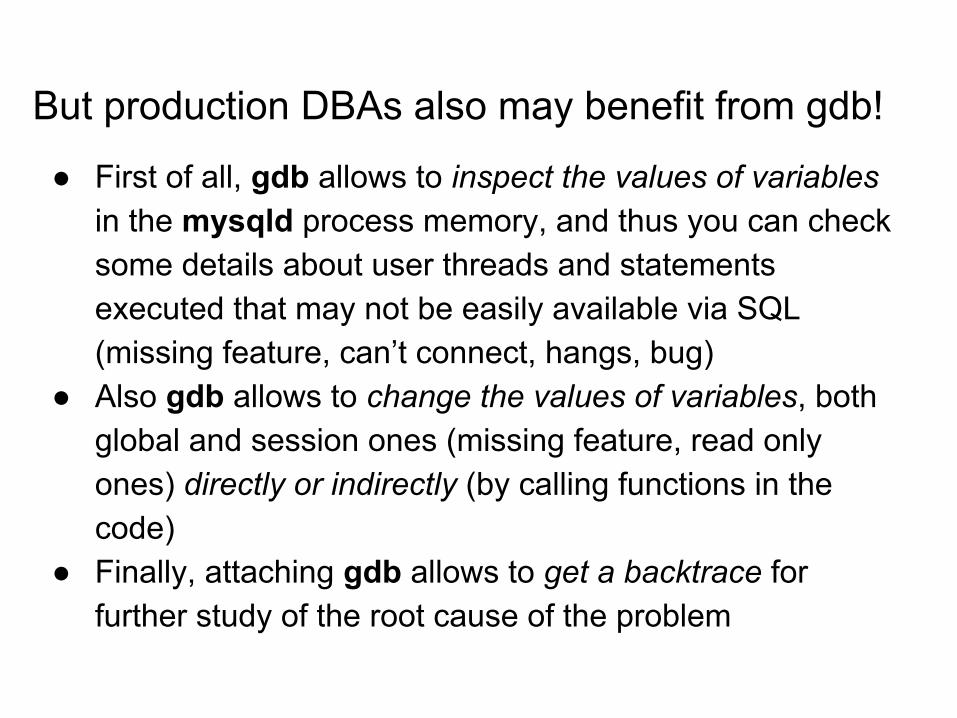
But production DBAs also may benefit from gdb!
● First of all, gdb allows to inspect the values of variables in the mysqld process memory, and thus you can check some details about user threads and statements executed that may not be easily available via SQL (missing feature, can’t connect, hangs, bug)
● Also gdb allows to change the values of variables, both global and session ones (missing feature, read only ones) directly or indirectly (by calling functions in the code)
● Finally, attaching gdb allows to get a backtrace for further study of the root cause of the problem
www.percona.com
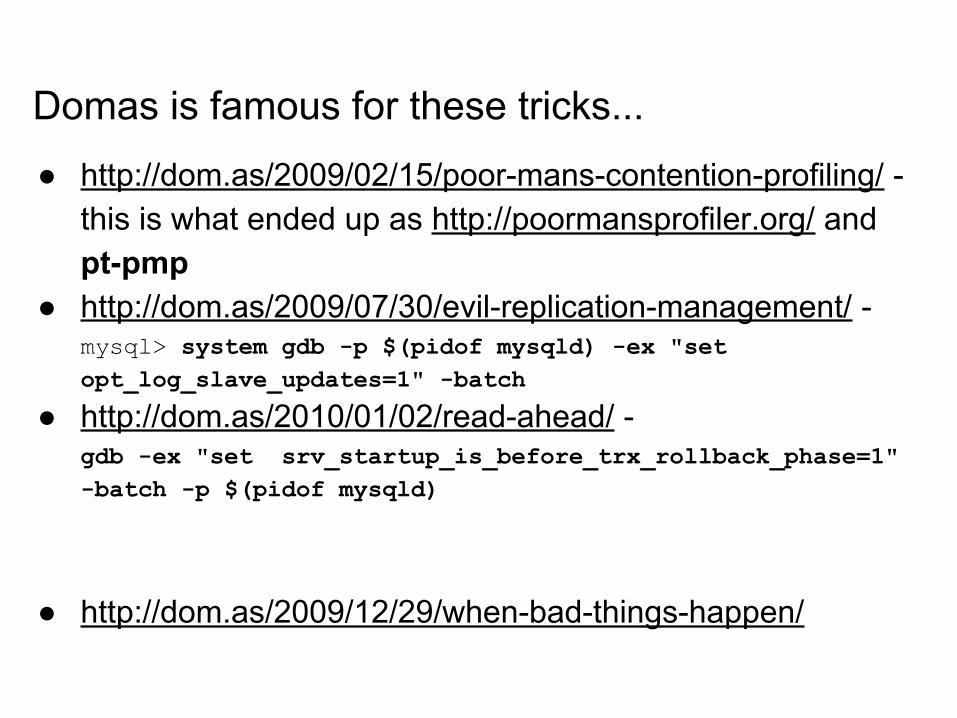
Domas is famous for these tricks...
● http://dom.as/2009/02/15/poor-mans-contention-profiling/ - this is what ended up as http://poormansprofiler.org/ and pt-pmp
● http://dom.as/2009/07/30/evil-replication-management/ - mysql> system gdb -p $(pidof mysqld) -ex "set opt_log_slave_updates=1" -batch
● http://dom.as/2010/01/02/read-ahead/ - gdb -ex "set srv_startup_is_before_trx_rollback_phase=1" -batch -p $(pidof mysqld)
● http://dom.as/2009/12/29/when-bad-things-happen/
www.percona.com
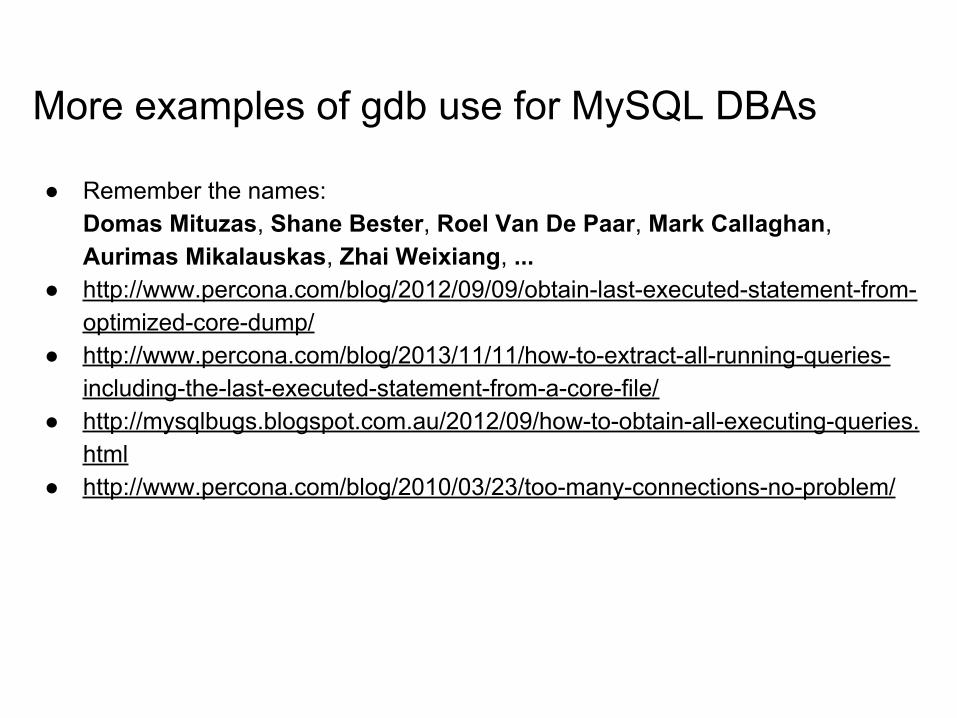
More examples of gdb use for MySQL DBAs
● Remember the names: Domas Mituzas, Shane Bester, Roel Van De Paar, Mark Callaghan, Aurimas Mikalauskas, Zhai Weixiang, ...
● http://www.percona.com/blog/2012/09/09/obtain-last-executed-statement-from-optimized-core-dump/
● http://www.percona.com/blog/2013/11/11/how-to-extract-all-running-queries-including-the-last-executed-statement-from-a-core-file/
● http://mysqlbugs.blogspot.com.au/2012/09/how-to-obtain-all-executing-queries.html
● http://www.percona.com/blog/2010/03/23/too-many-connections-no-problem/
www.percona.com
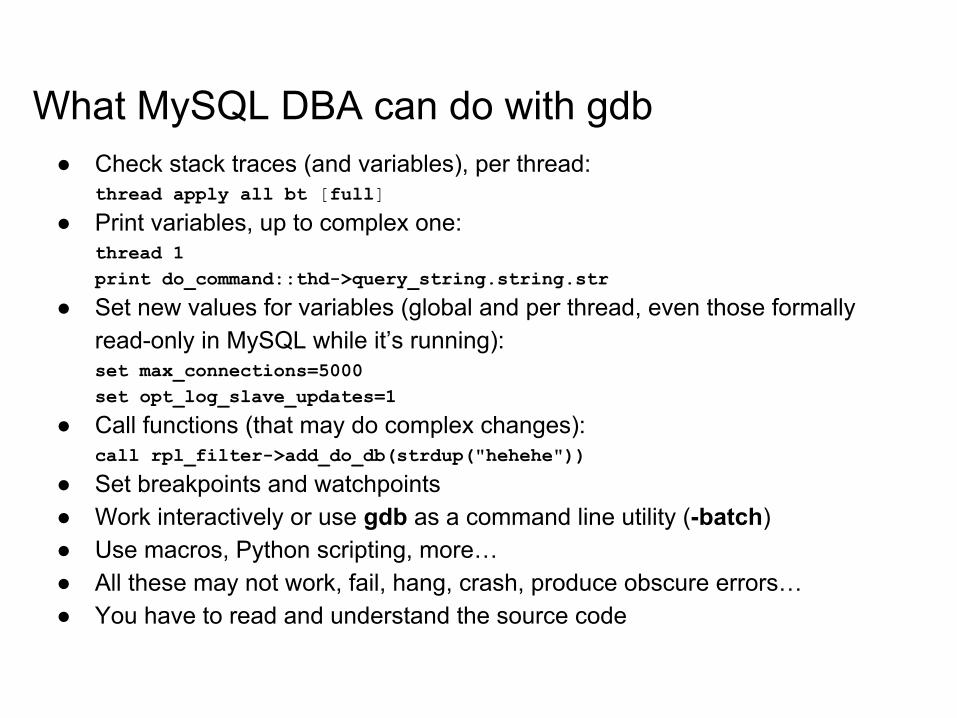
What MySQL DBA can do with gdb● Check stack traces (and variables), per thread:
thread apply all bt [full]
● Print variables, up to complex one:thread 1print do_command::thd->query_string.string.str
● Set new values for variables (global and per thread, even those formally read-only in MySQL while it’s running):set max_connections=5000set opt_log_slave_updates=1
● Call functions (that may do complex changes):call rpl_filter->add_do_db(strdup("hehehe"))
● Set breakpoints and watchpoints● Work interactively or use gdb as a command line utility (-batch)● Use macros, Python scripting, more…● All these may not work, fail, hang, crash, produce obscure errors…● You have to read and understand the source code
www.percona.com
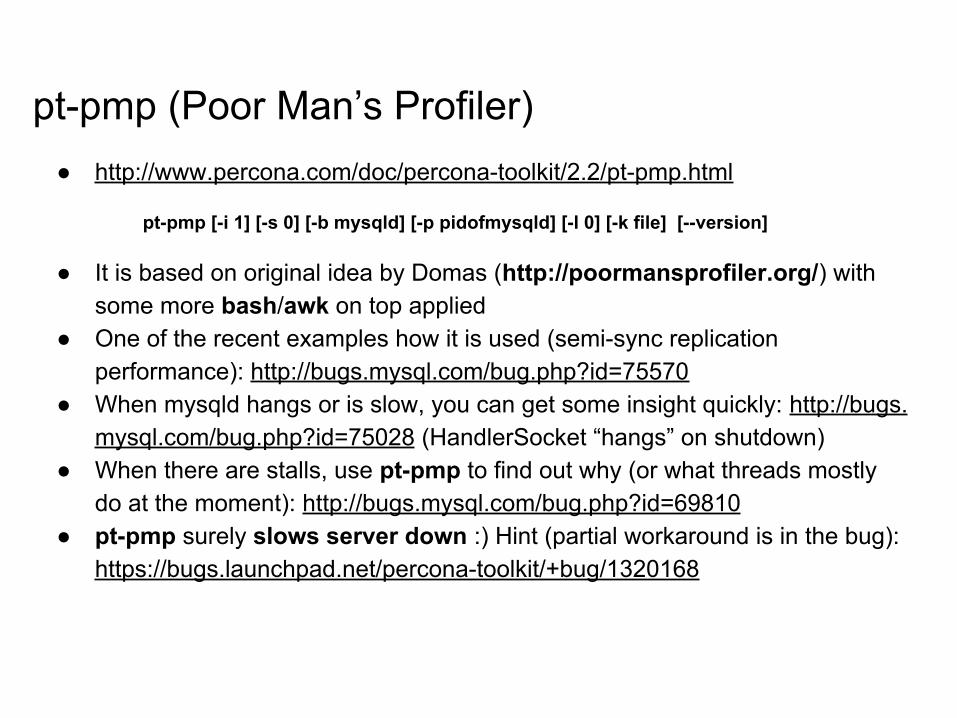
pt-pmp (Poor Man’s Profiler)● http://www.percona.com/doc/percona-toolkit/2.2/pt-pmp.html
pt-pmp [-i 1] [-s 0] [-b mysqld] [-p pidofmysqld] [-l 0] [-k file] [--version]
● It is based on original idea by Domas (http://poormansprofiler.org/) with some more bash/awk on top applied
● One of the recent examples how it is used (semi-sync replication performance): http://bugs.mysql.com/bug.php?id=75570
● When mysqld hangs or is slow, you can get some insight quickly: http://bugs.mysql.com/bug.php?id=75028 (HandlerSocket “hangs” on shutdown)
● When there are stalls, use pt-pmp to find out why (or what threads mostly do at the moment): http://bugs.mysql.com/bug.php?id=69810
● pt-pmp surely slows server down :) Hint (partial workaround is in the bug):https://bugs.launchpad.net/percona-toolkit/+bug/1320168
www.percona.com
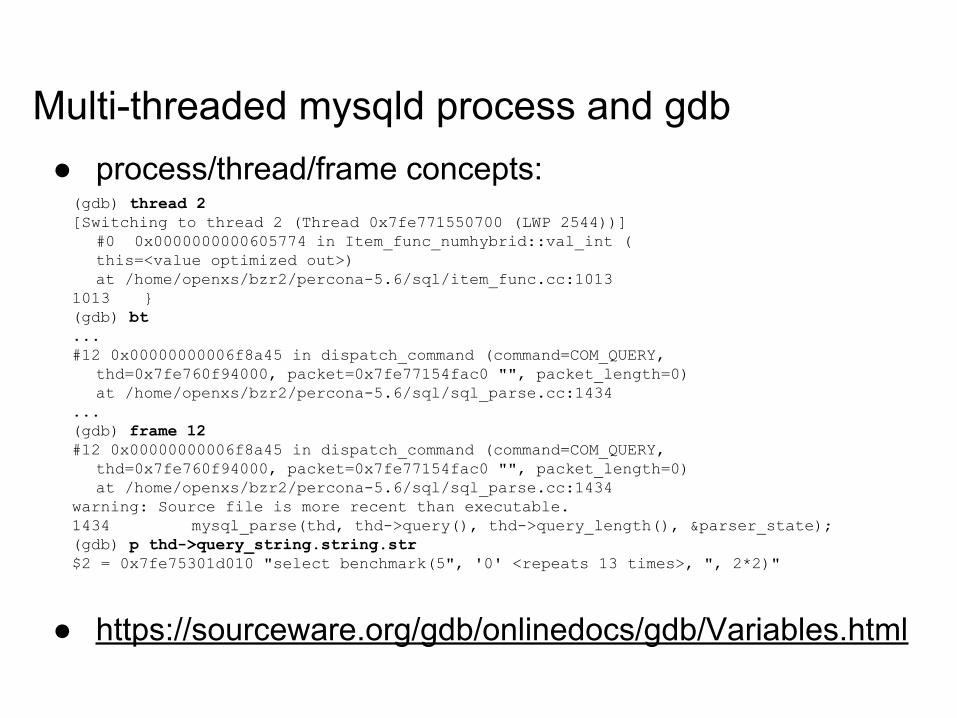
Multi-threaded mysqld process and gdb● process/thread/frame concepts:
(gdb) thread 2[Switching to thread 2 (Thread 0x7fe771550700 (LWP 2544))]
#0 0x0000000000605774 in Item_func_numhybrid::val_int (this=<value optimized out>)at /home/openxs/bzr2/percona-5.6/sql/item_func.cc:1013
1013 }(gdb) bt...#12 0x00000000006f8a45 in dispatch_command (command=COM_QUERY,
thd=0x7fe760f94000, packet=0x7fe77154fac0 "", packet_length=0)at /home/openxs/bzr2/percona-5.6/sql/sql_parse.cc:1434
...(gdb) frame 12#12 0x00000000006f8a45 in dispatch_command (command=COM_QUERY,
thd=0x7fe760f94000, packet=0x7fe77154fac0 "", packet_length=0)at /home/openxs/bzr2/percona-5.6/sql/sql_parse.cc:1434
warning: Source file is more recent than executable.1434 mysql_parse(thd, thd->query(), thd->query_length(), &parser_state);(gdb) p thd->query_string.string.str$2 = 0x7fe75301d010 "select benchmark(5", '0' <repeats 13 times>, ", 2*2)"
● https://sourceware.org/gdb/onlinedocs/gdb/Variables.html
www.percona.com
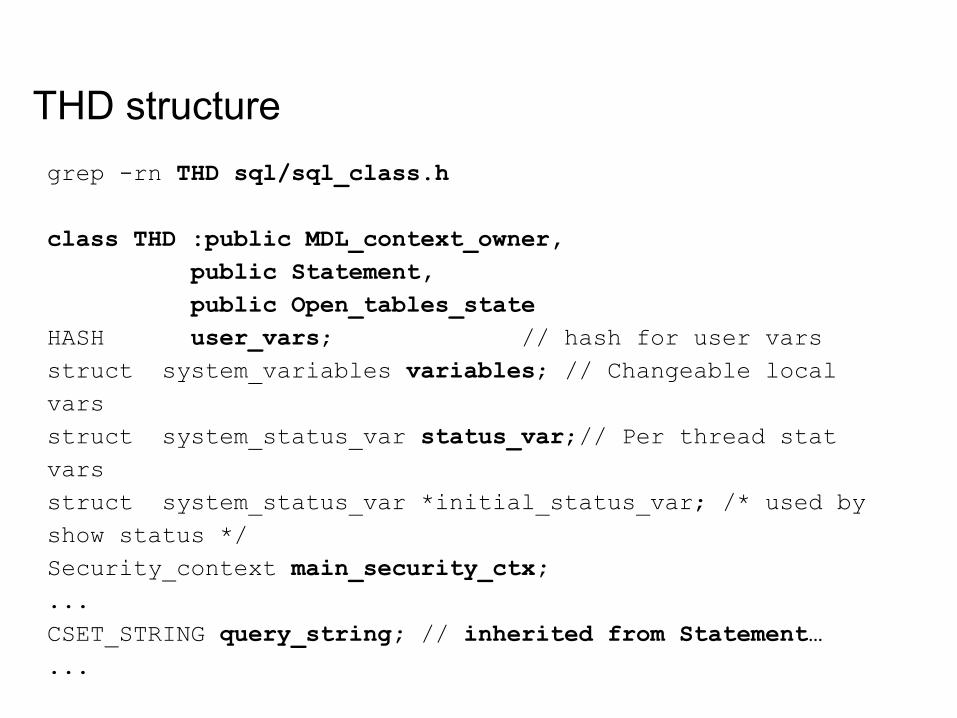
THD structuregrep -rn THD sql/sql_class.h
class THD :public MDL_context_owner, public Statement, public Open_tables_stateHASH user_vars; // hash for user varsstruct system_variables variables; // Changeable local varsstruct system_status_var status_var;// Per thread stat varsstruct system_status_var *initial_status_var; /* used by show status */Security_context main_security_ctx;...CSET_STRING query_string; // inherited from Statement…...
www.percona.com
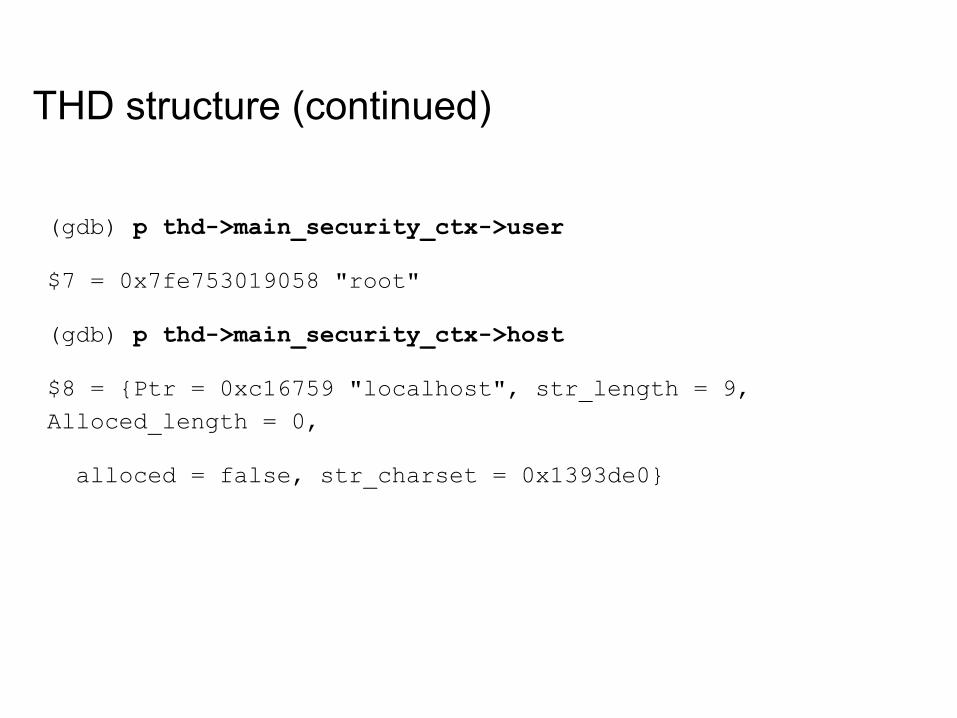
THD structure (continued)
(gdb) p thd->main_security_ctx->user
$7 = 0x7fe753019058 "root"
(gdb) p thd->main_security_ctx->host
$8 = {Ptr = 0xc16759 "localhost", str_length = 9, Alloced_length = 0,
alloced = false, str_charset = 0x1393de0}
www.percona.com
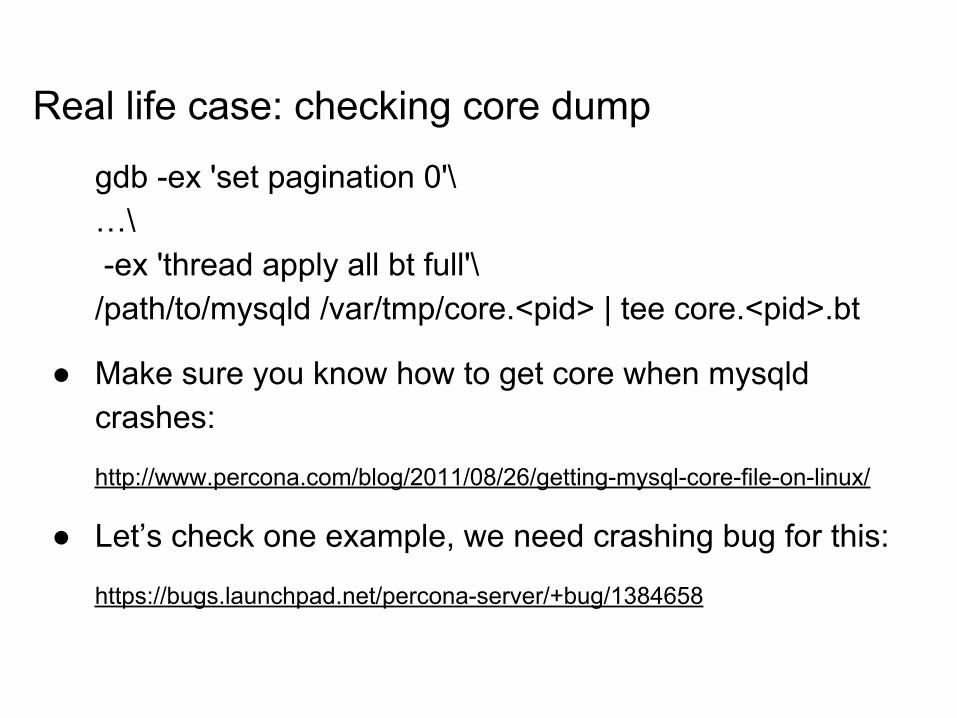
Real life case: checking core dump
gdb -ex 'set pagination 0'\…\ -ex 'thread apply all bt full'\ /path/to/mysqld /var/tmp/core.<pid> | tee core.<pid>.bt
● Make sure you know how to get core when mysqld crashes:
http://www.percona.com/blog/2011/08/26/getting-mysql-core-file-on-linux/
● Let’s check one example, we need crashing bug for this:
https://bugs.launchpad.net/percona-server/+bug/1384658
www.percona.com
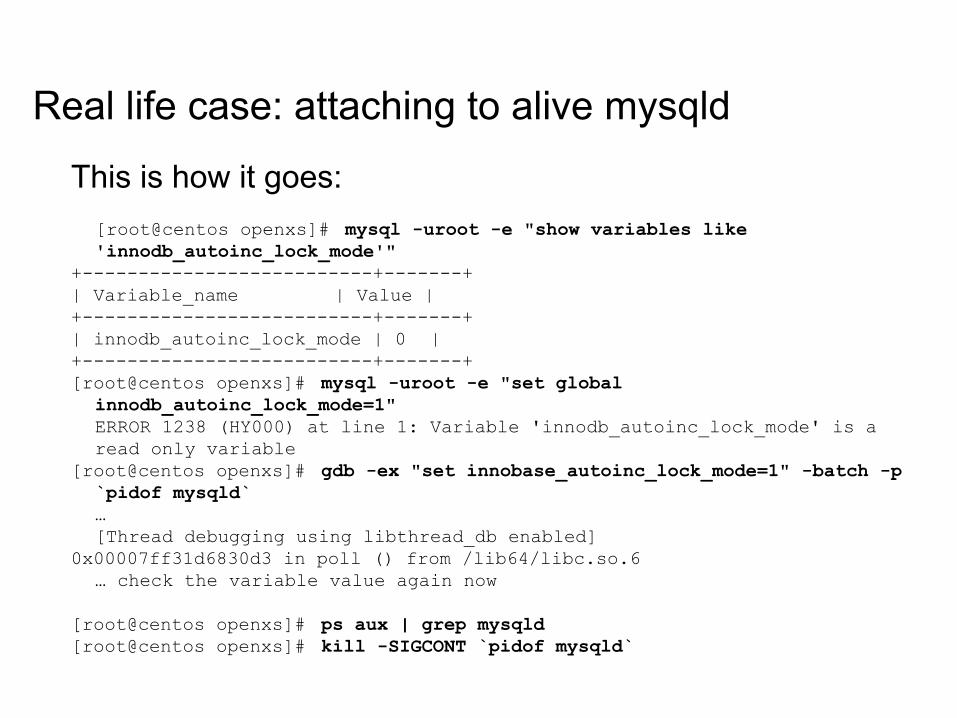
Real life case: attaching to alive mysqld
This is how it goes:[root@centos openxs]# mysql -uroot -e "show variables like 'innodb_autoinc_lock_mode'"
+--------------------------+-------+| Variable_name | Value |+--------------------------+-------+| innodb_autoinc_lock_mode | 0 |+--------------------------+-------+[root@centos openxs]# mysql -uroot -e "set global
innodb_autoinc_lock_mode=1"ERROR 1238 (HY000) at line 1: Variable 'innodb_autoinc_lock_mode' is a read only variable
[root@centos openxs]# gdb -ex "set innobase_autoinc_lock_mode=1" -batch -p `pidof mysqld`…[Thread debugging using libthread_db enabled]
0x00007ff31d6830d3 in poll () from /lib64/libc.so.6… check the variable value again now
[root@centos openxs]# ps aux | grep mysqld[root@centos openxs]# kill -SIGCONT `pidof mysqld`
www.percona.com
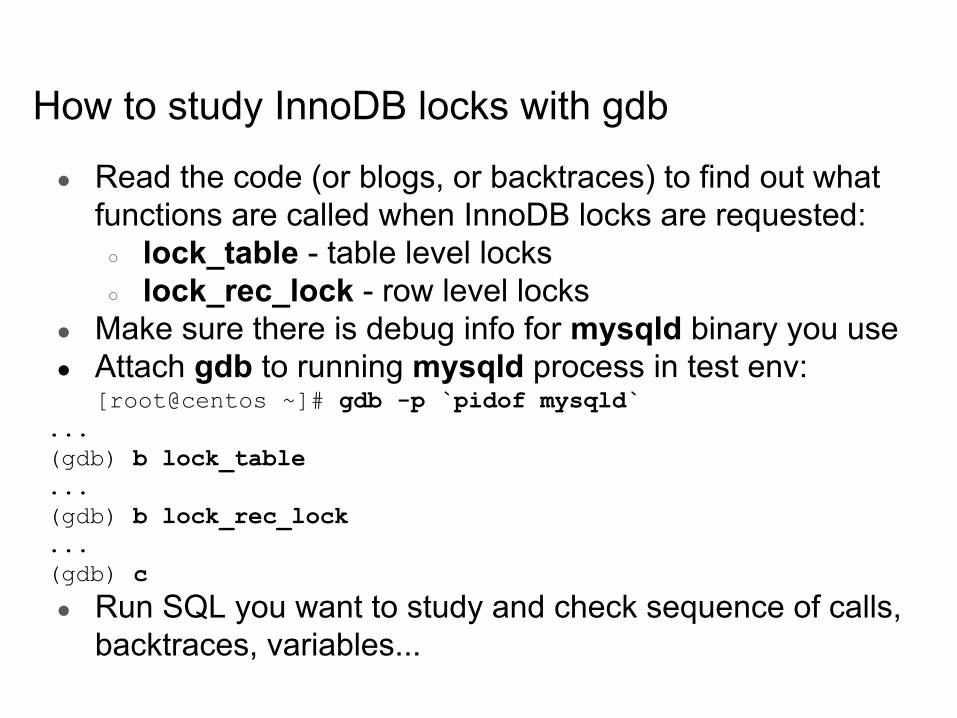
How to study InnoDB locks with gdb
● Read the code (or blogs, or backtraces) to find out what functions are called when InnoDB locks are requested:
○ lock_table - table level locks○ lock_rec_lock - row level locks
● Make sure there is debug info for mysqld binary you use● Attach gdb to running mysqld process in test env:
[root@centos ~]# gdb -p `pidof mysqld`...(gdb) b lock_table...(gdb) b lock_rec_lock...(gdb) c
● Run SQL you want to study and check sequence of calls, backtraces, variables...
www.percona.com
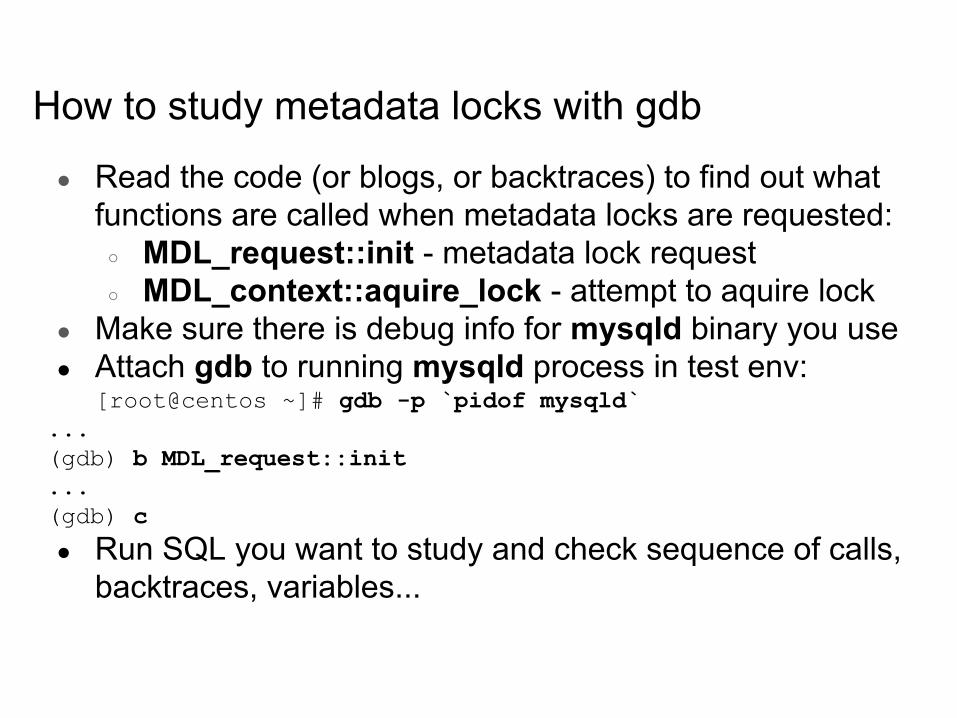
How to study metadata locks with gdb
● Read the code (or blogs, or backtraces) to find out what functions are called when metadata locks are requested:
○ MDL_request::init - metadata lock request○ MDL_context::aquire_lock - attempt to aquire lock
● Make sure there is debug info for mysqld binary you use● Attach gdb to running mysqld process in test env:
[root@centos ~]# gdb -p `pidof mysqld`...(gdb) b MDL_request::init...(gdb) c
● Run SQL you want to study and check sequence of calls, backtraces, variables...
www.percona.com
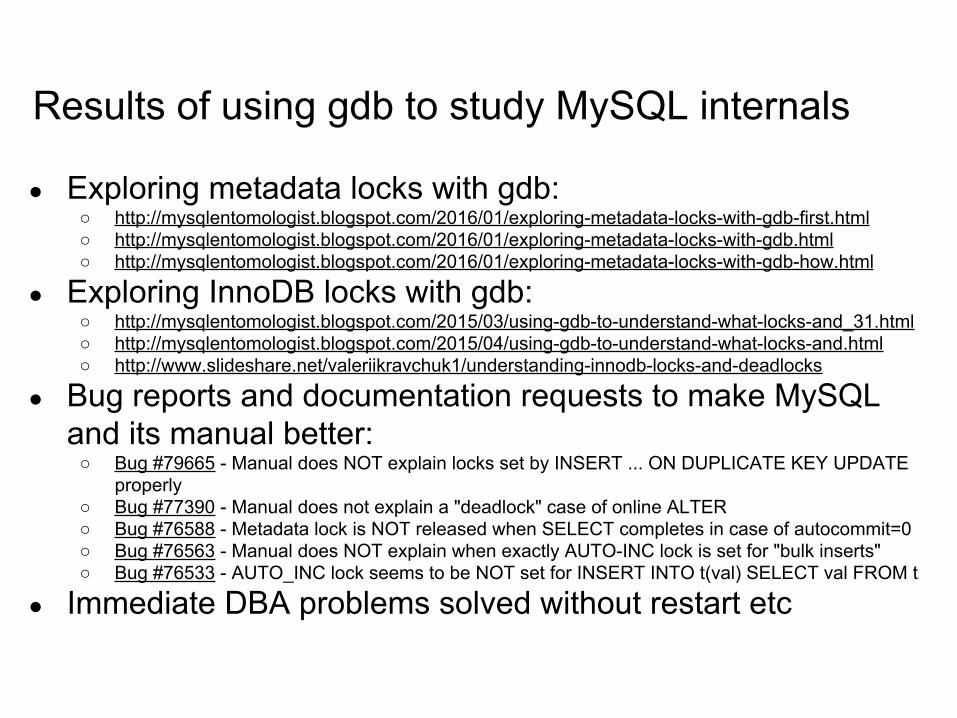
Results of using gdb to study MySQL internals
● Exploring metadata locks with gdb:○ http://mysqlentomologist.blogspot.com/2016/01/exploring-metadata-locks-with-gdb-first.html○ http://mysqlentomologist.blogspot.com/2016/01/exploring-metadata-locks-with-gdb.html○ http://mysqlentomologist.blogspot.com/2016/01/exploring-metadata-locks-with-gdb-how.html
● Exploring InnoDB locks with gdb:○ http://mysqlentomologist.blogspot.com/2015/03/using-gdb-to-understand-what-locks-and_31.html○ http://mysqlentomologist.blogspot.com/2015/04/using-gdb-to-understand-what-locks-and.html○ http://www.slideshare.net/valeriikravchuk1/understanding-innodb-locks-and-deadlocks
● Bug reports and documentation requests to make MySQL and its manual better:
○ Bug #79665 - Manual does NOT explain locks set by INSERT ... ON DUPLICATE KEY UPDATE properly
○ Bug #77390 - Manual does not explain a "deadlock" case of online ALTER○ Bug #76588 - Metadata lock is NOT released when SELECT completes in case of autocommit=0○ Bug #76563 - Manual does NOT explain when exactly AUTO-INC lock is set for "bulk inserts"○ Bug #76533 - AUTO_INC lock seems to be NOT set for INSERT INTO t(val) SELECT val FROM t
● Immediate DBA problems solved without restart etc
www.percona.com
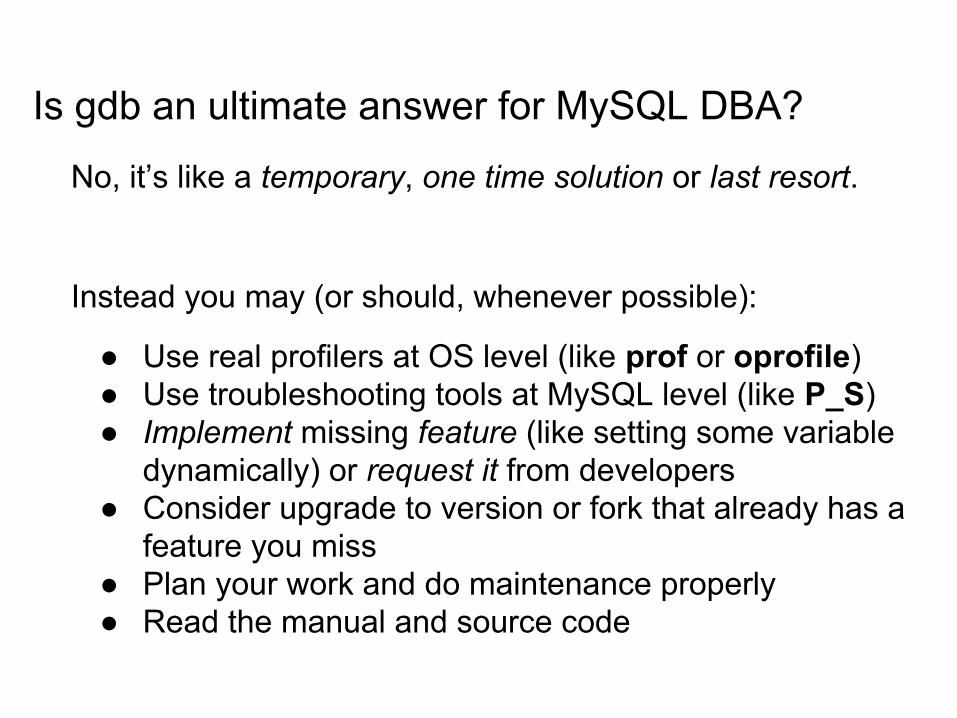
Is gdb an ultimate answer for MySQL DBA?
No, it’s like a temporary, one time solution or last resort.
Instead you may (or should, whenever possible):
● Use real profilers at OS level (like prof or oprofile)● Use troubleshooting tools at MySQL level (like P_S)● Implement missing feature (like setting some variable
dynamically) or request it from developers● Consider upgrade to version or fork that already has a
feature you miss● Plan your work and do maintenance properly● Read the manual and source code

www.percona.com
Thank you!Questions and Answers?
Please, report bugs at:
http://bugs.mysql.com
Use “Affects Me” button!


![GDB telux ver090906 - cs.tau.ac.il · (gdb) watch expr –stops whenever the value of the expression changes (gdb ) i b (gdb) clear [arg ] (gdb) delete [bnum ] Without arguments deletes](https://img.pdfslide.net/doc/110x75/5ae0abbc7f8b9ab4688daeeb/gdb-telux-ver090906-cstauacil-gdb-watch-expr-stops-whenever-the-value-of.jpg)


![MIT OpenCourseWare 6.189 Multicore …...Running Processes Under GDB ppu-gdb ./hello-world (gdb) run [args] … (gdb) quit export SPU_INFO=1 for extra information about threads Phil](https://img.pdfslide.net/doc/110x75/5f19ba63a6b0b957e67c7a59/mit-opencourseware-6189-multicore-running-processes-under-gdb-ppu-gdb-hello-world.jpg)