Embed Size (px)
Citation preview
Final Pre Formal Consultation DB Morecambe Bay and Duddon Estuary SPA Departmental Brief. Page 1 of 74 January 2016
Departmental brief:
Morecambe Bay and Duddon Estuary potential Special Protection Area (pSPA)
Natural England
January 2016
Final Pre Formal Consultation DB Morecambe Bay and Duddon Estuary SPA Departmental Brief. Page 2 of 74 January 2016
Contents
Contents 2 SUMMARY ........................................................................................................................... 3 1 Assessment against SPA Selection Guidelines ..................................................... 6
Stage 1 .................................................................................................................. 6 1.1 Stage 2 .................................................................................................................. 6 1.2
2 Rationale and data underpinning site classification ................................................ 7 Data collection – defining the abundance of species supported by the Morecambe Bay 2.1
and Duddon Estuary pSPA .................................................................................... 8 Defining the marine extension area to inform the boundary of Morecambe Bay and 2.2
Duddon Estuary pSPA ........................................................................................... 9 2.2.1 Identification of important marine areas for larger terns ............................................. 9
2.2.2 Identification of important marine areas for little tern ................................................ 13
3 Boundary Description .......................................................................................... 15 Seaward boundary of the pSPA ........................................................................... 15 3.1 Landward boundary of the pSPA ......................................................................... 15 3.2
4 Location and Habitats .......................................................................................... 16 5 Assessment of Ornithological Interest .................................................................. 17
Survey Information and summary ........................................................................ 17 5.1 Annex I species ................................................................................................... 17 5.2
5.2.2 Non-breeding season .............................................................................................. 19
Regularly occurring migratory species ................................................................. 21 5.35.3.1 Breeding season ...................................................................................................... 21
5.3.2 Non-breeding season .............................................................................................. 22
Potential qualifying features not recommended for inclusion ............................... 25 5.4 Assemblages ....................................................................................................... 26 5.5
5.5.1 Seabird assemblage ................................................................................................ 26
5.5.2 Waterbird assemblage ............................................................................................. 26
6 Comparison with other sites in the UK ................................................................. 27 7 Conclusion ........................................................................................................... 28 8 References .......................................................................................................... 28 Annex 1 Boundary Maps ..................................................................................................... 31 Annex 2 Site Citation .......................................................................................................... 34 Annex 3 Sources of bird data .............................................................................................. 37 Annex 4 Defining little tern foraging areas and seaward boundary .................................... 38 1. Background and overview ................................................................................... 38 2. Data collection ..................................................................................................... 38
2.1. Seaward extent of little tern distribution (boat-based survey) ............................... 38 2.2. Alongshore extent of little tern distribution (shore-based surveys) ....................... 39
3. Data analysis ....................................................................................................... 39 3.1. Site-specific options ............................................................................................. 39 3.2. Generic options ................................................................................................... 40
4. Boundary delineation ........................................................................................... 43 Annex 5 Defining larger tern foraging areas and seaward boundary .................................. 47 2. Data collection ..................................................................................................... 47 3. Data preparation and analysis ............................................................................. 48 4. Boundary Delineation .......................................................................................... 55 Annex 6 Implementation of Natural England Evidence Standards ....................................... 60 Annex 7 Data used in Departmental Brief ........................................................................... 70
Final Pre Formal Consultation DB Morecambe Bay and Duddon Estuary SPA Departmental Brief. Page 3 of 74 January 2016
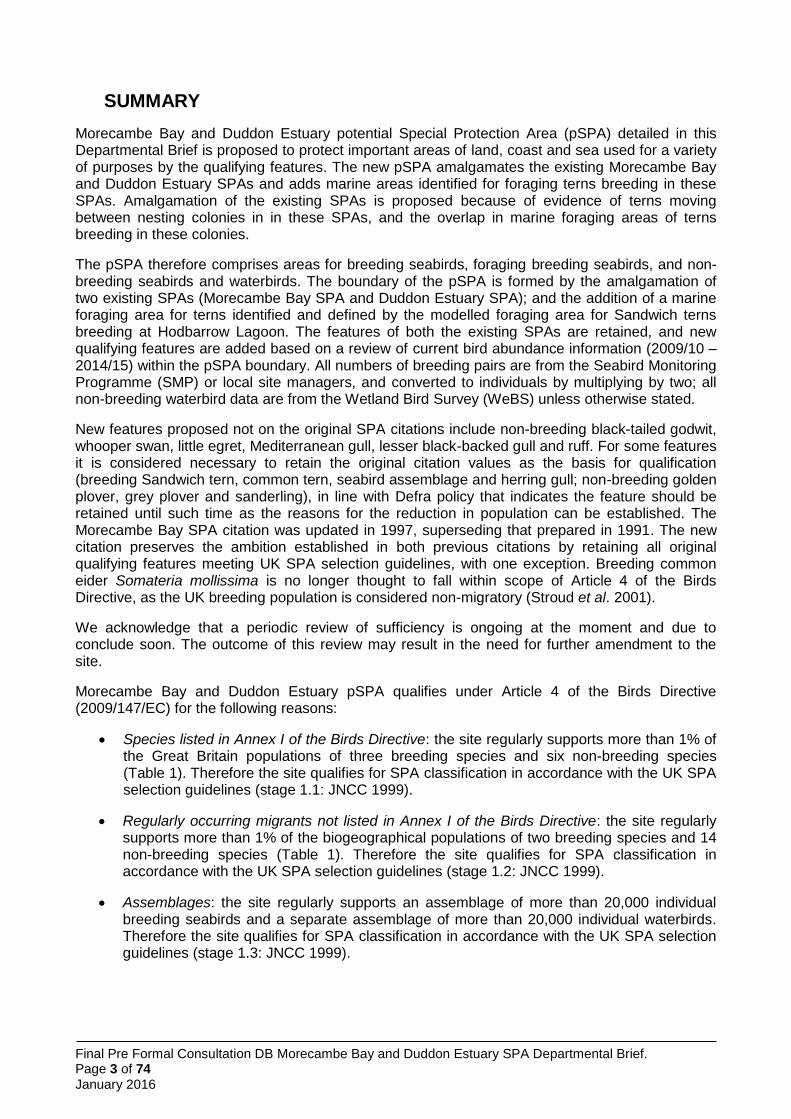
SUMMARY
Morecambe Bay and Duddon Estuary potential Special Protection Area (pSPA) detailed in this Departmental Brief is proposed to protect important areas of land, coast and sea used for a variety of purposes by the qualifying features. The new pSPA amalgamates the existing Morecambe Bay and Duddon Estuary SPAs and adds marine areas identified for foraging terns breeding in these SPAs. Amalgamation of the existing SPAs is proposed because of evidence of terns moving between nesting colonies in in these SPAs, and the overlap in marine foraging areas of terns breeding in these colonies.
The pSPA therefore comprises areas for breeding seabirds, foraging breeding seabirds, and non-breeding seabirds and waterbirds. The boundary of the pSPA is formed by the amalgamation of two existing SPAs (Morecambe Bay SPA and Duddon Estuary SPA); and the addition of a marine foraging area for terns identified and defined by the modelled foraging area for Sandwich terns breeding at Hodbarrow Lagoon. The features of both the existing SPAs are retained, and new qualifying features are added based on a review of current bird abundance information (2009/10 – 2014/15) within the pSPA boundary. All numbers of breeding pairs are from the Seabird Monitoring Programme (SMP) or local site managers, and converted to individuals by multiplying by two; all non-breeding waterbird data are from the Wetland Bird Survey (WeBS) unless otherwise stated.
New features proposed not on the original SPA citations include non-breeding black-tailed godwit, whooper swan, little egret, Mediterranean gull, lesser black-backed gull and ruff. For some features it is considered necessary to retain the original citation values as the basis for qualification (breeding Sandwich tern, common tern, seabird assemblage and herring gull; non-breeding golden plover, grey plover and sanderling), in line with Defra policy that indicates the feature should be retained until such time as the reasons for the reduction in population can be established. The Morecambe Bay SPA citation was updated in 1997, superseding that prepared in 1991. The new citation preserves the ambition established in both previous citations by retaining all original qualifying features meeting UK SPA selection guidelines, with one exception. Breeding common eider Somateria mollissima is no longer thought to fall within scope of Article 4 of the Birds Directive, as the UK breeding population is considered non-migratory (Stroud et al. 2001).
We acknowledge that a periodic review of sufficiency is ongoing at the moment and due to conclude soon. The outcome of this review may result in the need for further amendment to the site.
Morecambe Bay and Duddon Estuary pSPA qualifies under Article 4 of the Birds Directive (2009/147/EC) for the following reasons:
Species listed in Annex I of the Birds Directive: the site regularly supports more than 1% of the Great Britain populations of three breeding species and six non-breeding species (Table 1). Therefore the site qualifies for SPA classification in accordance with the UK SPA selection guidelines (stage 1.1: JNCC 1999).
Regularly occurring migrants not listed in Annex I of the Birds Directive: the site regularly supports more than 1% of the biogeographical populations of two breeding species and 14 non-breeding species (Table 1). Therefore the site qualifies for SPA classification in accordance with the UK SPA selection guidelines (stage 1.2: JNCC 1999).
Assemblages: the site regularly supports an assemblage of more than 20,000 individual breeding seabirds and a separate assemblage of more than 20,000 individual waterbirds. Therefore the site qualifies for SPA classification in accordance with the UK SPA selection guidelines (stage 1.3: JNCC 1999).
Final Pre Formal Consultation DB Morecambe Bay and Duddon Estuary SPA Departmental Brief. Page 4 of 74 January 2016
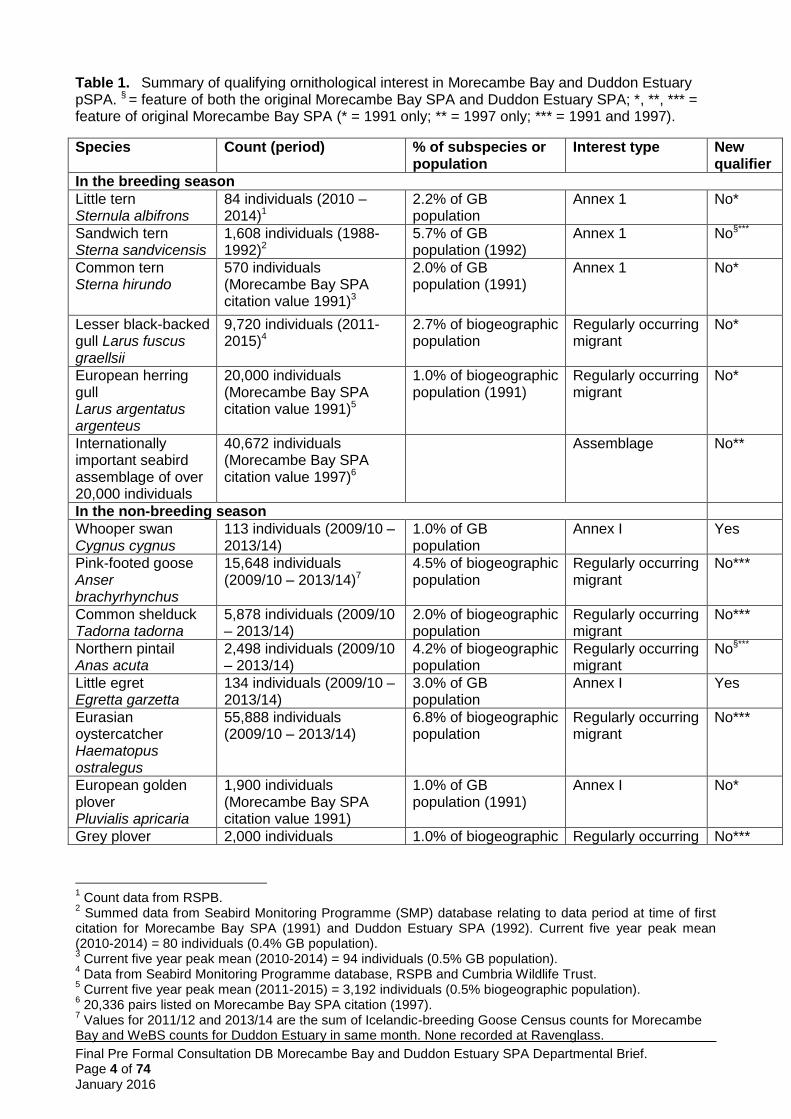
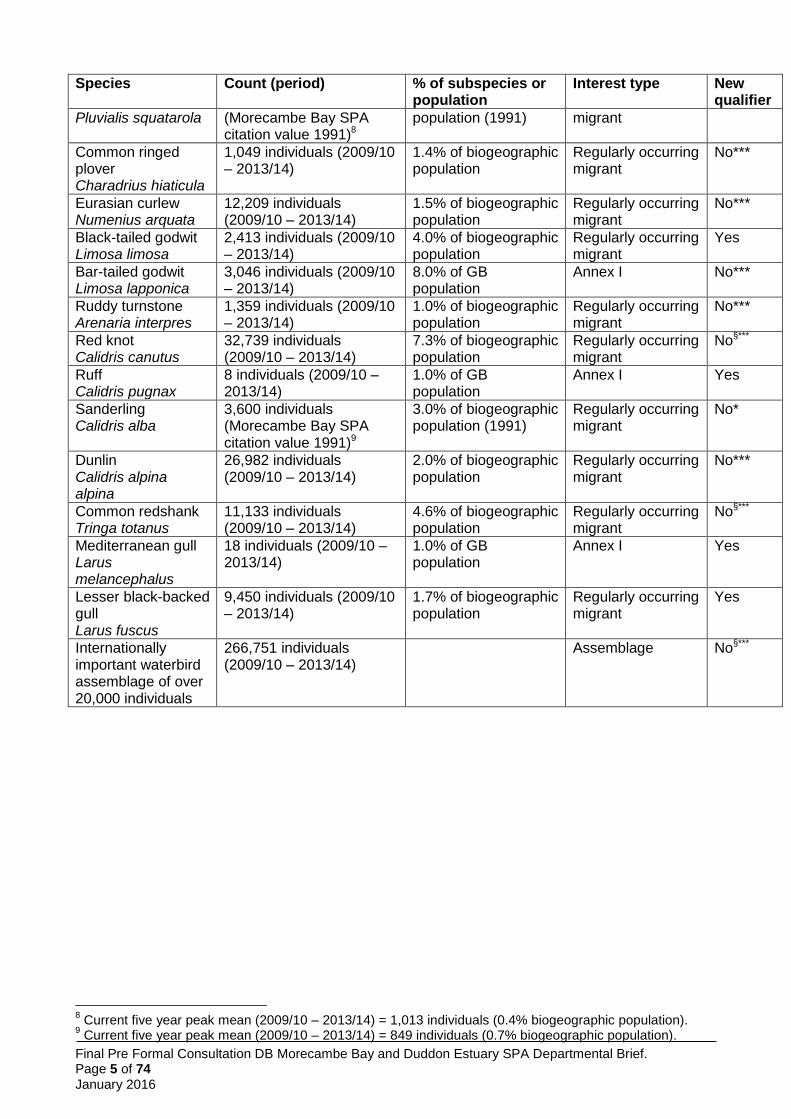
Table 1. Summary of qualifying ornithological interest in Morecambe Bay and Duddon Estuary pSPA. § = feature of both the original Morecambe Bay SPA and Duddon Estuary SPA; *, **, *** = feature of original Morecambe Bay SPA (* = 1991 only; ** = 1997 only; *** = 1991 and 1997).
Species Count (period) % of subspecies or population
Interest type New qualifier
In the breeding season
Little tern Sternula albifrons
84 individuals (2010 – 2014)1
2.2% of GB population
Annex 1 No*
Sandwich tern Sterna sandvicensis
1,608 individuals (1988-1992)2
5.7% of GB population (1992)
Annex 1
No§***
Common tern Sterna hirundo
570 individuals (Morecambe Bay SPA citation value 1991)3
2.0% of GB population (1991)
Annex 1
No*
Lesser black-backed gull Larus fuscus graellsii
9,720 individuals (2011-2015)4
2.7% of biogeographic population
Regularly occurring migrant
No*
European herring gull Larus argentatus argenteus
20,000 individuals (Morecambe Bay SPA citation value 1991)5
1.0% of biogeographic population (1991)
Regularly occurring migrant
No*
Internationally important seabird assemblage of over 20,000 individuals
40,672 individuals (Morecambe Bay SPA citation value 1997)6
Assemblage No**
In the non-breeding season
Whooper swan Cygnus cygnus
113 individuals (2009/10 – 2013/14)
1.0% of GB population
Annex I Yes
Pink-footed goose Anser brachyrhynchus
15,648 individuals (2009/10 – 2013/14)7
4.5% of biogeographic population
Regularly occurring migrant
No***
Common shelduck Tadorna tadorna
5,878 individuals (2009/10 – 2013/14)
2.0% of biogeographic population
Regularly occurring migrant
No***
Northern pintail Anas acuta
2,498 individuals (2009/10 – 2013/14)
4.2% of biogeographic population
Regularly occurring migrant
No§***
Little egret Egretta garzetta
134 individuals (2009/10 – 2013/14)
3.0% of GB population
Annex I Yes
Eurasian oystercatcher Haematopus ostralegus
55,888 individuals (2009/10 – 2013/14)
6.8% of biogeographic population
Regularly occurring migrant
No***
European golden plover Pluvialis apricaria
1,900 individuals (Morecambe Bay SPA citation value 1991)
1.0% of GB population (1991)
Annex I
No*
Grey plover 2,000 individuals 1.0% of biogeographic Regularly occurring No***
1 Count data from RSPB.
2 Summed data from Seabird Monitoring Programme (SMP) database relating to data period at time of first
citation for Morecambe Bay SPA (1991) and Duddon Estuary SPA (1992). Current five year peak mean (2010-2014) = 80 individuals (0.4% GB population). 3 Current five year peak mean (2010-2014) = 94 individuals (0.5% GB population).
4 Data from Seabird Monitoring Programme database, RSPB and Cumbria Wildlife Trust.
5 Current five year peak mean (2011-2015) = 3,192 individuals (0.5% biogeographic population).
6 20,336 pairs listed on Morecambe Bay SPA citation (1997).
7 Values for 2011/12 and 2013/14 are the sum of Icelandic-breeding Goose Census counts for Morecambe
Bay and WeBS counts for Duddon Estuary in same month. None recorded at Ravenglass.
Final Pre Formal Consultation DB Morecambe Bay and Duddon Estuary SPA Departmental Brief. Page 5 of 74 January 2016
Species Count (period) % of subspecies or population
Interest type New qualifier
Pluvialis squatarola (Morecambe Bay SPA citation value 1991)8
population (1991) migrant
Common ringed plover Charadrius hiaticula
1,049 individuals (2009/10 – 2013/14)
1.4% of biogeographic population
Regularly occurring migrant
No***
Eurasian curlew Numenius arquata
12,209 individuals (2009/10 – 2013/14)
1.5% of biogeographic population
Regularly occurring migrant
No***
Black-tailed godwit Limosa limosa
2,413 individuals (2009/10 – 2013/14)
4.0% of biogeographic population
Regularly occurring migrant
Yes
Bar-tailed godwit Limosa lapponica
3,046 individuals (2009/10 – 2013/14)
8.0% of GB population
Annex I No***
Ruddy turnstone Arenaria interpres
1,359 individuals (2009/10 – 2013/14)
1.0% of biogeographic population
Regularly occurring migrant
No***
Red knot Calidris canutus
32,739 individuals (2009/10 – 2013/14)
7.3% of biogeographic population
Regularly occurring migrant
No§***
Ruff Calidris pugnax
8 individuals (2009/10 – 2013/14)
1.0% of GB population
Annex I Yes
Sanderling Calidris alba
3,600 individuals (Morecambe Bay SPA citation value 1991)9
3.0% of biogeographic population (1991)
Regularly occurring migrant
No*
Dunlin Calidris alpina alpina
26,982 individuals (2009/10 – 2013/14)
2.0% of biogeographic population
Regularly occurring migrant
No***
Common redshank Tringa totanus
11,133 individuals (2009/10 – 2013/14)
4.6% of biogeographic population
Regularly occurring migrant
No§***
Mediterranean gull Larus melancephalus
18 individuals (2009/10 – 2013/14)
1.0% of GB population
Annex I Yes
Lesser black-backed gull Larus fuscus
9,450 individuals (2009/10 – 2013/14)
1.7% of biogeographic population
Regularly occurring migrant
Yes
Internationally important waterbird assemblage of over 20,000 individuals
266,751 individuals (2009/10 – 2013/14)
Assemblage No§***
8 Current five year peak mean (2009/10 – 2013/14) = 1,013 individuals (0.4% biogeographic population).
9 Current five year peak mean (2009/10 – 2013/14) = 849 individuals (0.7% biogeographic population).
Final Pre Formal Consultation DB Morecambe Bay and Duddon Estuary SPA Departmental Brief. Page 6 of 74 January 2016
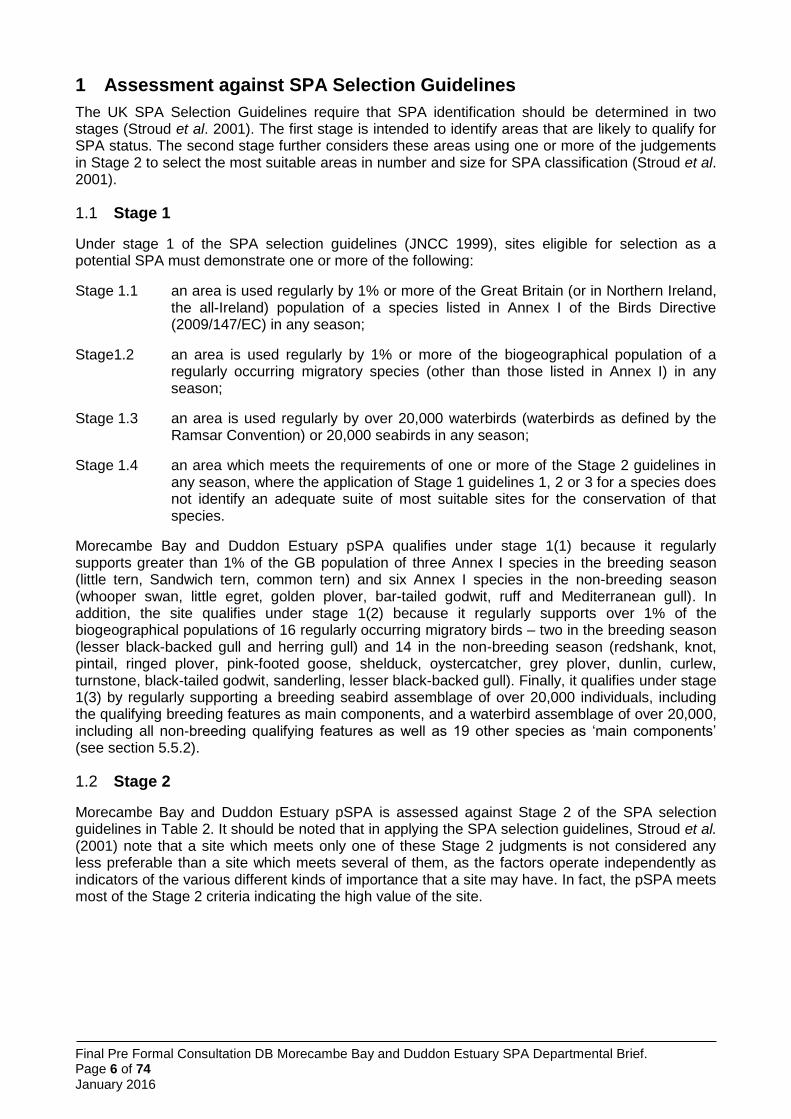
1 Assessment against SPA Selection Guidelines
The UK SPA Selection Guidelines require that SPA identification should be determined in two stages (Stroud et al. 2001). The first stage is intended to identify areas that are likely to qualify for SPA status. The second stage further considers these areas using one or more of the judgements in Stage 2 to select the most suitable areas in number and size for SPA classification (Stroud et al. 2001).
Stage 1 1.1
Under stage 1 of the SPA selection guidelines (JNCC 1999), sites eligible for selection as a potential SPA must demonstrate one or more of the following:
Stage 1.1 an area is used regularly by 1% or more of the Great Britain (or in Northern Ireland, the all-Ireland) population of a species listed in Annex I of the Birds Directive (2009/147/EC) in any season;
Stage1.2 an area is used regularly by 1% or more of the biogeographical population of a regularly occurring migratory species (other than those listed in Annex I) in any season;
Stage 1.3 an area is used regularly by over 20,000 waterbirds (waterbirds as defined by the Ramsar Convention) or 20,000 seabirds in any season;
Stage 1.4 an area which meets the requirements of one or more of the Stage 2 guidelines in any season, where the application of Stage 1 guidelines 1, 2 or 3 for a species does not identify an adequate suite of most suitable sites for the conservation of that species.
Morecambe Bay and Duddon Estuary pSPA qualifies under stage 1(1) because it regularly supports greater than 1% of the GB population of three Annex I species in the breeding season (little tern, Sandwich tern, common tern) and six Annex I species in the non-breeding season (whooper swan, little egret, golden plover, bar-tailed godwit, ruff and Mediterranean gull). In addition, the site qualifies under stage 1(2) because it regularly supports over 1% of the biogeographical populations of 16 regularly occurring migratory birds – two in the breeding season (lesser black-backed gull and herring gull) and 14 in the non-breeding season (redshank, knot, pintail, ringed plover, pink-footed goose, shelduck, oystercatcher, grey plover, dunlin, curlew, turnstone, black-tailed godwit, sanderling, lesser black-backed gull). Finally, it qualifies under stage 1(3) by regularly supporting a breeding seabird assemblage of over 20,000 individuals, including the qualifying breeding features as main components, and a waterbird assemblage of over 20,000, including all non-breeding qualifying features as well as 19 other species as ‘main components’ (see section 5.5.2).
Stage 2 1.2
Morecambe Bay and Duddon Estuary pSPA is assessed against Stage 2 of the SPA selection guidelines in Table 2. It should be noted that in applying the SPA selection guidelines, Stroud et al. (2001) note that a site which meets only one of these Stage 2 judgments is not considered any less preferable than a site which meets several of them, as the factors operate independently as indicators of the various different kinds of importance that a site may have. In fact, the pSPA meets most of the Stage 2 criteria indicating the high value of the site.
Final Pre Formal Consultation DB Morecambe Bay and Duddon Estuary SPA Departmental Brief. Page 7 of 74 January 2016
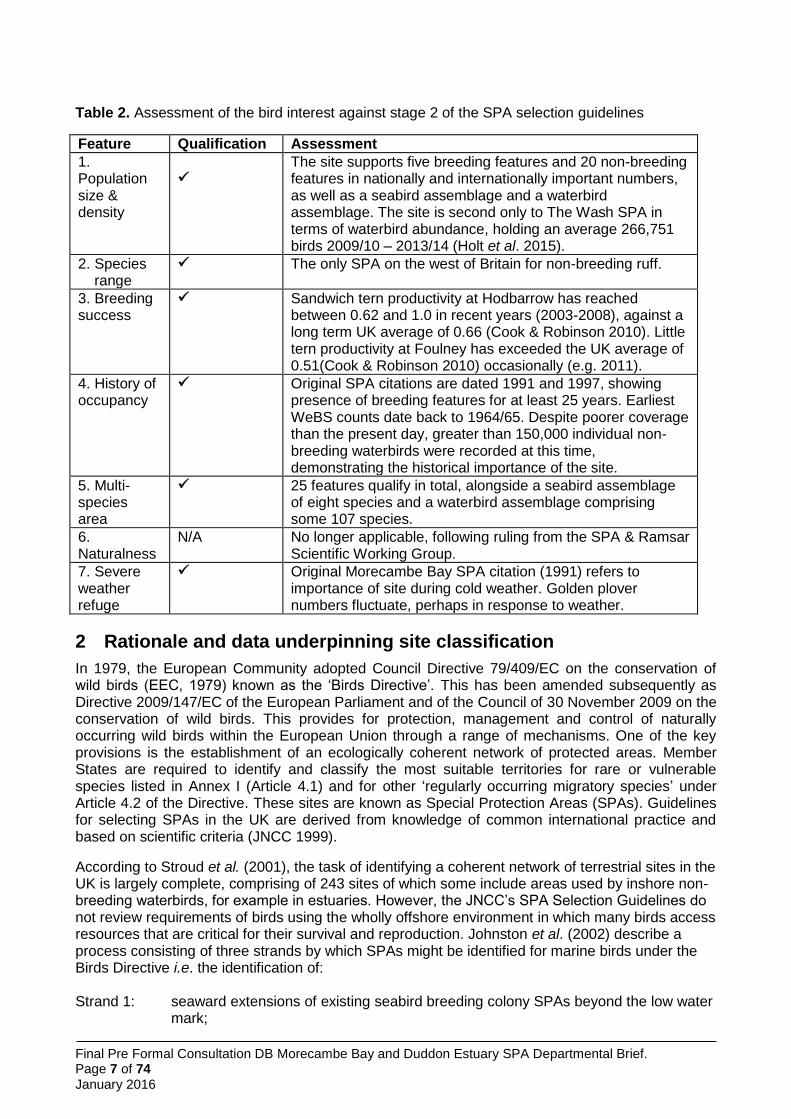
Table 2. Assessment of the bird interest against stage 2 of the SPA selection guidelines
Feature Qualification Assessment
1. Population size & density
The site supports five breeding features and 20 non-breeding features in nationally and internationally important numbers, as well as a seabird assemblage and a waterbird assemblage. The site is second only to The Wash SPA in terms of waterbird abundance, holding an average 266,751 birds 2009/10 – 2013/14 (Holt et al. 2015).
2. Species range
The only SPA on the west of Britain for non-breeding ruff.
3. Breeding success
Sandwich tern productivity at Hodbarrow has reached between 0.62 and 1.0 in recent years (2003-2008), against a long term UK average of 0.66 (Cook & Robinson 2010). Little tern productivity at Foulney has exceeded the UK average of 0.51(Cook & Robinson 2010) occasionally (e.g. 2011).
4. History of occupancy
Original SPA citations are dated 1991 and 1997, showing presence of breeding features for at least 25 years. Earliest WeBS counts date back to 1964/65. Despite poorer coverage than the present day, greater than 150,000 individual non-breeding waterbirds were recorded at this time, demonstrating the historical importance of the site.
5. Multi-species area
25 features qualify in total, alongside a seabird assemblage of eight species and a waterbird assemblage comprising some 107 species.
6. Naturalness
N/A No longer applicable, following ruling from the SPA & Ramsar Scientific Working Group.
7. Severe weather refuge
Original Morecambe Bay SPA citation (1991) refers to importance of site during cold weather. Golden plover numbers fluctuate, perhaps in response to weather.
2 Rationale and data underpinning site classification
In 1979, the European Community adopted Council Directive 79/409/EC on the conservation of wild birds (EEC, 1979) known as the ‘Birds Directive’. This has been amended subsequently as Directive 2009/147/EC of the European Parliament and of the Council of 30 November 2009 on the conservation of wild birds. This provides for protection, management and control of naturally occurring wild birds within the European Union through a range of mechanisms. One of the key provisions is the establishment of an ecologically coherent network of protected areas. Member States are required to identify and classify the most suitable territories for rare or vulnerable species listed in Annex I (Article 4.1) and for other ‘regularly occurring migratory species’ under Article 4.2 of the Directive. These sites are known as Special Protection Areas (SPAs). Guidelines for selecting SPAs in the UK are derived from knowledge of common international practice and based on scientific criteria (JNCC 1999).
According to Stroud et al. (2001), the task of identifying a coherent network of terrestrial sites in the UK is largely complete, comprising of 243 sites of which some include areas used by inshore non-breeding waterbirds, for example in estuaries. However, the JNCC’s SPA Selection Guidelines do not review requirements of birds using the wholly offshore environment in which many birds access resources that are critical for their survival and reproduction. Johnston et al. (2002) describe a process consisting of three strands by which SPAs might be identified for marine birds under the Birds Directive i.e. the identification of: Strand 1: seaward extensions of existing seabird breeding colony SPAs beyond the low water
mark;

Final Pre Formal Consultation DB Morecambe Bay and Duddon Estuary SPA Departmental Brief. Page 8 of 74 January 2016
Strand 2: inshore feeding areas used by concentrations of birds (e.g. seaduck, grebes and divers) in the non-breeding season; and
Strand 3: offshore areas for seabirds, probably for feeding but also for other purposes. Since then, a fourth strand was added to the work conducted by the Joint Nature Conservation Committee (JNCC) to address the need for: Strand 4 other types of SPA http://jncc.defra.gov.uk/page-4184 that would identify some
important areas for marine birds that may not be included within the above three categories and will be considered individually.
Within the UK there are currently 57 breeding colony SPAs where at least one species of tern (Arctic Sterna paradisaea, common S. hirundo, Sandwich S. sandvicensis, roseate S. dougallii or little tern Sternula albifrons) is protected. Since 2007, Joint Nature Conservation Committee (JNCC) has been working with Natural England to identify additional marine areas for terns as, given their likely spatial extent, these cannot be addressed simply by application of the generic “maintenance” extensions approach (strand 1). This work therefore sits under strand 4 above.
Because of the tendency for little terns to move between nesting colonies at Morecambe Bay SPA and the Duddon Estuary SPA, and because of the likely overlap in marine foraging areas of terns nesting in the existing SPAs, it is proposed to combine the existing classifications with an additional marine extension for foraging terns. This new composite site supersedes the existing, individual, Morecambe Bay and Duddon Estuary SPAs. Here, all of the information supporting the review and identification of qualifying features of the new Morecambe Bay & Duddon Estuary SPA is presented, including breeding features such as terns and gulls as well as non-breeding waterbirds. The definition of proposed boundaries according to marine foraging areas for breeding terns is also explained.
Before a site is fully classified as an SPA, it is known as a potential SPA (pSPA) once formal consultation has commenced following Ministerial approval. Sites currently under consideration include both new sites and existing sites which are either being extended or having new features added. For the purpose of clarity in departmental briefs for this suite of work, sites are referred to as “SPA” when referring to the existing classification. Where reference is made to the extended site or the site including new features being proposed it will be referred to as pSPA since this additional extent or feature is not yet fully classified.
Data collection – defining the abundance of species supported by the 2.1Morecambe Bay and Duddon Estuary pSPA
Abundances of each of the species using the Morecambe Bay and Duddon Estuary pSPA were derived from most current data, using land-based count methods. For breeding seabirds, data are the most recently available from the national Seabird Monitoring Programme (SMP) database (http://jncc.defra.gov.uk/smp/). In some cases, this dataset has been augmented by information requested directly from colony managers (RSPB for Hodbarrow / Duddon Estuary and Cumbria Wildlife Trust for colonies within Morecambe Bay).
All data on non-breeding birds comes from the Wetland Bird Survey
(WeBS:http://blx1.bto.org/webs-reporting/), with some supplementary counts of pink-footed and
greylag geese from Wildlife and Wetlands Trust’s (WWT’s) Icelandic-breeding Goose Census
(IGC) (Mitchell 2014 http://monitoring.wwt.org.uk/our-work/goose-swan-monitoring-
programme/reports-newsletter/). No population estimates were available for the part of the
boundary beyond the visible limit and thus not covered by WeBS (but potentially covered, for
example, by aerial surveys); neither were suitable data available for the coastal stretch between
(approximately) Haverigg and Eskmeals Range, which lies outside WeBS count sector boundaries
covering the Duddon and Ravenglass estuaries. Such data are expected to increase abundance
Final Pre Formal Consultation DB Morecambe Bay and Duddon Estuary SPA Departmental Brief. Page 9 of 74 January 2016
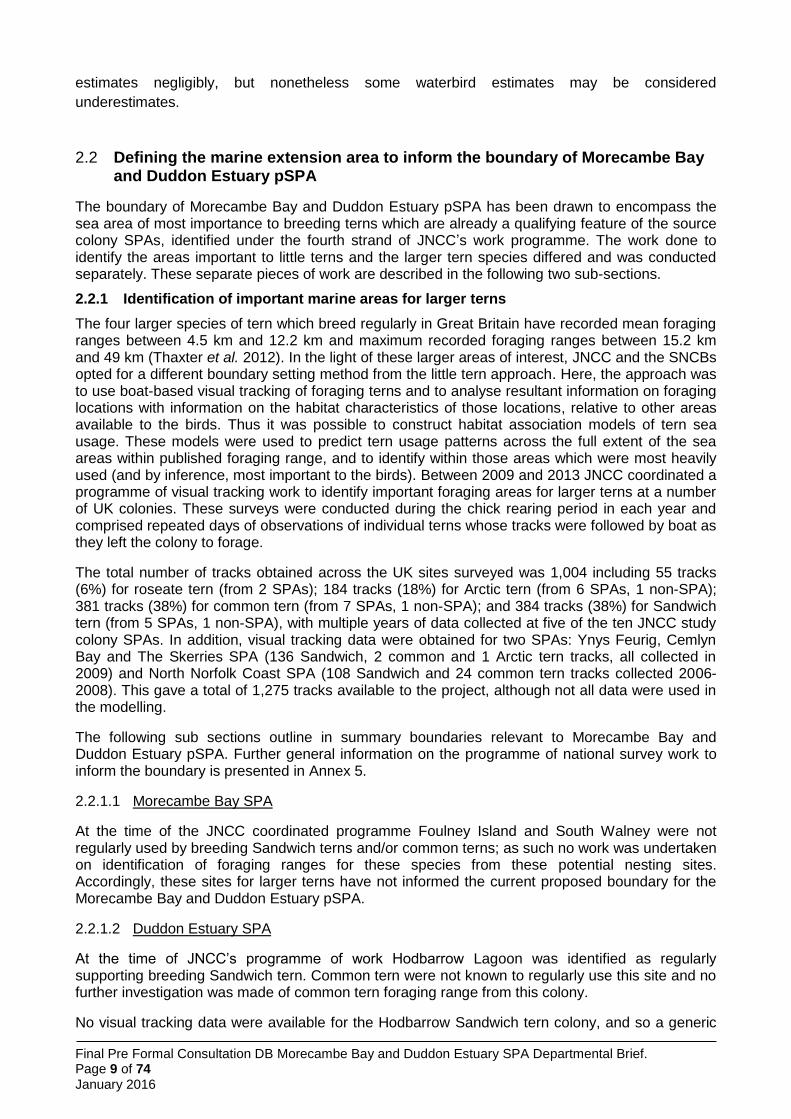
estimates negligibly, but nonetheless some waterbird estimates may be considered
underestimates.
Defining the marine extension area to inform the boundary of Morecambe Bay 2.2and Duddon Estuary pSPA
The boundary of Morecambe Bay and Duddon Estuary pSPA has been drawn to encompass the sea area of most importance to breeding terns which are already a qualifying feature of the source colony SPAs, identified under the fourth strand of JNCC’s work programme. The work done to identify the areas important to little terns and the larger tern species differed and was conducted separately. These separate pieces of work are described in the following two sub-sections.
2.2.1 Identification of important marine areas for larger terns
The four larger species of tern which breed regularly in Great Britain have recorded mean foraging ranges between 4.5 km and 12.2 km and maximum recorded foraging ranges between 15.2 km and 49 km (Thaxter et al. 2012). In the light of these larger areas of interest, JNCC and the SNCBs opted for a different boundary setting method from the little tern approach. Here, the approach was to use boat-based visual tracking of foraging terns and to analyse resultant information on foraging locations with information on the habitat characteristics of those locations, relative to other areas available to the birds. Thus it was possible to construct habitat association models of tern sea usage. These models were used to predict tern usage patterns across the full extent of the sea areas within published foraging range, and to identify within those areas which were most heavily used (and by inference, most important to the birds). Between 2009 and 2013 JNCC coordinated a programme of visual tracking work to identify important foraging areas for larger terns at a number of UK colonies. These surveys were conducted during the chick rearing period in each year and comprised repeated days of observations of individual terns whose tracks were followed by boat as they left the colony to forage.
The total number of tracks obtained across the UK sites surveyed was 1,004 including 55 tracks (6%) for roseate tern (from 2 SPAs); 184 tracks (18%) for Arctic tern (from 6 SPAs, 1 non-SPA); 381 tracks (38%) for common tern (from 7 SPAs, 1 non-SPA); and 384 tracks (38%) for Sandwich tern (from 5 SPAs, 1 non-SPA), with multiple years of data collected at five of the ten JNCC study colony SPAs. In addition, visual tracking data were obtained for two SPAs: Ynys Feurig, Cemlyn Bay and The Skerries SPA (136 Sandwich, 2 common and 1 Arctic tern tracks, all collected in 2009) and North Norfolk Coast SPA (108 Sandwich and 24 common tern tracks collected 2006-2008). This gave a total of 1,275 tracks available to the project, although not all data were used in the modelling.
The following sub sections outline in summary boundaries relevant to Morecambe Bay and Duddon Estuary pSPA. Further general information on the programme of national survey work to inform the boundary is presented in Annex 5.
2.2.1.1 Morecambe Bay SPA
At the time of the JNCC coordinated programme Foulney Island and South Walney were not regularly used by breeding Sandwich terns and/or common terns; as such no work was undertaken on identification of foraging ranges for these species from these potential nesting sites. Accordingly, these sites for larger terns have not informed the current proposed boundary for the Morecambe Bay and Duddon Estuary pSPA.
2.2.1.2 Duddon Estuary SPA
At the time of JNCC’s programme of work Hodbarrow Lagoon was identified as regularly supporting breeding Sandwich tern. Common tern were not known to regularly use this site and no further investigation was made of common tern foraging range from this colony.
No visual tracking data were available for the Hodbarrow Sandwich tern colony, and so a generic

Final Pre Formal Consultation DB Morecambe Bay and Duddon Estuary SPA Departmental Brief. Page 10 of 74 January 2016
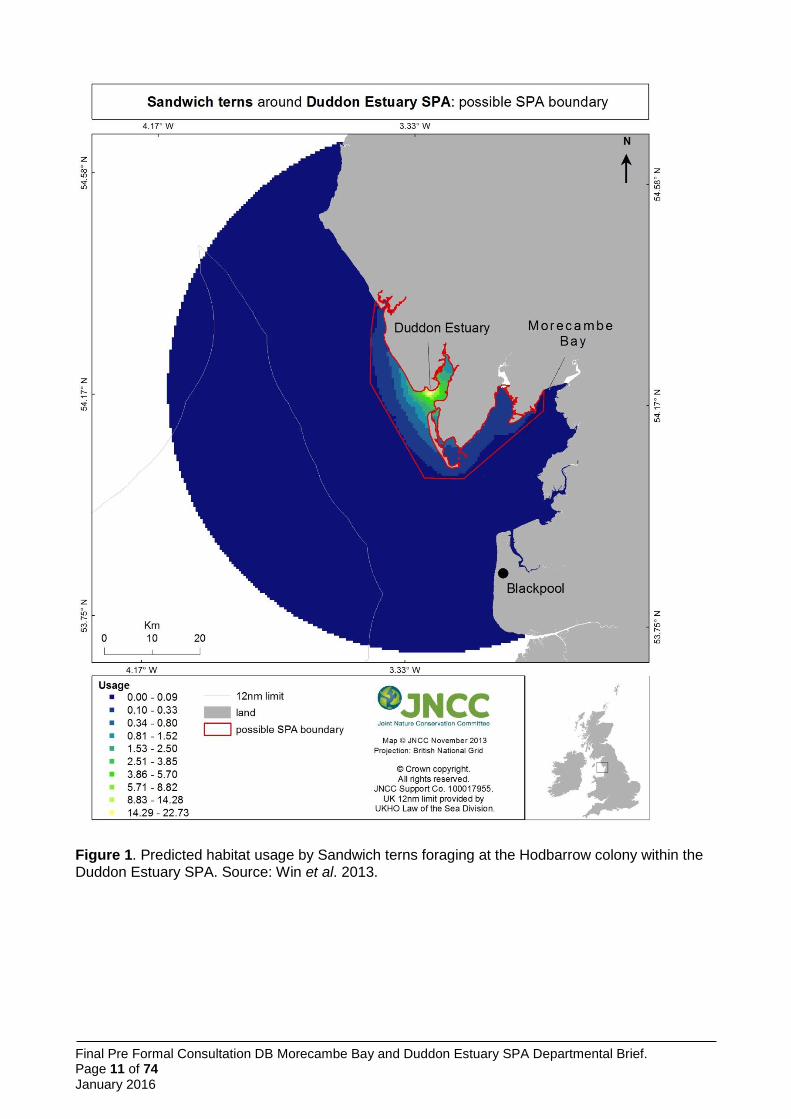
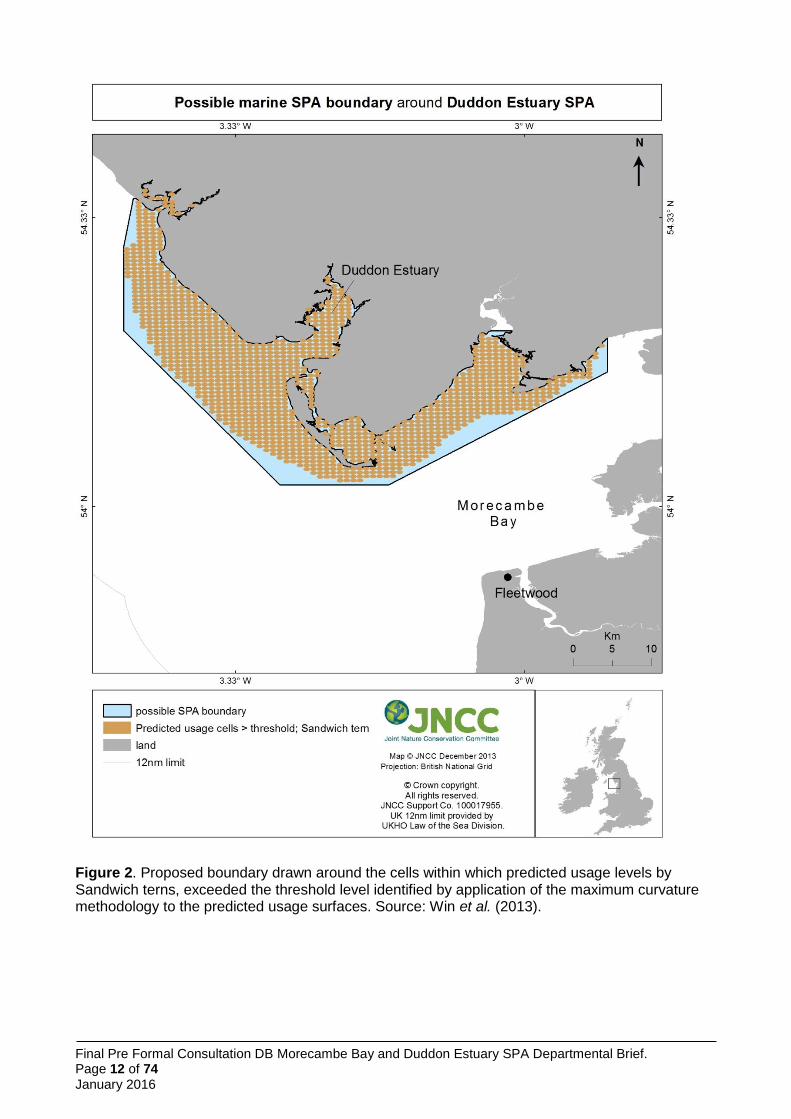
model using maximum curvature thresholds was applied to define the boundary of foraging areas (Wilson et al. 2014) (Figure 2). Predicted usage was greatest in the vicinity of the colony (Figure 1), although cells exceeding the threshold were spread more widely (Figure 1).
Although numbers of breeding pairs of Sandwich terns at the Duddon Estuary SPA have declined since the modelling work, information from site managers indicates that terns still prospect to breed (e.g. 300 individuals in June 2014 and 220 in June 2015; RSPB pers. comm.). The modelled foraging extension is thus proposed for Sandwich terns, as we expect the terns to continue to attempt to breed at the site. The aim is for successful breeding, which will require provision of food to chicks and adults.
The boundary is not influenced by the requirements of foraging common terns, despite their retention as a qualifying feature from the original Morecambe Bay SPA. This is because current breeding numbers are below the relevant qualifying threshold and management action may be required to restore the feature. If this proves successful, common terns will still be protected within their foraging area (despite a lack of specific marine boundary for that foraging area – as functionally linked habitat must be considered for conservation of SPA features), and further survey or modelling work may be considered worthwhile at that stage to provide evidence in support of marine foraging extension boundary amendment.
Final Pre Formal Consultation DB Morecambe Bay and Duddon Estuary SPA Departmental Brief. Page 11 of 74 January 2016
Figure 1. Predicted habitat usage by Sandwich terns foraging at the Hodbarrow colony within the Duddon Estuary SPA. Source: Win et al. 2013.
Final Pre Formal Consultation DB Morecambe Bay and Duddon Estuary SPA Departmental Brief. Page 12 of 74 January 2016
Figure 2. Proposed boundary drawn around the cells within which predicted usage levels by Sandwich terns, exceeded the threshold level identified by application of the maximum curvature methodology to the predicted usage surfaces. Source: Win et al. (2013).
Final Pre Formal Consultation DB Morecambe Bay and Duddon Estuary SPA Departmental Brief. Page 13 of 74 January 2016
2.2.2 Identification of important marine areas for little tern
Little terns are the smallest commonly breeding terns in Britain, and have the most limited foraging range. The mean range is 2.1 km, mean of recorded maxima is 6.3 km and the maximum ever recorded is 11 km (Thaxter et al. 2012). Using this evidence, JNCC and the Statutory Nature Conservation Bodies (SNCBs) decided the most effective method of determining the most heavily used foraging areas of breeding little terns was through shore- and boat-based observational surveys near to colonies, using the resultant distribution data directly in boundary setting of important foraging areas. Accordingly, between 2009 and 2013, JNCC coordinated surveys to identify these areas at a number of UK colonies. These took place during the chick rearing period in each year and comprised repeated shore-based counts of little terns seen at a series of observation stations at increasing distances from the colony locations, and repeated boat-based surveys along transects across the waters offshore from the colonies. These surveys sought to establish the distances both alongshore and offshore that little terns were travelling to feed.
In total, 70 shore-based surveys were undertaken at 14 little tern colonies around the UK with a total of 7,006 tern registrations at various points along the shore. Twenty-three boat-based surveys were undertaken in waters near eight colonies around the UK with a total of 781 tern registrations at various distances offshore.
Further general information on the little tern survey programme is presented in Annex 4.
2.2.2.1 Morecambe Bay
No boat-based surveys took place at Morecambe Bay SPA, but alongshore surveys did (Parsons et al. 2015).
Five shore-based surveys were undertaken at Morecambe Bay; two in 2012 and three in 2013. A total of 154 tern passes were recorded, but only one tern was seen in the three surveys in 2013 (possibly because it seems half of the colony nested at Hodbarrow that year; Annex 7). The maximum alongshore extent recorded was 7,000 m west and 2,000 m east of the colony at Foulney Island. However, due to the comparatively low number of tern sightings, this was assessed as insufficient to justify a fully site-specific approach to boundary definition. Thus the alongshore foraging extent was instead set to a site-specific value to the west of the colony, based on the majority of sightings occurring here, whilst the generic value derived from all of the surveys at all of the colonies i.e. 3,900 m was applied to the east, in the absence of more data.
No boat-based surveys were undertaken at Morecambe Bay SPA. Therefore, the seaward foraging extent was set to the generic seaward extent value derived from all of the surveys at all of the colonies, i.e. 2,176 m.
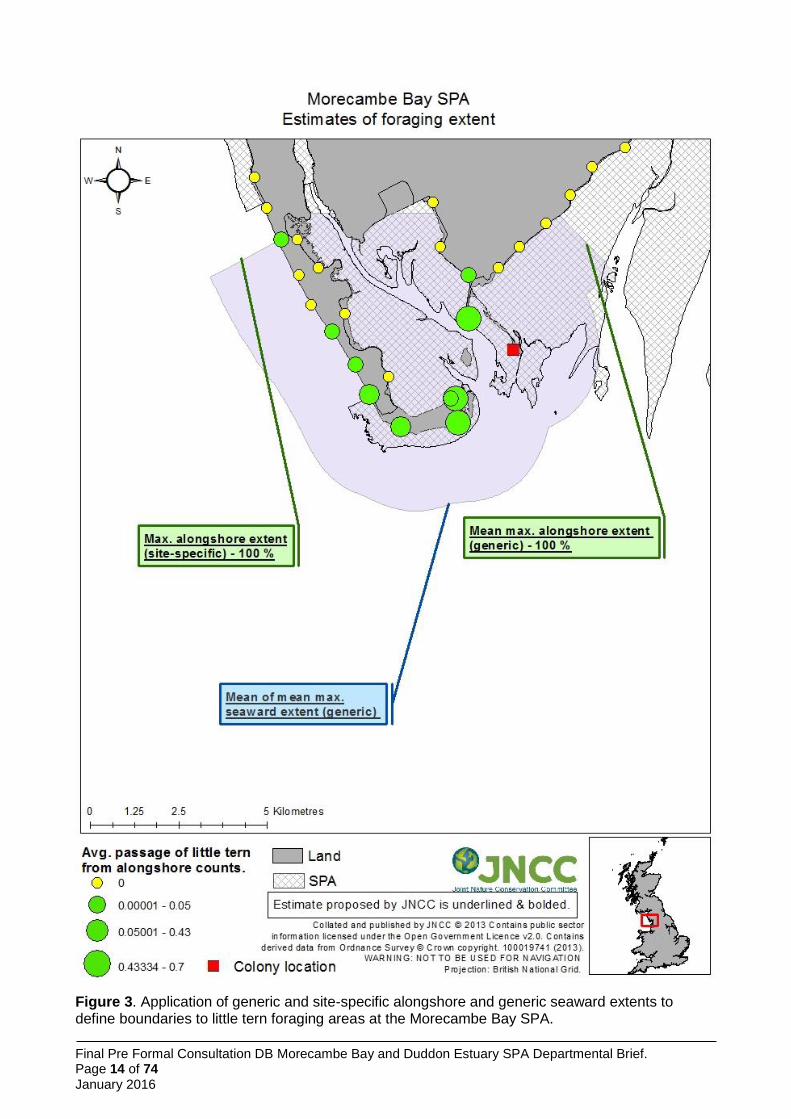
In summary, given the absence of site-specific information on seaward extent and of relatively sparse data for the alongshore extent, it is considered that identification of the sea areas most likely to be heavily used by birds from this colony is best based on a combination of site-specific alongshore extent to the west and the generic extents for seaward and eastward alongshore boundaries (Figure 3).
The little tern modelled foraging area does not inform the boundary of the Morecambe Bay & Duddon Estuary pSPA, as it sits entirely within the boundary identified from the larger tern analysis for Sandwich terns at Hodbarrow Lagoon.
Final Pre Formal Consultation DB Morecambe Bay and Duddon Estuary SPA Departmental Brief. Page 14 of 74 January 2016
Figure 3. Application of generic and site-specific alongshore and generic seaward extents to define boundaries to little tern foraging areas at the Morecambe Bay SPA.

Final Pre Formal Consultation DB Morecambe Bay and Duddon Estuary SPA Departmental Brief. Page 15 of 74 January 2016
2.2.2.2 Duddon Estuary
As little terns were not a feature of the Duddon Estuary SPA, no surveys of any type took place here during the JNCC coordinated survey programme in 2009 - 2013. No generic boundary has been identified for these birds using this colony and therefore does not inform the proposed boundary for Morecambe Bay and Duddon Estuary pSPA.
Should the generic extents of seaward and longshore foraging distance of little tern be applied to the Hodbarrow Lagoon colony, the foraging area of little terns, at this site falls within the pSPA boundary. Thus the proposed pSPA boundary affords protection to little terns foraging area despite no formal application of a foraging model.
3 Boundary Description
The boundary for the Morecambe Bay and Duddon Estuary pSPA is formed from the amalgamation of the existing boundaries of Morecambe Bay SPA and Duddon Estuary SPA (Annex 1, Figure 2) and the identified foraging area for Sandwich terns breeding at Hodbarrow Lagoon identified by Wilson et al. (2014) (Figure 1).
The total area of the proposed Morecambe Bay & Duddon Estuary pSPA is approximately 68,550 ha covering the intertidal areas of Morecambe Bay, Duddon Estuary and the Ravenglass Estuary together with the intervening Cumbria coast, and extending approximately up to 8 km seawards at its widest point, point D to Mean High Water (Annex 1, Figure 1 and 3).
Seaward boundary of the pSPA 3.1
The existing seaward boundary for Morecambe Bay SPA, from Wyre Estuary to north Morecambe Bay, remains unchanged and follows Mean Low Water (MLW) (Annex 1, Figure 3). In north Morecambe Bay, around Walney Island and along the Cumbria coast to the Ravenglass Estuary the seaward boundary follows the JNCC recommended boundary based on the modelled foraging area for Sandwich tern (Figure 1: Wilson et al. 2014).
Landward boundary of the pSPA 3.2
The landward boundary around the existing Morecambe Bay SPA and Duddon Estuary SPA remains unchanged (Annex 1, Figure 3). The boundary of the section of coastline previously outside the existing SPAs follows Mean High Water (MHW) as recommended by JNCC for Sandwich tern foraging requirements (Figure 1: Wilson et al. 2014). At the Port of Barrow, the boundary has been identified as a line between the north and south harbour wall at the entrance to the dock system.

Final Pre Formal Consultation DB Morecambe Bay and Duddon Estuary SPA Departmental Brief. Page 16 of 74 January 2016
4 Location and Habitats
The pSPA is sited within the Eastern Irish Sea and covers coastal and marine habitats around Morecambe Bay, Duddon Estuary and along the south west Cumbrian coast up to and including Ravenglass Estuary. The pSPA overlaps the designations listed in Table 3.
Table 3. Designations overlapping with or adjacent to Morecambe Bay and Duddon Estuary pSPA
Special Area of Conservation
(SAC)
Ramsar Sites of Special Scientific Interest
(SSSI)
Other
Within Morecambe Bay
Drigg Coast
Morecambe Bay
Duddon Estuary
Morecambe Bay
Lune Estuary
Wyre Estuary
South Walney and Piel Channel Flats
Duddon Estuary
Roudsea Woods and Mosses
Drigg Coast
Lake District National Park
Cumbria Coast Marine Conservation Zone
Arnside and Silverdale Area of Outstanding Beauty
Sandscale Haws National Nature Reserve (NNR)
North Walney NNR
Roudsea Woods and Mosses NNR
Drigg Dunes and Gullery Ravenglass Local Nature Reserve (LNR)
Adjacent Duddon Mosses SAC
Annaside
Annaside & Gutterby Banks
Arnside Knott
Barker Scar
Cockerham Marsh
Duddon Mosses
Far Arnside
Humphrey Head
Jack Scout
Meathop Woods & Quarry
Sea Wood
Shaw Meadow & Sea Pasture
Skelwith Hill
Leighton Moss
Millom Iron Works LNR
Duddon Mosses NNR
Morecambe Bay is the second largest embayment in Britain after The Wash, at over 310 km2, and has four estuaries – the Wyre, Lune, Kent and Leven. It contains the largest continuous area of intertidal mudflats and sandflats in the UK which supports a variety of infaunal communities including cockle beds. Morecambe Bay supports a wide range of other habitats including large areas of saltmarsh and transitional habitats as well as sand dune systems and coastal lagoons. Within the Bay there are areas of stony reef (known locally as scars or skears) which also support blue mussel beds and honeycomb worm Sabellaria alveolata reefs. Extensive intertidal eelgrass beds are present around Foulney Island and in the south Walney Channel, the only examples in the North West of England.
The Duddon and Ravenglass Estuaries support saltmarsh, intertidal mud and sand communities and sand dune systems with small areas of stony reef. The intervening coast comprises extensive shingle and sand beaches.
The offshore parts of the SPA are sandy and shallow, mostly less than 15 metres deep.

Final Pre Formal Consultation DB Morecambe Bay and Duddon Estuary SPA Departmental Brief. Page 17 of 74 January 2016
5 Assessment of Ornithological Interest
Survey Information and summary 5.1
In all cases, up-to-date data have been used to inform the classification, where available. This is to allow data for the two existing SPAs to be combined and to include data for new areas such as Ravenglass Estuary.
SPA site selection guidelines have been applied to the most up to date information for the site. However, these contemporary data reveal that some species are no longer present in qualifying numbers (either through declines or because the relevant threshold has increased). It is not clear whether anthropogenic influences have affected the populations at the site. Defra policy indicates that in these circumstances the feature should be retained until such time as the reasons for the reduction in population can be established. Natural England therefore considers that these species should be retained on the citation, and the level of ambition set out in the conservation objectives for these species maintained, until such time as we have evidence to support the conclusion that declines are a result of natural processes and that the SPA is no longer suitable for these species.
New qualifiers have emerged, but for some species it has been necessary to retain the original citation values as the basis for qualification, in line with the above (Table 1). Features not currently meeting qualification thresholds but previously doing so, and included on the citation prepared in 1991 have been included; this applies to common tern, herring gull, golden plover, grey plover and sanderling. One additional feature not currently meeting qualification thresholds but previously doing so, and included on the citation prepared in 1997, is also included: the seabird assemblage (greater than 20,000 individual breeding seabirds).
Counts of breeding seabirds at the colonies within the existing SPAs (which are also those most likely to be the origin of birds within the marine foraging areas of the pSPA) are from the national Seabird Monitoring Programme (SMP). This dataset has been augmented by information from colony managers (Cumbria Wildlife Trust and RSPB).
Details of the work carried out to characterise the foraging areas used by breeding adult terns originating from Morecambe Bay and Duddon Estuary pSPA are detailed in Annexes 4 and 5.
Data on non-breeding waterbirds is from the BTO/RSPB/JNCC Wetland Bird Survey (WeBS), the national monitoring scheme for these species, supplemented by data from WWT’s Icelandic-breeding Goose Census (Mitchell 2014). In calculating five-year peak means, all available data have been included. WeBS (e.g. Holt et al. 2015) now follows a convention of excluding ‘undercounts’ (i.e. surveys where the total number of birds was not considered representative of the actual number of birds likely to be present) from five year peak mean assessments, choosing to include only counts across the period that were considered complete. This convention was not followed here, primarily to avoid issues of inconsistency (i.e. it is not clear that this approach was followed in selecting other SPAs; it would lead to means based on variable numbers of count winters for different species; and for some species where all counts were considered undercounts it would lead to a single peak value being used for the citation) and to comply with the UK SPA selection guidelines which require assessment of the mean of maxima over at least five years (JNCC 1999). Therefore, some peak mean values may be underestimates. In many cases this is sufficient to show the site qualifies for that species.
Annex I species 5.2
Breeding Season
5.2.1.1 Little tern Sternula albifrons
The breeding population of little terns in Great Britain is estimated to be 1,900 pairs (Musgrove et al. 2013), representing about 10.3% of the Eastern Atlantic breeding population (18,500 pairs
derived by division by 3 of the upper estimate of 55,500 individuals: AEWA 2012). Breeding occurs
in scattered colonies along much of the east and west coasts of Britain, from the north of Scotland
Final Pre Formal Consultation DB Morecambe Bay and Duddon Estuary SPA Departmental Brief. Page 18 of 74 January 2016
to (and including) the south coast of England (Mitchell et al. 2004). The greater part of the population occurs in south and east England from Dorset to Norfolk (Mitchell et al. 2004). All British little terns nest on the coast, utilising sand and shingle beaches and spits, as well as tiny islets of sand or rock close inshore (Mitchell et al. 2004).
Little terns were a qualifying feature of the original Morecambe Bay SPA, holding 29 pairs according to the citation (1991). This represented 1% of the GB population at that time. Latest data (2010-2014) show the five year peak mean to have increased to 42 pairs (2.2% of GB population); this value includes birds nesting at Foulney Island (within the Morecambe Bay SPA), Hodbarrow and Haverigg Haws (within the Duddon Estuary SPA, where little terns were not included as a feature). The pSPA will thus offer protection to little terns that may move between nesting sites within the original SPAs in different years.
5.2.1.2 Sandwich tern Sterna sandvicensis
The breeding population of Sandwich terns in Great Britain is estimated to be 11,000 pairs (Musgrove et al. 2013), representing about 19.3% of the Western Europe/West Africa breeding population (57,000 pairs derived by division by 3 of the upper estimate of 171,000 individuals: AEWA 2012). In the UK, the species is restricted to relatively few large colonies, most of which are on the east coast of Britain with a few smaller ones on the south and north-west coasts of England and in Northern Ireland. Colonies are mostly confined to coastal shingle beaches, sand dunes and offshore islets (Mitchell et al. 2004).
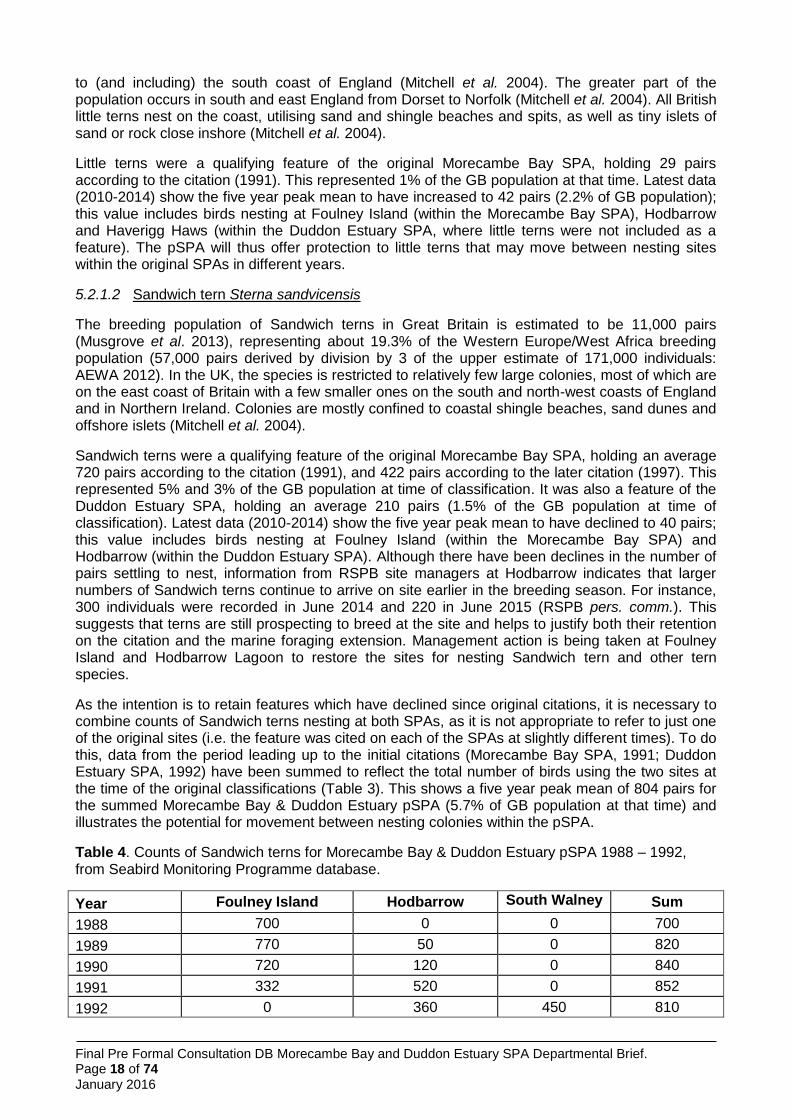
Sandwich terns were a qualifying feature of the original Morecambe Bay SPA, holding an average 720 pairs according to the citation (1991), and 422 pairs according to the later citation (1997). This represented 5% and 3% of the GB population at time of classification. It was also a feature of the Duddon Estuary SPA, holding an average 210 pairs (1.5% of the GB population at time of classification). Latest data (2010-2014) show the five year peak mean to have declined to 40 pairs; this value includes birds nesting at Foulney Island (within the Morecambe Bay SPA) and Hodbarrow (within the Duddon Estuary SPA). Although there have been declines in the number of pairs settling to nest, information from RSPB site managers at Hodbarrow indicates that larger numbers of Sandwich terns continue to arrive on site earlier in the breeding season. For instance, 300 individuals were recorded in June 2014 and 220 in June 2015 (RSPB pers. comm.). This suggests that terns are still prospecting to breed at the site and helps to justify both their retention on the citation and the marine foraging extension. Management action is being taken at Foulney Island and Hodbarrow Lagoon to restore the sites for nesting Sandwich tern and other tern species.
As the intention is to retain features which have declined since original citations, it is necessary to combine counts of Sandwich terns nesting at both SPAs, as it is not appropriate to refer to just one of the original sites (i.e. the feature was cited on each of the SPAs at slightly different times). To do this, data from the period leading up to the initial citations (Morecambe Bay SPA, 1991; Duddon Estuary SPA, 1992) have been summed to reflect the total number of birds using the two sites at the time of the original classifications (Table 3). This shows a five year peak mean of 804 pairs for the summed Morecambe Bay & Duddon Estuary pSPA (5.7% of GB population at that time) and illustrates the potential for movement between nesting colonies within the pSPA.
Table 4. Counts of Sandwich terns for Morecambe Bay & Duddon Estuary pSPA 1988 – 1992, from Seabird Monitoring Programme database.
Year Foulney Island Hodbarrow South Walney Sum
1988 700 0 0 700
1989 770 50 0 820
1990 720 120 0 840
1991 332 520 0 852
1992 0 360 450 810
Final Pre Formal Consultation DB Morecambe Bay and Duddon Estuary SPA Departmental Brief. Page 19 of 74 January 2016
A baseline citation value of 804 pairs (1,608 individuals) is proposed for the new pSPA.
5.2.1.3 Common tern Sterna hirundo
The breeding population of common terns in Great Britain is estimated to be 10,000 pairs (Musgrove et al. 2013), representing at least 2% of the Northern and Eastern European breeding population (500,000 pairs derived by division by 3 of the upper estimate of 1,500,000 individuals: AEWA 2012). A significant proportion of the British population breeds in Scotland. Coastal colonies in England are concentrated in the north-east, East Anglia, at a few localities along the south coast, and in the north-west (Mitchell et al. 2004). Common terns breed not only around coasts but, unlike the other tern species which breed in the UK, also breed frequently beside inland freshwater bodies.
Common terns were a qualifying feature of the original Morecambe Bay SPA, holding 285 pairs according to the citation (1991). This represented 2% of the GB population at time of classification. The largest (maximum 250-300 pairs) common tern colony within the pSPA, on Colloway Marsh in the Lune Estuary, declined in the late 1980’s and was lost subsequently. Latest data (2010-2014) show the five year peak mean to have declined to 47 pairs; this value includes birds nesting at Foulney Island (within the Morecambe Bay SPA) and Hodbarrow (within the Duddon Estuary SPA). Management action is being taken to recover the sites to a favourable condition for nesting common tern and other tern species.
The original baseline citation (1991) value of 285 pairs has been retained for the new pSPA. The pSPA will offer protection to common terns that may move between nesting sites within the original SPAs in different years.
5.2.2 Non-breeding season
5.2.2.1 Whooper swan Cygnus cygnus
The non-breeding population of whooper swans in Great Britain is estimated to be 11,000 individuals (Musgrove et al. 2013). This has increased in recent years, perhaps in response to increases in numbers of breeders (Holt et al. 2012). Birds at Morecambe Bay & Duddon Estuary pSPA are thought to originate from the Icelandic breeding population, arriving in Great Britain during the autumn.
WeBS data show the pSPA held a five year peak mean value of 113 individuals (2009/10 – 2013/14), representing 1.0% of the GB population. Whooper swans are a newly qualifying species for the pSPA, as the species was not part of original citations for Morecambe Bay SPA or Duddon Estuary SPA. Again, this may reflect increasing numbers in Great Britain. Within the pSPA, the vast majority of whooper swans are found within Morecambe Bay, although in some winters larger flocks appear on the Duddon Estuary too (Holt et al. 2015). Adding Morecambe Bay & Duddon Estuary pSPA creates a link between NW sites in the southern part of the species’ range.
5.2.2.2 Little egret Egretta garzetta
The non-breeding population of little egrets in Great Britain is estimated to be 4,500 individuals (Musgrove et al. 2013). The national increase in little egret abundance is well documented (Balmer et al. 2013; Holt et al. 2015), with continued expansion north and westward.
WeBS data show the pSPA held a five year peak mean value of 134 individuals (2009/10 – 2013/14), representing 3.0% of the GB population. Little egrets are a newly qualifying species for the pSPA, as the species was not part of original citations for Morecambe Bay SPA or Duddon Estuary SPA, reflecting national increases since the earlier classifications. Within the pSPA, the majority of little egrets are found within Morecambe Bay, with smaller numbers on the Duddon Estuary (Holt et al. 2015).
Final Pre Formal Consultation DB Morecambe Bay and Duddon Estuary SPA Departmental Brief. Page 20 of 74 January 2016
5.2.2.3 European golden plover Pluvialis apricaria
The non-breeding population of European golden plovers (hereafter golden plovers) in Great Britain is estimated to be 400,000 individuals (Musgrove et al. 2013). Golden plovers are distributed widely throughout the British lowlands in winter (Balmer et al. 2013) but do aggregate in large numbers at certain sites (Holt et al. 2015). Numbers are known to fluctuate in response to weather conditions, and the most recent five year period has included at least two winters when national numbers declined because of cold weather (Holt et al. 2012).
WeBS data show the pSPA held a five year peak mean value of 3,494 individuals (2009/10 – 2013/14), representing 0.9% of the GB population. It should be noted that counts from each of the five winters were considered to be undercounts by WeBS, and the ‘true’ number of golden plovers using the site need only be an average of 500 individuals greater to meet the 1% threshold. Golden plovers were a qualifying species on the original citation (1991) for Morecambe Bay SPA; at time of that citation, the site supported a five year peak mean of 1,900 individuals (1984/85 – 1988/89), then representing 1% of the GB population. In the intervening period, national increases of golden plovers have increased the relevant 1% threshold such that numbers do not currently qualify under stage 1.1 of the UK SPA selection guidelines.
As the site now supports greater numbers of golden plovers than in 1991, it appears to be making a continued contribution to conservation of the species. In order to retain the ambition to preserve golden plovers as features of the pSPA, the original citation peak mean value of 1,900 individuals is referred to.
5.2.2.4 Bar-tailed godwit Limosa lapponica
The non-breeding population of bar-tailed godwits in Great Britain is estimated to be 38,000 individuals (Musgrove et al. 2013). Nationally, bar-tailed godwit numbers have stayed fairly stable over the past 35 years (Holt et al. 2015).
WeBS data show the pSPA held a five year peak mean value of 3,046 individuals (2009/10 – 2013/14), representing 8.0% of the GB population. Bar-tailed godwits were a qualifying species on the original citation for Morecambe Bay SPA; at time of citation, the site supported a five year peak mean of 3,500 individuals (1984/85 – 1988/89), then representing 6% of the GB population. In the intervening period, although the peak mean estimate is slightly lower, the proportion of the national total supported has increased. The majority of the birds within the pSPA occur within Morecambe Bay.
5.2.2.5 Ruff Calidris pugnax
The non-breeding population of ruff in Great Britain is estimated to be 800 individuals (Musgrove et al. 2013). Ruff increased in number nationally throughout the 1990s but declined from the mid-2000s (Holt et al. 2015). However, they are still widely but thinly dispersed around areas of suitable habitat (Balmer et al. 2013).
WeBS data show the pSPA held a five year peak mean value of 8 individuals (2009/10 – 2013/14), representing 1.0% of the GB population. Ruffs are a newly qualifying species for the pSPA, as the species was not part of original citations for Morecambe Bay SPA or Duddon Estuary SPA. Within the pSPA, ruffs are only found within Morecambe Bay (Holt et al. 2015). Although the mean value of individuals is low, the species is recommended for inclusion because the current SPA suite does not include any sites in west Britain; Morecambe Bay & Duddon Estuary pSPA therefore provides unique protection to birds in this part of their range, making a meaningful contribution to conservation needs of the species.
5.2.2.6 Mediterranean gull Larus melanocephalus
The non-breeding population of Mediterranean gulls in Great Britain is estimated to be 1,800 individuals (Musgrove et al. 2013). Mediterranean gulls have increased in number nationally throughout the 2000s and 2010s (Holt et al. 2015). They are distributed widely around British coasts (excepting northern Scotland) in the winter (Balmer et al. 2013).
Final Pre Formal Consultation DB Morecambe Bay and Duddon Estuary SPA Departmental Brief. Page 21 of 74 January 2016
WeBS data show the pSPA held a five year peak mean value of 18 individuals (2009/10 – 2013/14), representing 1.0% of the GB population. Mediterranean gulls are a newly qualifying species for the pSPA, as the species was not part of original citations for Morecambe Bay SPA or Duddon Estuary SPA. Within the pSPA, Mediterranean gulls are mainly found within Morecambe Bay, with only occasional individuals on the Duddon Estuary (Holt et al. 2015). Although the mean value of individuals is low, the species is recommended for inclusion because the current SPA suite does not contain any SPAs for non-breeding gulls despite several sites supporting qualifying numbers. The pSPA supports a regularly occurring aggregation of non-breeding Mediterranean gulls at the north-westerly extent of its range and that meets the SPA selection guidelines, although other sites in the UK support higher abundances.
Regularly occurring migratory species 5.3
5.3.1 Breeding season
5.3.1.1 European herring gull Larus argentatus argenteus
The breeding population of European herring gulls (hereafter herring gulls) in Great Britain is estimated to be 130,000 pairs (Musgrove et al. 2013). This estimate relates to the race argenteus, which all breeding birds in GB are considered to belong to (Wetlands International 2015). Herring gulls have declined markedly in recent years (-30% in the UK between 2000 and 2013; JNCC 2014), and are now on the ‘red list’ of Birds of Conservation Concern (Eaton et al. 2009) because of longer-term declines.
Herring gulls were a qualifying feature of the original Morecambe Bay SPA, holding 10,000 pairs according to the citation (1991). This represented 7% of the GB population at time of classification, though the proportion of the biogeographic population is not given (retrospectively this has been calculated as 1.0%). It was not a feature of the Duddon Estuary SPA, as only very small numbers of pairs breed at Hodbarrow. Latest data (2011-2015) show the five year peak mean to have declined to 1,596 pairs (0.5% biogeographic population of 340,000 pairs); this value includes birds nesting at South Walney (within Morecambe Bay SPA) and Hodbarrow (within Duddon Estuary SPA). Management action is being undertaken to try to restore the gull colony at South Walney to favourable condition. The principal driver behind the onsite declines is considered to be predator pressure which can be addressed through management.
The original baseline citation (1991) value of 10,000 pairs has been retained for the new pSPA.
5.3.1.2 Lesser black-backed gull Larus fuscus graellsii
The breeding population of lesser black-backed gulls in Great Britain is estimated to be 110,000 pairs (Musgrove et al. 2013). This estimate relates to the race graellsii, which all breeding birds in GB are considered to belong to (Wetlands International 2015). Lesser black-backed gulls have declined markedly in recent years (-48% in the UK between 2000 and 2013; JNCC 2014), but are not yet on the ‘red list’ of Birds of Conservation Concern (Eaton et al. 2009).
Lesser black-backed gulls were a qualifying feature of the original Morecambe Bay SPA, holding 10,000 pairs according to the citation (1991). This represented 12% of the GB population at time of classification, though the proportion of the biogeographic population is not given. It was not a feature of the Duddon Estuary SPA, as comparatively small numbers of pairs breed at Hodbarrow. Latest data (2011-2015) show the five year peak mean to have declined to 4,860 pairs (2.7% of biogeographic population); this value includes birds nesting at South Walney (within Morecambe Bay SPA) and Hodbarrow (within Duddon Estuary SPA). Management action is being undertaken to try to restore the gull colony at South Walney to favourable condition. The principal driver behind the onsite declines is considered to be predator pressure which can be addressed through management.
Despite these declines, contemporary data are used to show the feature qualifies for the pSPA, holding 2.7% of the biogeographic population of 183,000 pairs.
Final Pre Formal Consultation DB Morecambe Bay and Duddon Estuary SPA Departmental Brief. Page 22 of 74 January 2016
5.3.2 Non-breeding season
5.3.2.1 Pink-footed goose Anser brachyrhychus
The non-breeding population of pink-footed geese in Great Britain is estimated to be 360,000 individuals (Musgrove et al. 2013), derived almost exclusively from the entire Iceland and eastern Greenland breeding populations and thus forming the biogeographic estimate as well as national estimate. Pink-footed geese are distributed across northern and western Britain in the winter (Balmer et al. 2013), and numbers have increased almost unabated over the past 30 years (Holt et al. 2015).
WeBS data, supplemented by IGC data from January 2012 and October 2013 (Holt et al. 2015), show the pSPA held a five year peak mean value of 15,648 individuals (2009/10 – 2013/14), representing 4.5% of the biogeographic population. Pink-footed geese were part of the original citation for Morecambe Bay SPA. This site holds larger numbers than the Duddon Estuary, although flocks of 1,500 are not uncommon on the estuary (Holt et al. 2015).
5.3.2.2 Common shelduck Tadorna tadorna
The non-breeding population of common shelducks (hereafter shelducks) in Great Britain is estimated to be 61,000 individuals (Musgrove et al. 2013); the 300,000 biogeographic estimate relates to the northwest Europe population (Wetlands International 2015). Shelducks are widespread (Balmer et al. 2013) but declining since the 1990s (Holt et al. 2015).
WeBS data show the pSPA held a five year peak mean value of 5,878 individuals (2009/10 – 2013/14), representing 2.0% of the biogeographic population. Shelducks were part of the original citation for Morecambe Bay SPA. This site holds larger numbers than the Duddon Estuary, although flocks of several hundred are also recorded (Holt et al. 2015).
5.3.2.3 Northern pintail Anas acuta
The non-breeding population of Northern pintails (hereafter pintails) in Great Britain is estimated to be 29,000 individuals (Musgrove et al. 2013); the 60,000 biogeographic estimate relates to the northwest Europe population (Wetlands International 2015). Pintails are widely distributed throughout Britain in the winter (Balmer et al. 2013), and have increased since the 1970s despite a recent sharp decline (Holt et al. 2015). Morecambe Bay consistently ranks amongst the sites holding the greatest number of pintails in the UK.
WeBS data show the pSPA held a five year peak mean value of 2,498 individuals (2009/10 – 2013/14), representing 4.2% of the biogeographic population. Pintails were part of the original citations for Morecambe Bay SPA and Duddon Estuary SPA, reflecting the importance of both areas (Holt et al. 2015); the former holds larger numbers than the latter, and both have undergone some recent declines in numbers (Holt et al. 2015).
5.3.2.4 Eurasian oystercatcher Haemotopus ostralegus
The non-breeding population of Eurasian oystercatchers (hereafter oystercatchers) in Great Britain is estimated to be 320,000 individuals (Musgrove et al. 2013); the 820,000 biogeographic estimate relates to the ostralegus population (Wetlands International 2015). Oystercatchers are widespread (Balmer et al. 2013) but slowly declining nationally since the 1990s (Holt et al. 2015).
WeBS data show the pSPA held a five year peak mean value of 55,888 individuals (2009/10 – 2013/14), representing 6.8% of the biogeographic population. Oystercatchers were part of the original citation for Morecambe Bay SPA, and the site ranks consistently first for oystercatcher abundance in the UK (Holt et al. 2015). However, the Duddon Estuary also supports several thousand individuals, meaning the combined pSPA holds a substantial proportion of both British (17.5%) and biogeographic (6.8%) totals.
Final Pre Formal Consultation DB Morecambe Bay and Duddon Estuary SPA Departmental Brief. Page 23 of 74 January 2016
5.3.2.5 Grey plover Pluvialis squatarola
The non-breeding population of grey plovers in Great Britain is estimated to be 43,000 individuals (Musgrove et al. 2013); the 250,000 biogeographic estimate relates to the population occurring in western Europe (Wetlands International 2015). Grey plovers are distributed widely across muddy and sandy coasts in winter (Balmer et al. 2013) but do aggregate in large numbers at certain sites (Holt et al. 2015). The British population has remained fairly stable for ten years following a period of increase, then decline (Holt et al. 2015).
WeBS data show the pSPA held a five year peak mean value of 1,013 individuals (2009/10 – 2013/14), representing 2.4% of the GB population and 0.4% of the biogeographic population. It should be noted that counts from each of the five winters were considered to be undercounts, and the ‘true’ number of grey plovers using the site may be greater. Grey plovers were a qualifying species on the original citation (1991) for Morecambe Bay SPA, as well as the updated version (1997). In 1991, the site supported a five year peak mean of 2,000 individuals (1984/85 – 1988/89), then representing 1.0% of the biogeographic population. In the intervening period, grey plover numbers have declined at the site, but the 1991 citation value of 2,000 is retained here.
5.3.2.6 Common ringed plover Charadrius hiaticula
The non-breeding population of common ringed plovers (hereafter ringed plovers) in Great Britain is estimated to be 34,000 individuals (Musgrove et al. 2013); the 73,000 biogeographic estimate relates to the hiaticula race thought to winter in Britain (Wetlands International 2015). Ringed plovers are widely distributed throughout Britain in the winter (Balmer et al. 2013), though have been in steady decline since the early 1990s (Holt et al. 2015).
WeBS data show the pSPA held a five year peak mean value of 1,049 individuals (2009/10 – 2013/14), representing 1.4% of the biogeographic population. Ringed plovers were part of the original citation for Morecambe Bay SPA but not Duddon Estuary SPA. Within the pSPA, Morecambe Bay holds larger numbers than the Duddon (Holt et al. 2015).
5.3.2.7 Eurasian curlew Numenius arquata
The non-breeding population of Eurasian curlews (hereafter curlews) in Great Britain is estimated to be 140,000 individuals (Musgrove et al. 2013); the 840,000 biogeographic estimate relates to the European arquata population (Wetlands International 2015). Curlews are widespread (Balmer et al. 2013) and the British population has been more or less stable over the past 40 years (Holt et al. 2015).
WeBS data show the pSPA held a five year peak mean value of 12,209 individuals (2009/10 – 2013/14), representing 8.7% of the GB population and 1.5% of the biogeographic population. Curlews were part of the original citation for Morecambe Bay SPA. This part of the site holds larger numbers than the Duddon Estuary and consistently ranks amongst the most abundant in the country, although flocks in the thousands are also recorded on the Duddon (Holt et al. 2015).
5.3.2.8 Black-tailed godwit Limosa limosa
In the UK, wintering black-tailed godwits almost exclusively originate from breeding grounds in Iceland. The national trend for the species continues to increase (Holt et al. 2015), with greater abundance in key areas and wider range expansion perhaps reflecting sustained successful breeding (Balmer et al. 2013). The non-breeding population of black-tailed godwits in Great Britain is estimated to be 43,000 individuals (Musgrove et al. 2013); the 61,000 biogeographic estimate relates to the islandica race wintering in western Europe (Wetlands International 2015).
WeBS data show the pSPA held a five year peak mean value of 2,413 individuals (2009/10 – 2013/14), representing 5.6% of the GB population and 4.0% of the biogeographic population. This is a new qualifier for the pSPA, as black-tailed godwits were not part of original citations for Morecambe Bay SPA or Duddon Estuary SPA. Within the pSPA, the species is mostly found at Morecambe Bay. Black-tailed godwits are now recommended for inclusion because they were

Final Pre Formal Consultation DB Morecambe Bay and Duddon Estuary SPA Departmental Brief. Page 24 of 74 January 2016
recognised in the past as qualifiers for this SPA (Stroud et al. 2001).
5.3.2.9 Ruddy turnstone Arenaria intepres
The non-breeding population of ruddy turnstones (hereafter turnstones) in Great Britain is estimated to be 48,000 individuals (Musgrove et al. 2013); the 140,000 biogeographic estimate relates to the population occurring in western Europe (Wetlands International 2015). Turnstones are widespread (Balmer et al. 2013) and the British population has been fairly stable over the past 15 years (Holt et al. 2015).
WeBS data show the pSPA held a five year peak mean value of 1,359 individuals (2009/10 – 2013/14), representing 2.8% of the GB population and 1.0% of the biogeographic population. Turnstones were part of the original citation for Morecambe Bay SPA. This part of the site holds larger numbers than the Duddon Estuary and consistently ranks amongst the most abundant in the country, with a few hundred also recorded regularly on the Duddon (Holt et al. 2015).
5.3.2.10 Red knot Calidris canutus
The non-breeding population of red knots (hereafter knots) in Great Britain is estimated to be 320,000 individuals (Musgrove et al. 2013); the 450,000 biogeographic estimate relates to the islandica race thought to winter in Britain (Wetlands International 2015). Knots are widely distributed throughout Britain in the winter (Balmer et al. 2013), and numbers have been largely stable over the past 30 years (Holt et al. 2015). Morecambe Bay consistently ranks amongst the sites holding the greatest number of knots in the UK.
WeBS data show the pSPA held a five year peak mean value of 32,739 individuals (2009/10 – 2013/14), representing 7.3% of the biogeographic population. Knots were part of the original citations for Morecambe Bay SPA and Duddon Estuary SPA, reflecting the importance of both areas (Holt et al. 2015); the former holds larger numbers than the latter, which has undergone some recent declines in numbers (Holt et al. 2015).
5.3.2.11 Sanderling Calidris alba
The non-breeding population of sanderlings in Great Britain is estimated to be 16,000 individuals (Musgrove et al. 2013); the 120,000 biogeographic estimate relates to the population occurring in the east Atlantic (Wetlands International 2015). Sanderlings are almost entirely coastal in winter, preferring sandy habitats as the name suggests (Balmer et al. 2013). The British population is steadily increasing (Holt et al. 2015).
WeBS data show the pSPA held a five year peak mean value of 849 individuals (2009/10 – 2013/14), representing 5.3% of the GB population and 0.7% of the biogeographic population. It should be noted that counts from each of the five winters were considered to be undercounts, and the ‘true’ number of sanderlings using the site may be greater. Sanderlings were a qualifying species on the original citation (1991) for Morecambe Bay SPA; at time of that citation, the site supported a five year peak mean of 3,600 individuals (1984/85 – 1988/89), then representing 3% of the East Atlantic Flyway population. Numbers appear to be variable at Morecambe Bay, with one very large count of greater than 8,000 birds recorded during the original citation period (1984/85 – 1989/90), though peaks of at least 1,000 were common. No flocks greater than 1,000 have been recorded since 1997/98. Within the pSPA, it is typical for a few hundred sanderlings to occur on both Morecambe Bay and the Duddon Estuary.
Altough numbers have declined at the site since 1991, they are approximately stable over the past 15 years and the site appears to be making a continued contribution to conservation of the species. In order to retain the ambition to preserve sanderlings as features of the pSPA, the original citation peak mean value of 3,600 individuals is referred to.
5.3.2.12 Dunlin Calidris alpina
The non-breeding population of dunlins in Great Britain is estimated to be 350,000 individuals (Musgrove et al. 2013); the 1,330,000 biogeographic estimate relates to the alpina race which
Final Pre Formal Consultation DB Morecambe Bay and Duddon Estuary SPA Departmental Brief. Page 25 of 74 January 2016
occurs in Britain (Wetlands International 2015). Dunlins are widespread (Balmer et al. 2013) but in steady decline (Holt et al. 2015).
WeBS data show the pSPA held a five year peak mean value of 26,982 individuals (2009/10 – 2013/14), representing 7.7% of the GB population and 2.0% of the biogeographic population. Dunlins were part of the original citation for Morecambe Bay SPA. This part of the site holds larger numbers than the Duddon Estuary, although flocks of several thousand are also recorded here (Holt et al. 2015).
5.3.2.13 Common redshank Tringa totanus
The non-breeding population of common redshanks (hereafter redshanks) in Great Britain is estimated to be 120,000 individuals (Musgrove et al. 2013); the 240,000 biogeographic estimate relates to the robusta race thought to winter in Britain (Wetlands International 2015). Redshanks are widely distributed throughout Britain in the winter (Balmer et al. 2013), but have undergone some recent declines in abundance (Holt et al. 2015). Morecambe Bay consistently ranks amongst the site holding the greatest number of redshanks in the UK.
WeBS data show the pSPA held a five year peak mean value of 11,133 individuals (2009/10 – 2013/14), representing 4.6% of the biogeographic population. Redshanks were part of the original citations for Morecambe Bay SPA and Duddon Estuary SPA, reflecting the importance of both areas (Holt et al. 2015); the former holds larger numbers than the latter, with smaller numbers still on the Irt, Mite and Esk Estuaries (collectively termed Ravenglass Estuary).
5.3.2.14 Lesser black-backed gull Larus fuscus
The non-breeding population of lesser black-backed gulls in Great Britain is estimated to be 120,000 individuals (Musgrove et al. 2013), distributed widely around the country in the winter (Balmer et al. 2013). The biogeographic population of L. fuscus graellsii totals an estimated 550,000 individuals (Wetlands International 2015). A significant proportion of this total is supported by the UK in the non-breeding season (which appears to be have grown through the 20th Century: Banks et al. 2007), including at several sites which may qualify as SPAs (Burton et al. 2012): however, the UK SPA suite currently contains no sites for wintering gulls.
WeBS data show the pSPA held a five year peak mean value of 9,450 individuals (2009/10 – 2013/14), representing 7.9% of the GB population and 1.7% of the biogeographic population. In order to avoid double counting of breeding birds, data from May – July were excluded (using the ‘migration free’ breeding season described by Furness 2015). Lesser black-backed gulls are a newly qualifying species for the pSPA in the non-breeding season, adding to the breeding season citation for Morecambe Bay SPA. The vast majority are recorded at Morecambe Bay (Holt et al. 2015).
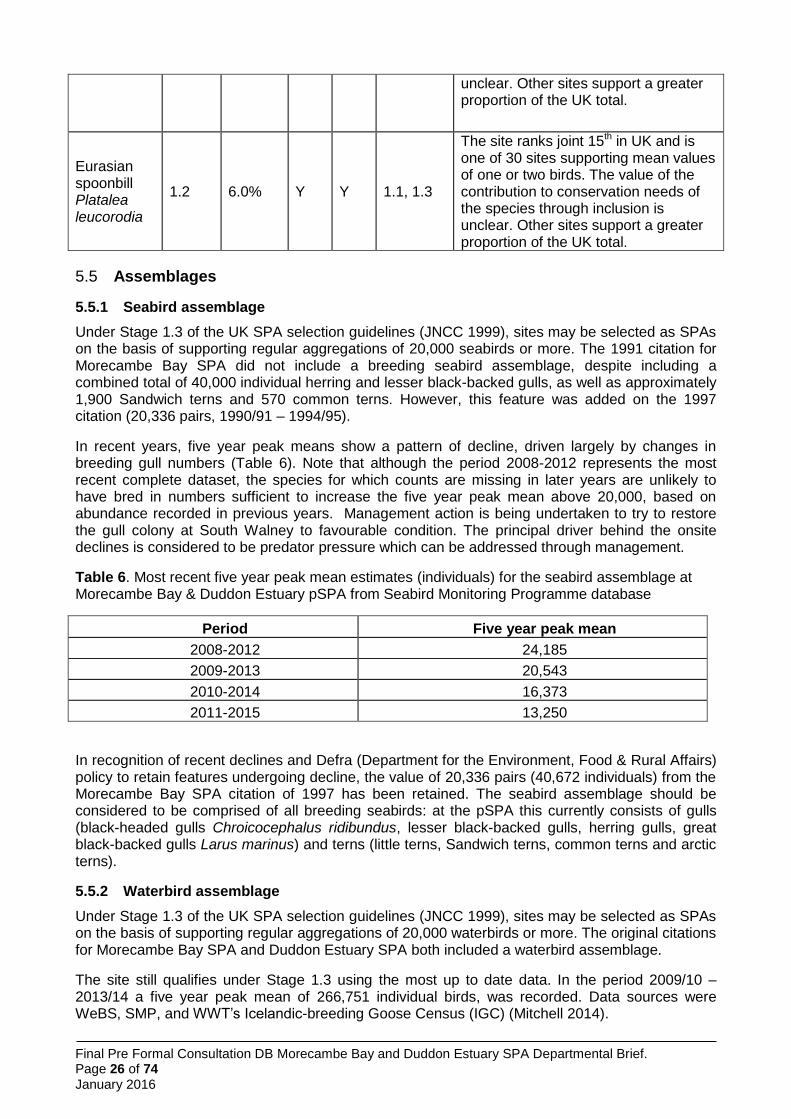
Potential qualifying features not recommended for inclusion 5.4
Table 5 illustrates a list of potential qualifiers (both non-breeding waterbirds on Annex I of the Birds Directive) that are not recommended for inclusion on the new citation, with justifications provided.
Table 5. Potential qualifiers not recommended for inclusion.
Species
Five year peak mean
% national
SPA 1.1
SPA 1.3
Selection stage
Justification for exclusion
Great white egret Ardea alba
1.4 4.1% Y Y 1.1, 1.3
Although the site is ranked joint 4th in the UK, it represents one of 29 sites supporting mean values of one or two birds and so the value of the contribution to conservation needs of the species through inclusion is
Final Pre Formal Consultation DB Morecambe Bay and Duddon Estuary SPA Departmental Brief. Page 26 of 74 January 2016
unclear. Other sites support a greater proportion of the UK total.
Eurasian spoonbill Platalea leucorodia
1.2 6.0% Y Y 1.1, 1.3
The site ranks joint 15th in UK and is one of 30 sites supporting mean values of one or two birds. The value of the contribution to conservation needs of the species through inclusion is unclear. Other sites support a greater proportion of the UK total.
Assemblages 5.5
5.5.1 Seabird assemblage
Under Stage 1.3 of the UK SPA selection guidelines (JNCC 1999), sites may be selected as SPAs on the basis of supporting regular aggregations of 20,000 seabirds or more. The 1991 citation for Morecambe Bay SPA did not include a breeding seabird assemblage, despite including a combined total of 40,000 individual herring and lesser black-backed gulls, as well as approximately 1,900 Sandwich terns and 570 common terns. However, this feature was added on the 1997 citation (20,336 pairs, 1990/91 – 1994/95).
In recent years, five year peak means show a pattern of decline, driven largely by changes in breeding gull numbers (Table 6). Note that although the period 2008-2012 represents the most recent complete dataset, the species for which counts are missing in later years are unlikely to have bred in numbers sufficient to increase the five year peak mean above 20,000, based on abundance recorded in previous years. Management action is being undertaken to try to restore the gull colony at South Walney to favourable condition. The principal driver behind the onsite declines is considered to be predator pressure which can be addressed through management.
Table 6. Most recent five year peak mean estimates (individuals) for the seabird assemblage at Morecambe Bay & Duddon Estuary pSPA from Seabird Monitoring Programme database
Period Five year peak mean
2008-2012 24,185
2009-2013 20,543
2010-2014 16,373
2011-2015 13,250
In recognition of recent declines and Defra (Department for the Environment, Food & Rural Affairs) policy to retain features undergoing decline, the value of 20,336 pairs (40,672 individuals) from the Morecambe Bay SPA citation of 1997 has been retained. The seabird assemblage should be considered to be comprised of all breeding seabirds: at the pSPA this currently consists of gulls (black-headed gulls Chroicocephalus ridibundus, lesser black-backed gulls, herring gulls, great black-backed gulls Larus marinus) and terns (little terns, Sandwich terns, common terns and arctic terns).
5.5.2 Waterbird assemblage
Under Stage 1.3 of the UK SPA selection guidelines (JNCC 1999), sites may be selected as SPAs on the basis of supporting regular aggregations of 20,000 waterbirds or more. The original citations for Morecambe Bay SPA and Duddon Estuary SPA both included a waterbird assemblage.
The site still qualifies under Stage 1.3 using the most up to date data. In the period 2009/10 – 2013/14 a five year peak mean of 266,751 individual birds, was recorded. Data sources were WeBS, SMP, and WWT’s Icelandic-breeding Goose Census (IGC) (Mitchell 2014).
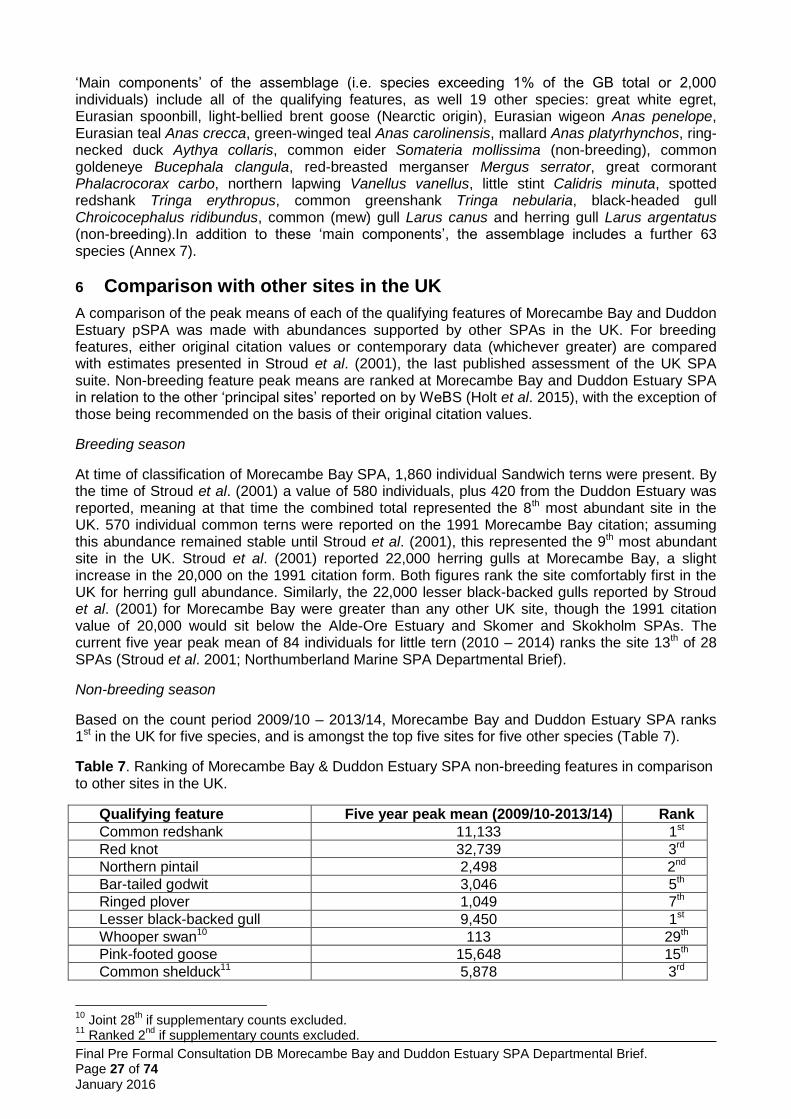
Final Pre Formal Consultation DB Morecambe Bay and Duddon Estuary SPA Departmental Brief. Page 27 of 74 January 2016
‘Main components’ of the assemblage (i.e. species exceeding 1% of the GB total or 2,000 individuals) include all of the qualifying features, as well 19 other species: great white egret, Eurasian spoonbill, light-bellied brent goose (Nearctic origin), Eurasian wigeon Anas penelope, Eurasian teal Anas crecca, green-winged teal Anas carolinensis, mallard Anas platyrhynchos, ring-necked duck Aythya collaris, common eider Somateria mollissima (non-breeding), common goldeneye Bucephala clangula, red-breasted merganser Mergus serrator, great cormorant Phalacrocorax carbo, northern lapwing Vanellus vanellus, little stint Calidris minuta, spotted redshank Tringa erythropus, common greenshank Tringa nebularia, black-headed gull Chroicocephalus ridibundus, common (mew) gull Larus canus and herring gull Larus argentatus (non-breeding).In addition to these ‘main components’, the assemblage includes a further 63 species (Annex 7).
6 Comparison with other sites in the UK
A comparison of the peak means of each of the qualifying features of Morecambe Bay and Duddon Estuary pSPA was made with abundances supported by other SPAs in the UK. For breeding features, either original citation values or contemporary data (whichever greater) are compared with estimates presented in Stroud et al. (2001), the last published assessment of the UK SPA suite. Non-breeding feature peak means are ranked at Morecambe Bay and Duddon Estuary SPA in relation to the other ‘principal sites’ reported on by WeBS (Holt et al. 2015), with the exception of those being recommended on the basis of their original citation values.
Breeding season
At time of classification of Morecambe Bay SPA, 1,860 individual Sandwich terns were present. By the time of Stroud et al. (2001) a value of 580 individuals, plus 420 from the Duddon Estuary was reported, meaning at that time the combined total represented the 8th most abundant site in the UK. 570 individual common terns were reported on the 1991 Morecambe Bay citation; assuming this abundance remained stable until Stroud et al. (2001), this represented the 9th most abundant site in the UK. Stroud et al. (2001) reported 22,000 herring gulls at Morecambe Bay, a slight increase in the 20,000 on the 1991 citation form. Both figures rank the site comfortably first in the UK for herring gull abundance. Similarly, the 22,000 lesser black-backed gulls reported by Stroud et al. (2001) for Morecambe Bay were greater than any other UK site, though the 1991 citation value of 20,000 would sit below the Alde-Ore Estuary and Skomer and Skokholm SPAs. The current five year peak mean of 84 individuals for little tern (2010 – 2014) ranks the site 13th of 28 SPAs (Stroud et al. 2001; Northumberland Marine SPA Departmental Brief).
Non-breeding season
Based on the count period 2009/10 – 2013/14, Morecambe Bay and Duddon Estuary SPA ranks 1st in the UK for five species, and is amongst the top five sites for five other species (Table 7).
Table 7. Ranking of Morecambe Bay & Duddon Estuary SPA non-breeding features in comparison to other sites in the UK.
Qualifying feature Five year peak mean (2009/10-2013/14) Rank
Common redshank 11,133 1st
Red knot 32,739 3rd
Northern pintail 2,498 2nd
Bar-tailed godwit 3,046 5th
Ringed plover 1,049 7th
Lesser black-backed gull 9,450 1st
Whooper swan10 113 29th
Pink-footed goose 15,648 15th
Common shelduck11 5,878 3rd
10
Joint 28th if supplementary counts excluded.
11 Ranked 2
nd if supplementary counts excluded.
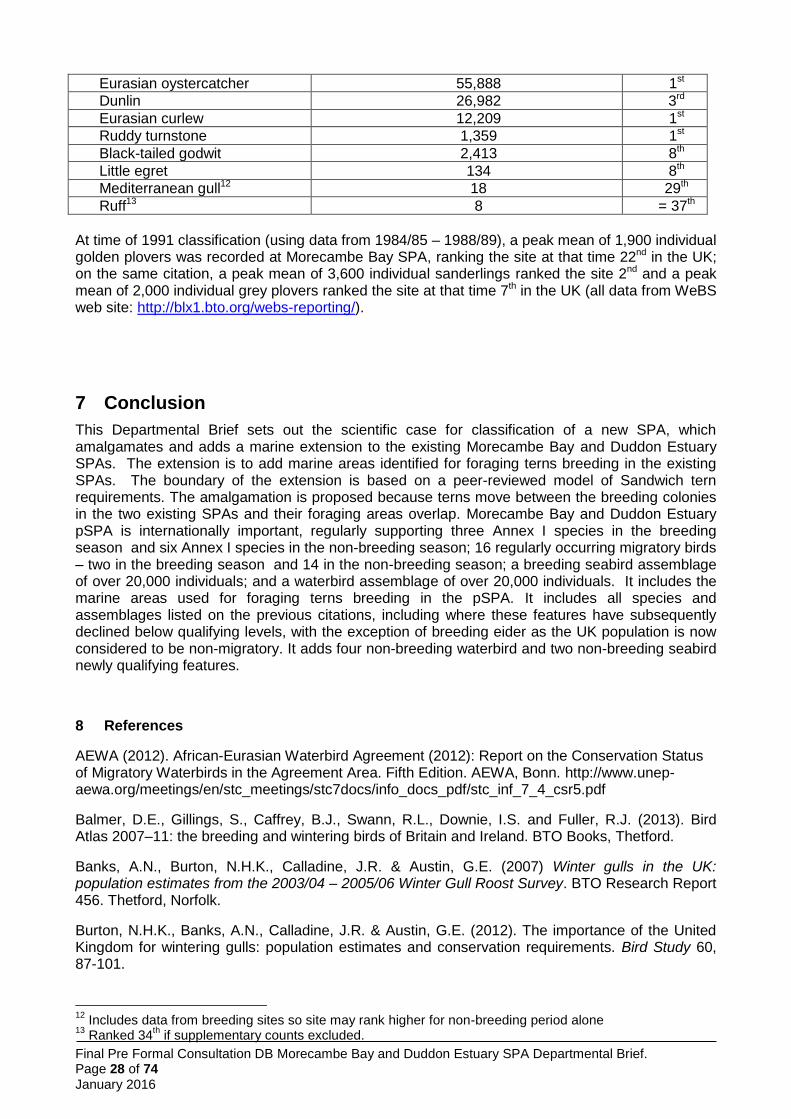
Final Pre Formal Consultation DB Morecambe Bay and Duddon Estuary SPA Departmental Brief. Page 28 of 74 January 2016
Eurasian oystercatcher 55,888 1st
Dunlin 26,982 3rd
Eurasian curlew 12,209 1st
Ruddy turnstone 1,359 1st
Black-tailed godwit 2,413 8th
Little egret 134 8th
Mediterranean gull12 18 29th
Ruff13 8 = 37th
At time of 1991 classification (using data from 1984/85 – 1988/89), a peak mean of 1,900 individual golden plovers was recorded at Morecambe Bay SPA, ranking the site at that time 22nd in the UK; on the same citation, a peak mean of 3,600 individual sanderlings ranked the site 2nd and a peak mean of 2,000 individual grey plovers ranked the site at that time 7th in the UK (all data from WeBS web site: http://blx1.bto.org/webs-reporting/).
7 Conclusion
This Departmental Brief sets out the scientific case for classification of a new SPA, which amalgamates and adds a marine extension to the existing Morecambe Bay and Duddon Estuary SPAs. The extension is to add marine areas identified for foraging terns breeding in the existing SPAs. The boundary of the extension is based on a peer-reviewed model of Sandwich tern requirements. The amalgamation is proposed because terns move between the breeding colonies in the two existing SPAs and their foraging areas overlap. Morecambe Bay and Duddon Estuary pSPA is internationally important, regularly supporting three Annex I species in the breeding season and six Annex I species in the non-breeding season; 16 regularly occurring migratory birds – two in the breeding season and 14 in the non-breeding season; a breeding seabird assemblage of over 20,000 individuals; and a waterbird assemblage of over 20,000 individuals. It includes the marine areas used for foraging terns breeding in the pSPA. It includes all species and assemblages listed on the previous citations, including where these features have subsequently declined below qualifying levels, with the exception of breeding eider as the UK population is now considered to be non-migratory. It adds four non-breeding waterbird and two non-breeding seabird newly qualifying features.
8 References
AEWA (2012). African-Eurasian Waterbird Agreement (2012): Report on the Conservation Status of Migratory Waterbirds in the Agreement Area. Fifth Edition. AEWA, Bonn. http://www.unep-aewa.org/meetings/en/stc_meetings/stc7docs/info_docs_pdf/stc_inf_7_4_csr5.pdf
Balmer, D.E., Gillings, S., Caffrey, B.J., Swann, R.L., Downie, I.S. and Fuller, R.J. (2013). Bird Atlas 2007–11: the breeding and wintering birds of Britain and Ireland. BTO Books, Thetford.
Banks, A.N., Burton, N.H.K., Calladine, J.R. & Austin, G.E. (2007) Winter gulls in the UK: population estimates from the 2003/04 – 2005/06 Winter Gull Roost Survey. BTO Research Report 456. Thetford, Norfolk.
Burton, N.H.K., Banks, A.N., Calladine, J.R. & Austin, G.E. (2012). The importance of the United Kingdom for wintering gulls: population estimates and conservation requirements. Bird Study 60, 87-101.
12
Includes data from breeding sites so site may rank higher for non-breeding period alone 13
Ranked 34th if supplementary counts excluded.
Final Pre Formal Consultation DB Morecambe Bay and Duddon Estuary SPA Departmental Brief. Page 29 of 74 January 2016
Cook, A.S.C.P. and Robinson, R.A. (2010). How representative is the current monitoring of breeding success in the UK? BTO Research Report No. 573, BTO, Thetford.
Eaton, M.A., Brown, A.F., Noble, D.G., Musgrove, A.J., Hearn, R., Aebischer, N.J., Gibbons, D.W., Evans, A. and Gregory, R.D. (2009). Birds of Conservation Concern 3: the population status of birds in the United Kingdom, Channel Islands and the Isle of Man. British Birds 102, pp 296–341.
Furness, R.W. (2015). Non-breeding season populations of seabirds in UK waters: Population sizes for Biologically Defined Minimum Population Scales (BDMPS). Natural England Commissioned Reports, Number 164.
Holt, C.A., Austin, G.E., Calbrade, N.A., Mellan, H.J., Hearn, R.D., Stroud, D.A., Wotton, S.R. and
Musgrove, A.J. (2012). Waterbirds in the UK 2010/11: The Wetland Bird Survey.
BTO/RSPB/JNCC, Thetford.
Holt, C.A., Austin, G.E., Calbrade, N.A., Mellan, H.J., Hearn, R.D., Stroud, D.A., Wotton, S.R. and
Musgrove, A.J. (2015). Waterbirds in the UK 2013/14: The Wetland Bird Survey.
BTO/RSPB/JNCC. Thetford. http://www.bto.org/volunteer-surveys/webs/publications/webs-annual-
report
JNCC (1999). The Birds Directive – selection guidelines for Special Protection Areas. JNCC,
Peterborough.
JNCC (2014). Seabird Population Trends and Causes of Change: 1986-2013 Report (http://www.jncc.defra.gov.uk/page-3201). Joint Nature Conservation Committee. Updated August 2014. Accessed [19th June 2015].
Johnston, C.M., Turnbull, C.G., Tasker, M.L. (2002): Natura 2000 in UK Offshore Waters: Advice to support the implementation of the EC Habitat and Birds Directives in UK offshore waters. JNCC Report 325, Peterborough. Available at: http://jncc.defra.gov.uk/page-2412
Mitchell, P.I., Newton, S.F., Ratcliffe, N. and Dunn, T.E. (2004). Seabird populations of Britain and Ireland. T. & A.D. Poyser, London, 511pp.
Mitchell, C. (2014). Status and distribution of Icelandic-breeding geese: results of the 2013 international census. Wildfowl & Wetlands Trust Report, Slimbridge. 20pp.
Musgrove, A., Aebischer, N., Eaton, M., Hearn, R., Newson, S., Noble, D., Parsons, M., Risley, K. and Stroud, D. (2013). Population estimates of birds in Great Britain and the United Kingdom. British Birds 106, 64 – 100.
Parsons, M., Lawson, J., Lewis, M., Lawrence, R. and Kuepfer, A. (2015). Quantifying foraging areas of little tern around its breeding colony SPA during chick-rearing. JNCC Report 548, ISSN 0963 8901.
Stroud, D.A., Chambers, D., Cook, S., Buxton, N., Fraser, B., Clement, P., Lewis, I., McLean, I., Baker, H. and Whitehead, S. (2001). The UK SPA Network: its scope and content. Vols 1 – 3, JNCC, Peterborough.
Thaxter, C.B., Lascelles, B., Sugar, K., Cook, A.S.C.P., Roos, S., Bolton, M., Langston, R.H.W. and Burton, N.H.K. (2012). Seabird foraging ranges as a preliminary tool for identifying candidate marine protected areas. Biological Conservation 156, 53 - 61.
Wetlands International (2015). "Waterbird Population Estimates". Retrieved from wpe.wetlands.org on Friday 19 Jun 2015
Wilson L. J., Black J., Brewer, M. J., Potts, J. M., Kuepfer, A., Win I., Kober K., Bingham C., Mavor R. and Webb A. (2014). Quantifying usage of the marine environment by terns Sterna sp. around their breeding colony SPAs. JNCC report 500.

Final Pre Formal Consultation DB Morecambe Bay and Duddon Estuary SPA Departmental Brief. Page 30 of 74 January 2016
Win, I., Wilson, L. J. and Kuepfer, A. (2013). Identification of possible marine SPA boundaries for the larger tern species around the United Kingdom. Unpublished JNCC report. December 2013.
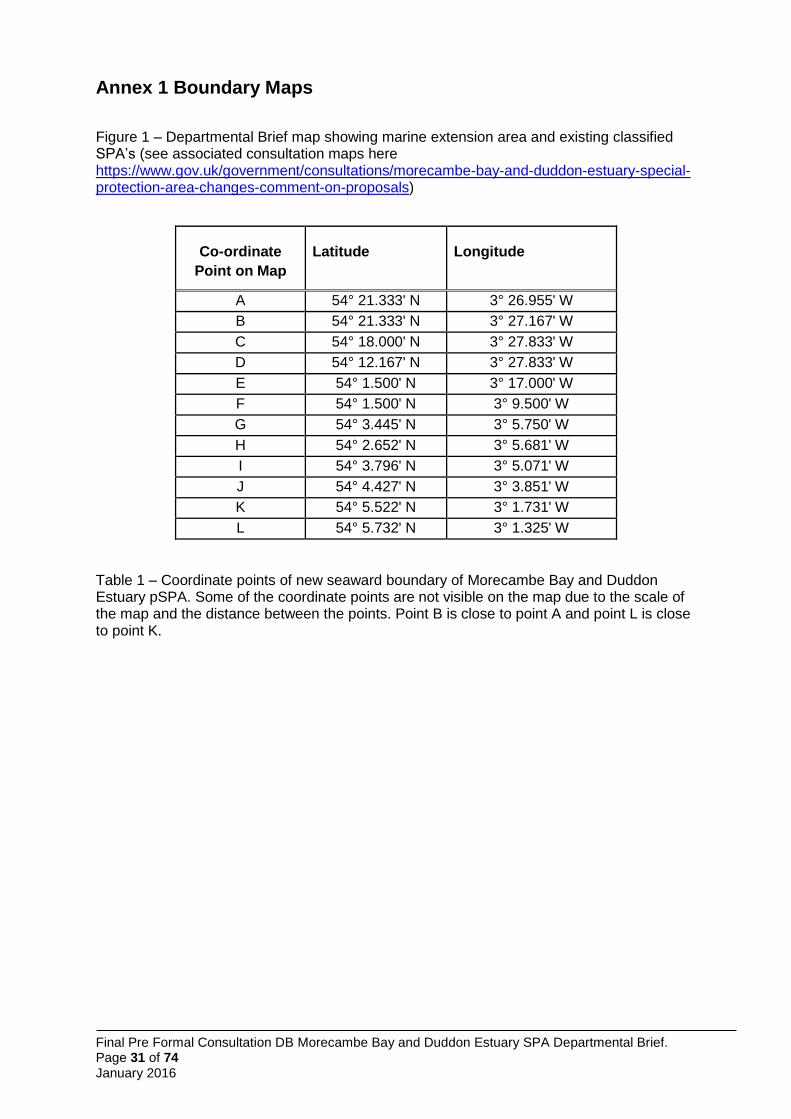
Final Pre Formal Consultation DB Morecambe Bay and Duddon Estuary SPA Departmental Brief. Page 31 of 74 January 2016
Annex 1 Boundary Maps
Figure 1 – Departmental Brief map showing marine extension area and existing classified SPA’s (see associated consultation maps here https://www.gov.uk/government/consultations/morecambe-bay-and-duddon-estuary-special-protection-area-changes-comment-on-proposals)
Co-ordinate
Point on Map
Latitude Longitude
A 54° 21.333' N 3° 26.955' W
B 54° 21.333' N 3° 27.167' W
C 54° 18.000' N 3° 27.833' W
D 54° 12.167' N 3° 27.833' W
E 54° 1.500' N 3° 17.000' W
F 54° 1.500' N 3° 9.500' W
G 54° 3.445' N 3° 5.750' W
H 54° 2.652' N 3° 5.681' W
I 54° 3.796' N 3° 5.071' W
J 54° 4.427' N 3° 3.851' W
K 54° 5.522' N 3° 1.731' W
L 54° 5.732' N 3° 1.325' W
Table 1 – Coordinate points of new seaward boundary of Morecambe Bay and Duddon Estuary pSPA. Some of the coordinate points are not visible on the map due to the scale of the map and the distance between the points. Point B is close to point A and point L is close to point K.
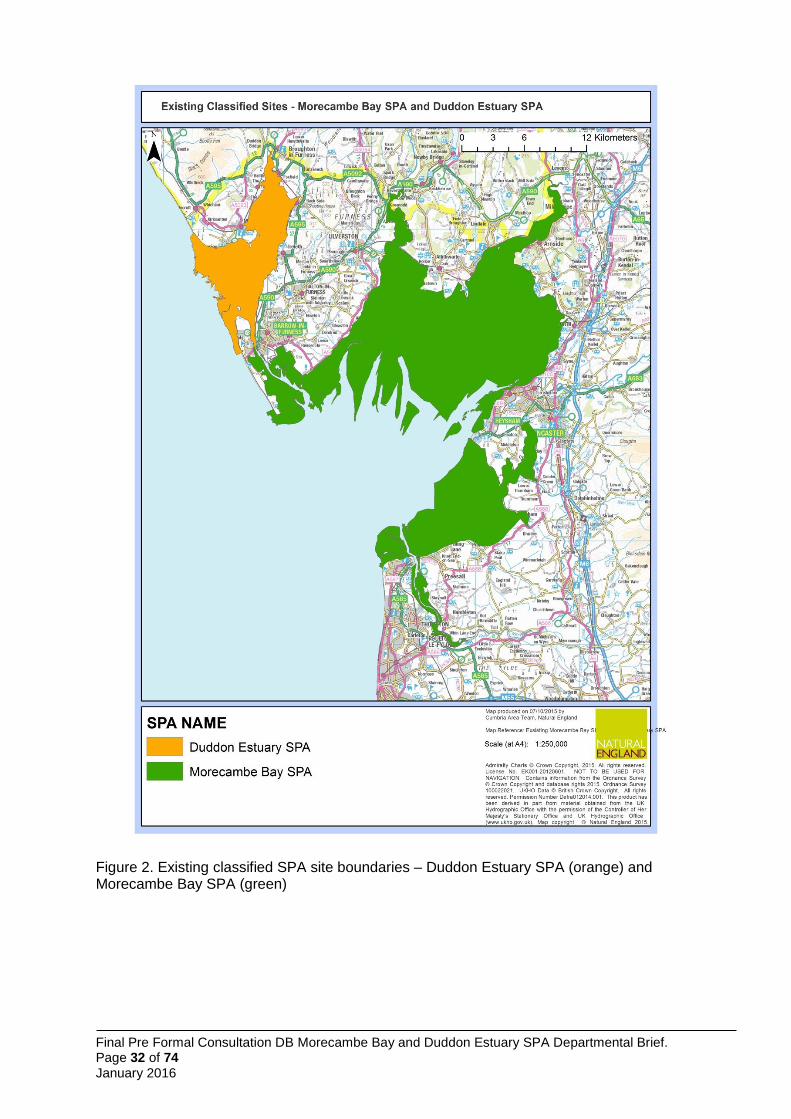
Final Pre Formal Consultation DB Morecambe Bay and Duddon Estuary SPA Departmental Brief. Page 32 of 74 January 2016
Figure 2. Existing classified SPA site boundaries – Duddon Estuary SPA (orange) and Morecambe Bay SPA (green)
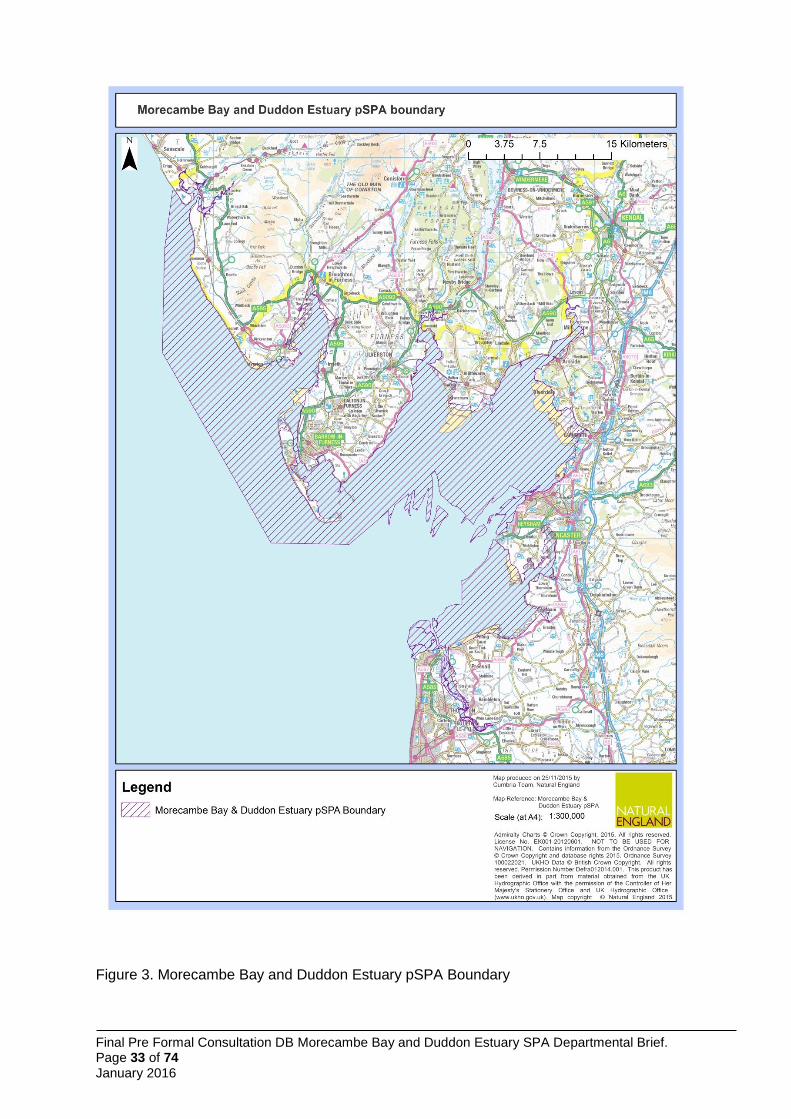
Final Pre Formal Consultation DB Morecambe Bay and Duddon Estuary SPA Departmental Brief. Page 33 of 74 January 2016
Figure 3. Morecambe Bay and Duddon Estuary pSPA Boundary
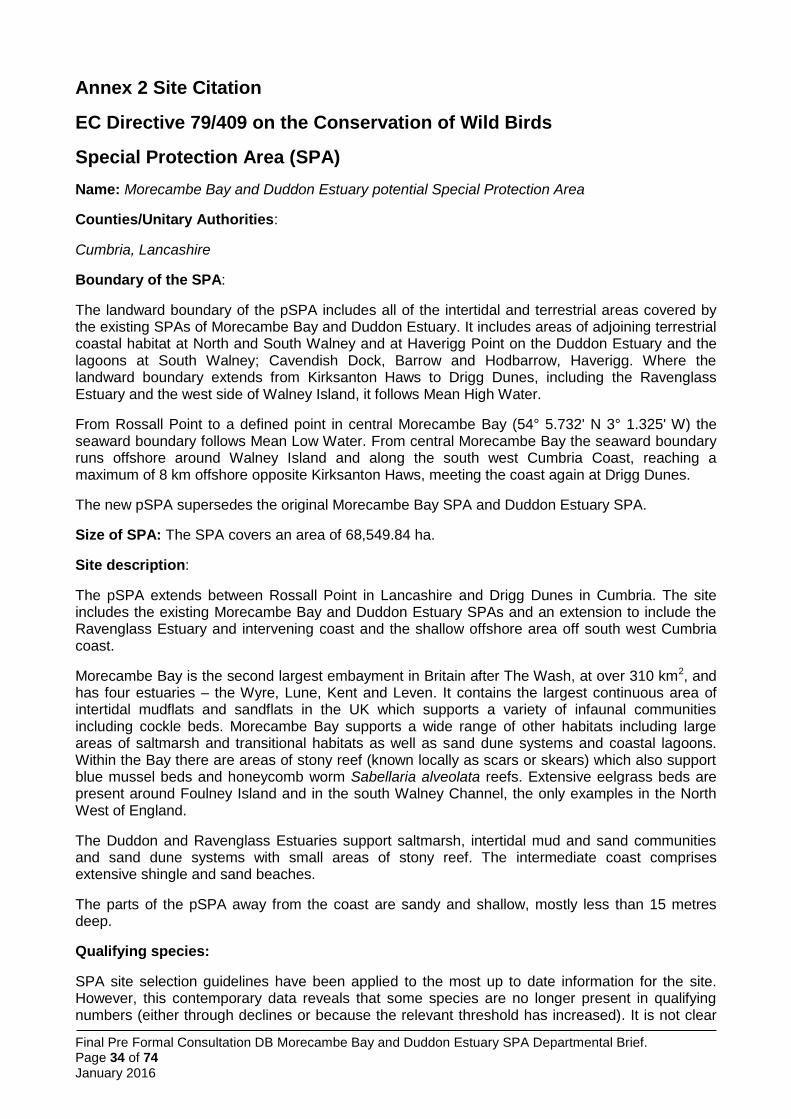
Final Pre Formal Consultation DB Morecambe Bay and Duddon Estuary SPA Departmental Brief. Page 34 of 74 January 2016
Annex 2 Site Citation
EC Directive 79/409 on the Conservation of Wild Birds
Special Protection Area (SPA)
Name: Morecambe Bay and Duddon Estuary potential Special Protection Area
Counties/Unitary Authorities:
Cumbria, Lancashire
Boundary of the SPA:
The landward boundary of the pSPA includes all of the intertidal and terrestrial areas covered by the existing SPAs of Morecambe Bay and Duddon Estuary. It includes areas of adjoining terrestrial coastal habitat at North and South Walney and at Haverigg Point on the Duddon Estuary and the lagoons at South Walney; Cavendish Dock, Barrow and Hodbarrow, Haverigg. Where the landward boundary extends from Kirksanton Haws to Drigg Dunes, including the Ravenglass Estuary and the west side of Walney Island, it follows Mean High Water.
From Rossall Point to a defined point in central Morecambe Bay (54° 5.732' N 3° 1.325' W) the seaward boundary follows Mean Low Water. From central Morecambe Bay the seaward boundary runs offshore around Walney Island and along the south west Cumbria Coast, reaching a maximum of 8 km offshore opposite Kirksanton Haws, meeting the coast again at Drigg Dunes.
The new pSPA supersedes the original Morecambe Bay SPA and Duddon Estuary SPA.
Size of SPA: The SPA covers an area of 68,549.84 ha.
Site description:
The pSPA extends between Rossall Point in Lancashire and Drigg Dunes in Cumbria. The site includes the existing Morecambe Bay and Duddon Estuary SPAs and an extension to include the Ravenglass Estuary and intervening coast and the shallow offshore area off south west Cumbria coast.
Morecambe Bay is the second largest embayment in Britain after The Wash, at over 310 km2, and has four estuaries – the Wyre, Lune, Kent and Leven. It contains the largest continuous area of intertidal mudflats and sandflats in the UK which supports a variety of infaunal communities including cockle beds. Morecambe Bay supports a wide range of other habitats including large areas of saltmarsh and transitional habitats as well as sand dune systems and coastal lagoons. Within the Bay there are areas of stony reef (known locally as scars or skears) which also support blue mussel beds and honeycomb worm Sabellaria alveolata reefs. Extensive eelgrass beds are present around Foulney Island and in the south Walney Channel, the only examples in the North West of England.
The Duddon and Ravenglass Estuaries support saltmarsh, intertidal mud and sand communities and sand dune systems with small areas of stony reef. The intermediate coast comprises extensive shingle and sand beaches.
The parts of the pSPA away from the coast are sandy and shallow, mostly less than 15 metres deep.
Qualifying species:
SPA site selection guidelines have been applied to the most up to date information for the site. However, this contemporary data reveals that some species are no longer present in qualifying numbers (either through declines or because the relevant threshold has increased). It is not clear
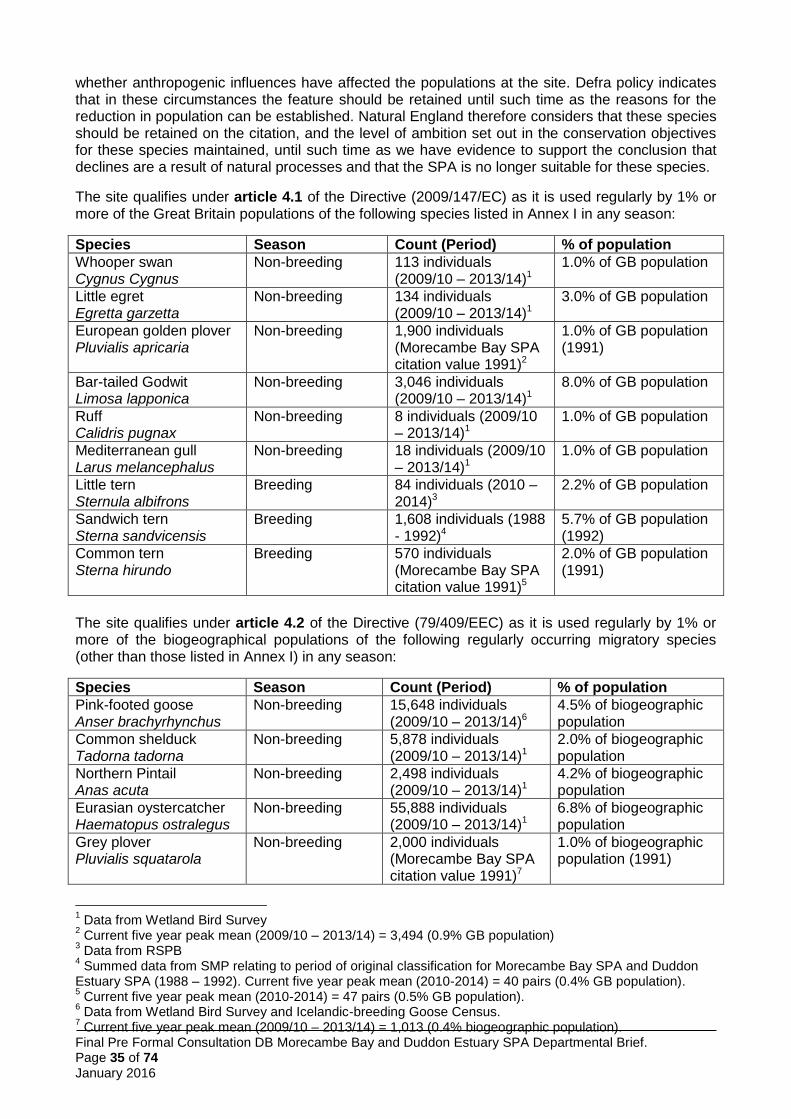
Final Pre Formal Consultation DB Morecambe Bay and Duddon Estuary SPA Departmental Brief. Page 35 of 74 January 2016
whether anthropogenic influences have affected the populations at the site. Defra policy indicates that in these circumstances the feature should be retained until such time as the reasons for the reduction in population can be established. Natural England therefore considers that these species should be retained on the citation, and the level of ambition set out in the conservation objectives for these species maintained, until such time as we have evidence to support the conclusion that declines are a result of natural processes and that the SPA is no longer suitable for these species.
The site qualifies under article 4.1 of the Directive (2009/147/EC) as it is used regularly by 1% or more of the Great Britain populations of the following species listed in Annex I in any season:
Species Season Count (Period) % of population
Whooper swan Cygnus Cygnus
Non-breeding 113 individuals (2009/10 – 2013/14)1
1.0% of GB population
Little egret Egretta garzetta
Non-breeding 134 individuals (2009/10 – 2013/14)1
3.0% of GB population
European golden plover Pluvialis apricaria
Non-breeding 1,900 individuals (Morecambe Bay SPA citation value 1991)2
1.0% of GB population (1991)
Bar-tailed Godwit Limosa lapponica
Non-breeding 3,046 individuals (2009/10 – 2013/14)1
8.0% of GB population
Ruff Calidris pugnax
Non-breeding 8 individuals (2009/10 – 2013/14)1
1.0% of GB population
Mediterranean gull Larus melancephalus
Non-breeding 18 individuals (2009/10 – 2013/14)1
1.0% of GB population
Little tern Sternula albifrons
Breeding 84 individuals (2010 – 2014)3
2.2% of GB population
Sandwich tern Sterna sandvicensis
Breeding 1,608 individuals (1988 - 1992)4
5.7% of GB population (1992)
Common tern Sterna hirundo
Breeding 570 individuals (Morecambe Bay SPA citation value 1991)5
2.0% of GB population (1991)
The site qualifies under article 4.2 of the Directive (79/409/EEC) as it is used regularly by 1% or more of the biogeographical populations of the following regularly occurring migratory species (other than those listed in Annex I) in any season:
Species Season Count (Period) % of population
Pink-footed goose Anser brachyrhynchus
Non-breeding 15,648 individuals (2009/10 – 2013/14)6
4.5% of biogeographic population
Common shelduck Tadorna tadorna
Non-breeding 5,878 individuals (2009/10 – 2013/14)1
2.0% of biogeographic population
Northern Pintail Anas acuta
Non-breeding 2,498 individuals (2009/10 – 2013/14)1
4.2% of biogeographic population
Eurasian oystercatcher Haematopus ostralegus
Non-breeding 55,888 individuals (2009/10 – 2013/14)1
6.8% of biogeographic population
Grey plover Pluvialis squatarola
Non-breeding 2,000 individuals (Morecambe Bay SPA citation value 1991)7
1.0% of biogeographic population (1991)
1 Data from Wetland Bird Survey
2 Current five year peak mean (2009/10 – 2013/14) = 3,494 (0.9% GB population)
3 Data from RSPB
4 Summed data from SMP relating to period of original classification for Morecambe Bay SPA and Duddon
Estuary SPA (1988 – 1992). Current five year peak mean (2010-2014) = 40 pairs (0.4% GB population). 5 Current five year peak mean (2010-2014) = 47 pairs (0.5% GB population).
6 Data from Wetland Bird Survey and Icelandic-breeding Goose Census.
7 Current five year peak mean (2009/10 – 2013/14) = 1,013 (0.4% biogeographic population).
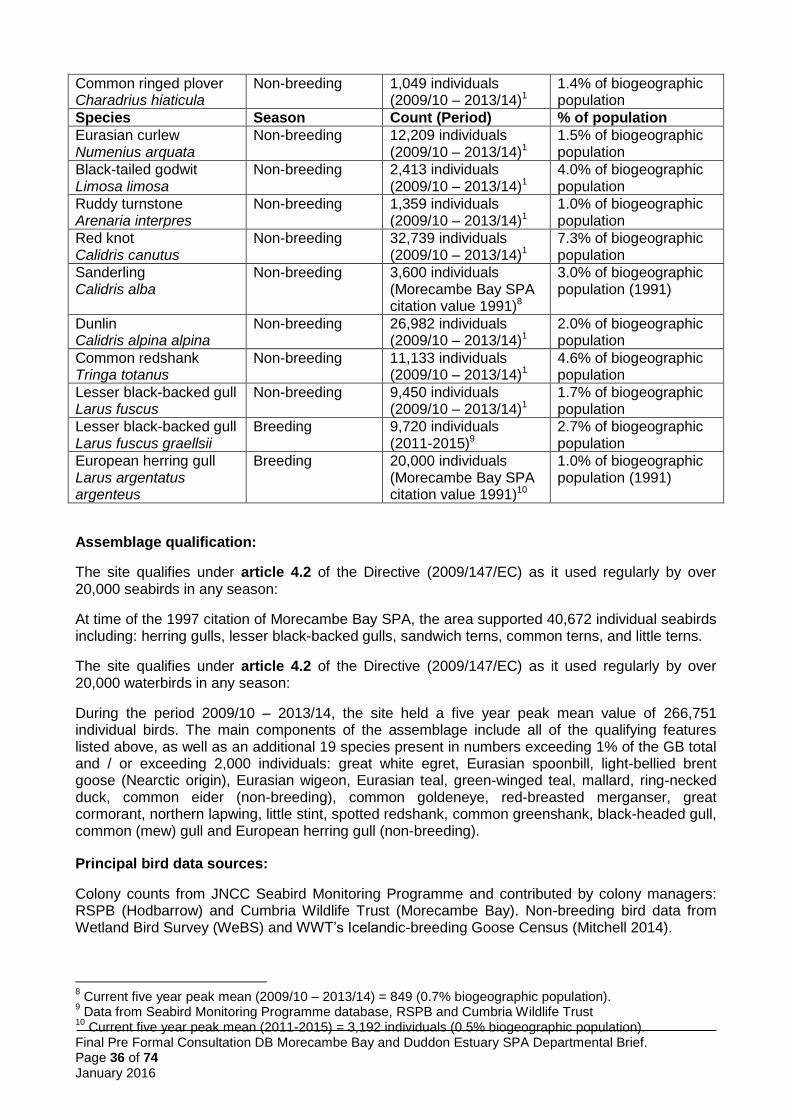
Final Pre Formal Consultation DB Morecambe Bay and Duddon Estuary SPA Departmental Brief. Page 36 of 74 January 2016
Common ringed plover Charadrius hiaticula
Non-breeding 1,049 individuals (2009/10 – 2013/14)1
1.4% of biogeographic population
Species Season Count (Period) % of population
Eurasian curlew Numenius arquata
Non-breeding 12,209 individuals (2009/10 – 2013/14)1
1.5% of biogeographic population
Black-tailed godwit Limosa limosa
Non-breeding 2,413 individuals (2009/10 – 2013/14)1
4.0% of biogeographic population
Ruddy turnstone Arenaria interpres
Non-breeding 1,359 individuals (2009/10 – 2013/14)1
1.0% of biogeographic population
Red knot Calidris canutus
Non-breeding 32,739 individuals (2009/10 – 2013/14)1
7.3% of biogeographic population
Sanderling Calidris alba
Non-breeding 3,600 individuals (Morecambe Bay SPA citation value 1991)8
3.0% of biogeographic population (1991)
Dunlin Calidris alpina alpina
Non-breeding 26,982 individuals (2009/10 – 2013/14)1
2.0% of biogeographic population
Common redshank Tringa totanus
Non-breeding 11,133 individuals (2009/10 – 2013/14)1
4.6% of biogeographic population
Lesser black-backed gull Larus fuscus
Non-breeding 9,450 individuals (2009/10 – 2013/14)1
1.7% of biogeographic population
Lesser black-backed gull Larus fuscus graellsii
Breeding 9,720 individuals (2011-2015)9
2.7% of biogeographic population
European herring gull Larus argentatus argenteus
Breeding 20,000 individuals (Morecambe Bay SPA citation value 1991)10
1.0% of biogeographic population (1991)
Assemblage qualification:
The site qualifies under article 4.2 of the Directive (2009/147/EC) as it used regularly by over 20,000 seabirds in any season:
At time of the 1997 citation of Morecambe Bay SPA, the area supported 40,672 individual seabirds including: herring gulls, lesser black-backed gulls, sandwich terns, common terns, and little terns.
The site qualifies under article 4.2 of the Directive (2009/147/EC) as it used regularly by over 20,000 waterbirds in any season:
During the period 2009/10 – 2013/14, the site held a five year peak mean value of 266,751 individual birds. The main components of the assemblage include all of the qualifying features listed above, as well as an additional 19 species present in numbers exceeding 1% of the GB total and / or exceeding 2,000 individuals: great white egret, Eurasian spoonbill, light-bellied brent goose (Nearctic origin), Eurasian wigeon, Eurasian teal, green-winged teal, mallard, ring-necked duck, common eider (non-breeding), common goldeneye, red-breasted merganser, great cormorant, northern lapwing, little stint, spotted redshank, common greenshank, black-headed gull, common (mew) gull and European herring gull (non-breeding).
Principal bird data sources:
Colony counts from JNCC Seabird Monitoring Programme and contributed by colony managers: RSPB (Hodbarrow) and Cumbria Wildlife Trust (Morecambe Bay). Non-breeding bird data from Wetland Bird Survey (WeBS) and WWT’s Icelandic-breeding Goose Census (Mitchell 2014).
8 Current five year peak mean (2009/10 – 2013/14) = 849 (0.7% biogeographic population).
9 Data from Seabird Monitoring Programme database, RSPB and Cumbria Wildlife Trust
10 Current five year peak mean (2011-2015) = 3,192 individuals (0.5% biogeographic population).
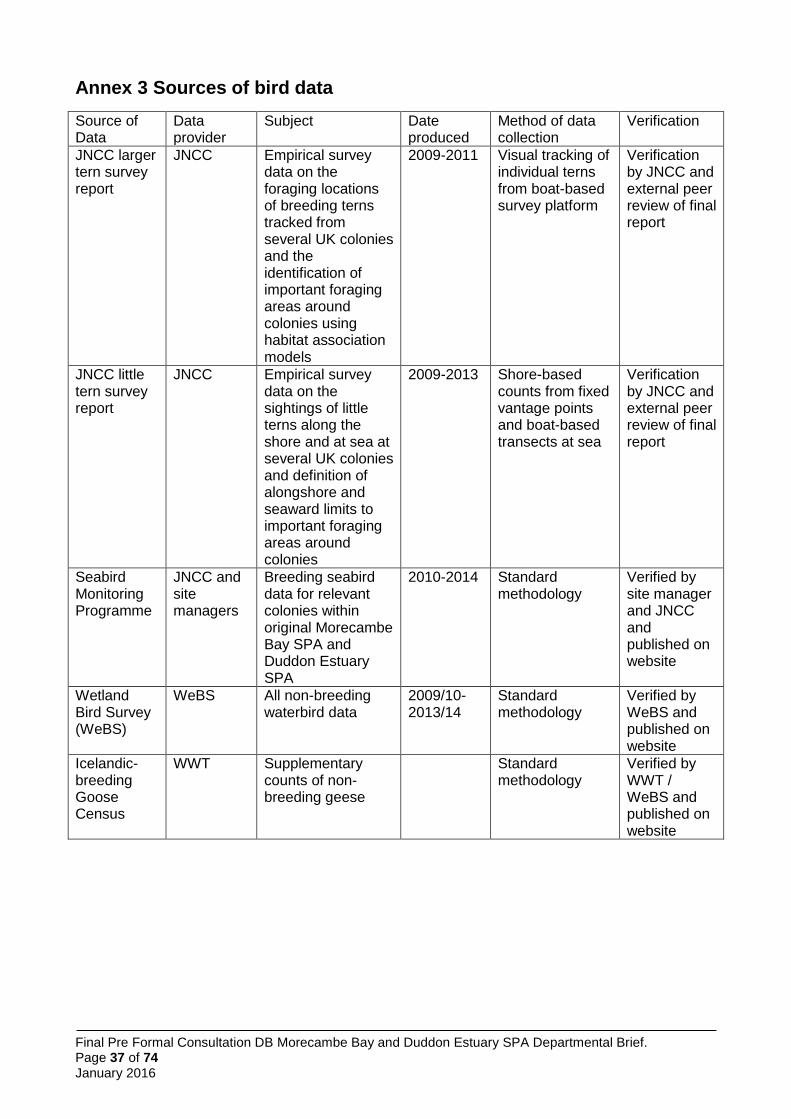
Final Pre Formal Consultation DB Morecambe Bay and Duddon Estuary SPA Departmental Brief. Page 37 of 74 January 2016
Annex 3 Sources of bird data
Source of Data
Data provider
Subject Date produced
Method of data collection
Verification
JNCC larger tern survey report
JNCC Empirical survey data on the foraging locations of breeding terns tracked from several UK colonies and the identification of important foraging areas around colonies using habitat association models
2009-2011 Visual tracking of individual terns from boat-based survey platform
Verification by JNCC and external peer review of final report
JNCC little tern survey report
JNCC Empirical survey data on the sightings of little terns along the shore and at sea at several UK colonies and definition of alongshore and seaward limits to important foraging areas around colonies
2009-2013 Shore-based counts from fixed vantage points and boat-based transects at sea
Verification by JNCC and external peer review of final report
Seabird Monitoring Programme
JNCC and site managers
Breeding seabird data for relevant colonies within original Morecambe Bay SPA and Duddon Estuary SPA
2010-2014 Standard methodology
Verified by site manager and JNCC and published on website
Wetland Bird Survey (WeBS)
WeBS All non-breeding waterbird data
2009/10-2013/14
Standard methodology
Verified by WeBS and published on website
Icelandic-breeding Goose Census
WWT Supplementary counts of non-breeding geese
Standard methodology
Verified by WWT / WeBS and published on website
Final Pre Formal Consultation DB Morecambe Bay and Duddon Estuary SPA Departmental Brief. Page 38 of 74 January 2016
Annex 4 Defining little tern foraging areas and seaward boundary
1. Background and overview
All five species of tern that breed in the UK (Arctic Sterna paradisaea, common S. hirundo, Sandwich S. sandvicensis, roseate S. dougallii and little tern Sternula albifrons) are listed as rare and vulnerable on Annex I of the EU Birds Directive and thus are subject to special conservation measures including the classification of Special Protection Areas (SPAs). Little terns nest on sand or shingle beaches, islets and spits, often very close to the high water mark and are among the rarest seabird species breeding in the UK. There are currently 28 breeding colony SPAs designated within which little terns are protected. The marine areas they use while foraging have not yet been identified and classified as SPAs to complement the existing terrestrial suite. Since 2009, the JNCC has been working with the four Statutory Nature Conservation Bodies (SNCBs) towards the identification of such areas.
This annex gives an overview of the survey and analytical work carried out by and on behalf of JNCC between 2009 and 2013 for little tern. This work focussed on those colony SPAs which have been regularly occupied1 by significant numbers of little tern pairs over the last 5-10 years (13 colony SPAs). Shore-based and boat-based survey work was undertaken which allowed characterisation of the distances that little terns fly from their colony in order to forage. Boundaries of important foraging areas were drawn based on the distances which little terns fly along the coast, and distances which they fly out to sea (Parsons et al. 2015 http://jncc.defra.gov.uk/page-6976).
2. Data collection
The study aimed to provide three years of colony specific data for all regularly occupied breeding SPAs of little terns. However logistics, colony failure, and other factors meant the data coverage for each colony varied. Surveys were timed to coincide as far as possible with chick rearing, which is the period of greatest energetic demand during the breeding season and therefore critical to the maintenance of the population.
Two types of survey (boat- and shore-based observations) were applied in order to estimate both seaward as well as alongshore (coastal) extent of little tern foraging areas.
2.1. Seaward extent of little tern distribution (boat-based survey)
Boat-based surveys were carried out to assess how far out at sea foraging little terns would range (i.e. to confirm their maximum seaward foraging extent). Surveys involved travelling along a series of parallel lines through a survey area around each colony. These surveys extended to 6 km from the coast to approximate the expected mean maximum foraging range (e.g. Thaxter et al. 2012) and preliminary JNCC observations. Two methods of recording little terns along a transect line were employed: (i) Instantaneous counts undertaken systematically at pre-determined points (between 300 m and 1800 m apart). The instantaneous count area was an 180º arc either ahead of, or to one side of, the boat depending on viewing conditions. All birds seen within this arc (out to a maximum estimated distance of 300 m) were recorded, along with the distance and bearing of the sighting and information on behaviour; (ii) Continuous counts of any little terns observed between the instantaneous points were also recorded to provide an index of relative abundance. Although observers recorded behaviour (foraging/flying), restricting the analysis to just foraging observations would have limited the sample size. Therefore, all records (foraging and not foraging) were included in the analyses.
1 ‘Regularly occupied’ was defined where the mean peak breeding numbers of the most recent five years at the time of
assessment equalled or exceeded the 1% of the national population. Colony counts were provided by the Seabird
Monitoring Programme (www.jncc.defra. gov.uk/page-1550) and direct from site managers.
Final Pre Formal Consultation DB Morecambe Bay and Duddon Estuary SPA Departmental Brief. Page 39 of 74 January 2016
2.2. Alongshore extent of little tern distribution (shore-based surveys)
Shore-based observations aimed to assess to what extent little terns forage away from their colony along the coastal strip. Observation points were chosen at 1 km intervals to either side of the colony, up to a distance of 6 km along the coast, according to the mean maximum foraging range indicated by the literature. If preliminary observations found birds going further than 6 km, more observation points were added at successive 1 km intervals. Birds were counted within a distance of 300 m to either side of the observation point (resulting in a 180° arc). The shore based counts recorded passage rate and foraging use and if possible snapshot counts at one minute or two minute intervals were also recorded. The aim of the snapshot counts was to provide information on the intensity of foraging at each observation point. Ideally, counts at different observation points were done concurrently, lasting at least 30 minutes at each observation point. This time is based on the mean foraging trip duration for little terns lasting 16–29 minutes according to Perrow et al. (2006). However, in some cases this was not possible due to time constraints and/or logistical difficulties. In order to account for this difference in effort between observation points the shore-based count data were standardised to the number of birds observed per minute at each observation point. Care was taken to cover a range of tidal states, as variations in water levels between the times of high and low water are likely to play a significant role in determining the foraging locations of terns.
To ensure that the data were comparable between sites the samples were analysed as a proportion of the total birds counted (per minute) at the first count point (usually 1 km) in either direction alongshore from the colony. Each side of the colony was analysed as a separate sample. This approach assumes that 100% of birds leaving the colony in a particular direction reach the first count point, and that all birds reaching subsequent count points have passed through (and had been counted at) point one on their way.
3. Data analysis
The density of little terns within each survey area was relatively small, leading to small numbers of observations within boat transects and shore based count points. This was particularly evident at the colonies with fewer breeding pairs. Given this, techniques successfully used for defining boundaries in areas of importance for other seabird and waterfowl species such as interpolation based on analyses of transect data to yield density maps (O’Brien et al. 2012) could not be used. Furthermore, the small foraging range of the little terns precluded application of the habitat association modelling approach used for larger terns (Annex 5). Accordingly, JNCC developed a method for boundary delineation with this type of data.
The approach developed to boundary setting was based on use of simple metrics that could be derived from the boat-based and shore-based survey data collected at each site. At colonies where sufficient site-specific data were available, these were used to determine the values of these metrics. Colony size and density had only a weak effect on the extent of little tern foraging ranges, so for colonies where there were insufficient or no data, averages of all the colony specific values were used to define seaward and alongshore boundaries. These options are set out in more detail below.
3.1. Site-specific options
For colonies with sufficient data to describe either or both seaward and alongshore extents, the
following site-specific metrics were used to define boundaries:
A) Seaward extent
The site-specific seaward extent of foraging areas was determined by the mean of the maximum extents of little tern observations from repeated surveys at that site.
Using the mean of the maximum seaward observations across repeated surveys aims to represent
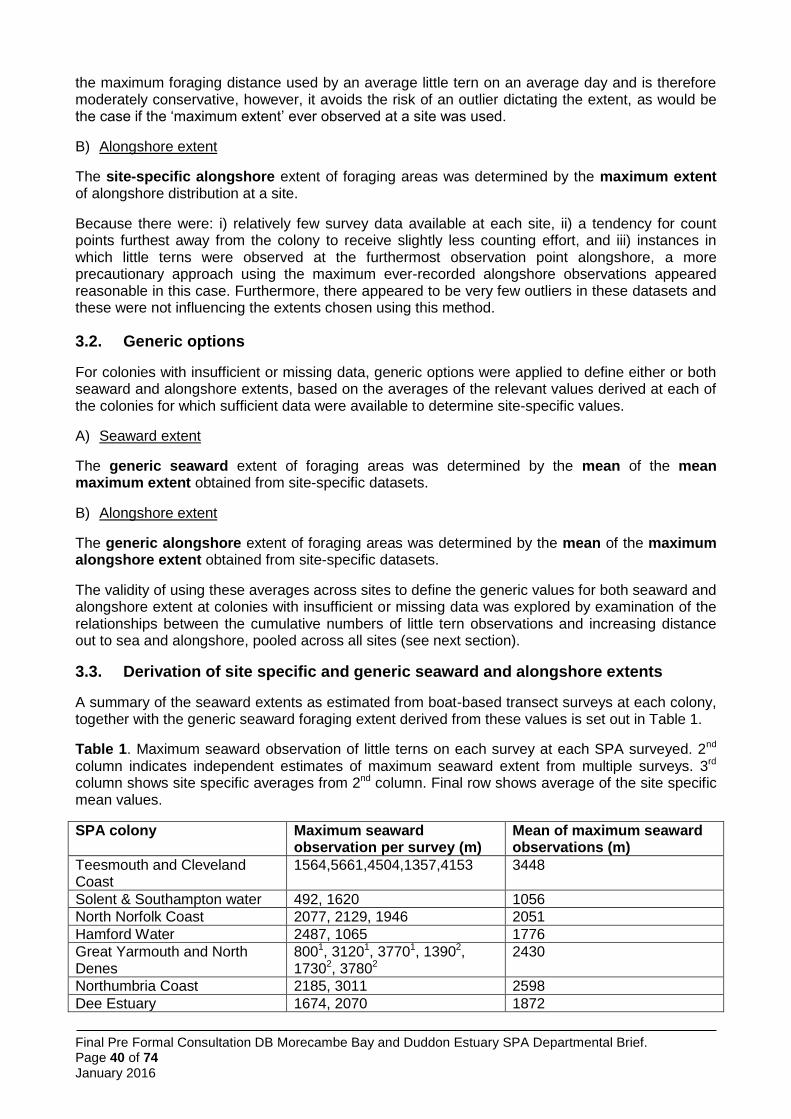
Final Pre Formal Consultation DB Morecambe Bay and Duddon Estuary SPA Departmental Brief. Page 40 of 74 January 2016
the maximum foraging distance used by an average little tern on an average day and is therefore moderately conservative, however, it avoids the risk of an outlier dictating the extent, as would be the case if the ‘maximum extent’ ever observed at a site was used.
B) Alongshore extent
The site-specific alongshore extent of foraging areas was determined by the maximum extent of alongshore distribution at a site.
Because there were: i) relatively few survey data available at each site, ii) a tendency for count points furthest away from the colony to receive slightly less counting effort, and iii) instances in which little terns were observed at the furthermost observation point alongshore, a more precautionary approach using the maximum ever-recorded alongshore observations appeared reasonable in this case. Furthermore, there appeared to be very few outliers in these datasets and these were not influencing the extents chosen using this method.
3.2. Generic options
For colonies with insufficient or missing data, generic options were applied to define either or both seaward and alongshore extents, based on the averages of the relevant values derived at each of the colonies for which sufficient data were available to determine site-specific values.
A) Seaward extent
The generic seaward extent of foraging areas was determined by the mean of the mean maximum extent obtained from site-specific datasets.
B) Alongshore extent
The generic alongshore extent of foraging areas was determined by the mean of the maximum alongshore extent obtained from site-specific datasets.
The validity of using these averages across sites to define the generic values for both seaward and alongshore extent at colonies with insufficient or missing data was explored by examination of the relationships between the cumulative numbers of little tern observations and increasing distance out to sea and alongshore, pooled across all sites (see next section).
3.3. Derivation of site specific and generic seaward and alongshore extents
A summary of the seaward extents as estimated from boat-based transect surveys at each colony, together with the generic seaward foraging extent derived from these values is set out in Table 1.
Table 1. Maximum seaward observation of little terns on each survey at each SPA surveyed. 2nd column indicates independent estimates of maximum seaward extent from multiple surveys. 3rd column shows site specific averages from 2nd column. Final row shows average of the site specific mean values.
SPA colony Maximum seaward observation per survey (m)
Mean of maximum seaward observations (m)
Teesmouth and Cleveland Coast
1564,5661,4504,1357,4153 3448
Solent & Southampton water 492, 1620 1056
North Norfolk Coast 2077, 2129, 1946 2051
Hamford Water 2487, 1065 1776
Great Yarmouth and North Denes
8001, 31201, 37701, 13902, 17302, 37802
2430
Northumbria Coast 2185, 3011 2598
Dee Estuary 1674, 2070 1872
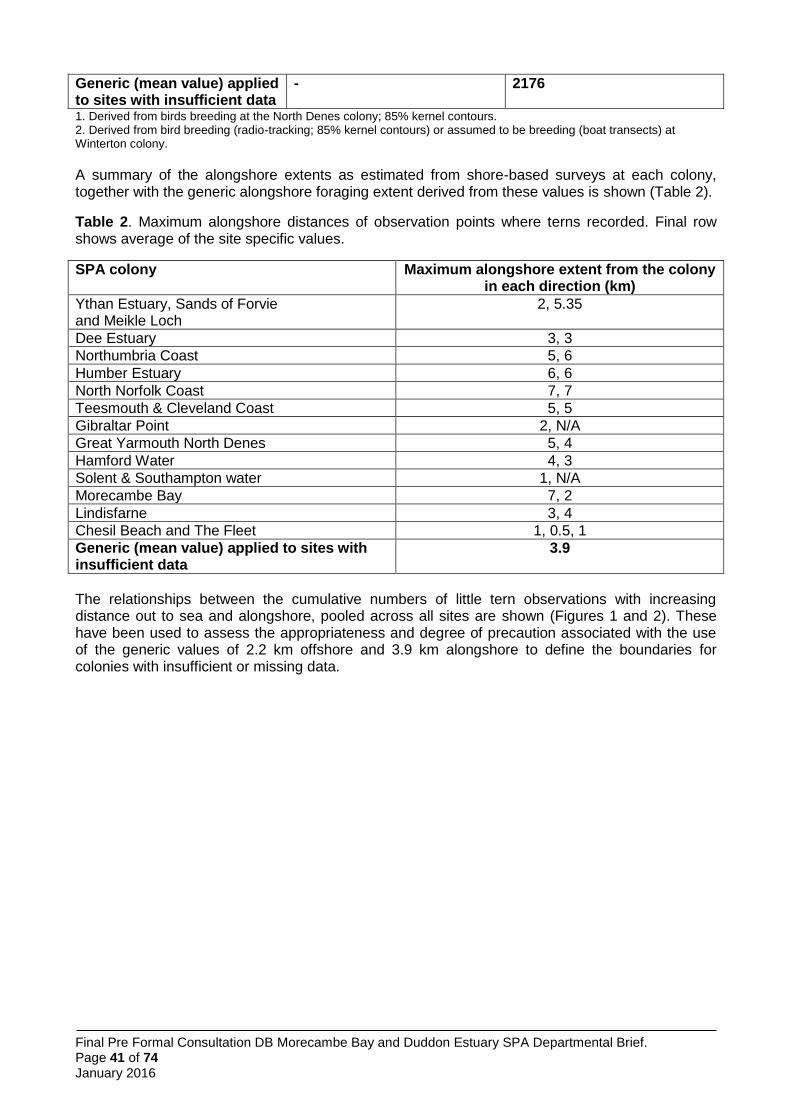
Final Pre Formal Consultation DB Morecambe Bay and Duddon Estuary SPA Departmental Brief. Page 41 of 74 January 2016
Generic (mean value) applied to sites with insufficient data
- 2176
1. Derived from birds breeding at the North Denes colony; 85% kernel contours. 2. Derived from bird breeding (radio-tracking; 85% kernel contours) or assumed to be breeding (boat transects) at Winterton colony.
A summary of the alongshore extents as estimated from shore-based surveys at each colony, together with the generic alongshore foraging extent derived from these values is shown (Table 2).
Table 2. Maximum alongshore distances of observation points where terns recorded. Final row shows average of the site specific values.
SPA colony Maximum alongshore extent from the colony in each direction (km)
Ythan Estuary, Sands of Forvie and Meikle Loch
2, 5.35
Dee Estuary 3, 3
Northumbria Coast 5, 6
Humber Estuary 6, 6
North Norfolk Coast 7, 7
Teesmouth & Cleveland Coast 5, 5
Gibraltar Point 2, N/A
Great Yarmouth North Denes 5, 4
Hamford Water 4, 3
Solent & Southampton water 1, N/A
Morecambe Bay 7, 2
Lindisfarne 3, 4
Chesil Beach and The Fleet 1, 0.5, 1
Generic (mean value) applied to sites with insufficient data
3.9
The relationships between the cumulative numbers of little tern observations with increasing distance out to sea and alongshore, pooled across all sites are shown (Figures 1 and 2). These have been used to assess the appropriateness and degree of precaution associated with the use of the generic values of 2.2 km offshore and 3.9 km alongshore to define the boundaries for colonies with insufficient or missing data.
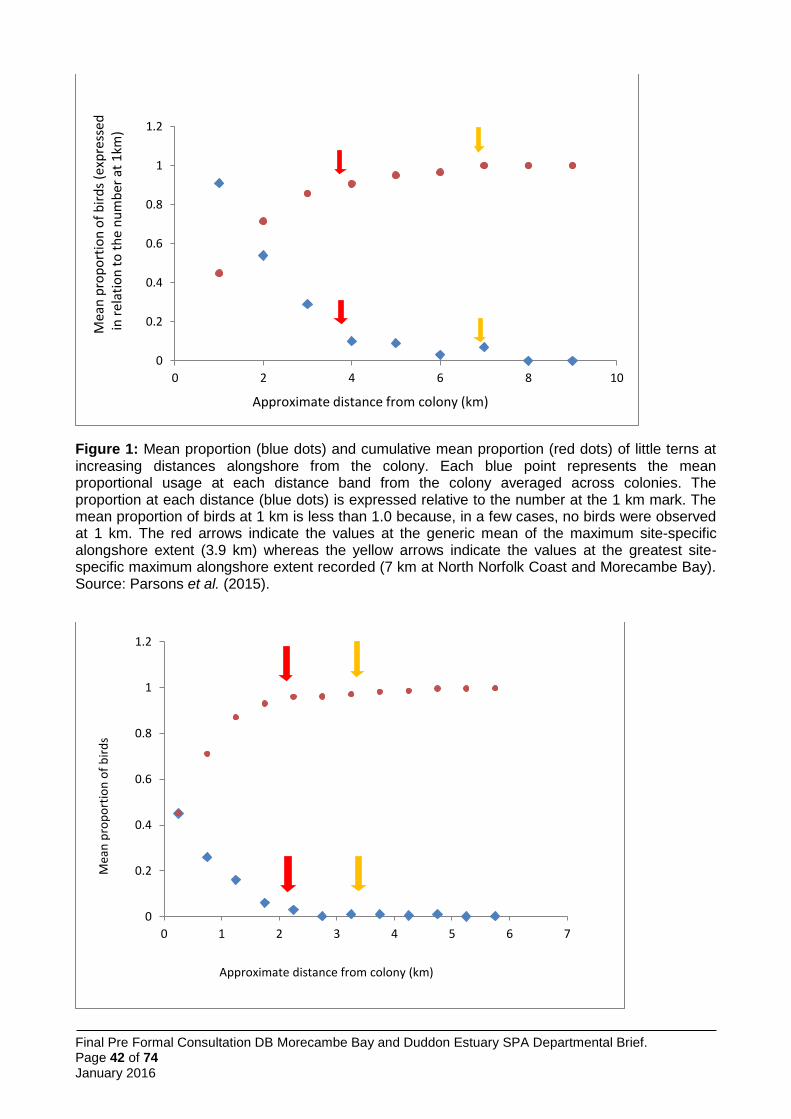
Final Pre Formal Consultation DB Morecambe Bay and Duddon Estuary SPA Departmental Brief. Page 42 of 74 January 2016
Figure 1: Mean proportion (blue dots) and cumulative mean proportion (red dots) of little terns at increasing distances alongshore from the colony. Each blue point represents the mean proportional usage at each distance band from the colony averaged across colonies. The proportion at each distance (blue dots) is expressed relative to the number at the 1 km mark. The mean proportion of birds at 1 km is less than 1.0 because, in a few cases, no birds were observed at 1 km. The red arrows indicate the values at the generic mean of the maximum site-specific alongshore extent (3.9 km) whereas the yellow arrows indicate the values at the greatest site-specific maximum alongshore extent recorded (7 km at North Norfolk Coast and Morecambe Bay). Source: Parsons et al. (2015).
0
0.2
0.4
0.6
0.8
1
1.2
0 2 4 6 8 10
Approximate distance from colony (km)
Mea
n p
rop
ort
ion
of
bir
ds
(exp
ress
ed
in r
ela
tio
n t
o t
he
nu
mb
er a
t 1
km)
0
0.2
0.4
0.6
0.8
1
1.2
0 1 2 3 4 5 6 7
Approximate distance from colony (km)
Mea
n p
rop
ort
ion
of
bir
ds
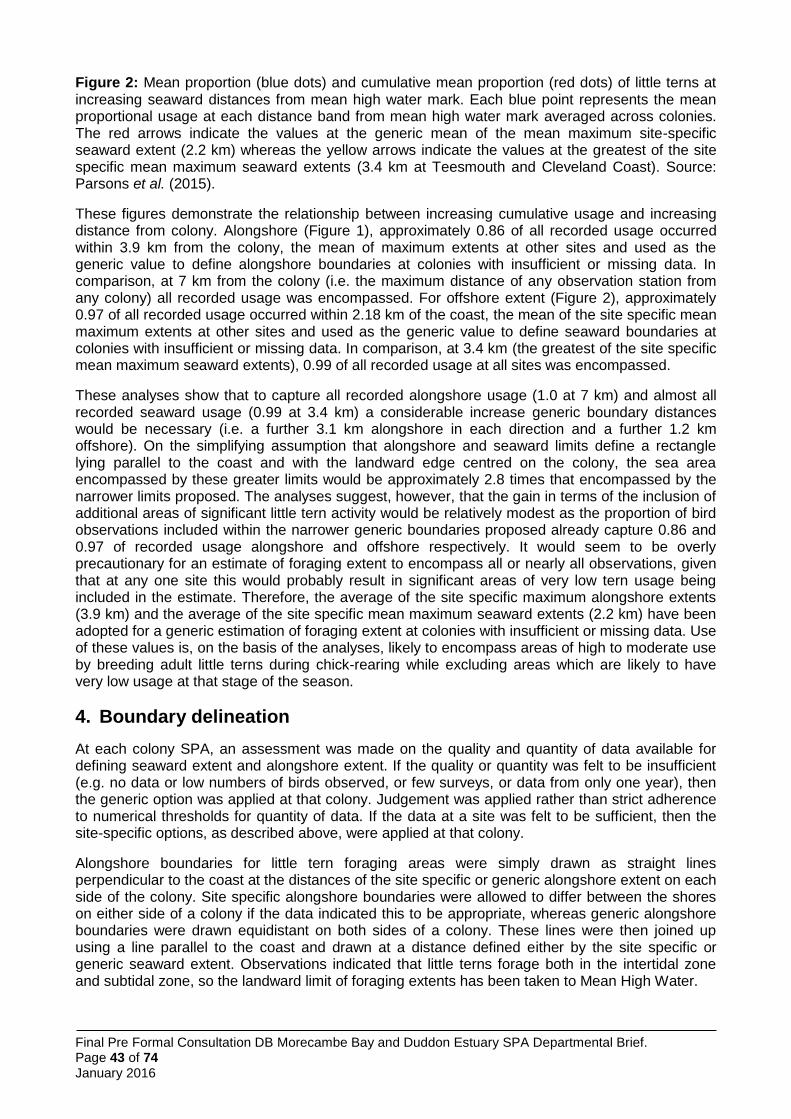
Final Pre Formal Consultation DB Morecambe Bay and Duddon Estuary SPA Departmental Brief. Page 43 of 74 January 2016
Figure 2: Mean proportion (blue dots) and cumulative mean proportion (red dots) of little terns at increasing seaward distances from mean high water mark. Each blue point represents the mean proportional usage at each distance band from mean high water mark averaged across colonies. The red arrows indicate the values at the generic mean of the mean maximum site-specific seaward extent (2.2 km) whereas the yellow arrows indicate the values at the greatest of the site specific mean maximum seaward extents (3.4 km at Teesmouth and Cleveland Coast). Source: Parsons et al. (2015).
These figures demonstrate the relationship between increasing cumulative usage and increasing distance from colony. Alongshore (Figure 1), approximately 0.86 of all recorded usage occurred within 3.9 km from the colony, the mean of maximum extents at other sites and used as the generic value to define alongshore boundaries at colonies with insufficient or missing data. In comparison, at 7 km from the colony (i.e. the maximum distance of any observation station from any colony) all recorded usage was encompassed. For offshore extent (Figure 2), approximately 0.97 of all recorded usage occurred within 2.18 km of the coast, the mean of the site specific mean maximum extents at other sites and used as the generic value to define seaward boundaries at colonies with insufficient or missing data. In comparison, at 3.4 km (the greatest of the site specific mean maximum seaward extents), 0.99 of all recorded usage at all sites was encompassed.
These analyses show that to capture all recorded alongshore usage (1.0 at 7 km) and almost all recorded seaward usage (0.99 at 3.4 km) a considerable increase generic boundary distances would be necessary (i.e. a further 3.1 km alongshore in each direction and a further 1.2 km offshore). On the simplifying assumption that alongshore and seaward limits define a rectangle lying parallel to the coast and with the landward edge centred on the colony, the sea area encompassed by these greater limits would be approximately 2.8 times that encompassed by the narrower limits proposed. The analyses suggest, however, that the gain in terms of the inclusion of additional areas of significant little tern activity would be relatively modest as the proportion of bird observations included within the narrower generic boundaries proposed already capture 0.86 and 0.97 of recorded usage alongshore and offshore respectively. It would seem to be overly precautionary for an estimate of foraging extent to encompass all or nearly all observations, given that at any one site this would probably result in significant areas of very low tern usage being included in the estimate. Therefore, the average of the site specific maximum alongshore extents (3.9 km) and the average of the site specific mean maximum seaward extents (2.2 km) have been adopted for a generic estimation of foraging extent at colonies with insufficient or missing data. Use of these values is, on the basis of the analyses, likely to encompass areas of high to moderate use by breeding adult little terns during chick-rearing while excluding areas which are likely to have very low usage at that stage of the season.
4. Boundary delineation
At each colony SPA, an assessment was made on the quality and quantity of data available for defining seaward extent and alongshore extent. If the quality or quantity was felt to be insufficient (e.g. no data or low numbers of birds observed, or few surveys, or data from only one year), then the generic option was applied at that colony. Judgement was applied rather than strict adherence to numerical thresholds for quantity of data. If the data at a site was felt to be sufficient, then the site-specific options, as described above, were applied at that colony.
Alongshore boundaries for little tern foraging areas were simply drawn as straight lines perpendicular to the coast at the distances of the site specific or generic alongshore extent on each side of the colony. Site specific alongshore boundaries were allowed to differ between the shores on either side of a colony if the data indicated this to be appropriate, whereas generic alongshore boundaries were drawn equidistant on both sides of a colony. These lines were then joined up using a line parallel to the coast and drawn at a distance defined either by the site specific or generic seaward extent. Observations indicated that little terns forage both in the intertidal zone and subtidal zone, so the landward limit of foraging extents has been taken to Mean High Water.
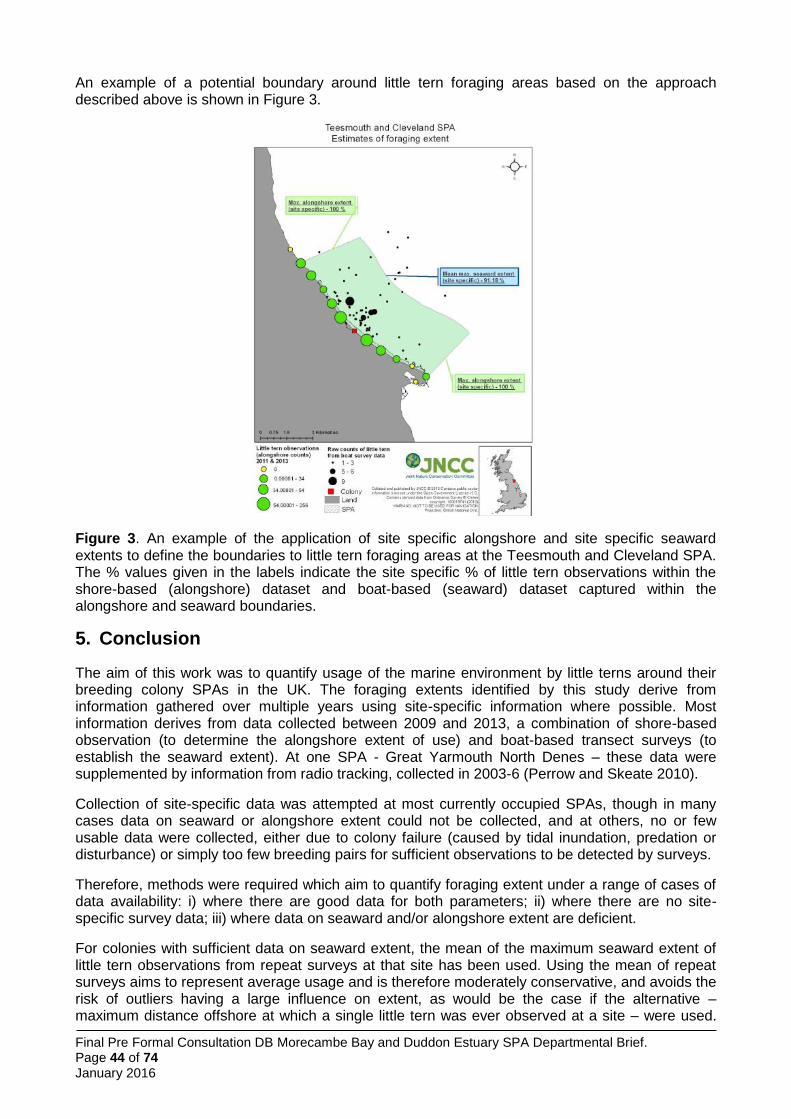
Final Pre Formal Consultation DB Morecambe Bay and Duddon Estuary SPA Departmental Brief. Page 44 of 74 January 2016
An example of a potential boundary around little tern foraging areas based on the approach described above is shown in Figure 3.
Figure 3. An example of the application of site specific alongshore and site specific seaward extents to define the boundaries to little tern foraging areas at the Teesmouth and Cleveland SPA. The % values given in the labels indicate the site specific % of little tern observations within the shore-based (alongshore) dataset and boat-based (seaward) dataset captured within the alongshore and seaward boundaries.
5. Conclusion
The aim of this work was to quantify usage of the marine environment by little terns around their breeding colony SPAs in the UK. The foraging extents identified by this study derive from information gathered over multiple years using site-specific information where possible. Most information derives from data collected between 2009 and 2013, a combination of shore-based observation (to determine the alongshore extent of use) and boat-based transect surveys (to establish the seaward extent). At one SPA - Great Yarmouth North Denes – these data were supplemented by information from radio tracking, collected in 2003-6 (Perrow and Skeate 2010).
Collection of site-specific data was attempted at most currently occupied SPAs, though in many cases data on seaward or alongshore extent could not be collected, and at others, no or few usable data were collected, either due to colony failure (caused by tidal inundation, predation or disturbance) or simply too few breeding pairs for sufficient observations to be detected by surveys.
Therefore, methods were required which aim to quantify foraging extent under a range of cases of data availability: i) where there are good data for both parameters; ii) where there are no site-specific survey data; iii) where data on seaward and/or alongshore extent are deficient.
For colonies with sufficient data on seaward extent, the mean of the maximum seaward extent of little tern observations from repeat surveys at that site has been used. Using the mean of repeat surveys aims to represent average usage and is therefore moderately conservative, and avoids the risk of outliers having a large influence on extent, as would be the case if the alternative – maximum distance offshore at which a single little tern was ever observed at a site – were used.
Final Pre Formal Consultation DB Morecambe Bay and Duddon Estuary SPA Departmental Brief. Page 45 of 74 January 2016
For colonies with sufficient data on alongshore extent, the maximum distance alongshore at which terns were observed has been used, on the basis that because there are relatively few survey data at each site, and the tendency for furthest count points to have received slightly less effort on average, further survey would probably have extended the estimates of range. Because of this, it was judged that choosing the maximum extent at a site would not be excessively precautionary nor would the influence of outliers pose significant risk of over-estimation of extent.
For colonies with no or insufficient data, a method to derive generic extents was developed, based on data collected at other colonies. This aimed to weigh the risks of being overly precautionary (over-estimate foraging extent) or overly conservative (under-estimate foraging extent). Analyses indicated that use of the average across sites of the site specific means of the maximum recorded seaward extents captured 0.97 of all recorded tern observations, while use of the average across sites of the site specific maximum recorded alongshore extent captured 0.86 of all recorded tern observations. This suggested that use of these values at colonies with insufficient data to derive site-specific boundaries to little tern foraging areas would be likely to encompass areas of high to moderate use while excluding areas which are likely to have very low usage during the chick-rearing period.
The colony SPAs selected for study were those assessed to be currently occupied. This, however leaves a number of SPAs where little tern is a feature, where it was judged that little terns are no longer regularly breeding in significant numbers (as well as those currently occupied SPAs where no or few data could be collected). The assessment of occupation of such sites may change with time. This study has provided generic extents that could be applied following changed assessments.
The methods to estimate foraging extents are derived from field surveys and analyses of a nature appropriate to the data and the ecology of the little tern. Habitat modelling, such as that undertaken for the larger tern species (Annex 6) is not appropriate for the little tern, due to the combined effects of their more restricted inherent foraging range and the limited availability of habitat data at a suitable resolution or inshore locations.
The foraging extents of little tern estimated in this study fall within the range identified for little tern in a recent review of foraging ranges (Thaxter et al. 2012). That study identified the mean extent of the three studies included in the review as 2.1 km, with the mean of maxima across studies as 6.3 km. The work by JNCC, on a larger number of colonies, gave a mean maximum extent of 2.2 km, with a range of 1.1-3.4 km (for seaward extent) and a mean maximum of 3.9 km, with a range of 0.5-7 km (for alongshore extent). Eglington (2013), in a literature review of foraging ecology of terns, concluded that most studies, including those citing anecdotal information, reported a foraging radius less than 4 km from the colony, which accords with the results of JNCC’s work.
References
Eglington, S. (2013). Literature review of tern Sterna sp. foraging ecology. Report to JNCC, under Contract ref. C13-0204-0686.
O‟Brien, S. W. (2012). Use of kernel density estimation and maximum curvature to set Marine Protected Area boundaries: Identifying a Special Protection Area for wintering red-throated divers in the UK. Biological Conservation, 156, 15–21. 12 033. doi:10.1016/j.biocon.2011.12.033
Parsons, M., Lawson, J., Lewis, M., Lawrence, R and Kuepfer, A. (2015). Quantifying foraging areas of little tern around its breeding colony SPA during chick-rearing. JNCC report No. 548. May 2015.
Perrow, M.R., Skeate, E.R., Lines, P., Brown, D. & Tomlinson, M.L. (2006). Radio telemetry as a tool for impact assessment of wind farms: the case of Little Terns Sterna albifrons at Scroby Sands, Norfolk, UK. Ibis 148 (Suppl. 1): 57-75.
Final Pre Formal Consultation DB Morecambe Bay and Duddon Estuary SPA Departmental Brief. Page 46 of 74 January 2016
Perrow, M. R., and Skeate, E. R. (2010), Offshore extension of a colony-based Special Protection Area (SPA) for a small seabird, the Little Tern Sternula albifrons. Unpublished report to Natural England.
Thaxter, C.B., Lascelles, B., Sugar, K., Cook, A.S.C.P., Roos, S., Bolton, M., Langston, R.H.W., Burton, N.H.K. (2012): Seabird foraging ranges as a preliminary tool for identifying candidate Marine Protected Areas. Biological Conservation, 156, 53-61. Abstract available at: http://www.researchgate.net/publication/236034521_Seabird_foraging_ranges_as_a_preliminary_tool_for_identifying_candidate_Marine_Protected_Areas/file/3deec515ec5e3a2218.pdf
Final Pre Formal Consultation DB Morecambe Bay and Duddon Estuary SPA Departmental Brief. Page 47 of 74 January 2016
Annex 5 Defining larger tern foraging areas and seaward boundary
1. Background and overview
All five species of tern that breed in the UK (Arctic Sterna paradisaea, common S. hirundo, Sandwich S. sandvicensis, roseate S. dougallii and little tern Sternula albifrons) are listed as rare and vulnerable on Annex I of the EU Birds Directive and thus are subject to special conservation measures including the classification of Special Protection Areas (SPAs). Within the UK there are currently 57 breeding colony SPAs for which at least one species of tern is protected. However, additional important areas for terns at sea have yet to be identified and classified as marine SPAs to complement the existing terrestrial suite. Since 2007, the JNCC has been working with the four Statutory Nature Conservation Bodies (SNCBs) towards the identification of such areas.
The work described here aimed to detect and characterise marine feeding areas used by terns breeding within colony SPAs. Given that at least one of five species of terns occur as an interest feature within 57 colony SPAs spread across the UK, it was recognised that resource and time constraints would preclude the detailed site-specific surveys at all colony SPAs over several years that, in an ideal world, would provide the most robust empirically based characterisation of marine feeding areas used by terns breeding within every colony SPA. Accordingly a statistical modelling approach was adopted which used data collected from a sub-sample of colonies to a) characterise the types of marine environment that are used by foraging terns, and b) use this information to identify potential feeding areas around all colony SPAs.
This annex gives an overview of the survey and analytical work carried out by and on behalf of JNCC between 2009 and 2013 for the four larger tern species (Wilson et al. 2014 http://jncc.defra.gov.uk/page-6644). For the modelling analysis aspect of the project, JNCC worked collaboratively with Biomathematics and Statistics Scotland (BioSS)2.
2. Data collection
To acquire information on the at-sea foraging distributions of breeding terns, three years of targeted data collection were carried out or commissioned by JNCC around selected tern colonies from 2009 to 2011, using the visual-tracking technique3 (see Box 1 for details). The majority of the data were collected during the chick-rearing period (June to early July), a highly demanding period for breeding adult terns due to food gathering for chick feeding and rearing. The need to regularly return to the colony results in a higher number of foraging trips within a generally more restricted foraging range. Accordingly, areas used during this period are considered as crucial for overall survival and are thus high priority for site-based conservation.
2 BioSS are one of the Main Research Providers for strategic research in environmental, agricultural and
biological science funded by the Scottish Government’s Rural and Environment Science and Analytical Services Division. 3 Perrow, M. R., Skeate, E. R. and Gilroy, J. J. (2011). Visual tracking from a rigid-hulled inflatable boat to
determine foraging movements of breeding terns. Journal of Field Ornithology, 82(1), 68-79.
Box 1. Observers on-board a rigid-hulled inflatable boat (RIB) followed individual terns during their foraging trips. An on-board GPS recorded the boat’s track, which was used to represent the track of the bird. Observations commenced immediately adjacent to the SPA colony. The actual starting position was varied to capture the full range of departure directions of the birds. Observers maintained constant visual contact with the bird (by maintaining the RIB c.50-200 m from the bird*) and recorded any incidence of foraging behaviours, along with their associated timings. Behaviours could then be assigned to a distinct location within the GPS track by matching the timings. * This distance was found to be optimal in terms of maintaining visual contact whilst minimising disturbance to the bird
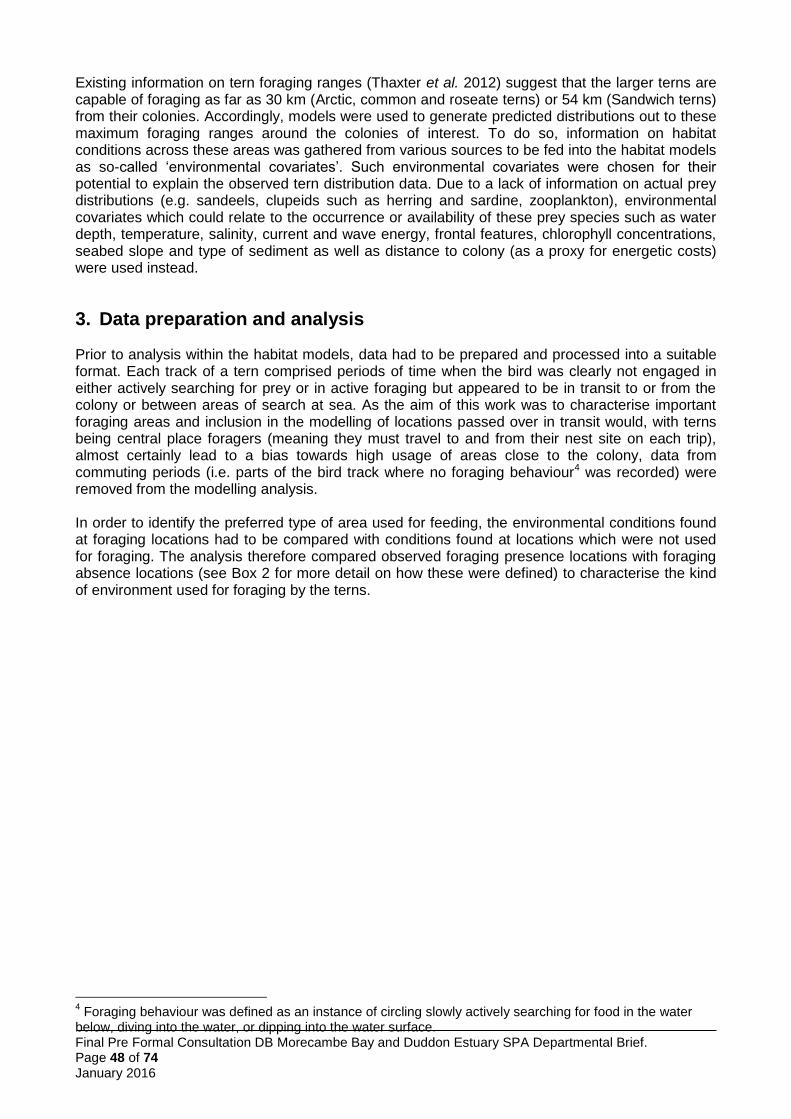
Final Pre Formal Consultation DB Morecambe Bay and Duddon Estuary SPA Departmental Brief. Page 48 of 74 January 2016
Existing information on tern foraging ranges (Thaxter et al. 2012) suggest that the larger terns are capable of foraging as far as 30 km (Arctic, common and roseate terns) or 54 km (Sandwich terns) from their colonies. Accordingly, models were used to generate predicted distributions out to these maximum foraging ranges around the colonies of interest. To do so, information on habitat conditions across these areas was gathered from various sources to be fed into the habitat models as so-called ‘environmental covariates’. Such environmental covariates were chosen for their potential to explain the observed tern distribution data. Due to a lack of information on actual prey distributions (e.g. sandeels, clupeids such as herring and sardine, zooplankton), environmental covariates which could relate to the occurrence or availability of these prey species such as water depth, temperature, salinity, current and wave energy, frontal features, chlorophyll concentrations, seabed slope and type of sediment as well as distance to colony (as a proxy for energetic costs) were used instead.
3. Data preparation and analysis
Prior to analysis within the habitat models, data had to be prepared and processed into a suitable format. Each track of a tern comprised periods of time when the bird was clearly not engaged in either actively searching for prey or in active foraging but appeared to be in transit to or from the colony or between areas of search at sea. As the aim of this work was to characterise important foraging areas and inclusion in the modelling of locations passed over in transit would, with terns being central place foragers (meaning they must travel to and from their nest site on each trip), almost certainly lead to a bias towards high usage of areas close to the colony, data from commuting periods (i.e. parts of the bird track where no foraging behaviour4 was recorded) were removed from the modelling analysis. In order to identify the preferred type of area used for feeding, the environmental conditions found at foraging locations had to be compared with conditions found at locations which were not used for foraging. The analysis therefore compared observed foraging presence locations with foraging absence locations (see Box 2 for more detail on how these were defined) to characterise the kind of environment used for foraging by the terns.
4 Foraging behaviour was defined as an instance of circling slowly actively searching for food in the water
below, diving into the water, or dipping into the water surface.
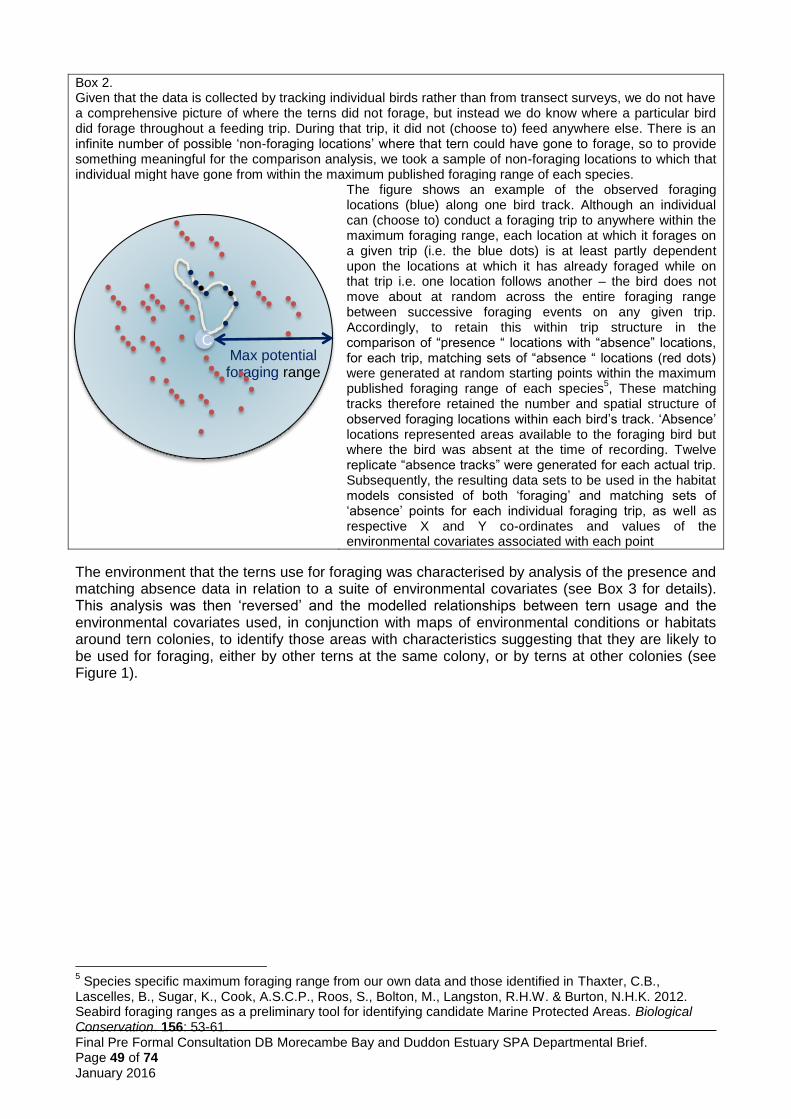
Final Pre Formal Consultation DB Morecambe Bay and Duddon Estuary SPA Departmental Brief. Page 49 of 74 January 2016
Max potential foraging range
C
Box 2. Given that the data is collected by tracking individual birds rather than from transect surveys, we do not have a comprehensive picture of where the terns did not forage, but instead we do know where a particular bird did forage throughout a feeding trip. During that trip, it did not (choose to) feed anywhere else. There is an infinite number of possible ‘non-foraging locations’ where that tern could have gone to forage, so to provide something meaningful for the comparison analysis, we took a sample of non-foraging locations to which that individual might have gone from within the maximum published foraging range of each species. The figure shows an example of the observed foraging
locations (blue) along one bird track. Although an individual can (choose to) conduct a foraging trip to anywhere within the maximum foraging range, each location at which it forages on a given trip (i.e. the blue dots) is at least partly dependent upon the locations at which it has already foraged while on that trip i.e. one location follows another – the bird does not move about at random across the entire foraging range between successive foraging events on any given trip. Accordingly, to retain this within trip structure in the comparison of “presence “ locations with “absence” locations, for each trip, matching sets of “absence “ locations (red dots) were generated at random starting points within the maximum published foraging range of each species
5, These matching
tracks therefore retained the number and spatial structure of observed foraging locations within each bird’s track. ‘Absence’ locations represented areas available to the foraging bird but where the bird was absent at the time of recording. Twelve replicate “absence tracks” were generated for each actual trip. Subsequently, the resulting data sets to be used in the habitat models consisted of both ‘foraging’ and matching sets of ‘absence’ points for each individual foraging trip, as well as respective X and Y co-ordinates and values of the environmental covariates associated with each point
The environment that the terns use for foraging was characterised by analysis of the presence and matching absence data in relation to a suite of environmental covariates (see Box 3 for details). This analysis was then ‘reversed’ and the modelled relationships between tern usage and the environmental covariates used, in conjunction with maps of environmental conditions or habitats around tern colonies, to identify those areas with characteristics suggesting that they are likely to be used for foraging, either by other terns at the same colony, or by terns at other colonies (see Figure 1).
5 Species specific maximum foraging range from our own data and those identified in Thaxter, C.B.,
Lascelles, B., Sugar, K., Cook, A.S.C.P., Roos, S., Bolton, M., Langston, R.H.W. & Burton, N.H.K. 2012. Seabird foraging ranges as a preliminary tool for identifying candidate Marine Protected Areas. Biological Conservation. 156: 53-61.
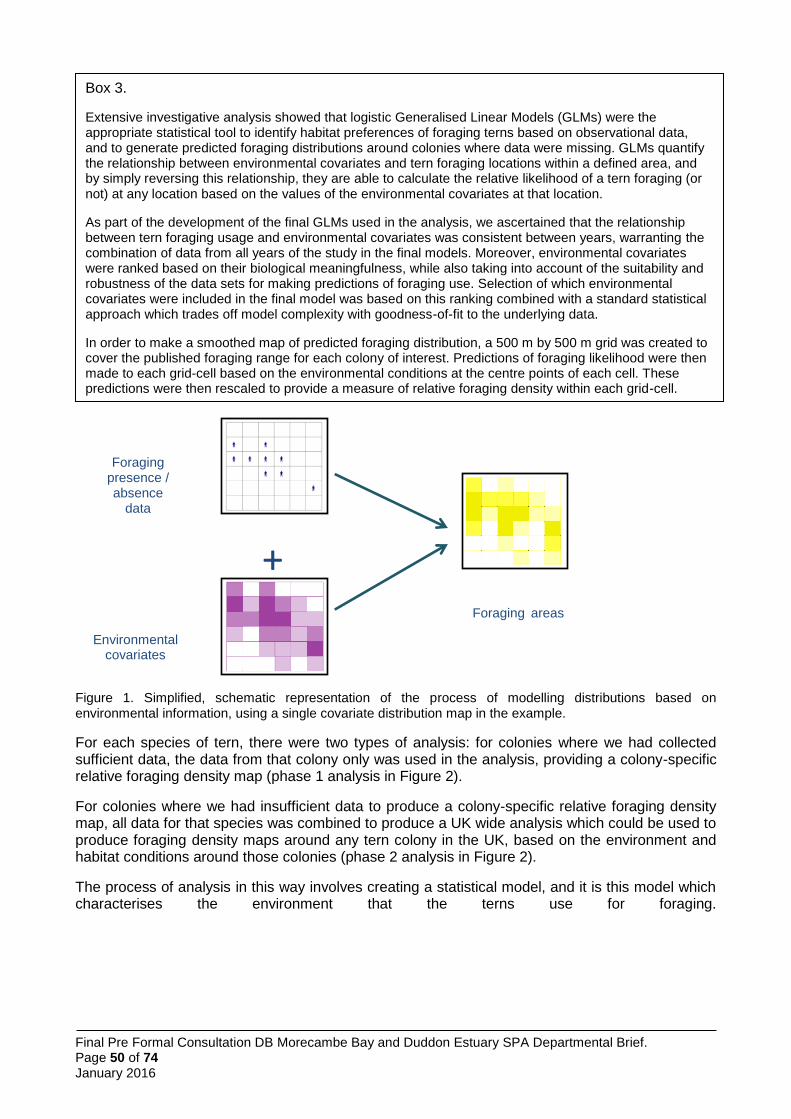
Final Pre Formal Consultation DB Morecambe Bay and Duddon Estuary SPA Departmental Brief. Page 50 of 74 January 2016
Figure 1. Simplified, schematic representation of the process of modelling distributions based on environmental information, using a single covariate distribution map in the example.
For each species of tern, there were two types of analysis: for colonies where we had collected sufficient data, the data from that colony only was used in the analysis, providing a colony-specific relative foraging density map (phase 1 analysis in Figure 2).
For colonies where we had insufficient data to produce a colony-specific relative foraging density map, all data for that species was combined to produce a UK wide analysis which could be used to produce foraging density maps around any tern colony in the UK, based on the environment and habitat conditions around those colonies (phase 2 analysis in Figure 2).
The process of analysis in this way involves creating a statistical model, and it is this model which characterises the environment that the terns use for foraging.
Box 3.
Extensive investigative analysis showed that logistic Generalised Linear Models (GLMs) were the appropriate statistical tool to identify habitat preferences of foraging terns based on observational data, and to generate predicted foraging distributions around colonies where data were missing. GLMs quantify the relationship between environmental covariates and tern foraging locations within a defined area, and by simply reversing this relationship, they are able to calculate the relative likelihood of a tern foraging (or not) at any location based on the values of the environmental covariates at that location.
As part of the development of the final GLMs used in the analysis, we ascertained that the relationship between tern foraging usage and environmental covariates was consistent between years, warranting the combination of data from all years of the study in the final models. Moreover, environmental covariates were ranked based on their biological meaningfulness, while also taking into account of the suitability and robustness of the data sets for making predictions of foraging use. Selection of which environmental covariates were included in the final model was based on this ranking combined with a standard statistical approach which trades off model complexity with goodness-of-fit to the underlying data.
In order to make a smoothed map of predicted foraging distribution, a 500 m by 500 m grid was created to cover the published foraging range for each colony of interest. Predictions of foraging likelihood were then made to each grid-cell based on the environmental conditions at the centre points of each cell. These predictions were then rescaled to provide a measure of relative foraging density within each grid-cell.
+
Foraging presence / absence
data
Environmental covariates
Foraging areas
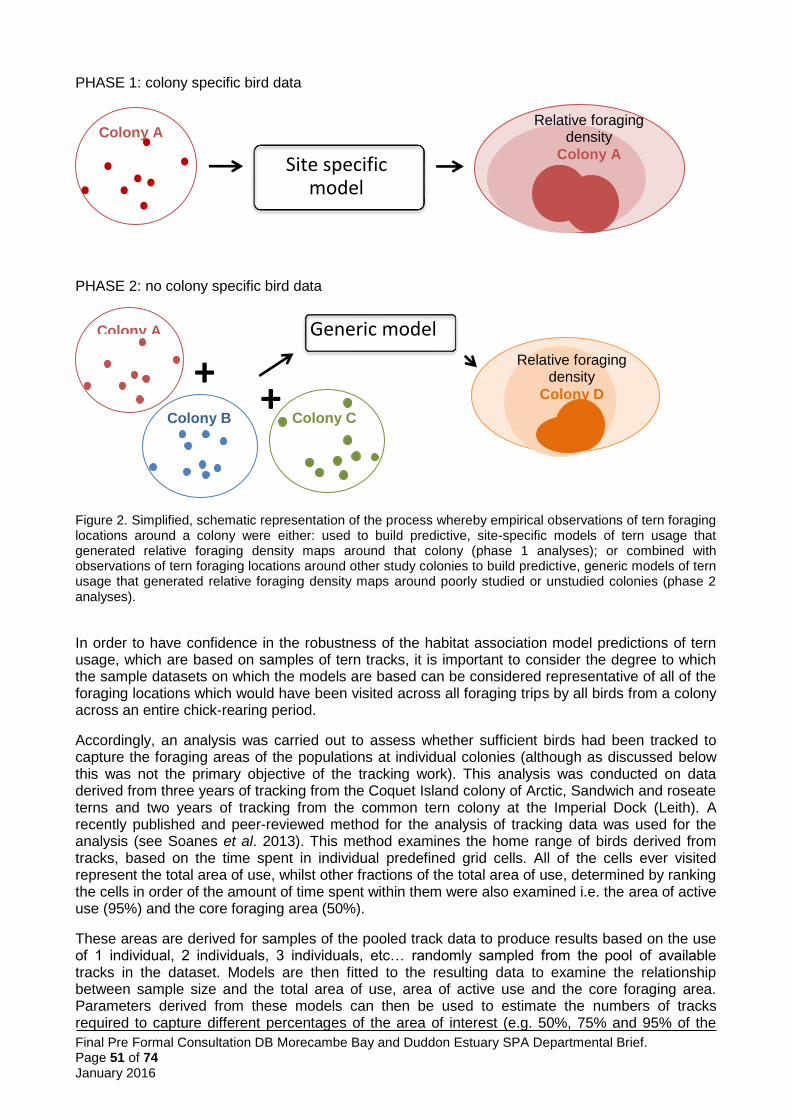
Final Pre Formal Consultation DB Morecambe Bay and Duddon Estuary SPA Departmental Brief. Page 51 of 74 January 2016
PHASE 1: colony specific bird data
PHASE 2: no colony specific bird data
Figure 2. Simplified, schematic representation of the process whereby empirical observations of tern foraging locations around a colony were either: used to build predictive, site-specific models of tern usage that generated relative foraging density maps around that colony (phase 1 analyses); or combined with observations of tern foraging locations around other study colonies to build predictive, generic models of tern usage that generated relative foraging density maps around poorly studied or unstudied colonies (phase 2 analyses).
In order to have confidence in the robustness of the habitat association model predictions of tern usage, which are based on samples of tern tracks, it is important to consider the degree to which the sample datasets on which the models are based can be considered representative of all of the foraging locations which would have been visited across all foraging trips by all birds from a colony across an entire chick-rearing period.
Accordingly, an analysis was carried out to assess whether sufficient birds had been tracked to capture the foraging areas of the populations at individual colonies (although as discussed below this was not the primary objective of the tracking work). This analysis was conducted on data derived from three years of tracking from the Coquet Island colony of Arctic, Sandwich and roseate terns and two years of tracking from the common tern colony at the Imperial Dock (Leith). A recently published and peer-reviewed method for the analysis of tracking data was used for the analysis (see Soanes et al. 2013). This method examines the home range of birds derived from tracks, based on the time spent in individual predefined grid cells. All of the cells ever visited represent the total area of use, whilst other fractions of the total area of use, determined by ranking the cells in order of the amount of time spent within them were also examined i.e. the area of active use (95%) and the core foraging area (50%).
These areas are derived for samples of the pooled track data to produce results based on the use of 1 individual, 2 individuals, 3 individuals, etc… randomly sampled from the pool of available tracks in the dataset. Models are then fitted to the resulting data to examine the relationship between sample size and the total area of use, area of active use and the core foraging area. Parameters derived from these models can then be used to estimate the numbers of tracks required to capture different percentages of the area of interest (e.g. 50%, 75% and 95% of the
Site specific model
Relative foraging density
Colony A
Colony A
Colony B
Generic model
Colony A
+ Colony C
Relative foraging density
Colony D +
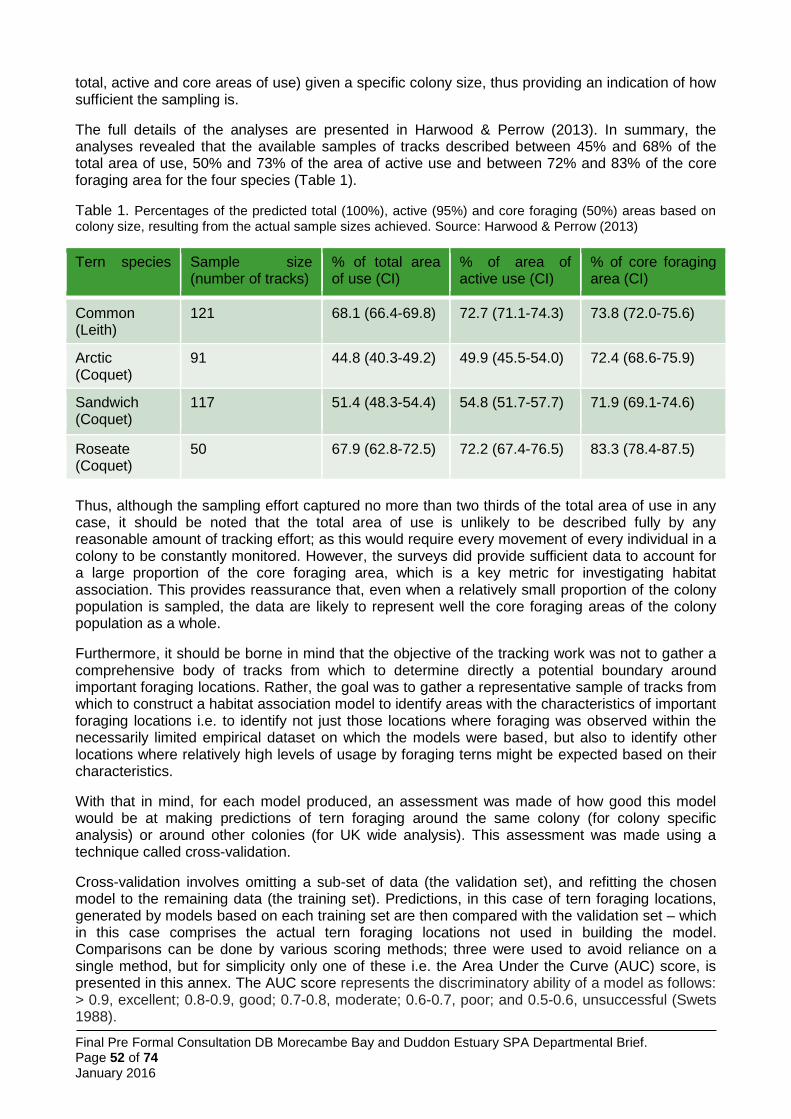
Final Pre Formal Consultation DB Morecambe Bay and Duddon Estuary SPA Departmental Brief. Page 52 of 74 January 2016
total, active and core areas of use) given a specific colony size, thus providing an indication of how sufficient the sampling is.
The full details of the analyses are presented in Harwood & Perrow (2013). In summary, the analyses revealed that the available samples of tracks described between 45% and 68% of the total area of use, 50% and 73% of the area of active use and between 72% and 83% of the core foraging area for the four species (Table 1).
Table 1. Percentages of the predicted total (100%), active (95%) and core foraging (50%) areas based on
colony size, resulting from the actual sample sizes achieved. Source: Harwood & Perrow (2013)
Tern species
Sample size (number of tracks)
% of total area of use (CI)
% of area of active use (CI)
% of core foraging area (CI)
Common (Leith)
121 68.1 (66.4-69.8) 72.7 (71.1-74.3) 73.8 (72.0-75.6)
Arctic (Coquet)
91 44.8 (40.3-49.2) 49.9 (45.5-54.0) 72.4 (68.6-75.9)
Sandwich (Coquet)
117 51.4 (48.3-54.4) 54.8 (51.7-57.7) 71.9 (69.1-74.6)
Roseate (Coquet)
50 67.9 (62.8-72.5) 72.2 (67.4-76.5) 83.3 (78.4-87.5)
Thus, although the sampling effort captured no more than two thirds of the total area of use in any case, it should be noted that the total area of use is unlikely to be described fully by any reasonable amount of tracking effort; as this would require every movement of every individual in a colony to be constantly monitored. However, the surveys did provide sufficient data to account for a large proportion of the core foraging area, which is a key metric for investigating habitat association. This provides reassurance that, even when a relatively small proportion of the colony population is sampled, the data are likely to represent well the core foraging areas of the colony population as a whole.
Furthermore, it should be borne in mind that the objective of the tracking work was not to gather a comprehensive body of tracks from which to determine directly a potential boundary around important foraging locations. Rather, the goal was to gather a representative sample of tracks from which to construct a habitat association model to identify areas with the characteristics of important foraging locations i.e. to identify not just those locations where foraging was observed within the necessarily limited empirical dataset on which the models were based, but also to identify other locations where relatively high levels of usage by foraging terns might be expected based on their characteristics.
With that in mind, for each model produced, an assessment was made of how good this model would be at making predictions of tern foraging around the same colony (for colony specific analysis) or around other colonies (for UK wide analysis). This assessment was made using a technique called cross-validation.
Cross-validation involves omitting a sub-set of data (the validation set), and refitting the chosen model to the remaining data (the training set). Predictions, in this case of tern foraging locations, generated by models based on each training set are then compared with the validation set – which in this case comprises the actual tern foraging locations not used in building the model. Comparisons can be done by various scoring methods; three were used to avoid reliance on a single method, but for simplicity only one of these i.e. the Area Under the Curve (AUC) score, is presented in this annex. The AUC score represents the discriminatory ability of a model as follows: > 0.9, excellent; 0.8-0.9, good; 0.7-0.8, moderate; 0.6-0.7, poor; and 0.5-0.6, unsuccessful (Swets 1988).
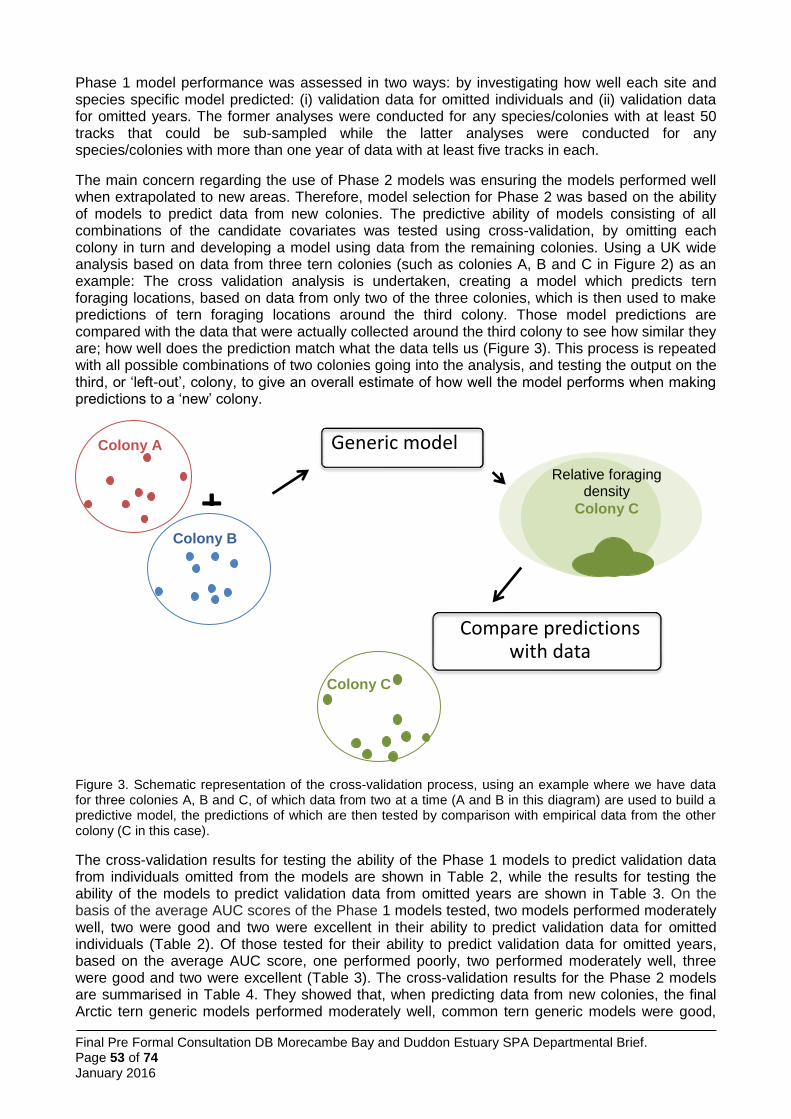
Final Pre Formal Consultation DB Morecambe Bay and Duddon Estuary SPA Departmental Brief. Page 53 of 74 January 2016
Phase 1 model performance was assessed in two ways: by investigating how well each site and species specific model predicted: (i) validation data for omitted individuals and (ii) validation data for omitted years. The former analyses were conducted for any species/colonies with at least 50 tracks that could be sub-sampled while the latter analyses were conducted for any species/colonies with more than one year of data with at least five tracks in each.
The main concern regarding the use of Phase 2 models was ensuring the models performed well when extrapolated to new areas. Therefore, model selection for Phase 2 was based on the ability of models to predict data from new colonies. The predictive ability of models consisting of all combinations of the candidate covariates was tested using cross-validation, by omitting each colony in turn and developing a model using data from the remaining colonies. Using a UK wide analysis based on data from three tern colonies (such as colonies A, B and C in Figure 2) as an example: The cross validation analysis is undertaken, creating a model which predicts tern foraging locations, based on data from only two of the three colonies, which is then used to make predictions of tern foraging locations around the third colony. Those model predictions are compared with the data that were actually collected around the third colony to see how similar they are; how well does the prediction match what the data tells us (Figure 3). This process is repeated with all possible combinations of two colonies going into the analysis, and testing the output on the third, or ‘left-out’, colony, to give an overall estimate of how well the model performs when making predictions to a ‘new’ colony.
Figure 3. Schematic representation of the cross-validation process, using an example where we have data for three colonies A, B and C, of which data from two at a time (A and B in this diagram) are used to build a predictive model, the predictions of which are then tested by comparison with empirical data from the other colony (C in this case).
The cross-validation results for testing the ability of the Phase 1 models to predict validation data from individuals omitted from the models are shown in Table 2, while the results for testing the ability of the models to predict validation data from omitted years are shown in Table 3. On the basis of the average AUC scores of the Phase 1 models tested, two models performed moderately well, two were good and two were excellent in their ability to predict validation data for omitted individuals (Table 2). Of those tested for their ability to predict validation data for omitted years, based on the average AUC score, one performed poorly, two performed moderately well, three were good and two were excellent (Table 3). The cross-validation results for the Phase 2 models are summarised in Table 4. They showed that, when predicting data from new colonies, the final Arctic tern generic models performed moderately well, common tern generic models were good,
+
Colony B
Generic model
Colony A
Colony C
Relative foraging density
Colony C
Compare predictions with data
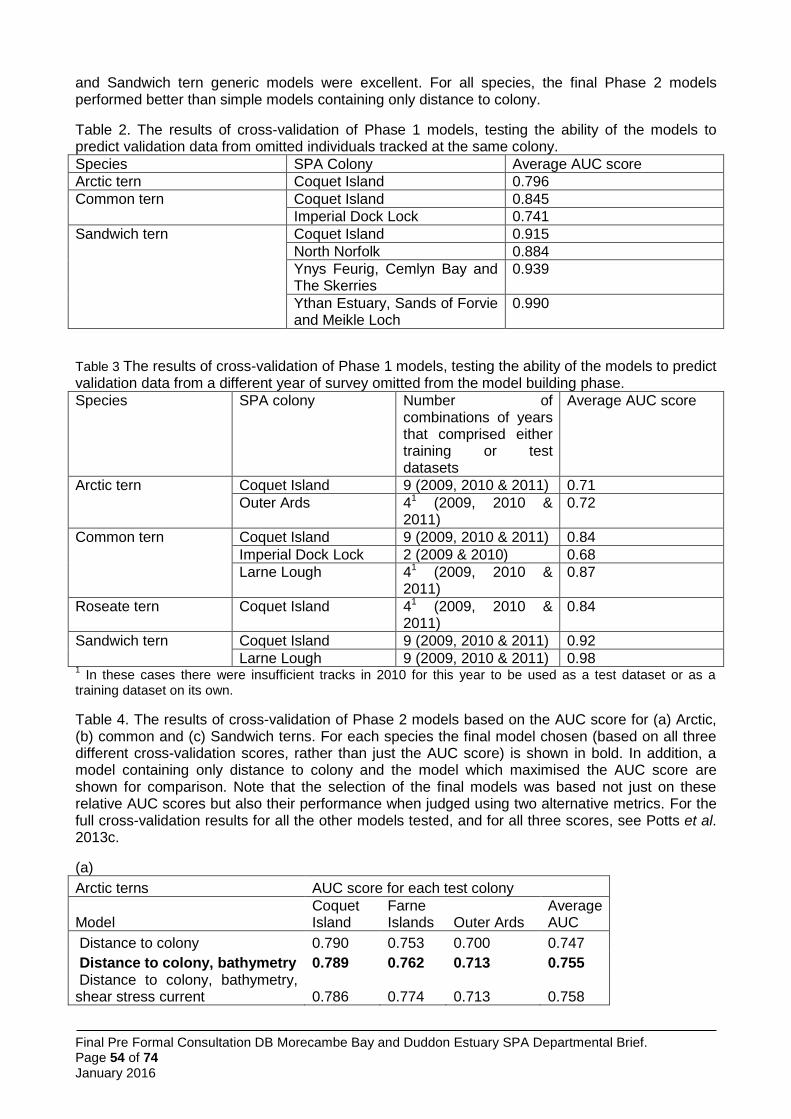
Final Pre Formal Consultation DB Morecambe Bay and Duddon Estuary SPA Departmental Brief. Page 54 of 74 January 2016
and Sandwich tern generic models were excellent. For all species, the final Phase 2 models performed better than simple models containing only distance to colony.
Table 2. The results of cross-validation of Phase 1 models, testing the ability of the models to predict validation data from omitted individuals tracked at the same colony.
Species SPA Colony Average AUC score
Arctic tern Coquet Island 0.796
Common tern Coquet Island 0.845
Imperial Dock Lock 0.741
Sandwich tern Coquet Island 0.915
North Norfolk 0.884
Ynys Feurig, Cemlyn Bay and The Skerries
0.939
Ythan Estuary, Sands of Forvie and Meikle Loch
0.990
Table 3 The results of cross-validation of Phase 1 models, testing the ability of the models to predict validation data from a different year of survey omitted from the model building phase.
Species SPA colony Number of combinations of years that comprised either training or test datasets
Average AUC score
Arctic tern Coquet Island 9 (2009, 2010 & 2011) 0.71
Outer Ards 41 (2009, 2010 & 2011)
0.72
Common tern Coquet Island 9 (2009, 2010 & 2011) 0.84
Imperial Dock Lock 2 (2009 & 2010) 0.68
Larne Lough 41 (2009, 2010 & 2011)
0.87
Roseate tern Coquet Island 41 (2009, 2010 & 2011)
0.84
Sandwich tern Coquet Island 9 (2009, 2010 & 2011) 0.92
Larne Lough 9 (2009, 2010 & 2011) 0.98 1 In these cases there were insufficient tracks in 2010 for this year to be used as a test dataset or as a
training dataset on its own.
Table 4. The results of cross-validation of Phase 2 models based on the AUC score for (a) Arctic, (b) common and (c) Sandwich terns. For each species the final model chosen (based on all three different cross-validation scores, rather than just the AUC score) is shown in bold. In addition, a model containing only distance to colony and the model which maximised the AUC score are shown for comparison. Note that the selection of the final models was based not just on these relative AUC scores but also their performance when judged using two alternative metrics. For the full cross-validation results for all the other models tested, and for all three scores, see Potts et al. 2013c.
(a)
Arctic terns AUC score for each test colony
Model Coquet Island
Farne Islands Outer Ards
Average AUC
Distance to colony 0.790 0.753 0.700 0.747
Distance to colony, bathymetry 0.789 0.762 0.713 0.755 Distance to colony, bathymetry, shear stress current 0.786 0.774 0.713 0.758
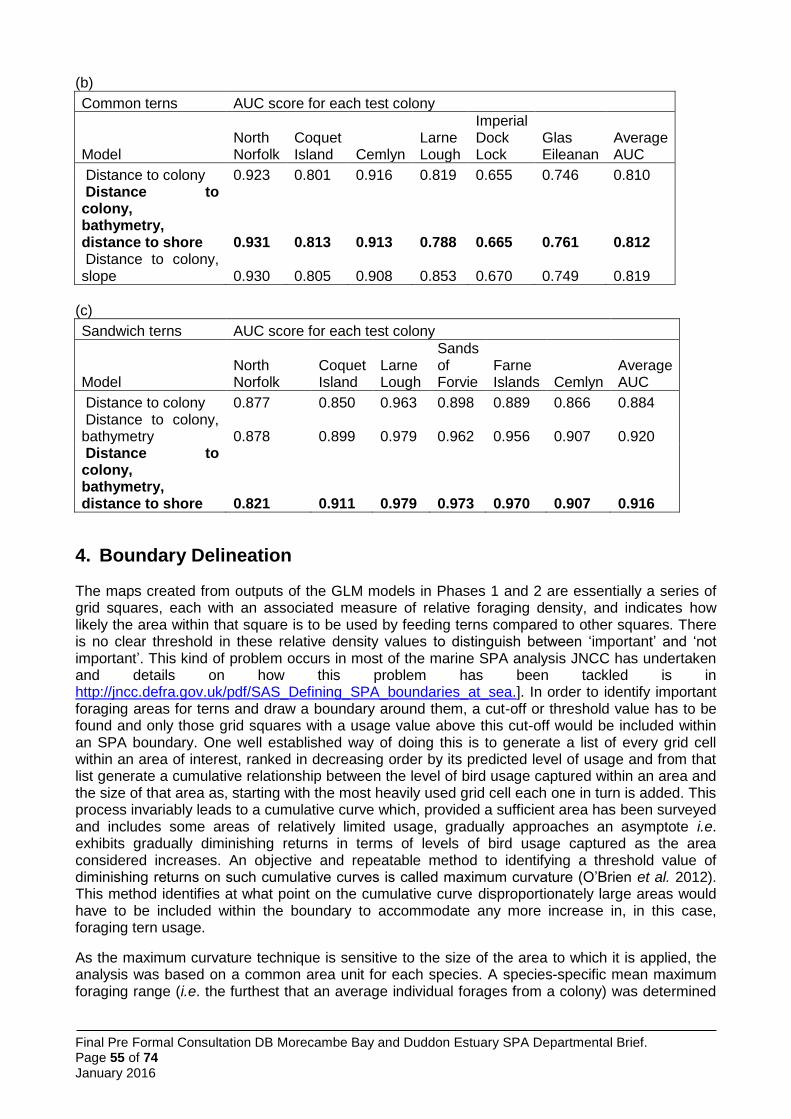
Final Pre Formal Consultation DB Morecambe Bay and Duddon Estuary SPA Departmental Brief. Page 55 of 74 January 2016
(b)
Common terns AUC score for each test colony
Model North Norfolk
Coquet Island Cemlyn
Larne Lough
Imperial Dock Lock
Glas Eileanan
Average AUC
Distance to colony 0.923 0.801 0.916 0.819 0.655 0.746 0.810 Distance to colony, bathymetry, distance to shore 0.931 0.813 0.913 0.788 0.665 0.761 0.812 Distance to colony, slope 0.930 0.805 0.908 0.853 0.670 0.749 0.819
(c)
Sandwich terns AUC score for each test colony
Model North Norfolk
Coquet Island
Larne Lough
Sands of Forvie
Farne Islands Cemlyn
Average AUC
Distance to colony 0.877 0.850 0.963 0.898 0.889 0.866 0.884 Distance to colony, bathymetry 0.878 0.899 0.979 0.962 0.956 0.907 0.920 Distance to colony, bathymetry, distance to shore 0.821 0.911 0.979 0.973 0.970 0.907 0.916
4. Boundary Delineation
The maps created from outputs of the GLM models in Phases 1 and 2 are essentially a series of grid squares, each with an associated measure of relative foraging density, and indicates how likely the area within that square is to be used by feeding terns compared to other squares. There is no clear threshold in these relative density values to distinguish between ‘important’ and ‘not important’. This kind of problem occurs in most of the marine SPA analysis JNCC has undertaken and details on how this problem has been tackled is in http://jncc.defra.gov.uk/pdf/SAS_Defining_SPA_boundaries_at_sea.]. In order to identify important foraging areas for terns and draw a boundary around them, a cut-off or threshold value has to be found and only those grid squares with a usage value above this cut-off would be included within an SPA boundary. One well established way of doing this is to generate a list of every grid cell within an area of interest, ranked in decreasing order by its predicted level of usage and from that list generate a cumulative relationship between the level of bird usage captured within an area and the size of that area as, starting with the most heavily used grid cell each one in turn is added. This process invariably leads to a cumulative curve which, provided a sufficient area has been surveyed and includes some areas of relatively limited usage, gradually approaches an asymptote i.e. exhibits gradually diminishing returns in terms of levels of bird usage captured as the area considered increases. An objective and repeatable method to identifying a threshold value of diminishing returns on such cumulative curves is called maximum curvature (O’Brien et al. 2012). This method identifies at what point on the cumulative curve disproportionately large areas would have to be included within the boundary to accommodate any more increase in, in this case, foraging tern usage.
As the maximum curvature technique is sensitive to the size of the area to which it is applied, the analysis was based on a common area unit for each species. A species-specific mean maximum foraging range (i.e. the furthest that an average individual forages from a colony) was determined
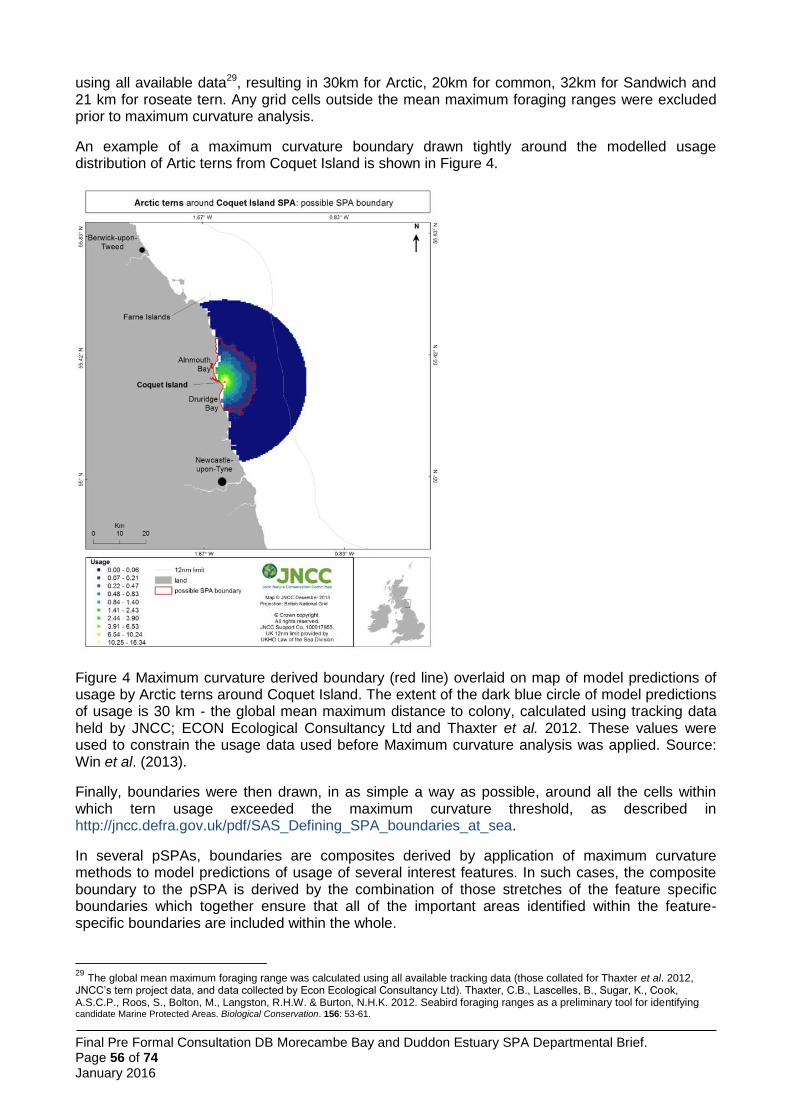
Final Pre Formal Consultation DB Morecambe Bay and Duddon Estuary SPA Departmental Brief. Page 56 of 74 January 2016
using all available data29, resulting in 30km for Arctic, 20km for common, 32km for Sandwich and 21 km for roseate tern. Any grid cells outside the mean maximum foraging ranges were excluded prior to maximum curvature analysis.
An example of a maximum curvature boundary drawn tightly around the modelled usage distribution of Artic terns from Coquet Island is shown in Figure 4.
Figure 4 Maximum curvature derived boundary (red line) overlaid on map of model predictions of usage by Arctic terns around Coquet Island. The extent of the dark blue circle of model predictions of usage is 30 km - the global mean maximum distance to colony, calculated using tracking data held by JNCC; ECON Ecological Consultancy Ltd and Thaxter et al. 2012. These values were used to constrain the usage data used before Maximum curvature analysis was applied. Source: Win et al. (2013).
Finally, boundaries were then drawn, in as simple a way as possible, around all the cells within which tern usage exceeded the maximum curvature threshold, as described in http://jncc.defra.gov.uk/pdf/SAS_Defining_SPA_boundaries_at_sea.
In several pSPAs, boundaries are composites derived by application of maximum curvature methods to model predictions of usage of several interest features. In such cases, the composite boundary to the pSPA is derived by the combination of those stretches of the feature specific boundaries which together ensure that all of the important areas identified within the feature-specific boundaries are included within the whole.
29
The global mean maximum foraging range was calculated using all available tracking data (those collated for Thaxter et al. 2012, JNCC’s tern project data, and data collected by Econ Ecological Consultancy Ltd). Thaxter, C.B., Lascelles, B., Sugar, K., Cook, A.S.C.P., Roos, S., Bolton, M., Langston, R.H.W. & Burton, N.H.K. 2012. Seabird foraging ranges as a preliminary tool for identifying candidate Marine Protected Areas. Biological Conservation. 156: 53-61.
Final Pre Formal Consultation DB Morecambe Bay and Duddon Estuary SPA Departmental Brief. Page 57 of 74 January 2016
5. Conclusion
Delineation of the boundaries around areas of sea that are most heavily used by seabirds have, in several existing marine SPAs, been based on maps of the relative density of birds derived directly from empirical at sea surveys of bird distribution. However, such an approach was not followed in the current project for a number of reasons. First, with tern foraging being predominantly close to shore and with the need to consider colonies all around the United Kingdom, existing data sources eg the European Seabirds at Sea (ESAS) database (http://jncc.defra.gov.uk/page-1547) were not fit for purpose. For this approach to have been followed, a significant programme of bespoke, near-shore at sea transect surveys around the UK would have been required. Furthermore, as the objective of the work was to identify foraging areas of importance to birds originating from existing SPA colonies it was necessary that survey methods could identify the origin of each bird seen at sea. Conventional at sea transect surveys cannot provide this information with any certainty, particularly when considering sightings of birds in sea areas that may be many kilometers from possible source colonies. Accordingly, a programme of boat-based tracking of breeding terns was identified as being the most suitable approach to gathering the necessary information on at sea tern foraging distributions. In an ideal world, such tracking would have been carried out on each species at every colony of interest around the UK with the intention of collating sufficiently large numbers of tracks to allow delineation of a boundary to important areas of use of each species at each colony directly from maps of relative intensity of occurrence. However, given the scale of the task (41 breeding colony SPAs have one or more of the larger tern Sterna species as a feature) and the inevitable limitations to survey effort that could be deployed, it was recognized that a targeted survey programme leading to development of predictive models would be the most pragmatic, cost-effective and indeed reliable approach to this project.
This project collected and collated a substantial amount of data on the distributions of terns at sea and to our knowledge represents the largest available resource of tracking data for breeding terns. The data collected/collated consisted of up to three years of survey around eleven colony SPAs and a total of almost 1300 tracks were available to the project across the four species. Geographical coverage across the UK was maximised within the constraints of the time available, logistics and resources. This ensured that data were obtained across a large range of covariate values, and that inter-colony variation could be captured as much as possible for the generic models.
The datasets collected and modelling carried out within this project allowed the development of site-specific models for 16 species/SPAs as well as generic models for each species that were used to extrapolate geographically for 30 species/SPAs. Thus the project delivered predictions of relative distributions of the larger tern species around the full complement of 32 colony SPAs in the UK which were deemed to be recently regularly occupied (46 species/SPA models in total).
Distributions predicted by the Phase 1 models generally matched the underlying data well, but also occasionally identified areas of use which were not captured by the tracking data. This is one of the key advantages of using a habitat modelling approach as it allows extrapolation into areas which were not sampled, but which are predicted to be used based on the suitability of the environment. Interpolation based only on raw data would risk overlooking the potential importance of some areas if they had not happened to be used at the time of tracking by the individuals that were sampled. A habitat modelling approach also allowed us to apply generic models which benefit from pooling data across multiple colonies, gaining strength from increased sample sizes which are able to identify broad, consistent preference relationships across multiple colonies.
All of our models predicted highest usage around the colony, with usage generally declining with increasing distance from the colony. This pattern accords well with what we might expect from central place foragers. For Arctic and common terns, the pattern of usage generally radiated out from the colony in all directions out to sea. For Sandwich terns, usage was in most cases confined to a relatively narrow coastal area either side of the colony. In all cases, there was negligible use of areas distant from the colony; more than half of the maximum potential foraging range was predicted to be virtually unused. The majority of usage was also confined to an area less than that
Final Pre Formal Consultation DB Morecambe Bay and Duddon Estuary SPA Departmental Brief. Page 58 of 74 January 2016
encompassed by the mean maximum foraging ranges (as recorded in this study as well as those in Thaxter et al. (2012)). So although a simple approach such as applying a mean maximum foraging range radius around the colony, would correctly identify areas being used (and be a simpler method to explain) and could have been used in boundary setting, it would also include large areas of relatively low importance. The habitat modelling approach, although relatively complex, provides more realistic estimates of the relative importance of the areas within the maximum and mean maximum foraging ranges.
It might be considered that boundaries determined directly from empirically derived maps of the distributions of terns around each colony would have had a smaller degree of uncertainty associated with them than ones derived, as in this project, on the basis of model predictions of bird usage patterns, which in the case of some species and colonies are derived entirely from models of the association between bird usage and environmental covariates which have been derived elsewhere. However, this need not be the case. As noted above, the modelling approach has the advantage of allowing extrapolation of predicted usage levels into sea areas which may not be seen to be sampled (by the birds) in what will always be a necessarily limited sample dataset. Furthermore, the cross-validation of both site specific and generic models has indicated that the pooling of data across years and colonies has allowed models of tern usage to be built which are relatively robust to variations in tern foraging behaviour in time and space. For these reasons it is considered that this project has generated proposed boundaries which have degrees of uncertainty that are acceptable, and certainly need not be considered to be any worse than if it had been possible to apply more conventional approaches.
References
Harwood A. & Perrow, M. 2013. Analysis of JNCC visual tracking data. Report to JNCC, under Contract ref. C13-0204-0686 (ECON Ecological Consultancy Ltd).
O‟Brien, S. W. (2012). Use of kernel density estimation and maximum curvature to set Marine Protected Area boundaries: Identifying a Special Protection Area for wintering red-throated divers in the UK. Biological Conservation, 156, 15–21. 12 033. doi:10.1016/j.biocon.2011.12.033
Potts, J. M. Brewer, M.J. & Duff, E. I. 2013. Refinements of tern Sterna sp. tracking data modelling (Phase 2) (Under Agreement C10-0206-0387). Contract Report to JNCC, October 2013
Perrow, M. R., Skeate, E. R. and Gilroy, J. J. (2011). Visual tracking from a rigid-hulled inflatable boat to determine foraging movements of breeding terns. Journal of Field Ornithology, 82(1), 68-79.
Soanes, L.M., Arnould, J.P.Y., Dodd, S.G., Sumner, M.D. and Green, J.A. (2013). How many seabirds do we need to track to define home-range area? Journal of Applied Ecology, 50: 671-679.
Stroud, D.A., Chambers, D., Cook, S., Buxton, N., Fraser, B., Clement, P., Lewis, P., McLean, I., Baker, H., Whitehead, S. (2001): The UK SPA network: its scope and content, Volume 2: Species accounts. JNCC, Peterborough, 438 pp. Available at: http://jncc.defra.gov.uk/page-1418
Swets .JA. (1988). Measuring the accuracy of diagnostic systems. Science 240:1285–1293.
Thaxter, C.B., Lascelles, B., Sugar, K., Cook, A.S.C.P., Roos, S., Bolton, M., Langston, R.H.W., Burton, N.H.K. (2012): Seabird foraging ranges as a preliminary tool for identifying candidate Marine Protected Areas. Biological Conservation, 156, 53-61. Abstract available at: http://www.researchgate.net/publication/236034521_Seabird_foraging_ranges_as_a_preliminary_tool_for_identifying_candidate_Marine_Protected_Areas/file/3deec515ec5e3a2218.pdf
Win, I., Wilson, L. J. and Kuepfer, A. 2015. Identification of possible marine SPA boundaries for the larger tern species around the United Kingdom. Unpublished JNCC report. December 2013. Supplement to Wilson L. J., Black J., Brewer, M. J., Potts, J. M., Kuepfer, A., Win I., Kober K.,

Final Pre Formal Consultation DB Morecambe Bay and Duddon Estuary SPA Departmental Brief. Page 59 of 74 January 2016
Bingham C., Mavor R. and Webb A. 2015. Quantifying usage of the marine environment by terns Sterna sp. around their breeding colony SPAS.JNCC Report 500.
Final Pre Formal Consultation DB Morecambe Bay and Duddon Estuary SPA Departmental Brief. Page 60 of 74 January 2016
Annex 6 Implementation of Natural England Evidence Standards
Decision-making processes within NE are evidence driven and the Natural England strategic evidence standard, and supporting guidance were followed. In particular, the four principles for the analysis of evidence set out in the Natural England Standard Analysis of Evidence have been adhered to. These two standards documents can be downloaded from the following web-links:
Strategic Evidence Standard:
http://publications.naturalengland.org.uk/publication/7699291?category=3769710
Analysis of Evidence Standard:
http://publications.naturalengland.org.uk/publication/7850003?category=3769710
An explanation follows as to how the principles within the Analysis of Evidence standard have been applied in defining the set of qualifying features and boundary of the Morecambe Bay & Duddon Estuary pSPA.
1.) The evidence used is of a quality and relevance appropriate to the research question or issue requiring advice or decision
Quantification of qualifying feature population sizes
In order to determine the suite of species present within the pSPA which meet the SPA selection guidelines (JNCC 1999), and to determine the nature and size of the seabird and waterbird assemblages supported by this site, most relevant, bird count data were used, either pertaining to the current five year period (2010-2014 for all breeding seabirds except herring and lesser black-backed gulls for which data from the period 2011-2015 were available; 2009/10 – 2013/14 for non-breeding waterbirds as the most recently available WeBS data), or that at the time of original classification of Morecambe Bay SPA and Duddon Estuary SPA. Data for Sandwich terns used the period 1988-1992, relating to citations dated 1991 (Morecambe Bay SPA) and 1992 (Duddon Estuary SPA). Data on non-breeding waterbirds for the 1991 Morecambe Bay SPA citation relate to the five year period 1984/85 – 1988/89; for the 1997 citation, the period was 1989/90 – 1993/94. The seabird assemblage from the 1997 citation was based on data from 1990/91 – 1994/95.
1. Data from JNCC’s Seabird Monitoring Programme (SMP) (http://jncc.defra.gov.uk/smp/)
Count data for breeding seabirds (terns and gulls) were taken from the national database wherever possible. All data from 1988-1992 were from this source, with the exception of little tern data, and the majority of data from 2010-2014 were also sourced here.
2. Data from colony managers supplemented the SMP data where this was not available, in the following instances:
a. All little tern data (from RSPB).
b. Missing data for some species for South Walney, Foulney Island and Hodbarrow (RSPB and Cumbria Wildlife Trust).
The count data taken from the SMP database is the best available information. In addition, the SMP data has been checked by JNCC. The count data which were obtained directly from the colony managers is source information that will in due course become part of the SMP database. As such, it too is the best available information.
3. Data from national Wetland Bird Survey (WeBS) and Icelandic-breeding Goose Census (IGC)
These sources are recognised as the national authority on non-breeding waterbird data. Data were sourced from the British Trust for Ornithology (as the administrators of WeBS), with a consolidation
Final Pre Formal Consultation DB Morecambe Bay and Duddon Estuary SPA Departmental Brief. Page 61 of 74 January 2016
of all count sectors contained by the existing Morecambe Bay and Duddon Estuary SPAs, as well as the area known as Ravenglass (termed Irk, Mite and Esk Estuary by WeBS). Data were requested for the period 2009/10 – 2013/14. To calculate peak pink-footed goose numbers, reference was made to the IGC, which ‘trumps’ peak counts on the WeBS website (http://blx1.bto.org/webs-reporting/) when these exceed WeBS counts. These counts were included in calculations for the pSPA.
Establishment of extent of marine pSPAs using tern tracking data
Webb & Reid (2004) provide a series of guidelines for the selection of marine SPAs for aggregations of inshore non-breeding waterbirds. This guidance does not directly consider the evidence requirements for the selection of marine SPAs focussed on the principal foraging areas used by breeding seabirds. However, a number of the issues and principles covered in Webb & Reid (2004) nonetheless have some relevance in this context. Accordingly, the following section describes in broad terms a comparison of the quality and relevance of the tern evidence base with the guidelines produced by Webb & Reid (2004).
Webb & Reid (2004) note that the guidelines for selecting SPAs in the United Kingdom are described in Stroud et al. (2001), and are adequate and competent for application to site selection in the inshore environment for inshore non-breeding waterbird aggregations. However, given that the type and quality of data which underpins the Morecambe Bay & Duddon Estuary pSPA differs from those used in identifying sites for terrestrial birds and aggregations of non-breeding waterbirds, it is necessary to consider their adequacy and relevance.
Webb & Reid (2004) set out seven criteria to assess the adequacy of count data. Although not all of direct relevance in the current case these criteria are set out in Table 1 with accompanying comments regarding the tern tracking and modelling work.
Table 1 Criteria for inshore SPA data adequacy.
Criterion Adequacy of JNCC led larger tern surveys
Adequacy of JNCC led little tern surveys
Experience of observers
All tracking of terns was undertaken either by JNCC staff or experienced contractors commissioned by JNCC to do the work.
All observations of terns was undertaken either by JNCC staff or experienced contractors commissioned by JNCC or volunteer counters who received training in the shore-based observation techniques.
Systematic surveys
Tern tracking was conducted in as systematic a way as possible. Tracking at each colony was carried out during well-defined periods of the breeding season (chick-rearing) in one or more years. Tracking was undertaken in accordance with a field protocol established by JNCC. In the context of tern tracking, the movements of birds is an essential component of the technique and not a source of systematic bias in the survey results as it may be in conventional transect surveys.
Boat-based survey work followed systematic transect survey designs that were appropriate to each colony and were followed on repeated surveys. Shore based survey work used systematic series of observation stations and a standard recording protocol which was used repeatedly at each colony.
Completeness The aim of the tracking survey method was not to cover all of the areas sea to consider for inclusion in the pSPA, but to ensure that the tracking effort was sufficient to capture tern usage across a representative proportion of that area on the basis of which reliable habitat association models could be constructed and used to predict tern
Boat-based transects extended up to 6km offshore and alongshore survey stations were positioned at 1km intervals up to at least 6km in either direction from the colony (and where necessary, further). With the mean maximum foraging range reported to be 6.3km, the survey areas gave virtual complete coverage of the likely areas of greatest importance.
Final Pre Formal Consultation DB Morecambe Bay and Duddon Estuary SPA Departmental Brief. Page 62 of 74 January 2016
usage patterns across the wider area – including those areas in which no direct observations of terns were made.
Counting method
The larger tern tracking work did not involve counting of birds or use of such information to derive population estimates for the pSPA. However, the modelling is based on samples of tracks of relatively few individual terns from each colony rather than surveys of the distribution of terns (of unknown origin) around the colony. Cross-validation tests of the models’ predictions and analysis of sample adequacy both suggest that the results of the models, although based on the samples of tracks, are robust.
At sea observations included instantaneous counts at predetermined distances along transects at which all terns in flight within 300 m in an 180º arc of the boat were recorded. Between these points, continuous records of all little terns seen were also made to provide an index of relative abundance. During shore-based observations, terns recorded within 300 m of the observation point were recorded during timed observation periods. Counts at each station were standardised to birds/minute and expressed as proportions of the value recorded at the 1 km observation station to standardise across sites.
Quality of sampling
Cross-validation tests of the models’ predictions and analysis of sample size adequacy both suggest that the results of the models based on the samples of tracks are robust.
This was affected by the low numbers of birds at many colonies and the frequent breeding failures. At colonies with 5 or more shore-based surveys yielding records of 200 or more terns, this was deemed sufficient to derive site-specific along shore boundaries. At colonies with at least 2 boat-based surveys yielding at least 20 tern sightings this was deemed sufficient to derive site-specific seaward boundaries. At colonies where these criteria were not met, a generic approach was used by pooling sample data across sites to yield better-evidence based estimates of limits.
Robustness of population estimate
Not applicable as the tern tracking work was not used to generate a population estimate
Not applicable as the tern observation work was not used to generate a population estimate
External factors affecting the survey
Tracking was constrained by weather, e.g. tracking could not take place with sea state ≥3 and during rain. Thus, tracking data were gathered only under favourable weather conditions.
Although the aim was to collect data from most currently occupied SPAs, in many cases data on seaward or alongshore extent could not be collected due to colony failure (caused by tidal inundation, predation or disturbance) or simply too few breeding pairs for sufficient observations to be detected by surveys. Accessibility to count points in all parts of the possible extent of a foraging area limited the ability to provide site-specific alongshore extents in some cases.
Webb & Reid (2004) also discuss the issue of establishing sufficient evidence in the case of marine SPAs to establish regularity of use, which is a key element of the SPA selection guidelines. The tern tracking work was never intended to establish regularity of use of certain sea areas by particular species around particular colonies. The aim of that work was simply to capture sufficient representative information on tern foraging behaviour to allow reliable habitat association models to be constructed and used to generate maps of areas of principal usage. The results of the cross validation of those models’ predictions, in which data from different years were used as test datasets, suggests a relatively high degree of consistency in usage patterns between years i.e. regularity of use of those most important areas (Wilson et al. 2014). However, no formal tests of the regularity of use of the sea areas within the pSPA boundary have been made. Regularity of use of the pSPA has been reasonably inferred from the continued existence of the site’s named

Final Pre Formal Consultation DB Morecambe Bay and Duddon Estuary SPA Departmental Brief. Page 63 of 74 January 2016
features in qualifying numbers in each of the existing coastal SPAs from which birds within the marine SPA are most likely to originate.
Webb & Reid (2004) discuss the issue of boundary placement. They note that the principles for defining boundaries for terrestrial SPAs in the UK are described in Stroud et al. (2001) thus (emphasis added):
“The first stage of boundary determination involves defining the extent of area required by the qualifying species concerned. These scientific judgements are made in the light of the ecological requirements of the relevant species that may be delivered by that particular site, and the extent to which the site can fulfil these requirements. This follows a rigorous assessment of the best-available local information regarding distribution, abundance and movements of the qualifying species. It may also involve the commissioning of special surveys where the information base is weak. Following this stage, every attempt is made to define a boundary that is identifiable on the ground and can be recognised by those responsible for the management of the site. This boundary will include the most suitable areas for the qualifying species identified in the first stage……”
The larger tern tracking and little tern observations were conducted to define the extent of the area required by these species on the basis of specially commissioned surveys that generated the best available local information regarding distribution, abundance and movements of these qualifying species.
Webb & Reid (2004) discuss the principles of setting both landward and seaward boundaries of marine SPAs.
In regard of setting landward boundaries they note that “Where the distribution of birds at a site is likely to meet land, a boundary should usually be set at the mean high water mark (MHW)……. unless there is evidence that the qualifying species make no use of the intertidal region at high water.”
The landward boundary of the pSPA has been drawn at MHW along the Cumbrian coast, Ravenglass Estuary and the west side of Walney Island in the light of: i) model predictions of the usage of such areas by foraging Sandwich terns.
Webb & Reid (2004) set out a recommended method for defining the seaward boundary of SPAs for inshore non-breeding waterbirds on the basis of analysing bird data from aerial or boat-based sample surveys using spatial interpolation combined with spatial analysis. They note exceptions to this method which include the case in which “habitat data are also used in combination with bird distribution data to determine boundaries”. This is the approach which has been used in the tern work which has determined the seaward boundary of this pSPA.
Webb & Reid (2004) describe spatial interpolation methods by which survey sample data can be used to generate maps of species probability of occurrence or abundance. This involves use of a “….suite of modelling techniques in which the probability of bird occurrence or the total number of birds present is estimated at unsampled locations (usually in grid cells) using information on the presence or absence, or the number of birds recorded at sampled locations”. This is the principle underlying the modelling of the tern tracking data, albeit that the nature of the statistical models used is somewhat different to those considered by Webb & Reid (2004). As such, the principle of the method which has been used to define the seaward boundary of the pSPA is entirely in line with the recommendation of Webb & Reid (2004).
Webb & Reid (2004) conclude by discussing the method by which a boundary should be drawn around the parts of a site identified as being most important. They refer to Webb et al. (2003) which sets out a method for classifying grid cells so that the most important ones for a species on any given survey are highlighted. In that method, the grid cells are ranked from lowest predicted bird abundance to highest, and the cumulative population calculated from

Final Pre Formal Consultation DB Morecambe Bay and Duddon Estuary SPA Departmental Brief. Page 64 of 74 January 2016
lowest ranked grid cell to highest. The highest ranking grid cells were selected such that they comprised 95% of the total population. The analytical approach which has been applied to the grid-based, modelled predictions of tern usage to define the most important areas to include within the pSPA boundary (Win et al. 2013) follows the basic ranking principle outlined by Webb et al. (2003). However, the application of the maximum curvature technique to such cumulative usage curves in the current case (Win et al. 2013) reflects the advances in the details of this analytical method by JNCC since then (O’Brien et al. 2012).
Thus, in summary, although Webb & Reid (2004) does not directly address the issue of data requirements in regard of establishing marine SPAs for breeding seabirds, many aspects of the collection and analysis of the tern tracking work which has been used to define the location and extent of the Morecambe Bay & Duddon Estuary pSPA can be seen to accord with the guidelines set out in that document.
Establishment of the extent of Morecambe Bay & Duddon Estuary pSPA
The extent of the pSPA boundary is determined partially by the extent of the model-generated predictions of which areas of sea are most heavily used by foraging terns originating from two source colonies. The boundary of the pSPA is a composite of several discrete, but in some case overlapping, areas identified by the modelling as being most heavily used by different species of tern from different colonies. All species and colony-specific areas of use have been derived from models based on at-sea records of the foraging locations of the particular species but at other colonies around the UK i.e. generic models (e.g. Sandwich terns at the Farne Islands). The quality and relevance of the evidence provided in both of these ways is discussed in the following section.
The adequacy and relevance of these various models and of the modelling approach in general, was addressed by JNCC in three ways (Wilson et al. 2014):
i) Cross-validation of site specific models ii) Cross-validation of generic models iii) Adequacy of sample size data
A summary of the results of the cross-validation of both site specific and generic models of larger tern usage is presented in Annex 5, as is a summary of the analysis addressing the adequacy of the sample sizes.
The land-based extent of the pSPA is determined by the original classifications of Morecambe Bay and Duddon Estuary SPAs.
2.) The Analysis carried out is appropriate to the evidence available and the question or issue under consideration
The other major analyses which underpin the pSPA are: i) the boat-based and shore-based observations of little terns, ii) the habitat-association based modelling of larger tern usage patterns and ii) identification of threshold levels of predicted larger tern usage which were used to define the site boundary.
The very restricted foraging range of little terns precluded the use of the predictive habitat association modelling approach that was used for the larger terns. Accordingly, it was appropriate to gather empirical evidence on little tern distributions from which to determine directly the boundaries to the areas of greatest usage by foraging birds at each colony. At colonies where evidence was lacking or insufficient it was considered appropriate to make use of data gathered at other colonies to determine “generic” boundaries which, comparison with all available data indicated, would capture a very significant proportion of total usage (see Annex 4).
The habitat association modelling approach is a novel one which has not been used in defining the extent or boundaries of any marine SPA to date. However, the decision to adopt a habitat association modelling approach was the subject of discussion between JNCC and all other
Final Pre Formal Consultation DB Morecambe Bay and Duddon Estuary SPA Departmental Brief. Page 65 of 74 January 2016
statutory nature conservation bodies over many years and agreement to follow this approach informed the design of the survey programme coordinated by JNCC since 2009. For the modelling analysis part of the project JNCC worked collaboratively with their statistical advisors Biomathematics and Statistics Scotland (BioSS).
Although the method by which the grid-cell based maps of predicted bird distribution were drawn up in this case differed in detail from more conventional spatial interpolation and spatial analysis considered by Webb & Reid (2004), the way in which the resultant maps of predicted bird distribution were analysed to determine threshold levels of predicted tern usage, and hence to define the site boundary, (i.e. maximum curvature analysis) represents application of an established method used at other marine SPAs (O’Brien et al. 2012) and is thus entirely appropriate to the evidence available.
Following completion of the work on both larger terns and little terns, JNCC commissioned external peer review of both pieces of work. Those peer reviews did not highlight any significant issues with the appropriateness of the analyses which were not resolved by subsequent discussion between the reviewers and JNCC. Further details of the external peer review are provided in section 5 of this Annex.
Analysis of non-breeding data follows the convention of calculating five-year peak mean values from the most recent data available, and thus is considered entirely appropriate to the evidence.
3.) Conclusions are drawn which clearly relate to the evidence and analysis
The conclusions regarding the list of features and their reference population sizes within the pSPA are based on application of the SPA selection guidelines issued by JNCC (JNCC 1999) to the best and most recent count data, or to count data originating from the time of original classification. As such the conclusions in this respect clearly relate to the best available evidence.
The conclusions regarding the drawing of the landward boundary of the pSPA along the Cumbria coast at MHW are based upon the evidence provided in the form of a model of predicted usage by foraging Sandwich tern. In this instance Sandwich tern used the generic model which included distance from shore as a significant covariate with a negative coefficient indicative of highest use being closest to shore and therefore in many instances inclusive of intertidal areas. That the use of such areas by larger tern species is also likely is supported by information in the scientific literature. A review of tern foraging ecology (Eglington 2013) notes that larger tern species including Sandwich tern routinely forage in areas of shallow water. There is no reason on the basis of that review to consider it likely that that Sandwich terns will not forage over intertidal areas. Accordingly, in this respect too, the conclusions clearly relate to the best available evidence.
The conclusions regarding the drawing of the seaward boundary of the pSPA are based upon the evidence provided in the form of models of predicted usage by foraging larger tern species and the application of a standard analytical method, already well-established for use in marine SPA boundary setting i.e. maximum curvature (O’Brien et al. 2012), to the models’ outputs. The validity and robustness of the outputs of the site specific and generic models used to underpin the boundary analysis of the pSPA have been established by the process of cross-validation described in Annex 5. Thus, the conclusions in this respect clearly relate to the best available analysis of the best available evidence.
Since the modelling work was completed by JNCC, the Department of the Environment, Northern Ireland (DoENI) commissioned in 2014 a programme of land-based and at-sea surveys to verify the extents of tern foraging activity at three sites in Northern Ireland i.e. Larne Lough, Strangford Lough and Carlingford Lough. At each of these sites, the same generic predictive models, as already described in this Departmental Brief, had also been used to generate relative usage maps for at least one species of larger tern ( and in some cases for all species) and hence to determine proposed site boundaries. In summary, this work (Allen & Mellon Environmental Ltd 2015) confirmed the presence of terns (mainly Sandwich) to the furthermost alongshore limits of the areas searched and in one case beyond the limit of the modelled alongshore boundaries. The work

Final Pre Formal Consultation DB Morecambe Bay and Duddon Estuary SPA Departmental Brief. Page 66 of 74 January 2016
provided some evidence that the larger terns do feed further out to sea than the limits of the modelled boundaries. However, the use of the threshold setting approach to the predicted relative usage maps does not deny that terns may forage beyond that limit. The work also provided some evidence that the very intense use of localised hotspots of activity recorded in or close to the entrances to the loughs were not as clearly identified as such by the models. However, the proposed boundaries in each of the three sites did contain the hotspots within the lough entrances. Thus, these verification surveys provide: confirmation that hotspots of usage near colonies are contained within modelled boundaries, some evidence that proposed boundaries, based on model predictions, may be somewhat conservative in regard of their seaward limits, and no evidence that their alongshore or seaward extents are in any way excessive.
4.) Uncertainty arising due to the nature of the evidence and analysis is clearly identified, explained and recorded.
Count data
The UK SMP is an internationally recognised monitoring scheme coordinated by JNCC in partnership with others (e.g. statutory nature conservation bodies, the RSPB and other colony managers as data providers, etc.). It collects data according to standardised field methods (Walsh et al. 1995). SMP data are verified by the JNCC seabird team. Therefore, there is high confidence in SMP data. The majority of the data which has been used in determining the size of the populations of each of the species considered for inclusion as features of the pSPA is based on counts which are on the SMP database and so justify high confidence.
RSPB survey data are verified and quality assured by the RSPB count coordinator and site manager and Cumbria Wildlife Trust (CWT) data is verified and quality assured by the site manager [TBC]. Both are professional organisations with long-standing experience of seabird monitoring, and surveys are conducted by trained surveyors. There is therefore high confidence in RSPB and CWT survey data. Accordingly, such data referred to in this Departmental Brief can be considered to justify high confidence.
The Wetland Bird Survey (WeBS) is a partner organisation comprising BTO, RSPB and JNCC (on behalf of the Country Agencies), and in association with WWT. It is the national scheme for monitoring non-breeding waterbirds in the UK and has been running in various guises for more than 40 years. All data are checked thoroughly by the WeBS team before release. There is thus high confidence in the WeBS data used.
One are of uncertainty is in ‘true’ numbers of birds using sites. Aside from the issue of WeBS being a ‘snapshot’ survey (i.e. counts are made once a month with no records from days other than the count visit date), and thus perhaps ignores the issue of ‘turnover’ of birds on a site, many counts in the dataset were flagged as undercounts. This is where the counter believes the ‘true’ number of birds present was not recorded for some reason (e.g. poor visibility, birds were disturbed and departed before count complete, and so on).
The analysis of WeBS data here has assumed that such counts can be considered as minima. We have not excluded undercounts or attempted to calculate five-year peak means using anything other than the full dataset. The expectation is that undercounts are just as likely to occur at any given time, and so should not have an undue bias over time.
Landward boundary
The issue regarding the confidence in the evidence base upon which the decision to draw the landward boundary of the pSPA to MHW along the coast has been made, is discussed in the previous section.
Seaward boundary
The position of the seaward boundary of the pSPA is the principal source of uncertainty in the identification and characterisation of the site. The position of the seaward boundary of the pSPA
Final Pre Formal Consultation DB Morecambe Bay and Duddon Estuary SPA Departmental Brief. Page 67 of 74 January 2016
has been determined on the basis of outputs of statistical models which in some cases are based on tern behaviour at colonies in other parts of the UK. Accordingly, it is almost inevitable that there is a greater degree of uncertainty regarding the robustness of the boundary location than if it had been derived directly from a comprehensive site-specific set of observations of tern foraging locations. However, provided the models are empirically evidence based, and shown to be robust via cross validation, the modelling approach brings with it a robustness which may exceed that which might be achieved from reliance on a limited empirical dataset of tern foraging locations. It is considered that the cross-validation analyses and sample-size sufficiency analyses indicate that proposed boundaries generated by the modelling approach have degrees of uncertainty that are acceptable, and certainly need not be considered to be any worse than if it had been possible to apply more conventional approaches. This issue is discussed fully in Annex 5.
5.) Independent expert review and internal quality assurance processes
Independent expert review
Natural England’s standard in quality assurance of use of evidence, including peer review, (http://www.naturalengland.org.uk/images/operationalstandardsforevidence_tcm6-28588.pdf) has been followed in determining the level of independent expert review and internal quality assurance required in relation to Natural England’s analysis of the evidence for this site and the way that the boundary has been drawn up. Independent expert review is to be adopted where there is a high novelty or technical difficulty to the analysis.
The derivation of the alongshore extent and seaward boundary to the pSPA is based on a novel approach, never used before in SPA designation, and has entailed considerable technical difficulty in the analyses. In recognition of this, JNCC commissioned independent expert review of both the larger tern and little tern programmes of work. A representative of Natural England, along with those of all other country statutory nature conservation bodies, was involved by JNCC in setting the terms of reference for the review work, in nominating potential reviewers for JNCC to consider approaching, and in the selection of those who carried out the reviews.
The larger tern modelling work was reviewed by two independent scientists (Dr Mark Bolton of the RSPB and Dr Norman Ratcliffe of the British Antarctic Survey). In summary, both reviewers raised two primary issues with the data collection and its analyses. These related to: i) the focus of the tern tracking work during the chick-rearing phase of the breeding season and ii) to the details of the way in which control points denoting tern absence were generated to match track locations where terns were recorded and the use of that information to determine terns’ preference for each location and the conversion of that preference pattern into a pattern of tern usage. In regard to the first issue, JNCC acknowledged that the focus of the tracking work was only on the chick-rearing period, partly in order to ensure that sufficient data were gathered during that one period, but also in recognition of the need to focus attention on the identification and protection of those sea areas which are of most importance to the birds when their ability to buffer themselves against adverse environmental conditions by foraging further from the colony is most limited by time and energy constraints and their need to provision their chicks. The report (Wilson et al. 2014) was amended to acknowledge the fact that the modelled boundaries are unlikely to fully capture areas of importance during the incubation phase of the breeding cycle. The second point of concern raised by the reviewers led to extended discussion between the reviewers, JNCC and BiOSS. As part of this process, independent advice was sought from Dr Geert Aarts (AEW Wageningen University). In summary, the conclusion of those discussions, agreed by all, was that the methods used by JNCC and BioSS were sound and appropriate, but that further clarification was needed in the text of the report. As a result of these discussions, the relevant section of the report (Box 1 in Wilson et al. 2014) was amended.
The reports on the little tern field work methodology and results and subsequent boundary setting work were also put out to independent peer review by JNCC. One main point made by the peer reviewer(s) was that the boat and shore-based observations should have been corroborated more extensively with data from radio tracking or even habitat modelling. JNCC did in fact use radio tracking, at one site, where it confirmed the results of their techniques. JNCC did not consider it to

Final Pre Formal Consultation DB Morecambe Bay and Duddon Estuary SPA Departmental Brief. Page 68 of 74 January 2016
be necessary or even practicable to apply this approach more widely. JNCC considered that habitat modelling was not possible, given the small range of the species and the limited availability of environmental data over that range. JNCC noted that it would have been prohibitively expensive to collect their own environmental data, even at a few sites, and with unknown chance of “success”. The other main point made by the peer reviewers (in accord with the same suggestion made by the peer reviewers of the larger tern work) was for data to have also been collected during the incubation period. However, as noted above in regard of work on larger terns, it was decided at the outset of the work that the priority should be on the chick-rearing period, because it is probably at this time when little terns face the greatest energetic demands. The focus was on chick-rearing for biological reasons but also logistical ones; JNCC noted that there would have been a risk of obtaining too few data during both incubation and chick-rearing if both periods were studied. One reviewer asked for greater reference to the findings of other studies but JNCC considered this aspect to be sufficient. A number of improvements were made to text, tables and figures by JNCC, on the recommendation of the reviewer, and some additional text was included in the Discussion to serve as a Conclusion to the report.
In the light of Natural England’s involvement with the review process conducted by JNCC and in the light of its outcomes, Natural England did not consider it necessary to initiate its own independent expert review of the reports prepared by JNCC.
Internal peer review and quality assurance
A representative of Natural England has been involved in the entire history of the larger and little tern monitoring and modelling work programme since its inception. Since late 2009, this role was fulfilled by Dr Richard Caldow (Senior Environmental Specialist: Marine Ornithology). Accordingly, Natural England has, in conjunction with Scottish Natural Heritage (SNH), Natural Resources Wales (NRW) and Department of the Environment Northern Ireland (DoENI), been in a position to review and provide quality assurance of the programme of JNCCs work and its findings from start to finish as detailed below.
JNCC evidence reports relating to marine SPA identification go through an extensive internal and external QA process. This has applied to all of the main strands of analysis (ESAS analyses to identify offshore hotspots of usage, inshore wintering waterbird work, larger tern work, and little tern work).
The general approach and survey methods are subject to internal and external discussion, often in workshop format. External discussion can involve organisations such as SNCBs who will use the outputs, academics and other researchers in the field. Once an approach and survey method has been agreed and data collection has started, interim reports are prepared which are subject to internal and SNCB review. Analysis of data is subject to discussions (and workshops if appropriate) internally and with academics and statistical contractors if appropriate. For particularly challenging analyses (such as larger tern modelling work) statistical contractors may undertake significant portions of exploration and development work, and/or of final analysis. Finally, once all the data has been collected and analysed, JNCC prepare an extensive report which has contributions from several JNCC staff, undergoes several rounds of JNCC and SNCB comment, and is finally signed off at JNCC Grade 7 level. At this stage it goes to SNCBs for use in their own work in parallel with going to external peer review, where a minimum of 2 reviewers are sought. Reviewers are usually sought with knowledge of the species ecologies and/or statistical and technical understanding, with reviewers sought to complement each other (for example with differing expertise, from differing types of organisation). JNCC then respond to peer reviews, making changes to ‘final’ reports if appropriate. Only if peer review comments are significant and fundamental is further grade 7 sign off sought before publishing as part of the JNCC report series.
The first version of this Departmental Brief was drawn up by Alex Banks, Emily Kirkham, Helen Ake and Chris Lumb of Natural England. This version (will be) quality assured by Defra, JNCC (David Stroud), MPATG and UKMBPSG.
References:
Final Pre Formal Consultation DB Morecambe Bay and Duddon Estuary SPA Departmental Brief. Page 69 of 74 January 2016
Allen & Mellon Environmental Ltd. 2015. Validation of selected tern foraging areas associated with breeding colony SPAs. Reference Number CT2 (4). Unpublished report to Department of the Environment Northern Ireland. 53pp.
Eglington, S. (2013). Literature review of tern Sterna sp. foraging ecology. Report to JNCC, under Contract ref. C13-0204-0686.
JNCC (1999): The Birds Directive – selection guidelines for Special Protection Areas. JNCC, Peterborough. Available at: http://jncc.defra.gov.uk/page-1405
McSorley, C.A., Dean, B.J., Webb, A., Reid, J.B. (2003): Seabird use of waters adjacent to colonies, JNCC Report No. 329. Available at: http://jncc.defra.gov.uk/page-2342
McSorley, C.A., Webb, A., Dean, B.J., Reid J.B. (2005): Generic guidelines for seaward extensions to existing breeding northern fulmar Fulmarus glacialis colony Special Protection Areas. JNCC Report No. 358. Available at: http://jncc.defra.gov.uk/pdf/JNCC358web.pdf
McSorley, C.A., Dean, B.J., Webb, A., Reid J.B. (2006): Extending the boundaries of seabird breeding colony protected areas into the marine environment. Waterbirds around the world. Eds. G.C. Boere, C.A. Galbraith & D.A. Stroud. The Stationery Office, Edinburgh, UK. pp. 752-753. Available at: http://jncc.defra.gov.uk/PDF/pub07_waterbirds_part5.5.4.pdf
O’Brien, S.H., Webb, A., Brewer, M. J. & Reid, J. B. 2012 Use of kernel density estimation and maximum curvature to set Marine Protected Area boundaries: Identifying a Special Protection Area for wintering red-throated divers in the UK. Biological Conservation, 156, 15–21.
Reid, J., Webb, A. (2005): JNCC Committee Papers – December 2005. Marine NATURA 2000 – Recommendations for the extension of existing seabird (colony) Special Protection Areas into the marine environment. JNCC 05 P14B. Available at: http://jncc.defra.gov.uk/pdf/comm05P14B.pdf
Walsh, P.M., Halley, D.J., Harris, M.P., del Nevo, A., Sim, I.M., Tasker, M.L. (1995): Seabird Monitoring Handbook for Britain and Ireland. JNCC, RSPB, Seabird Group, Peterborough, 150 pp. Available at: http://jncc.defra.gov.uk/PDF/pub95_SeabirdHandbook.pdf
Wilson L. J., Black J., Brewer, M. J., Potts, J. M., Kuepfer, A., Win I., Kober K., Bingham C., Mavor R. and Webb A. (2014). Quantifying usage of the marine environment by terns Sterna sp. around their breeding colony SPAs. JNCC Report no. 500. July 2014.

Final Pre Formal Consultation DB Morecambe Bay and Duddon Estuary SPA Departmental Brief. Page 70 of 74 January 2016
Annex 7 Data used in Departmental Brief
This annex presents the data used to derive peak mean values within this brief. Current values are presented even where declines have meant original SPA citation values have been retained.
1. Breeding features
Wherever possible, data were drawn from the national Seabird Monitoring Programme database (http://jncc.defra.gov.uk/smp/). These data were supplemented with counts from RSPB (Hodbarrow) and Cumbria Wildlife Trust (Morecambe Bay).
Table 1. Counts of breeding birds (pairs). Hodbarrow counts for terns include birds nesting at Ski Bank, outside the RSPB reserve. ‘-‘ indicates no count data available.
2010 2011 2012 2013 2014 2015
Lesser black-backed gull
South Walney 9829 8130 4987 3850 3850 3034
Hodbarrow 55 155 60 123 67 43
Total 9854 8160 4997 3973 3917 3034
Herring gull
South Walney 2246 2094 1734 1529 535 2039
Hodbarrow 10 18 5 15 7 4
Total 2248 2097 1736 1531 536 2039
Sandwich tern
Foulney Island - 1 0 0 0 -
Hodbarrow 170 0 1 10 20 -
Total 170 1 1 10 20 -
Common tern
Foulney Island - 8 14 0 0 -
South Walney 1 0 - - - -
Hodbarrow 44 44 31 47 44 -
Total 45 52 45 47 44 -
Little tern
Foulney Island 35 62 44 21 18 -
Haverigg Haws 0 0 0 0 4 -
Hodbarrow 0 0 0 13 15 -
Total 35 62 44 34 37 -
2. Non-breeding features
All data were drawn from the national Wetland Bird Survey (WeBS) database (http://blx1.bto.org/webs-reporting/). These data were supplemented with counts from WWT’s Icelandic-breeding Goose Census (Mitchell 2014).
Table 2. Counts of non-breeding birds (individuals). Bracketed values represent known undercounts.
Species 2009/2010 2010/2011 2011/2012 2012/2013 2013/2014
Whooper Swan (118) (FEB) (74) (NOV) (68) (NOV) (103) (NOV) (201) (NOV)
Pink-footed Goose (3648) (FEB) (11811) (OCT)
(24850) (JAN)
(15343) (OCT)
(22590) (OCT)
Shelduck (8501) (OCT)
(6876) (NOV)
(5686) (NOV)
(4543) (SEP)
(3786) (OCT)
Pintail (3723) (DEC)
(3180) (OCT)
(2942) (NOV)
(1198) (DEC)
(1446) (OCT)
Little Egret (92) (OCT) 169 (SEP) (107) (NOV) 148 (OCT) (153) (SEP)
Oystercatcher (61538) (OCT)
84068 (SEP) 46409 (OCT)
48926 (SEP) (38499) (SEP)
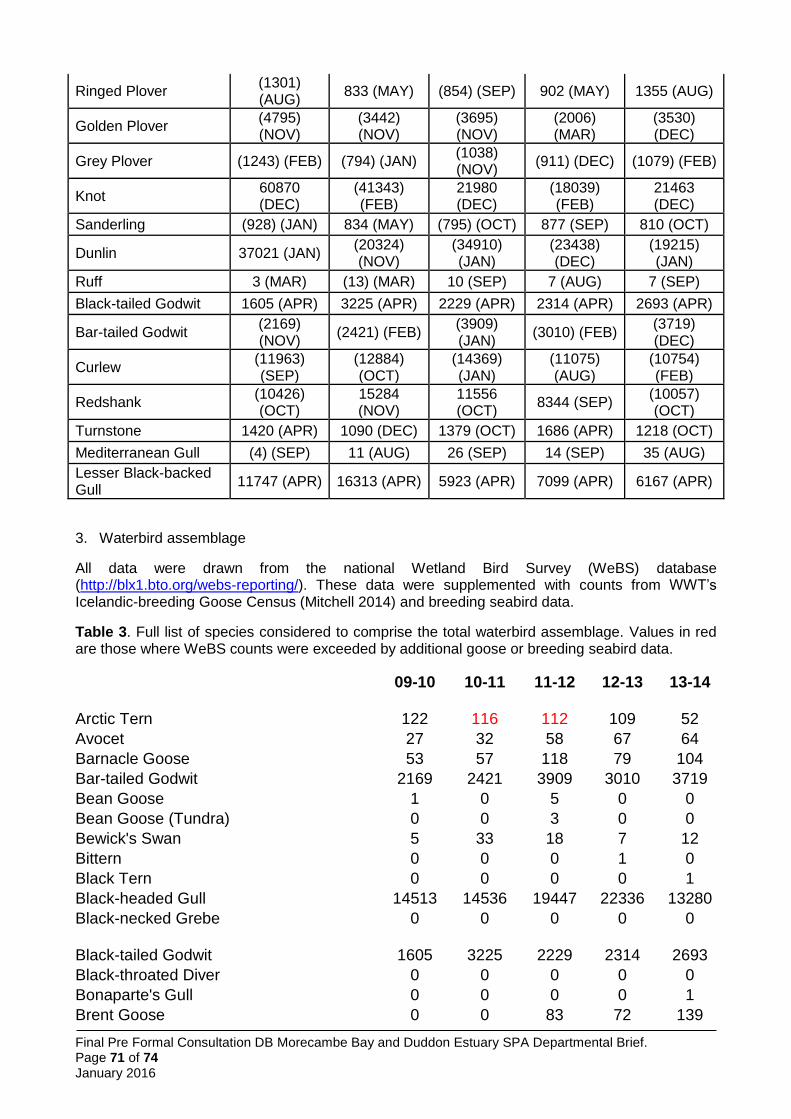
Final Pre Formal Consultation DB Morecambe Bay and Duddon Estuary SPA Departmental Brief. Page 71 of 74 January 2016
Ringed Plover (1301) (AUG)
833 (MAY) (854) (SEP) 902 (MAY) 1355 (AUG)
Golden Plover (4795) (NOV)
(3442) (NOV)
(3695) (NOV)
(2006) (MAR)
(3530) (DEC)
Grey Plover (1243) (FEB) (794) (JAN) (1038) (NOV)
(911) (DEC) (1079) (FEB)
Knot 60870 (DEC)
(41343) (FEB)
21980 (DEC)
(18039) (FEB)
21463 (DEC)
Sanderling (928) (JAN) 834 (MAY) (795) (OCT) 877 (SEP) 810 (OCT)
Dunlin 37021 (JAN) (20324) (NOV)
(34910) (JAN)
(23438) (DEC)
(19215) (JAN)
Ruff 3 (MAR) (13) (MAR) 10 (SEP) 7 (AUG) 7 (SEP)
Black-tailed Godwit 1605 (APR) 3225 (APR) 2229 (APR) 2314 (APR) 2693 (APR)
Bar-tailed Godwit (2169) (NOV)
(2421) (FEB) (3909) (JAN)
(3010) (FEB) (3719) (DEC)
Curlew (11963) (SEP)
(12884) (OCT)
(14369) (JAN)
(11075) (AUG)
(10754) (FEB)
Redshank (10426) (OCT)
15284 (NOV)
11556 (OCT)
8344 (SEP) (10057) (OCT)
Turnstone 1420 (APR) 1090 (DEC) 1379 (OCT) 1686 (APR) 1218 (OCT)
Mediterranean Gull (4) (SEP) 11 (AUG) 26 (SEP) 14 (SEP) 35 (AUG)
Lesser Black-backed Gull
11747 (APR) 16313 (APR) 5923 (APR) 7099 (APR) 6167 (APR)
3. Waterbird assemblage
All data were drawn from the national Wetland Bird Survey (WeBS) database (http://blx1.bto.org/webs-reporting/). These data were supplemented with counts from WWT’s Icelandic-breeding Goose Census (Mitchell 2014) and breeding seabird data.
Table 3. Full list of species considered to comprise the total waterbird assemblage. Values in red are those where WeBS counts were exceeded by additional goose or breeding seabird data.
09-10 10-11 11-12 12-13 13-14
Arctic Tern 122 116 112 109 52
Avocet 27 32 58 67 64
Barnacle Goose 53 57 118 79 104
Bar-tailed Godwit 2169 2421 3909 3010 3719
Bean Goose 1 0 5 0 0
Bean Goose (Tundra) 0 0 3 0 0
Bewick's Swan 5 33 18 7 12
Bittern 0 0 0 1 0
Black Tern 0 0 0 0 1
Black-headed Gull 14513 14536 19447 22336 13280
Black-necked Grebe 0 0 0 0 0
Black-tailed Godwit 1605 3225 2229 2314 2693
Black-throated Diver 0 0 0 0 0
Bonaparte's Gull 0 0 0 0 1
Brent Goose 0 0 83 72 139
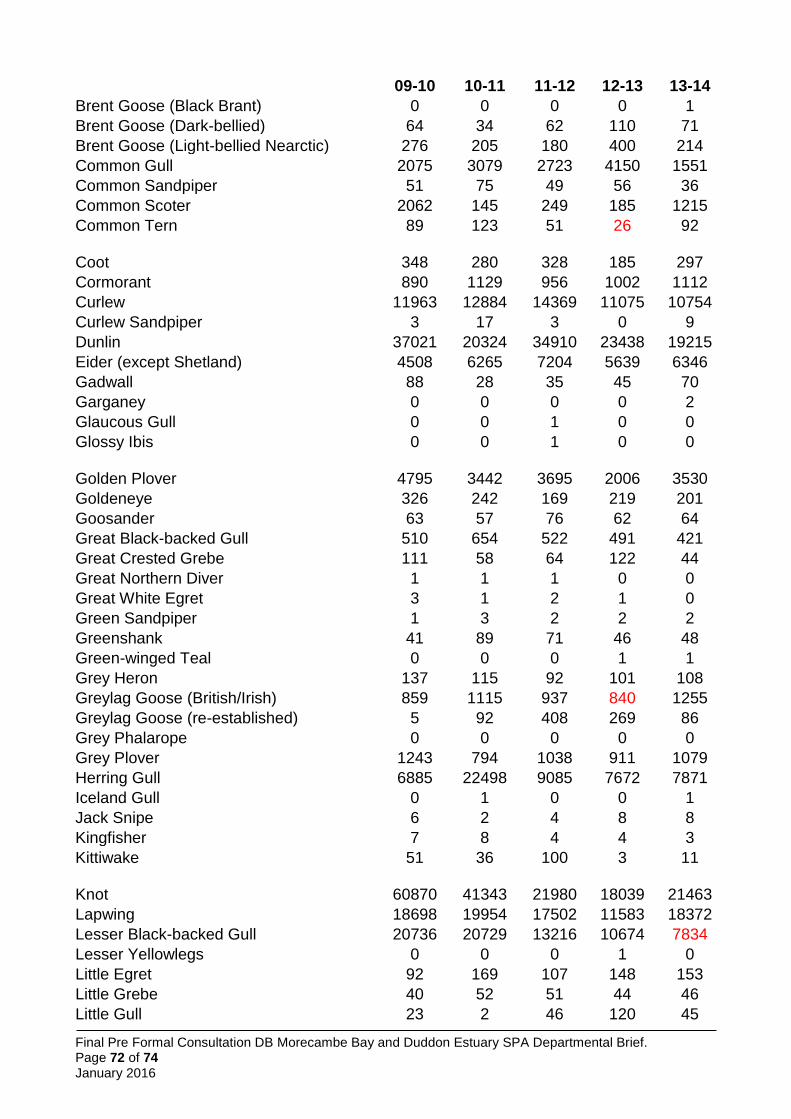
Final Pre Formal Consultation DB Morecambe Bay and Duddon Estuary SPA Departmental Brief. Page 72 of 74 January 2016
09-10 10-11 11-12 12-13 13-14
Brent Goose (Black Brant) 0 0 0 0 1
Brent Goose (Dark-bellied) 64 34 62 110 71
Brent Goose (Light-bellied Nearctic) 276 205 180 400 214
Common Gull 2075 3079 2723 4150 1551
Common Sandpiper 51 75 49 56 36
Common Scoter 2062 145 249 185 1215
Common Tern 89 123 51 26 92
Coot 348 280 328 185 297
Cormorant 890 1129 956 1002 1112
Curlew 11963 12884 14369 11075 10754
Curlew Sandpiper 3 17 3 0 9
Dunlin 37021 20324 34910 23438 19215
Eider (except Shetland) 4508 6265 7204 5639 6346
Gadwall 88 28 35 45 70
Garganey 0 0 0 0 2
Glaucous Gull 0 0 1 0 0
Glossy Ibis 0 0 1 0 0
Golden Plover 4795 3442 3695 2006 3530
Goldeneye 326 242 169 219 201
Goosander 63 57 76 62 64
Great Black-backed Gull 510 654 522 491 421
Great Crested Grebe 111 58 64 122 44
Great Northern Diver 1 1 1 0 0
Great White Egret 3 1 2 1 0
Green Sandpiper 1 3 2 2 2
Greenshank 41 89 71 46 48
Green-winged Teal 0 0 0 1 1
Grey Heron 137 115 92 101 108
Greylag Goose (British/Irish) 859 1115 937 840 1255
Greylag Goose (re-established) 5 92 408 269 86
Grey Phalarope 0 0 0 0 0
Grey Plover 1243 794 1038 911 1079
Herring Gull 6885 22498 9085 7672 7871
Iceland Gull 0 1 0 0 1
Jack Snipe 6 2 4 8 8
Kingfisher 7 8 4 4 3
Kittiwake 51 36 100 3 11
Knot 60870 41343 21980 18039 21463
Lapwing 18698 19954 17502 11583 18372
Lesser Black-backed Gull 20736 20729 13216 10674 7834
Lesser Yellowlegs 0 0 0 1 0
Little Egret 92 169 107 148 153
Little Grebe 40 52 51 44 46
Little Gull 23 2 46 120 45
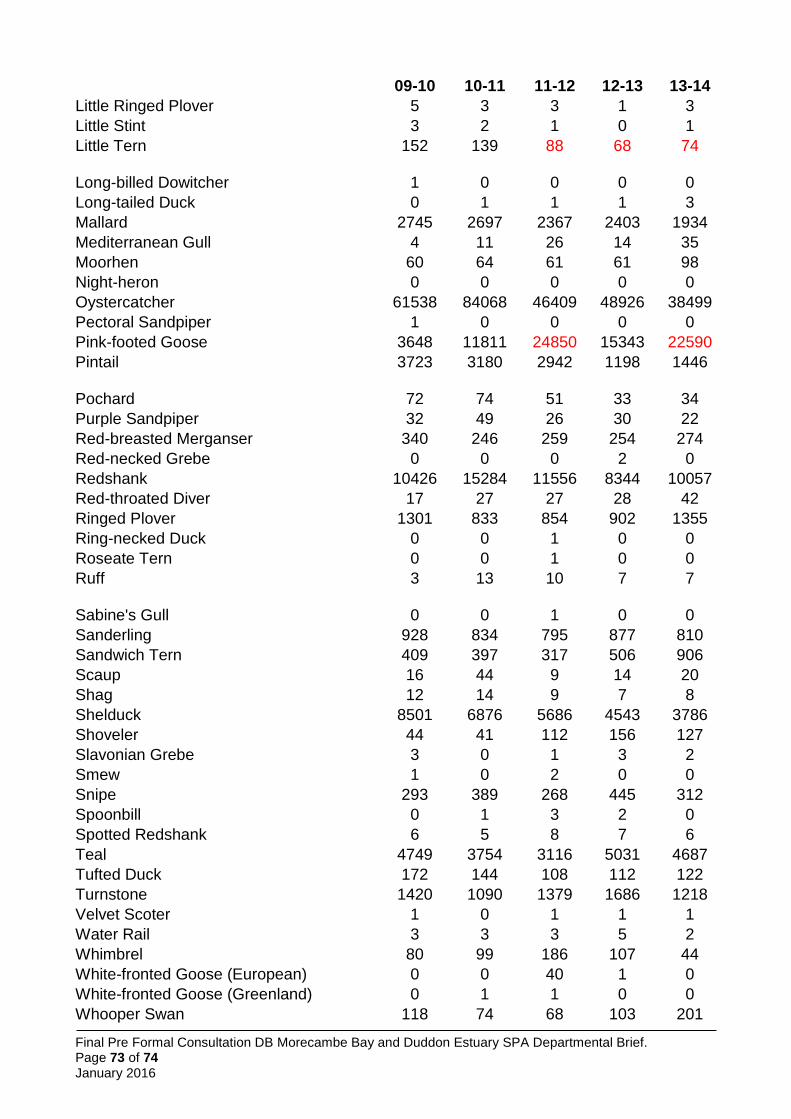
Final Pre Formal Consultation DB Morecambe Bay and Duddon Estuary SPA Departmental Brief. Page 73 of 74 January 2016
09-10 10-11 11-12 12-13 13-14
Little Ringed Plover 5 3 3 1 3
Little Stint 3 2 1 0 1
Little Tern 152 139 88 68 74
Long-billed Dowitcher 1 0 0 0 0
Long-tailed Duck 0 1 1 1 3
Mallard 2745 2697 2367 2403 1934
Mediterranean Gull 4 11 26 14 35
Moorhen 60 64 61 61 98
Night-heron 0 0 0 0 0
Oystercatcher 61538 84068 46409 48926 38499
Pectoral Sandpiper 1 0 0 0 0
Pink-footed Goose 3648 11811 24850 15343 22590
Pintail 3723 3180 2942 1198 1446
Pochard 72 74 51 33 34
Purple Sandpiper 32 49 26 30 22
Red-breasted Merganser 340 246 259 254 274
Red-necked Grebe 0 0 0 2 0
Redshank 10426 15284 11556 8344 10057
Red-throated Diver 17 27 27 28 42
Ringed Plover 1301 833 854 902 1355
Ring-necked Duck 0 0 1 0 0
Roseate Tern 0 0 1 0 0
Ruff 3 13 10 7 7
Sabine's Gull 0 0 1 0 0
Sanderling 928 834 795 877 810
Sandwich Tern 409 397 317 506 906
Scaup 16 44 9 14 20
Shag 12 14 9 7 8
Shelduck 8501 6876 5686 4543 3786
Shoveler 44 41 112 156 127
Slavonian Grebe 3 0 1 3 2
Smew 1 0 2 0 0
Snipe 293 389 268 445 312
Spoonbill 0 1 3 2 0
Spotted Redshank 6 5 8 7 6
Teal 4749 3754 3116 5031 4687
Tufted Duck 172 144 108 112 122
Turnstone 1420 1090 1379 1686 1218
Velvet Scoter 1 0 1 1 1
Water Rail 3 3 3 5 2
Whimbrel 80 99 186 107 44
White-fronted Goose (European) 0 0 40 1 0
White-fronted Goose (Greenland) 0 1 1 0 0
Whooper Swan 118 74 68 103 201

Final Pre Formal Consultation DB Morecambe Bay and Duddon Estuary SPA Departmental Brief. Page 74 of 74 January 2016
09-10 10-11 11-12 12-13 13-14
Wigeon 7860 6848 6420 9759 10619
Wood Sandpiper 0 0 0 1 0
Woodcock 2 3 0 1 0
Yellow-legged Gull 1 1 2 2 1
Grand Total 302126 315585 264343 228657 223042
Five year peak mean
266,751