Embed Size (px)
Citation preview
World Journal of Agricultural Sciences 7 (6): 743-754, 2011ISSN 1817-3047© IDOSI Publications, 2011
Corresponding Author: T. Prema Ranjitham, Department of Plant Pathology, Centre for Plant Protection Studies, Tamil Nadu Agricultural University, Coimbatore-641 003, India.
743
Morphological and Physiological Characterization of Colletotrichum musae the Causal Organism of Banana Anthracnose
Prema ranjitham Thangamani, Prabakar Kuppusamy, Mohammed Faisal Peeran, Kathikeyan Gandhi and Thiruvengadam Raguchander
Department of Plant Pathology, Centre for Plant Protection Studies, Tamil Nadu Agricultural University, Coimbatore-641 003, India
Abstract: Sixteen isolates of C. musae were collected from different banana growing areas of Tamil Nadu andtheir pathogenicity was proved under laboratory conditions. Effect of different pH levels, temperature, lightintensity and media were tested against the growth of C. musae under in vitro. Results indicated that thegrowth of C. musae was maximum at pH range of 6.50-7.00 and temperature range of 25-30°C. Exposure of thefungus to alternate cycles of 12 hr light and 12 hr darkness resulted in the maximum mycelial growth of C. musaecompared to the 24 hr exposure to either continuous light or dark. Among the different media tested, Potatodextrose agar medium supported significantly the maximum growth of all the sixteen isolates of C. musae.Further, the strains were found to vary morphologically between the isolates under the study.
Key words: Banana Colletotrichum musae pH Temperature Light and Media
INTRODUCTION pathogenic on banana. The cultures were distinct with
Banana anthracnose caused by Colletotrichum cinnamon conidial masses, elliptical shape conidia andmusae (Berk. and Curt) Arx. is considered as one of the setae absent. coloured acervuli. most important diseases of banana in the global level and The growth characters of different isolates ofis one of the major constraints to banana production [1,2]. Colletotrichum spp. varied on different solid media.It deteriorates the quality and nutritive value of the fruits The growth and sporulation of the C. capsici infectingand renders them unfit for marketing and consumption, chilli was maximum on PDA and Das Gupta’s standardthereby causing severe loss to farmers and traders. medium [8]. PDA supported the maximum growth ofColletotrichum musae is the most important pathogen on C. gloeosporioides [9,10]. Anand et al. [11] reportedwounded green and ripe banana fruits [3,4]. Occasionally, that the isolate of C. capsici produced white colonies onthe fungus invades necks of green fingers when damaged Richard’s agar, ripe chilli fruit extract agar, oat meal agarby flexing. Lesions are sunken and covered with salmon- and PDA and it produced greyish white, whitish black,colored acervuli [5]. Infections stimulate ripening of fruits blackish white and black coloured colonies on Czapek Doxand lesions elongate with ripening. On ripening fruits, agar, chilli leaf extract agar, green chilli fruit extract agarsunken brown spots develop with orange acervuli [4]. and radish dextrose agar, respectively. Manjunath [12]Jinyoung Lim et al. [6] studied the cultural and reported that C. gloeosporioides produced black colouredmorphological characters of C. musae. They observed the colonies on water agar, white coloured on Richards, oatcolony was loose with white aerial mycelium, which later meal agar, PDA, host leaf extract and Walksman’s agar,became orange in color. Several black, acervulus-like blackish white colonies on nutrient agar, greyish white onmasses developed on the culture plates after incubation Czapek Dox agar and dark white on Martin’s Rose Bengalfor 10 days at 25°C with dark-orange drops of conidia. agar médium and reddish white on King’s B agar medium.Conidia were aseptate, hyaline, mostly ellipsoid, ranging The metabolic and catabolic activity of an organism variesfrom 10-18 µm and 5-9 µm (average of 14.5-6.9 µm ) in size. depending on the hydrogen ion concentration existing inPhotita et al. [7] reported that the C. musae isolates were the surrounding environment. Hence, pH plays a vital role
fast growing sparse aerial mycelium, white, with copious
World J. Agric. Sci., 7 (6): 743-754, 2011
744
in deciding the nature and activities of microorganisms The inoculated Petri plates and slants were incubated[13]. C. gloeosporioides exhibited the maximum mycelial under sterilized bell jar at room temperature (28 ± 2°C) andgrowth at pH 7 [14,15]. observations were taken at regular intervals.
Temperature affects the physiological function of thefungi, which in turn affect the phenotypic expression. Identification of the Pathogen: The pathogen wasFor each fungus, there is a particular temperature below identified up to species level based on their cultural andwhich it will not grow. Likewise, there is a particular morphological characters. A loop full of fungal culturetemperature above which the growth ceases. A grown on PDA plates were taken on a glass slide andtemperature of 25°C was reported to be the optimum for observed with image analyzer under 100 X magnificationsthe growth of C. gloeosporioides on mango, almond and for the presence of conidia and conidiophore. Afteravocado [16-17]. Nandinidevi [10] reported that the confirming the spores, the cultures were purified by singlemycelial growth of C. gloeosporioides isolated from spore isolation technique. anthurium was maximum at 25°C compared to incubationof the fungus at 30°C. Manjunath [12] reported that the Pathogenicity Test: In order to prove Koch's postulates,optimum growth of C 1 isolate of C. gloeosporioides pathogenicity test was carried out. Fully matured greenisolated from noni was at 25-28°C. Mishra and Siradhana unripe banana fruits were collected from the field, washed[19] reported that, the diurnal exposure favored the thoroughly under running tap water. The fruits were blotgrowth and sporulation of C. graminicola. dried and surface sterilized with 70 per cent ethanol. The
The phase of growth is either stationary or fruits were injured (pinprick) with sterilized needle and theaccelerated or declining or autolysis. Yashodha et al. [20] spore suspension (5 x 10 spores/ml) of the pathogen wasstudied the growth phases of C. gloeosporioides causing prepared using a seven days old PDA culture by grindinganthracnose of arecanut. They noticed that the fungus it with sterile distilled water in a pestle and mortar andreached maximum growth after ten days of inoculation sprayed over the fruits. The fruits inoculated with sterilebeyond which autolysis occurred. Vegetative growth of distilled water after pin prick served as control. TheC. gloeosporioides isolated from stylosanthes reached inoculated fruit surface was covered with moist cottonmaximum on 14 day after inoculation and after that and the fruits were kept inside the moist chamber. Fiveth
autolysis was noticed [21]. fruits were used for each method. The infection was
MATERIALS AND METHODS The fungus was reisolated from the artificially
Collection and Establishment of Isolates of C. musae: and the culture obtained was confirmed for itsDuring the survey, anthracnose diseased samples werecollected from different market places of Tamil Nadu viz.,Coimbatore, Madurai, Erode, Tirunelveli andKancheepuram. The samples were first examined to obtained isolates of C. musae used in present study areconfirm the presence of the fungus. The diseased tissues tabulated as follows: were teased with a sharp blade on a glass slide having adrop of clear water and covered with a cover slip toconfirm the presence of fungal spores under the binocularresearch microscope (10 X). After confirming the presenceof fungal spores, isolation was carried out in the laminarflow chamber under aseptic conditions following astandard tissue isolation method [22]. The infected tissueof fruits which showed typical symptoms were cut intosmall bits measuring about 2 mm and surface sterilized in0.1 per cent mercuric chloride solution for one minute andwashed repeatedly thrice in sterile distilled water toremove the traces of mercuric chloride. Then surfacesterilized tissues were transferred to sterile Petri platescontaining PDA medium under aseptic conditions.
5
recorded after seven days.
inoculated fruits showing typical anthracnose symptoms
morphology and colony characters.
Isolates of C. musae Used in the Study: Sixteen different
Isolate Variety Place of collectionC1 Nendran 1 CoimbatoreC2 Nendran ErodeC3 Nendran TirunelveliC4 Karpooravalli ErodeC5 Robusta CoimbatoreC6 Rasthali CoimbatoreC7 Nadan MaduraiC8 Nendran 2 CoimbatoreC9 Hill banana MaduraiC10 Karpooravalli CoimbatoreC11 Nadan ErodeC12 Poovan TirunelveliC13 Nadan CoimbatoreC14 Poovan KancheepuramC15 Poovan ErodeC16 Poovan Coimbatore
World J. Agric. Sci., 7 (6): 743-754, 2011
745
Cultural Characters of the Isolates of C. musae Effect of Temperature on the Growth of C. musae:Growth Characters on Solid Media: Different solid media The effect of temperature on growth of the pathogen wasmentioned below were used for assessing the growth of studied. Different temperatures maintained for the growthisolates of C. musae. The mycelial diameter as well of pathogen on PDA were 5, 10, 15, 20, 25 and 30°C.morphological character of mycelia on different media was Mycelial disc of 8 mm was used to inoculate Petri plates.recorded. The composition and preparations of the Three replications were maintained for each treatment.following media were obtained from "Ainsworth and Inoculated plates were kept in incubator and temperatureBisby's Dictionary of the fungi" by Ainsworth [23] and was adjusted to required level. The mycelial growth wasPlant Pathological methods, fungi and bacteria by Tuite recorded on seventh day after inoculation.[24]. Each culture medium was prepared in one literof water and autoclaved at 120°C at 15 psi for 20 min. Effect of Light Intensity on the Growth of C. musae:These were cooled to 45°C and then poured in 9 cm Petridishes for solidification. Potato Dextrose Agar (PDA)Medium (Potato 250 g, Dextrose 20 g and Agar agar 20 g),Oat meal agar (Oat meal 40 g and Agar agar 20 g) [25],Water agar (Agar agar 20 g ), Richards agar (Sucrose 50 g,Potassium nitrate 10g, Magnesium sulphate 2.5 g,Ferric chloride 10 ml and Agar agar 20 g) [26], Czapekdox Agar Medium (Sodium nitrate 2 g, Potassiumnitrate 1 g, Magnesium sulphate 0.5 g, Potassiumchloride 0.5 g, Ferrous sulphate 3 g, Sucrose 30 g andAgar agar 20 g) [27], Martin’s Rose Bengal agar medium(Magnesium sulphate 0.20 g, Dipotassium hydrogenphosphate 0.90 g, Ammonium Nitrate1.00 g, Potassiumchloride 0.15 g, Glucose 3.00 g, Penta chloro nitrobenzene0.20 g, Rose Bengal 0.20 g, Chlorothallonil 0.20 g and Agaragar 20 g) and Waksman‘s Agar Medium (Glucose 10 g,Peptone 5 g, Potassium dihydrogen phosphate 1 g,Magnesium sulphate 0.5 g and Agar agar 26 g).Threereplications were maintained for each media. Colonydiameter was measured ten day after inoculation. Thedifferent colony characters were recorded in each mediumby visual observation.
Influence of Abiotic Factors on the Growth of PathogenEffect of pH on the growth of C. musae: The effect of pHon the growth of the pathogen was studied as per themethod followed by Kiryu [28] using PDA medium. Banana fruits showing typical symptoms ofDifferent pHlevels viz., 4.0, 4.5, 5.0, 5.5, 6.0, 6.5, 7.0 and 7.5 anthracnose were collected during the survey fromwere used. The pH levels of the medium were adjusted in different banana growing areas of Tamil Nadu. Thea digital pH meter using 0.1 N Hydrochloric acid and 0.1 N cultures of 16 isolates of C. musae were isolated andSodium hydroxide. The media with different pH levels purified. The isolates were maintained on PDA slants forwere sterilized, cooled and poured in the sterilized Petri further studies.plates in 20 ml quantities and allowed to solidify. Theeight mm disc of pathogen was placed on the centre of the Identification of the Pathogen: Pathogen associated withPetri plates. The plates were incubated at room anthracnose disease was isolated on PDA medium and ittemperature (28 ± 2°C) for ten days. The diameter of the was identified as C. musae (Berk. and Curt.) Arx based onmycelial growth was recorded. Three replications were the morphological and cultural characteristics of themaintained for each treatment. fungus.
The effect of light on the growth of pathogen was studiedby exposing the inoculated culture to alternate cycles of24 h light, 24 h dark and 12 h light and 12 h dark in anenvironment chamber maintained at room temperature(28 ± 2°C). Mycelial disc of eight mm was used toinoculate Petri plates. Three replications were maintainedfor each treatment. Inoculated plates were kept inenvironment chamber and light intensity was adjusted torequired level. The mycelial growth was recorded onseventh day after inoculation.
Growth Phase Study: The growth phase study wasconducted on potato dextrose broth (PDB). Thirty ml ofbroth was pipetted out into each 100 ml flasks. The flaskscontaining potato dextrose broth were then sterilized at121°C for 20 min. at 15 lb pressure and then inoculatedwith 8 mm disc of pathogen. The inoculated flasks wereincubated at 28 ± 2°C. A set of three flasks were harvestedstarting from first day up to 16 day.th
The culture filtrate was filtered through WhatmanNo.4 filter paper. Before filtering, filter paper was dried toa constant weight in hot air oven at 50°C. The weight ofdry mycelial mat was recorded.
RESULTS
World J. Agric. Sci., 7 (6): 743-754, 2011
746
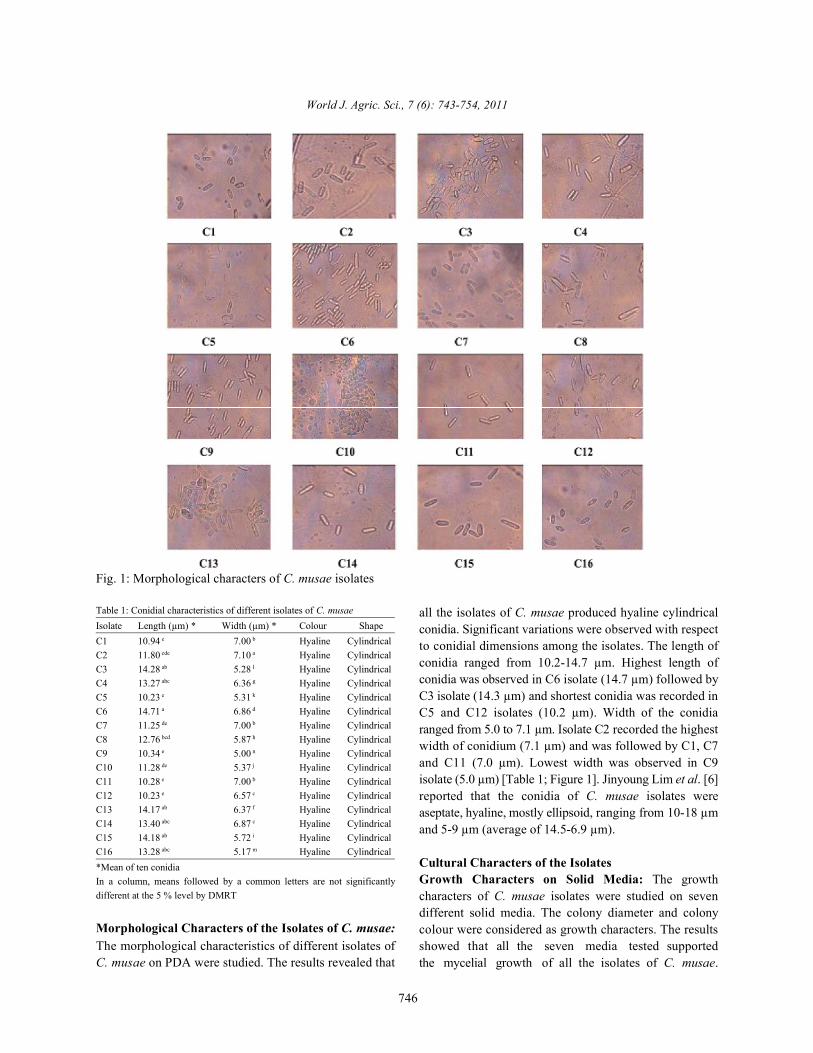
Fig. 1: Morphological characters of C. musae isolates
Table 1: Conidial characteristics of different isolates of C. musaeIsolate Length (µm) * Width (µm) * Colour ShapeC1 10.94 7.00 Hyaline Cylindrical e b
C2 11.80 7.10 Hyaline Cylindrical cde a
C3 14.28 5.28 Hyaline Cylindrical ab l
C4 13.27 6.36 Hyaline Cylindrical abc g
C5 10.23 5.31 Hyaline Cylindrical e k
C6 14.71 6.86 Hyaline Cylindrical a d
C7 11.25 7.00 Hyaline Cylindrical de b
C8 12.76 5.87 Hyaline Cylindrical bcd h
C9 10.34 5.00 Hyaline Cylindrical e n
C10 11.28 5.37 Hyaline Cylindrical de j
C11 10.28 7.00 Hyaline Cylindrical e b
C12 10.23 6.57 Hyaline Cylindrical e c
C13 14.17 6.37 Hyaline Cylindrical ab f
C14 13.40 6.87 Hyaline Cylindrical abc c
C15 14.18 5.72 Hyaline Cylindrical ab i
C16 13.28 5.17 Hyaline Cylindrical abc m
*Mean of ten conidiaIn a column, means followed by a common letters are not significantlydifferent at the 5 % level by DMRT
Morphological Characters of the Isolates of C. musae:The morphological characteristics of different isolates ofC. musae on PDA were studied. The results revealed that
all the isolates of C. musae produced hyaline cylindricalconidia. Significant variations were observed with respectto conidial dimensions among the isolates. The length ofconidia ranged from 10.2-14.7 µm. Highest length ofconidia was observed in C6 isolate (14.7 µm) followed byC3 isolate (14.3 µm) and shortest conidia was recorded inC5 and C12 isolates (10.2 µm). Width of the conidiaranged from 5.0 to 7.1 µm. Isolate C2 recorded the highestwidth of conidium (7.1 µm) and was followed by C1, C7and C11 (7.0 µm). Lowest width was observed in C9isolate (5.0 µm) [Table 1; Figure 1]. Jinyoung Lim et al. [6]reported that the conidia of C. musae isolates wereaseptate, hyaline, mostly ellipsoid, ranging from 10-18 µmand 5-9 µm (average of 14.5-6.9 µm).
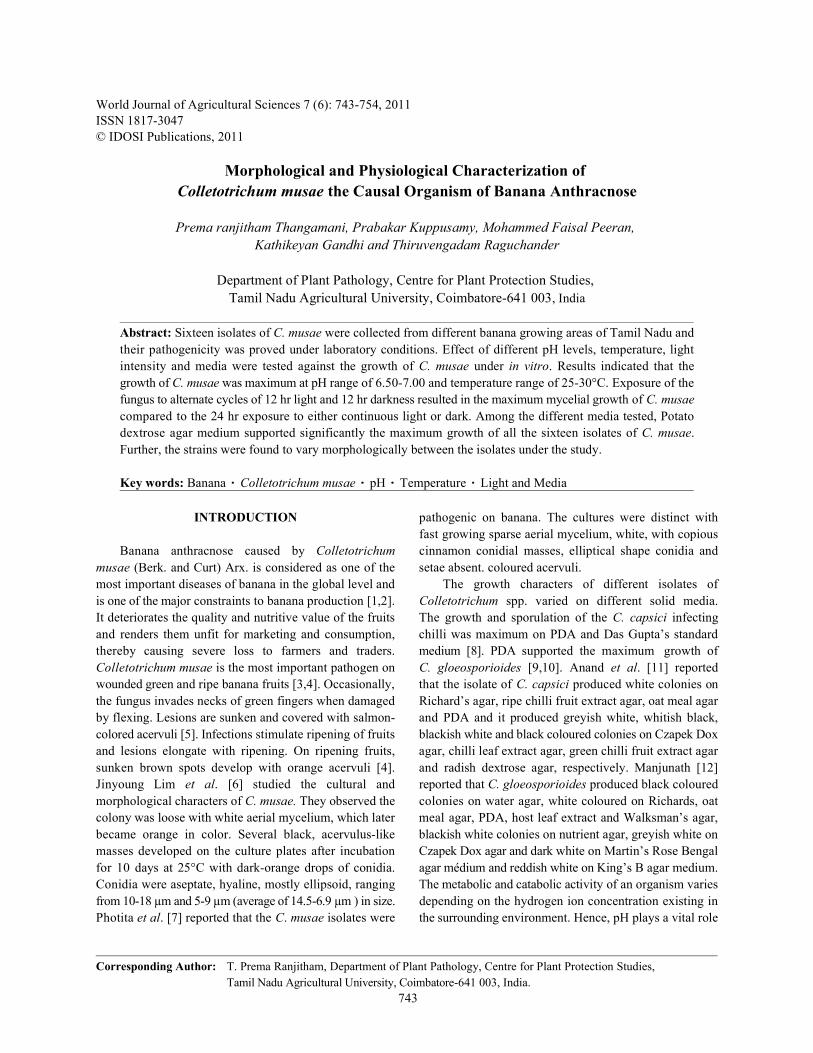
Cultural Characters of the IsolatesGrowth Characters on Solid Media: The growthcharacters of C. musae isolates were studied on sevendifferent solid media. The colony diameter and colonycolour were considered as growth characters. The resultsshowed that all the seven media tested supportedthe mycelial growth of all the isolates of C. musae.
World J. Agric. Sci., 7 (6): 743-754, 2011
747
Table 2: Effect of different solid media on the growth of C. musae isolates
Mycelial diameter (mm)--------------------------------------------------------------------------------------------------------------------------------------------------------------------------------
Isolate Water agar Oat meal agar Richards agar PDA MRB Czapek Dox agar Walksman’s agar
C1 8.80 80.00 88.05 89.00 40.00 65.55 79.00 ef k a c e m g
C2 10.00 83.00 84.10 89.61 49.00 70.05 78.80 b d b a bc d d
C3 10.50 82.00 74.90 89.10 42.00 65.50 76.02 a f cef b cde n n
C4 8.50 81.45 82.25 89.00 44.00 66.00 76.12 ghi h b c bcde l m
C5 8.31 81.62 76.60 89.00 42.95 69.93 81.05 ij g fg c bcde e c
C6 8.75 81.00 81.14 81.06 43.00 66.61 76.20 hij i cd n bcde i l
C7 9.14 81.51 81.17 86.03 44.99 67.35 79.30 cd h fg m bcde h f
C8 8.70 78.95 76.30 86.40 43.41 69.24 81.80 fg n ef k bcde g b
C9 9.35 83.24 78.34 88.47 48.75 70.51 79.42 c c de e ab o e
C10 9.00 79.64 79.25 87.25 41.73 62.47 78.62 de l cde i de c h
C11 9.24 83.25 80.21 86.25 41.14 61.06 78.10 cd b g l de p j
C12 8.54 85.20 75.24 87.54 42.17 66.03 77.02 ghi a cde g cde k k
C13 8.65 79.54 80.64 88.75 46.30 66.40 75.12 fgh m cde d bcde j o
C14 8.41 82.55 80.25 87.34 48.34 71.47 83.05 hij e cde h bcd b a
C15 8.23 80.20 79.95 88.23 50.00 72.25 76.20 j j cde f b a m
C16 9.14 83.25 81.75 86.55 42.24 69.25 78.23 cd c bc j cde f i
Mean 8.95 81.65 80.00 87.47 44.37 67.47 78.37
* Mean of three replicationsIn a column, means followed by a common letters are not significantly different at the 5 % level by DMRT
Table 3: Cultural characteristics of C. musae isolates on different solid media
Colony colour----------------------------------------------------------------------------------------------------------------------------------------------------------------------------------------
Isolate Water agar Oat meal agar Richards agar PDA MRB Czapek Dox agar Walksman’s agar
C1 White Blackish white Blackish white Blackish white Reddish white Blackish white Blackish whiteC2 Pink Pink Pink Pink Reddish slight pink Pink PinkC3 White Blackish white Blackish white Blackish white Reddish white Blackish white Blackish whiteC4 Orange Orange Orange Orange Reddish orange Orange OrangeC5 Pink Pink Pink Pink Reddish slight pink Pink PinkC6 Pink Pink Pink Pink Reddish slight pink Pink PinkC7 Orange Orange Orange Orange Reddish orange Orange OrangeC8 White Blackish white Blackish white Blackish white Reddish white Blackish white Blackish whiteC9 Pink Pink Pink Pink Reddish slight pink Pink PinkC10 Pink Pink Pink Pink Reddish slight pink Pink PinkC11 Pink Pink Pink Pink Reddish slight pink Pink PinkC12 Pink Pink Pink Pink Reddish slight pink Pink PinkC13 White Blackish white Blackish white Blackish white Reddish white Blackish white Blackish whiteC14 Pink Pink Pink Pink Reddish slight pink Pink PinkC15 Pink Pink Pink Pink Reddish slight pink Pink PinkC16 Pink Pink Pink Pink Reddish slight pink Pink Pink
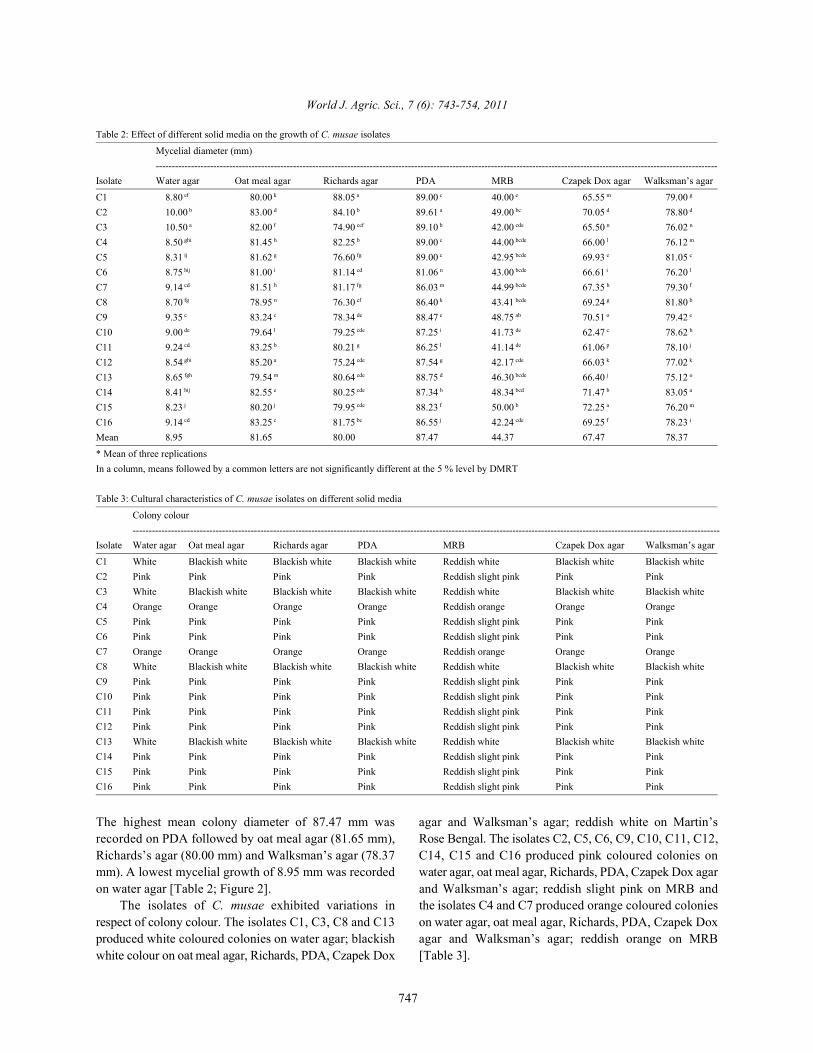
The highest mean colony diameter of 87.47 mm was agar and Walksman’s agar; reddish white on Martin’srecorded on PDA followed by oat meal agar (81.65 mm), Rose Bengal. The isolates C2, C5, C6, C9, C10, C11, C12,Richards’s agar (80.00 mm) and Walksman’s agar (78.37 C14, C15 and C16 produced pink coloured colonies onmm). A lowest mycelial growth of 8.95 mm was recorded water agar, oat meal agar, Richards, PDA, Czapek Dox agaron water agar [Table 2; Figure 2]. and Walksman’s agar; reddish slight pink on MRB and
The isolates of C. musae exhibited variations in the isolates C4 and C7 produced orange coloured coloniesrespect of colony colour. The isolates C1, C3, C8 and C13 on water agar, oat meal agar, Richards, PDA, Czapek Doxproduced white coloured colonies on water agar; blackish agar and Walksman’s agar; reddish orange on MRBwhite colour on oat meal agar, Richards, PDA, Czapek Dox [Table 3].
World J. Agric. Sci., 7 (6): 743-754, 2011
748
Fig. 2: Effect of different media on growth of C. musae produced the black colour, while C2, C5, C6, C9, C10, C11,
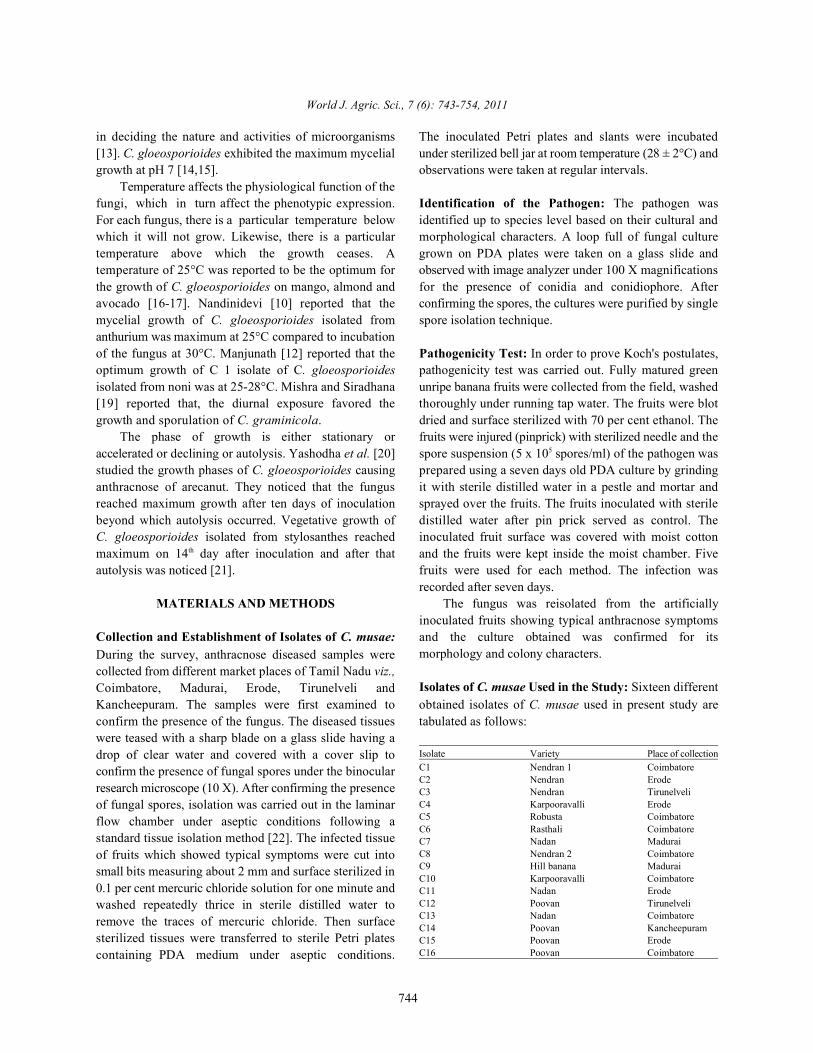
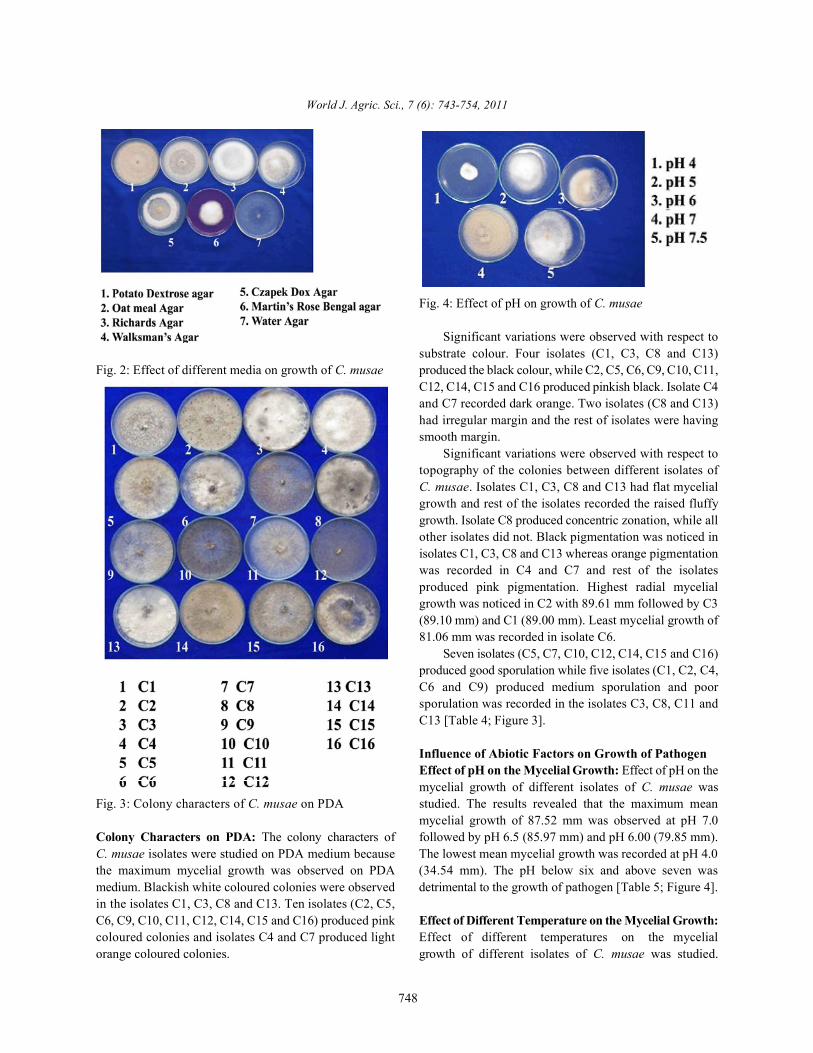
Fig. 3: Colony characters of C. musae on PDA studied. The results revealed that the maximum mean
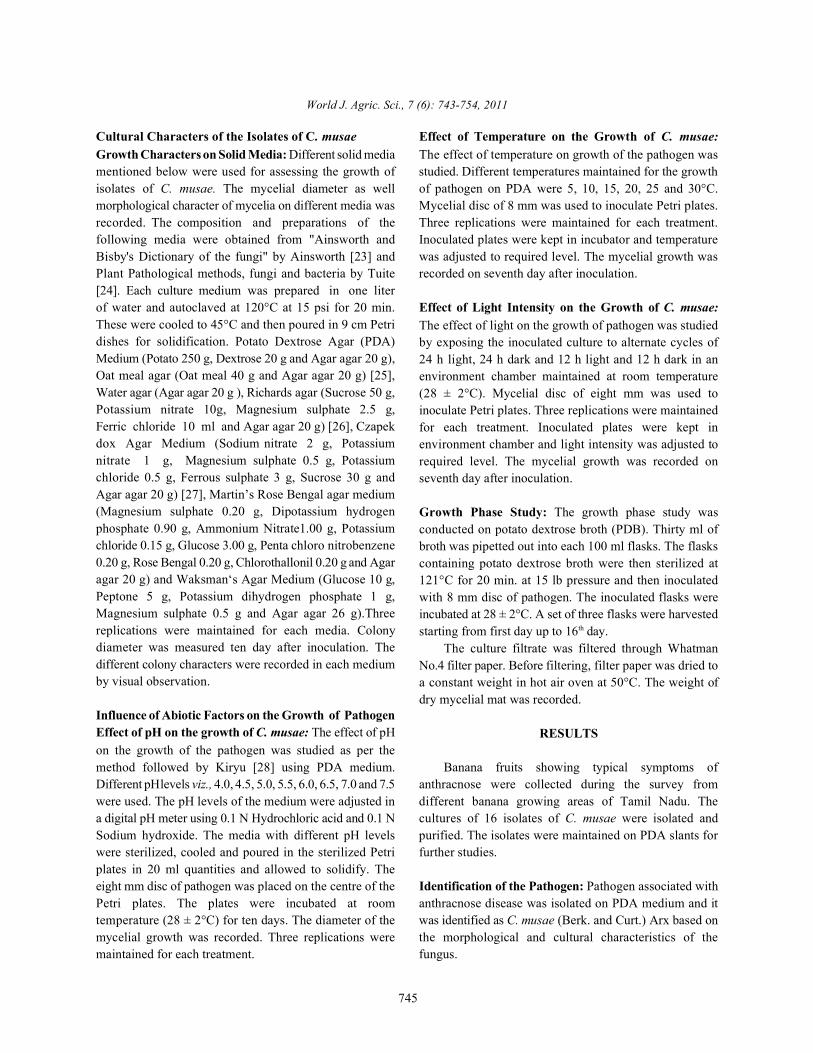
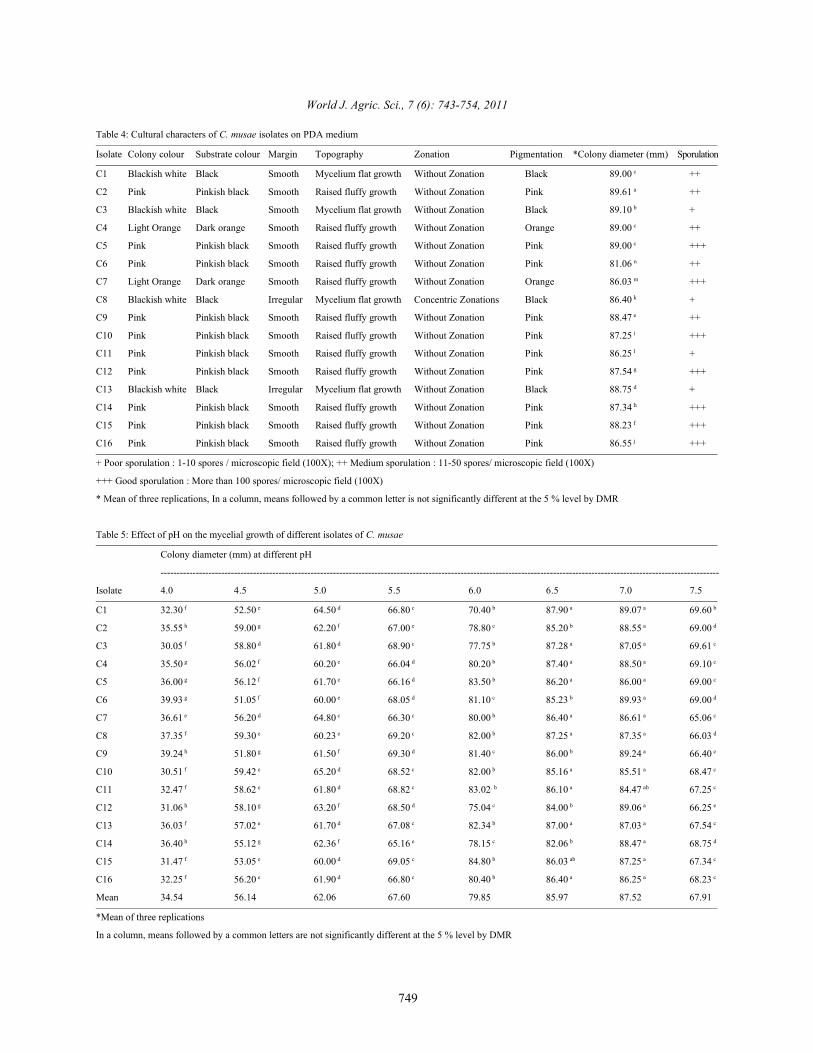
Colony Characters on PDA: The colony characters of followed by pH 6.5 (85.97 mm) and pH 6.00 (79.85 mm).C. musae isolates were studied on PDA medium because The lowest mean mycelial growth was recorded at pH 4.0the maximum mycelial growth was observed on PDA (34.54 mm). The pH below six and above seven wasmedium. Blackish white coloured colonies were observed detrimental to the growth of pathogen [Table 5; Figure 4].in the isolates C1, C3, C8 and C13. Ten isolates (C2, C5,C6, C9, C10, C11, C12, C14, C15 and C16) produced pink Effect of Different Temperature on the Mycelial Growth:coloured colonies and isolates C4 and C7 produced light Effect of different temperatures on the mycelialorange coloured colonies. growth of different isolates of C. musae was studied.
Fig. 4: Effect of pH on growth of C. musae
Significant variations were observed with respect tosubstrate colour. Four isolates (C1, C3, C8 and C13)
C12, C14, C15 and C16 produced pinkish black. Isolate C4and C7 recorded dark orange. Two isolates (C8 and C13)had irregular margin and the rest of isolates were havingsmooth margin.
Significant variations were observed with respect totopography of the colonies between different isolates ofC. musae. Isolates C1, C3, C8 and C13 had flat mycelialgrowth and rest of the isolates recorded the raised fluffygrowth. Isolate C8 produced concentric zonation, while allother isolates did not. Black pigmentation was noticed inisolates C1, C3, C8 and C13 whereas orange pigmentationwas recorded in C4 and C7 and rest of the isolatesproduced pink pigmentation. Highest radial mycelialgrowth was noticed in C2 with 89.61 mm followed by C3(89.10 mm) and C1 (89.00 mm). Least mycelial growth of81.06 mm was recorded in isolate C6.
Seven isolates (C5, C7, C10, C12, C14, C15 and C16)produced good sporulation while five isolates (C1, C2, C4,C6 and C9) produced medium sporulation and poorsporulation was recorded in the isolates C3, C8, C11 andC13 [Table 4; Figure 3].
Influence of Abiotic Factors on Growth of PathogenEffect of pH on the Mycelial Growth: Effect of pH on themycelial growth of different isolates of C. musae was
mycelial growth of 87.52 mm was observed at pH 7.0
World J. Agric. Sci., 7 (6): 743-754, 2011
749
Table 4: Cultural characters of C. musae isolates on PDA medium
Isolate Colony colour Substrate colour Margin Topography Zonation Pigmentation *Colony diameter (mm) Sporulation
C1 Blackish white Black Smooth Mycelium flat growth Without Zonation Black 89.00 ++ c
C2 Pink Pinkish black Smooth Raised fluffy growth Without Zonation Pink 89.61 ++ a
C3 Blackish white Black Smooth Mycelium flat growth Without Zonation Black 89.10 + b
C4 Light Orange Dark orange Smooth Raised fluffy growth Without Zonation Orange 89.00 ++ c
C5 Pink Pinkish black Smooth Raised fluffy growth Without Zonation Pink 89.00 +++ c
C6 Pink Pinkish black Smooth Raised fluffy growth Without Zonation Pink 81.06 ++ n
C7 Light Orange Dark orange Smooth Raised fluffy growth Without Zonation Orange 86.03 +++ m
C8 Blackish white Black Irregular Mycelium flat growth Concentric Zonations Black 86.40 + k
C9 Pink Pinkish black Smooth Raised fluffy growth Without Zonation Pink 88.47 ++ e
C10 Pink Pinkish black Smooth Raised fluffy growth Without Zonation Pink 87.25 +++ i
C11 Pink Pinkish black Smooth Raised fluffy growth Without Zonation Pink 86.25 + l
C12 Pink Pinkish black Smooth Raised fluffy growth Without Zonation Pink 87.54 +++ g
C13 Blackish white Black Irregular Mycelium flat growth Without Zonation Black 88.75 + d
C14 Pink Pinkish black Smooth Raised fluffy growth Without Zonation Pink 87.34 +++ h
C15 Pink Pinkish black Smooth Raised fluffy growth Without Zonation Pink 88.23 +++ f
C16 Pink Pinkish black Smooth Raised fluffy growth Without Zonation Pink 86.55 +++ j
+ Poor sporulation : 1-10 spores / microscopic field (100X); ++ Medium sporulation : 11-50 spores/ microscopic field (100X)
+++ Good sporulation : More than 100 spores/ microscopic field (100X)
* Mean of three replications, In a column, means followed by a common letter is not significantly different at the 5 % level by DMR
Table 5: Effect of pH on the mycelial growth of different isolates of C. musae
Colony diameter (mm) at different pH
-------------------------------------------------------------------------------------------------------------------------------------------------------------------------------
Isolate 4.0 4.5 5.0 5.5 6.0 6.5 7.0 7.5
C1 32.30 52.50 64.50 66.80 70.40 87.90 89.07 69.60 f e d c b a a b
C2 35.55 59.00 62.20 67.00 78.80 85.20 88.55 69.00 h g f e c b a d
C3 30.05 58.80 61.80 68.90 77.75 87.28 87.05 69.61 f d d c b a a c
C4 35.50 56.02 60.20 66.04 80.20 87.40 88.50 69.10 g f e d b a a c
C5 36.00 56.12 61.70 66.16 83.50 86.20 86.00 69.00 g f e d b a a c
C6 39.93 51.05 60.00 68.05 81.10 85.23 89.93 69.00 g f e d c b a d
C7 36.61 56.20 64.80 66.30 80.00 86.40 86.61 65.06 e d c c b a a c
C8 37.35 59.30 60.23 69.20 82.00 87.25 87.35 66.03 f e e c b a a d
C9 39.24 51.80 61.50 69.30 81.40 86.00 89.24 66.40 h g f d c b a e
C10 30.51 59.42 65.20 68.52 82.00 85.16 85.51 68.47 f e d c b a a c
C11 32.47 58.62 61.80 68.82 83.02 86.10 84.47 67.25 f e d c . b a ab c
C12 31.06 58.10 63.20 68.50 75.04 84.00 89.06 66.25 h g f d c b a e
C13 36.03 57.02 61.70 67.08 82.34 87.00 87.03 67.54 f e d c b a a c
C14 36.40 55.12 62.36 65.16 78.15 82.06 88.47 68.75 h g f e c b a d
C15 31.47 53.05 60.00 69.05 84.80 86.03 87.25 67.34 f e d c b ab a c
C16 32.25 56.20 61.90 66.80 80.40 86.40 86.25 68.23 f e d c b a a c
Mean 34.54 56.14 62.06 67.60 79.85 85.97 87.52 67.91
*Mean of three replications
In a column, means followed by a common letters are not significantly different at the 5 % level by DMR
World J. Agric. Sci., 7 (6): 743-754, 2011
750
Table 6: Effect of different temperatures on the mycelial growth of C. musae isolates
Colony diameter (mm) at different temperature*
----------------------------------------------------------------------------------------------------------------------------------------------------------------------------
Isolate 5 °C 10 °C 15 °C 20 °C 25 °C 30 °C 35 °C
C1 25.00 42.25 53.50 72.25 90.00 90.00 43.50 e d c b a a d
C2 23.50 41.00 54.50 68.25 89.25 89.00 46.00 f e c b a a d
C3 24.45 46.75 62.00 72.50 88.25 90.00 43.54 g e d c b a f
C4 22.00 46.80 60.00 78.80 88.00 89.24 46.00 e d c b a a d
C5 21.65 43.25 60.25 68.35 89.00 89.50 42.35 e d c b a a d
C6 22.65 42.75 61.00 72.50 87.65 89.24 46.58 g f d c b a e
C7 22.60 49.00 61.30 78.30 90.00 90.00 47.45 f d c b a a e
C8 19.85 44.31 59.30 69.65 87.50 90.00 42.00 g e d c b a f
C9 20.00 46.00 57.80 76.80 87.34 89.34 48.00 g f d c b a e
C10 22.00 46.35 50.00 70.00 87.30 89.00 46.15 e d c b a a d
C11 24.25 42.50 54.41 75.80 85.00 89.00 48.00 g f d c b a e
C12 22.75 43.45 51.73 70.00 85.25 89.75 47.90 g f d c b a e
C13 27.00 41.00 50.50 64.41 88.37 90.00 46.75 f e c b a a d
C14 27.31 41.65 53.25 61.73 84.00 88.75 48.90 g f d c b a e
C15 25.00 42.65 58.20 70.50 87.25 87.75 47.50 f e c b a a d
C16 26.35 42.60 53.00 63.25 89.00 90.00 49.00 f e c b a a d
Mean 23.52 43.89 56.29 70.81 87.69 89.41 46.22
*Mean of three replications
In a row, means followed by a common letter is not significantly different at the 5 % level by DMRT
Fig. 5: Effect of different temperature on growth of isolates grew well when they were exposed with alternateC. musae cycles of 12 h dark and 12 h light with mean mycelial
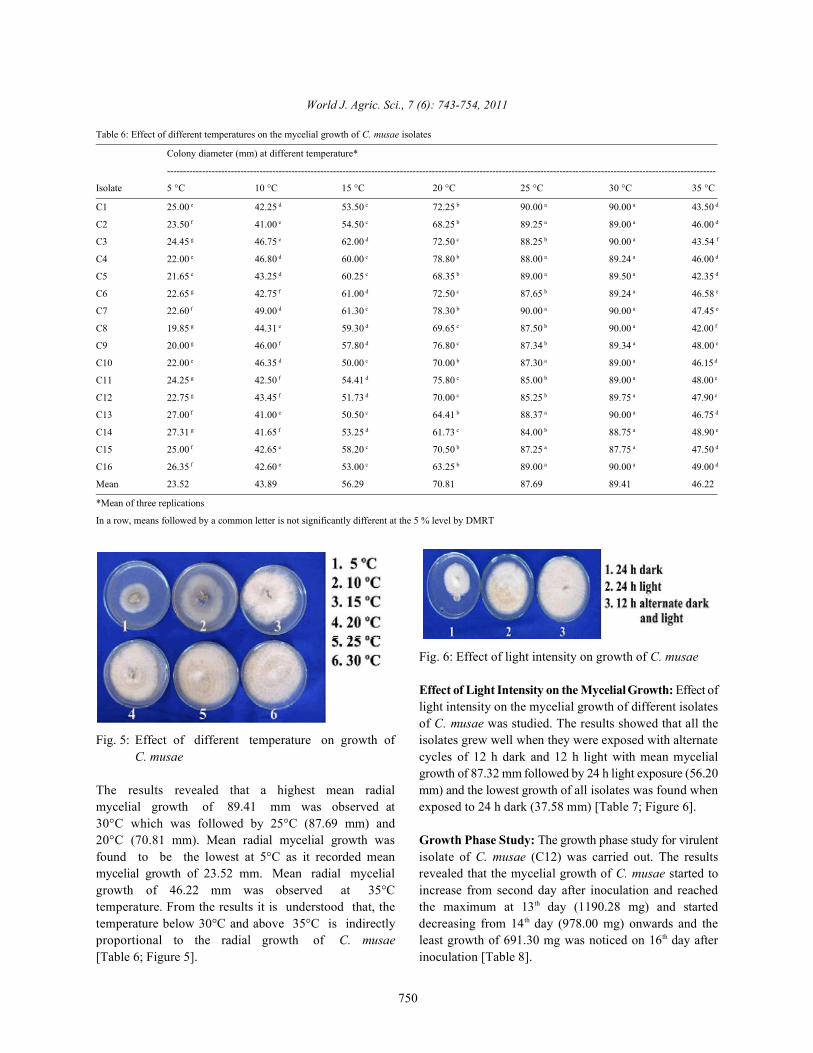
The results revealed that a highest mean radial mm) and the lowest growth of all isolates was found whenmycelial growth of 89.41 mm was observed at exposed to 24 h dark (37.58 mm) [Table 7; Figure 6].30°C which was followed by 25°C (87.69 mm) and20°C (70.81 mm). Mean radial mycelial growth was Growth Phase Study: The growth phase study for virulentfound to be the lowest at 5°C as it recorded mean isolate of C. musae (C12) was carried out. The resultsmycelial growth of 23.52 mm. Mean radial mycelial revealed that the mycelial growth of C. musae started togrowth of 46.22 mm was observed at 35°C increase from second day after inoculation and reachedtemperature. From the results it is understood that, the the maximum at 13 day (1190.28 mg) and startedtemperature below 30°C and above 35°C is indirectly decreasing from 14 day (978.00 mg) onwards and theproportional to the radial growth of C. musae least growth of 691.30 mg was noticed on 16 day after[Table 6; Figure 5]. inoculation [Table 8].
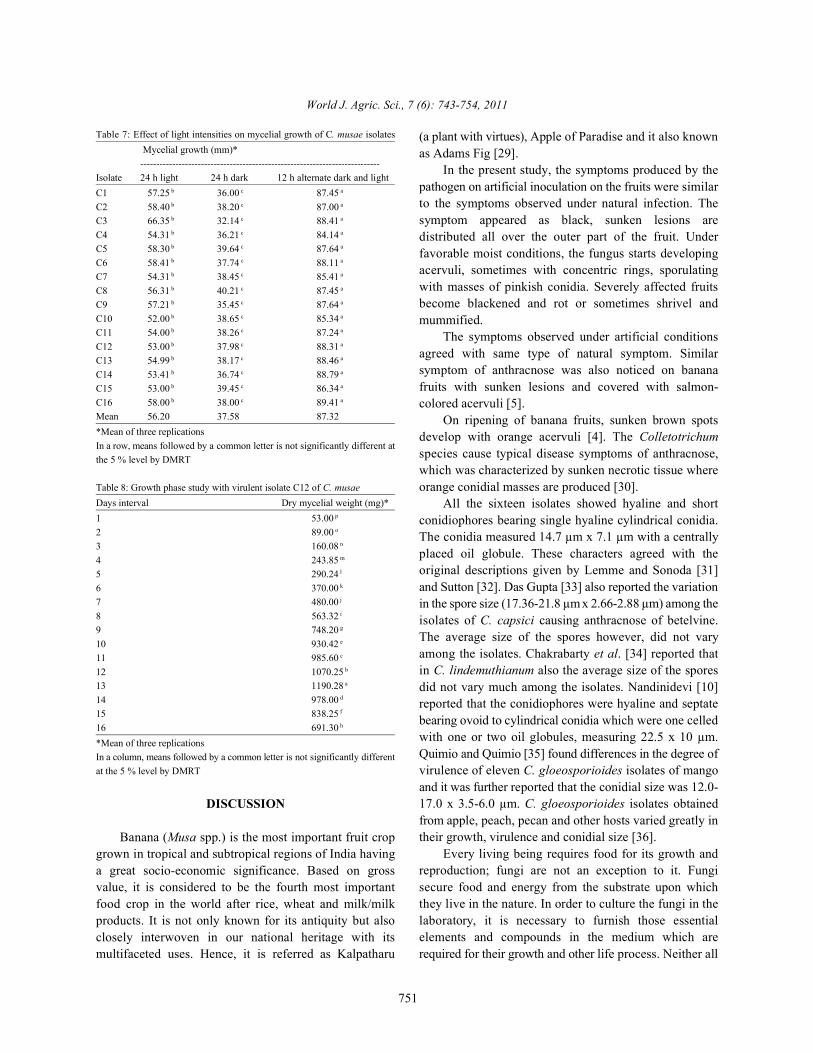
Fig. 6: Effect of light intensity on growth of C. musae
Effect of Light Intensity on the Mycelial Growth: Effect oflight intensity on the mycelial growth of different isolatesof C. musae was studied. The results showed that all the
growth of 87.32 mm followed by 24 h light exposure (56.20
th
th
th
World J. Agric. Sci., 7 (6): 743-754, 2011
751
Table 7: Effect of light intensities on mycelial growth of C. musae isolates Mycelial growth (mm)*---------------------------------------------------------------------------
Isolate 24 h light 24 h dark 12 h alternate dark and lightC1 57.25 36.00 87.45 b c a
C2 58.40 38.20 87.00 b c a
C3 66.35 32.14 88.41 b c a
C4 54.31 36.21 84.14 b c a
C5 58.30 39.64 87.64 b c a
C6 58.41 37.74 88.11 b c a
C7 54.31 38.45 85.41 b c a
C8 56.31 40.21 87.45 b c a
C9 57.21 35.45 87.64 b c a
C10 52.00 38.65 85.34 b c a
C11 54.00 38.26 87.24 b c a
C12 53.00 37.98 88.31 b c a
C13 54.99 38.17 88.46 b c a
C14 53.41 36.74 88.79 b c a
C15 53.00 39.45 86.34 b c a
C16 58.00 38.00 89.41 b c a
Mean 56.20 37.58 87.32*Mean of three replicationsIn a row, means followed by a common letter is not significantly different atthe 5 % level by DMRT
Table 8: Growth phase study with virulent isolate C12 of C. musaeDays interval Dry mycelial weight (mg)*1 53.00 p
2 89.00 o
3 160.08 n
4 243.85 m
5 290.24 l
6 370.00 k
7 480.00 j
8 563.32 i
9 748.20 g
10 930.42 e
11 985.60 c
12 1070.25 b
13 1190.28 a
14 978.00 d
15 838.25 f
16 691.30 h
*Mean of three replicationsIn a column, means followed by a common letter is not significantly differentat the 5 % level by DMRT
DISCUSSION
Banana (Musa spp.) is the most important fruit cropgrown in tropical and subtropical regions of India havinga great socio-economic significance. Based on grossvalue, it is considered to be the fourth most importantfood crop in the world after rice, wheat and milk/milkproducts. It is not only known for its antiquity but alsoclosely interwoven in our national heritage with itsmultifaceted uses. Hence, it is referred as Kalpatharu
(a plant with virtues), Apple of Paradise and it also knownas Adams Fig [29].
In the present study, the symptoms produced by thepathogen on artificial inoculation on the fruits were similarto the symptoms observed under natural infection. Thesymptom appeared as black, sunken lesions aredistributed all over the outer part of the fruit. Underfavorable moist conditions, the fungus starts developingacervuli, sometimes with concentric rings, sporulatingwith masses of pinkish conidia. Severely affected fruitsbecome blackened and rot or sometimes shrivel andmummified.
The symptoms observed under artificial conditionsagreed with same type of natural symptom. Similarsymptom of anthracnose was also noticed on bananafruits with sunken lesions and covered with salmon-colored acervuli [5].
On ripening of banana fruits, sunken brown spotsdevelop with orange acervuli [4]. The Colletotrichumspecies cause typical disease symptoms of anthracnose,which was characterized by sunken necrotic tissue whereorange conidial masses are produced [30].
All the sixteen isolates showed hyaline and shortconidiophores bearing single hyaline cylindrical conidia.The conidia measured 14.7 µm x 7.1 µm with a centrallyplaced oil globule. These characters agreed with theoriginal descriptions given by Lemme and Sonoda [31]and Sutton [32]. Das Gupta [33] also reported the variationin the spore size (17.36-21.8 µm x 2.66-2.88 µm) among theisolates of C. capsici causing anthracnose of betelvine.The average size of the spores however, did not varyamong the isolates. Chakrabarty et al. [34] reported thatin C. lindemuthianum also the average size of the sporesdid not vary much among the isolates. Nandinidevi [10]reported that the conidiophores were hyaline and septatebearing ovoid to cylindrical conidia which were one celledwith one or two oil globules, measuring 22.5 x 10 µm.Quimio and Quimio [35] found differences in the degree ofvirulence of eleven C. gloeosporioides isolates of mangoand it was further reported that the conidial size was 12.0-17.0 x 3.5-6.0 µm. C. gloeosporioides isolates obtainedfrom apple, peach, pecan and other hosts varied greatly intheir growth, virulence and conidial size [36].
Every living being requires food for its growth andreproduction; fungi are not an exception to it. Fungisecure food and energy from the substrate upon whichthey live in the nature. In order to culture the fungi in thelaboratory, it is necessary to furnish those essentialelements and compounds in the medium which arerequired for their growth and other life process. Neither all
World J. Agric. Sci., 7 (6): 743-754, 2011
752
media are equally good for all fungi nor there can be a sporulation, pigmentation, margin and topography. Similaruniversal substrate or artificial medium on which all fungi observations were made by Denobys and Baudry [39],can grow well. So different media were tried for the growth Kuramae et al. [40] and Manjunath [12].of C. musae. Literature is with full of conflicting reports Fungi generally utilize substrates in the form ofregarding the superiority of one medium over the other for solution only if the reaction of solution is conducive tothe growth and sporulation of C. musae. In the present fungal growth and metabolism. This brings importance ofstudy, PDA followed by Oat meal agar medium supported hydrogen ion concentration for better fungal growth. Inthe maximum growth of C. musae. This was in conformity the present study, maximum mycelial growth waswith the findings of Nandinidevi [10] where in among the observed at pH 7 which is in agreement with the results ofseven media tested, PDA recorded the maximum mean Nandinidevi [10] and she reported maximum growth of C.colony diameter followed by anthurium leaf extract and gloeosporioides was at pH 7 followed by pH 6. However,corn meal agar. The present findings is in similarity with this is similar to the work of Gina [41] who identified pH 7the report by Amarjit singh et al. [9] who observed the as the optimum for the mycelial growth. At reduced pH,maximum growth of C. gloeosporioides of Guava on PDA cell membrane becomes saturated with the hydrogen ionsmedium. Likewise, Jeyalakshmi and Seetharaman [37] and which limit the passage of cations. The reverse could bePatil and Moniz [8] reported that PDA was the best suited obtained when medium are alkaline and accumulatedone for the growth and sporulation of C. capsici. But the hydroxyl ions preventing the passage of essential anions.maximum growth of C. capsici was observed in Richard’s In addition, the enzyme activity is also conditioned bybroth followed by potato dextrose broth [38]. reaction of the medium, as a result the reduced growth of
In this study, the isolates C1, C3, C8 and C13 both fungi is observed at both the extremities [42].produced white coloured colonies on water agar; blackish Temperature is most important physicalwhite colour on oat meal agar, Richards, PDA, Czapek Dox environmental factor for regulating the growth andagar and Walksman’s agar; reddish white on Martin’s reproduction of fungi. The present study revealed thatRose Bengal. The isolates C2, C5, C6, C9, C10, C11, C12, good growth of fungus was observed at 25-30°C.C14, C15 and C16 produced pink coloured colonies on Nandinidevi [10] reported maximum growth of C.water agar, oat meal agar, Richards, PDA, Czapek Dox agar gloeosporioides at 25°C followed by 30°C. Theand Walksman’s agar; reddish slight pink colour on MRB temperature of 25°C was reported to be the optimum forand the isolates C4 and C7 produced orange coloured the growth of C. gloeosporioides on mango, almond andcolonies on water agar, oat meal agar, Richards, PDA, avocado [16-18]. Prabakar [43] reported that the mycelialCzapek Dox agar and Walksman’s agar; reddish orange on growth was maximum at 25°C followed by 30°C andMRB. Similar results were obtained by Manjunath [12], temperature below 20°C and above 35°C were inhibitorythe isolate C1 of C. gloeosporioides produced black to the growth. These reports supported the results of thecoloured colonies on water agar, white colour on present study. Richards, oat meal agar, PDA, host leaf extract and Light has profound effect on the mycelial growth ofWalksman’s agar, blackish white colonies on nutrient C. musae. Preliminary studies conducted in the presentagar, greyish white on Czapek Dox agar and dark white on study revealed that maximum mycelial growth wasMRB and reddish white on King’s B agar. This is in observed when it was exposed to alternate cycles of lightagreement with the results of Anand [38], where in he and darkness. This was followed by continuous light andnoticed variation in C. capsici colony of different isolates continuous darkness. This result agreed with findings ofon PDA. The present investigation revealed that the Kamanna [44] where in he found that alternate cycle of 12colony characters and growth of C. musae varied on h light and 12 h dark yielded maximum growth of C.different media. This might be due to the variation in the gloeosporioides when compared to the continuousnutritional requirement of the fungus. There was a wide exposure of light or dark. Similar results were recorded byvariation in the colony characters viz., colour, Alexander et al. [45] in C. gloeosporioides.topography, pigmentation, zonation, sporulation and Determination of optimum growth period is essentialmycelial growth of different isolates even in the same to study the physiology of fungi. Maximum dry mycelialmedia. In the present study, isolates were characterized by weight was recorded on nineth day after inoculation onblackish white, light pink and dark orange coloured potato dextrose broth. Afterwards growth of myceliumcolonies. Isolates with smooth and irregular margins were was declined with increase in the number of days ofrecorded. All the isolates varied with respect to incubation. This may be due to the autolysis of the
World J. Agric. Sci., 7 (6): 743-754, 2011
753
fungus and exhaustion of nutrients in the medium as 10. Nandinidevi, S., 2008. Studies on the foliar diseasesopined by Lilly and Barnett [46] who also pointed out, thegrowth of fungi follow a definite pattern which dependson species, environment and nutrition. Mycelial growthstarted to increased from second day after inoculation andreached maximum at 13 day after inoculation andth
thereafter growth started to decline. Similar results werealso observed by Sudhakar [21], who reported thatvegetative growth of C. gloeosporioides isolated fromstylosanthes reached maximum on 14 day afterth
inoculation and after that autolysis was noticed.Yashodha et al. [20] reported that the maximum growth ofC. gloeosporioides, causing anthracnose of arecanut onten days after inoculation.
REFERENCES
1. Wardlaw, C.W., 1961. Banana disease includingplantains and abaca. (Ed. Longman) William clownsand Sons limited, London, pp: 38.
2. Jeffries, P., J.C. Dodd, M.J. Jeger andR.A. Plumbley, 1990. The biology and control ofColletotrichum species on tropical fruit crops. Jounalof Plant Pathology, 39: 343-366.
3. Meredith, D.S., 1971. Transport and storage diseasesof bananas: Biology and control of Tropical.Agriculture (Trinidad), 48(1): 35-50.
4. Stover, R.H. and N.W. Simmonds, 1987. Diseases anddisorders. In: Bananas, Longman, pp: 281-323.
5. Sutton, B.C. and J.M. Waterston, 1970.Colletotrichum musae. CMI Description ofpathogenic fungi and bacteria. CMI. No., pp: 222.
6. Jinyoung Lim., Lim, T.H and B. Cha, 2002.Isolation and Identification of Colletotrichum musaefrom Imported Bananas. Department of AgriculturalBiology, Chungbuk National University, Cheongju,Korea, pp: 361-363.
7. Photita, W., P.W. Taylor, R. Ford, K.D. Hyde andS. Lumyong, 2005. Morphological and molecularcharacterization of Colletotrichum species fromherbaceous plants in Thailand. Fungal Diversity,18: 117-133.
8. Patil, B.K. and L. Moniz, 1973. Growth andsporulation of Colletotrichum capsici on differentculture media. Research Journal of Mahatma PhuleAgricultural University, 4: 62-66.
9. Amarjit singh, Verma, K.S. and Chander Mohan, 2006.Effect of different culture media on the growth andsporulation of Colletotrichum gloeosporioidescausing guava anthracnose. Plant Disease Research,21: 224.
of anthurium (Anthurium andreanum lind. Ex andre)M.Sc. (Ag) Thesis, Tamil Nadu AgriculturalUniversity, Coimbatore, India, pp: 168.
11. Anand, T., R. Bhaskaran, T. Raguchander,G. Karthikeyan, M. Rajesh and G. Senthilraja, 2008.Production of cell wall degrading enzymes and toxinsby Colletotrichum capsici and Alternaria alternatacausing fruit rot of chillies. Journal of PlantProtection Research, 48(4): 437-451.
12. Manjunath, 2009. Morphological and Molecularcharacterization of Alternaria alternata andColletotrichum gloeosporioides incitants of leafblight and anthracnose diseaseas of Noni and theirManagement, M.Sc.(Ag) Thesis, Tamil NaduAgricultural University, Coimbatore, India, pp: 222.
13. Munro, A.L.S., 1970. Measurement and control of pHvalues In: Methods of Microbiology, J.R. Norris andD.W. Ribbons, (Eds.). Academic Press, London,2: 39-90.
14. Purkayastha, R.P. and M. Sen Gupta, 1975.Studies on Colletotrichum gloeosporioidesinciting anthracnose of jute. Indian Phytopathology,28: 454-458.
15. Swart, G.M., 1999. Comparative study ofColletotrichum gloeosporioides from Avocado andMango. Ph.D Thesis, University of Pretoria, Pretoria,pp: 112.
16. Gonzalez, E., 2003. Characterization of isolates ofGlomerella cingulata causal agent of Glomerella leafspot and bitter rot of apples based on morphologyand genetic, molecular and pathogenicity tests.Ph.D. Thesis, North Carolina State University, pp: 77.
17. Moriwaki, J., T. Sato and T. Tsukiboshi, 2003.Morphological and molecular characterization ofColletotrichum boninense sp. nov. from Japan.Mycoscience, 44: 47-53.
18. Adaskaveg, J.E. and R.J. Hartin, 1997.Characterisation of Colletotrichum acutatum isolatescausing anthracnose of almond and peach inCalifornia. Phytopathology, 87: 979-987.
19. Mishra, A. and B.S. Siradhana, 1980.Sorghum anthracnose on the growth and sporulationof causal fungus at different light exposures.Philippine Agricultural Scientist, 63: 67-70.
20. Yashodha, H., R.K. Hegde andK. Srikant, 1993. Physiological studies onColletotrichum gloeosporioides (Penz) Penz andSacc. causing anthracnose of arecanut. KarnatakaJournal of Agricultural Sciences, 6: 411-412.
World J. Agric. Sci., 7 (6): 743-754, 2011
754
21. Sudhakar, S., 2000. Biology and management 35. Quimo, T.H. and A.J. Quimo, 1975. Pathogenicity ofof stylosanthes anthracnose caused by Mango anthracnose. Philippine AgriculturalColletotrichum gloeosporioides penz (penz) and Scientist, 58: 322-329.sacc. M.Sc. (Ag.) Thesis, University of Agricultural 36. Bernstein, B., E.I. Zehe, R.A. Dean and E. Shabi, 1995.Sciences, Dharwad, pp: 220. Characteristics of Colletotrichum from peach, apple,
22. Rangaswami, G., 1958. An agar block technique pecan and other hosts. Plant Disease, 79: 478-482.for isolating soil micro organisms with special 37. Jeyalakshmi, C. and K. Seetharaman, 1999.reference to Pythiaceous fungi. Science and Culture, Studies on the variability of the isolates of24: 85. Colletotrichum capsici (Syd.) Butler and Bisby
23. Ainsworth, G.C., 1961. Dictionary of fungi. causing chilli fruit rot. Crop Research, 17: 94-99.Commonwealth Mycological Institute, Kew Surrey, 38. Anand, T., 2002. Studies on fruit rotEngland, pp: 547. of chilli (Capsicum annuum L.) caused by
24. Tuite, J., 1969. Plant Pathological Methods. Colletotrichum capsici (Syd.) Butler and Bisby andFungi and Bacteria. Publishing Co., Minneapolis, Alternaria alternata (Fr) Keissler. M.Sc. (Ag.)U.S.A., pp: 239. Thesis, Tamil Nadu Agricultural University,
25. Booth, C., 1971. Fungal culture media. In: Methods in Coimbatore, India, pp: 157.Microbiology, C. Booth, (Ed.). Academic Press, 39. Denobys, B. and A. Baudry, 1995.New York, 4: 49-94. Species identification and pathogenicity strictly of
26. Fahmy, T., 1923. The production by Fusarium solani France Colletotrichum strains isolated fromof a toxic excretory substance capable of causing strawberry using morphological and culturalwilting of plants. Phytopathology, 13: 543-550. characteristics. Phytopathology, 85: 53-57.
27. Wastie, R.L., 1961. Factors affecting competitive 40. Kuramae, E.E., C.R. Lopes, N.L. Souza and Machado,saprophytic colonization of the agar plate by various 1997. Morphological and molecular characterizationroot infecting fungi. Transactions of the British of Colletotrichum spp. from citrus orchads affectedMycological Society, 44: 145-159. by post bloom fruit drop in Brazil. European Journal
28. Kiryu, T., 1939. Studies on physiological properties of Plant Pathology, 103: 323-329.of Ceratocystis paradoxa. Jaiwan province 41. Gina, M.S., 1999. Comparative study ofsugarcane experiments station Report, 6: 21-27. Colletotrichum gloeosporioides from Avocado and
29. Bose, T.K. and S.K. Mitra, 2001. Fruits: Tropical and Mango. Ph.D. Thesis, University of Pretoria, Pretoria,Sub Tropical. Tata McGraw-Hill, New Delhi, pp: 112.1: 227-318. 42. Bilgrami, K.S. and R.N. Verma, 1978. Physiology of
30. Bailey, J.A. and M.J. Jeger, 1992. fungi. Vikas Publishing House, New Delhi, pp: 438.Colletotrichum: Biology, Pathology and Control. 43. Prabakar, K., 1997. Anthracnose disease of mangoCAB International. Wallingford, UK. fruits caused by Colletotrichum gleosporioides.
31. Lemme, J.M. and C.M. Sonoda, 1978. Ph.D. Thesis. Tamil Nadu Agricultural University,Occurrence of Colletotrichum dematium f. sp. Coimbatore. India, pp: 196.truncata on stylosanthes spp. Plant Disease 44. Kamanna, B.C., 1996. Epidemology and control ofReporter, 62(7): 641-644. anthracnose diseases of coffee incited by
32. Sutton, B.C., 1980. The coelomycetes. Colletotrichum gloeosporioides (Penz.) Penz. andCommon Wealth Mycological Institute, Kew, pp: 78. Sacc. M.Sc.(Ag.) Thesis, University of Agricultural
33. Das Gupta, B., 1986. Role of toxin secretion by Sciences, Bangalore, pp: 190.Colletotrichum capsici on the expression of leaf spot 45. Alexander, F.S., A.C. Mello, M. Zamboni andsymptoms in Betelvine. Journal of Plantation Crops, P.B. Ivan, 2004. Development of14: 36-41. Colletotrichum gloeosporioides isolated from green
34. Chakrabarty, P.K., B.M. Singh and pepper in different culture media, temperatures andK.R. Shyam, 1988. Physiological specialization in light regimes. Scientific Agriculture, 61(5): 542-544. Colletotrichum lindemuthianum. Indian Journal of 46. Lilly, V.G. and H.L. Barnett, 1951. Physiology ofMycology and Plant Pathology, 18: 308-310. fungi. McGraw Hill Book Co. Inc., London, pp: 240.