Embed Size (px)
Citation preview
MORPHOLOGICAL CLASSIFICATION OF GLACIERS
Learning Outcomes:After reading this document and carefully studying the associated images, you should be able to: describe the different morphological classes of glaciers; classify glaciers in images or in real life based on their morphology; and, identify characteristics of glaciers in images or in real life that support your classification.
K.A. Lemke
Department of Geography and Geology, University of Wisconsin - Stevens [email protected]
2015
1
2
3
4
5
6
7
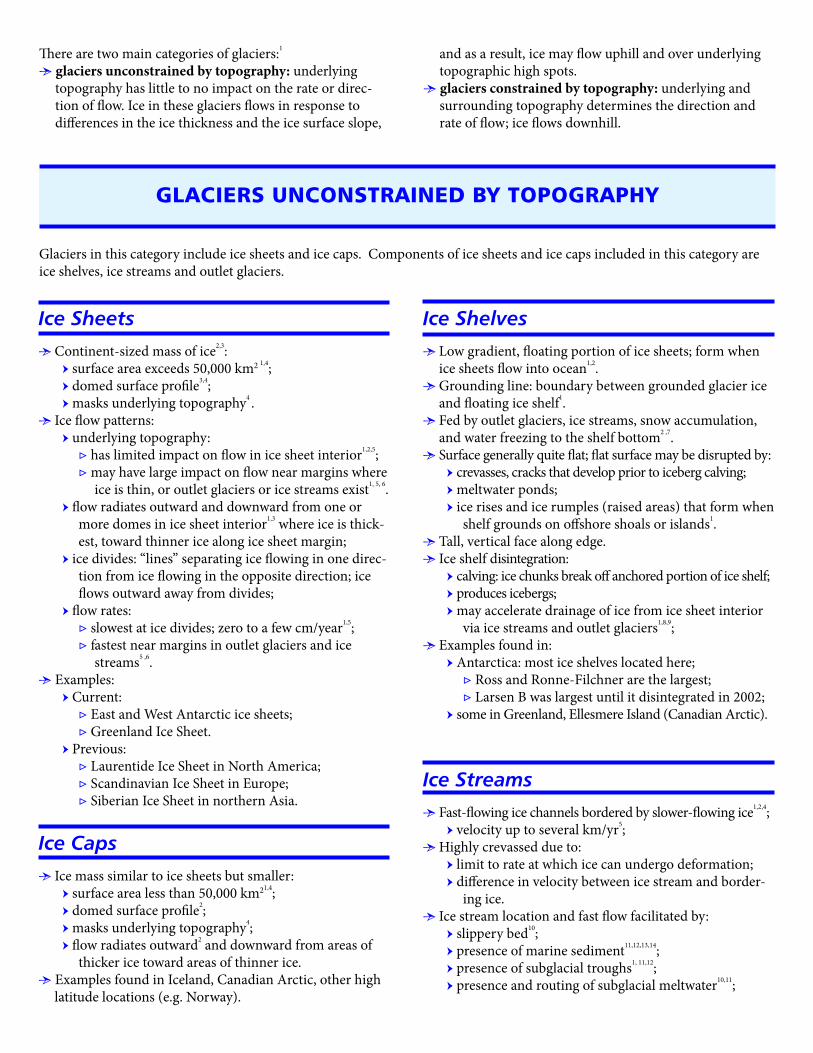
Ice Sheets
Continent-sized mass of ice2,3: surface area exceeds 50,000 km2 1,4; domed surface profile3,4; masks underlying topography4 .
Ice flow patterns: underlying topography:
▷ has limited impact on flow in ice sheet interior1,2,5;▷ may have large impact on flow near margins where
ice is thin, or outlet glaciers or ice streams exist1, 5, 6. flow radiates outward and downward from one or
more domes in ice sheet interior1,3 where ice is thick-est, toward thinner ice along ice sheet margin;
ice divides: “lines” separating ice flowing in one direc-tion from ice flowing in the opposite direction; ice flows outward away from divides;
flow rates:▷ slowest at ice divides; zero to a few cm/year1,5;▷ fastest near margins in outlet glaciers and ice
streams5 ,6. Examples:
Current:▷ East and West Antarctic ice sheets;▷ Greenland Ice Sheet.
Previous:▷ Laurentide Ice Sheet in North America;▷ Scandinavian Ice Sheet in Europe;▷ Siberian Ice Sheet in northern Asia.
GLACIERS UNCONSTRAINED BY TOPOGRAPHY
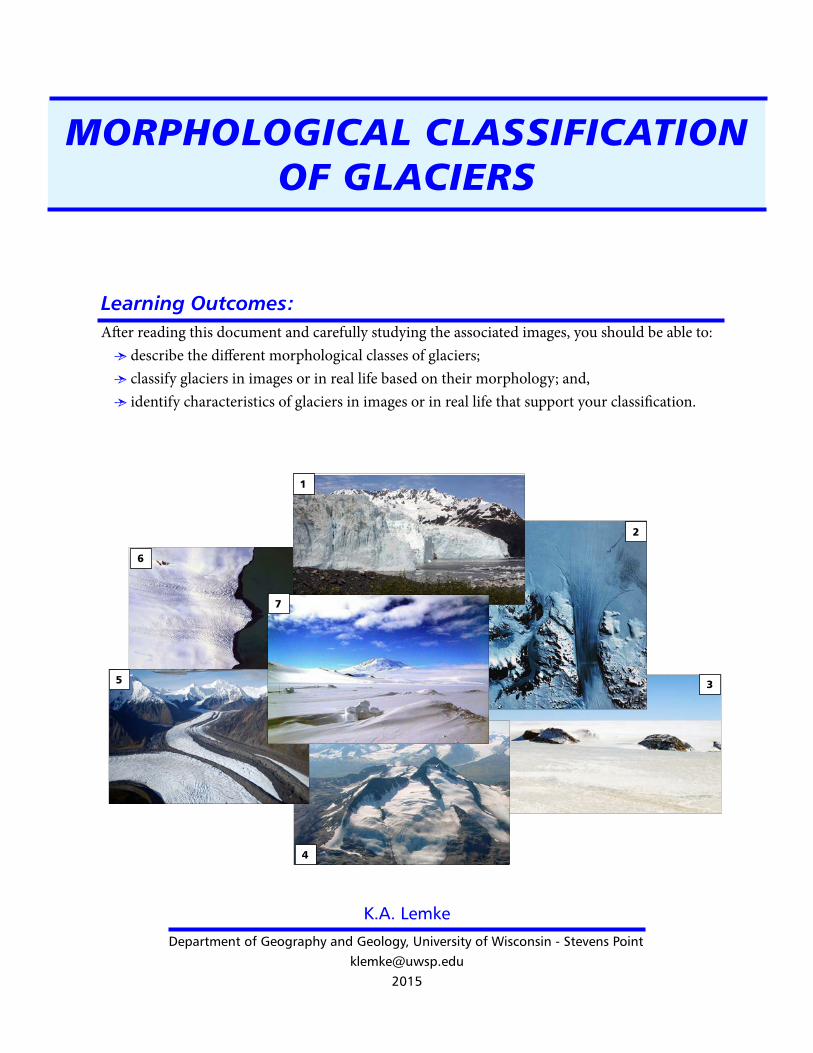
There are two main categories of glaciers:1
glaciers unconstrained by topography: underlying topography has little to no impact on the rate or direc-tion of flow. Ice in these glaciers flows in response to differences in the ice thickness and the ice surface slope,
and as a result, ice may flow uphill and over underlying topographic high spots.
glaciers constrained by topography: underlying and surrounding topography determines the direction and rate of flow; ice flows downhill.
Glaciers in this category include ice sheets and ice caps. Components of ice sheets and ice caps included in this category are ice shelves, ice streams and outlet glaciers.
Ice Caps
Ice mass similar to ice sheets but smaller: surface area less than 50,000 km21,4; domed surface profile2; masks underlying topography4; flow radiates outward2 and downward from areas of
thicker ice toward areas of thinner ice. Examples found in Iceland, Canadian Arctic, other high
latitude locations (e.g. Norway).
Ice Shelves
Low gradient, floating portion of ice sheets; form when ice sheets flow into ocean1,2.
Grounding line: boundary between grounded glacier ice and floating ice shelf1.
Fed by outlet glaciers, ice streams, snow accumulation, and water freezing to the shelf bottom2 ,7.
Surface generally quite flat; flat surface may be disrupted by: crevasses, cracks that develop prior to iceberg calving; meltwater ponds; ice rises and ice rumples (raised areas) that form when
shelf grounds on offshore shoals or islands1. Tall, vertical face along edge. Ice shelf disintegration:
calving: ice chunks break off anchored portion of ice shelf; produces icebergs; may accelerate drainage of ice from ice sheet interior
via ice streams and outlet glaciers1,8,9; Examples found in:
Antarctica: most ice shelves located here;▷ Ross and Ronne-Filchner are the largest;▷ Larsen B was largest until it disintegrated in 2002;
some in Greenland, Ellesmere Island (Canadian Arctic).
Ice Streams
Fast-flowing ice channels bordered by slower-flowing ice1,2,4; velocity up to several km/yr5;
Highly crevassed due to: limit to rate at which ice can undergo deformation; difference in velocity between ice stream and border-
ing ice. Ice stream location and fast flow facilitated by:
slippery bed10; presence of marine sediment11,12,13,14; presence of subglacial troughs1, 11,12; presence and routing of subglacial meltwater10,11;
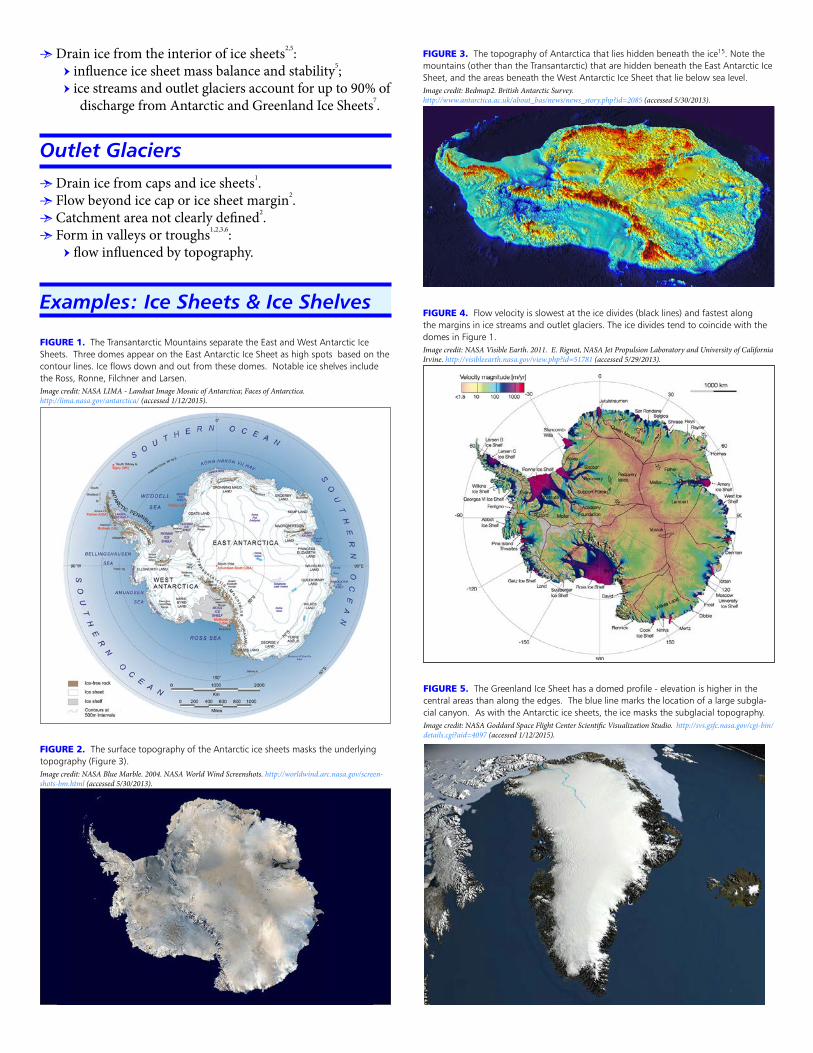
FIGURE 5. The Greenland Ice Sheet has a domed profile - elevation is higher in the central areas than along the edges. The blue line marks the location of a large subgla-cial canyon. As with the Antarctic ice sheets, the ice masks the subglacial topography.Image credit: NASA Goddard Space Flight Center Scientific Visualization Studio. http://svs.gsfc.nasa.gov/cgi-bin/details.cgi?aid=4097 (accessed 1/12/2015).
FIGURE 2. The surface topography of the Antarctic ice sheets masks the underlying topography (Figure 3). Image credit: NASA Blue Marble. 2004. NASA World Wind Screenshots. http://worldwind.arc.nasa.gov/screen-shots-bm.html (accessed 5/30/2013).
FIGURE 3. The topography of Antarctica that lies hidden beneath the ice15. Note the mountains (other than the Transantarctic) that are hidden beneath the East Antarctic Ice Sheet, and the areas beneath the West Antarctic Ice Sheet that lie below sea level.Image credit: Bedmap2. British Antarctic Survey. http://www.antarctica.ac.uk/about_bas/news/news_story.php?id=2085 (accessed 5/30/2013).
Drain ice from the interior of ice sheets2,5: influence ice sheet mass balance and stability5; ice streams and outlet glaciers account for up to 90% of
discharge from Antarctic and Greenland Ice Sheets7.
Outlet Glaciers
Drain ice from caps and ice sheets1. Flow beyond ice cap or ice sheet margin2. Catchment area not clearly defined2. Form in valleys or troughs1,2,3,6:
flow influenced by topography.
Examples: Ice Sheets & Ice Shelves
FIGURE 1. The Transantarctic Mountains separate the East and West Antarctic Ice Sheets. Three domes appear on the East Antarctic Ice Sheet as high spots based on the contour lines. Ice flows down and out from these domes. Notable ice shelves include the Ross, Ronne, Filchner and Larsen.Image credit: NASA LIMA - Landsat Image Mosaic of Antarctica; Faces of Antarctica. http://lima.nasa.gov/antarctica/ (accessed 1/12/2015).
FIGURE 4. Flow velocity is slowest at the ice divides (black lines) and fastest along the margins in ice streams and outlet glaciers. The ice divides tend to coincide with the domes in Figure 1.Image credit: NASA Visible Earth. 2011. E. Rignot, NASA Jet Propulsion Laboratory and University of California Irvine. http://visibleearth.nasa.gov/view.php?id=51781 (accessed 5/29/2013).
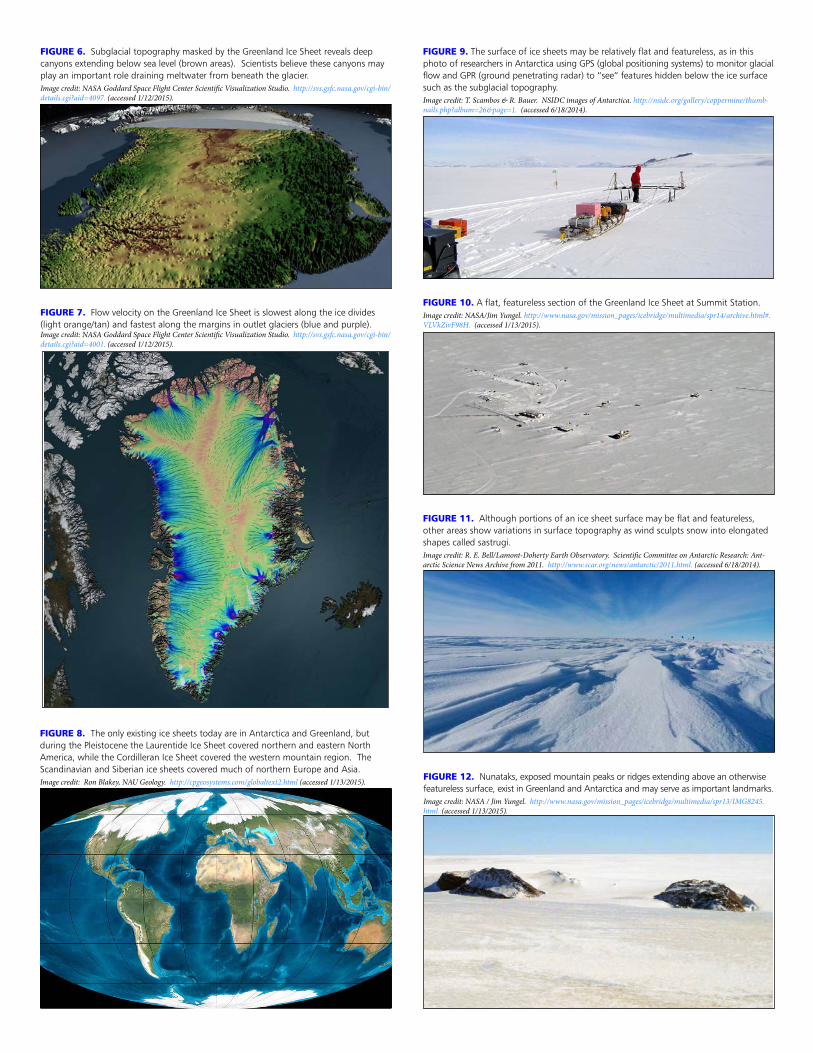
FIGURE 9. The surface of ice sheets may be relatively flat and featureless, as in this photo of researchers in Antarctica using GPS (global positioning systems) to monitor glacial flow and GPR (ground penetrating radar) to “see” features hidden below the ice surface such as the subglacial topography.Image credit: T. Scambos & R. Bauer. NSIDC images of Antarctica. http://nsidc.org/gallery/coppermine/thumb-nails.php?album=26&page=1. (accessed 6/18/2014).
FIGURE 11. Although portions of an ice sheet surface may be flat and featureless, other areas show variations in surface topography as wind sculpts snow into elongated shapes called sastrugi. Image credit: R. E. Bell/Lamont-Doherty Earth Observatory. Scientific Committee on Antarctic Research: Ant-arctic Science News Archive from 2011. http://www.scar.org/news/antarctic/2011.html. (accessed 6/18/2014).
FIGURE 8. The only existing ice sheets today are in Antarctica and Greenland, but during the Pleistocene the Laurentide Ice Sheet covered northern and eastern North America, while the Cordilleran Ice Sheet covered the western mountain region. The Scandinavian and Siberian ice sheets covered much of northern Europe and Asia. Image credit: Ron Blakey, NAU Geology. http://cpgeosystems.com/globaltext2.html (accessed 1/13/2015).
FIGURE 7. Flow velocity on the Greenland Ice Sheet is slowest along the ice divides (light orange/tan) and fastest along the margins in outlet glaciers (blue and purple).Image credit: NASA Goddard Space Flight Center Scientific Visualization Studio. http://svs.gsfc.nasa.gov/cgi-bin/details.cgi?aid=4001. (accessed 1/12/2015).
FIGURE 6. Subglacial topography masked by the Greenland Ice Sheet reveals deep canyons extending below sea level (brown areas). Scientists believe these canyons may play an important role draining meltwater from beneath the glacier.Image credit: NASA Goddard Space Flight Center Scientific Visualization Studio. http://svs.gsfc.nasa.gov/cgi-bin/details.cgi?aid=4097. (accessed 1/12/2015).
FIGURE 10. A flat, featureless section of the Greenland Ice Sheet at Summit Station.Image credit: NASA/Jim Yungel. http://www.nasa.gov/mission_pages/icebridge/multimedia/spr14/archive.html#.VLVkZivF98H. (accessed 1/13/2015).
FIGURE 12. Nunataks, exposed mountain peaks or ridges extending above an otherwise featureless surface, exist in Greenland and Antarctica and may serve as important landmarks. Image credit: NASA / Jim Yungel. http://www.nasa.gov/mission_pages/icebridge/multimedia/spr13/IMG8245.html. (accessed 1/13/2015).
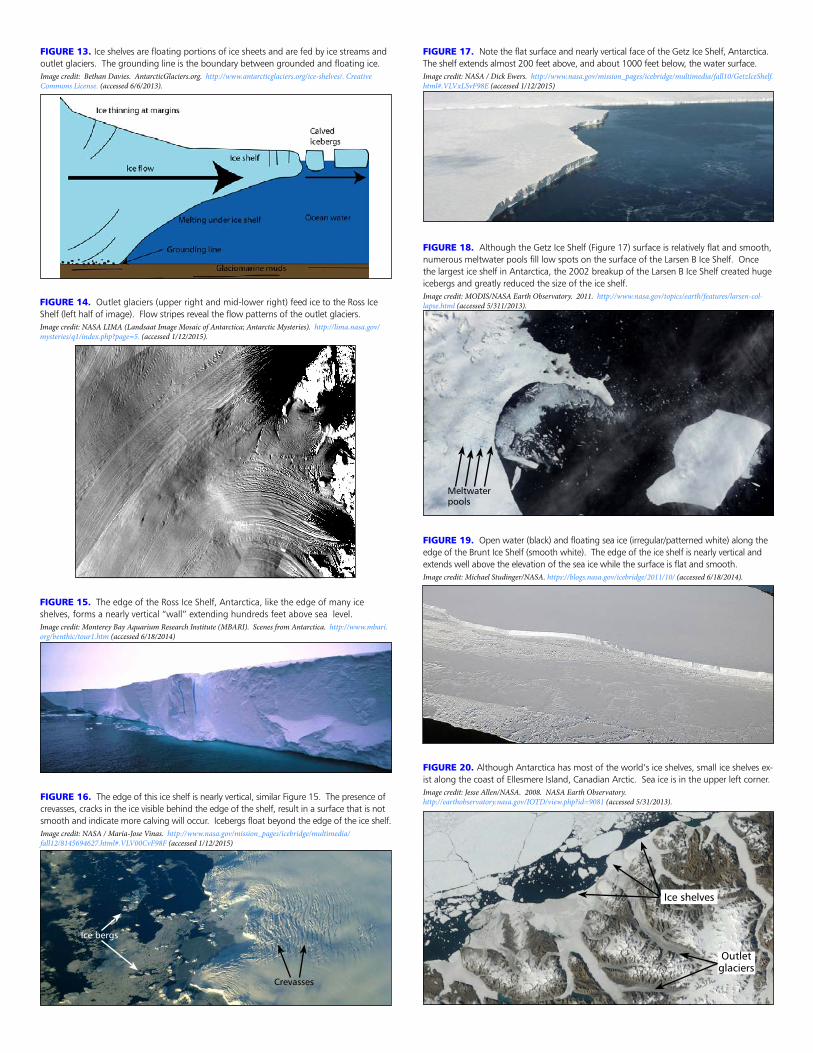
FIGURE 18. Although the Getz Ice Shelf (Figure 17) surface is relatively flat and smooth, numerous meltwater pools fill low spots on the surface of the Larsen B Ice Shelf. Once the largest ice shelf in Antarctica, the 2002 breakup of the Larsen B Ice Shelf created huge icebergs and greatly reduced the size of the ice shelf. Image credit: MODIS/NASA Earth Observatory. 2011. http://www.nasa.gov/topics/earth/features/larsen-col-lapse.html (accessed 5/311/2013).
FIGURE 19. Open water (black) and floating sea ice (irregular/patterned white) along the edge of the Brunt Ice Shelf (smooth white). The edge of the ice shelf is nearly vertical and extends well above the elevation of the sea ice while the surface is flat and smooth.Image credit: Michael Studinger/NASA. https://blogs.nasa.gov/icebridge/2011/10/ (accessed 6/18/2014).
FIGURE 14. Outlet glaciers (upper right and mid-lower right) feed ice to the Ross Ice Shelf (left half of image). Flow stripes reveal the flow patterns of the outlet glaciers.Image credit: NASA LIMA (Landsaat Image Mosaic of Antarctica; Antarctic Mysteries). http://lima.nasa.gov/mysteries/q1/index.php?page=5. (accessed 1/12/2015).
FIGURE 15. The edge of the Ross Ice Shelf, Antarctica, like the edge of many ice shelves, forms a nearly vertical “wall” extending hundreds feet above sea level.Image credit: Monterey Bay Aquarium Research Institute (MBARI). Scenes from Antarctica. http://www.mbari.org/benthic/tour1.htm (accessed 6/18/2014)
FIGURE 20. Although Antarctica has most of the world’s ice shelves, small ice shelves ex-ist along the coast of Ellesmere Island, Canadian Arctic. Sea ice is in the upper left corner.Image credit: Jesse Allen/NASA. 2008. NASA Earth Observatory. http://earthobservatory.nasa.gov/IOTD/view.php?id=9081 (accessed 5/31/2013).
Ice shelves
Outlet glaciers
FIGURE 13. Ice shelves are floating portions of ice sheets and are fed by ice streams and outlet glaciers. The grounding line is the boundary between grounded and floating ice. Image credit: Bethan Davies. AntarcticGlaciers.org. http://www.antarcticglaciers.org/ice-shelves/. Creative Commons License. (accessed 6/6/2013).
FIGURE 17. Note the flat surface and nearly vertical face of the Getz Ice Shelf, Antarctica. The shelf extends almost 200 feet above, and about 1000 feet below, the water surface.Image credit: NASA / Dick Ewers. http://www.nasa.gov/mission_pages/icebridge/multimedia/fall10/GetzIceShelf.html#.VLVxLSvF98E (accessed 1/12/2015)
FIGURE 16. The edge of this ice shelf is nearly vertical, similar Figure 15. The presence of crevasses, cracks in the ice visible behind the edge of the shelf, result in a surface that is not smooth and indicate more calving will occur. Icebergs float beyond the edge of the ice shelf.Image credit: NASA / Maria-Jose Vinas. http://www.nasa.gov/mission_pages/icebridge/multimedia/fall12/8145694627.html#.VLV00CvF98F (accessed 1/12/2015)
Crevasses
Ice bergs
Meltwater pools
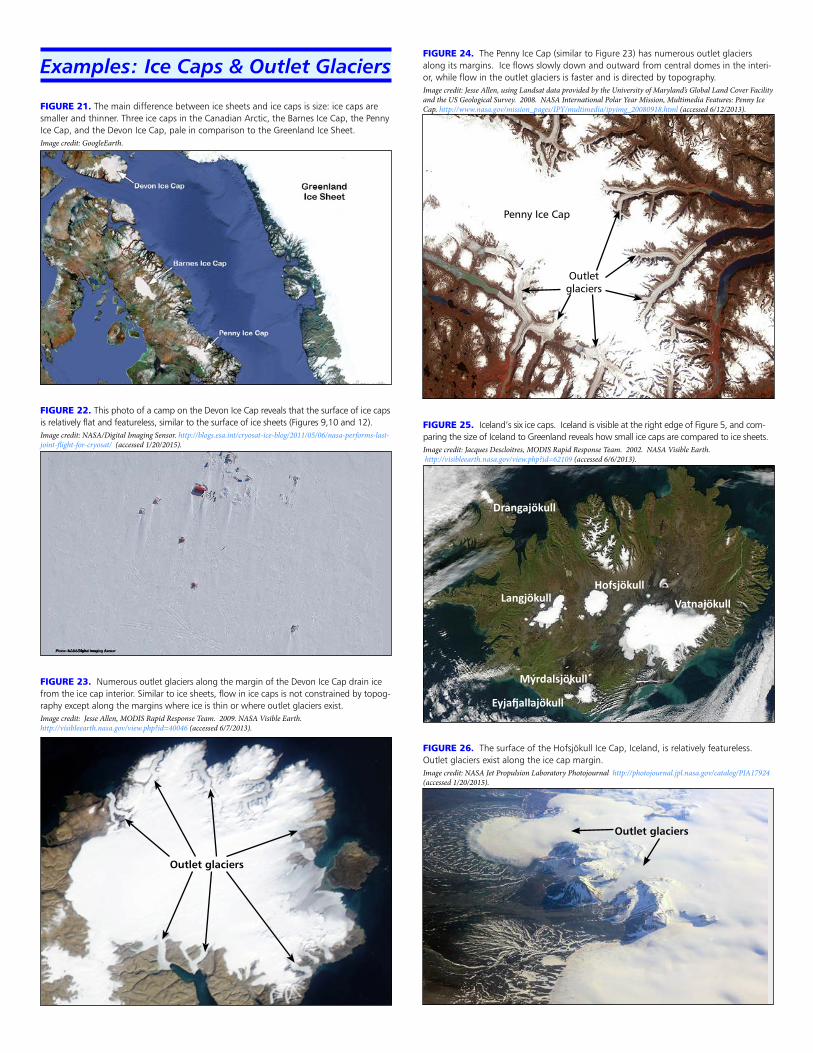
FIGURE 21. The main difference between ice sheets and ice caps is size: ice caps are smaller and thinner. Three ice caps in the Canadian Arctic, the Barnes Ice Cap, the Penny Ice Cap, and the Devon Ice Cap, pale in comparison to the Greenland Ice Sheet.Image credit: GoogleEarth.
FIGURE 22. This photo of a camp on the Devon Ice Cap reveals that the surface of ice caps is relatively flat and featureless, similar to the surface of ice sheets (Figures 9,10 and 12).Image credit: NASA/Digital Imaging Sensor. http://blogs.esa.int/cryosat-ice-blog/2011/05/06/nasa-performs-last-joint-flight-for-cryosat/ (accessed 1/20/2015).
FIGURE 23. Numerous outlet glaciers along the margin of the Devon Ice Cap drain ice from the ice cap interior. Similar to ice sheets, flow in ice caps is not constrained by topog-raphy except along the margins where ice is thin or where outlet glaciers exist. Image credit: Jesse Allen, MODIS Rapid Response Team. 2009. NASA Visible Earth. http://visibleearth.nasa.gov/view.php?id=40046 (accessed 6/7/2013).
Examples: Ice Caps & Outlet GlaciersFIGURE 24. The Penny Ice Cap (similar to Figure 23) has numerous outlet glaciers along its margins. Ice flows slowly down and outward from central domes in the interi-or, while flow in the outlet glaciers is faster and is directed by topography.Image credit: Jesse Allen, using Landsat data provided by the University of Maryland’s Global Land Cover Facility and the US Geological Survey. 2008. NASA International Polar Year Mission, Multimedia Features: Penny Ice Cap. http://www.nasa.gov/mission_pages/IPY/multimedia/ipyimg_20080918.html (accessed 6/12/2013).
Drangajökull
HofsjökullVatnajökull
Mýrdalsjökull
Eyjafjallajökull
Langjökull
FIGURE 25. Iceland’s six ice caps. Iceland is visible at the right edge of Figure 5, and com-paring the size of Iceland to Greenland reveals how small ice caps are compared to ice sheets. Image credit: Jacques Descloitres, MODIS Rapid Response Team. 2002. NASA Visible Earth. http://visibleearth.nasa.gov/view.php?id=62109 (accessed 6/6/2013).
Penny Ice Cap
Outletglaciers
FIGURE 26. The surface of the Hofsjökull Ice Cap, Iceland, is relatively featureless. Outlet glaciers exist along the ice cap margin. Image credit: NASA Jet Propulsion Laboratory Photojournal http://photojournal.jpl.nasa.gov/catalog/PIA17924 (accessed 1/20/2015).
Outlet glaciers
Outlet glaciers
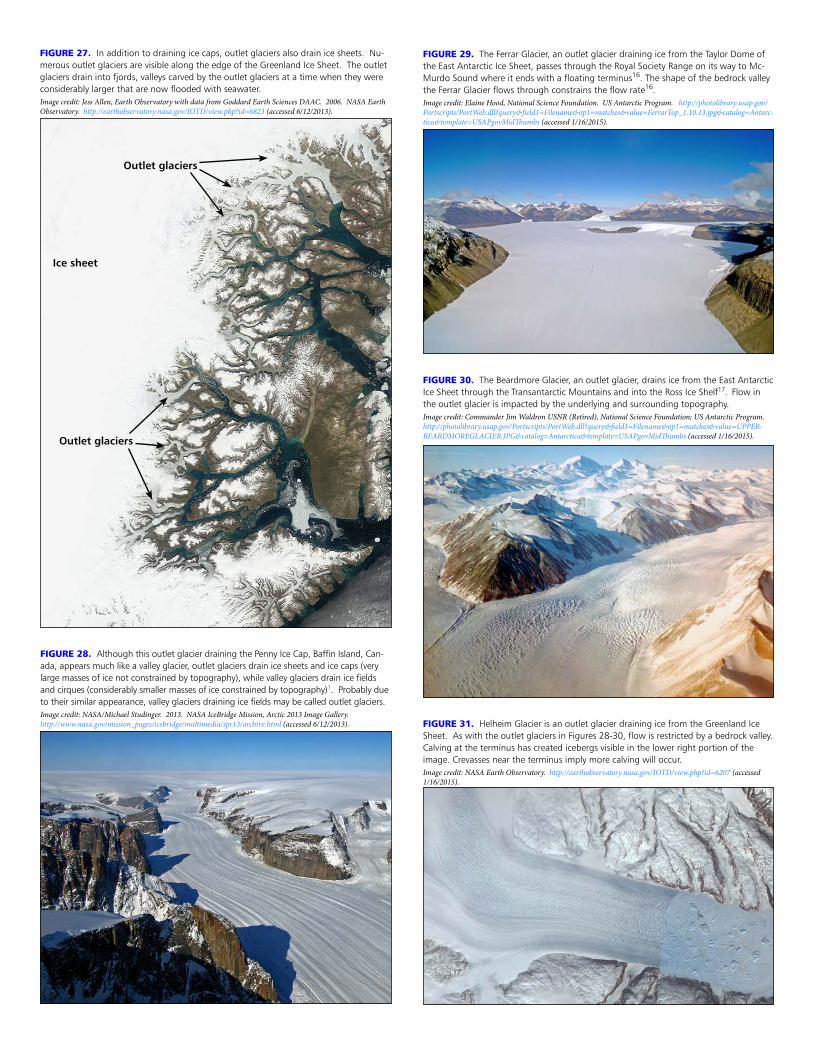
FIGURE 28. Although this outlet glacier draining the Penny Ice Cap, Baffin Island, Can-ada, appears much like a valley glacier, outlet glaciers drain ice sheets and ice caps (very large masses of ice not constrained by topography), while valley glaciers drain ice fields and cirques (considerably smaller masses of ice constrained by topography)1. Probably due to their similar appearance, valley glaciers draining ice fields may be called outlet glaciers.Image credit: NASA/Michael Studinger. 2013. NASA IceBridge Mission, Arctic 2013 Image Gallery. http://www.nasa.gov/mission_pages/icebridge/multimedia/spr13/archive.html (accessed 6/12/2013).
FIGURE 27. In addition to draining ice caps, outlet glaciers also drain ice sheets. Nu-merous outlet glaciers are visible along the edge of the Greenland Ice Sheet. The outlet glaciers drain into fjords, valleys carved by the outlet glaciers at a time when they were considerably larger that are now flooded with seawater.Image credit: Jess Allen, Earth Observatory with data from Goddard Earth Sciences DAAC. 2006. NASA Earth Observatory. http://earthobservatory.nasa.gov/IOTD/view.php?id=6823 (accessed 6/12/2013).
Ice sheet
Outlet glaciers
Outlet glaciers
FIGURE 29. The Ferrar Glacier, an outlet glacier draining ice from the Taylor Dome of the East Antarctic Ice Sheet, passes through the Royal Society Range on its way to Mc-Murdo Sound where it ends with a floating terminus16. The shape of the bedrock valley the Ferrar Glacier flows through constrains the flow rate16.Image credit: Elaine Hood, National Science Foundation. US Antarctic Program. http://photolibrary.usap.gov/Portscripts/PortWeb.dll?query&field1=Filename&op1=matches&value=FerrarTop_1.10.13.jpg&catalog=Antarc-tica&template=USAPgovMidThumbs (accessed 1/16/2015).
FIGURE 30. The Beardmore Glacier, an outlet glacier, drains ice from the East Antarctic Ice Sheet through the Transantarctic Mountains and into the Ross Ice Shelf17. Flow in the outlet glacier is impacted by the underlying and surrounding topography.Image credit: Commander Jim Waldron USNR (Retired), National Science Foundation; US Antarctic Program. http://photolibrary.usap.gov/Portscripts/PortWeb.dll?query&field1=Filename&op1=matches&value=UPPER-BEARDMOREGLACIER.JPG&catalog=Antarctica&template=USAPgovMidThumbs (accessed 1/16/2015).
FIGURE 31. Helheim Glacier is an outlet glacier draining ice from the Greenland Ice Sheet. As with the outlet glaciers in Figures 28-30, flow is restricted by a bedrock valley. Calving at the terminus has created icebergs visible in the lower right portion of the image. Crevasses near the terminus imply more calving will occur.Image credit: NASA Earth Observatory. http://earthobservatory.nasa.gov/IOTD/view.php?id=6207 (accessed 1/16/2015).
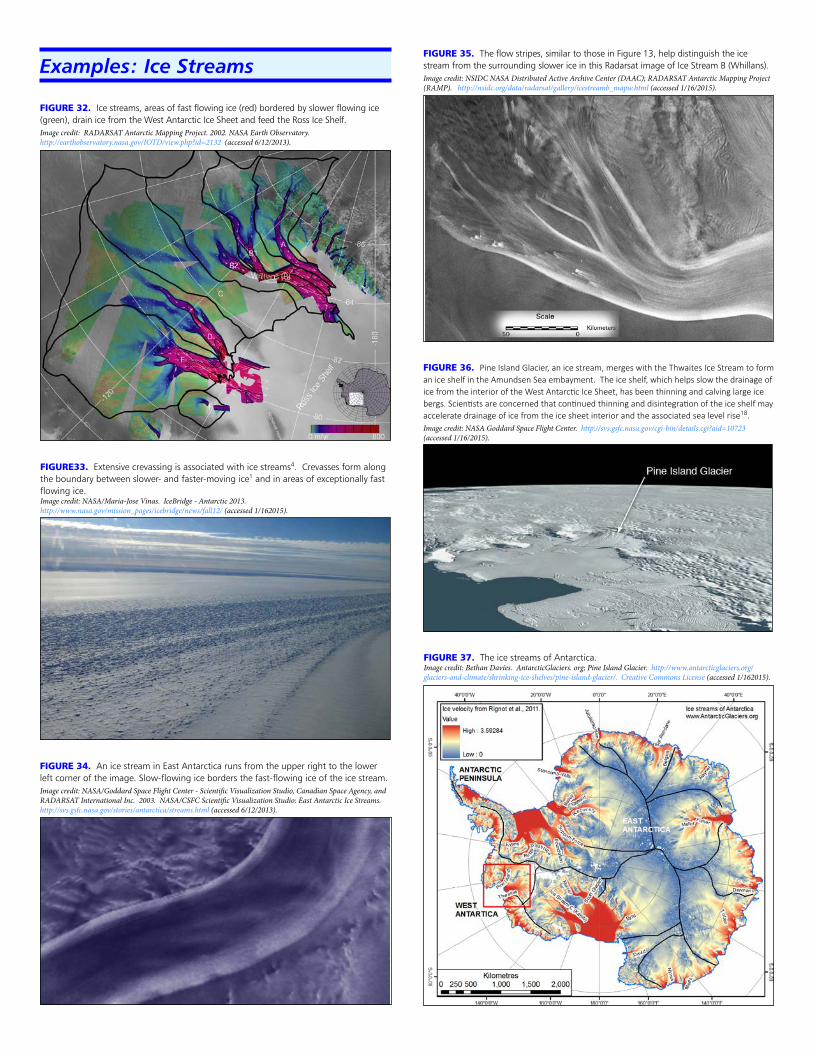
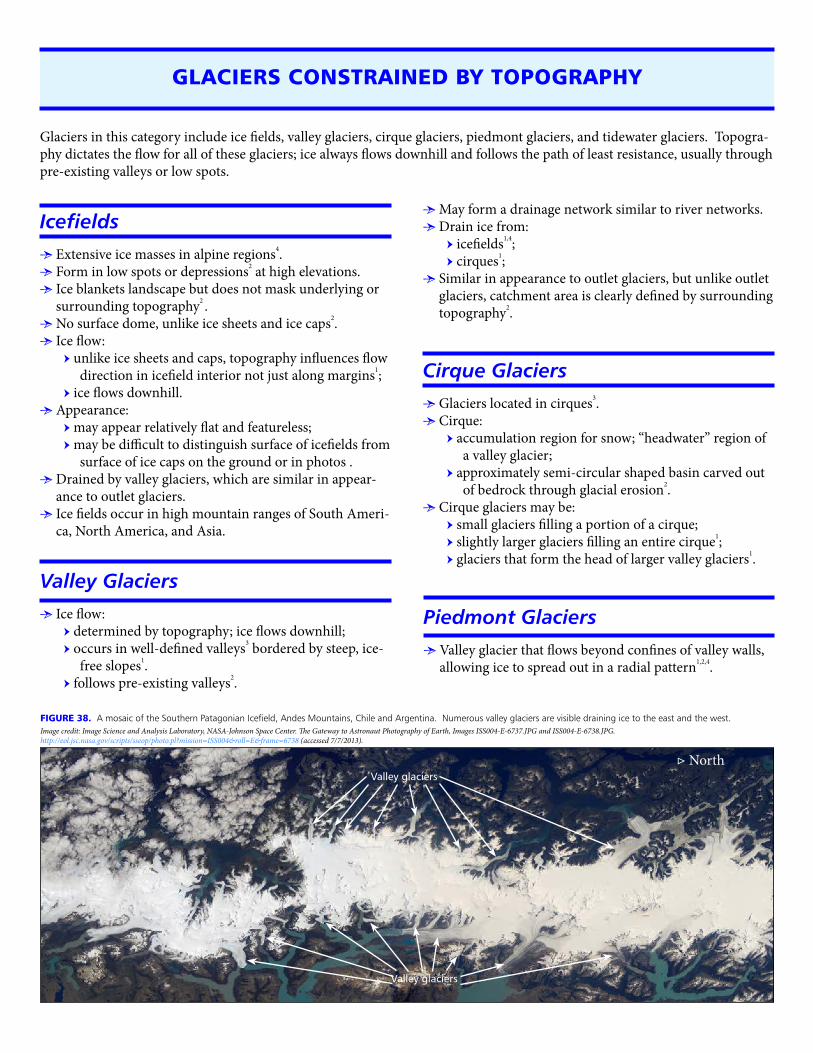
FIGURE 32. Ice streams, areas of fast flowing ice (red) bordered by slower flowing ice (green), drain ice from the West Antarctic Ice Sheet and feed the Ross Ice Shelf. Image credit: RADARSAT Antarctic Mapping Project. 2002. NASA Earth Observatory. http://earthobservatory.nasa.gov/IOTD/view.php?id=2132 (accessed 6/12/2013).
FIGURE33. Extensive crevassing is associated with ice streams4. Crevasses form along the boundary between slower- and faster-moving ice1 and in areas of exceptionally fast flowing ice. Image credit: NASA/Maria-Jose Vinas. IceBridge - Antarctic 2013. http://www.nasa.gov/mission_pages/icebridge/news/fall12/ (accessed 1/162015).
FIGURE 34. An ice stream in East Antarctica runs from the upper right to the lower left corner of the image. Slow-flowing ice borders the fast-flowing ice of the ice stream.Image credit: NASA/Goddard Space Flight Center - Scientific Visualization Studio, Canadian Space Agency, and RADARSAT International Inc. 2003. NASA/CSFC Scientific Visualization Studio: East Antarctic Ice Streams. http://svs.gsfc.nasa.gov/stories/antarctica/streams.html (accessed 6/12/2013).
Examples: Ice StreamsFIGURE 35. The flow stripes, similar to those in Figure 13, help distinguish the ice stream from the surrounding slower ice in this Radarsat image of Ice Stream B (Whillans).Image credit: NSIDC NASA Distributed Active Archive Center (DAAC); RADARSAT Antarctic Mapping Project (RAMP). http://nsidc.org/data/radarsat/gallery/icestreamb_mapw.html (accessed 1/16/2015).
FIGURE 36. Pine Island Glacier, an ice stream, merges with the Thwaites Ice Stream to form an ice shelf in the Amundsen Sea embayment. The ice shelf, which helps slow the drainage of ice from the interior of the West Antarctic Ice Sheet, has been thinning and calving large ice bergs. Scientists are concerned that continued thinning and disintegration of the ice shelf may accelerate drainage of ice from the ice sheet interior and the associated sea level rise18. Image credit: NASA Goddard Space Flight Center. http://svs.gsfc.nasa.gov/cgi-bin/details.cgi?aid=10723 (accessed 1/16/2015).
FIGURE 37. The ice streams of Antarctica. Image credit: Bethan Davies. AntarcticGlaciers. org; Pine Island Glacier. http://www.antarcticglaciers.org/glaciers-and-climate/shrinking-ice-shelves/pine-island-glacier/. Creative Commons License (accessed 1/162015).
Cirque Glaciers
Glaciers located in cirques3. Cirque:
accumulation region for snow; “headwater” region of a valley glacier;
approximately semi-circular shaped basin carved out of bedrock through glacial erosion2.
Cirque glaciers may be: small glaciers filling a portion of a cirque; slightly larger glaciers filling an entire cirque1; glaciers that form the head of larger valley glaciers1.
GLACIERS CONSTRAINED BY TOPOGRAPHY
Icefields
Extensive ice masses in alpine regions4. Form in low spots or depressions2 at high elevations. Ice blankets landscape but does not mask underlying or
surrounding topography2 . No surface dome, unlike ice sheets and ice caps2. Ice flow:
unlike ice sheets and caps, topography influences flow direction in icefield interior not just along margins1;
ice flows downhill. Appearance:
may appear relatively flat and featureless; may be difficult to distinguish surface of icefields from
surface of ice caps on the ground or in photos . Drained by valley glaciers, which are similar in appear-
ance to outlet glaciers. Ice fields occur in high mountain ranges of South Ameri-
ca, North America, and Asia.
FIGURE 38. A mosaic of the Southern Patagonian Icefield, Andes Mountains, Chile and Argentina. Numerous valley glaciers are visible draining ice to the east and the west. Image credit: Image Science and Analysis Laboratory, NASA-Johnson Space Center. The Gateway to Astronaut Photography of Earth, Images ISS004-E-6737.JPG and ISS004-E-6738.JPG. http://eol.jsc.nasa.gov/scripts/sseop/photo.pl?mission=ISS004&roll=E&frame=6738 (accessed 7/7/2013).
▷ North
Valley glaciers
Valley glaciers
Glaciers in this category include ice fields, valley glaciers, cirque glaciers, piedmont glaciers, and tidewater glaciers. Topogra-phy dictates the flow for all of these glaciers; ice always flows downhill and follows the path of least resistance, usually through pre-existing valleys or low spots.
Piedmont Glaciers
Valley glacier that flows beyond confines of valley walls, allowing ice to spread out in a radial pattern1,2,4.
Valley Glaciers
Ice flow: determined by topography; ice flows downhill; occurs in well-defined valleys3 bordered by steep, ice-
free slopes1. follows pre-existing valleys2.
May form a drainage network similar to river networks. Drain ice from:
icefields1,4; cirques1;
Similar in appearance to outlet glaciers, but unlike outlet glaciers, catchment area is clearly defined by surrounding topography2.
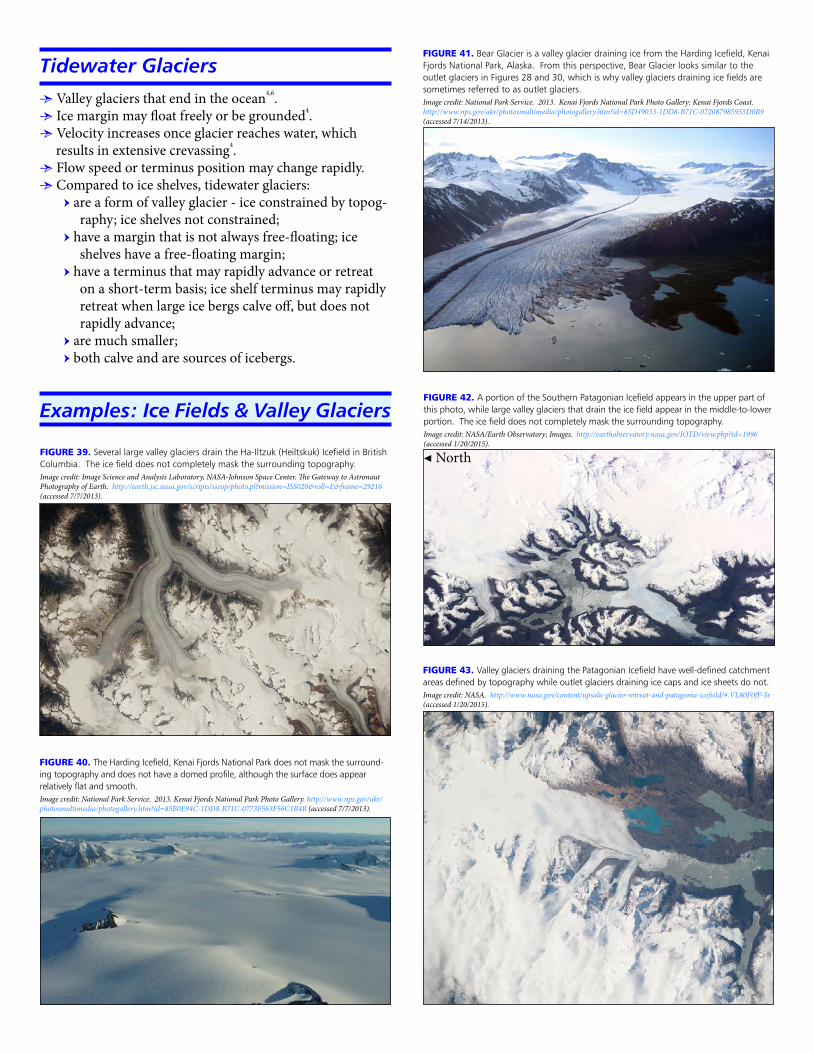
FIGURE 39. Several large valley glaciers drain the Ha-Iltzuk (Heiltskuk) Icefield in British Columbia. The ice field does not completely mask the surrounding topography.Image credit: Image Science and Analysis Laboratory, NASA-Johnson Space Center. The Gateway to Astronaut Photography of Earth. http://earth.jsc.nasa.gov/scripts/sseop/photo.pl?mission=ISS020&roll=E&frame=29216 (accessed 7/7/2013).
FIGURE 41. Bear Glacier is a valley glacier draining ice from the Harding Icefield, Kenai Fjords National Park, Alaska. From this perspective, Bear Glacier looks similar to the outlet glaciers in Figures 28 and 30, which is why valley glaciers draining ice fields are sometimes referred to as outlet glaciers.Image credit: National Park Service. 2013. Kenai Fjords National Park Photo Gallery: Kenai Fjords Coast. http://www.nps.gov/akr/photosmultimedia/photogallery.htm?id=85D49033-1DD8-B71C-072087985955D0B9 (accessed 7/14/2013).
Examples: Ice Fields & Valley Glaciers
FIGURE 40. The Harding Icefield, Kenai Fjords National Park does not mask the surround-ing topography and does not have a domed profile, although the surface does appear relatively flat and smooth.Image credit: National Park Service. 2013. Kenai Fjords National Park Photo Gallery. http://www.nps.gov/akr/photosmultimedia/photogallery.htm?id=85B0E94C-1DD8-B71C-0773F563F56C1B4B (accessed 7/7/2013).
Tidewater Glaciers
Valley glaciers that end in the ocean4,6. Ice margin may float freely or be grounded4. Velocity increases once glacier reaches water, which
results in extensive crevassing4. Flow speed or terminus position may change rapidly. Compared to ice shelves, tidewater glaciers:
are a form of valley glacier - ice constrained by topog-raphy; ice shelves not constrained;
have a margin that is not always free-floating; ice shelves have a free-floating margin;
have a terminus that may rapidly advance or retreat on a short-term basis; ice shelf terminus may rapidly retreat when large ice bergs calve off, but does not rapidly advance;
are much smaller; both calve and are sources of icebergs.
FIGURE 42. A portion of the Southern Patagonian Icefield appears in the upper part of this photo, while large valley glaciers that drain the ice field appear in the middle-to-lower portion. The ice field does not completely mask the surrounding topography.Image credit: NASA/Earth Observatory; Images. http://earthobservatory.nasa.gov/IOTD/view.php?id=1996 (accessed 1/20/2015).
◀ North
FIGURE 43. Valley glaciers draining the Patagonian Icefield have well-defined catchment areas defined by topography while outlet glaciers draining ice caps and ice sheets do not.Image credit: NASA. http://www.nasa.gov/content/upsala-glacier-retreat-and-patagonia-icefield/#.VL80F0fF-Sr (accessed 1/20/2015).
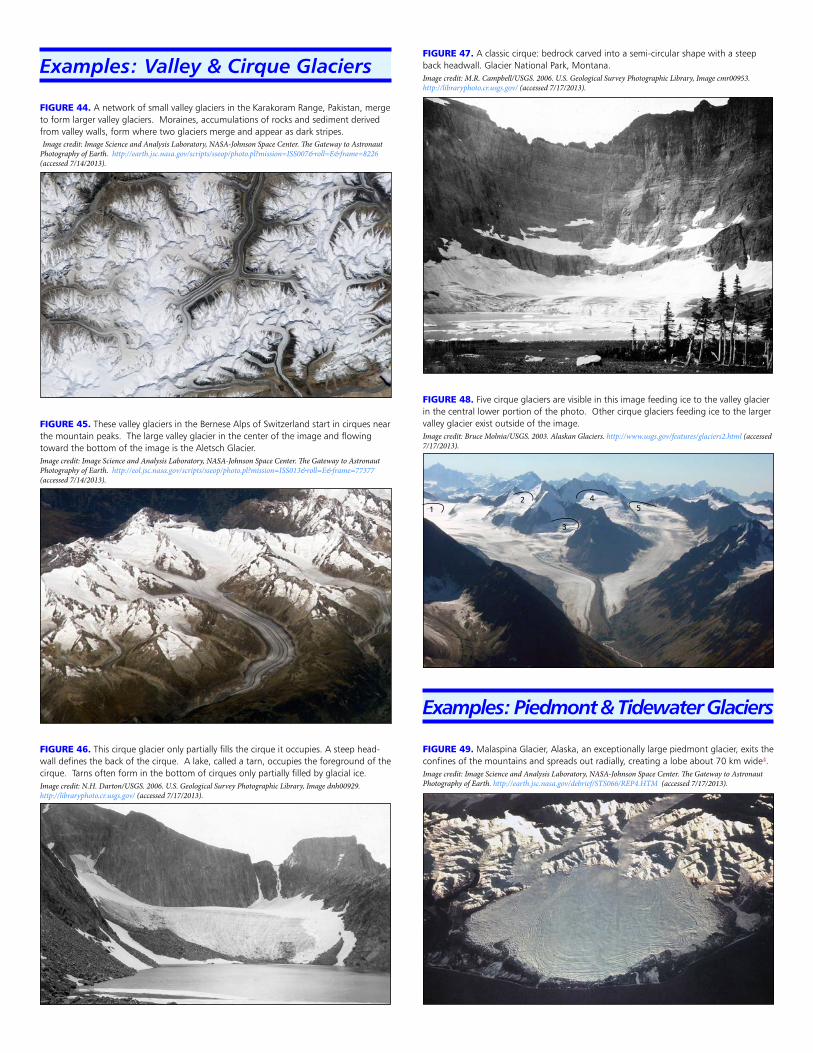
FIGURE 47. A classic cirque: bedrock carved into a semi-circular shape with a steep back headwall. Glacier National Park, Montana.Image credit: M.R. Campbell/USGS. 2006. U.S. Geological Survey Photographic Library, Image cmr00953. http://libraryphoto.cr.usgs.gov/ (accessed 7/17/2013).
FIGURE 48. Five cirque glaciers are visible in this image feeding ice to the valley glacier in the central lower portion of the photo. Other cirque glaciers feeding ice to the larger valley glacier exist outside of the image.Image credit: Bruce Molnia/USGS. 2003. Alaskan Glaciers. http://www.usgs.gov/features/glaciers2.html (accessed 7/17/2013).
12
3
45
FIGURE 46. This cirque glacier only partially fills the cirque it occupies. A steep head-wall defines the back of the cirque. A lake, called a tarn, occupies the foreground of the cirque. Tarns often form in the bottom of cirques only partially filled by glacial ice.Image credit: N.H. Darton/USGS. 2006. U.S. Geological Survey Photographic Library, Image dnh00929. http://libraryphoto.cr.usgs.gov/ (accessed 7/17/2013).
Examples: Valley & Cirque Glaciers
FIGURE 45. These valley glaciers in the Bernese Alps of Switzerland start in cirques near the mountain peaks. The large valley glacier in the center of the image and flowing toward the bottom of the image is the Aletsch Glacier.Image credit: Image Science and Analysis Laboratory, NASA-Johnson Space Center. The Gateway to Astronaut Photography of Earth. http://eol.jsc.nasa.gov/scripts/sseop/photo.pl?mission=ISS013&roll=E&frame=77377 (accessed 7/14/2013).
FIGURE 44. A network of small valley glaciers in the Karakoram Range, Pakistan, merge to form larger valley glaciers. Moraines, accumulations of rocks and sediment derived from valley walls, form where two glaciers merge and appear as dark stripes. Image credit: Image Science and Analysis Laboratory, NASA-Johnson Space Center. The Gateway to Astronaut Photography of Earth. http://earth.jsc.nasa.gov/scripts/sseop/photo.pl?mission=ISS007&roll=E&frame=8226 (accessed 7/14/2013).
Examples: Piedmont & Tidewater Glaciers
FIGURE 49. Malaspina Glacier, Alaska, an exceptionally large piedmont glacier, exits the confines of the mountains and spreads out radially, creating a lobe about 70 km wide4.Image credit: Image Science and Analysis Laboratory, NASA-Johnson Space Center. The Gateway to Astronaut Photography of Earth. http://earth.jsc.nasa.gov/debrief/STS066/REP4.HTM (accessed 7/17/2013).
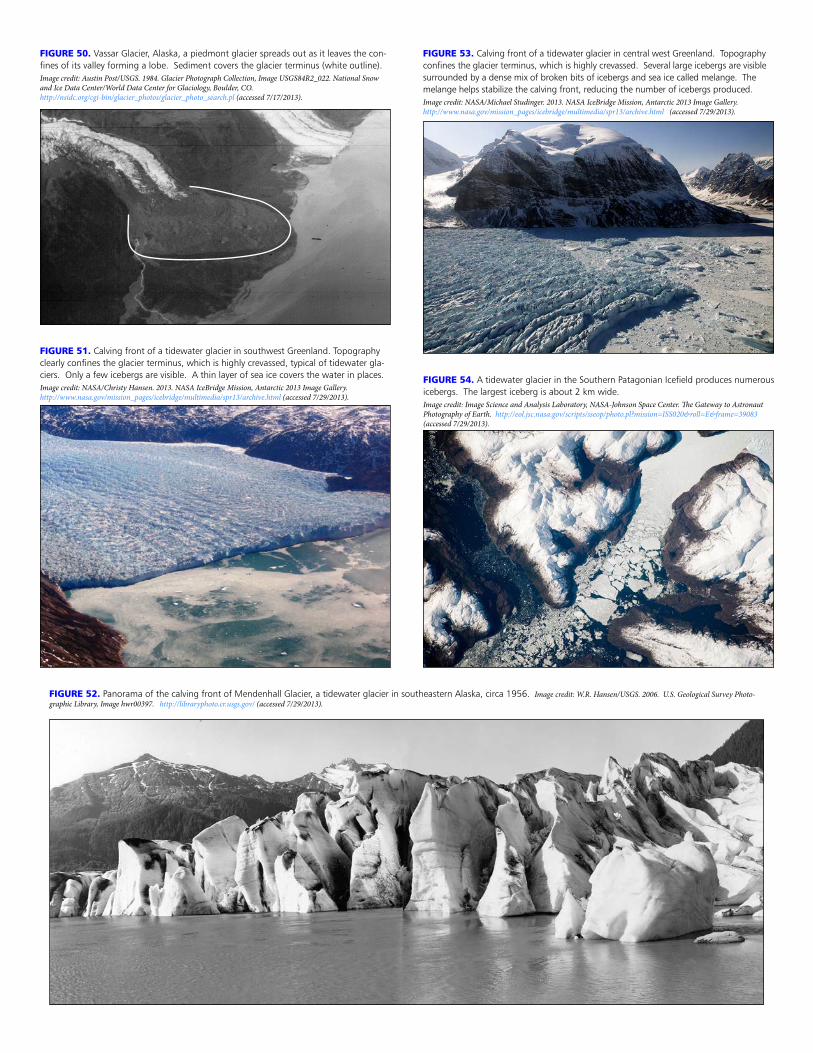
FIGURE 51. Calving front of a tidewater glacier in southwest Greenland. Topography clearly confines the glacier terminus, which is highly crevassed, typical of tidewater gla-ciers. Only a few icebergs are visible. A thin layer of sea ice covers the water in places.Image credit: NASA/Christy Hansen. 2013. NASA IceBridge Mission, Antarctic 2013 Image Gallery. http://www.nasa.gov/mission_pages/icebridge/multimedia/spr13/archive.html (accessed 7/29/2013).
FIGURE 53. Calving front of a tidewater glacier in central west Greenland. Topography confines the glacier terminus, which is highly crevassed. Several large icebergs are visible surrounded by a dense mix of broken bits of icebergs and sea ice called melange. The melange helps stabilize the calving front, reducing the number of icebergs produced.Image credit: NASA/Michael Studinger. 2013. NASA IceBridge Mission, Antarctic 2013 Image Gallery. http://www.nasa.gov/mission_pages/icebridge/multimedia/spr13/archive.html (accessed 7/29/2013).
FIGURE 54. A tidewater glacier in the Southern Patagonian Icefield produces numerous icebergs. The largest iceberg is about 2 km wide.Image credit: Image Science and Analysis Laboratory, NASA-Johnson Space Center. The Gateway to Astronaut Photography of Earth. http://eol.jsc.nasa.gov/scripts/sseop/photo.pl?mission=ISS020&roll=E&frame=39083 (accessed 7/29/2013).
FIGURE 52. Panorama of the calving front of Mendenhall Glacier, a tidewater glacier in southeastern Alaska, circa 1956. Image credit: W.R. Hansen/USGS. 2006. U.S. Geological Survey Photo-graphic Library, Image hwr00397. http://libraryphoto.cr.usgs.gov/ (accessed 7/29/2013).
FIGURE 50. Vassar Glacier, Alaska, a piedmont glacier spreads out as it leaves the con-fines of its valley forming a lobe. Sediment covers the glacier terminus (white outline).Image credit: Austin Post/USGS. 1984. Glacier Photograph Collection, Image USGS84R2_022. National Snow and Ice Data Center/World Data Center for Glaciology, Boulder, CO. http://nsidc.org/cgi-bin/glacier_photos/glacier_photo_search.pl (accessed 7/17/2013).
1. Benn, D.I. and D.J.A. Evans. 2010. Glaciers and Glaciation, 2nd ed. London: Hodder Education.2. Rau, F., F. Mauz, S. Vogt, S.J.S. Khalsa, and B. Raup. 2005. Illustrated GLIMS Classification Manual: Glacier Classification Guidance for the GLIMS Glacier Inventory. Freiburg, Germany: GLIMS
Regional Center “Antarctic Peninsula, Institut fur Physische Geographie.3. Martini, I.P., M.E. Brookfield, and S. Sadura. 2001. Principles of Glacial Geomorphology and Geology. Upper Saddle River, NJ: Prentice Hall.4. Hambrey, M. and J. Alean. 2004. Glaciers, 2nd ed. Cambridge: Cambridge University Press.5. Rignot, E., J. Mouginot, and B. Scheuchl. 2011. Ice flow of the Antarctic Ice Sheet. Science 333:1427-1430; doi: 10.1126/science.1208336.6. Joughin, I. et al. 2010. Greenland flow variability from ice-sheet-wide velocity mapping. Journal of Glaciology 56(197):415-430.7. Bennett, M.R. and N.F. Glasser. 2990. Glacial Geology: Ice Sheets and Landforms, 2nd ed. Chichester, West Sussex: Wiley-Blackwell.8. Pritchard, H.D., S.R.M. Ligtenberg, H.A. Fricker, D.G. Vaughan, M.R. van den Broeke, and L. Padman. 2012. Antarctic ice-sheet loss driven by basal melting of ice shelves. Nature 484(26):502-
505; doi:10.1038/nature10968.9. Cook, A.J. and D.G. Vaughan. 2010. Overview of areal changes of the ice shelves on the Antarctic Peninsula over the past 50 years. The Cryosphere 4:77-98; http://www.the-cryosphere.net/4/77/2010/
tc-4-77-2010.pdf.10. Kamb, B. 2001. Basal zone of the West Antarctic ice streams and its role in lubrication of their rapid motion, in The West Antarctic Ice Sheet: Behavior and Environment, Antarct. Res. Ser., vol. 77,
edited by R. B. Alley and R. A. Bindschadler, pp. 157–199, AGU, Washington, D. C. doi:10.1029/AR077p0157.11. Cuffey, K.M. and W.S.B. Paterson. 2010. The Physics of Glaciers. Oxford: Elsevier.12. Bamber, J.L. et al. 2006. East Antarctic ice stream tributary underlain by major sedimentary basin. Geology 34(1):33-36; doi: 10.1130/G22160.1.13. Studinger, M., R.E. Bell, D.D. Blankenship, C.A. Finn, R.A. Arko, D.L. Morse, and I. Joughin. 2001. Subglacial sediments: A regional geological template for ice flow in West Antarctica. Geophys-
ical Research Letters 28(18):3493-3496.14. Anandakrishnan, S., D.D. Blankenship, R.B. Alley, and P.L. Stoffa. 1998. Influence of suglacial geology on the position of a West Antarctic ice stream from seismic observations. Nature 394:62-65.15. Fretwell, P. and 59 others. 2013. Bedmap2: Improved ice bed, surface and thickness data sets for Antarctica. The Cryosphere 7:375-393; doi:10.5194/tc-7-375-2013. 16. Johnson, J.V. and J.W. Staiger. 2007. Modeling long-term stability of the Ferrar Glacier, East Antarctica: Implications for interpreting cosmogenic nuclide inheritance. Journal of Geophysical Research
112(F3); doi: 10.1029/2006JF000599. http://onlinelibrary.wiley.com/doi/10.1029/2006JF000599/full.17. Marsh, O.J., W. Rack, D. Floricioiu, N.R. Golledge, and W. Lawson. 2013. Tidally induced velocity variations of the Beardmore Glacier, Antarctica, and their representation in satellite measurement
of ice velocity. The Cryosphere 7:1375-1384. doi: 10.5194/tc-7-1375-2013. http://www.the-cryosphere.net/7/1375/2013/tc-7-1375-2013.pdf18. Favier, L., G. Durand, S.L. Cornford, G.H. Gudmundsson, O. Gagliardini, F. Gillet-Chaulet, T. Zwinger, A.J. Payne, and A.M. Le Brocq. 2014. Retreat of Pine Island Glacier controlled by marine ice-
sheet instability. Nature Climate Change 4:117-121; doi: 10.1038/nclimate2094.
Cover Images1. NPS/Jim Pfeiffenberger. 2013. Profile of Aialik Glacier. Kenai Fjords National Park Photo Gallery. http://www.nps.gov/akr/photosmultimedia/photogallery.htm?id=5A92139C-1DD8-B71C-078CD-
05F84A9AE80 (accessed 7/29/2013).2. B.K. Lucchitta/USGS Flagstaff Image Processing Facility. 2013. Byrd Glacier, Antarctica. http://www.glaciers.er.usgs.gov/gl_slide/ (accessed 7/29/2013). Published in: Swithinbank, C. (1988) Satellite
Image Atlas of Glaciers of the World: Antarctica. US Geological Survey Professional Paper 1386-B, Washington: United States Printing Office. Figure 23, p. B27. http://pubs.usgs.gov/pp/p1386b/.3. NASA/Jim Yungel. Nunataks in western Greenland. NASA IceBridge Mission, Antarctica 2013 Image Gallery. http://www.nasa.gov/mission_pages/icebridge/multimedia/spr13/archive.html (accessed 7/29/2013).4. Bruce F. Molnia/USGS. 2003. Alaskan Glaciers. Small valley glaciers, cirques and ridges, Chugach Mountains, Alaska. http://www.usgs.gov/features/glaciers2.html (accessed 7/29/2013).5. Don Becker/USGS. 2008. USGS Multimedia Gallery Photos. Photo #567, Alaska. http://gallery.usgs.gov/photos/567 (accessed 7/29/2013).6. NASA/Jim Ross. Antarctica’s Larsen Ice Shelf. NASA IceBridge Mission, Antarctica 2009 Image Gallery. http://www.nasa.gov/mission_pages/icebridge/multimedia/fall09/archive.html (accessed 7/29/2013).7. Ted Scambos/Ron Bauer/NSIDC. 2013. Antarctic Ice Sheet. National Snow and Ice Data Center Quick Facts on Ice Sheets, Boulder, CO. http://nsidc.org/cryosphere/quickfacts/icesheets.html (accessed 7/29/2013).
OTHER RESOURCES
REFERENCES
Resources specifically addressing the morphological classification of glaciers: Davies, B. Types of Glaciers. AntarcticGlaciers.org: Explaining the science of Antarctic Glaciology. http://www.antarcticglaciers.org/modern-glaciers/types-of-glacier/
(accessed 7/30/2013). NSIDC. 2013. All About Glaciers: What types of glaciers are there? National Snow and Ice Data Center, University of Colorado, Boulder. http://nsidc.
org/cryosphere/glaciers/questions/types.html (accessed 7/30/2013). Rau, F., F. Mauz, S. Vogt, S.J.S. Khalsa and B. Raup. 2005. Illustrated GLIMS Glacier Classification Manual, version 1.0. Global Land Ice Measurements from Space
(GLIMS) Regional Center “Antarctic Peninsula”, Institut für Physische Geographie, Albert-Ludwigs Universität, Freiburg, Germany, pp. 6-23. http://www.glims.org/MapsAndDocs/assets/ select file: GLIMS_Glacier-Classification-Manual_V1_2005-02-10.pdf (accessed 7/30/2013).
USGS. 2013. Glossary of Glacier Terminology: Types of Glaciers. http://pubs.usgs.gov/of/2004/1216/glaciertypes/glaciertypes.html (accessed 7/30/2013).
Resources addressing a wide range of glacier terminology, including different types of glaciers: Alean, J. and M. Hambrey. 2012. Photoglossary. Glaciers online, Swisseduc. http://www.swisseduc.ch/glaciers/glossary/ (accessed 7/30/2013). Davies, B. Glossary. AntarcticGlaciers.org: Explaining the science of Antarctic Glaciology. http://www.antarcticglaciers.org/students-3/glossary/ (accessed 7/30/2013). Lemke, K.A. 2010. Illustrated Glossary of Alpine Glacial Landforms. Virtual Geography Department Project, Physical Geography Working Group.
http://www4.uwsp.edu/geo/faculty/lemke/alpine_glacial_glossary/ (accessed 7/30/2013). Molnia, B.F. 2004. Glossary of Glacier Terminology. U.S. Geological Survey Open-File Report 2004-1216. http://pubs.usgs.gov/of/2004/1216/ (ac-
cessed 7/30/2103). NSIDC. 2013. Cryosphere Glossary. National Snow and Ice Data Center, University of Colorado, Boulder. http://nsidc.org/snow/glossary.html (accessed 7/30/2013). Scripps Glaciology Group. Cryosphere Glossary. Scripps Institution of Oceanography, University of California-San Diego.
http://glaciology.weebly.com/glossary.html (accessed 7/30/2013).