Embed Size (px)
Citation preview

MORPHOLOGY OF THE OLFACTORY APPARATUS IN LEPTOCEPHALUS
LARVAE
by
MOLLY ANN WIGHTMAN
B.S., Florida Institute of Technology
A thesis submitted to the Department of Biological Sciences of Florida Institute of
Technology in partial fulfillment of the requirements for the degree of
MASTER OF SCIENCE
in
BIOLOGICAL SCIENCE
Melbourne, Florida
July 2018

MORPHOLOGY OF THE OLFACTORY APPARATUS IN LEPTOCEPHALUS
LARVAE
A THESIS
By
MOLLY ANN WIGHTMAN
Approved as to style and content by:
Jonathan Shenker, Ph.D., Chairperson
Associate Professor
Department of Biological Sciences
Kelli Hunsucker, Ph.D., Member
Research Assistant Professor
Department of Ocean Engineering
and Sciences
Ralph Turingan, Ph.D., Member
Professor
Department of Biological Sciences
Richard Aronson, Ph.D.
Professor and Head
Department of Biological Science
July 2018

iii
ABSTRACT
MORPHOLOGY OF THE OLFACTORY APPARATUS IN LEPTOCEPHALUS
LARVAE
By Molly Ann Wightman, B.S., Florida Institute of Technology
Chairperson of Advisory Committee: Jonathan Shenker, Ph.D.
Leptocephalus larvae are a unique larval form that unites the Elopomorph
fishes. This larval form has morphological and cellular characteristics that differ
from most other teleost fishes. The visual system of leptocephali rod-dominated
retinas, leading to poor photopic vision and low visual acuity that would hinder
feeding on planktonic prey. Recent studies indicate they feed marine snow, which
is composed of mucilaginous materials, bacteria and plankton. Their low visual
acuity raises the question of how these organisms find this gelatinous food source
in the wild. I hypothesize that these larval fishes use chemoreception in order to
find marine snow, and that their olfactory apparatus thus differs morphologically
from other teleost fishes.
A variety of settlement-stage pelagic larvae were collected from Sebastian
Inlet State Park in Florida and Andros Island, Bahamas. Leptocephalus larvae were
represented by tarpon (Megalops atlanticus), ladyfish (Elops saurus), bonefish

iv
(Albula vulpes), and speckled worm eels (Myrophis punctatus). Three species with
non-leptocephalus larvae were examined: Atlantic menhaden (Brevoortia
tyrannus), Atlantic croaker (Micropogonias undulatus), and pinfish (Lagodon
rhomboides). Their external olfactory and visual systems were analyzed using
Scanning Electron Microscopy. Morphometric data were collected and compared
to make comparisons between larval types regarding the dimensions and structures
of these sensory organs. Developmental differences were also observed by
comparing SEM images of larval and juvenile fishes.
Three out of the four species of leptocephalus larvae had large, exposed
olfactory pits, while speckled worm eels and all non-leptocephalus larvae had their
olfactory apparatus embedded under the skin of the head, with distinct anterior and
posterior nostrils. Although there was no consistent difference among the groups in
dimensions of the olfactory apparatus, eye size, or ratio between the sensory
organs, the open olfactory pits of tarpon, ladyfish and bonefish larvae would
directly expose sensory cells to chemical signals from marine snow. The enclosed
olfactory apparatus of the non-leptocephalus species develops during
embryogenesis, suggesting that exposed olfactory surfaces are not as important as
vision in detecting motile plankton prey. Speckled worm eel larvae entering the
estuary had already developed closed olfactory pits and nostrils, presumably in
preparation for their rapid assumption of a life style where they bury in sediments
during the day. Bonefish and ladyfish showed a similar development of closed
olfactory pits and nostrils after metamorphosis within the estuarine habitat.

v
Studies of receptor densities, olfactory organ ontogeny, and testing the
olfactory sensitivity of live larvae could help to further understand the life history
of the Elopomorph fishes, and help with continued conservation and aquaculture
efforts.

vi
TABLE OF CONTENTS
Page
ABSTRACT . . . . . . . . . . . . . . . . . . . . . . . . . . . . . . . . . . . . . . . . . . . . . . . . . . .
iii
TABLE OF CONTENTS . . . . . . . . . . . . . . . . . . . . . . . . . . . . . . . . . . . . . . . . .
vi
LIST OF FIGURES . . . . . . . . . . . . . . . . . . . . . . . . . . . . . . . . . . . . . . . . . . . . .
viii
LIST OF TABLES . . . . . . . . . . . . . . . . . . . . . . . . . . . . . . . . . . . . . . . . . . . . . .
xi
ACKNOWLEDGEMENTS . . . . . . . . . . . . . . . . . . . . . . . . . . . . . . . . . . . . . . .
xii
DEDICATION . . . . . . . . . . . . . . . . . . . . . . . . . . . . . . . . . . . . . . . . . . . . . . . . .
xiii
INTRODUCTION . . . . . . . . . . . . . . . . . . . . . . . . . . . . . . . . . . . . . . . . . . . . . .
1
LEPTOCEPHALUS LARVAE . . . . . . . . . . . . . . . . . . . . . . . . . . . . . . . . . .
4
CHEMORECEPTION . . . . . . . . . . . . . . . . . . . . . . . . . . . . . . . . . . . . . . . . .
9
OLFACTION IN FISH . . . . . . . . . . . . . . . . . . . . . . . . . . . . . . . . . . . . . . . .
11
RATIONALE AND HYPOTHESIS . . . . . . . . . . . . . . . . . . . . . . . . . . . . . .
14
MATERIALS AND METHODS . . . . . . . . . . . . . . . . . . . . . . . . . . . . . . . . . . .
15
SAMPLE COLLECTION AND IDENTIFICATION . . . . . . . . . . . . . . . . .
15
EXTERNAL ASSESSMENT . . . . . . . . . . . . . . . . . . . . . . . . . . . . . . . . . . .
17
VISUAL ASSESSMENT . . . . . . . . . . . . . . . . . . . . . . . . . . . . . . . . . . . .
17
SCANNING ELECTRON MICROSCOPY . . . . . . . . . . . . . . . . . . . . . .
18
DATA COLLECTION AND ANALYSIS . . . . . . . . . . . . . . . . . . . . . . . . .
20
RESULTS . . . . . . . . . . . . . . . . . . . . . . . . . . . . . . . . . . . . . . . . . . . . . . . . . . . . .
22
MORPHOLOGY OF THE EYE AND OLFACTORY ORGANS. . . . . . . .
28
STANDARDIZATION WITH STANDARD LENGTH . . . . . . . . . . . . . . 32

vii
PRE/POST METAMORPHIC ELOPOMORPHS . . . . . . . . . . . . . . . . . . . .
35
DISCUSSION . . . . . . . . . . . . . . . . . . . . . . . . . . . . . . . . . . . . . . . . . . . . . . . . . .
38
LITERATURE CITED . . . . . . . . . . . . . . . . . . . . . . . . . . . . . . . . . . . . . . . . . . .
50

viii
LIST OF FIGURES
Page
Figure 1
Chart of larval fish development (Northern anchovy, Engraulis
mordax) from end of yolk-sac stage to juvenile stage (Moser and
Watson, 2006) . . . . . . . . . . . . . . . . . . . . . . . . . . . . . . . . . . . . . . . . .
2
Figure 2
Picture of various distinctive features in leptocephalus larvae
(Anibaldi et. al, 2016) . . . . . . . . . . . . . . . . . . . . . . . . . . . . . . . . . . .
6
Figure 3
Images of opsin immunohistochemistry of the retinas of ladyfish
(A,C,E) and bonefish (B,D,F). 1 = dorsal; 2 = central; 3 = ventral
retina regions. Antirod (magenta) and anticone (green,
arrowheads) fluorescent stains show the distribution of rods and
cones in the retinas of each species (Taylor et al. 2015) . . . . . . . . .
7
Figure 4
Schematic diagram of olfaction molecular mechanism (Buck and
Axel, 1991) . . . . . . . . . . . . . . . . . . . . . . . . . . . . . . . . . . . . . . . . . . . .
10
Figure 5
Schematic diagram of general morphology of fish olfactory area
(Kasumyan, 2004) . . . . . . . . . . . . . . . . . . . . . . . . . . . . . . . . . . . . . .
12
Figure 6
Imagery and drawings of various differences in morphology of
fish olfactory area (a) Photo of preserved male anglerfish
(Lophiiformes); (b) Electron micrograph from a goldfish
(Carrasius auratus); (c) Electron micrograph from European eel
(Anguilla anguilla); (ii) all drawings of rosette and lamellae for
each corresponding species above (Cox, 2008) . . . . . . . . . . . . . . . .
13
Figure 7
Images of morphometrics taken from an Atlantic menhaden
(Brevoortia tyrannus) using Scandium program. (1) Total
olfactory area; (2) Eye major and minor axis, posterier nostril
major and minor axis, and anterior nostril major and minor axis
(left to right); (3) Total eye area, posterior nostril area, anterior
nostril area (left to right) . . . . . . . . . . . . . . . . . . . . . . . . . . . . . . . . .
21
Figure 8
Scanning Electron Micrograph image of an Atlantic croaker
(Micropogonias undulatus) larva. Magnification = 50x. E = eye;
A = Anterior nostril; P = Posterior nostril . . . . . . . . . . . . . . . . . . . .
24

ix
Figure 9 Scanning Electron Micrograph image of an Atlantic menhaden
(Brevoorita tyrannus) larva. Magnification = 50x. E = eye; A =
Anterior nostril; P = Posterior nostril . . . . . . . . . . . . . . . . . . . . . . . .
24
Figure 10
Scanning Electron Micrograph image of a Pinfish (Lagodon
rhomboides) larva. Magnification = 50x. E = eye; A = Anterior
nostril; P = Posterior nostril . . . . . . . . . . . . . . . . . . . . . . . . . . . . . . .
25
Figure 11
Scanning Electron Micrograph image of a Speckled worm eel
(Myrophis punctatus) larva. Magnification = 50x. E = eye; A =
Anterior nostril; P = Posterior nostril . . . . . . . . . . . . . . . . . . . . . . . .
25
Figure 12
Scanning Electron Micrograph image of a Ladyfish (Elops saurus)
larva. Magnification = 50x. E = eye; Olf = olfactory pit . . . . . . . .
26
Figure 13
Scanning Electron Micrograph image of a Bonefish (Albula
vulpes) larva. Magnification = 50x. E = eye; Olf = olfactory pit . .
26
Figure 14
Scanning Electron Micrograph image of a Tarpon (Megalops
atlanticus) larva. Magnification = 50x. E = eye; Olf = olfactory
pit . . . . . . . . . . . . . . . . . . . . . . . . . . . . . . . . . . . . . . . . . . . . . . . . . . .
27
Figure 15
Mean eye area per species (+/- S.D.). Blue = Leptocephalus
larvae; Orange = Non- leptocephalus larvae . . . . . . . . . . . . . . . . . .
28
Figure 16
Mean olfactory area per species (+/- S.D.). Blue = Leptocephalus
larvae; Orange = Non- leptocephalus larvae . . . . . . . . . . . . . . . . . .
29
Figure 17
Mean (+/- S.D.) ratio of average olfactory area/average eye area in
each species; Blue = leptocephalus larvae; Orange = Non-
leptocephalus larvae . . . . . . . . . . . . . . . . . . . . . . . . . . . . . . . . . . . . .
30
Figure 18
Mean (+/- S.D.) of standardized eye diameter (% of SL); Blue =
Leptocephalus larvae; Orange = Non- leptocephalus larvae . . . . . .
33
Figure 19
Mean (+/- S.D.) of standardized olfactory pit length (% of SL);
Blue = Leptocephalus larvae; Orange = Non- leptocephalus larvae
. . . . . . . . . . . . . . . . . . . . . . . . . . . . . . . . . . . . . . . . . . . . . . . . . . . . . .
34
Figure 20
Scanning Electron Micrograph image of a juvenile bonefish at
20x. SL = 40mm . . . . . . . . . . . . . . . . . . . . . . . . . . . . . . . . . . . . . . . .
36

x
Figure 21 Scanning Electron Micrograph image of a juvenile ladyfish at 20x.
SL = 61mm . . . . . . . . . . . . . . . . . . . . . . . . . . . . . . . . . . . . . . . . . . . .
36
Figure 22
Scanning Electron Micrograph image of a juvenile pinfish at 20x.
SL = 34mm . . . . . . . . . . . . . . . . . . . . . . . . . . . . . . . . . . . . . . . . . . . .
37
Figure 23
Image of Muraenesox cinereus consuming squid paste (Mochioka
et. al, 1993) . . . . . . . . . . . . . . . . . . . . . . . . . . . . . . . . . . . . . . . . . . . .
39
Figure 24
Comparison of head versus body size of a leptocephalus larva
versus a larval pinfish . . . . . . . . . . . . . . . . . . . . . . . . . . . . . . . . . . . .
43
Figure 25
Image of various olfactory rosette types (Kasumyan, 2004) . . . . . .
46
Figure 26
(A) Scanning Electron Micrograph image of a juvenile Bonefish at
20x; (B) Scanning Electron Micrograph image of the olfactory
apparatus at 75x; SL = 40mm . . . . . . . . . . . . . . . . . . . . . . . . . . . . .
47
Figure 27
(A) Scanning Electron Micrograph image of a juvenile Ladyfish at
20x; (B) Scanning Electron Micrograph image of the olfactory
apparatus at 75x; SL = 61mm . . . . . . . . . . . . . . . . . . . . . . . . . . . . .
48

xi
LIST OF TABLES
Page
Table 1
Summary of settlement-stage larval fishes examined in this
study . . . . . . . . . . . . . . . . . . . . . . . . . . . . . . . . . . . . . . . . . . . . . . .
23
Table 2
Matrix showing the results of the KW multiple comparison tests
for total eye and olfactory areas. ** = significant at p<0.05. NS
= not significant . . . . . . . . . . . . . . . . . . . . . . . . . . . . . . . . . . . . . . .
31

xii
ACKNOWLEDGEMENTS
I would like to thank my academic advisor, Dr. Jon Shenker for his
guidance and support throughout my master’s program. I would like to thank my
remaining committee members, Dr. Turingan, Dr. Hunsucker, and Dr. Webbe for
their patience and support. I am so grateful for my friends and labmates, Jake
Rennert, Tony Cianciotto, Alex Gering, Jamie Kelly, Mason Thurman, Louis
Penrod, and James King, who helped with all the sample collections and sorting.
This project would not have been possible without the help and patience of
Gayle Duncombe, who taught me all about various microscopy techniques crucial
to this project. Thank you to Dee Dee for always keeping me on track and
providing constant support. I would also like to thank Dr. Miller for his help and
guidance with statistics, as well as Dr. Liz Wallace for providing the some of the
samples for this study.
Lastly, I would like to thank my family, who have supported me and
cheered me on throughout the entire process.

xiii
DEDICATION
I would like to dedicate this to my parents. I love you both so much.

1
INTRODUCTION
Many fish species have pelagic larvae that are called ichthyoplankton
because they are relatively weak swimmers that are dispersed throughout the water
column and transported by currents. The physical and ecological attributes of this
pelagic environment influenced the evolution of larval morphology, behavior and
physiology to enable larvae to find and ingest food, detect and avoid predators, and
locate appropriate nursery habitats upon the completion of larval development.
Larvae not only had to evolve within the constraints of the pelagic realm, but they
had to retain the capability to undergo an extensive series of ontogenetic changes to
metamorphose into older life stages in varying habitats (Moser and Watson, 2006).
Early larvae of many species rely on endogenous nutrients contained within
the remnants of their yolk sac, then transition to capturing food from the
surrounding environment. This transition requires development of a functional gut
and jaws and associated morphological changes in musculature, fins, and other
organ systems (Figure 1). An increase in motility throughout larval development
enhances prey capture and predator avoidance abilities. Congruent development of
sensory systems is also crucial to their survival at the larval stage (Moser and
Watson, 2006).

2
Figure 1: Chart of larval fish development (Northern anchovy, Engraulis mordax)
from end of yolk-sac stage to juvenile stage (Moser and Watson, 2006).
Most teleost fish larvae have very rudimentary sensory systems at hatching
that quickly develop, enabling fish to begin detecting prey by the time they absorb
the last of their yolk reserves (Figure 1). The three main sensory systems that begin
development during this stage include mechanoreception, vision, and smell (Moser
and Watson, 2006).
Mechanoreception is a crucial sensory system that enable fish to detect
vibration in the water. Specialized hair cells called neuromasts are the foundation

3
for the development of the lateral line system in fish. As these mechanoreceptors
are disturbed by pressure changes in the water, a signal is sent to the brain allowing
the organism to detect movements and changes in water patterns around them
(Moser and Watson, 2006). These changes can alert them to predators or prey
nearby. At the larval stage, these neuromasts are typically exposed on the surface of
the skin and increase in abundance through early larval development. During the
later larval period, neuromasts are encased within developing subdermal canals on
the side of the body creating the lateral line system (Figure 1). This system enables
detection of predators and mobile prey, but not for locating passive food sources
that do not create physical disturbance in the water (Moser and Watson, 2006).
Vision or photoreception is another important sensory system used in the
marine environment. Vision is the process of the eyes taking in a variety of
wavelengths of light and creating an image of the environment around an organism.
This visual system is driven by specialized photoreceptor cells, which are housed in
the posterior part of the retina. These photoreceptors fall into 2 main categories:
rods and cones. Rods are extremely sensitive to light stimuli, and therefore are able
to help organisms see in very low light level conditions, enabling nighttime
(scotopic) vision. Cones are less sensitive, needing more light to activate them,
leading to photopic (daytime) vision (Pankhurst, 1994; Moser and Watson, 2006).
These cones are more densely arranged in the retina, allowing higher visual acuity,
and are sensitive to different wavelengths of light that enable an organism to
perceive color. In teleost fishes, development of the funtional visual system

4
typically occurs by the end of the yolk-sac stage, with retinas being densely packed
with cone photoreceptors, providing larvae with the high visual acuity needed to
detect and consume planktonic prey. Rod photoreceptors tend to develop later in
larval or juvenile stages, when the need to navigate environments in lower light is
higher (Pankhurst, 1994; Moser and Watson, 2006).
Olfaction or sense of smell is a third sensory modality important to fishes
and other organisms. Specialized chemoreceptors detect different chemical cues in
the environment, and send signals to the brain for processing (Buck and Axel,
1991). These odorants can have important effects on the behaviors of an organisms,
including identifying conspecifics, detecting chemical attributes of spawning and
nursery habitats, and sensing the presence of food and predators. (Døving, 1985;
Kasumyan, 2004).
LEPTOCEPHALUS LARVAE
Most studies dealing with larval development of teleost (bony) fishes and
ontogenetic changes in sensory systems focus on the superorder of spiny-rayed
fishes known as Acanthopterygii. This superorder, containing 13 orders and
approximately 15,000 species is considered to be the most evolutionarily derived
lineage within the teleosts (Nelson, 2006). The Elopomorpha is an older
superorder, with a lineage dating back to the Jurassic period (Nelson 2006; Chen et
al. 2014). Although the Elopomorpha consists of morphologically diverse fishes,
their unusual leptocephalus (“slender head”) larvae are a synapomorphy that helps

5
define the superorder. This larval group is seen to be vastly different
morphologically from those in the superorder Acanthopterygii or any other teleosts
(Nelson, 2006).
The Elopomorpha include widely divergent adult forms including eels
(Anguilliformes), ladyfish and tarpon (Elopiformes), bonefish (Albuliformes), and
spiny eels (Notacanthiformes). Approximately 1000 extant species are currently
known (Chen et al. 2014). The leptocephalus larvae of all of these group share
unique characteristics including a laterally-compressed transparent body composed
largely of acellular glycosaminoglycan (GAG) compounds (Miller, 2009), forward-
pointing teeth, and a tubular gut (Figure 2). Each species can be differentiated
through differences in overall body, head, and fin shape, gut length and
morphology, pigmentation, and the number of muscle segments (myomeres).
Larvae of many coastal species have long developmental times, ranging from a
mean of 22 days from hatching to metamorphosis in tarpon (Shenker et al. 2002),
55 days in bonefish (Mojica et al. 1995) and up to 200 days in American eels
(Wang and Tzeng, 2000), enabling long distance transport along continental
shelves and pelagic areas by ocean currents (Miller, 2009). Deep sea taxa are
commonly found at depths of 1000-5000 meters or more below the ocean surface
(Sutton et al., 2010), but little is known about their biology and development.

6
Figure 2: Picture of various distinctive features in leptocephalus larvae (Anibaldi
et. al, 2016).
Along with their unique body morphology, leptocephali can be
distinguished from Acanthopterygii larvae by their retinal structure. As previously
stated, most teleost fishes have cone-dominated retinas at the larval stage, with rods
developing closer to the juvenile stage (Moser and Watson, 2006). However, initial
retinal structure and ontogeny is different in leptocephalus larvae. Taylor et. al
(2011, 2015) examined the visual systems of four species of larval Elopomorphs:
tarpon (Megalops atlanticus), bonefish (Albula vulpes), ladyfish (Elops saurus),
and speckled worm eels (Myrophis punctatus). This study showed that these larvae
initially had rod dominated retinas, suggesting that their visual system was adapted
for scotopic/nighttime vision, with low visual acuity and poor daytime vision
(Figure 3 ).

7
Figure 3: Images of opsin immunohistochemistry of the retinas of ladyfish (A,C,E)
and bonefish (B,D,F). 1 = dorsal; 2 = central; 3 = ventral retina regions. Antirod
(magenta) and anticone (green, arrowheads) fluorescent stains show the distribution
of rods and cones in the retinas of each species (Taylor et al. 2015).
Cones developed late in the larval period in these leptocephali. The number
and proportion of rods and cones changed through ontogeny, resulting in
development of photopic vision to accompany the scotopic vision (Taylor et. al,
2011:2015). This low visual acuity seen in leptocephalus larvae leads to the
question of how these animals find and consume food in the wild at this crucial
lifestage.

8
The feeding habits of leptocephalus larvae have long been a source of
controversy. Identifiable prey items are not found in their guts, and their forward-
pointing fang-like teeth are unlike those of other fish larvae, suggesting that these
larvae do not capture and consume individual planktonic organisms. Recent
studies have explored the carbon and nitrogen isotope ratios of these animals and
suggest that leptocephali feed on a diet of gelatinous materials such as marine snow
(Miller, 2009; Miller et. al, 2013). Marine snow are mucilaginous aggregates that
can include forms of detritius, inorganic materials, and various living organisms
such as bacteria or phytoplankton. These aggregates can be created by mucus-
based materials such as discarded larvacean houses and pteropod webs that collect
various particles as they slowly fall through the water column. Because marine
snow is able to support communities of bacteria and phytoplankton, it is an
important site for nutrient recycling and production, making the marine snow a
very nutricious food source for many organisms, including a variety of zooplankton
and deep sea creatures (Alldredge and Silver, 1988).
Marine snow and gelatinous material in the plankton are generally
transparent, which raise the question of how leptocephali with low visual acuity are
able to locate food in pelagic environments. Based on their reliance on diffuse
gelatinous food sources and and their retinal structure not being adapted for
detecting transparent food, I hypothesize that chemoreception provides
leptocephali with the ability to find and consume these gelatinous food sources.

9
CHEMORECEPTION
Chemoreception is the ability for animals to obtain information from
chemical stimuli in the environment. Olfaction, or smell, is one crucial form of
chemoreception that can help animals perceive their environment and affect their
behavior. Odorant chemical stimuli in the environment impact a wide variety of
fish behaviors, including identification of conspecific/prey/predator species,
schooling behavior, migration, reproduction, defense mechanisms, and
locating/orienting within habitats (Døving, 1985; Hara, 1986; Kasumyan, 2004;
Sola et. al, 1993).
Among the most intensively studied behaviors influenced by olfaction are
migration and homing. Many species of salmon (Salmonidae) undergo ocean-wide
migrations, returning to their natal stream to spawn, often dying after reproducing.
Various studies have shown that newly-hatched juvenile salmon imprint on stream-
specific chemical stimuli, and use that olfactory signal to enter the same stream
several years later to spawn (Cooper et. al, 1976; Graves et al 1968; Stabell, 1984).
In contrast with salmon who use olfaction to guide migration for
reproduction, juvenile clownfish (Pomacentridae: Amphiprionae) frequently return
to their natal range after a brief 9-12 day larval duration period. Jones et. al (2005)
showed that one-third clownfish juveniles returned back to a natal area within a 2
hectare distance, with most settling less than 100 meters from their nest site (Jones
et. al, 2005). Researchers believe that chemical cues are an important aspect in this
10
ability for coral-reef fishes to return to their natal area and locate suitable habitat
(Jones, 2005; Leis et. al, 2011; Gerlach and Artema, 2012).
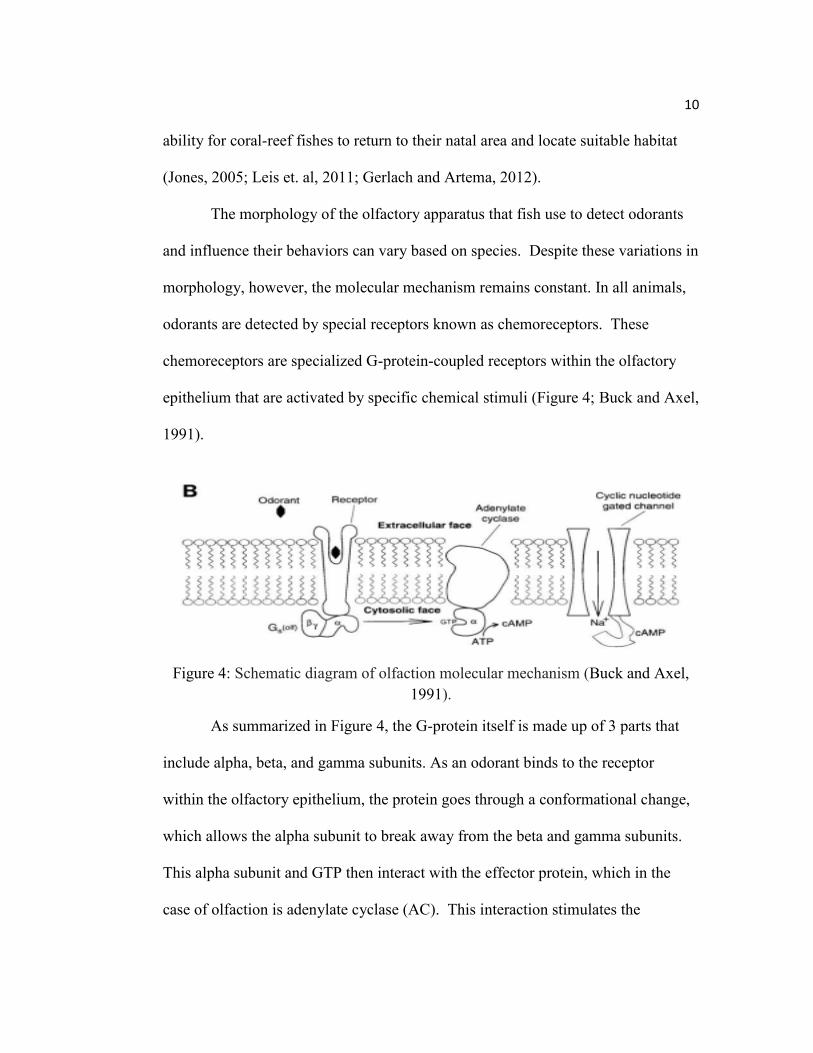
The morphology of the olfactory apparatus that fish use to detect odorants
and influence their behaviors can vary based on species. Despite these variations in
morphology, however, the molecular mechanism remains constant. In all animals,
odorants are detected by special receptors known as chemoreceptors. These
chemoreceptors are specialized G-protein-coupled receptors within the olfactory
epithelium that are activated by specific chemical stimuli (Figure 4; Buck and Axel,
1991).
Figure 4: Schematic diagram of olfaction molecular mechanism (Buck and Axel,
1991).
As summarized in Figure 4, the G-protein itself is made up of 3 parts that
include alpha, beta, and gamma subunits. As an odorant binds to the receptor
within the olfactory epithelium, the protein goes through a conformational change,
which allows the alpha subunit to break away from the beta and gamma subunits.
This alpha subunit and GTP then interact with the effector protein, which in the
case of olfaction is adenylate cyclase (AC). This interaction stimulates the

11
adenylate cyclase, which elevates levels of cyclic AMP (cAMP). The build-up of
cAMP in the cell opens a cyclic nucleotide gated channel and allowing ions such as
sodium or calcium to flood into the cell (Buck and Axel, 1991). This flood of ions
depolarizes the cell creating an action potential, which is passed along the olfactory
receptor neurons to a glomerulus within the olfactory bulb. This glomerulus
structure is a destination for multiple olfactory sensory cells to come together, and
then pass the signal along to mitral or tufted cells, which take information to the
brain for processing (Schoppa and Westbrook, 2001).
It was hypothesized by Buck and Axel (1991) that the olfactory system was
made up of thousands of different odorant receptors. Kajiya et. al (2001) tested this
hypothesis and examined if these olfactory receptors may overlap on the types of
odorants they can recognize. Through cloning of particular receptors, they
examined a variety of odorants including EG (Eugenol), EV (ethyl vanillin), and
vanillin to obtain concentration data and intensity rates on different receptors. Their
results showed that different receptors can detect overlapping odorants based on
concentrations and change in molecular structure of the odorant. Through this
research it was possible to see how different odorants are differentiated at a
molecular level (Kajiya et. al, 2001).
OLFACTION IN FISH
The most important element in the mechanism of olfaction are the
chemoreceptors. Without the stimulation of the receptors by an odorant, an action

12
potential cannot be created, and the stimuli cannot be changed into a form that can
be processed by the brain. As with all vertebrate species, these receptors are
contained within the olfactory epithelium.
Basic imaging of fish olfactory area shows that generally fish have an
anterior and posterior nostril (Figure 5). The placement and distance apart of these
nostrils, are unique for various species, however they are usually located between
the eyes and snout of the fish. Water carrying odorants is brought in through the
anterior nostril and down into the olfactory cavity or pit and back out through the
posterior nostril.
Figure 5: Schematic diagram of general morphology of fish olfactory area
(Kasumyan, 2004).
As water moves through this olfactory pit, it is carried acorss the olfactory
epithelium. The olfactory epithelium is specialized tissue that contains
chemoreceptors to which odorants can bind. This specialized tissue containing
receptor cells is folded into structures called lamellae, which arise from the bottom

13
of the pit and increase surface area within the pit. These lamellae then can come
together forming a leaf-like structure called a rosette (Cox, 2008; Kasumyan,
2004). These rosette structures vary in shape, size, and number of folds or lamellae
depending on species (Figure 6).
Figure 6: Imagery and drawings of various differences in morphology of fish
olfactory area (a) Photo of preserved male anglerfish (Lophiiformes); (b) Electron
micrograph from a goldfish (Carrasius auratus); (c) Electron micrograph from
European eel (Anguilla anguilla) ; (ii) all drawings of rosette and lamellae for each
corresponding species above (Cox, 2008).
The development of these structures typically starts within a teleost fish
embryo just a few days after fertilization. During the embryonic period, placodes
on each side of the head start to elongate and increase in size. As this growth
continues, the placodes invaginate and form the olfactory pit. As development of
the organism continues, this structure will migrate to a place on the head that varies
depending on species. Shortly after hatching, the anterior and posterior nostrils
begin to open into the olfactory pit and expose the lamellae created during the

14
embryonic stage. As the fish begins the larval stage and continues to grow, the
number and size of lamellae continue to increase, allowing various chemoreceptor
types to develop (Noakes and Godin, 1988).
RATIONALE AND HYPOTHESIS
Leptocephalus larvae unite a group consisting of popular sportfish and eels.
As juveniles and adults, this group of fishes are important recreationally. For
example, bonefish are a vital fishery in south Florida, contributing about 47 million
dollars alone in 2009 (Fedler, 2009). Along with recreational importance, eels have
a high level of commercial importance, and are a popular food source in many
countries around the world. These different species are crucial to many different
markets, and have prompted establishment of fishery regulations in many regions.
There is great interest in the development of aquaculture operations and produce
fish for the consumptive market (Tanaka et. al, 2001; Kagawa et. al, 2005; Lago et.
al, 2012). Despite this interest, one of the main problems for culturing the species
is determining successful strategies for feeding leptocephalus larvae.
The unique leptocephalus larval stages have low visual acuity, yet they are
able to navigate their environment and find gelatinous food sources. Determining
if they have an olfactory capability to find food will help understand the ontogeny,
feeding ecology and behavioral characteristics of these larvae. It will further help
determine suitable feeding strategies for animals grown in aquaculture systems

15
devoted to producing food fish (eels) or for stock enhancement (bonefish and
tarpon).
The overall goal of this study is to determine if chemoreception is a possible
mechanism by which leptocephalus larvae can locate food in the wild. In order to
achieve this, morphology of the olfactory system in leptocephalus larvae and other
teleost larvae representatives will be characterized and compared. A variety of
microscopy and histology techniques will be used to test the hypotheses:
H1: The olfactory apparatus of leptocephalus larvae is morphologically
different from other larval teleost fishes.
MATERIALS AND METHODS
SAMPLE COLLECTION AND IDENTIFICATION
The goal of this study is to compare leptocephalus larvae (tarpon, bonefish,
eel, and ladyfish) with examples of other teleost fishes. For this comparison,
samples of larvae were obtained from a variety of sources. I collected a diverse
array of larvae by using a plankton net at Sebastian Inlet State Park in Florida
during the months of October 2017 and February 2018. The plankton net was
attached to the catwalk on the north side of the park and left floating in the water
from 5-15 minutes during the incoming tide. A collection cup at the cod end of the
net was used to collect any larvae washed into the net. After net retrieval, fish
larvae were sorted from the other plankton and preserved in vials containing 10%

16
formalin in seawater. All samples were then brought back to the laboratory for
further sorting and species identification.
In addition to obtaining samples from Sebastian Inlet, bonefish leptocephali
were collected in late winter 2015 as they moved from the pelagic environment of
the Tongue of the Ocean toward their juvenile nursery habitats in their way into
the labyrinthine maze of creeks on South Andros Island, Bahamas. Staff from the
Forfar Field Station collected the larvae in a plankton net moored at the mouth of a
creek, preserved the larvae 70% ethanol in seawater, and sent the samples to Dr.
Elizabeth Wallace at the Florida Fish and Wildlife Research Institute for genetic
analysis. After confirming their identity as Albula vulpes, and not other species
within the genus, Dr. Wallace provided 12 specimens for my analysis.
All leptocephalus larvae were identified on the basis of caudal fin structure,
dorsal and anal fin placement and seasonality of collection. Round caudal fins
indicated that the leptocephali were eels, while forked caudal fins designated the
larvae as either bonefish, tarpon or ladyfish. Further identification to species was
accomplished using morphological traits defined by Smith (1989).
Leptocephali in the February samples were dominated by speckled worm
eels (Myrophis punctatus) and ladyfish (Elops saurus). The October samples also
contained Atlantic tarpon (Megalops atlanticus).
After all leptocephalus specimens were sorted from the Sebastian Inlet
samples, remaining larvae were sorted and identified for selection of teleost species
to be used for comparison with the leptocephali. Richards (2005) was used for

17
identification of these larvae. Three taxa dominated the non-leptocephalus larvae
in the collection, and were thus selected for analysis. Atlantic menhaden
(Brevoorita tyrannus) are planktivorous fishes that are members of the
Clupeomorpha, an early teleost superorder. Two species are members of the more
recently-evolved Acanthopterygii: Micropogonias undulatus (Atlantic croaker)
and Lagodon rhomboides (pinfish). Overall, this study thus used 4 different species
to represent leptocephalus larvae and 3 to represent other teleost fishes.
EXTERNAL ASSESSMENT
Once specimens were obtained for each species, an external assessment of
the olfactory region was completed using light microscopy and scanning electron
microscopy (SEM).
VISUAL ASSESSMENT
After sample processing, an initial visual assessment was conducted for
each species using light microscopy (Olympus CX31). Two larvae from each
species were randomly chosen and photos of the head region were taken. This
allowed for an initial assessment of the gross morphology of the fish without any
type of imaging enhancement. These photos were not used for data collection or
analysis, but instead were used as a guide to help develop and assess the quality of
the scanning electron microscopy (SEM) preparations.

18
SCANNING ELECTRON MICROSCOPY
After these initial visual microscopy images were taken, another 14 larvae
per species were chosen at random for morphometric analysis of the external
olfactory apparatus via SEM. The process for obtaining these data included 6
steps: (1) Measuring standard length (2) Dehydrating sample, (3) Critical point
drying, (4) Gold sputter coating, (5) SEM, and (6) Morphometric analysis. Before
the start of this process, standard length (SL, from the tip of the notochord to the
end of the caudal peduncle) was recorded, prior to any potential damage or
shrinkage that could occur during the drying process. SL data were not available
for bonefish larvae because their bodies had been removed for tissue for DNA
identification of species; lengths of a subset of larvae taken from this Andros Island
collection ranged from 42-63mm SL (mean = 54mm SL).
Extensive trials were performed on additional larvae to determine optimal
specimen preparation procedures for use with the leptocephali and other larvae.
Presented here are the steps found to provide suitable specimens for analysis.
Specimen dehydration involved soaking samples in a series of dehydrating
solutions: 20%, 50%, 75%, 90%, and 100% ethanol for 60 minutes each.
Following the ethanol series, the samples were then immersed in an intermediate
fluid containing 50% ethanol and 50% amyl acetate for 60 minutes, before the final
step which had the samples soak in 100% amyl acetate overnight. This process
allowed for the slow replacement of water in the samples with amyl acetate.
19
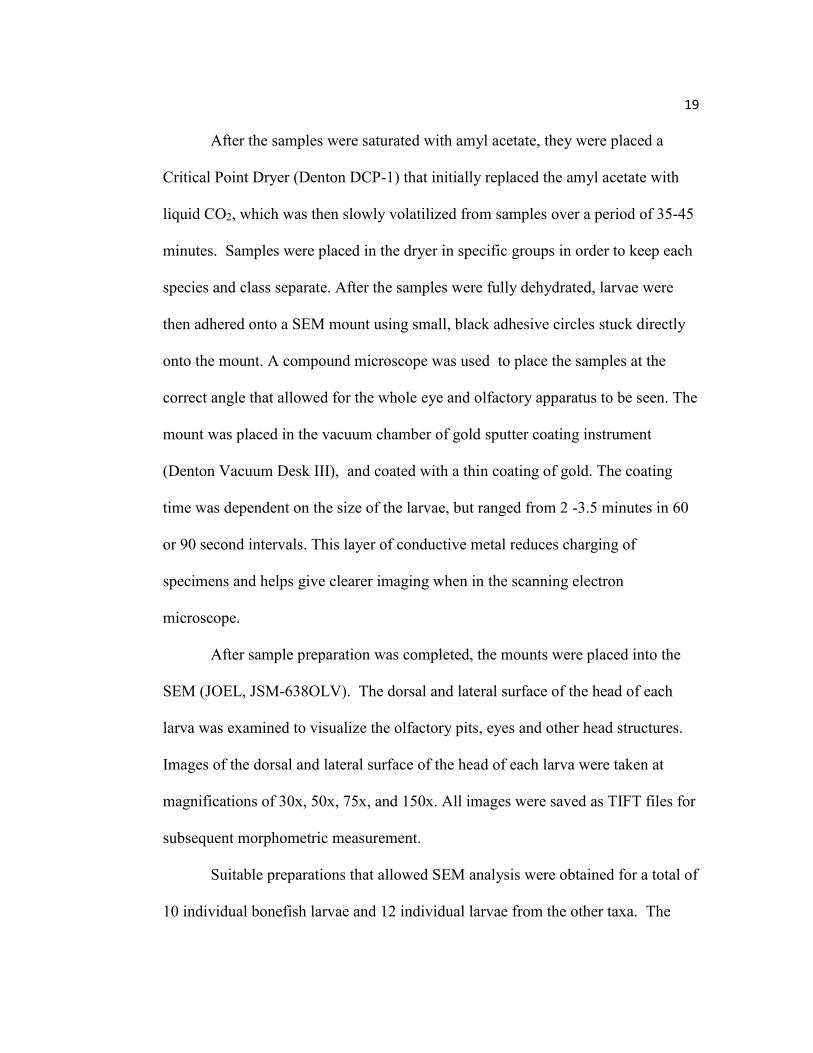
After the samples were saturated with amyl acetate, they were placed a
Critical Point Dryer (Denton DCP-1) that initially replaced the amyl acetate with
liquid CO2, which was then slowly volatilized from samples over a period of 35-45
minutes. Samples were placed in the dryer in specific groups in order to keep each
species and class separate. After the samples were fully dehydrated, larvae were
then adhered onto a SEM mount using small, black adhesive circles stuck directly
onto the mount. A compound microscope was used to place the samples at the
correct angle that allowed for the whole eye and olfactory apparatus to be seen. The
mount was placed in the vacuum chamber of gold sputter coating instrument
(Denton Vacuum Desk III), and coated with a thin coating of gold. The coating
time was dependent on the size of the larvae, but ranged from 2 -3.5 minutes in 60
or 90 second intervals. This layer of conductive metal reduces charging of
specimens and helps give clearer imaging when in the scanning electron
microscope.
After sample preparation was completed, the mounts were placed into the
SEM (JOEL, JSM-638OLV). The dorsal and lateral surface of the head of each
larva was examined to visualize the olfactory pits, eyes and other head structures.
Images of the dorsal and lateral surface of the head of each larva were taken at
magnifications of 30x, 50x, 75x, and 150x. All images were saved as TIFT files for
subsequent morphometric measurement.
Suitable preparations that allowed SEM analysis were obtained for a total of
10 individual bonefish larvae and 12 individual larvae from the other taxa. The

20
process was also repeated for 1 juvenile bonefish sample and 1 juvenile ladyfish
sample collected while seining in spring 2018 near a bridge close to Sebastian Inlet.
These extra samples were used to evaluate the ontogenetic changes that occurred
after metamorphosis.
DATA COLLECTION AND ANALYSIS
After all images were taken, Scandium (Olympus Soft Imaging Solutions)
was used to obtain the following general measurements: (1) Eye major/minor axis,
(2) Eye area, (3) Nostril major and minor axis, (4) Total nostril area, and (5) Total
olfactory area (Figure 7).

21
Figure 7: Images of morphometrics taken from an Atlantic menaden (Brevoorita
tyrannus) using Scandium program. (1) Total olfactory area; (2) Eye major and
minor axis, posterier nostril major and minor axis, and anterior nostril major and
minor axis (left to right); (3)Total eye area, posterior nostril area, anterior nostril
area (left to right).

22
All measurements were taken from photos at 50x, allowing for consistency
as well as a clear overall view of the eye and olfactory regions. Each picture was
loaded into the program, the scale was set, and each measurement was obtained and
saved onto an Excel sheet as well as in an image in case values needed to be double
checked. After all measurements were taken, mean (+/- S.D.) data for each
parameter was plotted per species and per group to characterize the structures.
Because larvae were of different sizes, measured parameters were also standardized
relative to the SL of each specimen. To determine if morphometric parameters
varied significantly among species, Kruskal-Wallis and KW Multiple Comparison
tests (R Studio) were employed.
RESULTS
The morphology of the olfactory system and other larval features were
examined in a total of 82 larvae compiled from 7 species of marine fishes (Table 1)
that were collected in Sebastian Inlet, Florida, or Andros Island, Bahamas. Four of
these species have leptocephalus larvae and 3 were representatives of other teleost
superorders. All specimens were collected as they migrated from the pelagic ocean
habitat into their juvenile nursery habitat. They can thus be considered as
“settlement-stage larvae,” and their sensory systems may begin to reflect the
metamorphic changes as they shift to a new biological and ecological mode of
existence.

23
A major difference between settlement-stage leptocephali and other teleost
larvae is their length. Bonefish and ladyfish leptocephali were 3 to 5 times larger
than croaker and pinfish, and twice the size of most menhaden larvae (Table 1).
The menhaden larvae and tarpon leptocephali were approximately equal in length,
although menhaden grow continuously throughout their larval period while
leptocephali shrink as they catabolize tissue while undergoing metamorphosis.
Table 1: Summary of settlement-stage larval fishes examined in this study.
Following initial species identification and sorting, fish larvae were
prepared for SEM and images were taken for each species (Figures 8-14).

24
Figure 8: Scanning Electron Micrograph image of an Atlantic croaker
(Micropogonias undulatus) larva. Magnification = 50x. E = eye; A = Anterior
nostril; P = Posterior nostril
Figure 9: Scanning Electron Micrograph image of an Atlantic menhaden
(Brevoorita tyrannus) larva. Magnification = 50x. E = eye; A = Anterior nostril; P
= Posterior nostril

25
Figure 10: Scanning Electron Micrograph image of a Pinfish (Lagodon
rhomboides) larva. Magnification = 50x. E = eye; A = Anterior nostril; P =
Posterior nostril
Figure 11: Scanning Electron Micrograph image of a Speckled worm eel (Myrophis
punctatus) larva. Magnification = 50x. E = eye; A = Anterior nostril; P = Posterior
nostril

26
Figure 12: Scanning Electron Micrograph image of a Ladyfish (Elops saurus)
larva. Magnification = 50x. E = eye; Olf = olfactory pit
Figure 13: Scanning Electron Micrograph image of a Bonefish (Albula vulpes)
larva. Magnification = 50x. E = eye; Olf = olfactory pit

27
Figure 14: Scanning Electron Micrograph image of a Tarpon (Megalops atlanticus)
larva. Magnification = 50x. E = eye; Olf = olfactory pit
The olfactory pits were easily observed in each species. When comparing
the 7 different species, it was noted that the croaker, menhaden, pinfish, and eel all
had very well developed anterior and posterior nostrils, and an enclosed olfactory
pit (Figures 8-11). Although the size and shape were different, the croaker and
menhaden seemed to have more elongated nostrils that were closer together (Figure
8 and 9) while the pinfish and eel (Figures 10 and 11) had more rounded and
symmetric nostrils that were farther apart. The remaining 3 species, which include
the ladyfish, bonefish, and tarpon seen in Figures 12-14 had large, open olfactory
pits with no developed set of nostrils. None of these larvae had developed a visible
olfactory rosette with associated lamellae.

28
MORPHOLOGY OF THE EYE AND OLFACTORY ORGANS
Following these initial morphological observations, various morphometric
measurements were recorded from each SEM image. Because many organs grow in
an isometric or allometric relationship with length, eyes would be expected to be
larger in longer fish than in shorter fish. If body size alone influenced the size of
sensory organs, the eyes and olfactory organs would be expected to be larger in the
larger leptocephali than the other larvae. This simple size relationship was not
observed in the eye area of the different species of larvae (Figure 15). While the
eye area was the largest in the longest larvae (bonefish), the eye areas of the other
leptocephali were smaller than the shorter non-leptocephalus larvae.
Figure 15: Mean eye area per species (+/- S.D).
Blue = Leptocephalus larvae; Orange = Non-leptocephalus larvae
0
0.2
0.4
0.6
0.8
1
1.2
1.4
Eye
Are
a (m
m2 )
Species

29
Keeping in mind how organs grow in relation to legth, it would be expected
that longer fish would have a larger olfactory pit. This size relationship was also
not observed in the olfactory pit of these different species (Figure 16). While the
largest olfactory area was observed in the ladyfish, areas of the other leptocephali
were the same size or smaller than the shorter non-leptocephalus larvae.
Figure 16: Mean olfactory area per species (+/-SD).
Blue = Leptocephalus larvae; Orange = Non-leptocephalus larvae
To make these two measurements more comparable per species, average
olfactory area was divided by average eye area for each species to compare the
relative size of these sense organs (Figure 17).
0
0.02
0.04
0.06
0.08
0.1
0.12
0.14
0.16
Olf
acto
ry A
rea
(mm
2)
Species

30
Figure 17: Mean (+/-SD) ratio of average olfactory area/average eye area in each
species.
Blue = Leptocephalus larvae; Orange = Non-leptocephalus larvae
This ratio of olfactory/eye area (Figure 17) is greatest in ladyfish, where the
area of the olfactory apparatus is about 40% the size of the eye area. When
compared to the non-leptocephalus larvae representatives, the ratio observed for the
ladyfish was more than double for that of the non-leptocephalus respresentatives.
To determine if the differnce in sense organ size differed signficantly
among species, both total eye area and total olfactory area were tested. After
running Shapiro-Wilk normality tests on both variables, a p-value less than 0.05
was seen for both, concluding the data were not normal. Following this, a Bartlett’s
test was used, which again producted a p-value less than 0.05 for both variables,
0
0.1
0.2
0.3
0.4
0.5
0.6
Bonefish Tarpon Ladyfish Eel Croaker Menhaden Pinfish
Olf
/Eye
Rat
io
Species

31
showing unequal variances. The lack of normal data and equal variances led
determined the need for a non-parametric test to be used.
The Kruskal-wallis test was selected, and ran for both eye and olfacotry
area. Both tests producted p-values less than 0.05, which showed a significant
difference in these variables among species. In order to find which species were
different from one another, KW multiple comparison tests were then used on the
matrix of interspecific comparisons to determine which species were different from
one another (Table 2).
Table 2: Matrix showing the results of the KW multiple comparison tests for total
eye and olfactory areas. ** = significant at p <0.05. NS = not significant.
As shown in Table 2, there are indeed significant differences in sensory
organ area among species. When looking at eye area, it was observed that bonefish
were significantly different from the other leptocephalus larvae. This matches
findings seen in Figure 15, which shows bonefish having an average eye area of
1.1mm2, compared to tarpon, ladyfish, and eels which all have averages less than
0.5mm2. With regards to olfactory area, there was a significant difference between

32
tarpon and the other leptocephalus representatives. This result corresponds to
Figure 16, which shows tarpon having the smallest olfactory area out of the
leptocephalus group. Overall, it was seen that there were observable differences in
sensory organ areas between species, however, there were no consistent differences
that separated leptocephalus and non-leptocephalus larvae
Following analysis on sensory organ areas between species, a Shapiro-wilk
normality test and a Bartlett’s test were also run for the olfactory/eye ratio data
(Figure 17). Both of these test concluded the data were again not normal and the
variances were not equal, leading to the use of another Kruskal-wallis test. This
Kurskal-wallis test was used to see if there were differnces in this ratio among
larval types. A p-value of less than 0.05 was produced, therefore showing that there
was a significant difference in these ratios among leptocephalus and non-
leptocephalus larvae.
STANDARDIZATION WITH STANDARD LENGTH
Although the KW multiple comparison tests presented above showed some
differences sensory organ sizes among species, this raw data did not take into
account the size differences between the fishes themselves.
Total eye area and olfactory area could not be directly standardized against
standard length, so eye diameter and olfactory pit length were used. Eye diameter
was initally measured during data collection for all fish, however olfactory pit
length was not. For the bonefish, tarpon, and ladyfish, the exposed olfacotry pit was

33
initally measured. In the other 3 species, which had enclosed olfactory pits the
length was caluculated by adding up the length of each nostril along with the
distance between. After all the values were obtained, each was standardized against
length by dividing the sensory variable by standard length for each fish and then
multiplying it by 100. This turned the values into percentages of the total length of
the fish, which were then compared between groups (Figures 18 and 19).
Figure 18: Mean (+/- S.D.) of standardized eye diameter (% of SL).
Blue = Leptocephalus larvae; Orange = Non-leptocephalus larvae
When looking at eye diameter, a trend was seen between larval types, with
the all leptocephalus larvae having a smaller mean of standardized eye diameter
compared to that of the non-leptocephalus larvae (Figure 18). This same pattern
was seen in Figure 19, with the leptocephalus larvae again havin a smaller mean of
0
2
4
6
8
10
12
Bonefish Tarpon Ladyfish Eel Croaker Pinfish Menhaden
% S
tan
dar
d L
en
gth
Species
34
standardized olfactory pit length compared to the non-leptocepahlus
representatives.
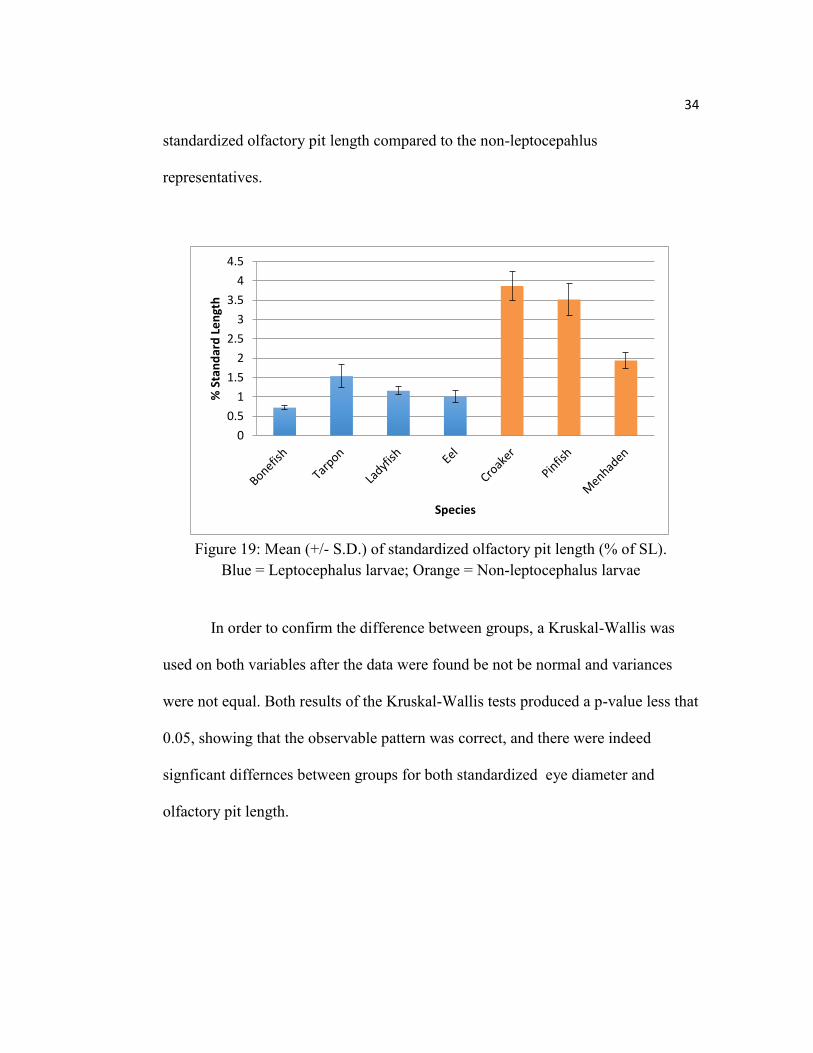
Figure 19: Mean (+/- S.D.) of standardized olfactory pit length (% of SL).
Blue = Leptocephalus larvae; Orange = Non-leptocephalus larvae
In order to confirm the difference between groups, a Kruskal-Wallis was
used on both variables after the data were found be not be normal and variances
were not equal. Both results of the Kruskal-Wallis tests produced a p-value less that
0.05, showing that the observable pattern was correct, and there were indeed
signficant differnces between groups for both standardized eye diameter and
olfactory pit length.
0
0.5
1
1.5
2
2.5
3
3.5
4
4.5
% S
tan
dar
d L
en
gth
Species

35
PRE/POST METAMORPHIC ELOPOMORPHS
The lack of anterior and posterior nostrils, and the open olfactory pits in the
tarpon, ladyfish, and bonefish leptocephalus larvae is a significant difference from
the development of other teleost fishes. Their olfactory pits are fully exposed on the
surface of the larval heads, while the olfactory apparatus of settlement-stage eel
leptocephali and other teleost fishes is embedded under the skin and exposed to
odorants in water moving through an incurrent nostril. The metamorphosis of
tarpon, bonefish and ladyfish leptocephali from pelagic larvae to coastal juveniles
presumably includes transition of the olfactory apparatus to the juvenile/adult state.
Several juvenile bonefish and ladyfish were captured and examined to address this
ontogenetic change in the olfactory apparatus. These juveniles were captured by
seine net in the Indian River Lagoon in spring 2018. Imagery for one juvenile
bonefish and ladyfish were then taken using the scanning electron microscope
(Figure 20 and 21).

36
Figure 20: Scanning Electron Micrograph image of a juvenile bonefish at 20x. SL =
40mm
Figure 21: Scanning Electron Micrograph image of a juvenile ladyfish at 20x. SL =
61mm

37
The SEM images of these juvenile ladyfish (61 mm SL) and bonefish (40
mm SL) show a dramatic change in olfactory morphology from the leptocephalus
larval condition, with the olfactory epithelium embedded under the skin with
clearly developed anterior and posterior nostrils. An olfactory rosette with
epithelial lamellae is clearly visible within the nostrils. This olfactory structure is
now morphologically similar to that of juvenile pinfish (Figure 22).
Figure 22: Scanning Electron Micrograph image of a juvenile Pinfish at 20x SL =
34mm

38
DISCUSSION
The superorder Elopomorpha is comprised of widely divergent adult fishes
including eels (Anguilliformes), ladyfish and tarpon (Elopiformes), bonefish
(Albuliformes), and spiny eels (Notacanthiformes). This group is united by the
unique leptocephalus (“slender head) larval stage, which has special morphological
characteristics including a compressed, transparent body, forward-pointing teeth,
and a tubular gut (Nelson, 2006). In addition to their distinctive morphological
characteristics, leptocephali have cellular, physiological and behavioral differences
from other teleost (bony fish) larvae. The visual system is an example of how
larval groups differ. Most teleost larvae have retinas dominated by dense arrays of
cone photoreceptors, allowing for high visual acuity and photopic (daytime) vision.
Leptocephalus larvae, however, have retinas dominated by rod photoreceptors,
which are more functional for scotopic (low light) vision (Taylor, 2011; 2015).
Another difference between leptocephali and other teleost larvae is their
feeding behavior. Most pelagic teleost larvae feed on zooplankton, and their retinal
structure is adapted to detecting these small moving particles. As opposed to
consuming active food sources, leptocephalus larvae eat marine snow (Miller,
2009; Miller et. al, 2013). Marine snow particles are aggregates derived from
mucus and gelatinous zoopolankton that host bacterial colonies and adhere
phytoplankton and other particulate matter (Alldredge and Silver, 1988).
Mochioka et. al (1993) demonstrated the feeding behavior of eel leptocephali when

39
fed on a diet of squid paste. The paste was dyed red in order to observe the
digestion process and showed that the larvae used their fang-like teeth to carve
pieces out of the artificial marine snow paste (Figure 23).
Figure 23: Image of Muraenesox cinereus consuming squid paste (Mochioka et. al,
1993).
This transparent and passive food source is hard to find in the water
column. Previous research has shown that the leptocephali have rod-dominated
retinas, meaning overall low visual acuity (Taylor et. al, 2011:2015). This lack of

40
emphasis on a visual feeding strategy is supported by the smaller eye diameter seen
in this group.
The unique transparent nature of these larvae, along with their poor visual
acuity creates the question of how these animals are able to find the gelatinous food
sources in the pelagic environment. This study hypothesized that leptocephali use
chemoreception to find the mucus aggregates of marine snow. This reliance on
chemoreception was hypothesized to require an enhanced the olfactory apparatus of
leptocephalus larvae compared to other teleost larval fishes. To test this hypothesis,
the external olfactory apparatus of late larval stages of four species of leptocephali
and three other teleost larvae was examined. Eye dimension data were also
collected to allow analysis of intraspecific differences among species, and as an
index of the relative development of visual and olfactory organs within each
species.
These morphological analyses did indeed find variation in the structure of
the olfactory apparatus between leptocephali and other teleost larvae. When
comparing the 7 different species, the croaker, menhaden, pinfish, and eel larvae all
had very well developed anterior and posterior nostrils, and an enclosed olfactory
pit. The ladyfish, bonefish, and tarpon, however, had large, open olfactory pits
with no developed set of nostrils. This unique open structure has not previously
been described in any other fish larvae. In most teleost fishes, shortly after
hatching, the anterior and posterior nostrils begin to open into the olfactory pit and
expose the lamellae created during the embryonic stage (Noakes and Godin, 1988).

41
This opening of the nostrils can occur within the first couple days after hatching,
making the delay seen in leptocephalus larvae unique.
The settlement-stage leptocephali with these exposed olfactory pits had
odorant receptors directly exposed to surrounding seawater, presumably increasing
their sensitivity to chemicals diffusing from their transparent mucus-based food
source. All three of these species metamorphose into predatory, highly mobile
species, and their olfactory apparatus apparently metamorphoses into the
juvenile/adult state (Figure 20 and 21) concurrently with metamorphosis of the rest
of the leptocephalus body into the juvenile body form.
Conversely, the speckled worm eel leptocephali had well-developed
anterior and posterior nostrils. Leiby (1979) examined the ontogeny of the cranial
osteology of this species throughout its larval period and metamorphosis. Although
he did not focus on the olfactory apparatus, his drawings suggest the presence of a
large open olfactory pit during early stages of larval development (from 13.9 to 49
mm Total Length [TL]). This open olfactory pit during early stages of
development presumably also occurs in early developmental stages of tarpon,
ladyfish and bonefish.
By the time the eel larvae began to metamorphose (65 mm TL), the open
olfactory pit had been covered over by a developing nasal bridge, with openings
restricted to anterior and posterior nostrils. This development of the closed
olfactory pit and nostrils during metamorphosis is a preadaptation to the subsequent
post-larval behavior of the species. Unlike mobile bonefish tarpon and ladyfish,

42
speckled worm eels burrow into the sediment and emerge only to forage (Able et.
al, 2011). The early development of protected olfactory organs prior to
metamorphosis enables the ability to quickly begin to bury in the sediment upon
estuarine entrance. This early olfactory development could also account for the
raised appearance of the anterior nostril as is the post-metamorphic fish could
expose only their head to sense prey, while they have their bodies burrowed.
The morphology of the olfactory apparatus in leptocephalus larvae thus
suggest that open exposed epithelial surfaces indeed help detect odorants in marine
snow aggregates. The size of the olfactory and visual organs alone, however, do
not serve as consistent predictors of the feeding behavior of larvae. Bonefish had
the largest eyes of any of the larvae, while ladyfish had the largest olfactory pits
(Figures 15, 16 on pages 28, 29), although if sensor size was standardized to the
length of the larvae, leptocephali had smaller sensors/larval length than did any of
the other teleosts (Figures 18 and 19 on pages 33 and 34). One reason there could
be no clear patterns in sensor dimensions could be the unique development patterns
of the leptocephalus.
As compared to other larval teleost fishes, leptocephalus larvae go through
a unique developmental change, which can be broken up into 2 phases. Phase 1 is
classified as the premetamorphic interval, which aligns with a growth period where
these larvae significantly expanding their body size in length and dorso-ventrally,
while there is little growth in their head. Following phase 1 is the metamorphic
interval or phase 2. In this phase the larvae begin to shrink and are no longer
43
laterally compressed, and start to lose some of the distinct leptocephalus
characteristics. Once phase 2 is complete they are able to grow again and
eventually enter the juvenile stage (Pfeiler, 1986).
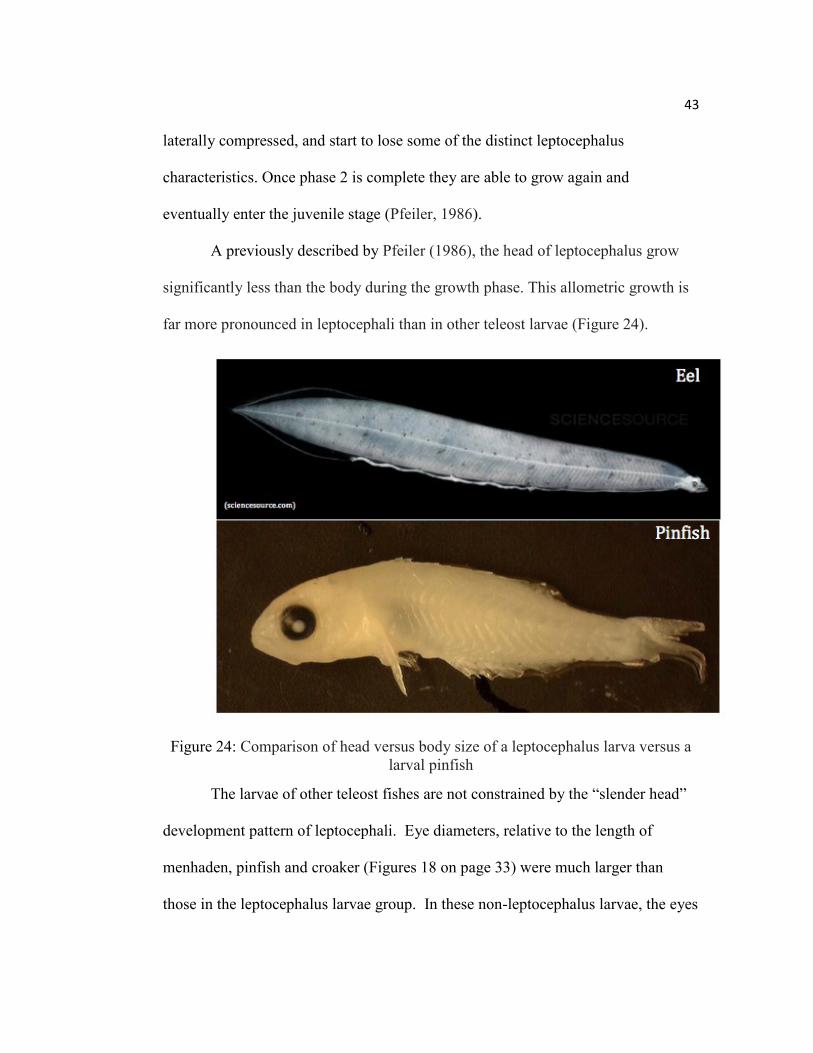
A previously described by Pfeiler (1986), the head of leptocephalus grow
significantly less than the body during the growth phase. This allometric growth is
far more pronounced in leptocephali than in other teleost larvae (Figure 24).
Figure 24: Comparison of head versus body size of a leptocephalus larva versus a
larval pinfish
The larvae of other teleost fishes are not constrained by the “slender head”
development pattern of leptocephali. Eye diameters, relative to the length of
menhaden, pinfish and croaker (Figures 18 on page 33) were much larger than
those in the leptocephalus larvae group. In these non-leptocephalus larvae, the eyes

44
are an important sensory system for larval fish to find food. The cone-dominated
retina helps to find planktonic prey moving throughout the water column
(Pankhurst, 1994; Moser and Watson, 2006). Pinfish, croaker, and menhaden have
a main diet of copepods at the larval stage, (June and Carlson, 1971; Darcy, 1985;
Govoni, 1986).
Although these three species with non-leptocephalus larvae use their visual
systems to feed on zooplankton, other non-Elopomorph teleosts may rely on other
sensory modalities to find and consume food. Newly hatched larvae of some other
teleosts, such as freshwater cichlids and catfish, feed on detritus or other benthic
materials. These animals presumably have well-developed olfactory systems, as
well as chemoreceptors on barbels and epidermal surfaces, to help them obtain
food, but the ontogeny of their olfactory sensors have not been studied (Mukai et.
al, 2010).
Regardless of the type of larval development, metamorphosis from larval
into juvenile form typically involves major changes in morphology, feeding and
other behaviors. The olfactory systems of leptocephalus and non-leptocephalus
larvae all develop into olfactory pits lined with the olfactory epithelium. This
specialized tissue is folded into structures called lamellae, which are arranged into a
leaf-like structure called a rosette. The rosette structures vary in shape, size, and
number of lamellae depending on species. The increased number and size of the
lamellae means there is more surface area for these chemoreceptors, and
presumably greater olfactory sensitivity of the fish (Cox, 2008; Kasumyan, 2004).

45
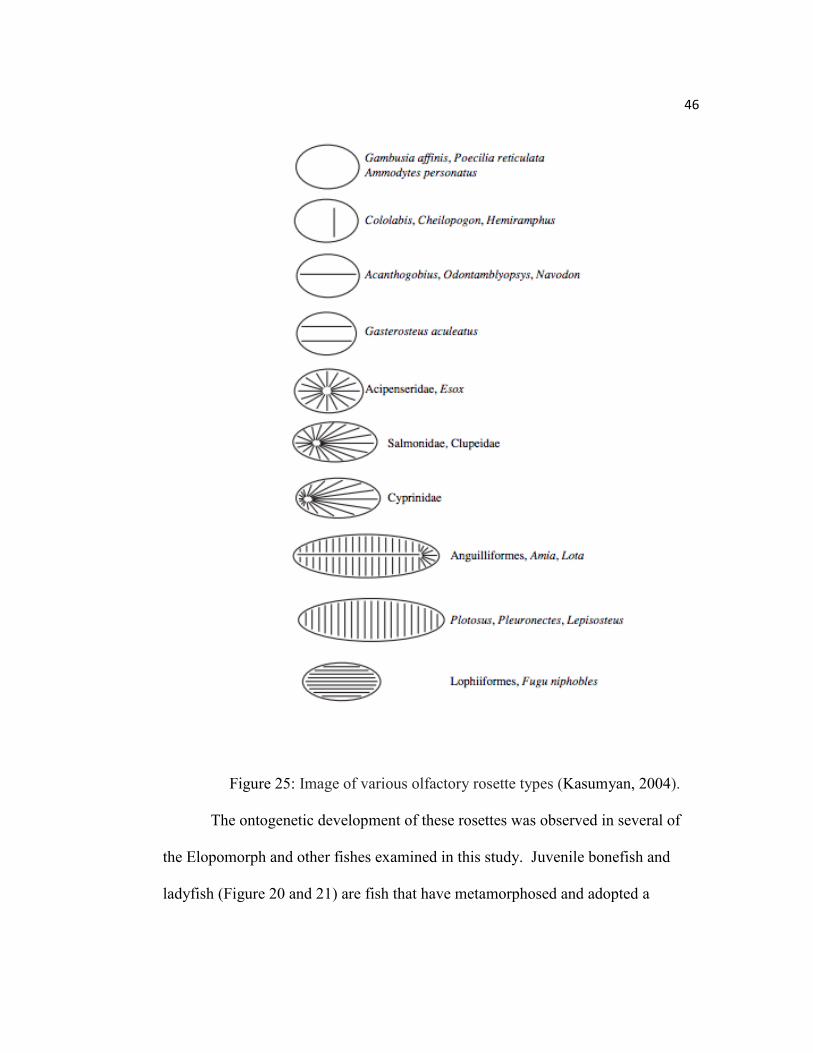
The various shapes and folds in a rosette can vary among families (Figure
25). The eels (Anguilliformes) have a long rosette with many folds, with a large
potential surface area for receptors. This is similar to what is seen in Figure 6 when
looking at the rosette of the European eel in panel C. That rosette has a
significantly longer shape with greater number of lamellae as compared to the
anglerfish in panel A or the goldfish in panel B (Cox, 2008).
46
Figure 25: Image of various olfactory rosette types (Kasumyan, 2004).
The ontogenetic development of these rosettes was observed in several of
the Elopomorph and other fishes examined in this study. Juvenile bonefish and
ladyfish (Figure 20 and 21) are fish that have metamorphosed and adopted a

47
juvenile mode of life. They no longer feed on marine snow and mucus aggregates,
instead feeding on various zooplankton and benthic invertebrates (Adams et.al,
2014). Their olfactory apparatus has also metamorphosed, with separate nostrils
and a developing rosette taking on different biological roles than detecting marine
snow (Figure 26 and 27).
Figure 26: (A) Scanning Electron Micrograph image of a juvenile Bonefish at 20x;
(B) Scanning Electron Micrograph image of the olfactory apparatus at 75x; SL =
40mm

48
Figure 27: (A) Scanning Electron Micrograph image of a juvenile Ladyfish at 20x;
(B) Scanning Electron Micrograph image of the olfactory apparatus at 75x; SL =
61mm
By this life stage, the retinas have developed a balance between rods and
cones, giving the organisms a higher visual acuity, which helps them become more
visual feeders (Taylor et. al, 2015). The opposite result was seen in the pinfish
development. These fish are already visual feeders and do not rely on olfaction as
heavily in the larval stage. Like most teleost fishes, they start out with an olfactory
apparatus that follows the basic schematic of having a covered olfactory pit with
well-formed nostrils. Metamorphosis of these fish thus involves elaboration of
their olfactory rosette and lamellae, rather than developing the entire nasal
structure.
The results of this study supported the hypothesis that there is a significant
difference in the morphology of the olfactory apparatus of leptocephalus larvae
compared to other larval teleost fishes. It is important to understand how these

49
unique larvae perceive the world, with various challenges they face. Having a
better understanding of these Elopomorphs at this stage can help give a more
complete life history of these organisms, which could further conservation and
aquaculture efforts. Further research needs to be conducted at the molecular level in
order to better understand the importance of olfaction by looking at receptor
densities and types present in these exposed, olfactory pits. Pairing this information
with experiments testing larval sensitivity to smell would help to fully understand
the importance olfaction in these larvae’s ability to find food.

50
LITERATURE CITED
Able, K. W., Allen, D. M., Bath-Martin, G., Hare, J. A., Hoss, D. E., Marancik, K.
E., ... & Warlen, S. M. (2011). Life history and habitat use of the speckled
worm eel, Myrophis punctatus, along the east coast of the United States.
Environmental biology of fishes, 92(2), 237.
Adams, A. J., Horodysky, A. Z., McBride, R. S., Guindon, K., Shenker, J.,
MacDonald, T. C., ... & Carpenter, K. (2014). Global conservation status
and research needs for tarpons (Megalopidae), ladyfishes (Elopidae) and
bonefishes (Albulidae). Fish and Fisheries, 15(2), 280-311.
Alldredge, A. L., & Silver, M. W. (1988). Characteristics, dynamics and
significance of marine snow. Progress in oceanography, 20(1), 41-82.
Anibaldi, A., Franciosi, C. B., Massari, F., Tinti, F., Piccinetti, C., & Riccioni, G.
(2016). Morphology and species composition of Southern Adriatic Sea
leptocephali evaluated using DNA barcoding. PloS one, 11(11), e0166137.
Barber, B. J. (1996). Gametogenesis of eastern oysters, Crassostrea virginica
(Gmelin, 1791), and Pacific oysters, Crassostrea gigas (Thunberg, 1793) in
disease-endemic lower Chesapeake Bay. Journal of Shellfish
Research, 15(2), 285-290.
Buck, L., & Axel, R. (1991). A novel multigene family may encode odorant
receptors: a molecular basis for odor recognition. Cell, 65(1), 175-187.
Chen, J. N., López, J. A., Lavoué, S., Miya, M., & Chen, W. J. (2014). Phylogeny
of the Elopomorpha (Teleostei): evidence from six nuclear and
mitochondrial markers. Molecular phylogenetics and evolution, 70, 152-
161.
Cooper, J. C., Scholz, A. T., Horrall, R. M., Hasler, A. D., & Madison, D. M.
(1976). Experimental confirmation of the olfactory hypothesis with homing,
artificially imprinted coho salmon (Oncorhynchus kisutch). Journal of the
Fisheries Board of Canada, 33(4), 703-710.
Cox, J. P. (2008). Hydrodynamic aspects of fish olfaction. Journal of The Royal
Society Interface, 5(23), 575-593.

51
Darcy, G. H. (1985). Synopsis of biological data on the pinfish, Lagodon
rhomboides (Pisces: Sparidae).
Dornburg, A., Friedman, M., & Near, T. J. (2015). Phylogenetic analysis of
molecular and morphological data highlights uncertainty in the relationships
of fossil and living species of Elopomorpha (Actinopterygii: Teleostei).
Molecular phylogenetics and evolution, 89, 205-218.
Fedler, T. (2009). The economic impact of recreational fishing in the everglades
region. The Everglades Foundation. Technical report
Gerlach, G., & Artema, J. (2012). The use of chemical cues in habitat recognition
and settlement. Chemical Ecology in Aquatic Systems, 72-89.
Govoni, J. J., Ortner, P. B., Al-Yamani, F., & Hill, L. C. (1986). Selective feeding
of spot, Leiostomus xanthurus, and Atlantic croaker, Micropogonias
undulatus, larvae in the northern Gulf of Mexico. Marine Ecology Progress
Series, 28(1-2), 175-183
Groves, A. B., Collins, G. B., & Trefethen, P. S. (1968). Roles of olfaction and
vision in choice of spawning site by homing adult chinook salmon
(Oncorhynchus tshawytscha). Journal of the Fisheries Board of Canada,
25(5), 867-876.
Hara, T. J. (1986). Role of olfaction in fish behaviour. In The behaviour of teleost
fishes (pp. 152-176). Springer, Boston, MA.
Hubbs, C., & Blaxter, J. H. S. (1986). Ninth larval fish conference: Development of
sense organs and behaviour of Teleost larvae with special reference to
feeding and predator avoidance. Transactions of the American Fisheries
Society, 115(1), 98-114.
Jones, G. P., Planes, S., & Thorrold, S. R. (2005). Coral reef fish larvae settle close
to home. Current Biology, 15(14), 1314-1318.
June, F. C., & Carlson, F. T. (1971). Food of young Atlantic menhaden, Brevoortia
tyrannus, in relation to metamorphosis. Fish. Bull, 68(3), 493-512.

52
Kagawa, H., Tanaka, H., Ohta, H., Unuma, T., & Nomura, K. (2005). The first
success of glass eel production in the world: basic biology on fish
reproduction advances new applied technology in aquaculture. Fish
Physiology and Biochemistry, 31(2-3), 193.
Kajiya, K., Inaki, K., Tanaka, M., Haga, T., Kataoka, H., & Touhara, K. (2001).
Molecular bases of odor discrimination: reconstitution of olfactory
receptors that recognize overlapping sets of odorants. Journal of
Neuroscience, 21(16), 6018-6025.
Lago, F. C., Vieites, J. M., & Espiñeira, M. (2012). Authentication of the most
important species of freshwater eels by means of FINS. European Food
Research and Technology, 234(4), 689-694.
Leiby, M. M. (1979). Morphological development of the eel Myrophis punctatus
(Ophichthidae) from hatching to metamorphosis, with emphasis on the
developing head skeleton. Bulletin of Marine Science, 29(4), 509-521.
Leis, J. M., Siebeck, U., & Dixson, D. L. (2011). How Nemo finds home: the
neuroecology of dispersal and of population
Miller, M. J. (2009). Ecology of anguilliform leptocephali: remarkable transparent
fish larvae of the ocean surface layer. Aqua-BioSci. Monogr, 2(4), 1-94.
Miller, M. J., Chikaraishi, Y., Ogawa, N. O., Yamada, Y., Tsukamoto, K., &
Ohkouchi, N. (2013). A low trophic position of Japanese eel larvae
indicates feeding on marine snow. Biology letters, 9(1), 20120826.
Mochioka, N., Iwamizu, M., & Kanda, T. (1993). Leptocephalus eel larvae will
feed in aquaria. Environmental Biology of Fishes, 36(4), 381-384.
Mojica, R., & Shenker, J. M. C. w. harnden, and DE wagner. 1995. Recruitment of
bonefish, Albula vulpes, around Lee Stocking Island, Bahamas. Fish.
Bull, 93, 666-674.
Moser HG, Watson W. (2006). Ichthyoplankton. Ecology of marine fishes:
California and adjacent waters. University of California Press. 269–319.
Mukai, Y., Tuzan, A. D., Lim, L. S., & Yahaya, S. (2010). Feeding behavior under
dark conditions in larvae of sutchi catfish Pangasianodon
hypophthalmus. Fisheries Science, 76(3), 457-461.

53
Nelson, J. S. (2006). Fishes of the world 4th edition. Hoboken: John Wiley & Sons,
Inc.
Pankhurst, P. M. (1994). Age-related changes in the visual acuity of larvae of New
Zealand snapper, Pagrus auratus. Journal of the Marine Biological
Association of the United Kingdom, 74(2), 337-349.
Pfeiler, E. (1986). Towards an explanation of the developmental strategy in
leptocephalous larvae of marine teleost fishes. Environmental Biology of
Fishes, 15(1), 3-13.
Richards, W. J. (Ed.). (2005). Early stages of Atlantic fishes: an identification
guide for the western central north Atlantic, Two Volume Set (Vol. 2). CRC
Press.
Schoppa, N. E., & Westbrook, G. L. (2001). Glomerulus-specific synchronization
of mitral cells in the olfactory bulb. Neuron, 31(4), 639-651.
Shenker, J. M., Cowie-Mojica, E., Crabtree, R. E., Patterson, H. M., Stevens, C., &
Yakubik, K. (2002). Recruitment of tarpon (Megalops atlanticus)
leptocephali into the Indian River Lagoon, Florida. Contrib Mar Sci, 35, 55-
69.
Smith, D. G. (1989). Fishes of the western North Atlantic Pt. 9. Vol. 2.
Leptocephali. Mem. Sears Found. Mar. Res. Mem., 1.
Sola, C., Spampanato, A., & Tosi, L. (1993). Behavioural responses of glass eels
(Anguilla anguilla) towards amino acids. Journal of Fish Biology, 42(5),
683-691.
Stabell, O. B. (1984). Homing and olfaction in salmonids: a critical review with
special reference to the Atlantic salmon. Biological Reviews, 59(3), 333-
388.
Stobutzki, I. C., & Bellwood, D. R. (1994). An analysis of the sustained swimming
abilities of pre-and post-settlement coral reef fishes. Journal of
Experimental Marine Biology and Ecology, 175(2), 275-286.

54
Sutton, T. T., Wiebe, P. H., Madin, L., & Bucklin, A. (2010). Diversity and
community structure of pelagic fishes to 5000 m depth in the Sargasso
Sea. Deep Sea Research Part II: topical studies in oceanography, 57(24-
26), 2220-2233.
Tanaka, H., Kagawa, H., & Ohta, H. (2001). Production of leptocephali of Japanese
eel (Anguilla japonica) in captivity. Aquaculture, 201(1-2), 51-60.
Taylor, S. M., Loew, E. R., & Grace, M. S. (2011). Developmental shifts in
functional morphology of the retina in Atlantic tarpon, Megalops atlanticus
(Elopomorpha: Teleostei) between four ecologically distinct life-history
stages. Visual neuroscience, 28(04), 309-323.
Taylor, S. M., Loew, E. R., & Grace, M. S. (2015). Ontogenic retinal changes in
three ecologically distinct elopomorph fishes (Elopomorpha: Teleostei)
correlate with light environment and behavior. Visual neuroscience, 32.
Wang, C. H., & Tzeng, W. N. (2000). The timing of metamorphosis and growth
rates of American and European eel leptocephali:: A mechanism of larval
segregative migration. Fisheries Research, 46(1-3), 191-205
Wilson, C., Scotto, L., Scarpa, J., Volety, A., Laramore, S., & Haunert, D. (2005).
Survey of water quality, oyster reproduction and oyster health status in the
St. Lucie Estuary. Journal of Shellfish Research, 24(1), 157-165.