Embed Size (px)
Citation preview
1928
Korean J. Chem. Eng., 32(9), 1928-1937 (2015)DOI: 10.1007/s11814-015-0004-3
INVITED REVIEW PAPER
pISSN: 0256-1115eISSN: 1975-7220
INVITED REVIEW PAPER
†To whom correspondence should be addressed.E-mail: [email protected] by The Korean Institute of Chemical Engineers.
Morphology study of nanofibers produced by extractionfrom polymer blend fibers using image processing
Neda Dehghan, Mohammad Ali Tavanaie†, and Pedram Payvandy
Textile Engineering Department, Faculty of Engineering, University of Yazd, P. O. Box 89195-741, Yazd, Iran(Received 27 September 2014 • accepted 1 January 2015)
Abstract−The morphology of nanofibers extracted from the industrial-scale produced polypropylene/polybutyleneterephthalate (PP/PBT) blend fibers was studied. To study the morphology and diameter measurements of the nanofi-bers, image processing method was used, and the results were compared with the results of a conventional visual method.Comparing these two methods indicated the good performance of image processing methods for the measuring ofnanofiber diameter. Among the various applied image processing methods, the fuzzy c-means (FCM) method wasdetermined as the best for image thresholding. Additionally, the distance transform method was determined as the bestway for measuring nanofiber diameter. According to high regression coefficient (R=0.98) resulting between the drawratio and nanofibers diameter, the high effectiveness of draw ratio to nanofiber diameter is concluded. The spherical(drop) shapes of the PBT dispersed phase particles were eventually deformed into very thin fibrils during the drawingprocess. The results of measuring the nanofiber diameters showed that the diameter means of nanofibers varied from420 nm to 175 nm with the highest draw ratio. Good uniformity for diameter of nanofibers was observed, which hadnot been observed in previous works.
Keywords: Polymer Blend Fibers, Nanofibers, Morphology, Draw Ratio, Image Processing
INTRODUCTION
The main purpose of blending polymers is to obtain materialssuitable for specific needs by creating or improving one or moreproperties with minimum destruction in other properties. Differ-ent shapes of dispersed phase (as minor phase) such as sphere, lami-nar and fibrillar may form in the matrix phase (as major phase) ofpolymer blends. Production of blend fibers during the melt spin-ning can result in more effective fibrillar phase morphology thanin other methods because of the existence of elongational force field,which are also called matrix-fibrill fibers [1]. In a matrix-fibril fiber,the fibrils are placed randomly within the matrix. By dissolvingthe matrix component, a set of very thin fibrils is obtained [2].
Recently, many researchers have focused on micro- and nanofi-bril formation in the matrix phase of immiscible blend fibers [3-6]. The processing parameters and characteristics of polymers affectthe size of fibrils. Some of these factors are various rheological andprocessing factors. These parameters include the viscosity ratio ofcomponents [2], the blend ratio of component [7], the presence ofcompatibilizer agent [8,9], the type of flow field (whether shear orelongational) [10], the type of dispersed or matrix component, stressrate, extrusion temperature, winding or take-up speed, etc. [1].
Drawing operation is conducted to obtain the desired charac-teristics of the fibers during or after the fiber formation process.This operation makes appropriate values o f tensile and structuralproperties such as elongation at break, tenacity, orientation and the
crystallinity of fibers in terms of their final consumption [11]. Thelength over diameter ratio of the dispersed phase particles couldbe increased by drawing blend fibers. Furthermore, these particlescould be changed to microfibrils and even nanofibrils by drawingoperation [12,13]. The fibrils had a wide range of sizes, consider-ing their production methods.
The drawing operation can be performed in two ways: in hot(feeding roller at a temperature higher than the glass transitiontemperature (Tg) (for both polymers)) and cold conditions. Colddrawing creates aligned fibrils into the matrix phase of blend fibers.Moreover, hot drawing can makes a possible higher draw ratio ofblend fibers compared to cold drawing [9]. Often with the increaseof draw ratio, in addition to decreasing fibril diameter, the unifor-mity of the fibrils length increases [1]. Changes in the morphologyof micro- and nanofibrils resulting from blend fibers were studiedby various researchers [9,13,14].
Jayanarayanan et al. observed that fibril diameter in dispersedphase of the PP/PET injection molded composite decreases withincreasing of the draw ratio [14]. Bagheban et al. [9] observed thatpolypropylene dispersed phase particles deform during the draw-ing process. Their fibril diameters in the blends with compatibi-lizer agent were smaller and more uniform, compared to the blendwithout compatibilizer agent. The diameter of the thinnest fibrilwas around 300 nm.
Falahi et al. studied the production of nanofibrils from a PP/PA6blend fiber. They observed that fibrils were oriented toward thedrawing direction, whichever the ratio of undrawn fibrils meandiameter over drawn fibrils mean diameter was reported as 1.2. Awide range of 300nm to 1,200nm was also reported for fibril diame-ter [13].
Morphology study of nanofibers extracted from blend fibers 1929
Korean J. Chem. Eng.(Vol. 32, No. 9)
Other presented results considered one of the most importantmorphological characteristics of nanofibers to be their diameterevaluation. Diameter of nanofibers is typically measured by the scan-ning electron microscopy visual method. Therefore, researchershave previously paid attention to providing ways for evaluation ofthe precise average fibril diameter with SEM images [15-19]. Poresize is another important property of nanofiber layers that previ-ously was studied using image processing [20,21].
Shin et al. [15] used an image processing method to determinethe diameter of electrospun nanofibers. Distance from the centertowards the edges of the fiber was calculated using the distancetransform method. Ziaberi et al. [16,17] suggested a new distancetransform method for measuring the diameter of electrospun nanofi-bers. By identifying the intersections of fibers and removing themfrom the image of the object skeleton, this method measures thedistribution of fiber diameter more precisely. Also, they suggesteda direct tracking method for measuring electrospun nanofiber diam-eter [18].
Electrospinning has many limitations and the possible non-uni-formities of nanofibers. So, production of the nanofibers from poly-mer blend fibers is considered to be a new approach with manyadvantages: for example, higher production speeds, lower produc-tion costs, and more flexibility in the production of nanofibers withdifferent diameters and more uniformity. In the present study, nano-fiber layers were produced by extracting dispersed phase fibrils fromthe matrix of the polypropylene/polybutylene terephthalate (PP/PBT) blend fibers. Also, the surface morphology of nanofiber lay-ers was studied using an image processing method.
EXPERIMENTAL
1. MaterialsPP/PBT polymer blend fibers (as the shape of multifilament yarn)
with low orientation (LOY) produced at industrial conditions wereused. Manufacturing conditions are presented in Table 1. In theundrawn as-spun fiber production stage, the presence of a 10% PBTdispersed phase content did not significantly affect the spinningcharacteristics of the fibers, and using a 1% polypropylene-grafted-maleic anhydride (PP-g-MAH) as a compatibilizing agent causedthe desired compatibility of the two components and the produc-tion of blend fibers with appropriate elongation at break. Note thatthe presence of the PBT in modified fibers increased the elonga-tion at break of the as-spun blend fibers, and consequently increased
the draw ability of the blend fiber samples [22]. Xylene was usedas a suitable matrix phase solvent for extraction of the nanofiberlayers from the blend fiber samples.2. Methods
The PP/PBT blend fiber was melt spun at industrial conditionsin Aliaf Co. (Iran). The melt spinning line was equipped with anextruder model 4E6 (manufactured by Barmag Co., Germany)with a screw length over diameter ratio (L/D) of 24, and includeda gear pump with a capacity of 0.8 ml per round (manufacturedby Zenite Co., Germany) a spinneret with circular hole (manufac-tured by Elmer Co., Germany) and low speed winding machine(manufactured by IWKA, Germany).
The drawing process was conducted using a tensile testing ma-chine, model SDL micro 350 (manufactured by SDL InternationalLtd./Shirley Development Ltd., UK). This machine works basedon a constant rate of elongation equipped with a load cell of 10 kgf.A Projectina microscope was used to observe and measure the blendfiber diameter. To study the nanofiber layer morphology, a scan-ning electron microscope (manufactured by Tescan Co., Czech)was used. Nanofiber layer images with a magnification of 5000,10000, 15000 and 30000 were prepared and analyzed.
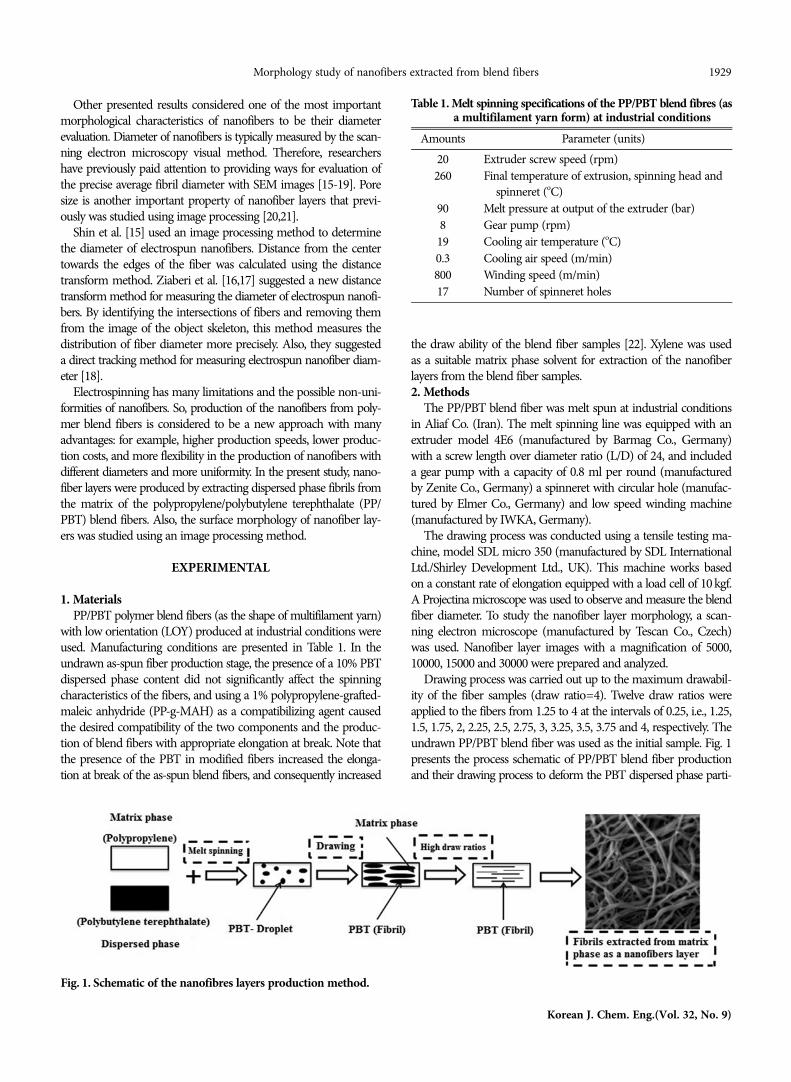
Drawing process was carried out up to the maximum drawabil-ity of the fiber samples (draw ratio=4). Twelve draw ratios wereapplied to the fibers from 1.25 to 4 at the intervals of 0.25, i.e., 1.25,1.5, 1.75, 2, 2.25, 2.5, 2.75, 3, 3.25, 3.5, 3.75 and 4, respectively. Theundrawn PP/PBT blend fiber was used as the initial sample. Fig. 1presents the process schematic of PP/PBT blend fiber productionand their drawing process to deform the PBT dispersed phase parti-
Table 1. Melt spinning specifications of the PP/PBT blend fibres (asa multifilament yarn form) at industrial conditions
Amounts Parameter (units)20 Extruder screw speed (rpm)260 Final temperature of extrusion, spinning head and
spinneret (oC)90 Melt pressure at output of the extruder (bar)8 Gear pump (rpm)
19 Cooling air temperature (oC)0.3 Cooling air speed (m/min)800 Winding speed (m/min)17 Number of spinneret holes
Fig. 1. Schematic of the nanofibres layers production method.
1930 N. Dehghan et al.
September, 2015
cles into fibril form, and finally extracting the nanofibrils by dis-solving the matrix phase component.
To study the appropriate methods for producing nanofibers byextraction method, the blend fiber samples were dissolved for 30,45 and 120 minutes to determine the optimal time at which thephase component is dissolved and the dispersed phase is formedas a layer of nanofibers. The extracted layers were placed at roomtemperature for 24 hours until they were completely dried and thesolvent was removed. A sample weighing method was used beforeand after dissolving the component; then, images of the sampleswere provided by SEM in order to find their dissolution rate as wellas the effect of variously applied draw ratios. A xylene solvent wasused to dissolve PP at boiling temperature. The best time for dis-solving the matrix phase component was 30 minutes.
Measuring of nanofiber diameters is highly important and com-plex due to their superfine diameters and various orientations. Avisual method was considered improper, because of the need forusing a human (operator) force, which should be replaced to meas-ure the diameter of fibers accurately and quickly. For this reason,more recently, the image processing method has been applied formeasuring. Choosing a suitable method for pre-processing the imagesand selecting a proper threshold for separating objects from thebackground are major stages during image processing. In this investi-gation, five different methods for image thresholding and two meth-ods for measuring diameter were introduced.3. Image Processing
Thresholding is a process in which a grey image is turned into ablack and white image using an optimal threshold value. In thresh-olding, each pixel of the image is marked as either the object orthe background. Each pixel is related to the object if the strengthof the pixel is higher than the determined threshold value; and if it islower than the threshold, it is related to the background. The thresh-olding method is generally divided into global and local threshold-ing [23]. Other methods used to threshold fuzzy algorithms includethe k-means clustering algorithm, the fuzzy c-means (FCM) cluster-ing method and the imperialist comparative algorithm (ICA) [24].
One threshold value is used for the entire image when apply-ing the global threshold method. In the case of local thresholdingrendering the clarity of the background unclear, dividing the imageinto smaller images makes the brightness of each part almost uni-form.
One of the most important clustering algorithms is the FCMalgorithm. In this algorithm, the pixels are divided into C (certainnumber) clusters [25]. Image features (intensity values) are used asinput data to the algorithm. When pixels are closer to the center oftheir clusters, they have high membership value, while low mem-bership value belongs to the pixels far from the center. Sivakumarapplied the fuzzy clustering method for dividing mammogramimages and introduced it as an appropriate method for sharingmedical images [26]. K-means clustering or cluster analysis is a branchof data analysis science that contributes data to predetermined clus-ters. These clusters are defined based on common characteristicsof data and without using any default data. Data consists of imagedetails in which each cluster contains similar data dissimilar to datain other clusters. Various criteria can be considered for similarity;one of the most applicable criteria for clustering is distance. Then,
the closer data is regard as one cluster. Another applied algorithmis a heuristic algorithm that divides the image according to the pri-mary population and then applies a target function. This approachhas been inspired by the k-means algorithm and image data [27].
Two methods are applied for measuring diameter: the image pro-cessing method (distance transform, direct tracking method) andthe visual method. In the present study, Euclidean distance trans-formation was used to measure the diameter of nanofibers in thedistance transform method. The direct tracking method was alsoone of the image processing methods used for measuring nanofi-bers diameter. In this method, the measured distance as radius isdoubled to obtain nanofibers diameter. The visual method is theconventional method for measuring the diameter of fibers. First, ascale is set; then, pixels located between two edges of the verticalaxis are counted. The number of pixels is converted to nanome-ters (nm) and the results are reported. Depending on the condi-tions of an image, 30 to 100 diameters could be measured. Thismethod is time-consuming and requires an operator, which reducesits accuracy. Automated measurement of diameter and omitting ahuman (operator) force for measurement can be selected as a nat-ural solution for solving this problem.
RESULTS AND DISCUSSION
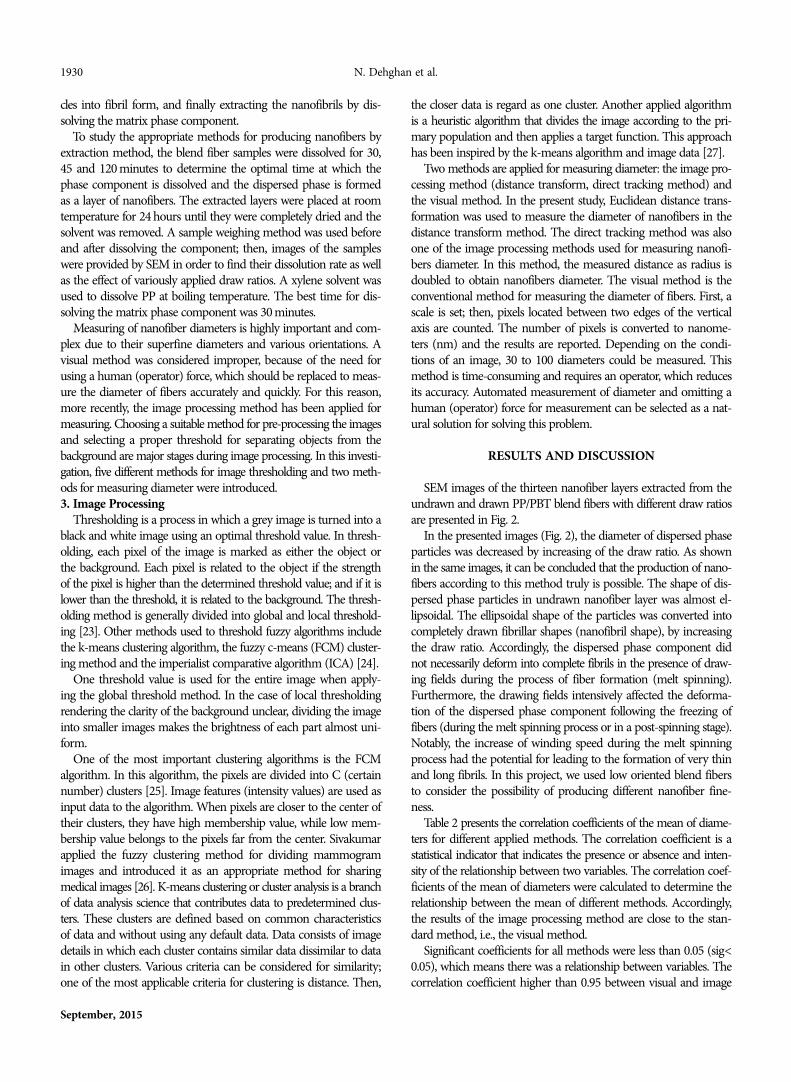
SEM images of the thirteen nanofiber layers extracted from theundrawn and drawn PP/PBT blend fibers with different draw ratiosare presented in Fig. 2.
In the presented images (Fig. 2), the diameter of dispersed phaseparticles was decreased by increasing of the draw ratio. As shownin the same images, it can be concluded that the production of nano-fibers according to this method truly is possible. The shape of dis-persed phase particles in undrawn nanofiber layer was almost el-lipsoidal. The ellipsoidal shape of the particles was converted intocompletely drawn fibrillar shapes (nanofibril shape), by increasingthe draw ratio. Accordingly, the dispersed phase component didnot necessarily deform into complete fibrils in the presence of draw-ing fields during the process of fiber formation (melt spinning).Furthermore, the drawing fields intensively affected the deforma-tion of the dispersed phase component following the freezing offibers (during the melt spinning process or in a post-spinning stage).Notably, the increase of winding speed during the melt spinningprocess had the potential for leading to the formation of very thinand long fibrils. In this project, we used low oriented blend fibersto consider the possibility of producing different nanofiber fine-ness.
Table 2 presents the correlation coefficients of the mean of diame-ters for different applied methods. The correlation coefficient is astatistical indicator that indicates the presence or absence and inten-sity of the relationship between two variables. The correlation coef-ficients of the mean of diameters were calculated to determine therelationship between the mean of different methods. Accordingly,the results of the image processing method are close to the stan-dard method, i.e., the visual method.
Significant coefficients for all methods were less than 0.05 (sig<0.05), which means there was a relationship between variables. Thecorrelation coefficient higher than 0.95 between visual and image
Morphology study of nanofibers extracted from blend fibers 1931
Korean J. Chem. Eng.(Vol. 32, No. 9)
Fig. 2. Nanofibres layers extracted from the blend fibres samples drawn with different draw ratios: (a) 1, (b) 1.25, (c) 1.5, (d) 1.75, (e) 2,(f) 2.25, (g) 2.5, (h) 2.75, (i) 3, (j) 3.25, (k) 3.5, (l) 3.75, (m) 4.
1932 N. Dehghan et al.
September, 2015
processing methods indicates a strong and positive relationshipbetween these methods and the visual method. The highest cor-relation coefficient for the diameter determining method was fordistance transform. Among thresholding methods, the best methodwith the highest correlation coefficient was the fuzzy c-means (FCM).
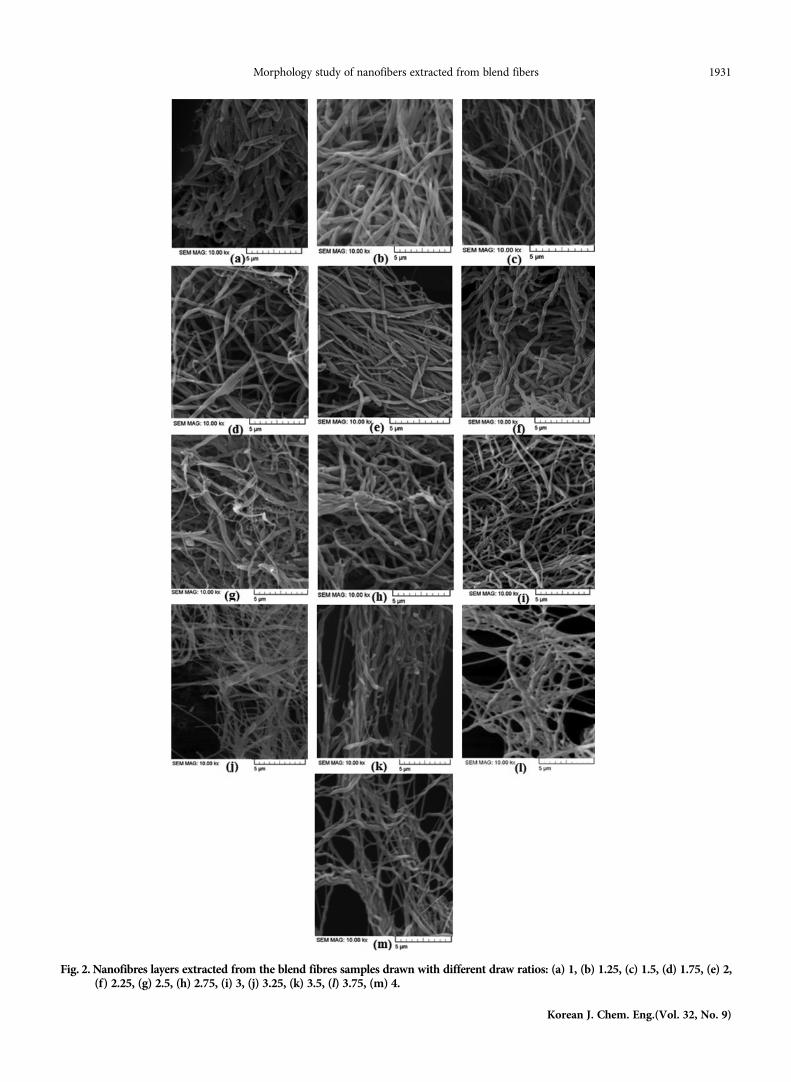
In the fuzzy method, an object belongs to all clusters with dif-ferent degrees of membership, and when the data are overlapping,this method provides the best tool for clustering the data. In thecase of nanofiber layers images, the best division is done throughFCM. Then, in order to measure nanofibers diameter, the imageprocessing method was applied, FCM was applied for threshold-ing, and the distance transform method was applied for measur-ing diameter. Fig. 3 shows the image of thresholding using FCMfor nanofiber layers with a draw ratio of 4.
The thresholding image of Fig. 3 shows that the thresholdingmethod was suitable for distinguishing nanofiber layers from the
background. To measure diameter using the distance transformmethod, the image was divided into sub-images. All nanofiber layerswere measured by the FCM thresholding method and two diame-ter measuring methods: the distance transform and visual method.
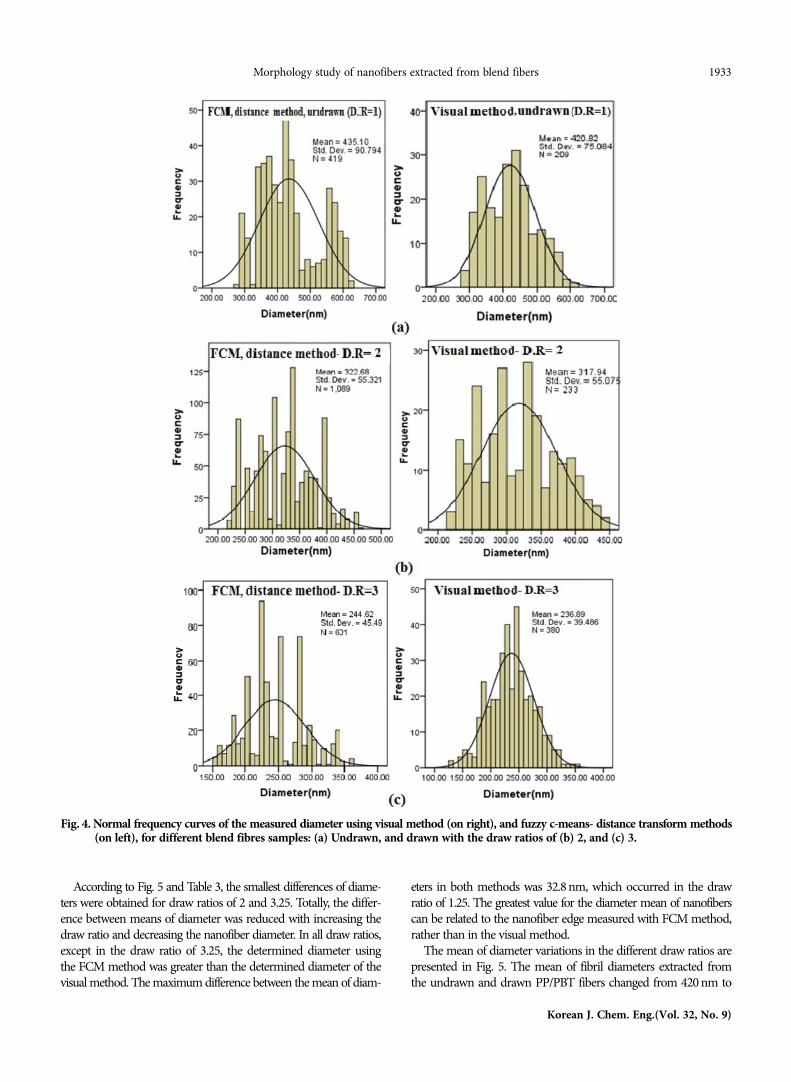
The results of diameter measurement were analyzed. As an exam-ple, the results of the measured diameters of three samples of thenanofiber layer (undrawn sample, sample with the draw ratio of 2and sample with the draw ratio of 3) are presented in the form ofa normal curve by image processing and visual methods. Fig. 4 showsthe results of the three samples with different draw ratios as nor-mal frequency curves with mean and standard deviation, as wellas the numbers of measured diameters.
As can be seen in Fig. 4, the visual and image processing meth-ods had a normal distribution curve; these methods had a frequencyalong the entire range of the measured diameters. Frequency dis-tribution curves for the visual method had a normal and uniformdistribution. However, these distribution graphs were not uniformin the previous research, and for some draw ratios no frequencywere observed [9, 12]. The more uniform distributions results ofthis study can be related to the resulted uniformity of the blendfiber produced in industrial conditions of this work compared toother blend fibers produced at laboratory scale [9,12,13].
As can be seen in the curves presented in Fig. 4, the mean ofdiameter was similar for both methods. The mean of diameters ofthe thirteen nanofiber layers were calculated. Table 3 shows the meanof diameter for all samples which was measured with both methods.
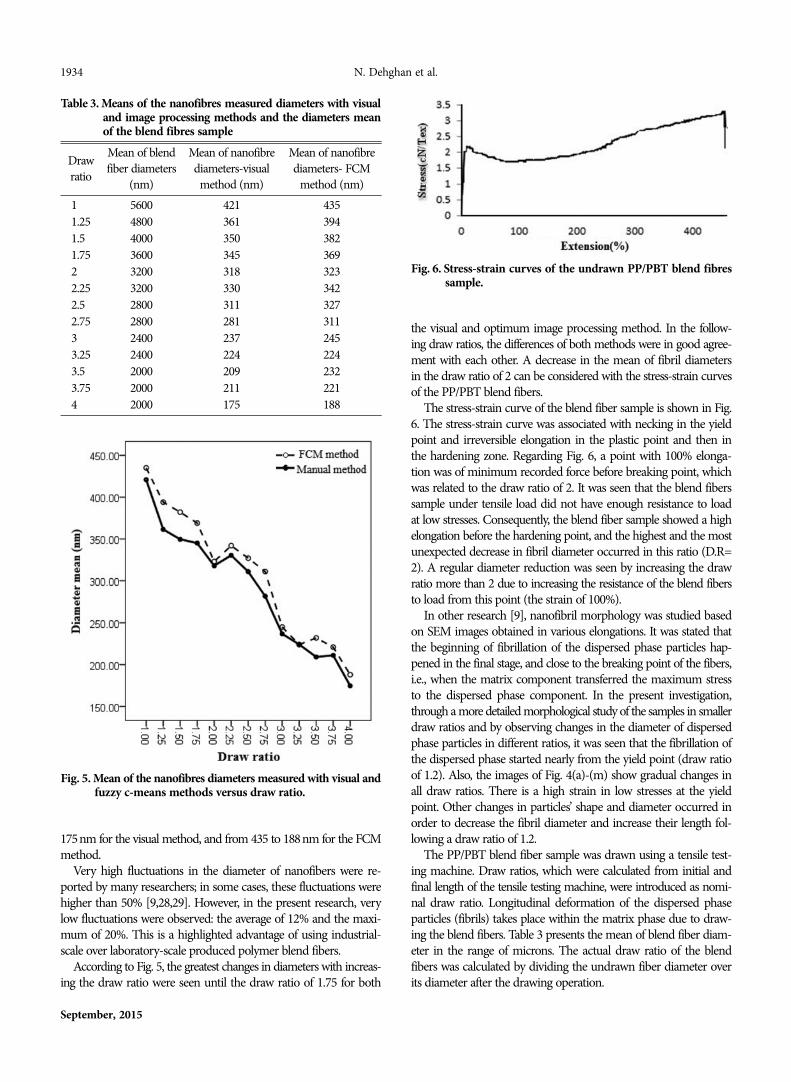
As shown in Table 3, the obtained results from FCM and visualmethods in all draw ratios are very close together and show a dif-ference of 1.5% to 10.5%. Fig. 5 shows the mean of the measureddiameters for the FCM and visual methods using the distance trans-form measuring method for all draw ratios. Generally, the resultsof the mean of diameters confirmed the decrease in fibrils diame-ter by increasing the draw ratio, as was previously noted.
Table 2. Correlation coefficients between the mean of nanofibresdiameters measured with different methods
Thresholding method-diametermeasurement method
Visual methodcorrelation coefficient
Otsu-Distance Transform 0.966Otsu-Direct Tracking 0.977Local-Distance Transform 0.984Local-Direct Tracking 0.977K-means- Distance Transform 0.989K-means- Direct Tracking 0.984FCM- Distance Transform 0.992FCM- Direct Tracking 0.984ICA- Distance Transform 0.988ICA- Direct Tracking 0.965
Fig. 3. Images of the nanofibres layer extracted from drawn PP/PBT blend fibres sample with the draw ratio of 4, (a) normal image, and(b) thresholded image by fuzzy c-means.
Morphology study of nanofibers extracted from blend fibers 1933
Korean J. Chem. Eng.(Vol. 32, No. 9)
According to Fig. 5 and Table 3, the smallest differences of diame-ters were obtained for draw ratios of 2 and 3.25. Totally, the differ-ence between means of diameter was reduced with increasing thedraw ratio and decreasing the nanofiber diameter. In all draw ratios,except in the draw ratio of 3.25, the determined diameter usingthe FCM method was greater than the determined diameter of thevisual method. The maximum difference between the mean of diam-
eters in both methods was 32.8 nm, which occurred in the drawratio of 1.25. The greatest value for the diameter mean of nanofiberscan be related to the nanofiber edge measured with FCM method,rather than in the visual method.
The mean of diameter variations in the different draw ratios arepresented in Fig. 5. The mean of fibril diameters extracted fromthe undrawn and drawn PP/PBT fibers changed from 420 nm to
Fig. 4. Normal frequency curves of the measured diameter using visual method (on right), and fuzzy c-means- distance transform methods(on left), for different blend fibres samples: (a) Undrawn, and drawn with the draw ratios of (b) 2, and (c) 3.
1934 N. Dehghan et al.
September, 2015
175nm for the visual method, and from 435 to 188nm for the FCMmethod.
Very high fluctuations in the diameter of nanofibers were re-ported by many researchers; in some cases, these fluctuations werehigher than 50% [9,28,29]. However, in the present research, verylow fluctuations were observed: the average of 12% and the maxi-mum of 20%. This is a highlighted advantage of using industrial-scale over laboratory-scale produced polymer blend fibers.
According to Fig. 5, the greatest changes in diameters with increas-ing the draw ratio were seen until the draw ratio of 1.75 for both
the visual and optimum image processing method. In the follow-ing draw ratios, the differences of both methods were in good agree-ment with each other. A decrease in the mean of fibril diametersin the draw ratio of 2 can be considered with the stress-strain curvesof the PP/PBT blend fibers.
The stress-strain curve of the blend fiber sample is shown in Fig.6. The stress-strain curve was associated with necking in the yieldpoint and irreversible elongation in the plastic point and then inthe hardening zone. Regarding Fig. 6, a point with 100% elonga-tion was of minimum recorded force before breaking point, whichwas related to the draw ratio of 2. It was seen that the blend fiberssample under tensile load did not have enough resistance to loadat low stresses. Consequently, the blend fiber sample showed a highelongation before the hardening point, and the highest and the mostunexpected decrease in fibril diameter occurred in this ratio (D.R=2). A regular diameter reduction was seen by increasing the drawratio more than 2 due to increasing the resistance of the blend fibersto load from this point (the strain of 100%).
In other research [9], nanofibril morphology was studied basedon SEM images obtained in various elongations. It was stated thatthe beginning of fibrillation of the dispersed phase particles hap-pened in the final stage, and close to the breaking point of the fibers,i.e., when the matrix component transferred the maximum stressto the dispersed phase component. In the present investigation,through a more detailed morphological study of the samples in smallerdraw ratios and by observing changes in the diameter of dispersedphase particles in different ratios, it was seen that the fibrillation ofthe dispersed phase started nearly from the yield point (draw ratioof 1.2). Also, the images of Fig. 4(a)-(m) show gradual changes inall draw ratios. There is a high strain in low stresses at the yieldpoint. Other changes in particles’ shape and diameter occurred inorder to decrease the fibril diameter and increase their length fol-lowing a draw ratio of 1.2.
The PP/PBT blend fiber sample was drawn using a tensile test-ing machine. Draw ratios, which were calculated from initial andfinal length of the tensile testing machine, were introduced as nomi-nal draw ratio. Longitudinal deformation of the dispersed phaseparticles (fibrils) takes place within the matrix phase due to draw-ing the blend fibers. Table 3 presents the mean of blend fiber diam-eter in the range of microns. The actual draw ratio of the blendfibers was calculated by dividing the undrawn fiber diameter overits diameter after the drawing operation.
Table 3. Means of the nanofibres measured diameters with visualand image processing methods and the diameters meanof the blend fibres sample
Drawratio
Mean of blendfiber diameters
(nm)
Mean of nanofibrediameters-visual
method (nm)
Mean of nanofibrediameters- FCM
method (nm)1 5600 421 4351.25 4800 361 3941.5 4000 350 3821.75 3600 345 3692 3200 318 3232.25 3200 330 3422.5 2800 311 3272.75 2800 281 3113 2400 237 2453.25 2400 224 2243.5 2000 209 2323.75 2000 211 2214 2000 175 188
Fig. 5. Mean of the nanofibres diameters measured with visual andfuzzy c-means methods versus draw ratio.
Fig. 6. Stress-strain curves of the undrawn PP/PBT blend fibressample.
Morphology study of nanofibers extracted from blend fibers 1935
Korean J. Chem. Eng.(Vol. 32, No. 9)
Actual blend fiber draw ratio(1)
The actual draw ratio of the fibrils was calculated by dividing theextracted fibril diameter mean of the undrawn fiber sample overthe extracted fibrils diameter mean of the drawn fiber sample.
Actual fibrils draw ratio(2)
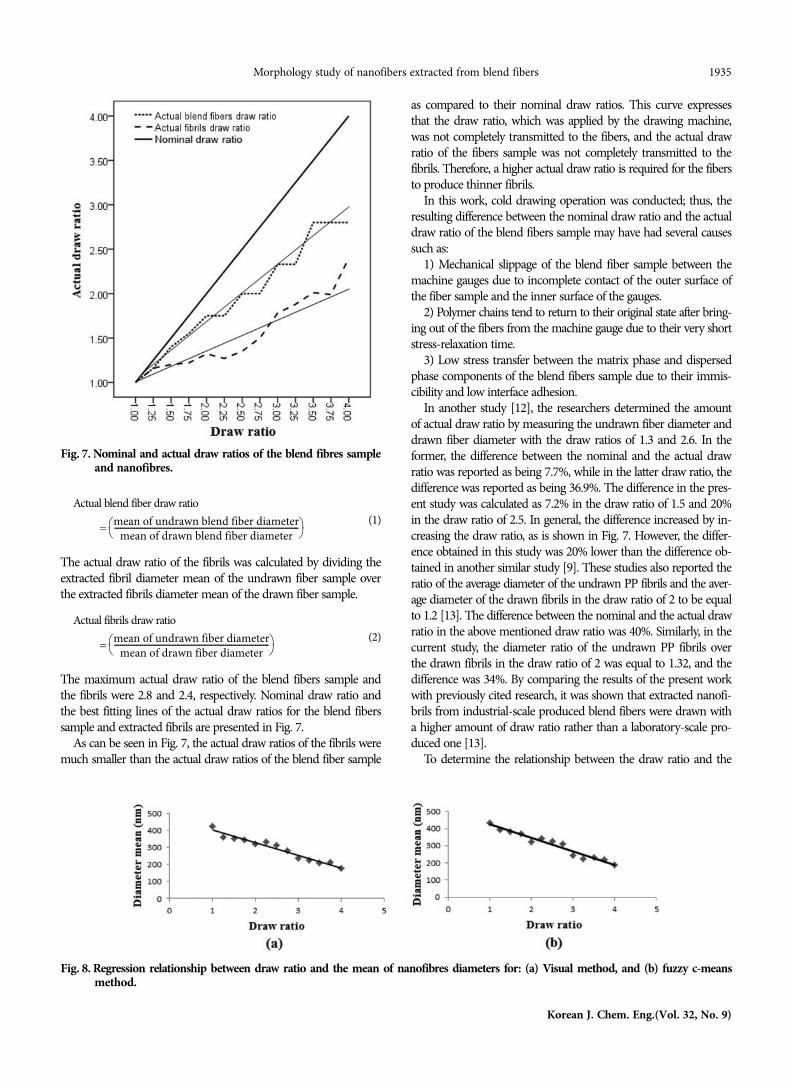
The maximum actual draw ratio of the blend fibers sample andthe fibrils were 2.8 and 2.4, respectively. Nominal draw ratio andthe best fitting lines of the actual draw ratios for the blend fiberssample and extracted fibrils are presented in Fig. 7.
As can be seen in Fig. 7, the actual draw ratios of the fibrils weremuch smaller than the actual draw ratios of the blend fiber sample
as compared to their nominal draw ratios. This curve expressesthat the draw ratio, which was applied by the drawing machine,was not completely transmitted to the fibers, and the actual drawratio of the fibers sample was not completely transmitted to thefibrils. Therefore, a higher actual draw ratio is required for the fibersto produce thinner fibrils.
In this work, cold drawing operation was conducted; thus, theresulting difference between the nominal draw ratio and the actualdraw ratio of the blend fibers sample may have had several causessuch as:
1) Mechanical slippage of the blend fiber sample between themachine gauges due to incomplete contact of the outer surface ofthe fiber sample and the inner surface of the gauges.
2) Polymer chains tend to return to their original state after bring-ing out of the fibers from the machine gauge due to their very shortstress-relaxation time.
3) Low stress transfer between the matrix phase and dispersedphase components of the blend fibers sample due to their immis-cibility and low interface adhesion.
In another study [12], the researchers determined the amountof actual draw ratio by measuring the undrawn fiber diameter anddrawn fiber diameter with the draw ratios of 1.3 and 2.6. In theformer, the difference between the nominal and the actual drawratio was reported as being 7.7%, while in the latter draw ratio, thedifference was reported as being 36.9%. The difference in the pres-ent study was calculated as 7.2% in the draw ratio of 1.5 and 20%in the draw ratio of 2.5. In general, the difference increased by in-creasing the draw ratio, as is shown in Fig. 7. However, the differ-ence obtained in this study was 20% lower than the difference ob-tained in another similar study [9]. These studies also reported theratio of the average diameter of the undrawn PP fibrils and the aver-age diameter of the drawn fibrils in the draw ratio of 2 to be equalto 1.2 [13]. The difference between the nominal and the actual drawratio in the above mentioned draw ratio was 40%. Similarly, in thecurrent study, the diameter ratio of the undrawn PP fibrils overthe drawn fibrils in the draw ratio of 2 was equal to 1.32, and thedifference was 34%. By comparing the results of the present workwith previously cited research, it was shown that extracted nanofi-brils from industrial-scale produced blend fibers were drawn witha higher amount of draw ratio rather than a laboratory-scale pro-duced one [13].
To determine the relationship between the draw ratio and the
= mean of undrawn blend fiber diameter
mean of drawn blend fiber diameter---------------------------------------------------------------------------------------------
⎝ ⎠⎛ ⎞
= mean of undrawn fiber diameter
mean of drawn fiber diameter------------------------------------------------------------------------------
⎝ ⎠⎛ ⎞
Fig. 7. Nominal and actual draw ratios of the blend fibres sampleand nanofibres.
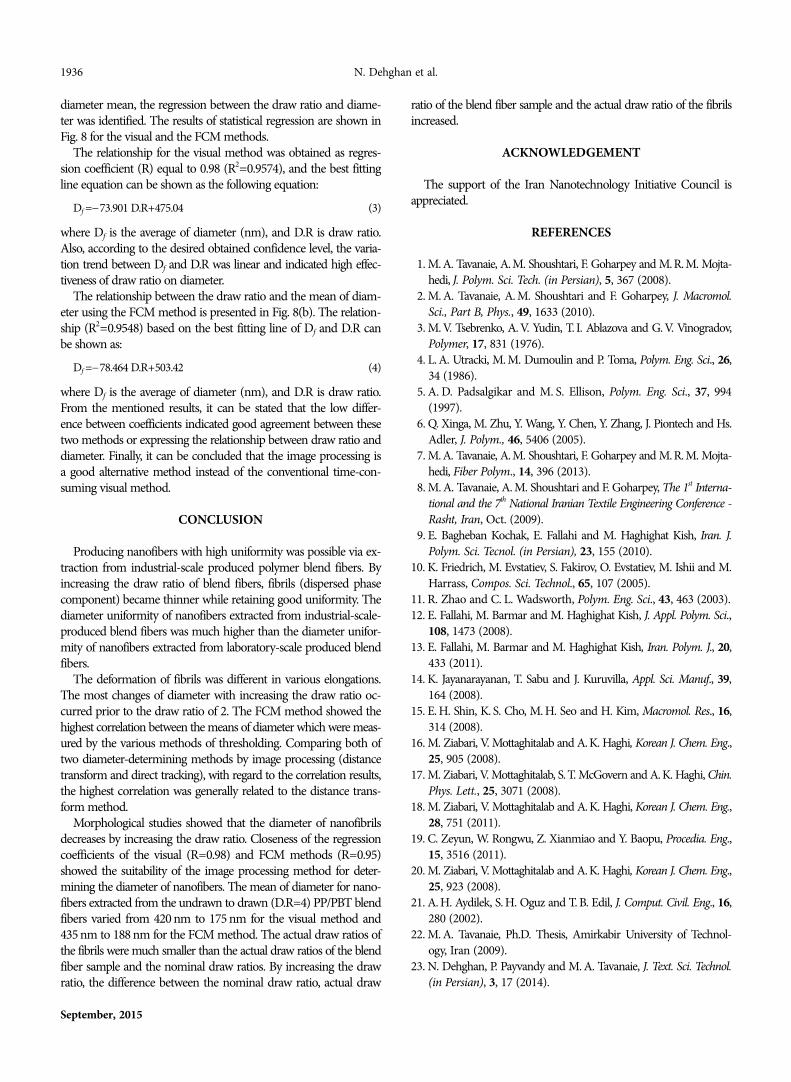
Fig. 8. Regression relationship between draw ratio and the mean of nanofibres diameters for: (a) Visual method, and (b) fuzzy c-meansmethod.
1936 N. Dehghan et al.
September, 2015
diameter mean, the regression between the draw ratio and diame-ter was identified. The results of statistical regression are shown inFig. 8 for the visual and the FCM methods.
The relationship for the visual method was obtained as regres-sion coefficient (R) equal to 0.98 (R2=0.9574), and the best fittingline equation can be shown as the following equation:
Df =−73.901 D.R+475.04 (3)
where Df is the average of diameter (nm), and D.R is draw ratio.Also, according to the desired obtained confidence level, the varia-tion trend between Df and D.R was linear and indicated high effec-tiveness of draw ratio on diameter.
The relationship between the draw ratio and the mean of diam-eter using the FCM method is presented in Fig. 8(b). The relation-ship (R2=0.9548) based on the best fitting line of Df and D.R canbe shown as:
Df =−78.464 D.R+503.42 (4)
where Df is the average of diameter (nm), and D.R is draw ratio.From the mentioned results, it can be stated that the low differ-ence between coefficients indicated good agreement between thesetwo methods or expressing the relationship between draw ratio anddiameter. Finally, it can be concluded that the image processing isa good alternative method instead of the conventional time-con-suming visual method.
CONCLUSION
Producing nanofibers with high uniformity was possible via ex-traction from industrial-scale produced polymer blend fibers. Byincreasing the draw ratio of blend fibers, fibrils (dispersed phasecomponent) became thinner while retaining good uniformity. Thediameter uniformity of nanofibers extracted from industrial-scale-produced blend fibers was much higher than the diameter unifor-mity of nanofibers extracted from laboratory-scale produced blendfibers.
The deformation of fibrils was different in various elongations.The most changes of diameter with increasing the draw ratio oc-curred prior to the draw ratio of 2. The FCM method showed thehighest correlation between the means of diameter which were meas-ured by the various methods of thresholding. Comparing both oftwo diameter-determining methods by image processing (distancetransform and direct tracking), with regard to the correlation results,the highest correlation was generally related to the distance trans-form method.
Morphological studies showed that the diameter of nanofibrilsdecreases by increasing the draw ratio. Closeness of the regressioncoefficients of the visual (R=0.98) and FCM methods (R=0.95)showed the suitability of the image processing method for deter-mining the diameter of nanofibers. The mean of diameter for nano-fibers extracted from the undrawn to drawn (D.R=4) PP/PBT blendfibers varied from 420 nm to 175 nm for the visual method and435 nm to 188 nm for the FCM method. The actual draw ratios ofthe fibrils were much smaller than the actual draw ratios of the blendfiber sample and the nominal draw ratios. By increasing the drawratio, the difference between the nominal draw ratio, actual draw
ratio of the blend fiber sample and the actual draw ratio of the fibrilsincreased.
ACKNOWLEDGEMENT
The support of the Iran Nanotechnology Initiative Council isappreciated.
REFERENCES
1. M. A. Tavanaie, A. M. Shoushtari, F. Goharpey and M. R. M. Mojta-hedi, J. Polym. Sci. Tech. (in Persian), 5, 367 (2008).
2. M. A. Tavanaie, A. M. Shoushtari and F. Goharpey, J. Macromol.Sci., Part B, Phys., 49, 1633 (2010).
3. M. V. Tsebrenko, A. V. Yudin, T. I. Ablazova and G. V. Vinogradov,Polymer, 17, 831 (1976).
4. L. A. Utracki, M. M. Dumoulin and P. Toma, Polym. Eng. Sci., 26,34 (1986).
5. A. D. Padsalgikar and M. S. Ellison, Polym. Eng. Sci., 37, 994(1997).
6. Q. Xinga, M. Zhu, Y. Wang, Y. Chen, Y. Zhang, J. Piontech and Hs.Adler, J. Polym., 46, 5406 (2005).
7. M. A. Tavanaie, A. M. Shoushtari, F. Goharpey and M. R. M. Mojta-hedi, Fiber Polym., 14, 396 (2013).
8. M. A. Tavanaie, A. M. Shoushtari and F. Goharpey, The 1st Interna-tional and the 7th National Iranian Textile Engineering Conference -Rasht, Iran, Oct. (2009).
9. E. Bagheban Kochak, E. Fallahi and M. Haghighat Kish, Iran. J.Polym. Sci. Tecnol. (in Persian), 23, 155 (2010).
10. K. Friedrich, M. Evstatiev, S. Fakirov, O. Evstatiev, M. Ishii and M.Harrass, Compos. Sci. Technol., 65, 107 (2005).
11. R. Zhao and C. L. Wadsworth, Polym. Eng. Sci., 43, 463 (2003).12. E. Fallahi, M. Barmar and M. Haghighat Kish, J. Appl. Polym. Sci.,
108, 1473 (2008).13. E. Fallahi, M. Barmar and M. Haghighat Kish, Iran. Polym. J., 20,
433 (2011).14. K. Jayanarayanan, T. Sabu and J. Kuruvilla, Appl. Sci. Manuf., 39,
164 (2008).15. E. H. Shin, K. S. Cho, M. H. Seo and H. Kim, Macromol. Res., 16,
314 (2008).16. M. Ziabari, V. Mottaghitalab and A. K. Haghi, Korean J. Chem. Eng.,
25, 905 (2008).17. M. Ziabari, V. Mottaghitalab, S. T. McGovern and A. K. Haghi, Chin.
Phys. Lett., 25, 3071 (2008).18. M. Ziabari, V. Mottaghitalab and A. K. Haghi, Korean J. Chem. Eng.,
28, 751 (2011).19. C. Zeyun, W. Rongwu, Z. Xianmiao and Y. Baopu, Procedia. Eng.,
15, 3516 (2011).20. M. Ziabari, V. Mottaghitalab and A. K. Haghi, Korean J. Chem. Eng.,
25, 923 (2008).21. A. H. Aydilek, S. H. Oguz and T. B. Edil, J. Comput. Civil. Eng., 16,
280 (2002).22. M. A. Tavanaie, Ph.D. Thesis, Amirkabir University of Technol-
ogy, Iran (2009).23. N. Dehghan, P. Payvandy and M. A. Tavanaie, J. Text. Sci. Technol.
(in Persian), 3, 17 (2014).

Morphology study of nanofibers extracted from blend fibers 1937
Korean J. Chem. Eng.(Vol. 32, No. 9)
24. N. Dehghan, P. Payvandy and M. A. Tavanaie, Int. J. Comput. Appl.,99, 37 (2014).
25. K. S. Chuang, H. L. Tzeng, S. Chen, J. Wu and T. J. Chen, Com-put. Med. Imag. Grap., 30, 9 (2006).
26. S. Sivakumar and C. Chandrasekar, In Recent. Advances. Comput.Software. Systems (RACSS), International Conference on (109-113,IEEE, 2012).
27. N. Dehghan, M. Sc. Thesis, Yazd University of Iran, February(2014).
28. M. Afshari, R. Kotek, M. Haghighat Kish, H. Nazock Dast and B. S.Gupta, Polymer, 43, 1331 (2002).
29. J. S. Lee, K. H. Choi, H. D. Ghim, S. S. Kim, D. H. Chun, H. Y. Kimand W. S. Lyoo, J. Appl. Polym. Sci., 93, 1638 (2004).