Embed Size (px)
Citation preview
Mortality
ANNUAL REPORT
FY 2014
This is the thirteenth of a series of annual reports on
mortality, mortality trends and related information
pertaining to the health and quality of care received by
individuals served by the Connecticut State Department
of Developmental Services. Reports focus on an analysis of
mortality data and specific findings resulting from the
Connecticut DDS mortality case review process.
Issue Date: November, 2015
2
Mortality ANNUAL REPORT – 2014
Issue Date: November 2015
This report represents a review of the period between July 1, 2013 to June 30, 2014.
Data in this report was obtained from the CT DDS Database system.
CT DDS Mortality Report
SECTION ONE OF THIS REPORT:
CT DDS MORTALITY REVIEW PROCESS
This section describes the CT DDS Mortality Reporting and Review Process.
SECTION TWO OF THIS REPORT:
ANALYSIS OF ALL CT DDS MORTALITIES
This section includes information and data concerning all deaths of individuals served by DDS who were
listed in the CT DDS data base and died during the 2014 fiscal year (July 1, 2013- June 30, 2014)
including death rates and life expectancy.
SECTION THREE OF THIS REPORT:
DATA GENERATED BY THE CT DDS MORTALITY REVIEW PROCESS
This section includes information and analysis of data generated for the 178 deaths reviewed by the DDS
nurse investigators, regional mortality review committees and Independent Mortality Review Board
(IMRB) for the period of July 1, 2013 – June 30, 2014.
SECTION FOUR OF THIS REPORT:
MORTALITY TRENDS CT DDS
This section provides an analysis and synthesis of CT DDS mortality data over time.
SECTION FIVE OF THIS REPORT:
LEADING CAUSES OF DEATH
This section presents CT DDS leading cause of death data.
SECTION SIX OF THIS REPORT:
BENCHMARKS
This section presents and compares CT DDS, National, and State mortality statistics and leading cause of
death information.
SECTION SEVEN OF THIS REPORT:
SUMMARY MORTALITY CASE REVIEW FINDINGS
This section includes information on the findings identified through the DDS mortality review process
and examples of quality initiatives implemented as a result of the CT Mortality Review Process.
Appendix: Includes demographic information on the population served by the CT DDS

Mortality ANNUAL REPORT – 2014
Issue Date: November 2015
3
Table of Contents
Page
Executive Summary 2014 Report 4
CT DDS Mortality Review 5
CT DDS Death Reporting Process 5
Section One: CT DDS Mortality Review Process 6
Critical Components of the CT DDS Mortality Process 6
Section Two: Analysis of All CT DDS Mortalities 9
Overall Mortality Rate 9
Mortality and Residence 9
Mortality and Gender 12
Mortality and Age 13
Section Three: Data Generated by the CT DDS Mortality Review Process 16
Community Hospice Support 16
Autopsies/Post Mortem Examinations 16
Predictability 17
Context: Manner of Death for Cases Reviewed 18
DNR 19
Risk Factors 20
Investigations 21
Pronouncement of Death (Location at Time of Death) 22
Summary of Mortality Data 23
Section Four: Mortality Trends CT DDS 24
Section Five: Leading Causes of Death 30
Heart Disease 30
Respiratory Disease 31
Alzheimer's Disease 32
Leading Causes of Death for People with Down Syndrome 34
Analysis of Cancer Deaths 35
Section Six: Benchmarks 36
Mortality Rate Comparison 36
Leading Causes of Death Benchmarks: National, State of CT and CT DDS 38
Section Seven: Summary Mortality Case Review Findings 39
CT DDS Mortality Review/General Findings 40
Findings and Quality Enhancement Action 40
General Community Awareness Findings 41
References 42
List of Figures 43
List of Tables 44
Appendices 45
• There were 238 deaths resulting in a crude mortality rate of 14.4/1000
• The strongest predictors of mortality were age, mobility status, and the need
for special assistance when eating
• The average age of death for individuals with ID was 59.1 years
• Starting early in the fifth decade of life there was a progressive increase in the
mortality rate for people with intellectual disabilities
• People with intellectual disabilities have a decreased life span as compared to
the general population which may be related to the onset of multiple chronic
and acute co-morbidities at a younger age
• Mortality is related to the level of intellectual disability. The greater the level of
disability the higher the mortality rate
• Heart disease continues to be the leading cause of death in the CT DDS
population (29.8%)
• Aspiration pneumonia/pneumonia accounted for 6.7% of all deaths
• The incidence of deaths related to cancer in the DDS population (10.5%) was
lower than the national (22.5%) and state (23%) 13,14
• Accidental deaths continue to occur at a rate below that of the general state
and national population 13,14
• The average age of death for people with Down syndrome was 60.6 years
• Cardiac Arrest was the leading cause of death for people with Down
syndrome
• Hospice supports were provided in 41% of the reviewed deaths which allowed
individuals to remain in their home residences in the final stages of a terminal
illness
Mortality ANNUAL REPORT – 2014
Issue Date: November 2015
Executive Summary 2014 Report
4
5
CT DDS DEATH REPORTING PROCESS
Per State of Connecticut Executive Order No. 42. The Department of
Developmental Services shall report all deaths of persons placed or
treated under the direction of the Commissioner of the Department of
Developmental Services to the Office of Protection and Advocacy whether
or not abuse or neglect is suspected or contributed to the individual’s
death.
The CT DDS death reporting process is a dynamic process that ensures
that all deaths are immediately reported to the department and death report
forms are submitted to the department within 24 hours of the death
notification.
Mortality Annual Report - 2014
Issue Date: November 2015
CT DDS MORTALITY REVIEW
An important component of the quality and risk management systems present
within DDS involves the analysis and review of deaths to identify important
patterns and trends that may help increase knowledge about risk factors and
provide information to guide systems enhancements. Consequently CT DDS
continues to embrace a planned organization wide approach to design
performance measurement, analysis and improvement by collecting information
pertaining to the deaths of all individuals served by the department. The CT
DDS mortality review system has proven to be a valuable quality assurance
mechanism providing information to trigger corrective action and reduce future
risk.
The CT DDS mortality review process provides a retrospective analysis
THAT
assures compliance with standards
reduces adverse events
leads to ongoing improvement
AND GENERATES
changes in policy and procedure
protocol development
practice standards
focused training
systems improvement strategies

6
• Uniform death reporting system
• Screen individual death reports with standard information
• Standardized mortality review process (regional and state)
• Medical professionals participate in the process
• External stakeholders included in the review process
• State level interdisciplinary/independent mortality review
board (IMRB) aggregates mortality data over time to identify
trends
• Direct link between mortality findings and improvement
• Publically report and document mortality information
(Annual CT DDS Mortality Report)
SECTION ONE: CT DDS MORTALITY REVIEW PROCESS
Mortality Annual Report - 2014
Issue Date: November 2015
CRITICAL COMPONENTS OF THE
CT DDS MORTALITY PROCESS:
7
Mortality Annual Report - 2014
Issue Date: November 2015 Section One Continued
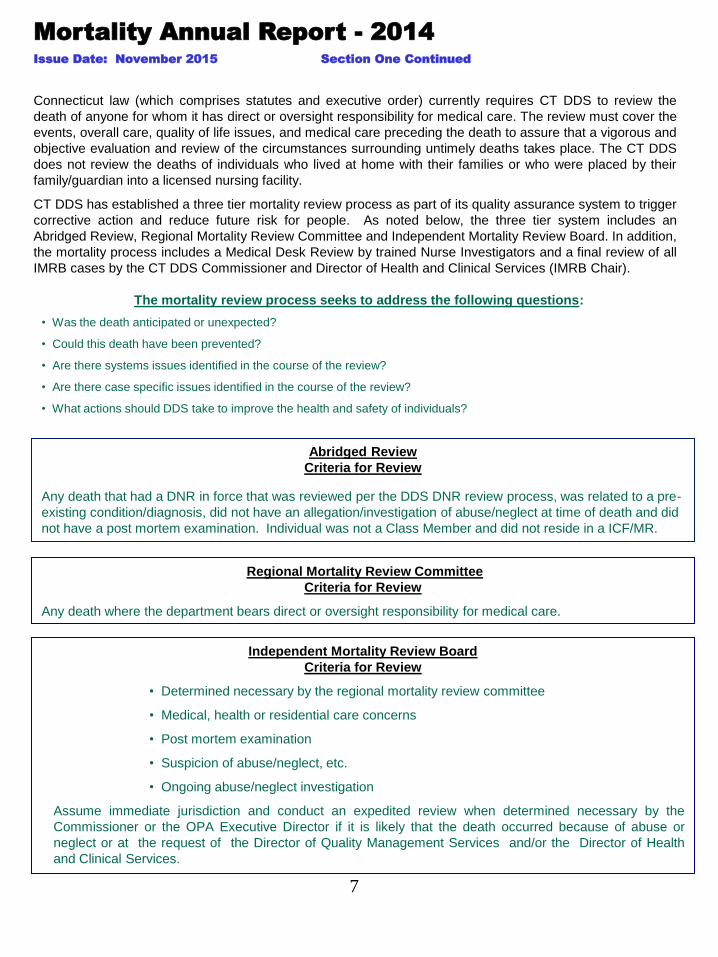
Regional Mortality Review Committee
Criteria for Review
Any death where the department bears direct or oversight responsibility for medical care.
Independent Mortality Review Board
Criteria for Review
• Determined necessary by the regional mortality review committee
• Medical, health or residential care concerns
• Post mortem examination
• Suspicion of abuse/neglect, etc.
• Ongoing abuse/neglect investigation
Assume immediate jurisdiction and conduct an expedited review when determined necessary by the
Commissioner or the OPA Executive Director if it is likely that the death occurred because of abuse or
neglect or at the request of the Director of Quality Management Services and/or the Director of Health
and Clinical Services.
Connecticut law (which comprises statutes and executive order) currently requires CT DDS to review the
death of anyone for whom it has direct or oversight responsibility for medical care. The review must cover the
events, overall care, quality of life issues, and medical care preceding the death to assure that a vigorous and
objective evaluation and review of the circumstances surrounding untimely deaths takes place. The CT DDS
does not review the deaths of individuals who lived at home with their families or who were placed by their
family/guardian into a licensed nursing facility.
CT DDS has established a three tier mortality review process as part of its quality assurance system to trigger
corrective action and reduce future risk for people. As noted below, the three tier system includes an
Abridged Review, Regional Mortality Review Committee and Independent Mortality Review Board. In addition,
the mortality process includes a Medical Desk Review by trained Nurse Investigators and a final review of all
IMRB cases by the CT DDS Commissioner and Director of Health and Clinical Services (IMRB Chair).
The mortality review process seeks to address the following questions:
• Was the death anticipated or unexpected?
• Could this death have been prevented?
• Are there systems issues identified in the course of the review?
• Are there case specific issues identified in the course of the review?
• What actions should DDS take to improve the health and safety of individuals?
Abridged Review
Criteria for Review
Any death that had a DNR in force that was reviewed per the DDS DNR review process, was related to a pre-
existing condition/diagnosis, did not have an allegation/investigation of abuse/neglect at time of death and did
not have a post mortem examination. Individual was not a Class Member and did not reside in a ICF/MR.
8
Mortality Annual Report - 2014
Issue Date: November 2015 Section One Continued
Role of the Nurse Investigators
The Nurse Investigator will forward the Medical Desk Review and associated documents to the DDS
Director of Investigations, DDS Director of Health Services (Chair of the Regional Mortality Review
Committee) and the DDS Director of Health and Clinical Services (Chair of the Independent Mortality
Review Board) when:
• Abuse or neglect is suspected according to DDS abuse/neglect policies and procedures
• Systems deficiencies are identified or suspected
• For routine mortality review as defined in DDS procedure
Independent Mortality Review Board Membership
Members of the Independent Mortality Review Board (IMRB) are appointed by the CT DDS Commissioner
and Executive Director of the CT Office of Protection and Advocacy for DD and include:
Nurse Investigators Medical Desk Review
In addition to the regional mortality review committees and the Independent Mortality Review Board, the DDS
death reporting and mortality review process requires that all deaths are reported to a Nurse Investigator
(NI) who is assigned to the DDS Investigations Division. The Nurse Investigator conducts a Medical Desk
Review (MDR), an abbreviated mortality review to determine the need for an abridged review, a
comprehensive review by a regional mortality committee and/or the Independent Mortality Review Board or if
an immediate investigation of the death by another state agency is warranted.
• DDS Director of Health and Clinical Services (Chair)
• DDS Director Division of Investigations
• DDS Director Division of Quality Management
• Associate Medical Examiner
(State Office of the Chief Medical Examiner)
• Community based physician
• State Office of Protection and Advocacy
• State Department of Public Health
• Executive Director private provider agency
• Family representative
Regional Mortality Committee Membership
Members of the Regional Mortality Review Committees are appointed by the regional or training school
(STS) Director and include:
• DDS Residential Manager
• DDS Assistant Regional Director
• DDS abuse/neglect liaison
• Family representative
• DDS Regional Health Services Director (Chair)
• Medical Director (for STS campus)
• Non DDS registered nurse
• Non DDS consumer advocate
9
Mortality Annual Report - 2014
Issue Date: November 2015
SECTION TWO: ANALYSIS OF ALL CT DDS MORTALITIES
(JULY 1, 2013 – JUNE 30, 2014)
NUMBER OF DEATHS REPORTED = 238
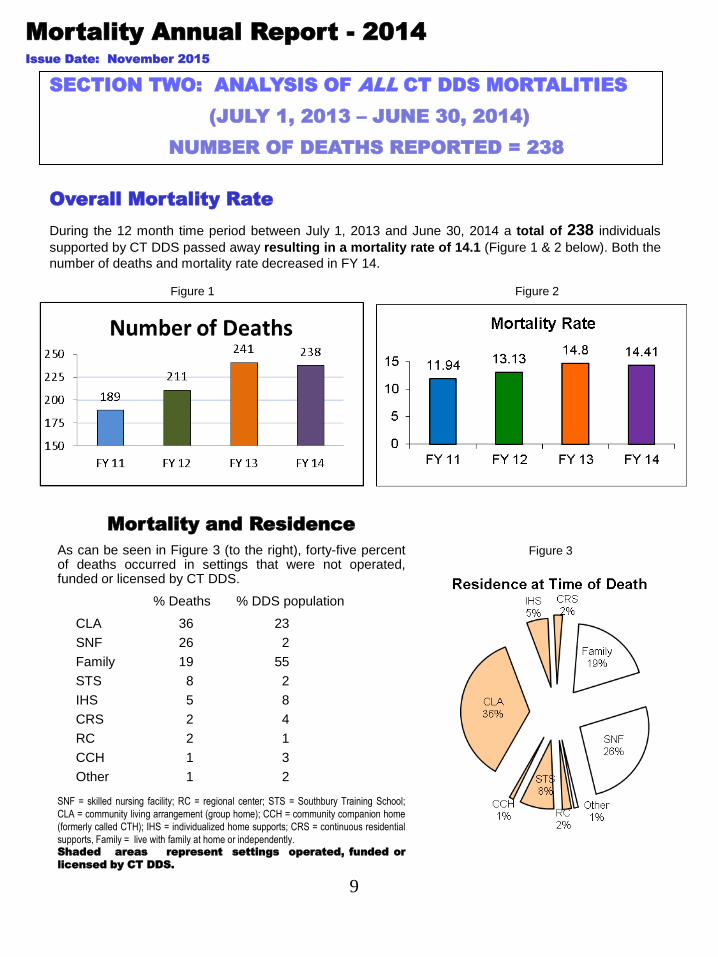
Mortality and Residence
As can be seen in Figure 3 (to the right), forty-five percent of deaths occurred in settings that were not operated, funded or licensed by CT DDS.
% Deaths % DDS population
CLA 36 23
SNF 26 2
Family 19 55
STS 8 2
IHS 5 8
CRS 2 4
RC 2 1
CCH 1 3
Other 1 2
SNF = skilled nursing facility; RC = regional center; STS = Southbury Training School;
CLA = community living arrangement (group home); CCH = community companion home
(formerly called CTH); IHS = individualized home supports; CRS = continuous residential
supports, Family = live with family at home or independently. Shaded areas represent settings operated, funded or
licensed by CT DDS.
Figure 3
Overall Mortality Rate
During the 12 month time period between July 1, 2013 and June 30, 2014 a total of 238 individuals
supported by CT DDS passed away resulting in a mortality rate of 14.1 (Figure 1 & 2 below). Both the
number of deaths and mortality rate decreased in FY 14.
Figure 1 Figure 2
10
Mortality Annual Report - 2014
Issue Date: November 2015 Section Two Continued
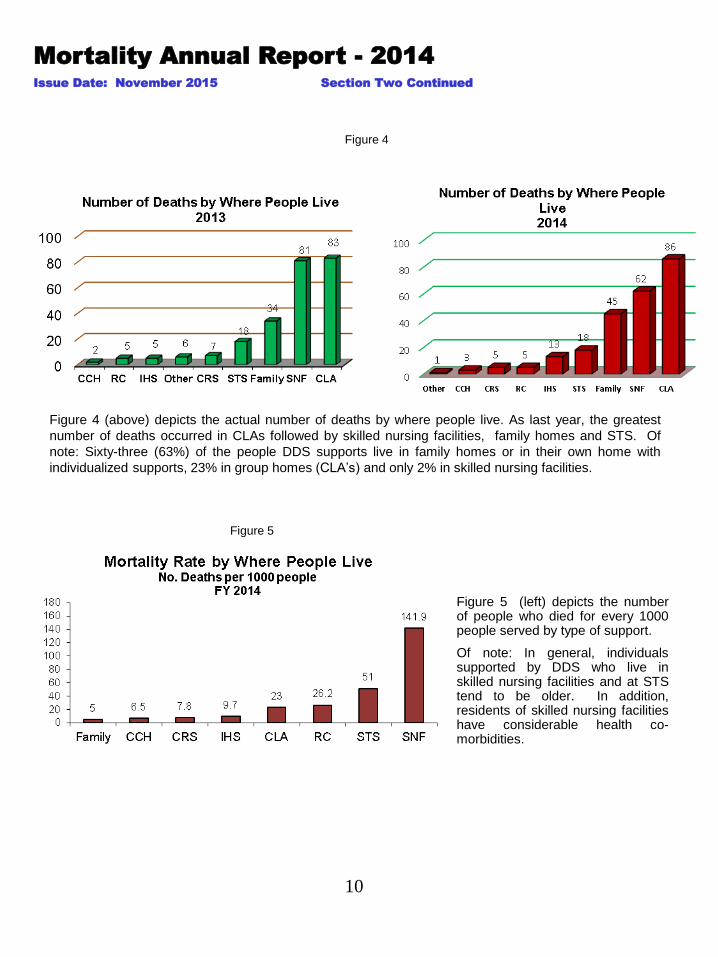
Figure 5 (left) depicts the number of people who died for every 1000 people served by type of support.
Of note: In general, individuals supported by DDS who live in skilled nursing facilities and at STS tend to be older. In addition, residents of skilled nursing facilities have considerable health co- morbidities.
Figure 4
Figure 4 (above) depicts the actual number of deaths by where people live. As last year, the greatest
number of deaths occurred in CLAs followed by skilled nursing facilities, family homes and STS. Of
note: Sixty-three (63%) of the people DDS supports live in family homes or in their own home with
individualized supports, 23% in group homes (CLA’s) and only 2% in skilled nursing facilities.
Figure 5
11
Family Home: People who live with their family without significant residential DDS supports or independently
represent 55% of the DDS population. However, in FY 2014 only 46 deaths (19.3% of all deaths) occurred in a
family home with an associated mortality rate of 5. All but one CT DDS deaths of children were for those who lived
with their families. Twenty-three of the 46 people died in a hospital, hospital emergency department or hospice.
CLA: These settings serve people with varying levels of intellectual disabilities who require 24 hour supervision for
their health and direct care supports. In FY 2014, 80 or 33.6% of all deaths occurred in CLA’s compared to 34.4% in
FY 13. Sixty of the 80 people died in a hospital, hospital emergency department, hospice or SNF.
CCH: There were 3 reported deaths in the community companion homes compared with 2 reported deaths in FY
2013. The CCH mortality rate of 6.5 was greater than the mortality rate for people living at home with their family or
people living in their own home. People living in CCH’s represent 2% of the DDS population and accounted for 1% of
the reported deaths. Two of the people died in a hospital, hospital emergency department or SNF.
CRS: People receiving 24 hour supports in their own homes, People receiving continuous residential supports in their
own homes, in most cases, are less medically involved than people living in other settings. Five or 2.1% of reported
deaths occurred in this environment. Two of the people died in a hospital, hospital emergency department, hospice or
SNF.
IHS: Similar to people living in CRS, however, this population does not require 24 hour support. As with CRS. people
receiving individualized home supports in their own homes, in most cases, are less medically involved than people
living in other settings. This year 13 or 5.4% of reported deaths occurred in this environment compared with 2.1% last
year. Ten of the 13 died in the hospital, hospital emergency department or SNF.
STS: The higher mortality rate of 51 is not surprising as this larger campus setting serves a population of older adults
(average age of 65.1 years). Eighteen deaths were reported at STS this past fiscal year representing 7.6% of all DDS
deaths. Last year the Training School accounted for 7.5% of all deaths. Twelve of the 18 people died in a hospital or
hospital emergency department.
RC: Less than 2% of DDS consumers reside at DDS regional centers. Five RC residents died in FY 2014 accounting
for 2% of all DDS deaths. Four of the 5 individuals died in a hospital or hospital emergency department.
SNF: Only 2% of people served by CT DDS live in a skilled nursing facility. This older (average age 65.7 years) and
medically fragile population accounted for 62 or 26.1% of all reported deaths. People living in licensed nursing
facilities had the highest mortality rate 141.9 per thousand. Fifteen percent (15%) of all DDS consumers over 65 years
of age live in a skilled nursing facility. It is important to note that 21 of the 62 people died in a hospital, hospital
emergency room or hospice.
• Community Living arrangement (CLA): 24 hour support is provided with staff in small group home settings. People share
an apartment or house also known as a group home.
• Community Companion Home (CCH): A family setting that is not the consumer’s own family. CCH provider has received
training and is licensed by DDS to provide services. (Formerly known as CTH, Community Training Home.)
• Continuous Residential Supports (CRS): 24 hours of support for consumers to live in their own home.
• Individualized Home Supports (IHS): Less than 24 hours of support for consumers to live in their own home. Staff support
may be from a few hours a day to only a few hours a month depending on the support needs of the individual.
• Southbury Training School (STS): 24 hour support is provided in a large campus setting serving a population of older
adults.
• Regional Center (RC): Regional Centers are facilities for over 16 people that provide 24 hour staffing.
• Skilled Nursing Facility (SNF): A Department of Public Health licensed nursing facility for people requiring skilled nursing
level of care not licensed or funded by the Department of Developmental Services also known as a nursing home.
Mortality Annual Report - 2014
Issue Date: November 2015 Section Two Continued
Mortality and Residence Definitions

12
Mortality Annual Report - 2014
Issue Date: November 2015 Section Two Continued
In FY 2014 both the number of males and females who died within the DDS was similar to the gender distribution of those people served by the department.
Mortality and Gender
Table 1
Although there are year to year variations in the actual number of deaths by gender, the data
consistently demonstrate that more men than women die each year and that women have a higher
mortality rate.
Figure 6
Figure 7
Mortality Rate by Gender - 2014 All
Individuals Total
Served by Number of No. Percentage
Rate (No.
Deaths
GENDER DDS Consumers Deaths of Deaths Per 1000)
Men 58% 6,841 124 52% 13
Women 42% 9,433 114 48% 16.4
Total 100% 16,274 238 100% 14.4
13
Mortality Annual Report - 2014
Issue Date: November 2015 Section Two Continued
Mortality and Age
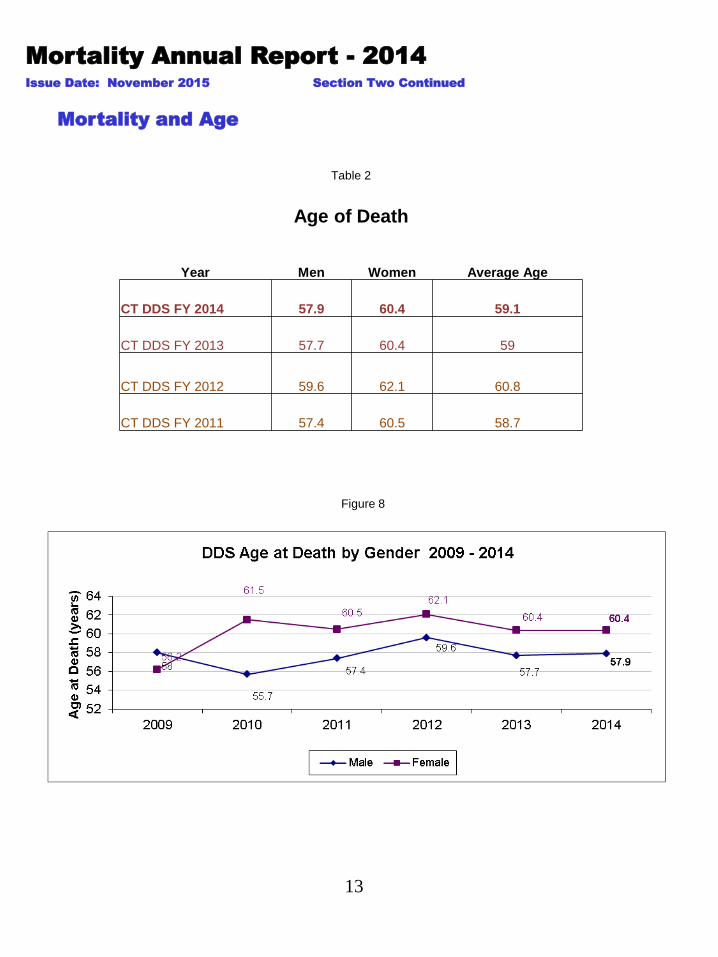
Figure 8
Table 2
Age of Death
Year Men Women Average Age
CT DDS FY 2014 57.9 60.4 59.1
CT DDS FY 2013 57.7 60.4 59
CT DDS FY 2012 59.6 62.1 60.8
CT DDS FY 2011 57.4 60.5 58.7

14
Figure 9
The relationship between age and mortality demonstrates the expected trend, with the mortality rate increasing as people served by DDS get older. As seen in Figure 9, there is an increase in the mortality rate that begins early in the fifth decade of life that continues to increase with advancing age. This finding is consistent with previous CT DDS mortality rate by age data.
Mortality Annual Report - 2014
Issue Date: November 2015 Section Two Continued
Table 3
Mortality statistics for the DDS population in Table 3 reveal a progressive increase in the mortality
rate as the age range increases.
Mortality Age Range Distribution Data
FY 2014
# OF % OF MORTALITY
AGE RANGE DEATHS DEATHS RATE
Age 0-19 9 3.8% 2.7
Age 20-29 7 2.9% 4.9
Age 30-39 15 6.3% 6.2
Age 40-49 23 9.7% 10.4
Age 50-59 63 26.5% 25.5
Age 60-69 64 26.9% 41.1
Age 70-79 36 15.1% 62.1
Age 80+ 21 8.8% 97.7
TOTAL 238 100%
15
Mortality Annual Report - 2014
Issue Date: November 2015 Section Two Continued
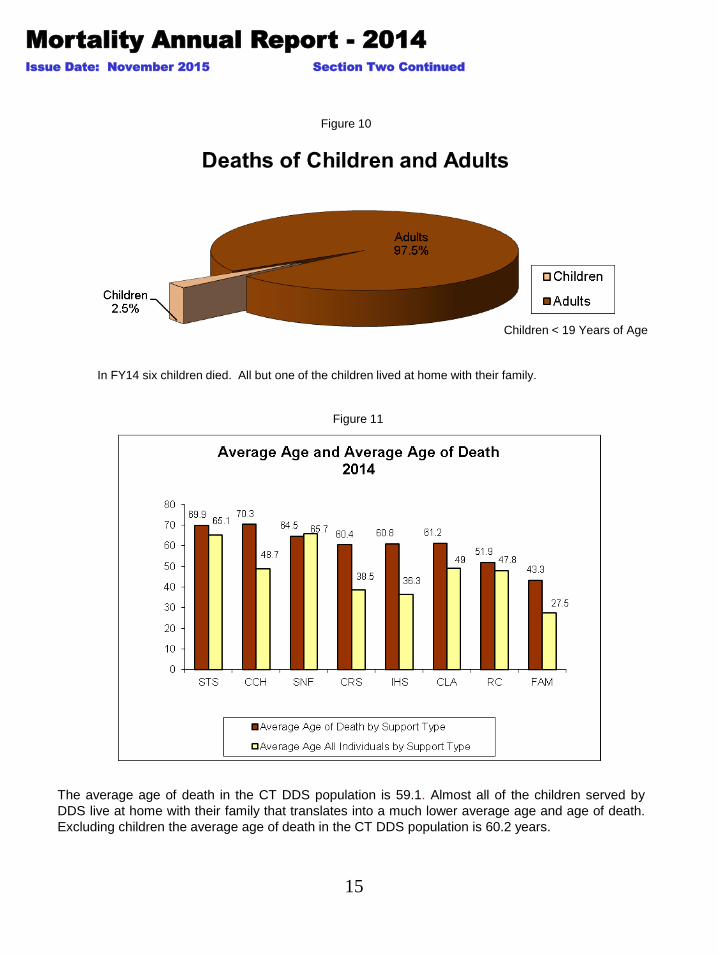
In FY14 six children died. All but one of the children lived at home with their family.
The average age of death in the CT DDS population is 59.1. Almost all of the children served by
DDS live at home with their family that translates into a much lower average age and age of death.
Excluding children the average age of death in the CT DDS population is 60.2 years.
Children < 19 Years of Age
Figure 10
Figure 11

16
Mortality Annual Report - 2014
Issue Date: November 2015
SECTION THREE: DATA GENERATED BY THE CT DDS
MORTALITY REVIEW PROCESS
Community Hospice Support
The concept of end of life planning including hospice care has been embraced by the CT DDS and is routinely requested and provided for individuals served by DDS who live in all settings, including regional centers, Southbury Training School, community living arrangements, community companion homes, continuous residential supports, individualized home supports and family homes. This includes state of the art palliative and hospice care to provide end of life support, hope and comfort to individuals either in the home or in a hospital setting.
The use of hospice services allowed CT DDS to support people through the final stages of a terminal illness while remaining in their current residence. Forty-six individuals received hospice services: 54% lived in a community living arrangement, 20% lived at the training school, 17% lived in a nursing home, 4% lived in individual home support, and 4% lived in a regional center. The average age of death for people receiving hospice services was 65.
Forty-six people (41% of all reviewed deaths) received hospice supports *
Autopsies/Post Mortem Examinations
Autopsies are performed by the Office of the Chief Medical Examiner (OCME) for those deaths in which the
OCME assumes jurisdiction or by hospital based pathology departments when DDS requests and the family
consents to the autopsy.
GUIDELINES FOR REQUESTING AUTOPSIES
• certain sudden or unexpected deaths in which the cause of death
is not due to a previously diagnosed condition or disease
• deaths involving an earlier accident or trauma
• deaths involving questionable contributing factors
• cases involving an allegation of abuse or neglect
Number of post mortem examinations performed: 6 (3.4% of reviewed deaths)
Number of post mortem examination performed by CT OCME: 4
IMPORTANT PLEASE NOTE:
THE INFORMATION PRESENTED IN THIS SECTION SUMMARIZES ONLY THOSE DEATHS THAT WERE REVIEWED BY THE
NURSE INVESTIGATORS, REGIONALCOMMITTEE AND/OR STATE INDEPENDENT MORTALITY REVIEW BOARD IN FY 2014
THEREFORE, THE MORTALITY DATA WILL DIFFER FROM THE INFORMATION PRESENTED AND DISCUSSED IN SECTION
TWO OF THIS REPORT
DDS NURSE INVESTIGATORS/MORTALITY COMMITTEE/BOARD REVIEWS = 178 cases (of total 238 deaths)
** 65 of the 178 cases reviewed were Abridged Reviews **
* Does not include Abridged Reviews
17
Mortality Annual Report - 2014
Issue Date: November 2015 Section Three Continued
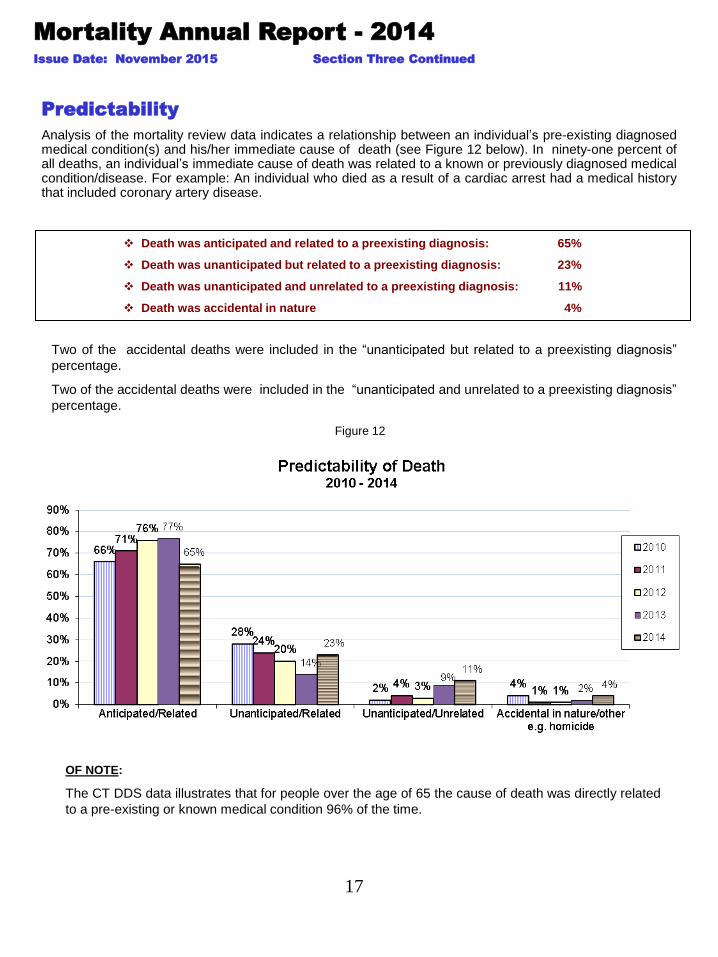
Predictability
Analysis of the mortality review data indicates a relationship between an individual’s pre-existing diagnosed medical condition(s) and his/her immediate cause of death (see Figure 12 below). In ninety-one percent of all deaths, an individual’s immediate cause of death was related to a known or previously diagnosed medical condition/disease. For example: An individual who died as a result of a cardiac arrest had a medical history that included coronary artery disease.
Death was anticipated and related to a preexisting diagnosis: 65%
Death was unanticipated but related to a preexisting diagnosis: 23%
Death was unanticipated and unrelated to a preexisting diagnosis: 11%
Death was accidental in nature 4%
Figure 12
OF NOTE:
The CT DDS data illustrates that for people over the age of 65 the cause of death was directly related
to a pre-existing or known medical condition 96% of the time.
Two of the accidental deaths were included in the “unanticipated but related to a preexisting diagnosis”
percentage.
Two of the accidental deaths were included in the “unanticipated and unrelated to a preexisting diagnosis”
percentage.
18
Mortality Annual Report - 2014
Issue Date: November 2015 Section Three Continued
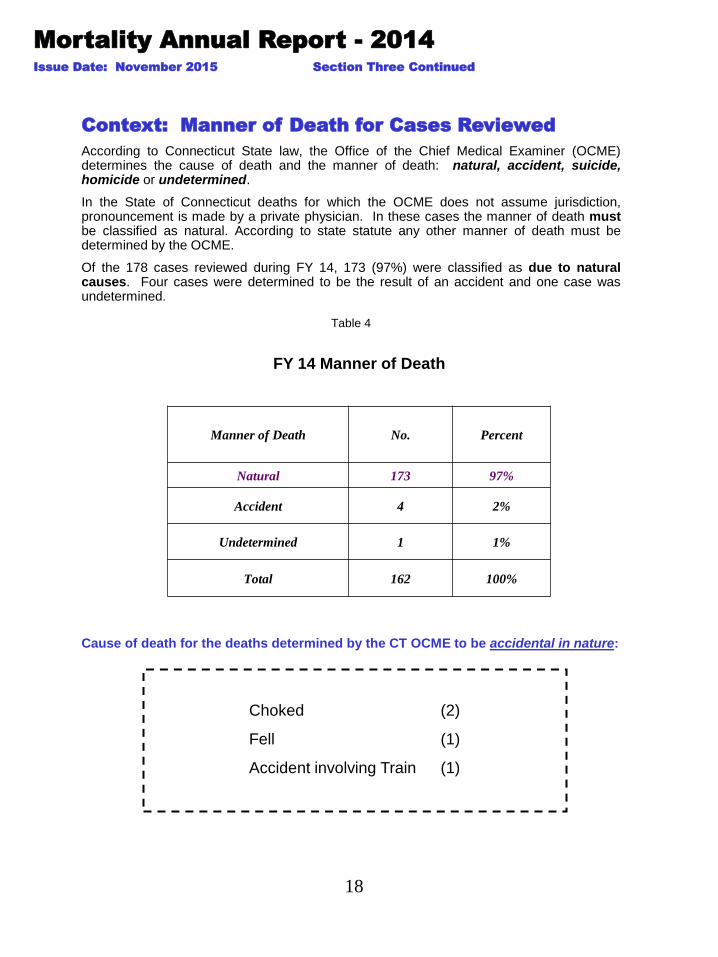
Context: Manner of Death for Cases Reviewed
According to Connecticut State law, the Office of the Chief Medical Examiner (OCME) determines the cause of death and the manner of death: natural, accident, suicide, homicide or undetermined.
In the State of Connecticut deaths for which the OCME does not assume jurisdiction, pronouncement is made by a private physician. In these cases the manner of death must be classified as natural. According to state statute any other manner of death must be determined by the OCME.
Of the 178 cases reviewed during FY 14, 173 (97%) were classified as due to natural causes. Four cases were determined to be the result of an accident and one case was undetermined.
Table 4
Cause of death for the deaths determined by the CT OCME to be accidental in nature:
Choked (2)
Fell (1)
Accident involving Train (1)
FY 14 Manner of Death
Manner of Death No. Percent
Natural 173 97%
Accident 4 2%
Undetermined 1 1%
Total 162 100%
19
DNR
Per Connecticut State Statute, CT DDS has an established procedure which requires that specific criteria must be met along with a special review process for all withholding cardiopulmonary resuscitation (DNR) orders to be issued/implemented for persons who are placed and treated under the direction of the Commissioner of DDS. Documentation regarding end of life planning and withholding of cardiopulmonary resuscitation is required per CT DDS policy.
Do Not Resuscitate (DNR) orders are medically indicated when an individual’s attending physician and another physician (second opinion) have diagnosed that an individual is in the final stages of a terminal disease or condition, or is permanently unconscious based upon appropriate tests and studies. This confirmation by the attending physicians that an individual has a terminal disease or condition is reviewed by DDS medical staff (Health Services Directors and in some cases Director of Health and Clinical Services).
For the 178 mortality cases reviewed in FY 2014
Mortality Annual Report - 2014
Issue Date: November 2015 Section Three Continued
137 cases had a DNR order in place
96% of the DNR orders were formally reviewed by DDS
100% of the DNR orders met the established DDS medical criteria
In 4% of all cases in which a DNR was ordered by a medical practitioner DDS was not notified prior to the
implementation of the DNR order as is required by DDS procedure. However, the DDS mortality review
process determined that in every case but one the medical criteria to support the decision to initiate the
DNR was met. DDS continues to provide written education and support to those agencies that fail to notify of
a DNR implementation.
OF NOTE: Sixty-seven percent (67%) of DDS consumers residing in skilled nursing facilities had a DNR
order in place at the time of their death.
ACCIDENTAL DEATHS
Two cases of accidental death were the result of choking, one was the result of a fall and one was the
result of being hit by a train.
UNANTICIPATED/UNRELATED DEATHS:
Of the 12 deaths that were unanticipated and not related to a known condition 2 were due to an accident, 1
was undetermined and 9 were due to natural causes. The cause of mortality for the unanticipated deaths
due to natural causes was cardiac arrest (7), respiratory failure (1), septicemia (1).
20
Mortality Annual Report - 2014
Issue Date: November 2015 Section Three Continued
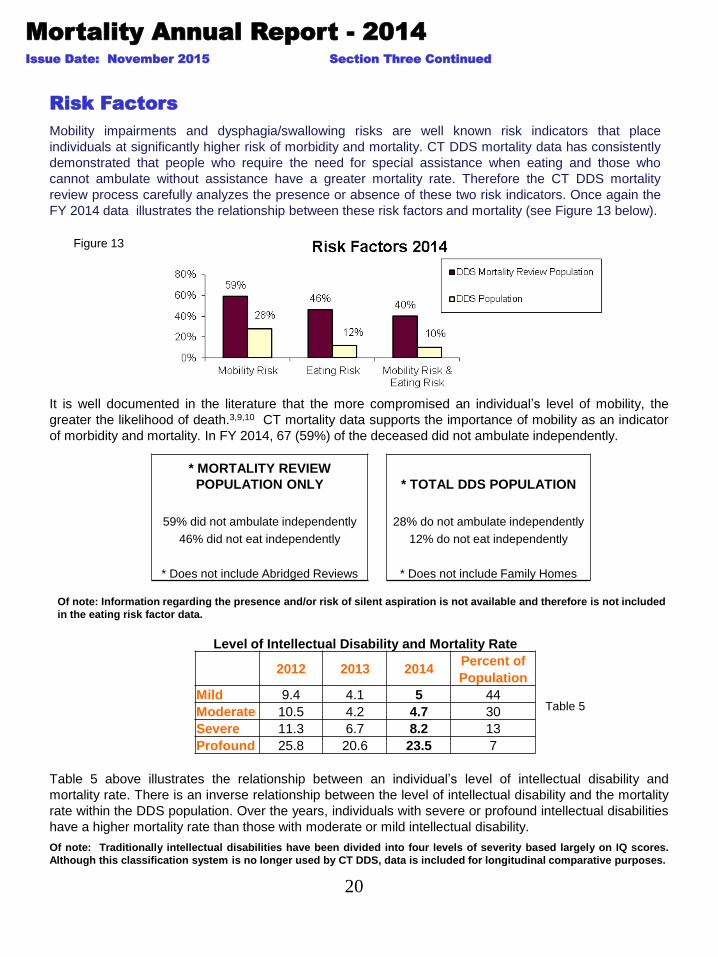
It is well documented in the literature that the more compromised an individual’s level of mobility, the
greater the likelihood of death.3,9,10 CT mortality data supports the importance of mobility as an indicator
of morbidity and mortality. In FY 2014, 67 (59%) of the deceased did not ambulate independently.
Figure 13
Risk Factors
Mobility impairments and dysphagia/swallowing risks are well known risk indicators that place
individuals at significantly higher risk of morbidity and mortality. CT DDS mortality data has consistently
demonstrated that people who require the need for special assistance when eating and those who
cannot ambulate without assistance have a greater mortality rate. Therefore the CT DDS mortality
review process carefully analyzes the presence or absence of these two risk indicators. Once again the
FY 2014 data illustrates the relationship between these risk factors and mortality (see Figure 13 below).
Of note: Information regarding the presence and/or risk of silent aspiration is not available and therefore is not included
in the eating risk factor data.
* MORTALITY REVIEW
POPULATION ONLY * TOTAL DDS POPULATION
59% did not ambulate independently 28% do not ambulate independently
46% did not eat independently 12% do not eat independently
* Does not include Abridged Reviews * Does not include Family Homes
Table 5
Table 5 above illustrates the relationship between an individual’s level of intellectual disability and
mortality rate. There is an inverse relationship between the level of intellectual disability and the mortality
rate within the DDS population. Over the years, individuals with severe or profound intellectual disabilities
have a higher mortality rate than those with moderate or mild intellectual disability.
Of note: Traditionally intellectual disabilities have been divided into four levels of severity based largely on IQ scores.
Although this classification system is no longer used by CT DDS, data is included for longitudinal comparative purposes.
Level of Intellectual Disability and Mortality Rate
2012 2013 2014
Percent of
Population
Mild 9.4 4.1 5 44
Moderate 10.5 4.2 4.7 30
Severe 11.3 6.7 8.2 13
Profound 25.8 20.6 23.5 7
21
Investigations
Mortality Annual Report - 2014
Issue Date: November 2015 Section Three Continued
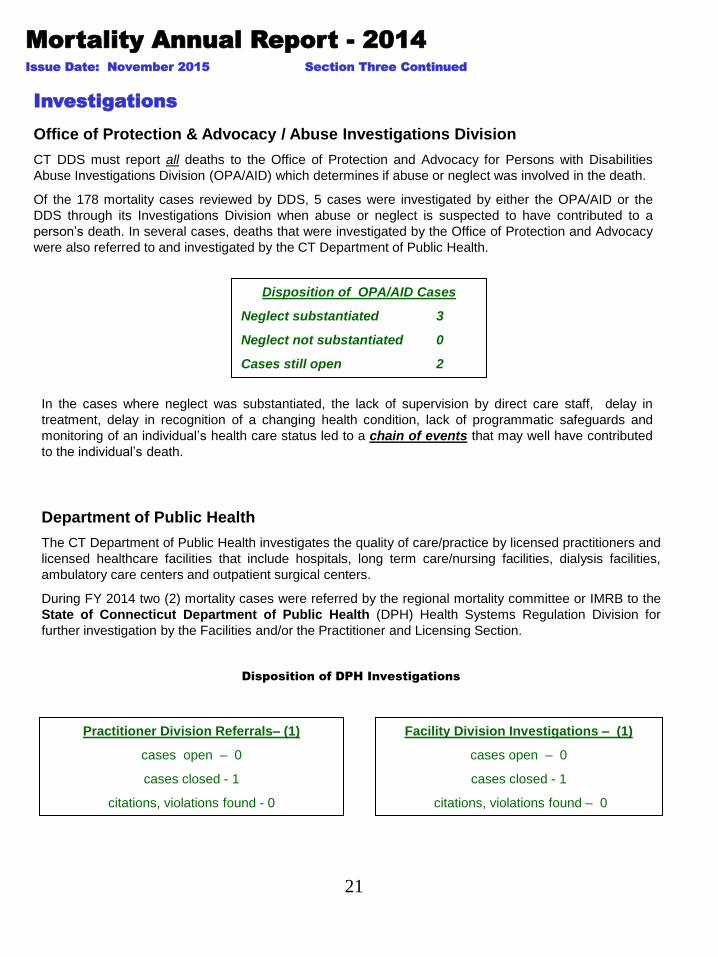
Office of Protection & Advocacy / Abuse Investigations Division
CT DDS must report all deaths to the Office of Protection and Advocacy for Persons with Disabilities
Abuse Investigations Division (OPA/AID) which determines if abuse or neglect was involved in the death.
Of the 178 mortality cases reviewed by DDS, 5 cases were investigated by either the OPA/AID or the
DDS through its Investigations Division when abuse or neglect is suspected to have contributed to a
person’s death. In several cases, deaths that were investigated by the Office of Protection and Advocacy
were also referred to and investigated by the CT Department of Public Health.
Disposition of OPA/AID Cases
Neglect substantiated 3
Neglect not substantiated 0
Cases still open 2
In the cases where neglect was substantiated, the lack of supervision by direct care staff, delay in
treatment, delay in recognition of a changing health condition, lack of programmatic safeguards and
monitoring of an individual’s health care status led to a chain of events that may well have contributed
to the individual’s death.
Department of Public Health
The CT Department of Public Health investigates the quality of care/practice by licensed practitioners and
licensed healthcare facilities that include hospitals, long term care/nursing facilities, dialysis facilities,
ambulatory care centers and outpatient surgical centers.
During FY 2014 two (2) mortality cases were referred by the regional mortality committee or IMRB to the
State of Connecticut Department of Public Health (DPH) Health Systems Regulation Division for
further investigation by the Facilities and/or the Practitioner and Licensing Section.
Disposition of DPH Investigations
Practitioner Division Referrals– (1)
cases open – 0
cases closed - 1
citations, violations found - 0
Facility Division Investigations – (1)
cases open – 0
cases closed - 1
citations, violations found – 0

22
Mortality Annual Report - 2014
Issue Date: November 2015 Section Three Continued
Pronouncement of Death
(Location at Time of Death)
Figure 14 below depicts the location where death was pronounced.
Figure 14
KEY: Location of Death
Hospital = Admission to the hospital as an inpatient, death occurred in the hospital.
Hospital ER = Evaluated in hospital ER, died in ER while receiving treatment, not admitted to the hospital.
All Other = Died where the person lived or worked or other community location.
As can be seen in Figure 15 to the right, 79%
of all deaths reviewed by the mortality review
committee during FY 14 occurred outside of a
DDS operated, licensed or funded residential
setting, this represents an increase in the
number of people dying outside of a DDS
setting compared to FY 13 (77%).
Figure 15
23
Mortality Annual Report - 2014
Issue Date: November 2015 Section Three Continued
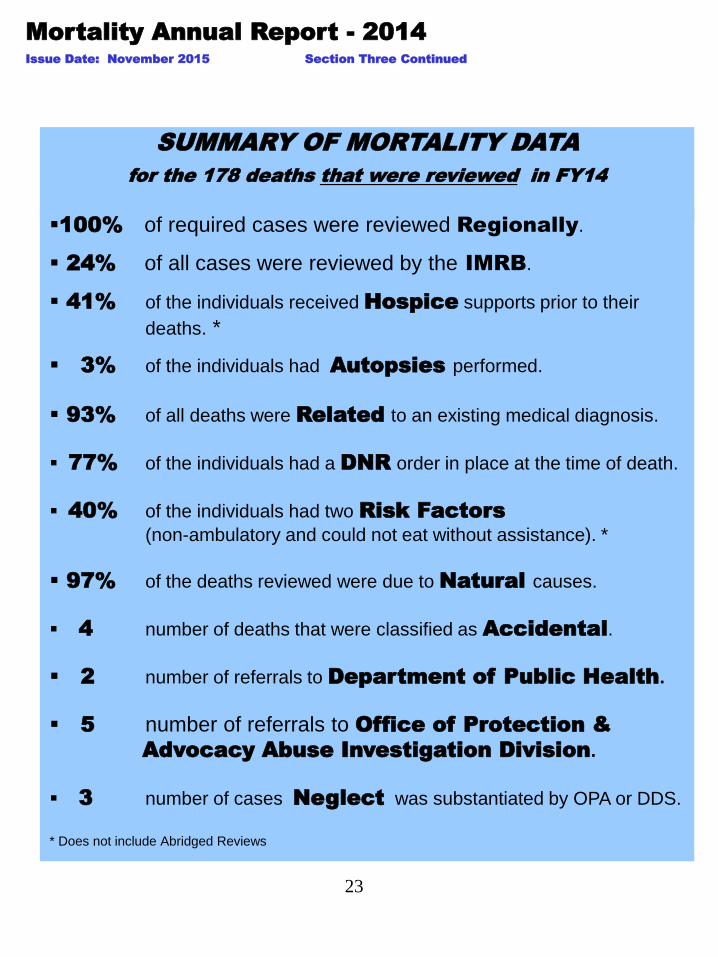
SUMMARY OF MORTALITY DATA
for the 178 deaths that were reviewed in FY14
100% of required cases were reviewed Regionally.
24% of all cases were reviewed by the IMRB.
41% of the individuals received Hospice supports prior to their
deaths. *
3% of the individuals had Autopsies performed.
93% of all deaths were Related to an existing medical diagnosis.
77% of the individuals had a DNR order in place at the time of death.
40% of the individuals had two Risk Factors
(non-ambulatory and could not eat without assistance). *
97% of the deaths reviewed were due to Natural causes.
4 number of deaths that were classified as Accidental.
2 number of referrals to Department of Public Health.
5 number of referrals to Office of Protection &
Advocacy Abuse Investigation Division.
3 number of cases Neglect was substantiated by OPA or DDS.
* Does not include Abridged Reviews
24
For the past thirteen years the Connecticut
Department of Developmental Services has
collected, reviewed and analyzed mortality
data.
Data collection has focused on mortality
and residence, mortality and age, mortality
and gender and leading causes and factors
associated with death.
The consistency of the cumulative
data/statistics from one year to the next
seems to validate and support the trends
and findings identified within the intellectual
disability population group served by the
State of Connecticut Department of
Developmental Services.
Mortality Annual Report - 2014
Issue Date: November 2015
SECTION FOUR: MORTALITY TRENDS CT DDS
25
Mortality Annual Report - 2014
Issue Date: November 2015 Section Four Continued
Figure 16
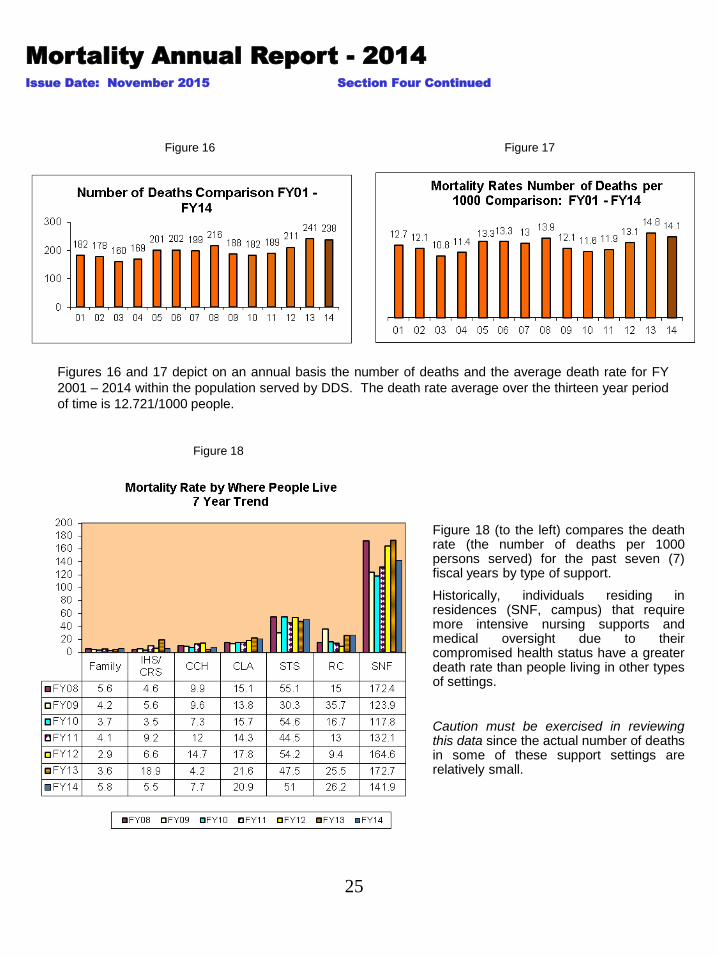
Figure 18 (to the left) compares the death rate (the number of deaths per 1000 persons served) for the past seven (7) fiscal years by type of support.
Historically, individuals residing in residences (SNF, campus) that require more intensive nursing supports and medical oversight due to their compromised health status have a greater death rate than people living in other types of settings.
Caution must be exercised in reviewing this data since the actual number of deaths in some of these support settings are relatively small.
Figures 16 and 17 depict on an annual basis the number of deaths and the average death rate for FY
2001 – 2014 within the population served by DDS. The death rate average over the thirteen year period
of time is 12.721/1000 people.
Figure 17
Figure 18
26
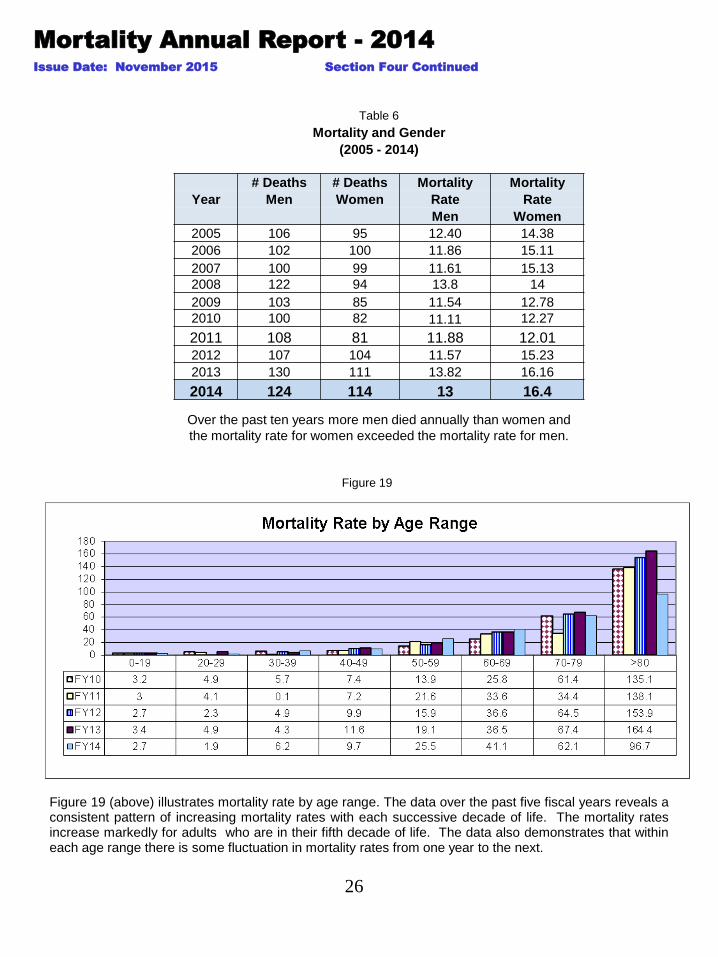
Figure 19 (above) illustrates mortality rate by age range. The data over the past five fiscal years reveals a consistent pattern of increasing mortality rates with each successive decade of life. The mortality rates increase markedly for adults who are in their fifth decade of life. The data also demonstrates that within each age range there is some fluctuation in mortality rates from one year to the next.
Mortality Annual Report - 2014
Issue Date: November 2015 Section Four Continued
Over the past ten years more men died annually than women and
the mortality rate for women exceeded the mortality rate for men.
Figure 19
Table 6
Mortality and Gender
(2005 - 2014)
# Deaths # Deaths Mortality Mortality
Year Men Women Rate Rate
Men Women
2005 106 95 12.40 14.38
2006 102 100 11.86 15.11
2007 100 99 11.61 15.13
2008 122 94 13.8 14
2009 103 85 11.54 12.78
2010 100 82 11.11 12.27
2011 108 81 11.88 12.01 2012 107 104 11.57 15.23
2013 130 111 13.82 16.16
2014 124 114 13 16.4
27
Mortality Annual Report - 2014
Issue Date: November 2015 Section Four Continued
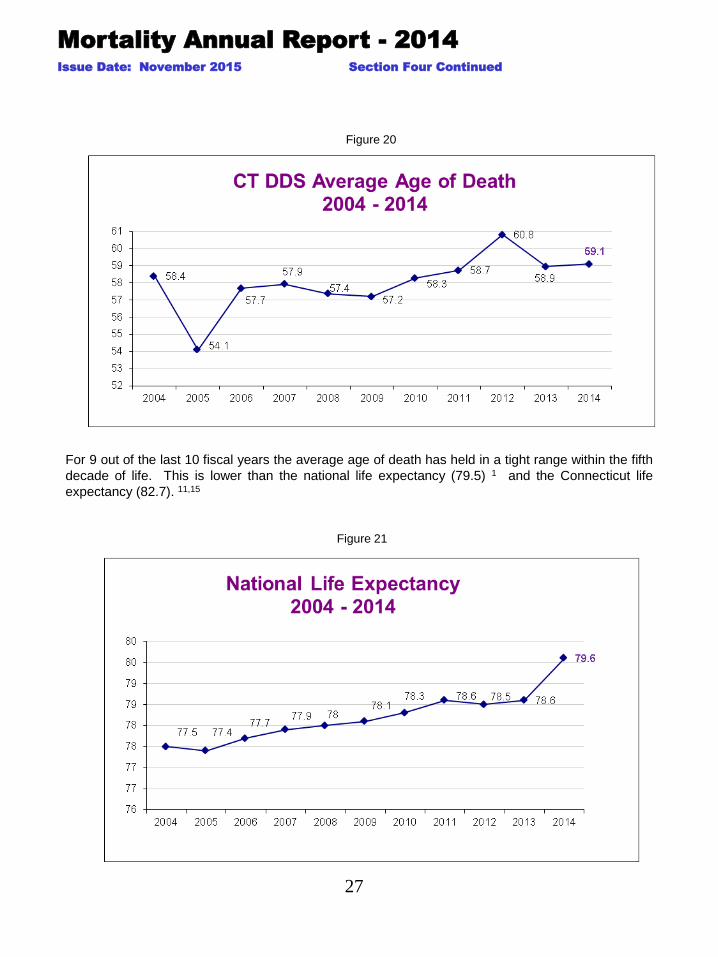
For 9 out of the last 10 fiscal years the average age of death has held in a tight range within the fifth
decade of life. This is lower than the national life expectancy (79.5) 1 and the Connecticut life
expectancy (82.7). 11,15
Figure 20
Figure 21
28
Mortality Annual Report - 2014
Issue Date: November 2015 Section Four Continued
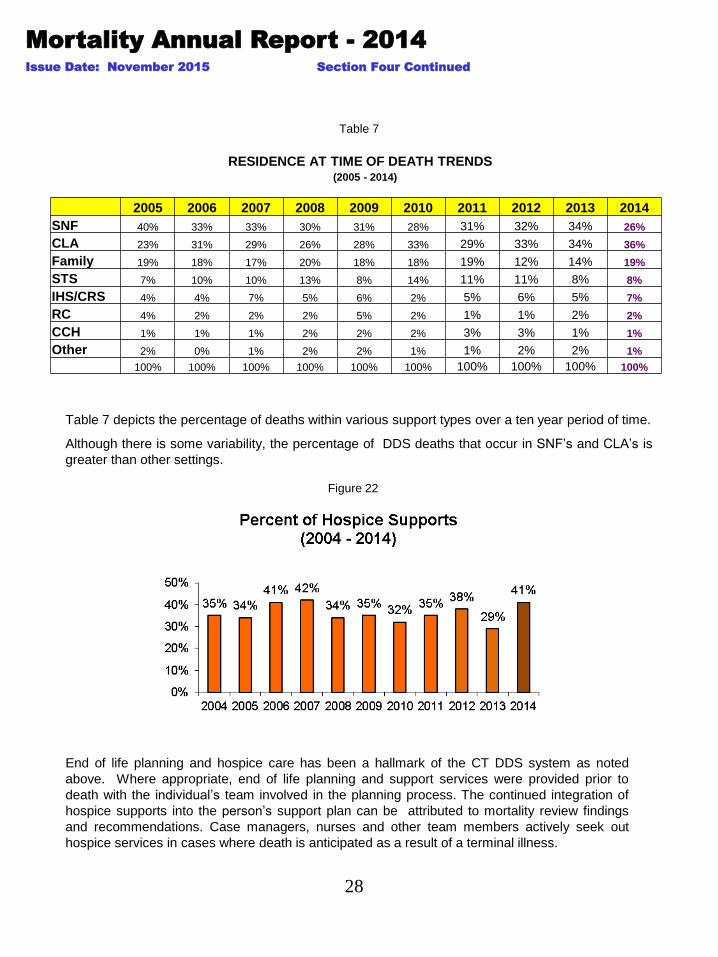
End of life planning and hospice care has been a hallmark of the CT DDS system as noted
above. Where appropriate, end of life planning and support services were provided prior to
death with the individual’s team involved in the planning process. The continued integration of
hospice supports into the person’s support plan can be attributed to mortality review findings
and recommendations. Case managers, nurses and other team members actively seek out
hospice services in cases where death is anticipated as a result of a terminal illness.
Figure 22
Table 7 depicts the percentage of deaths within various support types over a ten year period of time.
Although there is some variability, the percentage of DDS deaths that occur in SNF’s and CLA’s is
greater than other settings.
Table 7
RESIDENCE AT TIME OF DEATH TRENDS (2005 - 2014)
2005 2006 2007 2008 2009 2010 2011 2012 2013 2014
SNF 40% 33% 33% 30% 31% 28% 31% 32% 34% 26%
CLA 23% 31% 29% 26% 28% 33% 29% 33% 34% 36%
Family 19% 18% 17% 20% 18% 18% 19% 12% 14% 19%
STS 7% 10% 10% 13% 8% 14% 11% 11% 8% 8%
IHS/CRS 4% 4% 7% 5% 6% 2% 5% 6% 5% 7%
RC 4% 2% 2% 2% 5% 2% 1% 1% 2% 2%
CCH 1% 1% 1% 2% 2% 2% 3% 3% 1% 1%
Other 2% 0% 1% 2% 2% 1% 1% 2% 2% 1%
100% 100% 100% 100% 100% 100% 100% 100% 100% 100%
29
Mortality Annual Report - 2014
Issue Date: November 2015
.
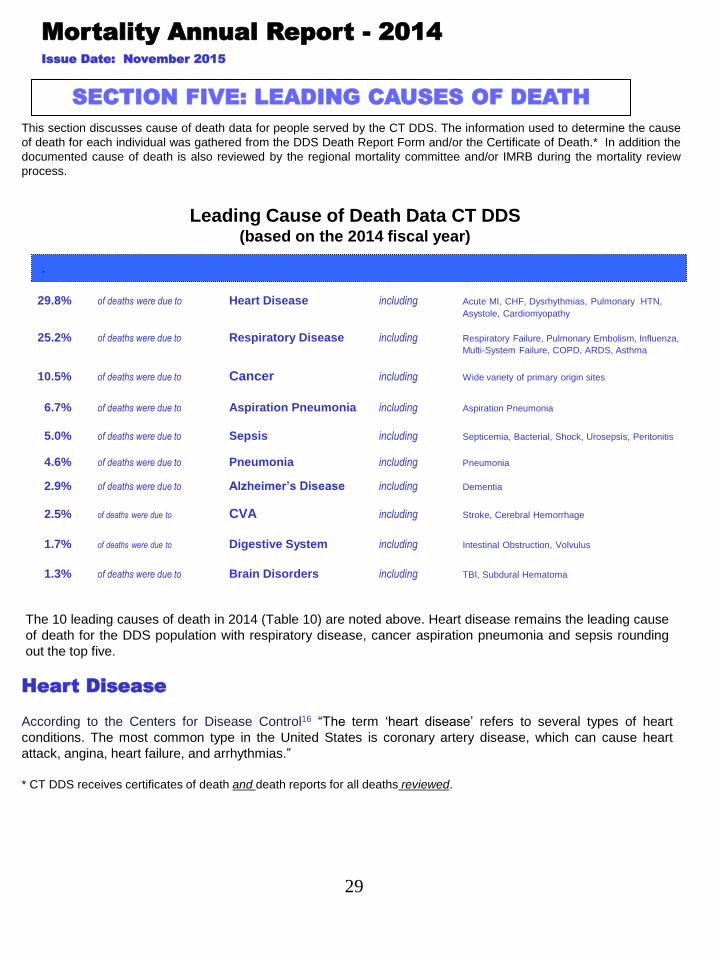
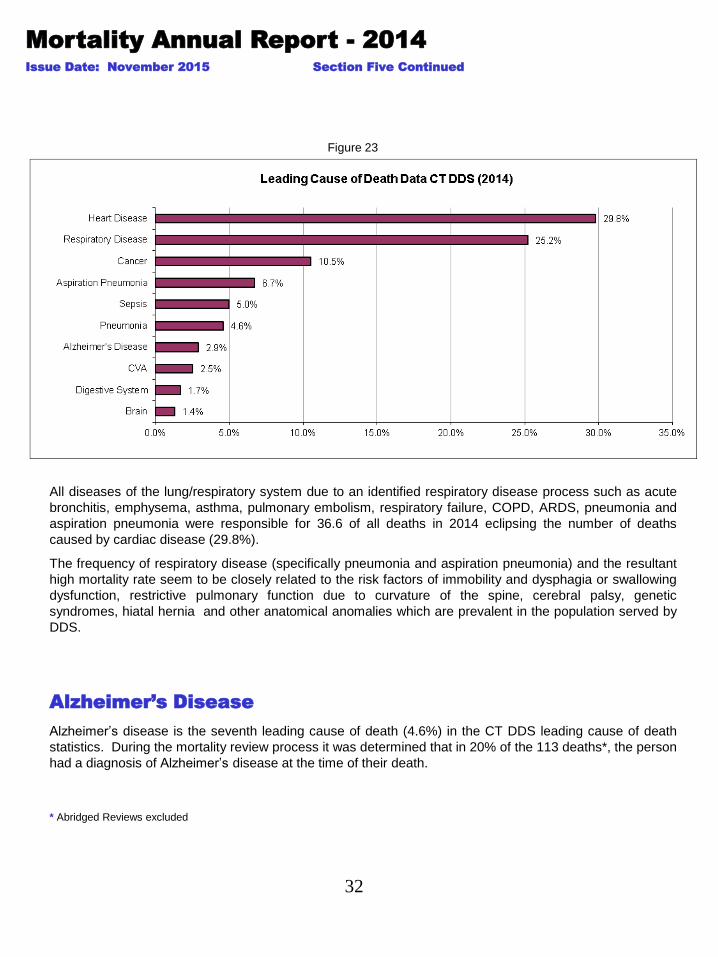
29.8% of deaths were due to Heart Disease including Acute MI, CHF, Dysrhythmias, Pulmonary HTN,
Asystole, Cardiomyopathy
25.2% of deaths were due to Respiratory Disease including Respiratory Failure, Pulmonary Embolism, Influenza,
Multi-System Failure, COPD, ARDS, Asthma
10.5% of deaths were due to Cancer including Wide variety of primary origin sites
6.7% of deaths were due to Aspiration Pneumonia including Aspiration Pneumonia
5.0% of deaths were due to Sepsis including Septicemia, Bacterial, Shock, Urosepsis, Peritonitis
4.6% of deaths were due to Pneumonia including Pneumonia
2.9% of deaths were due to Alzheimer’s Disease including Dementia
2.5% of deaths were due to CVA including Stroke, Cerebral Hemorrhage
1.7% of deaths were due to Digestive System including Intestinal Obstruction, Volvulus
1.3% of deaths were due to Brain Disorders including TBI, Subdural Hematoma
Leading Cause of Death Data CT DDS (based on the 2014 fiscal year)
Heart Disease
According to the Centers for Disease Control16 “The term ‘heart disease’ refers to several types of heart
conditions. The most common type in the United States is coronary artery disease, which can cause heart
attack, angina, heart failure, and arrhythmias.”
* CT DDS receives certificates of death and death reports for all deaths reviewed.
SECTION FIVE: LEADING CAUSES OF DEATH
The 10 leading causes of death in 2014 (Table 10) are noted above. Heart disease remains the leading cause
of death for the DDS population with respiratory disease, cancer aspiration pneumonia and sepsis rounding
out the top five.
This section discusses cause of death data for people served by the CT DDS. The information used to determine the cause
of death for each individual was gathered from the DDS Death Report Form and/or the Certificate of Death.* In addition the
documented cause of death is also reviewed by the regional mortality committee and/or IMRB during the mortality review
process.
30
FY 06 17 12%
FY 07 11 8%
FY 08 17 13%
FY 09 14 11%
FY 10 14 10%
FY 11 6 5%
FY 12 13 9%
FY 13 3 2%
FY 14 6 3%
Mortality Annual Report - 2014
Issue Date: November 2015 Section Four Continued
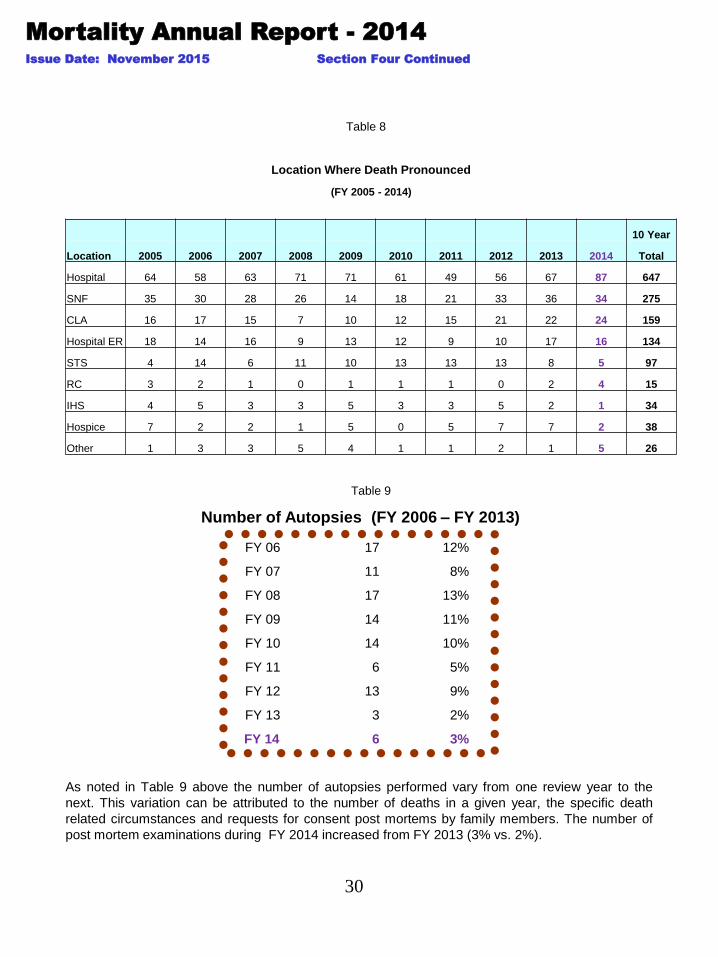
Table 9
Number of Autopsies (FY 2006 – FY 2013)
Table 8
As noted in Table 9 above the number of autopsies performed vary from one review year to the
next. This variation can be attributed to the number of deaths in a given year, the specific death
related circumstances and requests for consent post mortems by family members. The number of
post mortem examinations during FY 2014 increased from FY 2013 (3% vs. 2%).
Location Where Death Pronounced
(FY 2005 - 2014)
10 Year
Location 2005 2006 2007 2008 2009 2010 2011 2012 2013 2014 Total
Hospital 64 58 63 71 71 61 49 56 67 87 647
SNF 35 30 28 26 14 18 21 33 36 34 275
CLA 16 17 15 7 10 12 15 21 22 24 159
Hospital ER 18 14 16 9 13 12 9 10 17 16 134
STS 4 14 6 11 10 13 13 13 8 5 97
RC 3 2 1 0 1 1 1 0 2 4 15
IHS 4 5 3 3 5 3 3 5 2 1 34
Hospice 7 2 2 1 5 0 5 7 7 2 38
Other 1 3 3 5 4 1 1 2 1 5 26
31
The 2014 leading cause of death data demonstrates the significant impact of respiratory disease in the
CT DDS population.
An analysis of the cases reviewed by the CT DDS mortality review process revealed that slightly more
men died as a result of respiratory disease/aspiration pneumonia/pneumonia than women but that they
both had the same average age of death.*
Respiratory Disease
As in the general population, many of the individuals served by DDS who died as a result of
cardiovascular disease had at least one or more identified risk factors prior to their death such as high
blood cholesterol, high blood pressure, coronary artery disease, peripheral vascular disease, congenital
heart defects, congestive heart failure, physical inactivity, obesity and diabetes mellitus.
In the general population 80% of people who die of coronary heart disease are 65 or older 17 as
compared with only 43% of individuals in the CT DDS population. Of the remaining cardiac related
deaths in the DDS population group: Seventeen percent (17%) of the cardiac deaths occurred prior to the
age of 50 years and 40% percent of the cardiac deaths occurred between the ages of 50-65.
There is a greater prevalence of congenital heart conditions and atrioventricular septal defects found in
people with Down syndrome.12 CT DDS data reveals that the incidence of cardiac deaths reported for
people with Down syndrome was higher than that of the DDS population.
Mortality Annual Report - 2014
Issue Date: November 2015 Section Five Continued
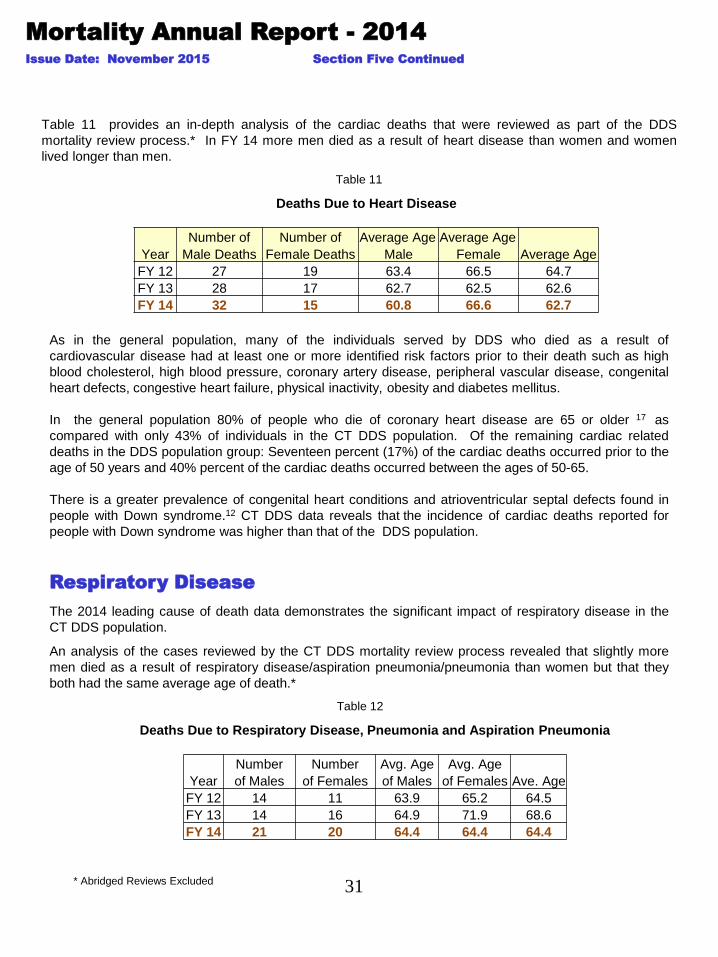
Table 11 provides an in-depth analysis of the cardiac deaths that were reviewed as part of the DDS
mortality review process.* In FY 14 more men died as a result of heart disease than women and women
lived longer than men.
Table 11
Table 12
* Abridged Reviews Excluded
Deaths Due to Heart Disease
Number of Number of Average Age Average Age
Year Male Deaths Female Deaths Male Female Average Age
FY 12 27 19 63.4 66.5 64.7
FY 13 28 17 62.7 62.5 62.6
FY 14 32 15 60.8 66.6 62.7
Deaths Due to Respiratory Disease, Pneumonia and Aspiration Pneumonia
Number Number Avg. Age Avg. Age
Year of Males of Females of Males of Females Ave. Age
FY 12 14 11 63.9 65.2 64.5
FY 13 14 16 64.9 71.9 68.6
FY 14 21 20 64.4 64.4 64.4
32
Alzheimer’s disease is the seventh leading cause of death (4.6%) in the CT DDS leading cause of death
statistics. During the mortality review process it was determined that in 20% of the 113 deaths*, the person
had a diagnosis of Alzheimer’s disease at the time of their death.
Mortality Annual Report - 2014
Issue Date: November 2015 Section Five Continued
Alzheimer’s Disease
Figure 23
All diseases of the lung/respiratory system due to an identified respiratory disease process such as acute
bronchitis, emphysema, asthma, pulmonary embolism, respiratory failure, COPD, ARDS, pneumonia and
aspiration pneumonia were responsible for 36.6 of all deaths in 2014 eclipsing the number of deaths
caused by cardiac disease (29.8%).
The frequency of respiratory disease (specifically pneumonia and aspiration pneumonia) and the resultant
high mortality rate seem to be closely related to the risk factors of immobility and dysphagia or swallowing
dysfunction, restrictive pulmonary function due to curvature of the spine, cerebral palsy, genetic
syndromes, hiatal hernia and other anatomical anomalies which are prevalent in the population served by
DDS.
* Abridged Reviews excluded
33
Mortality Annual Report - 2014
Issue Date: November 2015 Section Five Continued
Table 13
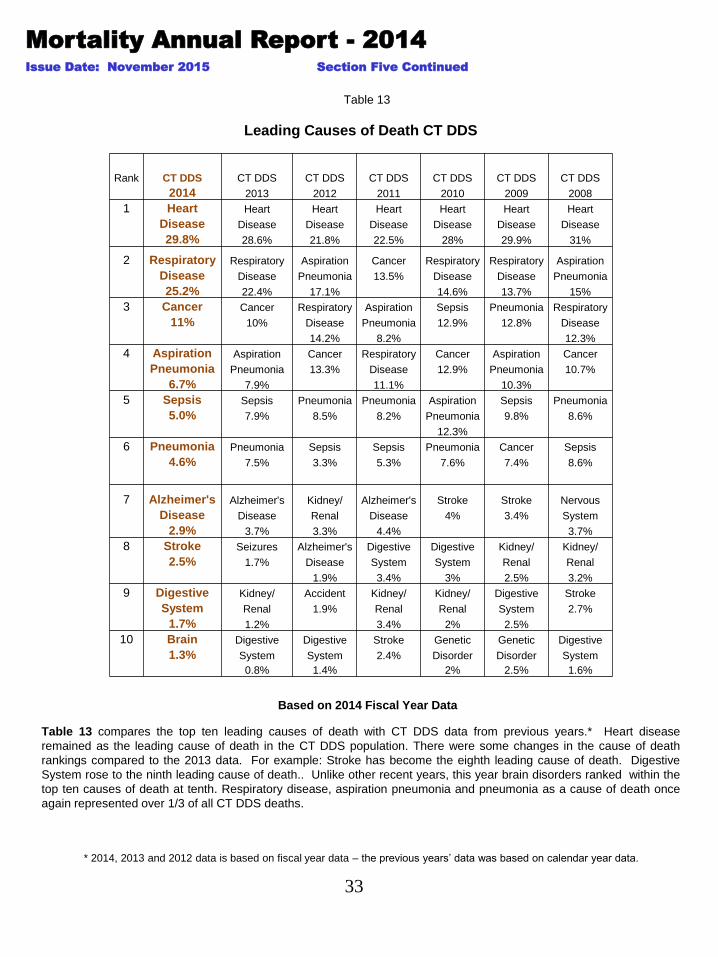
Table 13 compares the top ten leading causes of death with CT DDS data from previous years.* Heart disease
remained as the leading cause of death in the CT DDS population. There were some changes in the cause of death
rankings compared to the 2013 data. For example: Stroke has become the eighth leading cause of death. Digestive
System rose to the ninth leading cause of death.. Unlike other recent years, this year brain disorders ranked within the
top ten causes of death at tenth. Respiratory disease, aspiration pneumonia and pneumonia as a cause of death once
again represented over 1/3 of all CT DDS deaths.
Based on 2014 Fiscal Year Data
* 2014, 2013 and 2012 data is based on fiscal year data – the previous years’ data was based on calendar year data.
Leading Causes of Death CT DDS
Rank CT DDS CT DDS CT DDS CT DDS CT DDS CT DDS CT DDS
2014 2013 2012 2011 2010 2009 2008
1 Heart Heart Heart Heart Heart Heart Heart
Disease Disease Disease Disease Disease Disease Disease
29.8% 28.6% 21.8% 22.5% 28% 29.9% 31%
2 Respiratory Respiratory Aspiration Cancer Respiratory Respiratory Aspiration
Disease Disease Pneumonia 13.5% Disease Disease Pneumonia
25.2% 22.4% 17.1% 14.6% 13.7% 15%
3 Cancer Cancer Respiratory Aspiration Sepsis Pneumonia Respiratory
11% 10% Disease Pneumonia 12.9% 12.8% Disease
14.2% 8.2% 12.3%
4 Aspiration Aspiration Cancer Respiratory Cancer Aspiration Cancer
Pneumonia Pneumonia 13.3% Disease 12.9% Pneumonia 10.7%
6.7% 7.9% 11.1% 10.3%
5 Sepsis Sepsis Pneumonia Pneumonia Aspiration Sepsis Pneumonia
5.0% 7.9% 8.5% 8.2% Pneumonia 9.8% 8.6%
12.3%
6 Pneumonia Pneumonia Sepsis Sepsis Pneumonia Cancer Sepsis
4.6% 7.5% 3.3% 5.3% 7.6% 7.4% 8.6%
7 Alzheimer's Alzheimer's Kidney/ Alzheimer's Stroke Stroke Nervous
Disease Disease Renal Disease 4% 3.4% System
2.9% 3.7% 3.3% 4.4% 3.7%
8 Stroke Seizures Alzheimer's Digestive Digestive Kidney/ Kidney/
2.5% 1.7% Disease System System Renal Renal
1.9% 3.4% 3% 2.5% 3.2%
9 Digestive Kidney/ Accident Kidney/ Kidney/ Digestive Stroke
System Renal 1.9% Renal Renal System 2.7%
1.7% 1.2% 3.4% 2% 2.5%
10 Brain Digestive Digestive Stroke Genetic Genetic Digestive
1.3% System System 2.4% Disorder Disorder System
0.8% 1.4% 2% 2.5% 1.6%
34
Mortality Annual Report - 2014
Issue Date: November 2015 Section Five Continued
Leading Causes of Death for People with Down Syndrome
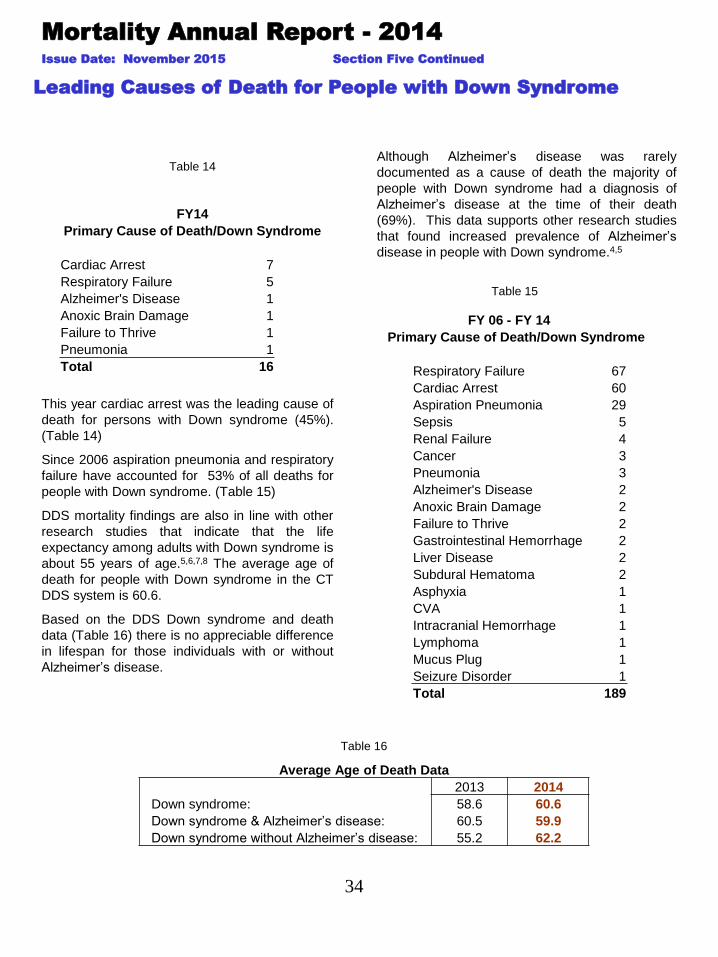
This year cardiac arrest was the leading cause of
death for persons with Down syndrome (45%).
(Table 14)
Since 2006 aspiration pneumonia and respiratory
failure have accounted for 53% of all deaths for
people with Down syndrome. (Table 15)
DDS mortality findings are also in line with other
research studies that indicate that the life
expectancy among adults with Down syndrome is
about 55 years of age.5,6,7,8 The average age of
death for people with Down syndrome in the CT
DDS system is 60.6.
Based on the DDS Down syndrome and death
data (Table 16) there is no appreciable difference
in lifespan for those individuals with or without
Alzheimer’s disease.
Table 16
Although Alzheimer’s disease was rarely
documented as a cause of death the majority of
people with Down syndrome had a diagnosis of
Alzheimer’s disease at the time of their death
(69%). This data supports other research studies
that found increased prevalence of Alzheimer’s
disease in people with Down syndrome.4,5
Table 14
Table 15
FY14
Primary Cause of Death/Down Syndrome
Cardiac Arrest 7
Respiratory Failure 5
Alzheimer's Disease 1
Anoxic Brain Damage 1
Failure to Thrive 1
Pneumonia 1
Total 16
FY 06 - FY 14
Primary Cause of Death/Down Syndrome
Respiratory Failure 67
Cardiac Arrest 60
Aspiration Pneumonia 29
Sepsis 5
Renal Failure 4
Cancer 3
Pneumonia 3
Alzheimer's Disease 2
Anoxic Brain Damage 2
Failure to Thrive 2
Gastrointestinal Hemorrhage 2
Liver Disease 2
Subdural Hematoma 2
Asphyxia 1
CVA 1
Intracranial Hemorrhage 1
Lymphoma 1
Mucus Plug 1
Seizure Disorder 1
Total 189
Average Age of Death Data
2013 2014
Down syndrome: 58.6 60.6
Down syndrome & Alzheimer’s disease: 60.5 59.9
Down syndrome without Alzheimer’s disease: 55.2 62.2
35
Mortality Annual Report - 2014
Issue Date: November 2015 Section Five Continued
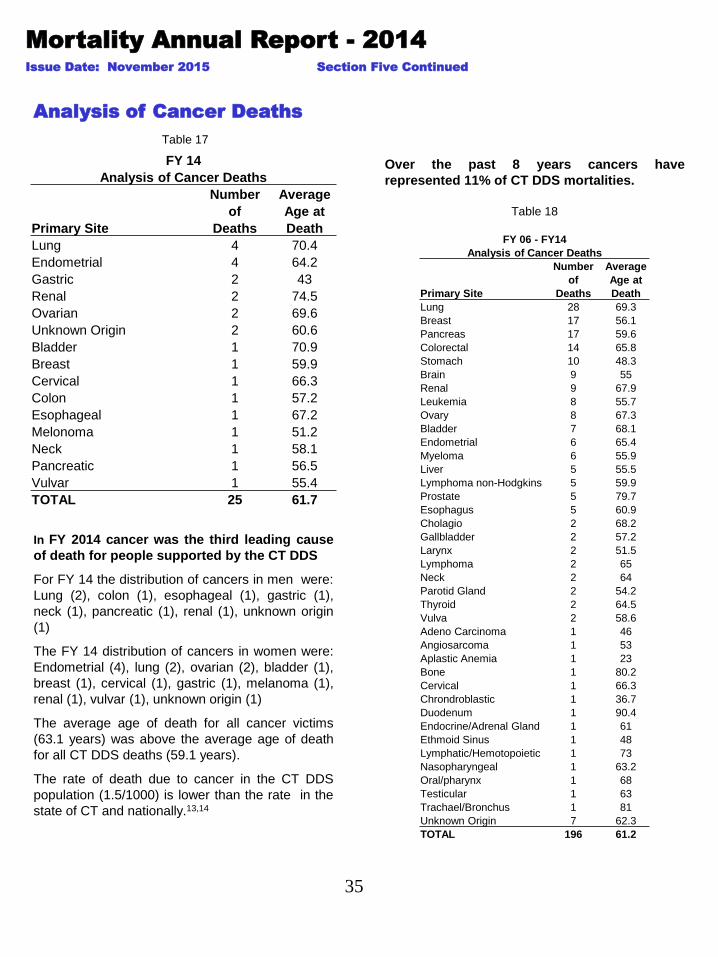
In FY 2014 cancer was the third leading cause
of death for people supported by the CT DDS
For FY 14 the distribution of cancers in men were:
Lung (2), colon (1), esophageal (1), gastric (1),
neck (1), pancreatic (1), renal (1), unknown origin
(1)
The FY 14 distribution of cancers in women were:
Endometrial (4), lung (2), ovarian (2), bladder (1),
breast (1), cervical (1), gastric (1), melanoma (1),
renal (1), vulvar (1), unknown origin (1)
The average age of death for all cancer victims
(63.1 years) was above the average age of death
for all CT DDS deaths (59.1 years).
The rate of death due to cancer in the CT DDS
population (1.5/1000) is lower than the rate in the
state of CT and nationally.13,14
Table 17
Analysis of Cancer Deaths
Over the past 8 years cancers have
represented 11% of CT DDS mortalities.
Table 18
FY 14
Analysis of Cancer Deaths
Number Average
of Age at
Primary Site Deaths Death
Lung 4 70.4
Endometrial 4 64.2
Gastric 2 43
Renal 2 74.5
Ovarian 2 69.6
Unknown Origin 2 60.6
Bladder 1 70.9
Breast 1 59.9
Cervical 1 66.3
Colon 1 57.2
Esophageal 1 67.2
Melonoma 1 51.2
Neck 1 58.1
Pancreatic 1 56.5
Vulvar 1 55.4
TOTAL 25 61.7
FY 06 - FY14
Analysis of Cancer Deaths
Number Average
of Age at
Primary Site Deaths Death
Lung 28 69.3
Breast 17 56.1
Pancreas 17 59.6
Colorectal 14 65.8
Stomach 10 48.3
Brain 9 55
Renal 9 67.9
Leukemia 8 55.7
Ovary 8 67.3
Bladder 7 68.1
Endometrial 6 65.4
Myeloma 6 55.9
Liver 5 55.5
Lymphoma non-Hodgkins 5 59.9
Prostate 5 79.7
Esophagus 5 60.9
Cholagio 2 68.2
Gallbladder 2 57.2
Larynx 2 51.5
Lymphoma 2 65
Neck 2 64
Parotid Gland 2 54.2
Thyroid 2 64.5
Vulva 2 58.6
Adeno Carcinoma 1 46
Angiosarcoma 1 53
Aplastic Anemia 1 23
Bone 1 80.2
Cervical 1 66.3
Chrondroblastic 1 36.7
Duodenum 1 90.4
Endocrine/Adrenal Gland 1 61
Ethmoid Sinus 1 48
Lymphatic/Hemotopoietic 1 73
Nasopharyngeal 1 63.2
Oral/pharynx 1 68
Testicular 1 63
Trachael/Bronchus 1 81
Unknown Origin 7 62.3
TOTAL 196 61.2
36
Mortality Annual Report - 2014
Issue Date: November 2015
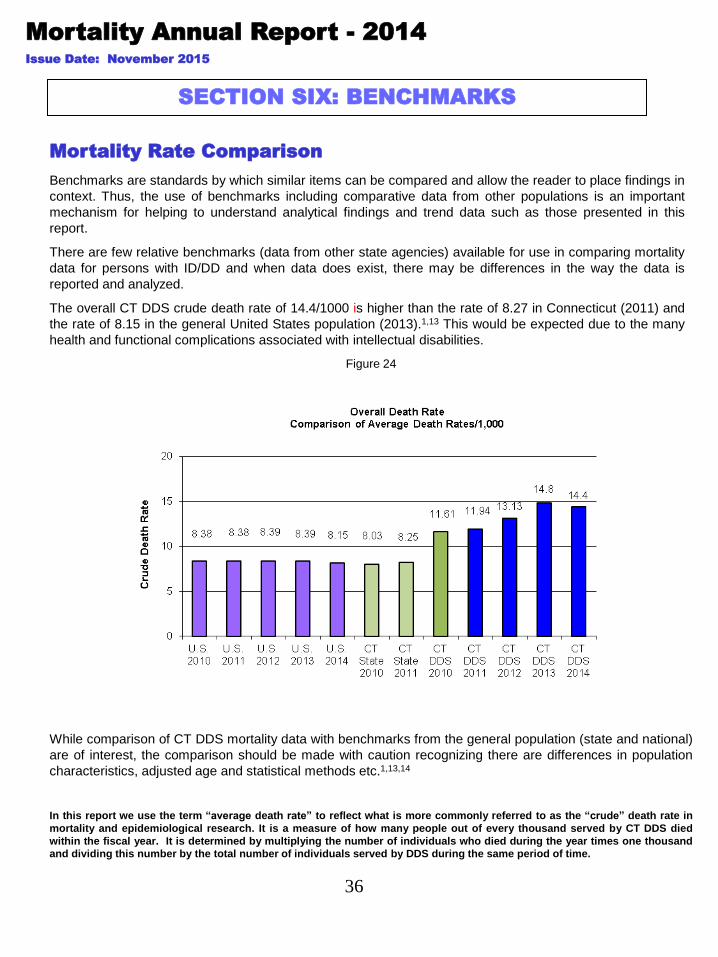
Figure 24
While comparison of CT DDS mortality data with benchmarks from the general population (state and national)
are of interest, the comparison should be made with caution recognizing there are differences in population
characteristics, adjusted age and statistical methods etc.1,13,14
In this report we use the term “average death rate” to reflect what is more commonly referred to as the “crude” death rate in
mortality and epidemiological research. It is a measure of how many people out of every thousand served by CT DDS died
within the fiscal year. It is determined by multiplying the number of individuals who died during the year times one thousand
and dividing this number by the total number of individuals served by DDS during the same period of time.
SECTION SIX: BENCHMARKS
Benchmarks are standards by which similar items can be compared and allow the reader to place findings in
context. Thus, the use of benchmarks including comparative data from other populations is an important
mechanism for helping to understand analytical findings and trend data such as those presented in this
report.
There are few relative benchmarks (data from other state agencies) available for use in comparing mortality
data for persons with ID/DD and when data does exist, there may be differences in the way the data is
reported and analyzed.
The overall CT DDS crude death rate of 14.4/1000 is higher than the rate of 8.27 in Connecticut (2011) and
the rate of 8.15 in the general United States population (2013).1,13 This would be expected due to the many
health and functional complications associated with intellectual disabilities.
Mortality Rate Comparison
37
Mortality Annual Report - 2014
Issue Date: November 2015 Section Six Continued
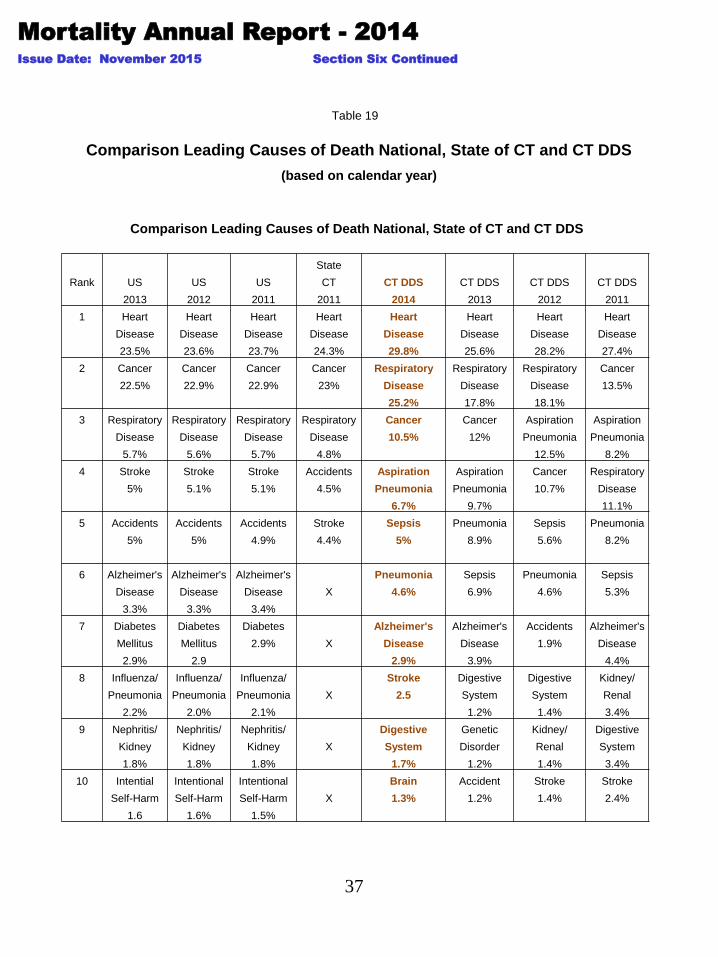
Table 19
Comparison Leading Causes of Death National, State of CT and CT DDS
(based on calendar year)
Comparison Leading Causes of Death National, State of CT and CT DDS
State
Rank US US US CT CT DDS CT DDS CT DDS CT DDS
2013 2012 2011 2011 2014 2013 2012 2011
1 Heart Heart Heart Heart Heart Heart Heart Heart
Disease Disease Disease Disease Disease Disease Disease Disease
23.5% 23.6% 23.7% 24.3% 29.8% 25.6% 28.2% 27.4%
2 Cancer Cancer Cancer Cancer Respiratory Respiratory Respiratory Cancer
22.5% 22.9% 22.9% 23% Disease Disease Disease 13.5%
25.2% 17.8% 18.1%
3 Respiratory Respiratory Respiratory Respiratory Cancer Cancer Aspiration Aspiration
Disease Disease Disease Disease 10.5% 12% Pneumonia Pneumonia
5.7% 5.6% 5.7% 4.8% 12.5% 8.2%
4 Stroke Stroke Stroke Accidents Aspiration Aspiration Cancer Respiratory
5% 5.1% 5.1% 4.5% Pneumonia Pneumonia 10.7% Disease
6.7% 9.7% 11.1%
5 Accidents Accidents Accidents Stroke Sepsis Pneumonia Sepsis Pneumonia
5% 5% 4.9% 4.4% 5% 8.9% 5.6% 8.2%
6 Alzheimer's Alzheimer's Alzheimer's Pneumonia Sepsis Pneumonia Sepsis
Disease Disease Disease X 4.6% 6.9% 4.6% 5.3%
3.3% 3.3% 3.4%
7 Diabetes Diabetes Diabetes Alzheimer's Alzheimer's Accidents Alzheimer's
Mellitus Mellitus 2.9% X Disease Disease 1.9% Disease
2.9% 2.9 2.9% 3.9% 4.4%
8 Influenza/ Influenza/ Influenza/ Stroke Digestive Digestive Kidney/
Pneumonia Pneumonia Pneumonia X 2.5 System System Renal
2.2% 2.0% 2.1% 1.2% 1.4% 3.4%
9 Nephritis/ Nephritis/ Nephritis/ Digestive Genetic Kidney/ Digestive
Kidney Kidney Kidney X System Disorder Renal System
1.8% 1.8% 1.8% 1.7% 1.2% 1.4% 3.4%
10 Intential Intentional Intentional Brain Accident Stroke Stroke
Self-Harm Self-Harm Self-Harm X 1.3% 1.2% 1.4% 2.4%
1.6 1.6% 1.5%

38
Mortality Annual Report - 2014
Issue Date: November 2015 Section Six
Continued
Leading Causes of Death Benchmarks: National, State of CT
and CT DDS
Table 19 compares the top ten leading causes of death for people served by CT DDS with vital statistics benchmarks
data for the State of Connecticut, and United States. Year over year data comparisons continue to demonstrate
consistency in the leading causes of death data. 1,13,14
Heart Disease: (Due to various cardiac diagnoses) is the number one cause of death for all of the referenced
populations. As in past years the prevalence of cardiac disease is slightly greater in the DDS population at 29.8% versus
24.3% in the CT general population and 23.5% nationally.
Respiratory Diseases: Is the second leading cause of death in the CT DDS population (25.2%). This category which
includes influenza causes death in the CT DDS population at a rate 4 times the rates reported in the CT and national vital
statistics data base (4.8%) and (5.7%) respectively .
Cancer: Is the third leading cause of death in the CT DDS population responsible for 10.5% of deaths. Unlike the other
mentioned leading causes of death, cancer in DDS occurs less frequently in the CT DDS population than in the CT
(23%) and national (22.5) general populations.
Aspiration Pneumonia: Is the forth leading cause of death in the DDS population (6.7%) and as mentioned earlier in this
report is unique to the ID/DD population due to many factors including the prevalence of dysphagia, Down syndrome,
Alzheimer’s disease and enteral feedings. In comparison, aspiration pneumonia is not reflected in the state of CT or
national vital statistics as one of the top ten leading causes of death.
Septicemia: Originating from various sites and usually acute in onset is the fifth leading cause of death in the CT DDS
population resulting in 5% of deaths . Sepsis is not reflected in the state of CT or national vital statistics as one of the top
ten leading causes of death.
Pneumonia: Is the sixth leading cause of death accounting for 4.6% of CT DDS deaths compared to <3% in the US
population. Many of the multiple co-morbidities found in the CT DDS ID/DD population such as cerebral palsy, congenital
syndromes, epilepsy, GERD, hiatal hernia, and immuno-deficiency disorders result in a compromised pulmonary system
that makes this population vulnerable for developing pneumonia.
Alzheimer’s Disease: In calendar year 2014 the percent of deaths resulting from Alzheimer’s Disease in the CT DDS
system (2.9%) was the seventh leading causes of death and was slightly lower than the number of Alzheimer’s Disease
deaths in the 2013 US population (3.3%).
Caution: While comparison of CT DDS mortality data with benchmarks from the general population (state and national)
are of interest, they are not very practical for direct comparison purposes due to differences in population characteristics,
adjusted age and statistical methods etc. For example, the added medical health concerns (co-morbidities) inherent in
people with intellectual disabilities are related to a greater mortality rate. Also, many individuals in the CT DDS system
had a diagnosis of dysphagia and or gastro esophageal reflux disease at the time of their death. Both of which have been
linked to aspiration pneumonia, respiratory failure, sepsis and death in the ID/DD population.2,9
Seasonal variations in mortality require consistency when conducting comparative analysis and, therefore, the
previous data regarding leading causes of death is based on the calendar year 2013 Leading cause of death
data for the calendar year will allow benchmark data from CT DDS to be consistent with Connecticut and
national mortality benchmarks developed for the general population calendar year.
39
Mortality Annual Report - 2014
Issue Date: November 2015
SECTION SEVEN: SUMMARY MORTALITY CASE
REVIEW FINDINGS
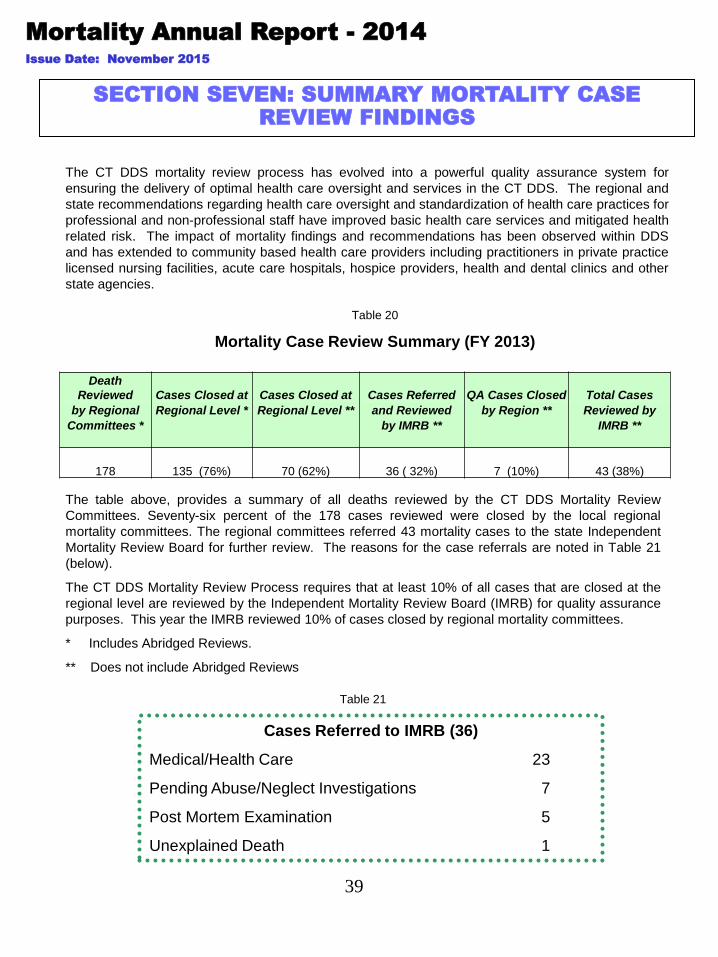
The table above, provides a summary of all deaths reviewed by the CT DDS Mortality Review
Committees. Seventy-six percent of the 178 cases reviewed were closed by the local regional
mortality committees. The regional committees referred 43 mortality cases to the state Independent
Mortality Review Board for further review. The reasons for the case referrals are noted in Table 21
(below).
The CT DDS Mortality Review Process requires that at least 10% of all cases that are closed at the
regional level are reviewed by the Independent Mortality Review Board (IMRB) for quality assurance
purposes. This year the IMRB reviewed 10% of cases closed by regional mortality committees.
* Includes Abridged Reviews.
** Does not include Abridged Reviews
Table 20
Mortality Case Review Summary (FY 2013)
Cases Referred to IMRB (36)
Medical/Health Care 23
Pending Abuse/Neglect Investigations 7
Post Mortem Examination 5
Unexplained Death 1
The CT DDS mortality review process has evolved into a powerful quality assurance system for
ensuring the delivery of optimal health care oversight and services in the CT DDS. The regional and
state recommendations regarding health care oversight and standardization of health care practices for
professional and non-professional staff have improved basic health care services and mitigated health
related risk. The impact of mortality findings and recommendations has been observed within DDS
and has extended to community based health care providers including practitioners in private practice
licensed nursing facilities, acute care hospitals, hospice providers, health and dental clinics and other
state agencies.
Table 21
Death
Reviewed Cases Closed at Cases Closed at Cases Referred QA Cases Closed Total Cases
by Regional Regional Level * Regional Level ** and Reviewed by Region ** Reviewed by
Committees * by IMRB ** IMRB **
178 135 (76%) 70 (62%) 36 ( 32%) 7 (10%) 43 (38%)
40
Mortality Annual Report - 2014
Issue Date: November 2015 Section Seven Continued
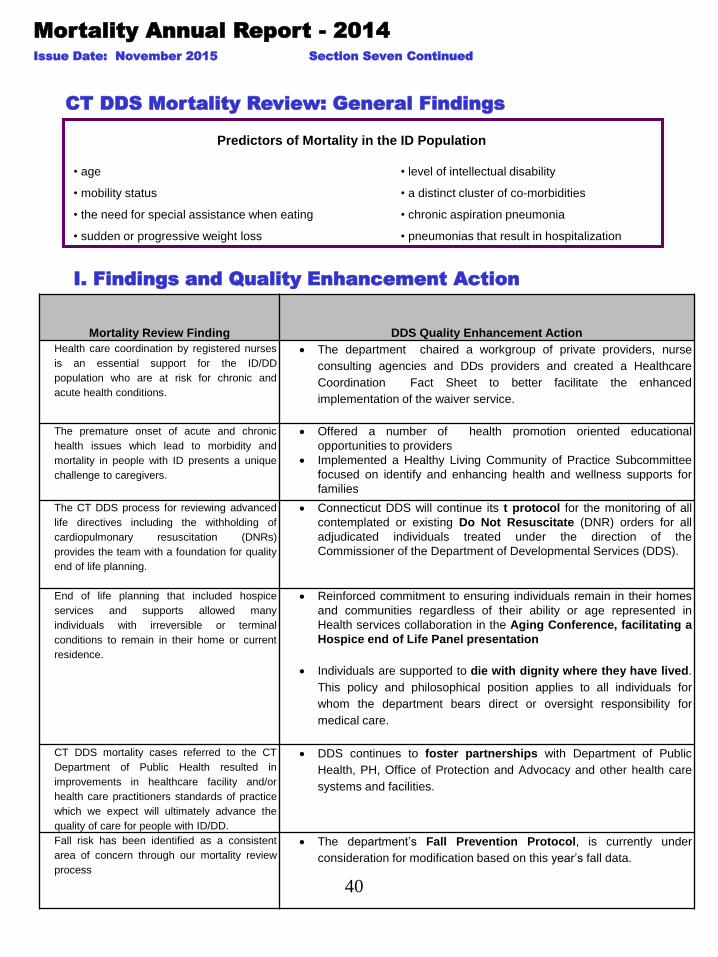
CT DDS Mortality Review: General Findings
• age
• mobility status
• the need for special assistance when eating
• sudden or progressive weight loss
• level of intellectual disability
• a distinct cluster of co-morbidities
• chronic aspiration pneumonia
• pneumonias that result in hospitalization
Predictors of Mortality in the ID Population
I. Findings and Quality Enhancement Action
Mortality Review Finding
DDS Quality Enhancement Action
Health care coordination by registered nurses
is an essential support for the ID/DD
population who are at risk for chronic and
acute health conditions.
The department chaired a workgroup of private providers, nurse
consulting agencies and DDs providers and created a Healthcare
Coordination Fact Sheet to better facilitate the enhanced
implementation of the waiver service.
The premature onset of acute and chronic
health issues which lead to morbidity and
mortality in people with ID presents a unique
challenge to caregivers.
Offered a number of health promotion oriented educational
opportunities to providers
Implemented a Healthy Living Community of Practice Subcommittee
focused on identify and enhancing health and wellness supports for
families
The CT DDS process for reviewing advanced
life directives including the withholding of
cardiopulmonary resuscitation (DNRs)
provides the team with a foundation for quality
end of life planning.
Connecticut DDS will continue its t protocol for the monitoring of all
contemplated or existing Do Not Resuscitate (DNR) orders for all
adjudicated individuals treated under the direction of the
Commissioner of the Department of Developmental Services (DDS).
End of life planning that included hospice
services and supports allowed many
individuals with irreversible or terminal
conditions to remain in their home or current
residence.
Reinforced commitment to ensuring individuals remain in their homes
and communities regardless of their ability or age represented in
Health services collaboration in the Aging Conference, facilitating a
Hospice end of Life Panel presentation
Individuals are supported to die with dignity where they have lived.
This policy and philosophical position applies to all individuals for
whom the department bears direct or oversight responsibility for
medical care.
CT DDS mortality cases referred to the CT
Department of Public Health resulted in
improvements in healthcare facility and/or
health care practitioners standards of practice
which we expect will ultimately advance the
quality of care for people with ID/DD.
DDS continues to foster partnerships with Department of Public
Health, PH, Office of Protection and Advocacy and other health care
systems and facilities.
Fall risk has been identified as a consistent
area of concern through our mortality review
process
The department’s Fall Prevention Protocol, is currently under
consideration for modification based on this year’s fall data.
Mortality Annual Report - 2014
Issue Date: November 2015 Section Seven Continued
42
II. General Community Awareness Findings
These are general findings that we believe the community at large should be aware of.
1. Individuals living in their own home or receiving individualized supports benefit from
health education and training that focuses on health promotion and disease prevention.
2. Post mortem examinations are a valuable tool to confirm the cause and manner of
death in cases where the cause of death was not immediately determined.
3. As individuals age, the “aging in place phenomenon” within the ID/DD population
presents a future challenge for the CT DDS service system and for all care providers,
but must be embraced through creative solutions and strengthened partnerships.
4. The aging Down syndrome population requires specialized and comprehensive
supports.
5. CT DDS has sustained quality in the area of water temperature safety. There have
been no mortality events related to scalding. The anti scalding devices continue to
assist in ensuring maximum water temperature safety practices.
42
Mortality Annual Report - 2014
Issue Date: November 2015
References
1 CIA World Fact Book.
2 Sutherland, Georgina, Couch, Murray A. and Iacono, Health Issues for Adults with Developmental Disabilities Research in Developmental Disabilities, Vol 23, Issue 6 Nov-Dec 2002 422-445.
3 Gruman, C; Fenster, J; A Report to the CT Department of Mental Retardation: 1996-2002 Data Overview 2002; April 2002.
4 Noberto Alverez, MD; Alzheimer Disease in Individuals with Down syndrome..
5 Coppus, A; Evenhuis, H; Verberne, G-J; Visser, F; van Gool, P; Eikelenboom, P; van Duin, C; Dementia and Mortality in Persons with Down’s Syndrome. Journal of Intellectual Disability Research, v50 n10 p768-777 Oct 2006.
6 Thase, ME; Longevity and Mortality in Down’s Syndrome; Journal of Mental Deficiency Research, v26 n3 p177-92 Sept 1982.
7 Day, Steven M; Strauss, David J; et al; Life Expectancy Project Mortality and Causes of Death in Person’s with Down Syndrome in California; May 19, 2004.
8 Strauss, D; Eyman, RK; Mortality with and without Down Syndrome; American Journal on MR 1996.
9 Horwitz, S.M., Kerker, B.D., Owens, P.L.,& Zigler, E. (2000). Physical Health Conditions Contributing to Morbidity and Mortality of Individuals with Mental Retardation. In The Health Status and Needs of Individuals with Mental Retardation. New Haven: Yale University School of Medicine. Published by Special Olympics, Inc., March 2001.
10 Strauss, D., Eyman, R., Grossman, H.J. (1996) Predictors of Mortality in Children with Severe Mental Retardation: The Effect of Placement. American Journal of Public Health, 86, 1422-1429.
11 US Census Bureau, Statistical Abstract of the United States 2012
12 Barlow, G.M. et al, Down Syndrome Congenital Heart Disease, Genet Med. 2001 Mar-Apr;3(2): 91-101.
13 CDC National Center for Health Statistics, Division of Vital Statistics; Deaths Final Data , 2007, 2008, 2009, 2010, 2011, 2012, 2013.
14 State of Connecticut Department of Public Health, Health Care Quality, Health Statistics & Analysis , 2007, 2008, 2009, 2010, 2011.
15 American Human Development Project, Measure of America 2012-2014. Mapping Risks and Resilience.
16 CDC National Center for Disease Control and Prevention, Heart Disease.
17 American Heart Association, Statistical Fact Sheet 2013 Update.
The next Annual Mortality Report UPDATE will be issued in March of 2016
For additional copies of this report or to contact DDS please visit us at www.ct.gov/dds
This report can be found on our website at: www.ct.gov/dds
Report prepared by Lakisha Hyatt, MSN, RN.
With thanks to Julie Bouchard with assistance from Tim Deschanes-Desmond and Victoria Berman.
43
Mortality Annual Report - 2014
Issue Date: November 2015
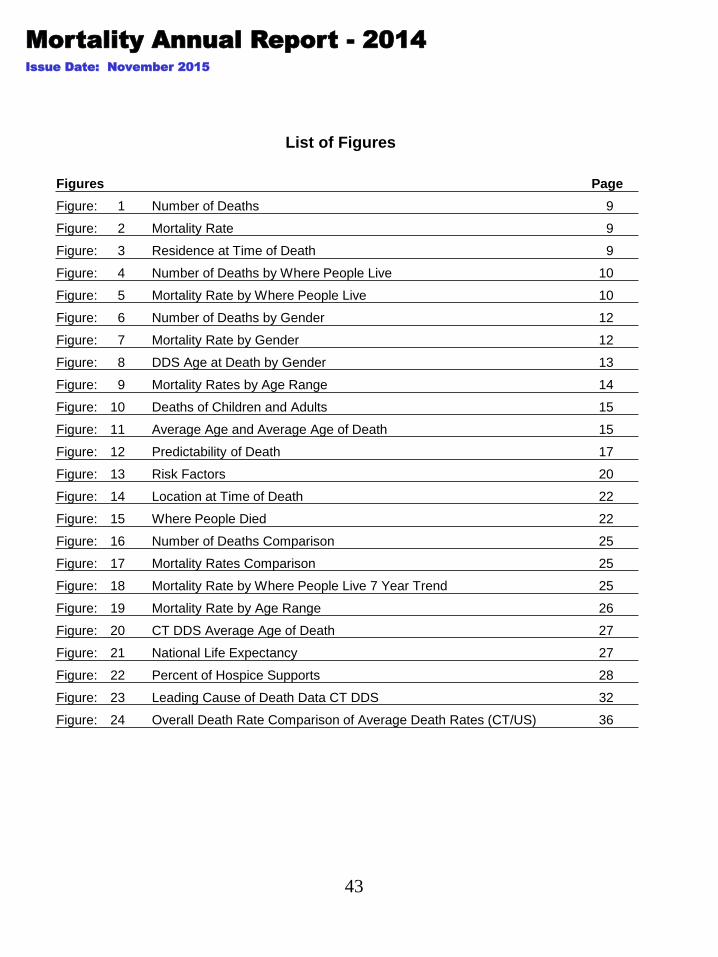
List of Figures
Figures Page
Figure: 1 Number of Deaths 9
Figure: 2 Mortality Rate 9
Figure: 3 Residence at Time of Death 9
Figure: 4 Number of Deaths by Where People Live 10
Figure: 5 Mortality Rate by Where People Live 10
Figure: 6 Number of Deaths by Gender 12
Figure: 7 Mortality Rate by Gender 12
Figure: 8 DDS Age at Death by Gender 13
Figure: 9 Mortality Rates by Age Range 14
Figure: 10 Deaths of Children and Adults 15
Figure: 11 Average Age and Average Age of Death 15
Figure: 12 Predictability of Death 17
Figure: 13 Risk Factors 20
Figure: 14 Location at Time of Death 22
Figure: 15 Where People Died 22
Figure: 16 Number of Deaths Comparison 25
Figure: 17 Mortality Rates Comparison 25
Figure: 18 Mortality Rate by Where People Live 7 Year Trend 25
Figure: 19 Mortality Rate by Age Range 26
Figure: 20 CT DDS Average Age of Death 27
Figure: 21 National Life Expectancy 27
Figure: 22 Percent of Hospice Supports 28
Figure: 23 Leading Cause of Death Data CT DDS 32
Figure: 24 Overall Death Rate Comparison of Average Death Rates (CT/US) 36
44
Mortality Annual Report - 2014
Issue Date: November 2015
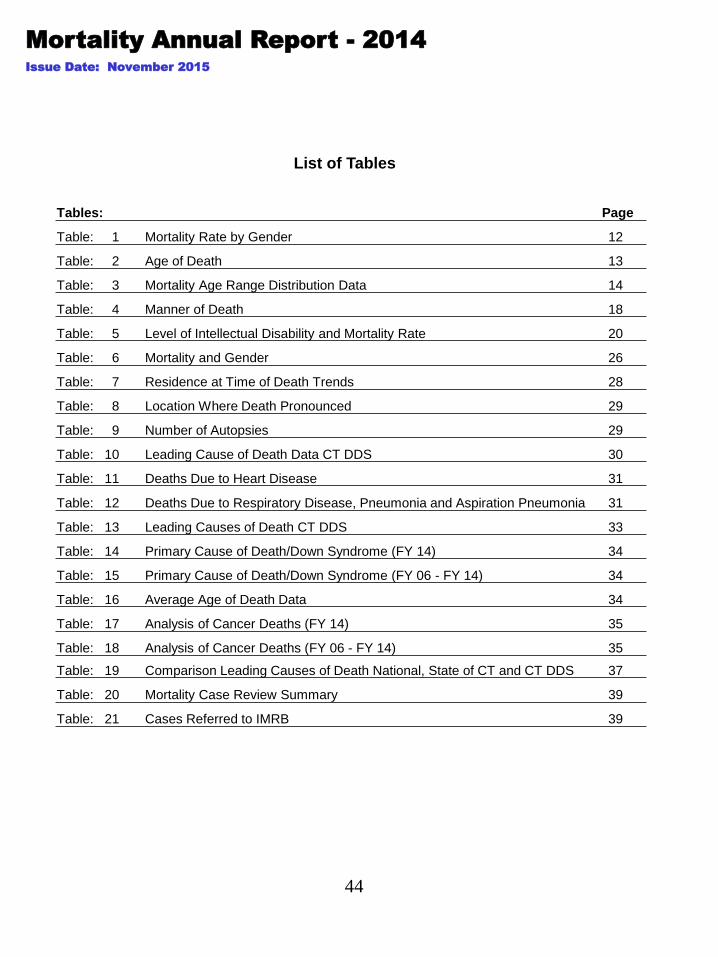
List of Tables
Tables: Page
Table: 1 Mortality Rate by Gender 12
Table: 2 Age of Death 13
Table: 3 Mortality Age Range Distribution Data 14
Table: 4 Manner of Death 18
Table: 5 Level of Intellectual Disability and Mortality Rate 20
Table: 6 Mortality and Gender 26
Table: 7 Residence at Time of Death Trends 28
Table: 8 Location Where Death Pronounced 29
Table: 9 Number of Autopsies 29
Table: 10 Leading Cause of Death Data CT DDS 30
Table: 11 Deaths Due to Heart Disease 31
Table: 12 Deaths Due to Respiratory Disease, Pneumonia and Aspiration Pneumonia 31
Table: 13 Leading Causes of Death CT DDS 33
Table: 14 Primary Cause of Death/Down Syndrome (FY 14) 34
Table: 15 Primary Cause of Death/Down Syndrome (FY 06 - FY 14) 34
Table: 16 Average Age of Death Data 34
Table: 17 Analysis of Cancer Deaths (FY 14) 35
Table: 18 Analysis of Cancer Deaths (FY 06 - FY 14) 35
Table: 19 Comparison Leading Causes of Death National, State of CT and CT DDS 37
Table: 20 Mortality Case Review Summary 39
Table: 21 Cases Referred to IMRB 39
45
2014 DDS Mortality Report, Connecticut
APPENDICES
Appendix A: Overview of DDS Population
Appendix B: DDS Consumers by Residential Setting
DDS Population by Age
Appendix C: Percentage Population by Age Ranges
Level of Intellectual Disability
Appendix D: Age Category and Residence
Consumers by Program Type

46
APPENDIX A
Overview of DDS Population
Intellectual Disability is a developmental disability that is present in about 1% of the Connecticut
population. In order for a person to be eligible for DDS services they must have significant deficits in
intellectual functioning and in adaptive behavior, both before the age of 18 yrs. As of June 30, 2014
16,274 individuals with intellectual disability were being supported by the department.
Over half of the people served by CT DDS live at home with their family. Almost one third receive
support services provided in community living arrangements (CLAs), community companion homes
(CCH), regional centers (RC) and a campus program, Southbury Training School (STS). Approximately
16% of the DDS population receive individualized home supports (IHS) or continuous residential
supports (CRS). The remainder (5%) of the people are supported by other state or local government
and/or private entities including licensed nursing facilities (SNF), the CT Department of Mental Health
and Addiction Services, the CT Department of Children and Families, the CT Department of Corrections
and residential schools.
Overview of DDS Population
Percentage by Setting
47
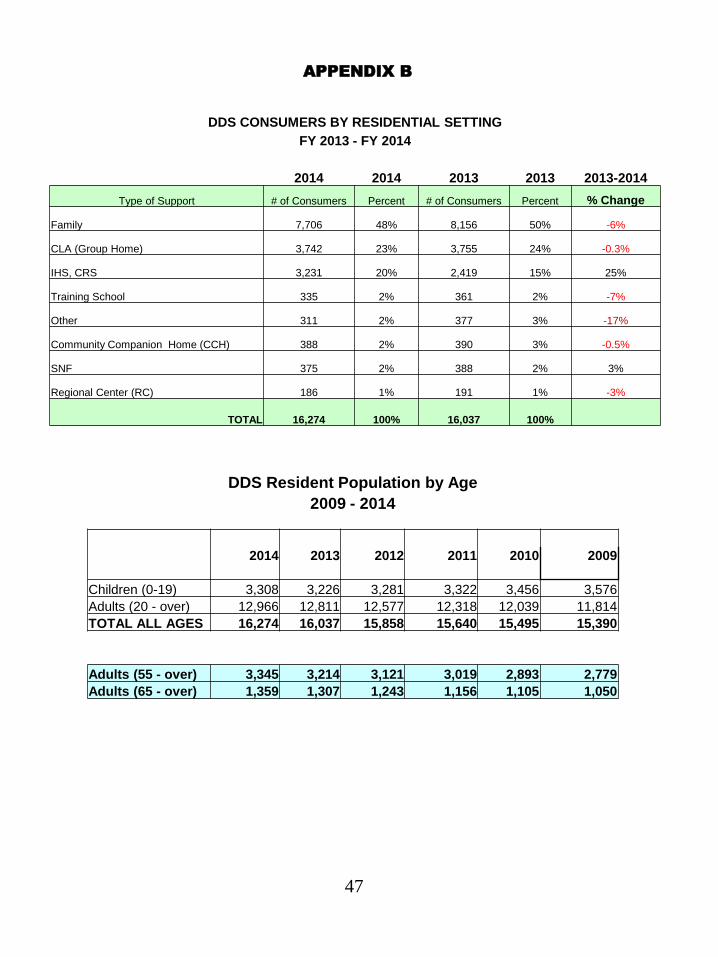
APPENDIX B
DDS Resident Population by Age
2009 - 2014
2014 2013 2012 2011 2010 2009
Children (0-19) 3,308 3,226 3,281 3,322 3,456 3,576
Adults (20 - over) 12,966 12,811 12,577 12,318 12,039 11,814
TOTAL ALL AGES 16,274 16,037 15,858 15,640 15,495 15,390
Adults (55 - over) 3,345 3,214 3,121 3,019 2,893 2,779
Adults (65 - over) 1,359 1,307 1,243 1,156 1,105 1,050
DDS CONSUMERS BY RESIDENTIAL SETTING
FY 2013 - FY 2014
2014 2014 2013 2013 2013-2014
Type of Support # of Consumers Percent # of Consumers Percent % Change
Family 7,706 48% 8,156 50% -6%
CLA (Group Home) 3,742 23% 3,755 24% -0.3%
IHS, CRS 3,231 20% 2,419 15% 25%
Training School 335 2% 361 2% -7%
Other 311 2% 377 3% -17%
Community Companion Home (CCH) 388 2% 390 3% -0.5%
SNF 375 2% 388 2% 3%
Regional Center (RC) 186 1% 191 1% -3%
TOTAL 16,274 100% 16,037 100%
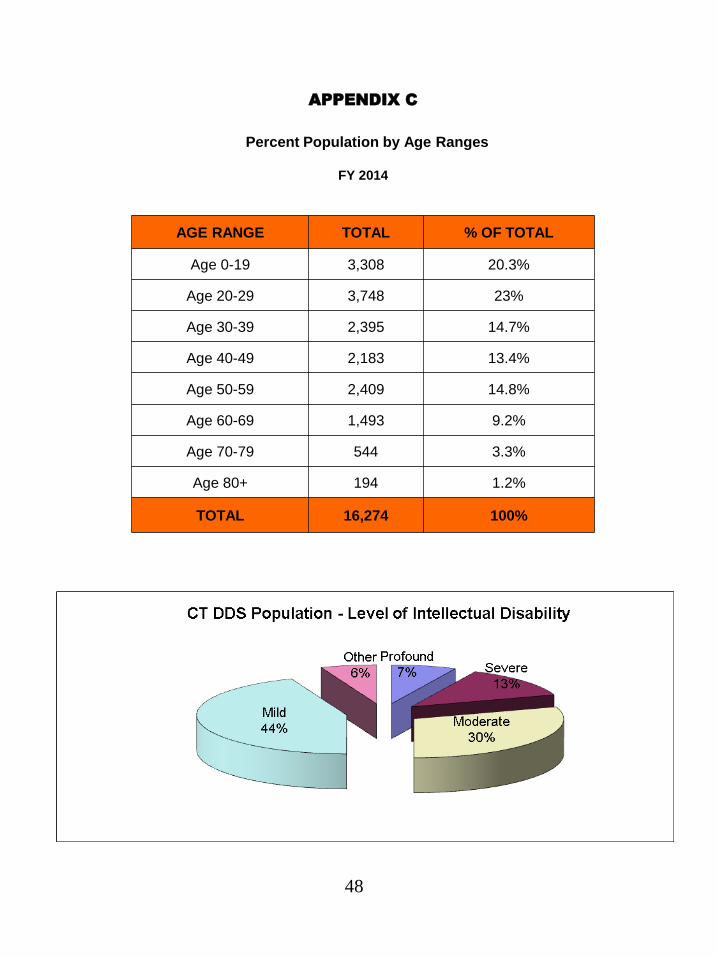
48
APPENDIX C
Percent Population by Age Ranges
FY 2014
AGE RANGE TOTAL % OF TOTAL
Age 0-19 3,308 20.3%
Age 20-29 3,748 23%
Age 30-39 2,395 14.7%
Age 40-49 2,183 13.4%
Age 50-59 2,409 14.8%
Age 60-69 1,493 9.2%
Age 70-79 544 3.3%
Age 80+ 194 1.2%
TOTAL 16,274 100%
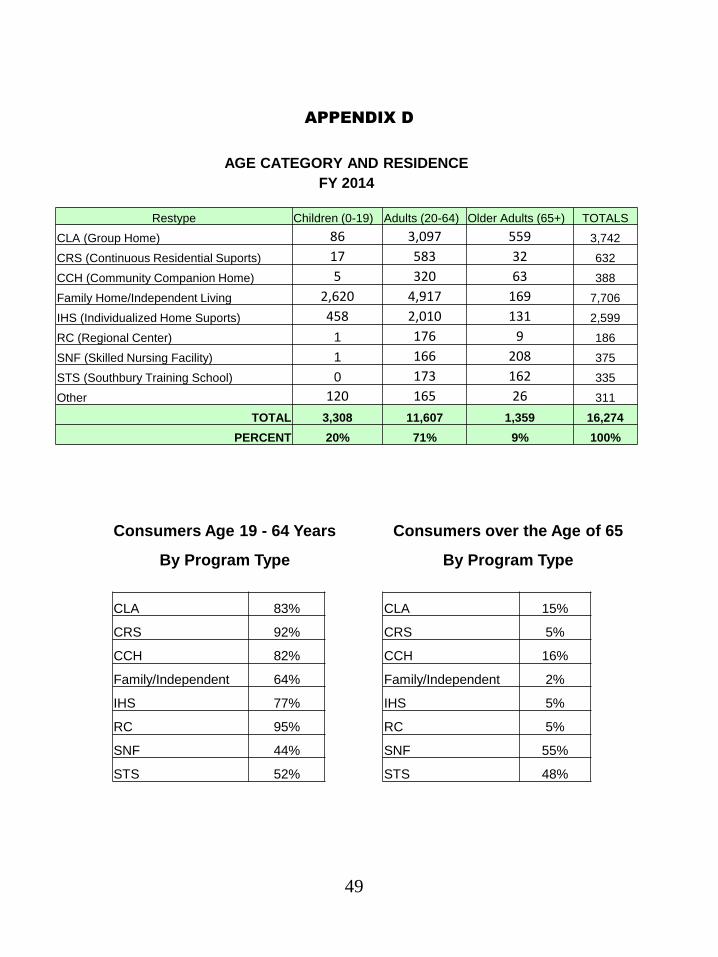
APPENDIX D
49
AGE CATEGORY AND RESIDENCE
FY 2014
Restype Children (0-19) Adults (20-64) Older Adults (65+) TOTALS
CLA (Group Home) 86 3,097 559 3,742
CRS (Continuous Residential Suports) 17 583 32 632
CCH (Community Companion Home) 5 320 63 388
Family Home/Independent Living 2,620 4,917 169 7,706
IHS (Individualized Home Suports) 458 2,010 131 2,599
RC (Regional Center) 1 176 9 186
SNF (Skilled Nursing Facility) 1 166 208 375
STS (Southbury Training School) 0 173 162 335
Other 120 165 26 311
TOTAL 3,308 11,607 1,359 16,274
PERCENT 20% 71% 9% 100%
Consumers Age 19 - 64 Years Consumers over the Age of 65
By Program Type By Program Type
CLA 83% CLA 15%
CRS 92% CRS 5%
CCH 82% CCH 16%
Family/Independent 64% Family/Independent 2%
IHS 77% IHS 5%
RC 95% RC 5%
SNF 44% SNF 55%
STS 52% STS 48%