Embed Size (px)
Citation preview
iT io s n
MORTALITY by OCCUPATION, INDUSTRY, and CAUSE of DEATH
24 REPORTING STATES A
V (1984-1988) /
^ ^ " U.S. DEPARTMENT OF HEALTH AND HUMAN SERVICESPublic Health Service
Centers for Disease Control and Prevention National Institute for Occupational Safety and Health
C D C
MORTALITY BY OCCUPATION, INDUSTRY, AND CAUSE OF DEATH
24 Reporting States, 1984-1988
by
Carol Burnett, M.S.National Institute for Occupational Safety and Health (NIOSH)
Jeff Maurer, M.S.Harry M. Rosenberg, Ph.D.
National Center for Health Statistics (NCHS)
Mustafa Dosemeci, Ph.D. National Cancer Institute (NCI)
U .S . D E P A R T M E N T O F H E A L T H A N D H U M A N S E R V I C E SP u b lic H ea lth S e r v ic e
C en te rs fo r D is e a s e C o n tro l an d P r e v e n tio n N a tio n a l In stitu te fo r O c cu p a tio n a l S a fe ty an d H e a lth
C in c in n a ti, O h io
June 1997
D IS C L A IM E R
Mention of any company name or product does not constitute endorsement by the National Institute for Occupational Safety and Health.
This document is in the public domain and may be freely copied or reprinted.
Copies of this and other NIOSH documents are available from
Publications Dissemination, EID National Institute for Occupational Safety and Health
4676 Columbia Parkway Cincinnati, OH 45226-1998
Fax number: (513) 533-8573 Telephone number: 1-800—35-NIOSH (1-800-356-4674)
E-mail: [email protected]
To receive other information about occupational safety and health problems, call 1-800-35-NIOSH (1-800-356-4674), or
visit the NIOSH Home Page on the World Wide Web at http://www.cdc.gov/niosh/homepage.html
DHHS (NIOSH) Publication No. 97-114
A B S T R A C T
Through a collaborative project with the National Institute for Occupational Safety and Health and the National Cancer Institute, 24 State health departments have provided occupation- and industry-coded death certificate data for 1 or more years from 1984 through 1988 to the National Center for Health Statistics. The occupation, industry, and cause-of-death data for 1,062,000 white males, 139,834 black males, 438,603 white females, and 72,976 black females were analyzed using age-adjusted, race- and gender-specific proportionate mortality ratios (PMRs) and 95% confidence intervals (CIs). The analysis includes 192 cause-of-death categories, 325 occupation categories, and 235 industry categories.
Results are presented for all combinations o f occupation and cause of death or industry and cause of death that meet the following criteria: (1) the PMR for the aged-20-and-over group was >120,(2) the lower limit of the 95% Cl of the PMR for the aged-20-and-over group exceeded 100, and(3) the observed number of deaths in the aged-20-and-over group was >10. The tables include the number of observed deaths and PMRs for the three age groups (20 and over, 20 to 64, and 65 and over).
Some findings support previously reported associations: for example, coal workers’ pneumoconiosis in white male mining machine operators (PMR=5,146; 95% CI=4,696-5,629) and malignant neoplasm of the lung in white male insulation workers (PMR=188; 95% 0= 152-229). Other results suggest new areas for research: for example, malignant neoplasm of the esophagus in white waitresses (PMR=203; 95% 0= 141-282) and cerebrovascular diseases in black farmers (male PMR=134; 95% 0= 128-140; female PMR=141; 95% 0=126-157).
A C K N O W L E D G M E N T S
This report was prepared by the National Institute for Occupational Safety and Health (NIOSH), the National Center for Health Statistics (NCHS), and the National Cancer Institute (NCI). The authors thank the following personnel for their support of the Occupation and Industry Mortality Program and for their review and comments on the report: Todd M. Frazier (retired), John P. Sestito, and Nina Lalich of the NIOSH Division of Surveillance, Hazard Evaluations, and Field Studies (DSHEFS); and Gilbert W. Beebe (retired) and Aaron E. Blair of the NCI Division of Cancer Etiology, Epidemiology, and Biostatistics Program.
The authors are also grateful to the following NCHS personnel: John E. Patterson (retired) for his support of the Program; Ronald F. Chamblee and Marshall C. Evans (retired) for directing the resources to collect and process the data; Glenn A. Flinchum (retired) for providing technical expertise; Lacola Washington (retired) for providing training in occupation and industry coding; Charles Royer for providing the data tapes; and the Registration Methods Branch for consulting with State vital statistics offices regarding collection of the death certificate data.
We gratefully acknowledge the work of the following reviewers: Nancy Stout and Robert Mullan, NIOSH; Richard Monson, Harvard School of Public Health; Gene D. Therriault, State of New York Department of Health; Robert Dubrow, Yale University.
In addition, the authors wish to thank the following NIOSH personnel: William E. Crouse (retired) for providing technical expertise; Lois L. Schuster (formerly o f NIOSH) for providing training in occupation and industry coding; and Robert Dubrow (formerly of NIOSH), Steven Spaeth, Steven Adams, and Martin Peterson for providing the methodology and programming of the statistical procedures. Jane Weber edited the document and Susan Kaelin produced the camera-ready copy.
C O N T E N T S
A b stra c t....................... ...................................... ............................................................................. iiiAcknowledgments............................................................................................................................vi
Introduction .............................................................................................................................................1
B ackground .............................................................................................................................................1
Methods ................................................................................................................................................... 2
Results and D iscu ss io n .............................................................................................................. ... . 3Occupations and Causes of D eath ........................................................................................... 13Industries and Causes of D e a th .............................................................................................. 14Using the R e s u l ts .....................................................................................................................14Analyses of Females ....................................................... .......................................................15Limitations ...............................................................................................................................15
C onclusions..................................................................................................................................... 17
References................................................................. .......................................................................18
AppendicesA. Technical N o te s .......................................................................................................................22B. List of Detailed Tables Found on Attached D isk e tte .........................................................41
v
M O R T A L IT Y B Y O C C U P A T IO N , IN D U S T R Y , A N D C A U S E O F D E A T H
2 4 R e p o r t in g S t a t e s , 1 9 8 4 - 8 8
IN T R O D U C T IO N
The purpose of this report is to present estimates o f the relative risks of mortality for selected causes of death by occupation and industry for white and black males and females. The report includes data for the period 1984-88 for 24
-States reporting this information from death certificates through the vital statistics system. The report is a collaborative effort of the National Institute for Occupational Safety and Health (NIOSH) and the National Center for Health Statistics (NCHS), both components of the Centers for Disease Control and Prevention (CDC) and the National Cancer Institute (NCI).
Occupation and industry information from death certificates can serve as a readily available resource for monitoring occupational mortality on an ongoing basis. This information has the advantage of being useful for many occupations, industries, and diseases. The data draw on the strengths of the vital statistics system, which include universal coverage, uniformity of information, large numbers of events, and geographic identifiers.
The results from this occupational mortality study may be used as a screening tool to identify possible associations of cause of death and occupation (or industry) that warrant further study, to evaluate the results of other studies, to target occupational groups for health promotion activities, or to use for descriptive purposes. An apparent excess of cause-specific mortality in an industry or occupation must be verified by more definitive studies.
Because of space restrictions, this report presents only statistically significant proportionate
mortality ratios (PMRs)— that is, those in which the lower bound of the confidence interval (Cl) is greater than 100. All results are available upon request.
B A C K G R O U N D
Information from death certificates was first used to describe occupational mortality in the United States in 1890. According to a brief description of occupational mortality studies in the United States,1 tabulations of mortality by occupation were made for each census year from 1890 through 1940. The population data collected in the census were used to compute population-based measures of risk. These tabulations were, however, published only for the years 1890,1900, and 1930. Evaluations found that the quality of the occupation-specific information was generally unsatisfactory. For the 1950 census year, efforts were made to improve the quality of occupational descriptors on death certificates. A major report was published based on deaths of men aged 20 to 64.2,3 In this report, population estimates from the 1950 Census of Population were used to produce standardized mortality ratios (SMRs).
Other countries have produced reports on occupational mortality. Great Britain has published decennial reports on patterns of mortality for occupational groups since 1851. The latest public a tio n covers the years 1979-80 and1982-90.4 These reports have been used primarily to provide readily available background data for suspected associations between an occupation and excess mortality. A major report from Canada described mortality by occupation in British Columbia, using data from 1950 through 1984.5
1
Although the United States Standard Certificate of Death has requested information on the occupation of the decedent since 1900, until recently this information has not been readily accessible. Since the report using the 1950 data, there has been no national report on occupational disease mortality. Work-related fatal injuries were described in a recent report.6 Based on the National Traumatic Occupational Fatalities (NTOF) database, the report described occupational injury fatalities by broad industrial and occupational categories for the period 1980 through 1989. In addition, several States (including California,7,8 Kentucky,9 Maine,10 New Hampshire,11 New York,12 North Carolina,13 Pennsylvania,14 Rhode Island,15 South Carolina,16 Utah,17 and Washington18,19) have coded the occupation data and published studies.
Over the last decade, NIOSH, NCHS, NCI, and the Bureau of the Census have collaborated to improve the quality of the occupational data collected on death certificates; to develop routine, standardized coding of this information by State health departments; and to partially reimburse selected States for the production of these date. Since 1984, a number of States have submitted the information in coded, machine- readable form to NCHS. The first report using these data was & Monthly Vital Statistics Report Supplement, based on the 1984 data from 12 States.20 It described the data and presented cause-specific estimates of relative risk for broad occupation and industry categories for males and females.
The availability of additional years of data and the contributions of additional States make possible this report on occupational mortality for 24 States for 1984 through 1988. The data were sufficient to compute estimates of relative risk for detailed occupation, industry, and cause-of- death categories. The report is more representative of the United States and more current than many of the individual State reports. It is hoped that researchers will find this a useful
addition to the occupational mortality surveillance literature.
M E T H O D S
The United States Standard Certificate of Death requests information on the usual occupation and kind of business or industry for each decedent. Beginning in 1983, an increasing number of State health departments have coded this information using standardized coding procedures. Twenty-four State health departments included the data in the coded death certificate data provided to NCHS for 1 or more years from 1984 through 1988. See Table A -l in Appendix A for States and years included.
The information on occupation and industry was coded according to the 1980 Bureau of the Census classification.21 The occupation and industry categories included in the report are described in Lists A -l and A-2 in Appendix A. The underlying cause of death was coded according to the Ninth Revision, International Classification of Diseases.11 The analysis included 185 selected causes of death for males and 188 selected causes for females (List A-3 in Appendix A).
The analysis includes deaths that occurred in the 24-State reporting area to residents of one of the 24 States. The criteria for inclusion in the analysis differed for males and females. For males, all white and black decedents aged 20 and older were included. For females, decedents reported in the occupation category of Housewives, homemakers were not included in either the occupation or industry analysis. Therefore, all white and black female decedents aged 20 and older with an occupation code other than Housewives, homemakers were included.
The measure of association used in this report is the proportionate mortality ratio (PMR). Age- standardized PMRs for the four race-sex groups were calculated using a computer program
2
developed at NIOSH.23 For a specific race- sex group, the program calculates PMRs by comparing the proportion of deaths from a specific cause within a specific occupation or industry group with the proportion of deaths for that cause for all occupations or industries. Age stratification was done by 5-year age groups. The program provides 95% confidence limits for the PMRs.
See Appendix A for a description of the computation of the PMRs and the confidence limits.
R E S U L T S A N D D IS C U S S IO N
The detailed statistical results are presented for a to tal o f 1,713,413 decedents, of whom1,062,000 are white males, 139,834 are black males, 438,603 are white females, and 72,976 are black females (Table 1). The numbers for females are much smaller than for males because females reported as housewives were not included in the analysis; for more than half of the females, housewife was reported as their usual occupation.
Detailed results are presented in Tables B-l through B -l6, found on the diskette attached to the back page of this report. These include the number o f observed deaths and PMRs for the three age groups: aged 20 and over, aged 20 to 64, and aged 65 and over. The tables show different combinations of occupation and cause of death, or industry and cause of death, depending on three criteria: (1) the PMR for the aged-20-and-over group was >120, (2) the lower limit of the 95% Cl of the PMR for the aged-20-and-over group exceeded 100, and(3) the observed number of deaths in the aged- 20-and-over group was >10. Space limitations preclude the display of all PMRs, but they are available upon request.
Four tables are shown for each race-sex group (see Appendix B for a complete list of the detailed tables on the diskette):
• Tables B -l through B-4, occupation by cause of death
• Tables B-5 through B-8, cause of death by occupation
• Tables B-9 through B-12, industry by cause of death
• Tables B-13 through B-16, cause of death by industry
Highlights o f the results are presented in Tables 2 -9 for each race-sex group. Some of these PMRs identify previously recognized occupational associations. Others are newly rep o rted or su p p o rt f in d in g s from o th e r surveillance reports and may indicate a need for further evaluation of the relationship of the occupation or industry to the cause of death. Still others may be due to socioeconomic status or lifestyle factors. Some PMRs may be elevated due to chance.
In Tables 2 through 9, to focus on associations that make substantial contributions to overall mortality and to de-emphasize the importance of chance or rare events, a minimum number of deaths per cause of death and occupation or industry combination was established. Similarly, to ensure the stability of the PMR estimates, each PMR included in these tables was required to have a minimum lower limit o f the 95% CL This minimum will eliminate highly elevated PMRs based on a small number of deaths. For each cause of death, the occupation or industry with the highest PMR meeting these criteria is shown in Tables 2-9 . The minimum number of deaths and lower confidence limit vary according to sex and race to take into account the differences in the total number of deaths in each race-sex group in the data set. For white males the minimum number of deaths was 50 and the minimum lower 95 percent confidence limit was 150; for black males and white females, the criteria was 20 and 125; and for
3
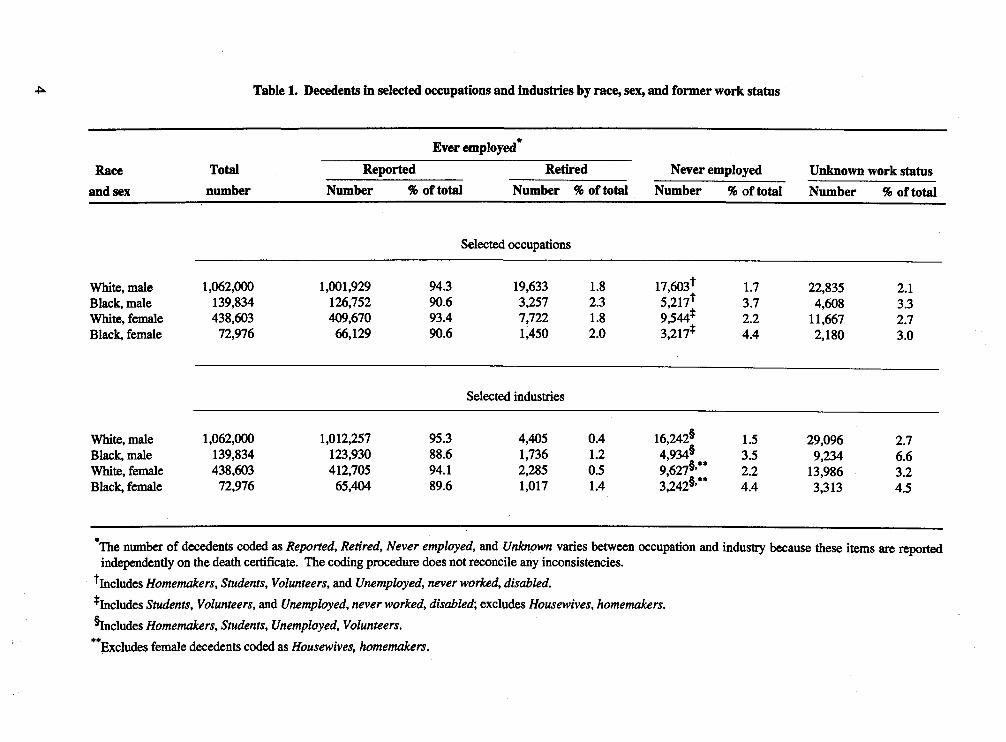
Table 1. Decedents in selected occupations and industries by race, sex, and former work status
Ever employed"Race Total Reported Retired Never employed Unknown work status
and sex number Number % of total Number % of total Number % of total Number % of total
Selected occupations
White, male 1,062,000 1,001,929 94.3 19,633 1.8 17,603* 1.7 22,835 2.1Black, male 139,834 126,752 90.6 3,257 2.3 5,217t 3.7 4,608 3.3White, female 438,603 409,670 93.4 7,722 1.8 9,544* 2.2 11,667 2.7Black, female 72,976 66,129 90.6 1,450 2.0 3,217* 4.4 2,180 3.0
Selected industries
White, male 1,062,000 1,012,257 95.3 4,405 0.4 16,242§ 1.5 29,096 2.7Black, male 139,834 123,930 88.6 1,736 1.2 4,934§ 3.5 9,234 6.6White, female 438,603 412,705 94.1 2,285 0.5 9,627§’** 2.2 13,986 3.2Black, female 72,976 65,404 89.6 1,017 1.4 3,242§’** 4.4 3,313 4.5
*The number of decedents coded as Reported, Retired, Never employed, and Unknown varies between occupation and industry because these items are reported independently on the death certificate. The coding procedure does not reconcile any inconsistencies.
^Includes Homemakers, Students, Volunteers, and Unemployed, never worked, disabled.^Includes Students, Volunteers, and Unemployed, never worked, disabled', excludes Housewives, homemakers.^Includes Homemakers, Students, Unemployed, Volunteers.**Excludes female decedents coded as Housewives, homemakers.
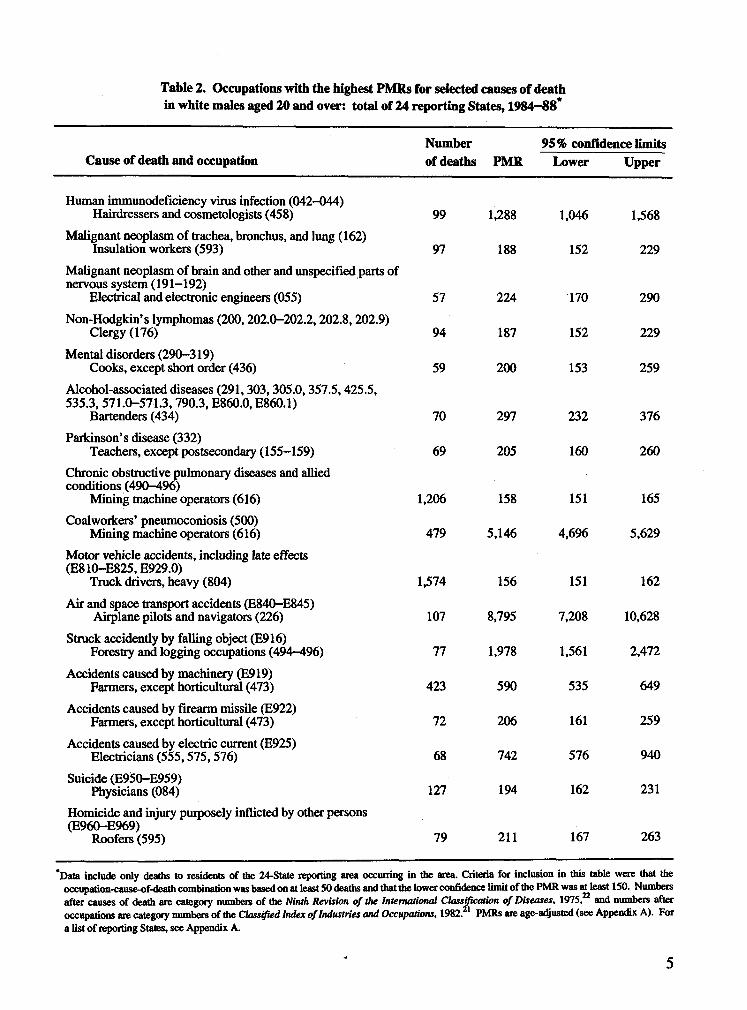
Table 2. Occupations with the highest PMRs for selected causes of deathin white males aged 20 and over: total of 24 reporting States, 1984—88*
Cause of death and occupationNumber of deaths PMR
95% confidence limits Lower Upper
Human immunodeficiency virus infection (042-044) Hairdressers and cosmetologists (458) 99 1,288 1,046 1,568
Malignant neoplasm of trachea, bronchus, and lung (162) Insulation workers (593) 97 188 152 229
Malignant neoplasm of brain and other and unspecified parts of nervous system (191-192)
Electrical and electronic engineers (055) 57 224 170 290Non-Hodgkin’s lymphomas (200,202.0-202.2,202.8,202.9)
Clergy (176) 94 187 152 229Mental disorders (290-319)
Cooks, except short order (436) 59 200 153 259Alcohol-associated diseases (291,303,305.0,357.5,425.5, 535.3, 571.0-571.3,790.3, E860.0, E860.1)
Bartenders (434) 70 297 232 376Parkinson’s disease (332)
Teachers, except postsecondaiy (155-159) 69 205 160 260Chronic obstructive pulmonary diseases and allied conditions (490-496)
Mining machine operators (616) 1,206 158 151 165Coalworkers’ pneumoconiosis (500)
Mining machine operators (616) 479 5,146 4,696 5,629Motor vehicle accidents, including late effects (E810-E825, E929.0)
Truck drivers, heavy (804) 1,574 156 151 162Air and space transport accidents (E840-E845)
Airplane pilots and navigators (226) 107 8,795 7,208 10,628Struck accidently by falling object (E916)
Forestry and logging occupations (494-496) 77 1,978 1,561 2,472
Accidents caused by machinery (E919) Farmers, except horticultural (473) 423 590 535 649
Accidents caused by firearm missile (E922) Fanners, except horticultural (473) 72 206 161 259
Accidents caused by electric current (E925) Electricians (555,575,576) 68 742 576 940
Suicide (E9$0-E959) Physicians (084) 127 194 162 231
Homicide and injury purposely inflicted by other persons (E960-E969)
Roofers (595) 79 211 167 263
*Data include only deaths to residents of the 24-State repotting area occurring in the area. Criteria for inclusion in this table were that the occupation-cause-of-death combination was based on at least 50 deaths and that the lower confidence limit of the PMR was at least 150. Numbers after causes of death are category numbers of the Ninth Revision of the International Classification of Diseases, 1975, and numbers after occupations are category numbers of the Classified Index of Industries and Occupations, 1982. 1 PMRs are age-adjusted (see Appendix A). For a list of reporting States, see Appendix A.
5
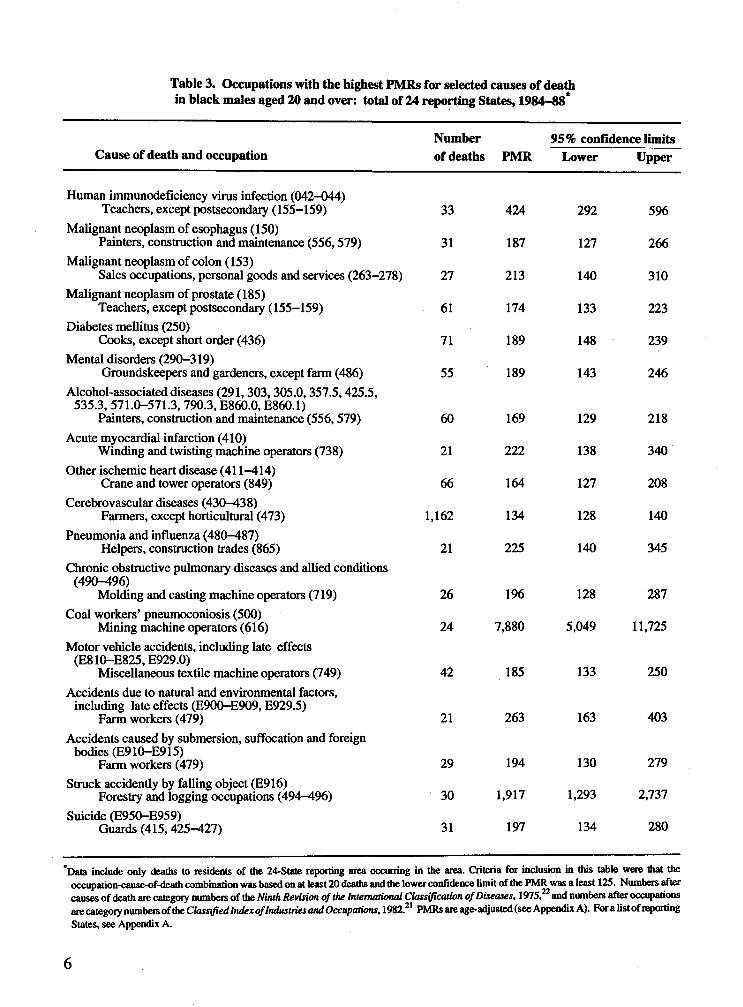
Table 3. Occupations with the highest PMRs for selected causes of deathin black males aged 20 and over: total of 24 reporting States, 1984—88*
Cause of death and occupationNumber of deaths PMR
95% confidence limits Lower Upper
Human immunodeficiency virus infection (042-044) Teachers, except postsecondary (155-159) 33 424 292 596
Malignant neoplasm of esophagus (150)Painters, construction and maintenance (556,579) 31 187 127 266
Malignant neoplasm of colon (153)Sales occupations, personal goods and services (263-278) 27 213 140 310
Malignant neoplasm of prostate (185)Teachers, except postsecondary (155-159) 61 174 133 223
Diabetes mellitus (250)Cooks, except short order (436) 71 189 148 239
Mental disorders (290-319)Groundskeepers and gardeners, except farm (486) 55 189 143 246
Alcohol-associated diseases (291, 303,305.0,357.5,425.5, 535.3,571.0-571.3,790.3, E860.0, E860.1)
Painters, construction and maintenance (556,579) 60 169 129 218Acute myocardial infarction (410)
Winding and twisting machine operators (738) 21 222 138 340Other ischemic heart disease (411-414)
Crane and tower operators (849) 66 164 127 208Cerebrovascular diseases (430-438)
Farmers, except horticultural (473) 1,162 134 128 140Pneumonia and influenza (480-487)
Helpers, construction trades (865) 21 225 140 345Chronic obstructive pulmonary diseases and allied conditions
(490-496)Molding and casting machine operators (719) 26 196 128 287
Coal workers’ pneumoconiosis (500) Mining machine operators (616) 24 7,880 5,049 11,725
Motor vehicle accidents, including late effects (E810-E825, E929.0)
Miscellaneous textile machine operators (749) 42 185 133 250Accidents due to natural and environmental factors,
including late effects (E900-E909, E929.5)Farm workers (479) 21 263 163 403
Accidents caused by submersion, suffocation and foreign bodies (E910—E915)
Farm workers (479) 29 194 130 279Struck accidently by falling object (E916)
Forestry and logging occupations (494-496) 30 1,917 1,293 2,737Suicide (E950-E959)
Guards (415,425-427) 31 197 134 280
*Data include only deaths to residents of the 24-State reporting area occurring in the area. Criteria for inclusion in this table were that the occupation-cause-of-death combination was based on at least 20 deaths and the lower confidence limit of the PMR was a least 125. Numbers after causes of death are category numbers of the Ninth Revision of the International Classification of Diseases, 1975,22 and numbers after occupations are category numbers of the Classified Index of Industries and Occupations, 1982.21 PMRs are age-adjusted (see Appendix A). Fora list of reporting States, see Appendix A.
6
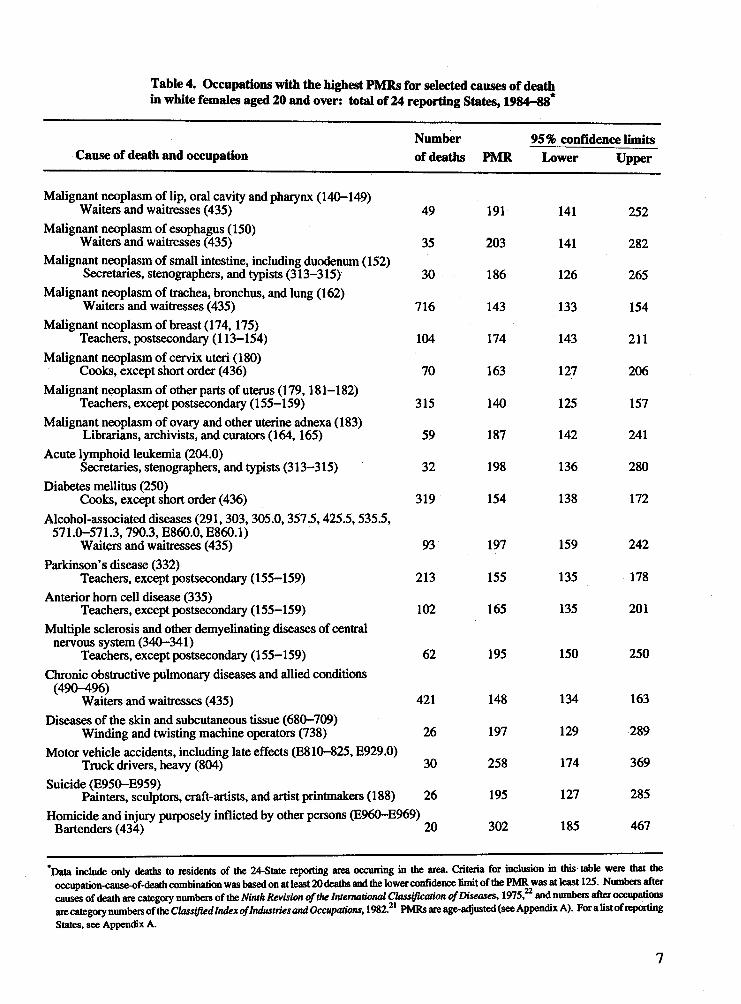
Table 4. Occupations with the highest PMRs for selected causes of deathin white females aged 20 and over: total of 24 reporting States, 1984-88*
Cause of death and occupationNumber of deaths PMR
95% confidence limits Lower Upper
Malignant neoplasm of Up, oral cavity and pharynx (140-149) Waiters and waitresses (435) 49 191 141 252
Malignant neoplasm of esophagus (150) Waiters and waitresses (435) 35 203 141 282
Malignant neoplasm of small intestine, including duodenum (152) Secretaries, stenographers, and typists (313-315) 30 186 126 265
Malignant neoplasm of trachea, bronchus, and lung (162) Waiters and waitresses (435) 716 143 133 154
Malignant neoplasm of breast (174,175) Teachers, postsecondary (113-154) 104 174 143 211
Malignant neoplasm of cervix uteri (180) Cooks, except short order (436) 70 163 127 206
Malignant neoplasm of other parts of uterus (179,181-182) Teachers, except postsecondary (155-159) 315 140 125 157
Malignant neoplasm of ovary and other uterine adnexa (183) Librarians, archivists, and curators (164,165) 59 187 142 241
Acute lymphoid leukemia (204.0)Secretaries, stenographers, and typists (313-315) 32 198 136 280
Diabetes mellitus (250)Cooks, except short order (436) 319 154 138 172
Alcohol-associated diseases (291,303,305.0,357.5,425.5,535.5, 571.0-571.3,790.3, E860.0, E860.1)
Waiters and waitresses (435) 93 197 159 242Parkinson’s disease (332)
Teachers, except postsecondary (155-159) 213 155 135 178Anterior horn cell disease (335)
Teachers, except postsecondary (155-159) 102 165 135 201Multiple sclerosis and other demyelinating diseases of central
nervous system (340-341)Teachers, except postsecondary (155-159) 62 195 150 250
Chronic obstructive pulmonary diseases and allied conditions (490-496)
Waiters and waitresses (435) 421 148 134 163Diseases of the skin and subcutaneous tissue (680-709)
Winding and twisting machine operators (738) 26 197 129 289Motor vehicle accidents, including late effects (E810-825, E929.0)
Truck drivers, heavy (804) 30 258 174 369Suicide (E950-E959)
Painters, sculptors, craft-artists, and artist printmakers (188) 26 195 127 285Homicide and injury purposely inflicted by other persons (E960-E969)
Bartenders (434) 20 302 185 467
'Data include only deaths to residents of the 24-State reporting area occurring in the area. Criteria for inclusion in this table were that the occupation-cause-of-death combination was based on at least 20 deaths and the lower confidence limit of the PMR was at least 125. Numbers after causes of death are category numbers of the Ninth Revision of the International Classification of Diseases, 1975, and numbers after occupations are category numbers of the Classified Index of Industries and Occupations, 1982.il PMRs are age-adjusted (see Appendix A). For a list of reporting States, see Appendix A.
7
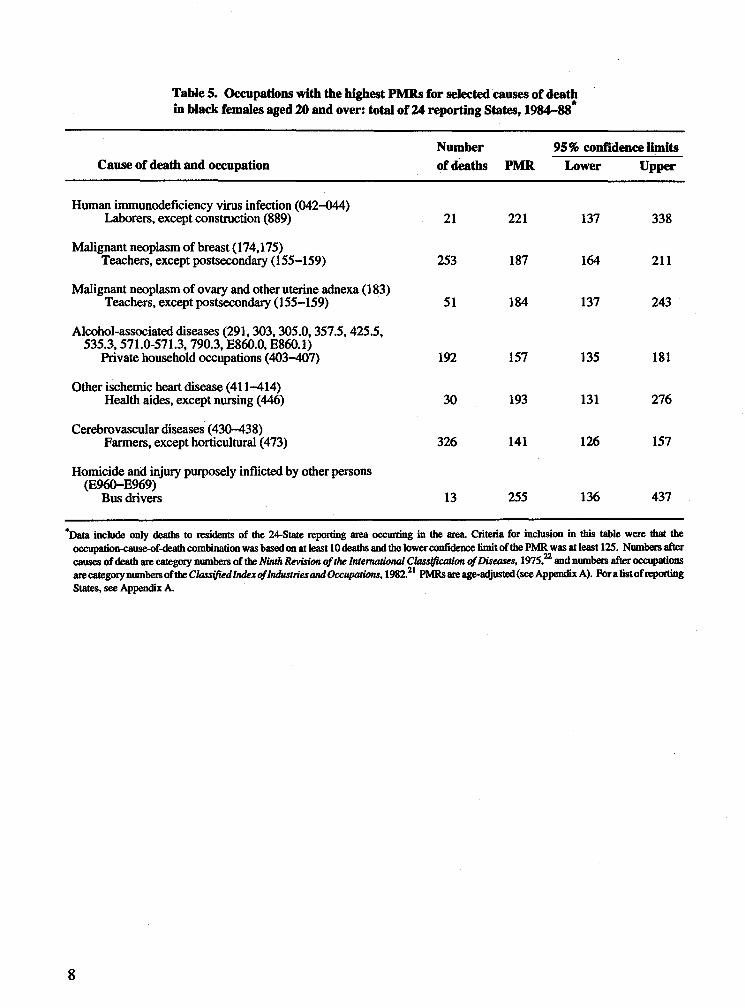
Table 5. Occupations with the highest PMRs for selected causes of deathin black females aged 20 and over: total of 24 reporting States, 1984-88*
Cause of death and occupationNumber of deaths PMR
95% confidence limits Lower Upper
Human immunodeficiency virus infection (042-044) Laborers, except construction (889) 21 221 137 338
Malignant neoplasm of breast (174,175)Teachers, except postsecondary (155-159) 253 187 164 211
Malignant neoplasm of ovary and other uterine adnexa (183) Teachers, except postsecondary (155-159) 51 184 137 243
Alcohol-associated diseases (291,303,305.0,357.5,425.5, 535.3,571.0-571.3, 790.3, E860.0, E860.1)
Private household occupations (403-407) 192 157 135 181
Other ischemic heart disease (411-414) Health aides, except nursing (446) 30 193 131 276
Cerebrovascular diseases (430-438)Farmers, except horticultural (473) 326 141 126 157
Homicide and injury purposely inflicted by other persons (E960-E969)
Bus drivers 13 255 136 437
*Data include only deaths to residents of the 24-State reporting area occurring in the area. Criteria for inclusion in this table were that the occupation-cause-of-death combination was based on at least 10 deaths and the lower confidence limit of the PMR was at least 123. Numbers after causes of death are category numbers of the Ninth Revision of the International Classification of Diseases, 1975,22 and numbers after occupations are category numbers of the Classified Index of Industries and Occupations, 1982.21 PMRs are age-adjusted (see Appendix A). For a list of reporting States, see Appendix A.
8
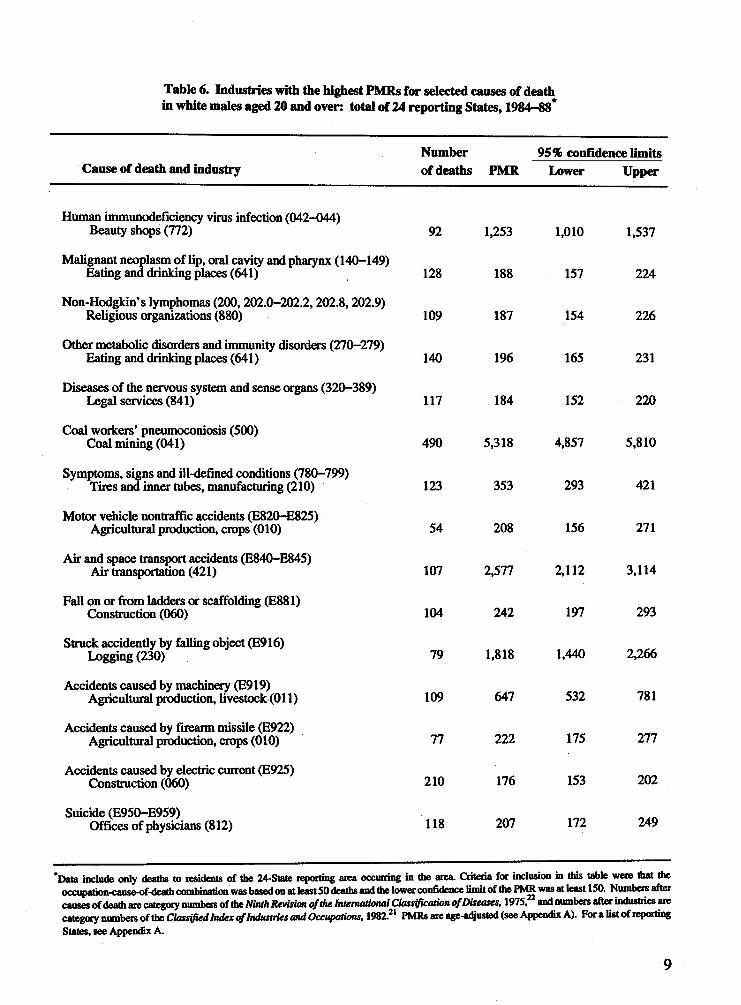
Table 6. Industries with the highest PMRs for selected causes of deathin white males aged 20 and over: total of 24 reporting States, 1984-88*
Cause of death and industryNumber of deaths PMR
95% confidence limits Lower Upper
Human immunodeficiency virus infection (042-044) Beauty shops (772) 92 1,253 1,010 1,537
Malignant neoplasm of lip, oral cavity and pharynx (140-149) Eating and drinking places (641) 128 188 157 224
Non-Hodgkin’s lymphomas (200,202.0-202.2,202.8,202.9) Religious organizations (880) 109 187 154 226
Other metabolic disorders and immunity disorders (270-279) Eating and drinking places (641) 140 196 165 231
Diseases of the nervous system and sense organs (320-389) Legal services (841) 117 184 152 220
Coal workers’ pneumoconiosis (500) Coal mining (041) 490 5,318 4,857 5,810
Symptoms, signs and ill-defined conditions (780-799) Tires and inner tubes, manufacturing (210) 123 353 293 421
Motor vehicle nontraffic accidents (E820-E825) Agricultural production, crops (010) 54 208 156 271
Air and space transport accidents (E840-E845) Air transportation (421) 107 2,577 2,112 3,114
Fall on or from ladders or scaffolding (E881) Construction (060) 104 242 197 293
Struck accidently by falling object (E916) Logging (230) 79 1,818 1,440 2,266
Accidents caused by machinery (E919) Agricultural production, livestock (011) 109 647 532 781
Accidents caused by firearm missile (E922) Agricultural production, crops (010) 77 222 175 277
Accidents caused by electric current (E925) Construction (060) 210 176 153 202
Suicide (E950-E959)Offices of physicians (812) 118 207 172 249
*Data inclii f only deaths to residents of the 24-State reporting area occurring in the area. Criteria fra: inclusion in this table were that the occupation-cause-of-death combination was based on at least 50 deaths and the lower confidence limit of the PNffi was at least 150. Numbers after causes of are category numbers of the Ninth Revision of the International Classification of Diseases, 1975, and numbers after industries arecategory numbers of the Classified Index of Industries and Occupations, 1982.21 PMRs are age-adjusted (see Appendix A). For a list of reporting States, see Appendix A.
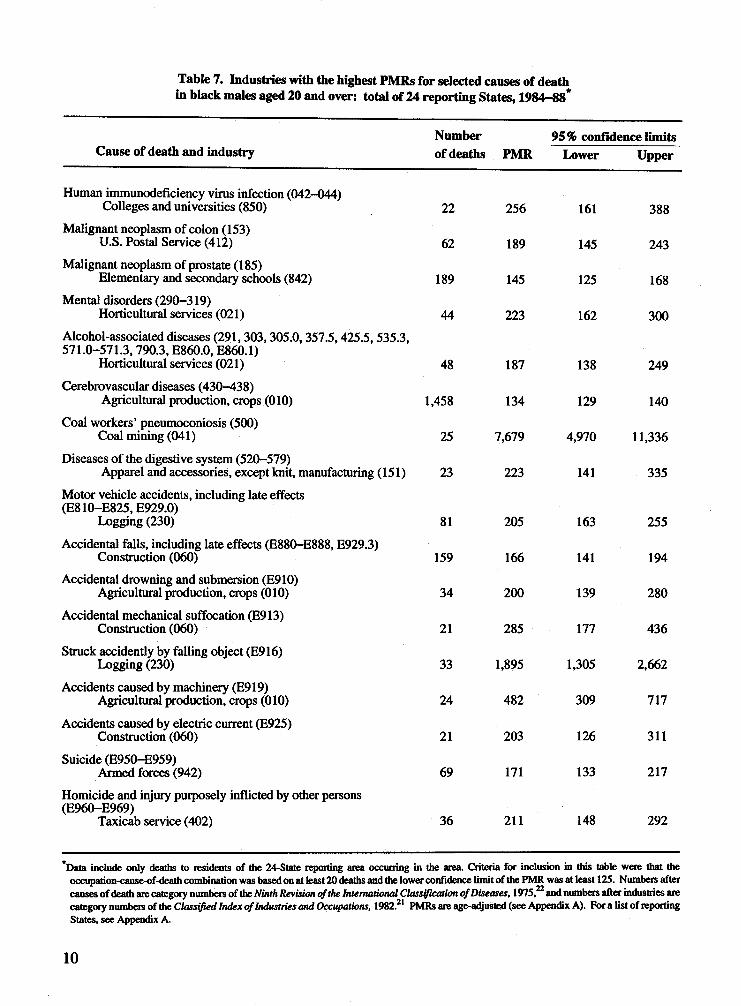
Table 7. Industries with the highest PMRs for selected causes of deathin black males aged 20 and over: total of 24 reporting States, 1984-88*
Cause of death and industryNumber of deaths PMR
95% confidence limits Lower Upper
Human immunodeficiency virus infection (042-044) Colleges and universities (850) 22 256 161 388
Malignant neoplasm of colon (153) U.S. Postal Service (412) 62 189 145 243
Malignant neoplasm of prostate (185)Elementary and secondary schools (842) 189 145 125 168
Mental disorders (290-319)Horticultural services (021) 44 223 162 300
Alcohol-associated diseases (291,303,305.0,357.5,425.5,535.3, 571.0-571.3,790.3, E860.0, E860.1)
Horticultural services (021) 48 187 138 249Cerebrovascular diseases (430-438)
Agricultural production, crops (010) 1,458 134 129 140Coal workers’ pneumoconiosis (500)
Coal mining (041) 25 7,679 4,970 11,336Diseases of the digestive system (520-579)
Apparel and accessories, except knit, manufacturing (151) 23 223 141 335Motor vehicle accidents, including late effects (E810—E825, E929.0)
Logging (230) 81 205 163 255Accidental falls, including late effects (E880-E888, E929.3)
Construction (060) 159 166 141 194Accidental drowning and submersion (E910)
Agricultural production, crops (010) 34 200 139 280Accidental mechanical suffocation (E913)
Construction (060) 21 285 177 436Struck accidently by falling object (E916)
Logging (230) 33 1,895 1,305 2,662Accidents caused by machinery (E919)
Agricultural production, crops (010) 24 482 309 717
Accidents caused by electric current (E925) Construction (060) 21 203 126 311
Suicide (E950-E959)Armed forces (942) 69 171 133 217
Homicide and injury purposely inflicted by other persons (E960-E969)
Taxicab service (402) 36 211 148 292
*Data include only deaths to residents of the 24-State repotting area occurring in the area. Criteria for inclusion in this table were that the occupadon-cause-of-death combination was based on at least 20 deaths and the lower confidence limit of the PMR was at least 125. Numbers after causes of death are category numbers of the Ninth Revision of the International Classification <ff Diseases, 1975,22 and numbers after industries are category numbers of the Classified Index of Industries and Occupations, 1982.21 PMRs are age-adjusted (see Appendix A). For a list of reporting States, see Appendix A.
10
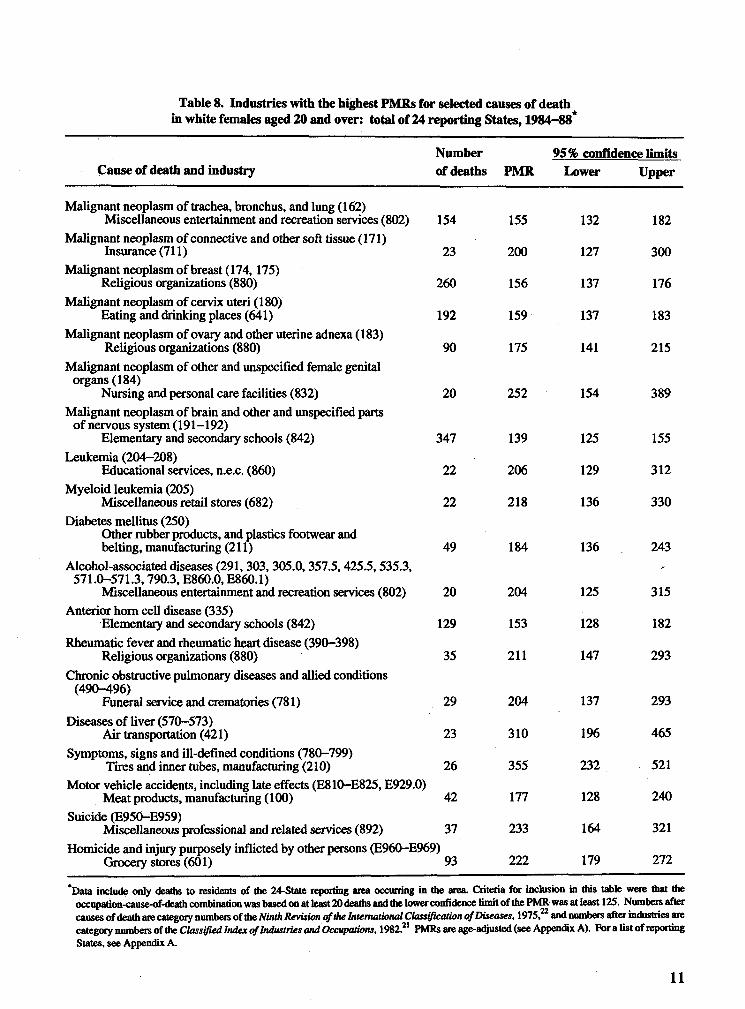
Table 8. Industries with the highest PMRs for selected causes of deathin white females aged 20 and over: total of 24 reporting States, 1984-88*
Cause of death and industryNumber of deaths PMR
95% confidence limits Lower Upper
Malignant neoplasm of trachea, bronchus, and lung (162)Miscellaneous entertainment and recreation services (802) 154 155 132 182
Malignant neoplasm of connective and other soft tissue (171) Insurance (711) 23 200 127 300
Malignant neoplasm of breast (174, 175) Religious organizations (880) 260 156 137 176
Malignant neoplasm of cervix uteri (180) Eating and drinking places (641) 192 159 137 183
Malignant neoplasm of ovaty and other uterine adnexa (183) Religious organizations (880) 90 175 141 215
Malignant neoplasm of other and unspecified female genital organs (184)
Nursing and personal care facilities (832) 20 252 154 389Malignant neoplasm of brain and other and unspecified parts
of nervous system (191—192)Elementary and secondary schools (842) 347 139 125 155
Leukemia (204-208)Educational services, n.e.c. (860) 22 206 129 312
Myeloid leukemia (205)Miscellaneous retail stores (682) 22 218 136 330
Diabetes mellitus (250)Other rubber products, and plastics footwear and belting, manufacturing (211) 49 184 136 243
Alcohol-associated diseases (291,303, 305.0,357.5,425.5,535.3, 571.0-571.3,790.3, E860.0, E860.1)
Miscellaneous entertainment and recreation services (802) 20 204 125 315Anterior horn cell disease (335)
Elementary and secondary schools (842) 129 153 128 182Rheumatic fever and rheumatic heart disease (390-398)
Religious organizations (880) 35 211 147 293Chronic obstructive pulmonary diseases and allied conditions
(490-496)Funeral service and crematories (781) 29 204 137 293
Diseases of liver (570-573) Air transportation (421) 23 310 196 465
Symptoms, signs and ill-defined conditions (780-799) Tires and inner tubes, manufacturing (210) 26 355 232 521
Motor vehicle accidents, including late effects (E810-E825, E929.0) Meat products, manufacturing (100) 42 177 128 240
Suicide (E950-E959)Miscellaneous professional and related services (892) 37 233 164 321
Homicide and injury purposely inflicted by other persons (E960-E969) Grocery stores (601) 93 222 179 272
'Data include only deaths to residents of the 24-State reporting area occurring in the area. Criteria for inclusion in this table were that the occupation-cause-of-death combination was based on at least 20 deaths and the lower confidence limit of the PMR was at least 125. Numbers after causes of death are category numbers of the Ninth Revision of the International Classification of Diseases, 1975,22 and numbers after industries are category numbers of the Classified Index of Industries and Occupations, 1982.21 PMRs are age-adjusted (see Appendix A). For a list of reporting States, see Appendix A.
11
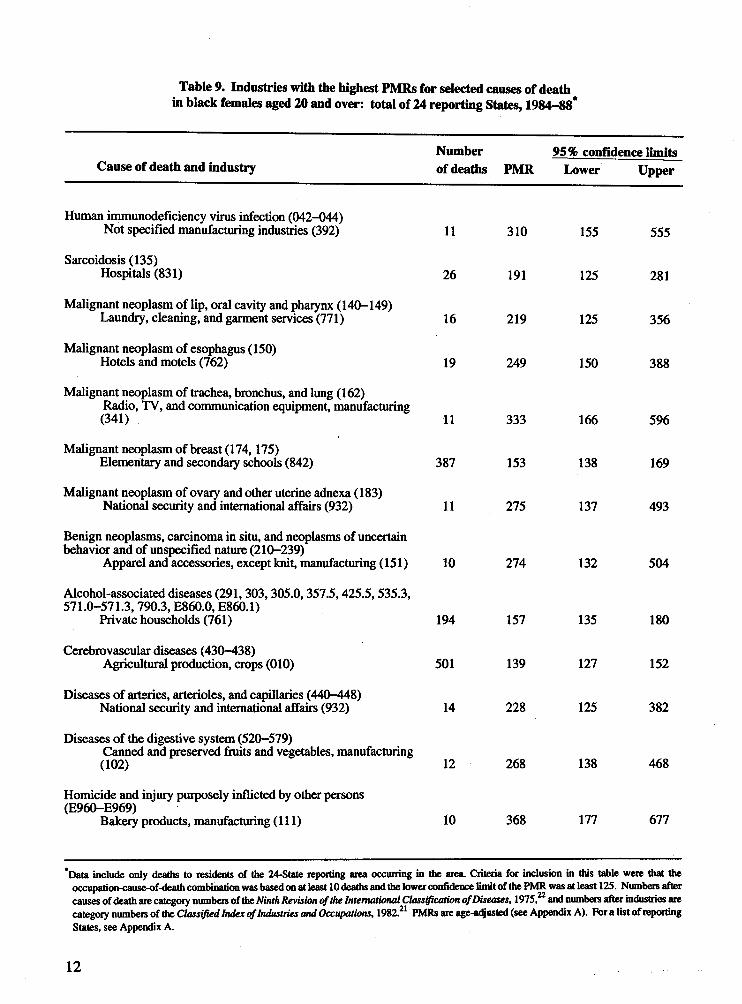
Table 9. Industries with the highest PMRs for selected causes of deathin black females aged 20 and over: total of 24 reporting States, 1984-88*
Cause of death and industryNumber of deaths PMR
95% confidence limits Lower Upper
Human immunodeficiency virus infection (042-044) Not specified manufacturing industries (392) 11 310 155 555
Sarcoidosis (135)Hospitals (831) 26 191 125 281
Malignant neoplasm of lip, oral cavity and pharynx (140-149) Laundry, cleaning, and garment services (771) 16 219 125 356
Malignant neoplasm of esophagus (150) Hotels and motels (762) 19 249 150 388
Malignant neoplasm of trachea, bronchus, and lung ( 162)Radio, TV, and communication equipment, manufacturing (341) 11 333 166 596
Malignant neoplasm of breast (174,175)Elementary and secondary schools (842) 387 153 138 169
Malignant neoplasm of ovary and other uterine adnexa (183) National security and international affairs (932) 11 275 137 493
Benign neoplasms, carcinoma in situ, and neoplasms of uncertain behavior and of unspecified nature (210-239)
Apparel and accessories, except knit, manufacturing (151) 10 274 132 504
Alcohol-associated diseases (291,303,305.0,357.5,425.5,535.3, 571.0-571.3,790.3, E860.0, E860.1)
Private households (761) 194 157 135 180
Cerebrovascular diseases (430-438)Agricultural production, crops (010) 501 139 127 152
Diseases of arteries, arterioles, and capillaries (440-448) National security and international affairs (932) 14 228 125 382
Diseases of the digestive system (520-579)Canned and preserved fruits and vegetables, manufacturing (102) 12 268 138 468
Homicide and injury purposely inflicted by other persons (E960-E969)
Bakery products, manufacturing (111) 10 368 177 677
*Data include only deaths to residents of the 24-State repotting area occurring in the area. Criteria for inclusion in this table were that the occupation-cause-of-death combination was based on at least 10 deaths and the lower confidence limit of the PMR was at least 12S. Numbers after causes of death are category numbers of the Ninth Revision of the International Classification of Diseases, 1975,22 and numbers after industries are category numbers of the Classified Index of Industries and Occupations, 1982.21 PMRs are age-adjusted (see Appendix A). For a list of reporting States, see Appendix A.
12
black females the criteria was 10 and 125. While Tables 2-9 show the occupation or industry with the highest PMR for selected causes of death, Tables B1-B16 show many other very interesting findings.
Occupations and Causes of Death
Table 2 shows occupations with the highest PMRs for selected causes of death in white males. Many of these occupational associations have been previously recognized; for example,(1) malignant neoplasm of the trachea, bronchus, and lung in insulation workers, (2) coal workers’ pneumoconiosis in mining machine operators, and (3) air and space transport accidents in airplane pilots and navigators. Some associations support results from other reports; for example, malignant neoplasm of the brain and other and unspecified parts of the nervous system in electrical and electronic engineers, (which was elevated in the study from Great Britain4), and Parkinson’s disease in all teachers but post-secondary (which was elevated in Great Britain4 and Washington State19). Other associations may be related to socioeconomic or lifestyle factors; for example, alcohol-associated diseases in bartenders—although demands of the job may also contribute to the elevated PMRs.
For black males, the highest PMR for each cause of death is shown in Table 3. Fewer of these associations can be classified as previously recognized: (1) coal workers’ pneumoconiosis in mining machine operators and(2) struck accidently by a falling object in forestry and logging occupations. Other associatio n s h a v e b e en reported previously in surveillance reports but not substantiated; for example, cerebrovascular diseases in farmers, except horticulture (seen in males in Great Britain,4 British Columbia,5 New York State,12 and Washington State19) and chronic obstructive pulmonary disease and allied conditions in molding and casting machine operators (which
was elevated in Great Britain4). An association that may be due to lifestyle or socioeconomic factors or to chance is malignant neoplasm of the colon in sales occupations and personal goods and services.
For white females, the highest PMR for each cause is shown in Table 4. Few of the associations shown in this table have been previously recognized. Instead, two occupations experien ced ex cess d e a th s fo r a num b er o f causes—which may indicate a need for further study of these groups or for targeted health promotion activities. Teachers, except postsecondary (the largest occupation group for white females) have the highest PMRs for four causes of death: (1) malignant neoplasm of other parts of the uterus, (2) Parkinson’s disease, (3) anterior horn cell disease, and (4) multiple sclerosis and other demyelinating diseases of the central nervous system. Two of these associations support results from other studies. An elevated risk for Parkinson’s disease in female teachers was reported in Washington State.19 As seen in Table 2, white male teachers in this study also had a highly elevated PMR for Parkinson’s disease. Elevated risks for multiple sclerosis were reported in Washington State19 and Great Britain.4 Waitresses experience the highest PMRs for five causes of death: (1) malignant neoplasm of the lip, oral cavity, and pharynx,(2) malignant neoplasm of the esophagus,(3) malignant neoplasm of the trachea, bronchus, and lung, (4) alcohol-associated diseases, and (5) chronic obstructive pulmonary diseases and allied conditions. Smoking and alcohol consumptions are major risk factors for these causes o f death, and the table illustrates the effect of lifestyle in this analysis and the need for health promotion programs for this occupational group.
For black females, the highest PMR for each cause is shown in Table 5. As with the white females, these are not recognized occupational associations. Two of the associations are similar
13
to the results in other race-sex groups: the PMR for malignant neoplasm of the breast is elevated in teachers, except postsecondary, as it was for white female teachers, postsecondary; and the PMR for cerebrovascular diseases in farmers, except horticultural, is elevated for both black males and females. This may indicate a need for followup.
Industries and Causes of Death
Table 6 shows the highest PMRs for industry and cause-of-death combinations for white males. Because some occupations are concentrated in one industry, many of the high PMRs for industry are similar to the results in the occupation analysis; for example, (1) human immunodeficiency virus infection in workers in beauty shops, (2) non-Hodgkin’s lymphomas in workers in religious organizations, (3) coal workers’ pneumonconiosis in workers in coal mining, (4) air and space transport accidents in workers in air transportation, (5) struck accidently by a falling object in logging workers, (6) accidents caused by machinery in agricultural production, livestock, (7) accidents caused by firearm missiles in workers in agricultural production, crops, (8) accidents caused by electric current in construction industry workers, and (9) suicide in workers in offices of physicians.
For black males, the industry results similar to the occupation results include (1) human immu- nodefiency virus infection in workers in colleges and universities, (2) malignant neoplasm of the prostate in workers in elementary and secondary schools, (3) mental disorders in workers in horticultural services, (4) cerebrovascular diseases in agricultural production workers, (5) coal workers’ pneumoconiosis in coal mining workers, and (6) struck accidently by falling object in logging workers.
For white females, the industry results are quite different from those in the occupation analysis.
Only malignant neoplasm of the cervix uteri in workers in eating and drinking places and anterior horn cell disease in workers in elementary and secondary schools are similar to the occupation results. Two of the associations have been reported previously: malignant neoplasm of the breast in workers in religious organizations12 and homicide in grocery store employees.19
As with the white females, few of the results for black females are similar to the occupation results. Those similar are malignant neoplasm of the breast in workers in elementary and secondary schools, alcohol-associated diseases in workers in private households, and cerebrovascular diseases in workers in agricultural production, crops.
Using the Results
The findings in this report can lend themselves to prevention of premature death which may be associated with workplace exposures and to understanding the association between exposure to risk factors or hazardous substances at work and death. A number of considerations for interpreting and applying the results of this analysis follow.
The PMRs presented in this report can be used in several ways. They may be evaluated by researchers and used as leads for further study. They may be used as additional information in the evaluation of previously hypothesized associations. They may identify new occupations and industries not previously recognized as experiencing an excess risk for a known occupational disease. They may be used to target health promotion and intervention activities to the appropriate workers for non-occupational disease.
A statistically significant elevation of a PMR cannot be interpreted directly as indicating a causal relationship between the industry or occupation and the cause of death. Since a very large number of PMRs were tested for statistical significance, many of the elevated PMRs will
14
occur due to chance. Other elevated PMRs will be due to confounding factors. Cigarette smoking, which is more prevalent among blue collar workers compared with white collar workers in the United States,24 is potentially a strong con- founder for a number of causes of death, including malignant neoplasms of the lung, larynx, and bladder, and ischemic heart disease. Alcohol consumption is a potential confounder for liver disease and malignant neoplasms of the mouth, pharynx, esophagus, and larynx. Socioeconomic factors such as availability of health care and diet are also potential confounders for a number of diseases.
Individual PMRs must be evaluated to determine which associations are likely to reflect cause-and-effect relationships.25 Several questions should be asked about the association:
1. Is a relationship of the potential exposure in the workplace with the disease biologically plausible? Is the relationship in accord with the known facts of the natural history and biology of the disease?
2. Is the result consistent with other surveillance or epidemiologic studies or with other race- sex groups?
3. Can the results be explained by confounding or bias?
4. Is the disease associated with workers in other occupations with similar exposures?
5. Is the result consistent with results for other diseases thought to have the same risk factor(s)?
Associations that appear, after evaluation, to be work-related may be followed up with more rigorous epidemiologic studies. More definitive studies may also be warranted to followup apparent associations of occupational groups with nonoccupational diseases for which health
promotion or intervention activities are appropriate.
Analyses of Females
The analyses of the black and white females excluded housewives to prevent biases in the PM Rs caused by u sing th is la rge category—which includes more than half of the females. Women whose usual occupation is described as Housewife on the death certificate may have had some experience in the workforce with unknown exposures. Since occupation is used in the PMR analysis as a surrogate for occupational exposure, this increase in the amount of misclassification of exposure could bias the PMRs toward the null. Furthermore, prior diseases may cause some women to remain out of the workforce. The resulting elevated proportion for such a disease for Housewives could mask an association of the disease with other occupations.
LimitationsDeath certificates collect information about the usual occupation and usual industry of the decedent This information is provided by an informant (usually the next-of-kin) to the funeral director at the time of death. The data have two types of limitations: (1) since the information is provided by a proxy who may not be aware of the exact type of work and the length of each job, the information given may not reflect the usual occupation and industry or may be nonspecific, and (2) the single items of usual occupation and usual industry may not be representative of the total work history. As a result, in cases where the death is definitely related to an occupational exposure, the usual occupation and industry recorded on the death certificate may not represent the job in which an exposure responsible for the disease occurred.
Several studies have compared the death certificate information about occupation and industry with employment information from interviews
15
conducted before death or interviews with next-of-kin.26,27,28’29’30 Except for one,27 the studies are small, with fewer than 400 comparisons. They are all limited geographically, and some are limited to specified causes of death. For white males, agreement for occupation ranged from 53% to 69%; and for industry, it ranged from 62% to 84%. Percent agreement for white females was a little higher than for white males. In one study of black males and females,27 the percent agreement for black females was similar to that for white females. The percent agreement for black males for occupation was 35%, and for industry it was 69%.
Another limitation is the quality of cause-of- death information reported on the death certificate. The medical certification of cause of death is made only by a qualified person, usually a physician, a medical examiner, or a coroner. The reliability and accuracy of cause-of-death statistics are, to a large extent, governed by the ability of the certifier to make the proper diagnosis and by the care with which he or she records this information on the death certificate. A number of studies31 have focused on the quality of this information by comparing the specified underlying cause of death to various sources, including autopsy reports and hospital records. The studies of the quality of the cause-of-death information have limitations similar to those found in the studies of employment information quality. Most of the studies are small, the alternative source of information may not be accurate, and there is no standard definition of agreement. In general, the accuracy of the certification differs among disease outcomes. A small study comparing the death certificate information with autopsy data32 found an 87% agreement for neoplasms, 82% for circulatory diseases, 50% for digestive diseases, and 33% for respiratory diseases. A second autopsy study33 found an overall concordance of 85%. This ranged from about 95% concordance for neoplasms and vascular diseases to 88% for digestive and 76% for respiratory diseases.
For accidental deaths, the information about injury at work was not routinely coded for NCHS before data year 1993. The NIOSH Division of Safety Research has constructed a database that contains information from death certificates with an indication that the injury occurred at work.6 The NTOF database contains records from all U.S. States from 1980 through 1993 for decedents aged 16 or older with an external cause of death and a Yes response to the Injury at work item on the death certificate. These data more accurately identify occupations and industries with a high risk of death due to work-related injuries than do the data in this report.
Death certificates have little information about potential confounding factors, including tobacco and alcohol use and socioeconomic status. Tobacco and alcohol use are known to be more highly associated with some occupations than with others.24,34 Socioeconomic status is usually determined by income and years of education, which are also associated with occupation. Without this information, it is not possible to control in the analysis for these possible confounders, resulting in spuriously elevated or decreased PMRs. However, studies comparing crude risk estimators with smoking- adjusted estimators suggest that the absence of information about smoking will seldom lead to serious errors in risk estimation.35,36 The lack of information about confounders is starting to be partially addressed. The Standard Certificate of Death, as revised in 1989, now collects information about the education of the decedent. The coded information was added to the 1989 mortality files for 21 States. Four States have added items collecting information about the contribution of tobacco use to the death.
Several authors have discussed the advantages and limitations of the PMR method.37,38,39,40 Briefly, the advantages are as follows: (1) the population at risk is not needed to calculate the PMRs and, therefore, additional misclassifica- tion is not introduced by using a different source
16
of occupation information in the denominator, and (2) the computer programming is relatively simple and inexpensive. The main limitation is that without a population at risk, it is not possible to estimate death rates. The PMR indicates only whether the age-standardized proportion of deaths from a specific cause appears to be higher or lower than the expected proportion for a particular occupation or industry. The PMR will be a poor estimate of the risk of death if the population-based SMR for all causes for an occupation or industry group is greatly above or below 100. For example, the SMR is often affected by socioeconomic factors, with high socioeconom ic groups having low er allcause SMRs than low socioeconomic groups.41 Therefore, a high socioeconomic occupation could have elevated PMRs for causes of death for which the death rates themselves were not elevated. The PMR may also be misleading if the death rate for a major cause of death is much higher or lower than expected in the occupation or industry. For example, if persons are selected into an occupation according to health status or level of fitness, the mortality risk for cardiovascular disease is likely to be low. This may cause a spurious increase in the PMRs for other causes of death.
C O N C L U S IO N S
The results shown in Tables 2 -9 demonstrate that analyses o f death certificate data are useful for the surveillance o f occupational mortality. Time trend analyses would be possible for the known associations of occupation with cause of death that were identified in this report. For example, malignant neoplasm of the trachea, bronchus, and lung in insulation workers; alcohol-associated d isease in bartenders; chronic obstructive pulmonary diseases and coal workers’ pneumoconiosis in mining machine operators; and accidents caused by electricity in electricians could be monitored with periodic analyses of the data.
The results could be used to generate leads for further research. Several associations with high PMRs in this report have elevated results in other occupational mortality surveillance studies. For example, elevated estimates of risk for Parkinson’s disease in both male and female teachers have been seen in Great Britain4 and Washington State.19 Elevated estimates of risk for cerebrovascular disease among farmers were reported in Great Britain,4 Washington State,19 British Columbia,5 and New York State.12 The need for followup may be indicated.
Past occupational mortality studies have been shown to be useful for targeting studies of work- related conditions and to add to the body of evidence generated from epidemiologic studies. In the United States, Dr. Samuel Milham, Jr. has long been a proponent of using mortality data for the surveillance o f occupation-related deaths. His publications of data from Washington State have stimulated several followup epidemiologic studies.42 A recent example is leukemia in electrical workers. The possibility of elevated leukemia rates in workers exposed to electric and magnetic fields was first suggested by an analysis of death certificate data from Washington State.43 This was followed by supporting evidence from the British mortality data44 and other surveillance studies. Several epidemiologic studies are now ongoing to investigate this hypothesis. Results from Milham’s surveillance reports have been cited in many other reports of epidemiologic studies.
A meta-analysis of cancer and occupation based primarily on death certificate data from the United States and Great Britain45 suggested priorities for further occupational cancer research. The report consistently found excess lung cancer in motor exhaust-related occupations. Two subsequent case-control studies, with adjustment for tobacco use,46,47 have supported these findings.
The Registrar General of Great Britain has published decennial reports on occupational
17

mortality since 1851.4 The British occupational mortality data have been used as background material supporting a number of studies, such as mortality studies of coal miners and gas workers and a study of nasal cancer in the boot and shoe industry.48 The data have been used often to check hypothesized associations between a cause of death and an occupation.
NIOSH publishes the Work-Related Lung Disease Surveillance Report which includes mortality data on lung diseases which are caused predominately by work exposures. The 1994 report49 included PMRs for asbestosis, malignant neoplasm of the pleura, pneumoconioses, and hypersensitivity pneumonitis by occupation and industry. The surveillance information is used for establishing priorities, for investigation and intervention, and for tracking progress toward elimination of preventable disease.
In addition to using the occupational mortality studies for research purposes, a few State health departments have used the analyses of their occupational data in policy setting. The State analyses have been used also as a source o f information for unions, workers, and employers on possible elevated health risks for the workers.
This analysis, based on data from 24 States, is able to examine the mortality profile for smaller occupations and industries and to include rarer causes o f death than the individual State analyses. The PMRs are based on larger numbers of observed deaths, resulting in more stable estimates. It is our hope that researchers will find these data of value in stimulating ideas for epidemiologic studies and in supporting the results of ongoing projects. The report should be a valuable resource for monitoring mortality by occupation and industry and for checking new hypotheses about conditions related to occupational exposures. It should be a useful reso u rce fo r S ta te h ealth departm ents in
addressing their need for information about occupational mortality.
R E F E R E N C E S
1. GuralnickL. Mortality by occupation and industry among men 20 to 64 years of age: United States, 1950. Vital statistics-special reports, Vol. 53, No. 2. Washington, DC: National Center for Health Statistics. 1962.
2. Guralnick L. Mortality by occupation and cause of death among men 20 to 64 years of age: United States, 1950. Vital statistics- special reports, Vol. 53, No. 3. Washington, DC: N ational Center for Health Statistics. 1963a.
3. Guralnick L. Mortality by industry and cause of death among men 20 to 64 years of age: United States, 1950. Vital statistics- special reports, Vol. 53, No. 4. Washington, DC: N ational Center for Health Statistics. 1963b.
4. Population Censuses and Surveys Office. Registrar General’s decennial supplement for England and Wales. Series DS No. 10. London, England: Her Majesty’s Stationery Office, 1995.
5. Gallagher RP, Threlfall WJ, Band PR, Spinelli JJ. Occupational mortality in British Columbia 1950-1984. Vancouver, British Columbia: Cancer Control Agency of British Columbia. 1989.
6. Jenkins EL, Kisner SM, Fosbroke DE, Layne LA, Stout NA, Castillo DN, Cutlip PM, Cianfrocco R. Fatal injuries to workers in the United States, 1980-1989: a decade o f surveillance. National Profile. Washington, DC: US Government Printing Office, DHHS (NIOSH) Publication No. 93-108. August 1993.
18
7. Peterson GR, Milham S. Occupational m orta lity in the State o f C alifo rn ia 1959-1961. Cincinnati, OH: National Institute for Occupational Safety and Health. 1980.
8. Reidmiller K, Doebbert G, Lashuay N, Rudolph L, Glazer E. California occupational mortality 1979-81. Sacramento, CA: California Department of Health Services. 1987.
9. Ford WL. An analysis of industrial and occupational mortality among white males in Kentucky 1983-1985. Frankfort, KY: Kentucky Department for Health Services. 1987.
10. Naor E, Lemieux D. Death certificates: a starting point for surveillance. Augusta, ME: Maine Department of Human Services. 1987.
11. Schwartz E, Grady K. Patterns of occupatio n a l m o rta lity in New H am pshire 1975-1985. Concord, NH: Division of Public Health Services, Bureau of Disease Control. 1986.
12. MacCubbin PA, Herzfeld PM, Therriault GD. M ortality in New Y ork State, 1980-1982: a report by occupation and industry. Monograph No. 21. Albany, NY: New York State Department of Health. 1986.
13. Surles K, Johnson P, Busecher P, Kaufman K. Occupational mortality among North Carolina males 1984-1986: a death rate analysis. Raleigh, NC: North Carolina Department of Human Resources. 1988.
14. Pennsylvania Department of Health. Mortality experience of Pennsylvania workers1983-1985. Harrisburg, PA: Pennsylvania State Health Data Center. 1987.
15. Kelley BC, Gurt DM. Surveillance Cooperative Agreement Between NIOSH and States (SCANS) Program: Rhode Island 1980-82. Cincinnati, OH: National Institute for Occupational Safety and Health. 1986.
16. Mace ML. Leading causes of death by in d u stry g ro u p s , S ou th C aro lin a1983-1985. Columbia, SC: South Carolina Department of Health and Environmental Control. 1986.
17. Brockert JE, Levy MI, Kan SH. Utah’s occupational health surveillance system, 1980-1982. Technical Report No. 0029, Salt Lake City, UT: Utah Department of Health. 1985.
18. Milham S. Occupational mortality in Washington State. Cincinnati, OH: National Institute for Occupational Safety and Health. 1976.
19. Milham S. Occupational mortality in Washington State 1950-1979. Cincinnati, OH: National Institute for Occupational Safety and Health. 1983.
20. Rosenberg HM, Burnett C, Maurer J, Spir- tas R. Mortality by occupation, industry and cause of death: 12 reporting States, 1984. Monthly Vital Statistics Report; Vol.42, No. 4, Supplement. Hyattsville, MD: National Center for Health Statistics. 1993.
21. U.S. Bureau of the Census. 1980 Census of Population: alphabetical index of industries and occupations. Washington, DC: U.S. Department of Commerce. 1982.
22. World Health Organization. Manual of the International Statistical Classification of Diseases, Injuries and Causes of Death, based on recommendations of the Ninth
19
Revision Conference, 1975. Geneva, Switzerland: World Health Organization. 1977.
23. Dubrow R, Spaeth S. Proportionate Mortality Ratio Analysis System—Version IV. Draft documentation. 1986.
24. B ra ck b ill R, F raz ie r T, S h illing S. Smoking characteristics of US workers, 1978-1980. Am J Ind Med 75:5—41.1988.
25. Hill AB. Principles of Medical Statistics. New York, NY: Oxford University Press, 1971.
26. Gute DM, Fulton JP. Agreement of occupation and industry data on Rhode Island death certificates with two alternative sources o f information. Public Health Rep 700:65-72.1985.
27. Schade WJ, Swanson GM. Comparison of death certificate occupation and industry data with lifetime occupational histories obtained by interview: variations in the accuracy of death certificate entries. Am J Ind Med 74(2):121-36. 1988.
28. Schumacher MC. Comparison of occupation and industry information from death certificates and interviews. Am J Public Health 7(5:635-37.1986.
29. Swanson GM, Schwartz AG, Burrows RW. An assessment of occupation and industry data from death certificates and hospital records for population-based cancer surveillance. Am J Public Health 74:464-61. 1984.
30. Turner DW, Schumacher MC, West DW. Comparison of occupational interview data to death certificate data in Utah. Am J Ind Med 72:145-51.1987.
31. Gittlesohn A, Royston PN. Annotated bibliography of cause-of-death validation studies, 1958-80. National Center for Health Statistics. Vital and Health Stat 2(89). 1982.
32. KircherT, Nelson J, BurdoH. The autopsy as a measure of accuracy of the death certificate. N Engl J Med 313:1263-69.1985.
33. Schottenfeld D, Eaton M, Sommers SC, Alonso DR, Wilkenson C. The autopsy as a measure of accuracy of the death certificate. Bull NY Acad Med 55:778-94.1982.
34. OlkinuoraM. Alcoholism and occupation. Scand J Work Environ Health 70:511-15. 1984.
35. Blair A, Hoar SK, Walrath J. Comparison o f crude and smoking-adjusted standardized mortality ratios. J Occup Med 27:881-84.1985.
36. Siemiatycki J, Wacholder S, Dewar R, Cardis E, Greenwood C, Richardson L. Degree of confounding bias related to smoking, ethnic group, and socioeconomic status in estimates of the associations between occupation and cancer. J Occup Med 50:617-25.1988.
37. Kupper LL, McMichael AJ, Symons MJ, Most BM. On the utility of proportional mortality analysis. J Chron Dis 57:15-22. 1978.
38. Decoufle P, Thomas TL, Pickle LW. Comparison of the proportionate mortality ratio and standardized mortality ratio risk measures. Am J Epidemiol 111{3):263-69. 1980.
39. Wong O, Decoufle P. Methodological issues involving the standardized mortality ratio and proportionate mortality ratio in
20
occupational studies. JOM 24:299-304. 1982.
40. Roman E, Beral V, Inskip H. A comparison of standardized and proportional mortality ratios. S tatin Med 3:15-22.1984.
41. P ark RM, M aiz lish NA, Punnett L, Moure-Eraso R, Silverstein MA. A comparison of PMRs and SMRs as estimators of occupational mortality. Epidemiology 2:49-59.1991.
42. M ilhamS. Experience in using death cert i f ic a te o c c u p a tio n a l in fo rm atio n . Hyattsville, MD: DHEW Publication No. (PHS) 79-1214. 1979.
43. Milham S. Mortality from leukemia in workers exposed to electrical and magnetic fields. (Letter). N Engl J Med 307:249. 1982.
44. McDowall ME. Leukemia mortality in electrical workers in England and Wales. (Letter). Lancet i(8318):246.1983.
45. DubrowR, WegmanDH. Setting priorities for occupational cancer research and control: synthesis of the results of occupational disease surveillance studies. J Natl Cancer Inst 77:1123-42.1983.,
46. Hayes RB, Thomas T, Silverman DT, Vineis P, Blot WJ, Mason TJ, Pickle LW, Correa P, Fontham ETH, Schoenberg JB. Lung cancer in motor exhaust-related occupations. Am J Ind Med 16:685-95.1989.
47. Steenland NK, Silverman DT, Homung RW. Case-control study of lung cancer and truck driving in the teamsters union. Am J Public Health 80:670-74.1990.
48. Alderson MR. Some sources of error in British occupational mortality data. Brit J Ind Med 29:245-54.1972.
49. National Institute for Occupational Safety and Health. Work-Related Lung Disease S u rv eillan ce R ep o rt, 1994. DHHS (NIOSH) Publication 94-120, August 1994.
50. National Center for Health Statistics. Industry and occupation coding for death certificates, 1984. NCHS instruction manual; Part 19, Hyattsville, MD: Public Health Service. 1984.
51. National Center for Health Statistics. Vital statistics: instructions for classifying the underlying cause of death. NCHS instruction manual, Part 2a. Rockville, MD: Public Health Service.
52. Mantel N, Haenszel W. Statistical aspects of the analysis of data from retrospective studies of disease. J Natl Cancer Inst 22:719-48.1959.
53. BailarJCIII,EdererF. Significance factors for the ratio of a Poisson variable to its expectation. Biometrics: The Biometric Society 20(3):639-43.1964.
54. Dowdy S, Wearden S. Statistics for Research. New York, NY: John Wiley and Sons. 1983.
55. Miller, RG. Simultaneous Statistical Inference. New York, NY: McGraw-Hill Book Company. 1966.
56. National Center for Health Statistics. Catalog o f E le c tro n ic D a ta P ro d u c ts . Hyattsville, MD: Public Health Service. 1990.
21
A P P E N D IX A
T E C H N IC A L N O T E S
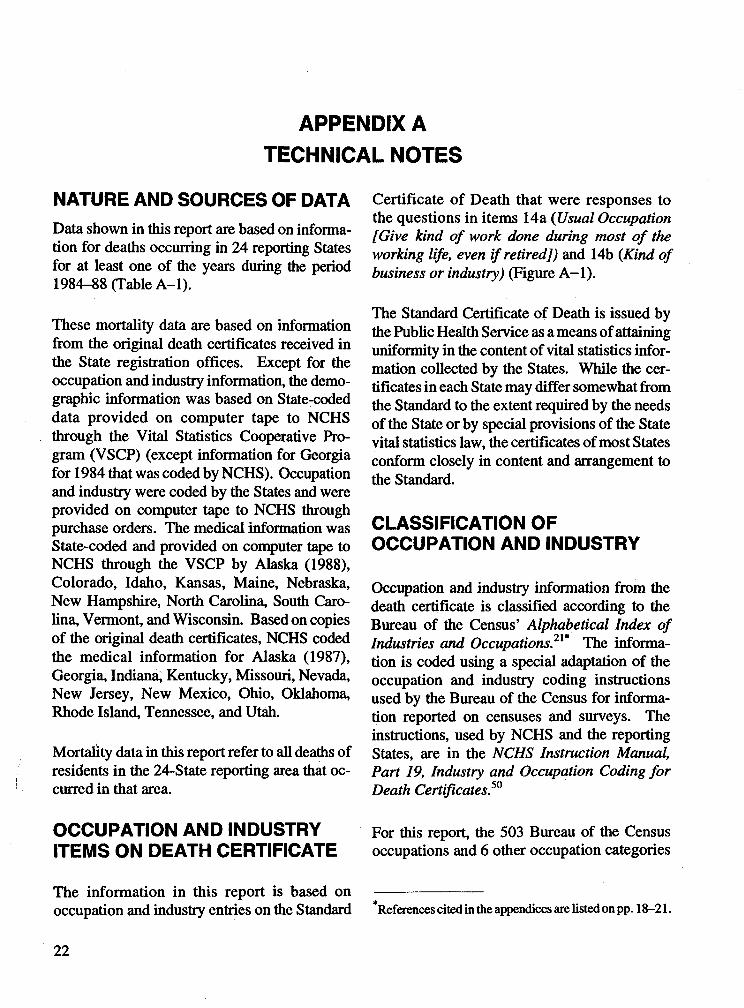
N A T U R E A N D S O U R C E S O F D ATA
Data shown in this report are based on information for deaths occurring in 24 reporting States for at least one of the years during the period1984-88 (Table A -l) .
These mortality data are based on information from the original death certificates received in the State registration offices. Except for the occupation and industry information, the demographic information was based on State-coded data provided on computer tape to NCHS through the Vital Statistics Cooperative Program (VSCP) (except information for Georgia for 1984 that was coded by NCHS). Occupation and industry were coded by the States and were provided on computer tape to NCHS through purchase orders. The medical information was State-coded and provided on computer tape to NCHS through the VSCP by Alaska (1988), Colorado, Idaho, Kansas, Maine, Nebraska, New Hampshire, North Carolina, South Carolina, Vermont, and Wisconsin. Based on copies of the original death certificates, NCHS coded the medical information for Alaska (1987), Georgia, Indiana, Kentucky, Missouri, Nevada, New Jersey, New Mexico, Ohio, Oklahoma, Rhode Island, Tennessee, and Utah.
Mortality data in this report refer to all deaths of residents in the 24-State reporting area that occurred in that area.
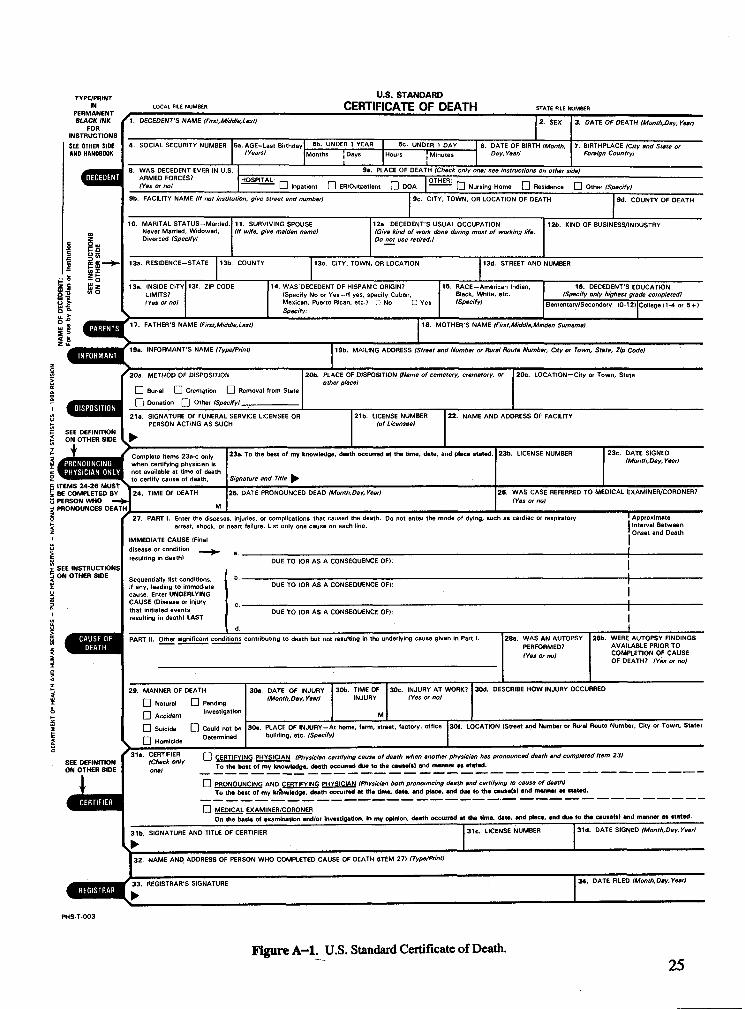
O C C U P A T IO N A N D IN D U ST R Y ITEM S O N D E A T H C ERTIFIC A TE
Certificate o f Death that were responses to the questions in items 14a (Usual Occupation [Give kind of work done during most of the working life, even if retired]) and 14b (Kind of business or industry) (Figure A -l) .
The Standard Certificate of Death is issued by the Public Health Service as a means of attaining uniformity in the content of vital statistics information collected by the States. While the certificates in each State may differ somewhat from the Standard to the extent required by the needs of the State or by special provisions of the State vital statistics law, the certificates of most States conform closely in content and arrangement to the Standard.
C L A SSIF IC A T IO N O F O C C U P A T IO N A N D IN D U S T R Y
Occupation and industry information from the death certificate is classified according to the Bureau of the Census’ Alphabetical Index of Industries and Occupations.21* The information is coded using a special adaptation of the occupation and industry coding instructions used by the Bureau of the Census for information reported on censuses and surveys. The instructions, used by NCHS and the reporting States, are in the NCHS Instruction Manual, Part 19, Industry and Occupation Coding for Death Certificates.50
For this report, the 503 Bureau of the Census occupations and 6 other occupation categories
* References cited in the appendices are listed on pp. 18-21.The information in this report is based on occupation and industry entries on the Standard
2 2
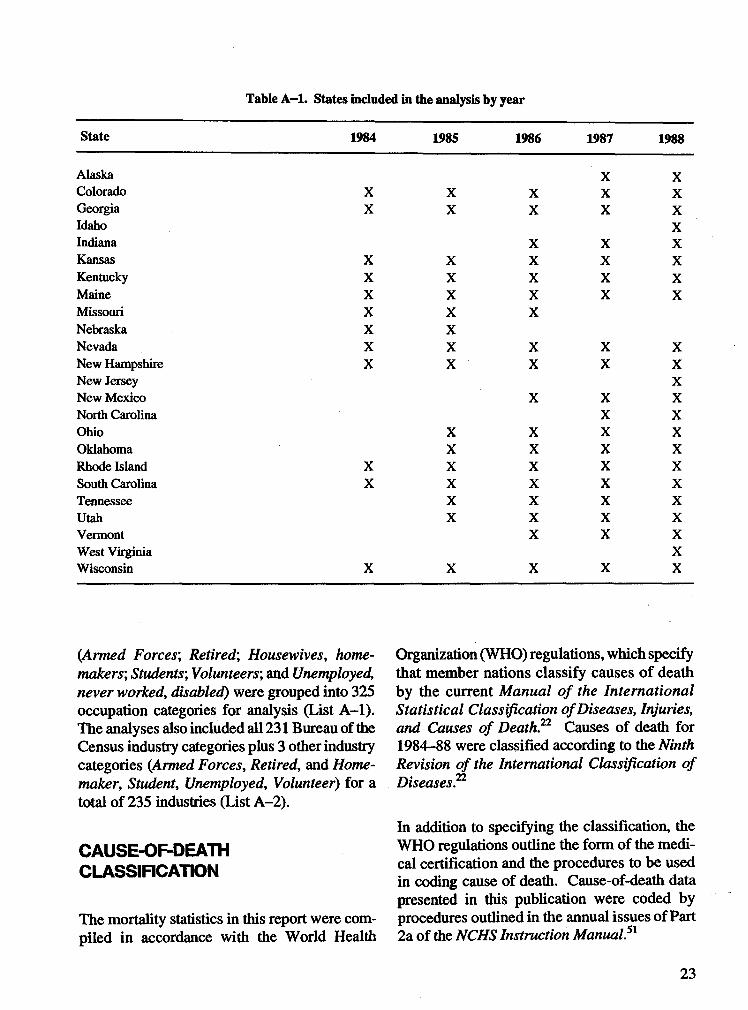
Table A -l. States included in the analysis by year
State 1984 1985 1986 1987 1988
Alaska X XColorado X X X X XGeorgia X X X X XIdaho XIndiana X X XKansas X X X X XKentucky X X X X XMaine X X X X XMissouri X X XNebraska X XNevada X X X X XNew Hampshire X X X X XNew Jersey XNew Mexico X X XNorth Carolina X XOhio X X X XOklahoma X X X XRhode Island X X X X XSouth Carolina X X X X XTennessee X X X XUtah X X X XVermont X X XWest Virginia XWisconsin X X X X X
(Armed Forces', Retired', Housewives, homemakers', Students', Volunteers; and Unemployed, never worked, disabled) were grouped into 325 occupation categories for analysis (List A -l) . The analyses also included all 231 Bureau of the Census industry categories plus 3 other industry categories (Armed Forces, Retired, and Homemaker, Student, Unemployed, Volunteer) for a total of 235 industries (List A-2).
CAUSE-OF-DEATH CLASSIFICATION
The mortality statistics in this report were compiled in accordance with the World Health
Organization (WHO) regulations, which specify that member nations classify causes o f death by the current Manual of the International Statistical Classification of Diseases, Injuries, and Causes of Death?2 Causes of death for1984-88 were classified according to the Ninth Revision of the International Classification of Diseases.22
In addition to specifying the classification, the WHO regulations outline the form of the medical certification and the procedures to be used in coding cause of death. Cause-of-death data presented in this publication were coded by procedures outlined in the annual issues of Part 2a of the NCHS Instruction Manual?1
23
C A U S E -O F -D E A T H LIST
For analysis of occupation and industry mortality data, a special list of 192 causes of death (List A -3) was developed jointly by NIOSH and NCHS. Of the 192 causes, 185 were analyzed for males and 188 for females. This list was created keeping in mind those causes of death that might possibly be associated with occupational exposures, particularly malignant neoplasms of selected sites and numerous accidental death categories.
Q U A L IT Y C O N T R O L
Quality control for the occupation and industry (O/I) coding was conducted by NCHS. For each year, States that maintained an error rate of less than 10% for the year and had less than 10% of their records coded to Retired or Unknown were included in the analysis. All 24 States met the criteria for at least 1 year. See Table 1 in the
main text for the number and percentage distribution of the records coded to Retired or Unknown.
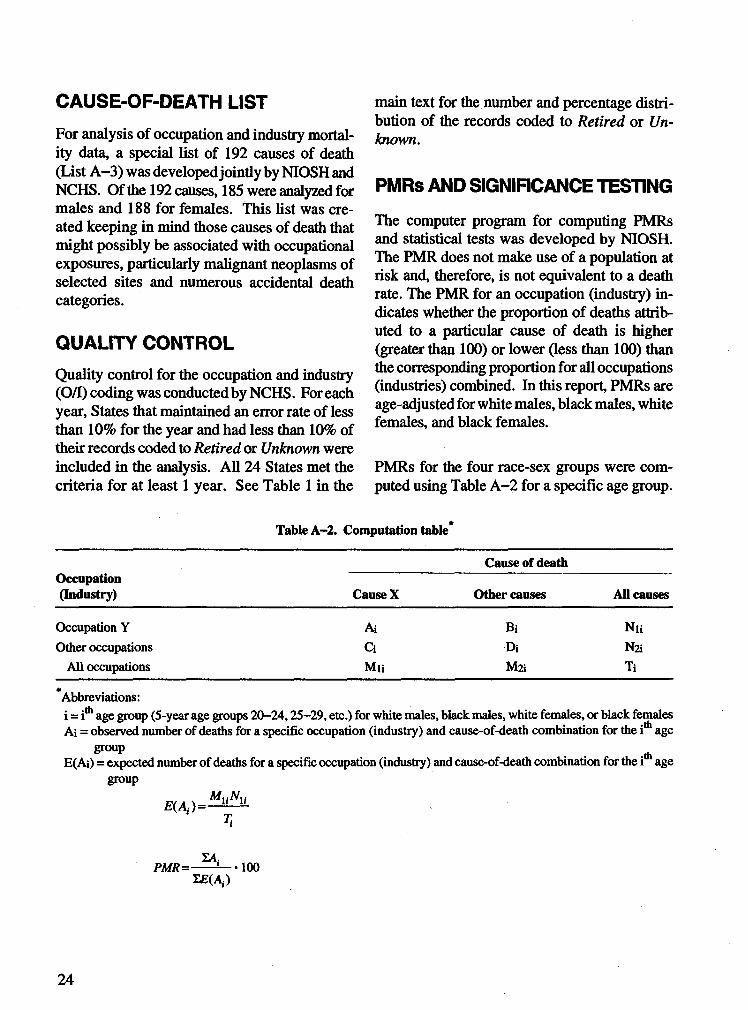
P M R s A N D SIGNIFICANCE TESTING
The computer program for computing PMRs and statistical tests was developed by NIOSH. The PMR does not make use of a population at risk and, therefore, is not equivalent to a death rate. The PMR for an occupation (industry) indicates whether the proportion of deaths attributed to a particular cause of death is higher (greater than 100) or lower (less than 100) than the corresponding proportion for all occupations (industries) combined. In this report, PMRs are age-adjusted for white males, black males, white females, and black females.
PMRs for the four race-sex groups were computed using Table A -2 for a specific age group.
Table A-2. Computation table
Occupation(Industry)
Cause of death
Cause X Other causes All causes
Occupation Y Ai Bi NuOther occupations Ci Di Na
All occupations Mu Ma Ti
Abbreviations:i = ith age group (5-year age groups 20-24,25-29, etc.) for white males, black males, white females, or black females Ai = observed number of deaths for a specific occupation (industry) and cause-of-death combination for the i age
group . , ^E(Ai) = expected number of deaths for a specific occupation (industry) and cause-of-death combination for the i age
group
E(Ai )= MUNUT i
PMR=-ZE(A,.)
100
24
DEPA
RTME
NT
OF HE
ALTH
AND
HUMA
N SER
VICES
- PUB
LIC
HEALT
H SER
VICE
- NA
TIONA
L CEN
TER F
OR HE
ALTH
STAT
ISTIC
S
TYPE/PRINTIN LOCAL FILE NUMBER
PERMANENT j
U.S. STANDARDCERTIFICATE OF DEATH STATE FILE NUMBER
BLACK INK FOR
INSTRUCTIONS SEE OTHER SIOE AND HANDBOOK
1. DECEDENT'S NAME (First,Middle,Last)
8. WAS DECEDENT EVER IN U.S.iraraiiana armed forces?
(Yes or noI
4. SOCIAL SECURITY NUMBER Sa.AGE-Last Birthday 5b. UNDER 1 YEAR 5c. UNDER 1 DAY 6. DATE OF BIRTH (Month, 7. BIRTHPLACE (City and State or(Years) Months J Days
IHours J Minutes
lDay, Year) Foreign Country)
3. DATE OF DEATH (Month,Day, Year/
la. PLACE OF DEATH (Check only one; see instructions on other sideI
ib. FACILITY NAME (If not institution, give Street end numberf
g Ou
10. MARITAL STATUS-Married Never Married, Widowed, Divorced (SpecifyI
11. SURVIVING SPOUSE (If wife, give maiden name)
HOSPITAL: OTHER: _I_I Inpatient I_I ER/Outpatient \_I DOA I_| Nursing Home I_I Residence I_I Other (Specify)
9c. CITY, TOWN. OR LOCATION OF DEATH
12a. DECEDENT'S USUAL OCCUPATION (Give kind of work done during most of working life. Do not use retired.}
17. FATHER'S NAME (First,Middle,Last)
19a. INFORMANT'S NAME (Type/Print)
20a. METHOD OF DISPOSITION
I I Burial CD Cremation D Removal from State | I Donation Q] Other tSperifyi
9d. COUNTY OF DEATH
12b. KIND OF BUSINESS/INDUSTRY
13a. RESIDENCE-STATE 13b. COUNTY 13c. CITY. TOWN, OR LOCATION 13d. STREET AND NUMBER
13e. INSIDE CITY LIMITS?(Yes or no)
13f. ZIP CODE 14. WAS DECEDENT OF HISPANIC ORIGIN?(Specify No or Yes-lf yes, specify Cuban, Mexican, Puerto Rican, etc.) n No C Yes Specify:
15. RACE—American Indian, Black, White, etc. (Specify)
16. DECEDENT'S E (Specify only highest gre
Elementary/Secondary (0-12)
3UCATION de completed) College (1-4 or 5 + )
18. MOTHER'S NAME (First,Middle,Maiden Surname)
19b. MAILING ADDRESS (Street and Number or Rural Route Number, City or Town, State, Zip Code)
20b. PLACE OF DISPOSITION (Name of cemetery, crematory, or other placet
21a. SIGNATURE OF FUNERAL SERVICE LICENSEE OR PERSON ACTING AS SUCH
SEE DEFINITION I ^ON OTHER SIDE I W
ITEMS 24-26 MUST BE COMPLETED BY PERSON WHO — PRONOUNCES DEATH
Complete items 23a-c only when certifying physician is not available at time of death to certify cause of death.24. TIME OF DEATH
21b. LICENSE NUMBER (of Licensee)
20c. LOCATION—City or Town, State
22. NAME AND ADDRESS OF FACILITY
23a. To the best of my knowledge, death occurred at the time, date, and place stated.
Signature and Title ^25. DATE PRONOUNCED DEAD (Month.Day,YearI
23b. LICENSE NUMBER 23c. DATE SIGNEO (Month,Day, Year!
26. WAS CASE REFERRED TO MEDICAL EXAMINER/CORONER? (Yes or no)
SEE INSTRUCTIONS ON OTHER SIDE
27. PART I. Enter the diseases, injuries, or complications that caused the death. Do not enter the mode of dying, such as cardiac or respiratory arrest, shock, or neart failure. List only one cause on each line.
IMMEDIATE CAUSE (Final disease or condition aresulting in death)
I Approximate | Interval Between ! Onset and Death
DUE TO (OR AS A CONSEQUENCE OF):
Sequentially fist conditions, if any, leading to immediate cause. Enter UNOERLYING CAUSE (Disease or injury that initiated events resuiting in death) LAST
DUE TO (OR AS A CONSEQUENCE OF):
DUE TO (OR AS A CONSEQUENCE OF):
PART il. Other significant conditions contributing to death but not resulting in the underlying cause given in Part I. 28a. WAS AN AUTOPSY PERFORMED?(Yes or noi
28b. WERE AUTOPSY FINDINGS AVAILABLE PRIOR TO COMPLETION OF CAUSE OF DEATH? (Yes or no)
29. MANNER OF DEATHI I Natural O Pending □ Accident ""'«Ration
(~| Suicide O Could not be l~~l Homicide Determined
30a. DATE OF INJURY (Month,Day, Year)
30b. TIME OF 30c. INJURY AT WORK?INJURY (Yes or no)
M
30d. DESCRIBE HOW INJURY OCCURRED
30e. PLACE OF INJURY-At home, farm, street, factory, office 30f. LOCATION (Street and Number or Rural Route Number, City or Town, State) building, etc. (SpecifyI
31a. CERTIFIER Q certifying PHYSICIAN (Physician certifying cause of death when another physician has pronounced death and completed Item 23)onef ^ To the bast of my knowledge, death occurred due to the cause(s) and manner aa stated.
□ PRONOUNCING AND CERTIFYING PHYSICIAN (Physician both pronouncing death and certifying to cause of death)To the best of my knowledge, death occurred at the time, date, and place, and due to the causeU) and manner as stated,
□ MEDICAL EXAMINER/CORONEROn the basis of examination and/or Investigation, In my opinion, death occurred at the time, date, and place, and due to the cause(s) and manner as stated.
31b. SIGNATURE AND TITLE OF CERTIFIER ►
31c. LICENSE NUMBER 31d. DATE SIGNED (Month.Day, Year)
32. NAME AND ADDRESS OF PERSON WHO COMPLETED CAUSE OF DEATH (ITEM 27) (Type/Print)
33. REGISTRAR'S SIGNATURE 34. DATE FILED (Month.Day, Year)
Figure A -l. U.S. Standard Certificate of Death.25
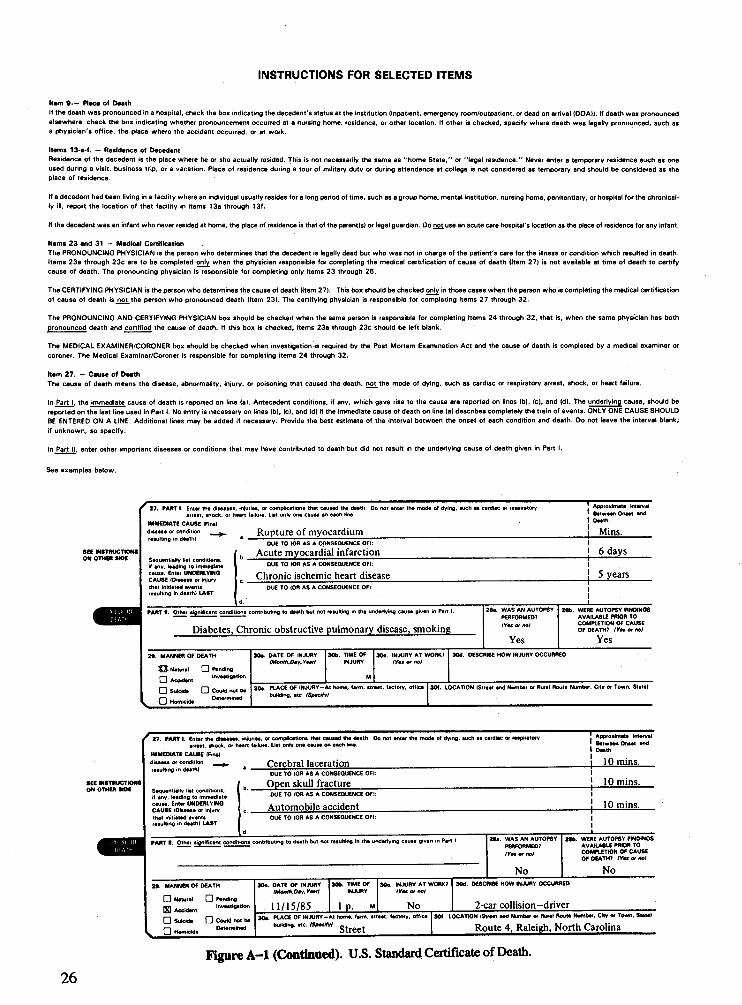
INSTRUCTIONS FOR SELECTED ITEMS
Ham 9 -- Place of DeathIf the death was pronounced in a hospital, check the box indicating the decedent’s status at the institution (inpatient, emergency room/outpatient, or dead on arrival {DOAH. If death was pronounced elsewhere, check the box indicating whether pronouncement occurred at a nursing home, residence, or other location. If other is checked, specify where death was legally pronounced, such as a physician's office, the place where the accident occurred, or at work.
Items 13-a-f. — Residence of DecedentResidence of the decedent is the place where he or she actually resided. This is not necessarily the same as "home State," or "legal residence." Never enter a temporary residence such as one used during a visit, business trip, or a vacation. Place of residence during a tour of military duty or during attendance at college is not considered as temporary and should be considered as the place of residence.
If a decedent had been living in a facility where an individual usually resides for a long period of time, such as a group home, mental institution, nursing home, penitentiary, or hospital for the chronically ill, report the location of that facility in items 13a through 13f.
If the decedent was an infant who never resided at home, the place of residence is that of the parent(s) or legal guardian. Oo not use an acute care hospital’s location as the place of residence for any infant.
Items 23 and 31 — Medical CertificationThe PRONOUNCING PHYSICIAN is the person who determines that the decedent is legally dead but who was not in charge of the patient's care for the illness or condition which resulted in death. Items 23a through 23c are to be completed only when the physician responsible for completing the medical certification of cause of death (Item 27) is not available at time of death to certify cause of death. The pronouncing physician is responsible for completing only items 23 through 26.
The CERTIFYING PHYSICIAN is the person who determines the cause of death (Item 27). This box should be checked only in those cases when the person who is completing the medical certification of cause of death is not the person who pronounced death (Item 23). The certifying physician is responsible for completing items 27 through 32.
The PRONOUNCING AND CERTIFYING PHYSICIAN box should be checked when the same person is responsible for completing Items 24 through 32, that is, when the same physician has both pronounced death 8nd certified the cause of death. If this box is checked, items 23a through 23c should be left blank.
The MEDICAL EXAMINER/CORONER box should be checked when investigation is required by the Post Mortem Examination Act and the cause of death is completed by a medical examiner orcoroner. The Medical Examiner/Coroner is responsible for completing items 24 through 32.
Item 27. — Cause of DeathThe cause of death means the disease, abnormality, injury, or poisoning that caused the death, not the mode of dying, such as cardiac or respiratory arrest, shock, or heart failure.
In Part I, the immediate cause of death is reported on line (a). Antecedent conditions, if any. which gave rise to the cause are reported on lines (b), (c), and (d). The underlying cause, should be reported on the last line used in Part I. No entry is necessary on lines (b), (c), and (d) if the immediate cause of death on line (a) describes completely the train of events. ONLY ONE CAUSE SHOULD 8E ENTERED ON A LINE. Additional lines may be added if necessary. Provide the best estimate of the interval between the onset of each condition and death. Do not leave the interval blank; if unknown, so specify.
In Part II, enter other important diseases or conditions that may have contributed to death but did not result in the underlying cause of death given in Part I.
See examples below.
8CE INSTRUCTIONS ON OTHER StOC
27. PART I. Enter the diseases. injurias, or complications that cauaad the death. Oo n arrest. «hock, or naan failure- Liai only on* causa on each line.
IMMEDIATE CAUSE (FinalRupture of myocardium
[ enter the mode of dying, such as cardiac or respiratory
disease or condition resultino in death)
! Approximate Interval È Between Onset and I DeathI Mins.____
Sequentially conditions, if any. leading to immediate cause- Enter UNDERLYING CAUSE (Disease or injury that initiated events resulting in death) LAST
DUE TO IOR AS A CONSEQUENCE OFI:Acute myocardial infarction 6 days
DUE TO «OR AS A CONSEQUENCE OFI:Chronic ischemic heart disease 5 years
OUE TO (OR AS A CONSEQUENCE OF):I
PART i. Other significant conditions contributing to daath but not resulting in the underlying cause given in Part I.
Diabetes, Chronic obstructive pulmonary disease, smoking
I. MANNER OF DEATHO Natural O Pending□ . InvestigationAccident□ Suicide □ Could not be□ DeterminedHomicide
. DATE OF INJURY (Month,Dty,yȎfl
30b. TIME OF INJURY
30c. INJURY AT WORK7 lYl* or not
2Bfe. WERE AUTOPSY FINDINGS AVAILABLE PRIOR TO COMPLETION OF CAUSE OF DEATH? <Yk or no)
Yes30d. DESCRIBE HOW INJURY OCCURREO
30e. PLACE OF INJURV-At home, farm, street, factory, office 30f. LOCATION (Street end Number or Rural Route Number. City or Town, Stete) building, etc. (Specify)
27. PART I. Enter the diseases, infuries, or complications that caused the death. Oo not enter the mode of dying, such as cardiac or respiratory arrest, shock, or heert feikire. List only one cause on each line.
IMMEDIATE CAUSE (Final, Cerebral laceration___________________________s or condition
resulting in death)
Approximate Interval ' Between Oneet and I Deatht IQ m ins.
•EE MSTftUCTIONS ON OTHER StOC Sequentially list conditions,
if any. leading to immediate cause. Enter UNDERLYING CAUSE {Disease or injury that initiated events resulting in death) LAST
DUE TO (OR AS A CONSEQUENCE OFI:Open skull fracture____ 10 mins.OUE TO t o n AS A CONSEQUENCE OFI:
A utom obile accident 10 mins.OUE TO (OR AS A CONSEQUENCE OFI:
PART N. Other significant conditions contributing to death but not resulting in the underlying cause given in Part I
29. MANNER OF OEATH□ Natural D Pending H Accktont '"»••'W*» G Suicida Q Could not be□ . DeterminedHomicide
PLACE OF INJURY-At home. farm, street, fectory. office building, etc. (Specify) - ,atreet
. WAS AN AUTOPSY PERFORMED? lYêt or not
No
2Bb. WERE AUTOPSY FINDiNOS AVAILABLE PRIOR TO COMPLETION OF CAUSE OF OEATH? (Yot or no)
No30«. DATE OF INJURY 30b. TIME OF 30c. INJURY AT WORK? 30d DESCRIBE HOW INJURY OCCURREO
IMonth,Dty.Y—rl INJURY (Yos or noi
11/15/85 1 p. M No 2-car collision-driver30f. LOCATION (Street and Number or Rural Route Number. City or Town. \
Route 4, Raleigh. North Carolina
Figure A -l (Continued). U.S. Standard Certificate of Death.
26
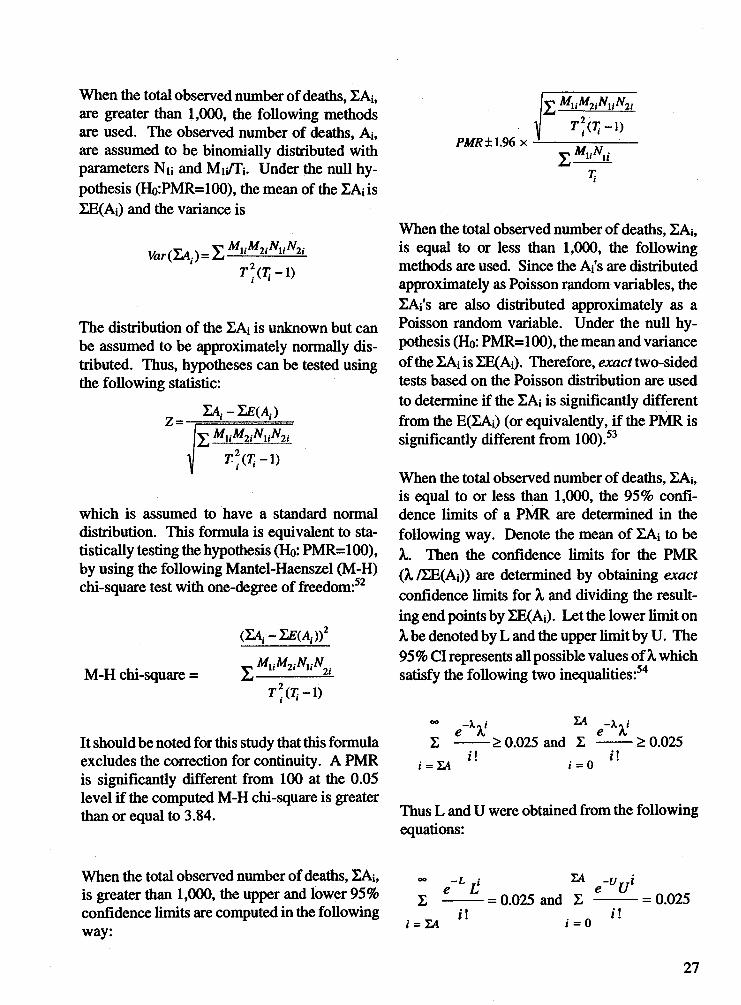
When the total observed number of deaths, EAi, are greater than 1,000, the following methods are used. The observed number of deaths, Ai, are assumed to be binomially distributed with parameters Nu and M i/ft. Under the null hypothesis (Ho:PMR=100), the mean of the ZAiis EE(Ai) and the variance is
Jfcr(ZA,.)=ZMuM2iNuN2i
T 2.(T.t - \ )
The distribution of the ZAi is unknown but can be assumed to be approximately normally distributed. Thus, hypotheses can be tested using the following statistic:
Z=y MuM2iNuN2i
T 2. ( T i - 1 )
which is assumed to have a standard normal distribution. This formula is equivalent to statistically testing the hypothesis (Ho: PMR=100), by using the following Mantel-Haenszel (M-H) chi-square test with one-degree of freedom:52
M-H chi-square =
(ZA,.-Z£(A,.))2
^ M u M 2i N u N 2
T 2.( Tj-1)
It should be noted for this study that this formula excludes the correction for continuity. A PMR is significantly different from 100 at the 0.05 level if the computed M-H chi-square is greater than or equal to 3.84.
IV M UM 2iN \ i N l i
PMR ±1.96 XT . W - l )
V MuNii
When the total observed number of deaths, ZAi, is equal to or less than 1,000, the following methods are used. Since the Ai's are distributed approximately as Poisson random variables, the EAi's are also distributed approximately as a Poisson random variable. Under the null hypothesis (Ho: PMR=100), the mean and variance of the ZAi is ZE(Ai). Therefore, exact two-sided tests based on the Poisson distribution are used to determine if the XAi is significantly different from the E(EAi) (or equivalently, if the PMR is significantly different from 100).53
When the total observed number of deaths, ZAi, is equal to or less than 1,000, the 95% confidence limits of a PMR are determined in the following way. Denote the mean of EAi to beA,. Then the confidence limits for the PMR (A, /EE(Ai)) are determined by obtaining exact confidence limits for A, and dividing the resulting end points by ZE(Ai). Let the lower limit onA, be denoted by L and the upper limit by U. The 95 % Cl represents all possible values of A, which satisfy the following two inequalities:54
-X,<\ f e X ™ g - X x i
> 0.025 and I -------> 0.025; = la
I !i = 0
!!
Thus L and U were obtained from the following equations:
When the total observed number of deaths, ZAi, <*» _L ; ia _v /is greater than 1,000, the upper and lower 95% £ £_____£ . _ q q25 and 2 e U = 0.025confidence limits are computed in the following / j /!i = IA i = oway:
27
When these two end points are divided by EE(Ai) and multiplied by 100, this determines a 95% Cl that will cover 100 if and only if the hypothesis test with a = 0.05 is not significant.
It should be noted that the criterion for PMRs to be shown in this report is that the PMR for a cause of death and an occupation (industry) had to be 120 or more and statistically significantly higher than 100 and had to have 10 or more observed deaths for the group aged 20 and over for a particular race-sex group. All other PMRs are available upon request.
Caution should be exercised in interpreting statistically significant PMRs. Since approximately430,000 PMRs were statistically tested, about 5% (about 21,500) would be expected to be
statistically significant at least at the .05 level, just due to chance (if the tests were independent).55
P U B L IC -U S E D A T A T A P E S
Beginning with data for 1985, mortality public- use data tapes include information about the occupation and industry of the decedent, along with other coded demographic and medical information. The detailed contents of the mortality data tapes and other public-use data tapes from NCHS are described in the NCHS publication Catalog of Electronic Data Products.x The 1985-93 mortality public-use data tapes may be purchased from the following:
National Technical Information Service U.S. Department of Commerce Springfield, Virginia 22161, (703) 487-4650
28
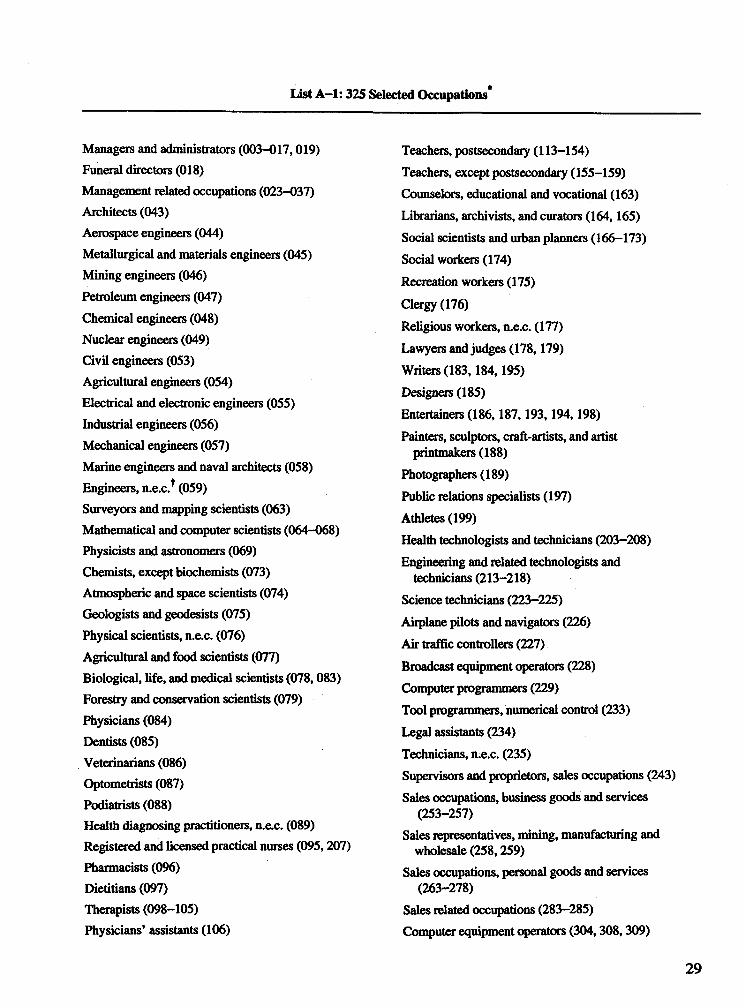
List A -l: 325 Selected Occupations
Managers and administrators (003-017,019) Funeral directors (018)Management related occupations (023-037) Architects (043)Aerospace engineers (044)Metallurgical and materials engineers (045) Mining engineers (046)Petroleum engineers (047)Chemical engineers (048)Nuclear engineers (049)Civil engineers (053)Agricultural engineers (054)Electrical and electronic engineers (055)Industrial engineers (056)Mechanical engineers (057)Marine engineers and naval architects (058) Engineers, n.e.c.* (059)Surveyors and mapping scientists (063) Mathematical and computer scientists (064-068) Physicists and astronomers (069)Chemists, except biochemists (073)Atmospheric and space scientists (074)Geologists and geodesists (075)Physical scientists, n.e.c. (076)Agricultural and food scientists (077)Biological, life, and medical scientists (078,083) Forestry and conservation scientists (079) Physicians (084)Dentists (085)Veterinarians (086)Optometrists (087)Podiatrists (088)Health diagnosing practitioners, n.e.c. (089) Registered and licensed practical nurses (095,207) Pharmacists (096)Dietitians (097)Therapists (098-105)Physicians’ assistants (106)
Teachers, postsecondary (113-154)Teachers, except postsecondary (155-159) Counselors, educational and vocational (163) Librarians, archivists, and curators (164,165)Social scientists and urban planners (166-173) Social workers (174)Recreation workers (175)Clergy (176)Religious workers, n.e.c. (177)Lawyers and judges (178,179)Writers (183,184,195)Designers (185)Entertainers (186,187,193,194,198)Painters, sculptors, craft-artists, and artist
printmakers (188)Photographers (189)Public relations specialists (197)Athletes (199)Health technologists and technicians (203-208)Engineering and related technologists and
technicians (213-218)Science technicians (223-225)Airplane pilots and navigators (226)Air traffic controllers (227)Broadcast equipment operators (228)Computer programmers (229)Tool programmers, numerical control (233)Legal assistants (234)Technicians, n.e.c. (235)Supervisors and proprietors, sales occupations (243)Sales occupations, business goods and services
(253-257)Sales representatives, mining, manufacturing and
wholesale (258,259)Sales occupations, personal goods and services
(263-278)Sales related occupations (283-285)Computer equipment operators (304,308,309)
29
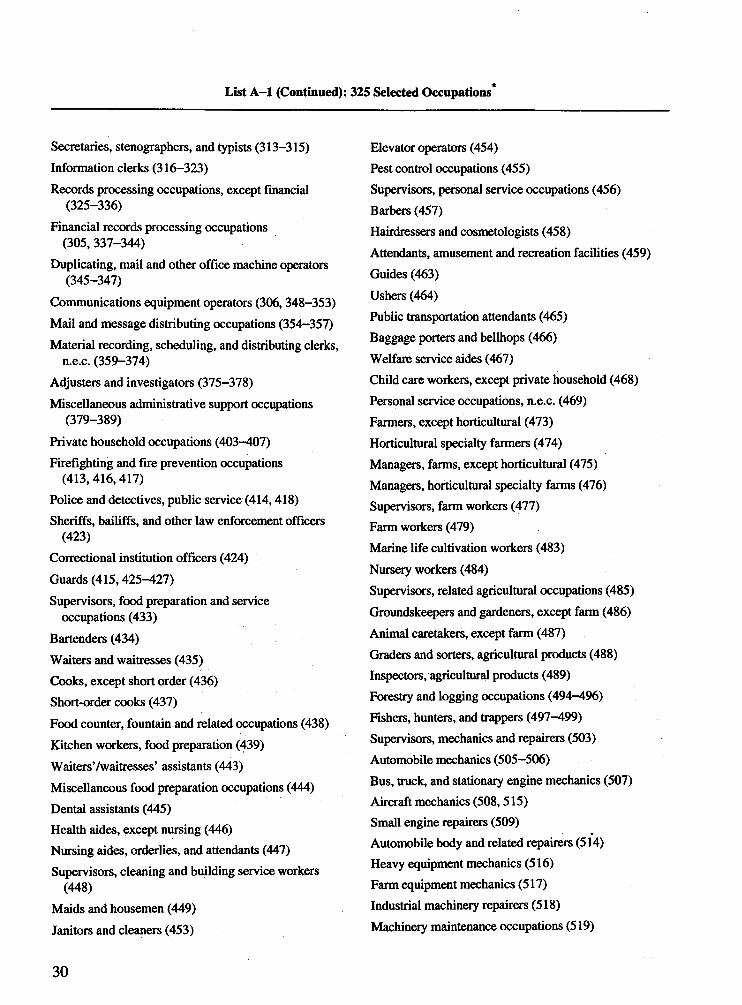
List A -l (Continued): 325 Selected Occupations*
Secretaries, stenographers, and typists (313-315)Information clerks (316-323)Records processing occupations, except financial
(325-336)Financial records processing occupations
(305, 337-344)Duplicating, mail and other office machine operators
(345-347)Communications equipment operators (306, 348-353)Mail and message distributing occupations (354-357)Material recording, scheduling, and distributing clerks,
n.e.c. (359-374)Adjusters and investigators (375-378)Miscellaneous administrative support occupations
(379-389)Private household occupations (403-407)Firefighting and fire prevention occupations
(413,416,417)Police and detectives, public service (414,418)Sheriffs, bailiffs, and other law enforcement officers
(423)Correctional institution officers (424)Guards (415,425-427)Supervisors, food preparation and service
occupations (433)Bartenders (434)Waiters and waitresses (435)Cooks, except short order (436)Short-order cooks (437)Food counter, fountain and related occupations (438)Kitchen workers, food preparation (439)Waiters’/waitresses’ assistants (443)Miscellaneous food preparation occupations (444)Dental assistants (445)Health aides, except nursing (446)Nursing aides, orderlies, and attendants (447)Supervisors, cleaning and building service workers
(448)Maids and housemen (449)Janitors and cleaners (453)
Elevator operators (454)Pest control occupations (455)Supervisors, personal service occupations (456) Barbers (457)Hairdressers and cosmetologists (458)Attendants, amusement and recreation facilities (459) Guides (463)Ushers (464)Public transportation attendants (465)Baggage porters and bellhops (466)Welfare service aides (467)Child care workers, except private household (468) Personal service occupations, n.e.c. (469)Farmers, except horticultural (473)Horticultural specialty farmers (474)Managers, farms, except horticultural (475) Managers, horticultural specialty farms (476) Supervisors, farm workers (477)Farm workers (479)Marine life cultivation workers (483)Nursery workers (484)Supervisors, related agricultural occupations (485) Groundskeepers and gardeners, except farm (486) Animal caretakers, except farm (487)Graders and sorters, agricultural products (488) Inspectors, agricultural products (489)Forestry and logging occupations (494-496)Fishers, hunters, and trappers (497-499)Supervisors, mechanics and repairers (503) Automobile mechanics (505-506)Bus, truck, and stationary engine mechanics (507) Aircraft mechanics (508,515)Small engine repairers (509)Automobile body and related repairers (514)Heavy equipment mechanics (516)Farm equipment mechanics (517)Industrial machinery repairers (518)Machinery maintenance occupations (519)
30
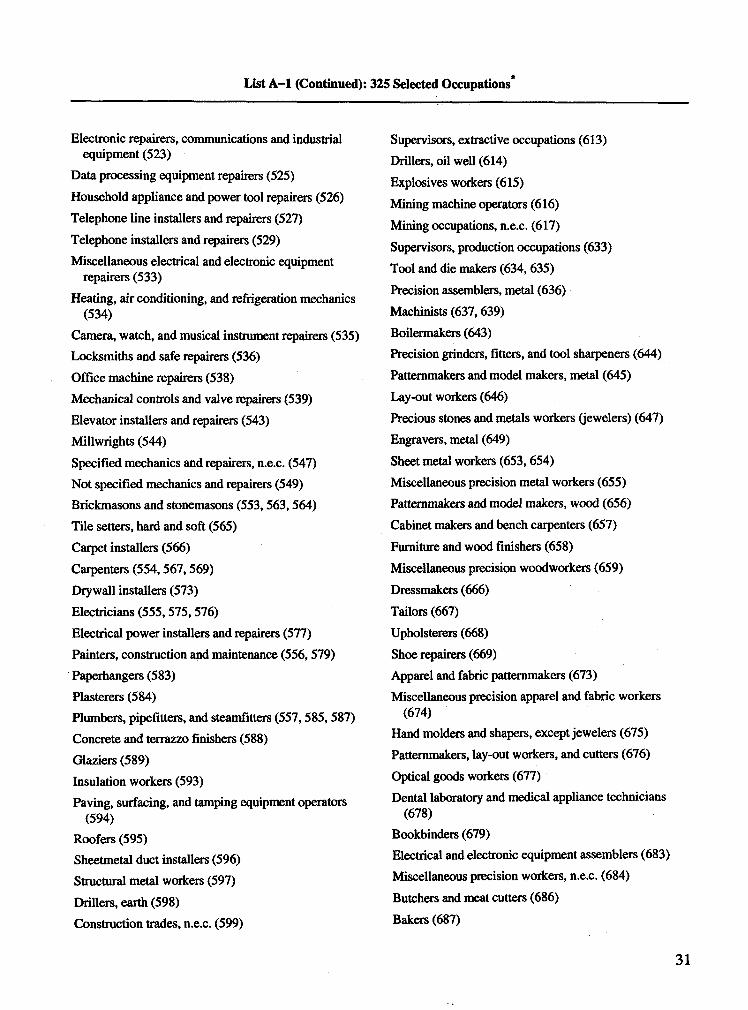
List A -l (Continued): 325 Selected Occupations*
Electronic repairers, communications and industrial equipment (523)
Data processing equipment repairers (525)Household appliance and power tool repairers (526)Telephone line installers and repairers (527)Telephone installers and repairers (529)Miscellaneous electrical and electronic equipment
repairers (533)Heating, air conditioning, and réfrigération mechanics
(534)Camera, watch, and musical instrument repairers (535) Locksmiths and safe repairers (536)Office machine repairers (538)Mechanical controls and valve repairers (539)Elevator installers and repairers (543)Millwrights (544)Specified mechanics and repairers, n.e.c. (547)Not specified mechanics and repairers (549) Brickmasons and stonemasons (553,563,564)Tile setters, hard and soft (565)Carpet installers (566)Carpenters (554,567,569)Drywall installers (573)Electricians (555,575,576)Electrical power installers and repairers (577)Painters, construction and maintenance (556,579) Paperhangers (583)Plasterers (584)Plumbers, pipefitters, and steamfitters (557,585,587) Concrete and terrazzo finishers (588)Glaziers (589)Insulation workers (593)Paving, surfacing, and tamping equipment operators
(594)Roofers (595)Sheetmetal duct installers (596)Structural metal workers (597)Drillers, earth (598)Construction trades, n.e.c. (599)
Supervisors, extractive occupations (613)Drillers, oil well (614)Explosives workers (615)Mining machine operators (616)Mining occupations, n.e.c. (617)Supervisors, production occupations (633)Tool and die makers (634, 635)Precision assemblers, metal (636)Machinists (637,639)Boilermakers (643)Precision grinders, fitters, and tool sharpeners (644) Patternmakers and model makers, metal (645) Lay-out workers (646)Precious stones and metals workers (jewelers) (647)Engravers, metal (649)Sheet metal workers (653,654)Miscellaneous precision metal workers (655)Patternmakers and model makers, wood (656)Cabinet makers and bench carpenters (657)Furniture and wood finishers (658)Miscellaneous precision woodworkers (659)Dressmakers (666)Tailors (667)Upholsterers (668)Shoe repairers (669)Apparel and fabric patternmakers (673)Miscellaneous precision apparel and fabric workers
(674)Hand molders and shapers, except jewelers (675)Patternmakers, lay-out workers, and cutters (676)Optical goods workers (677)Dental laboratory and medical appliance technicians
(678)Bookbinders (679)Electrical and electronic equipment assemblers (683) Miscellaneous precision workers, n.e.c. (684) Butchers and meat cutters (686)Bakers (687)
31
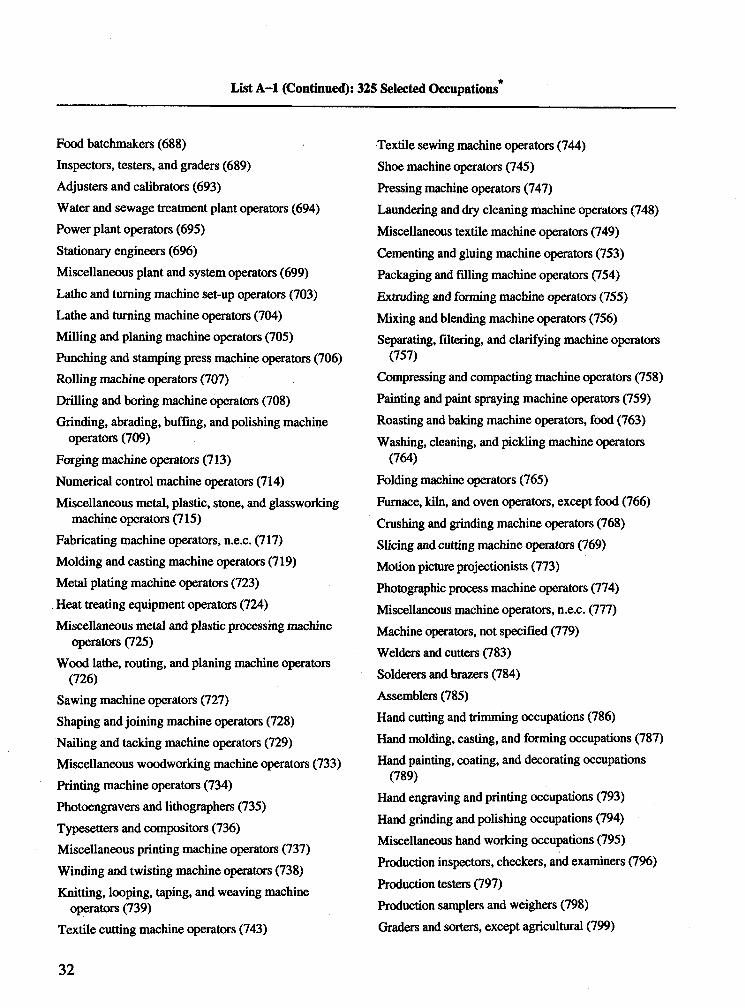
List A -l (Continued): 325 Selected Occupations*
Food batchmakers (688)Inspectors, testers, and graders (689)Adjusters and calibrators (693)Water and sewage treatment plant operators (694)Power plant operators (695)Stationary engineers (696)Miscellaneous plant and system operators (699)Lathe and turning machine set-up operators (703)Lathe and turning machine operators (704)Milling and planing machine operators (705)Punching and stamping press machine operators (706)Rolling machine operators (707)Drilling and boring machine operators (708)Grinding, abrading, buffing, and polishing machine
operators (709)Forging machine operators (713)Numerical control machine operators (714)Miscellaneous metal, plastic, stone, and glassworking
machine operators (715)Fabricating machine operators, n.e.c. (717)Molding and casting machine operators (719)Metal plating machine operators (723)Heat treating equipment operators (724)Miscellaneous metal and plastic processing machine
operators (725)Wood lathe, routing, and planing machine operators
(726)Sawing machine operators (727)Shaping and joining machine operators (728)Nailing and tacking machine operators (729)Miscellaneous woodworking machine operators (733)Printing machine operators (734)Photoengravers and lithographers (735)Typesetters and compositors (736)Miscellaneous printing machine operators (737)Winding and twisting machine operators (738)Knitting, looping, taping, and weaving machine
operators (739)Textile cutting machine operators (743)
Textile sewing machine operators (744)Shoe machine operators (745)Pressing machine operators (747)Laundering and dry cleaning machine operators (748)Miscellaneous textile machine operators (749)Cementing and gluing machine operators (753)Packaging and filling machine operators (754)Extruding and forming machine operators (755)Mixing and blending machine operators (756)Separating, filtering, and clarifying machine operators
(757)Compressing and compacting machine operators (758)Painting and paint spraying machine operators (759)Roasting and baking machine operators, food (763)Washing, cleaning, and pickling machine operators
(764)Folding machine operators (765)Furnace, kiln, and oven operators, except food (766) Crushing and grinding machine operators (768)Slicing and cutting machine operators (769)Motion picture projectionists (773)Photographic process machine operators (774) Miscellaneous machine operators, n.e.c. (777)Machine operators, not specified (779)Welders and cutters (783)Solderers and brazers (784)Assemblers (785)Hand cutting and trimming occupations (786)Hand molding, casting, and forming occupations (787)Hand painting, coating, and decorating occupations
(789)Hand engraving and printing occupations (793)Hand grinding and polishing occupations (794) Miscellaneous hand working occupations (795) Production inspectors, checkers, and examiners (796) Production testers (797)Production samplers and weighers (798)Graders and sorters, except agricultural (799)
32
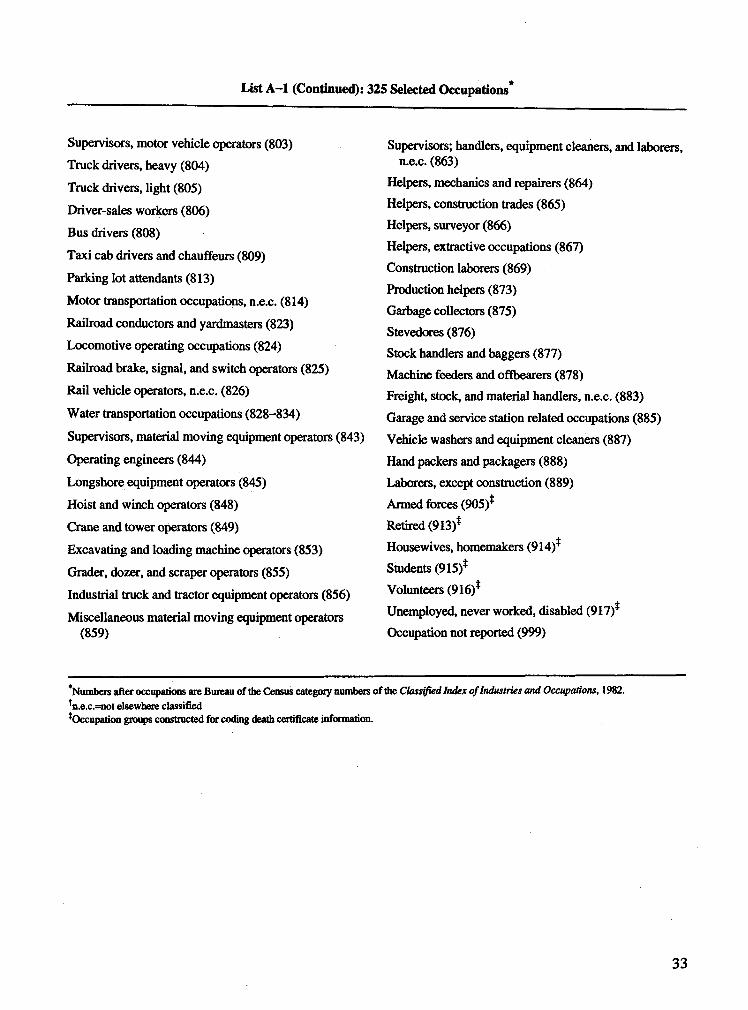
List A—1 (Continued): 325 Selected Occupations*
Supervisors, motor vehicle operators (803)Truck drivers, heavy (804)Truck drivers, light (805)Driver-sales workers (806)Bus drivers (808)
Taxi cab drivers and chauffeurs (809)Parking lot attendants (813)
Motor transportation occupations, n.e.c. (814)Railroad conductors and yardmasters (823)Locomotive operating occupations (824)Railroad brake, signal, and switch operators (825)Rail vehicle operators, n.e.c. (826)
Water transportation occupations (828-834)
Supervisors, material moving equipment operators (843)Operating engineers (844)
Longshore equipment operators (845)Hoist and winch operators (848)Crane and tower operators (849)Excavating and loading machine operators (853)Grader, dozer, and scraper operators (855)Industrial truck and tractor equipment operators (856)Miscellaneous material moving equipment operators
(859)
Supervisors; handlers, equipment cleaners, and laborers, n.e.c. (863)
Helpers, mechanics and repairers (864)Helpers, construction trades (865)Helpers, surveyor (866)Helpers, extractive occupations (867)Construction laborers (869)Production helpers (873)Garbage collectors (875)Stevedores (876)Stock handlers and baggers (877)Machine feeders and offbearers (878)Freight, stock, and material handlers, n.e.c. (883)Garage and service station related occupations (885)Vehicle washers and equipment cleaners (887)Hand packers and packagers (888)Laborers, except construction (889)Armed forces (905)*Retired (913)*Housewives, homemakers (914)*Students (915)*Volunteers (916)*Unemployed, never worked, disabled (917)*Occupation not reported (999)
*Numbers after occupations are Bureau of the Census category numbers of the Classified Index of Industries and Occupations, 1982.*n.e.c.=not elsewhere classifiedtOccupation groups constructed for coding death certificate information.
33
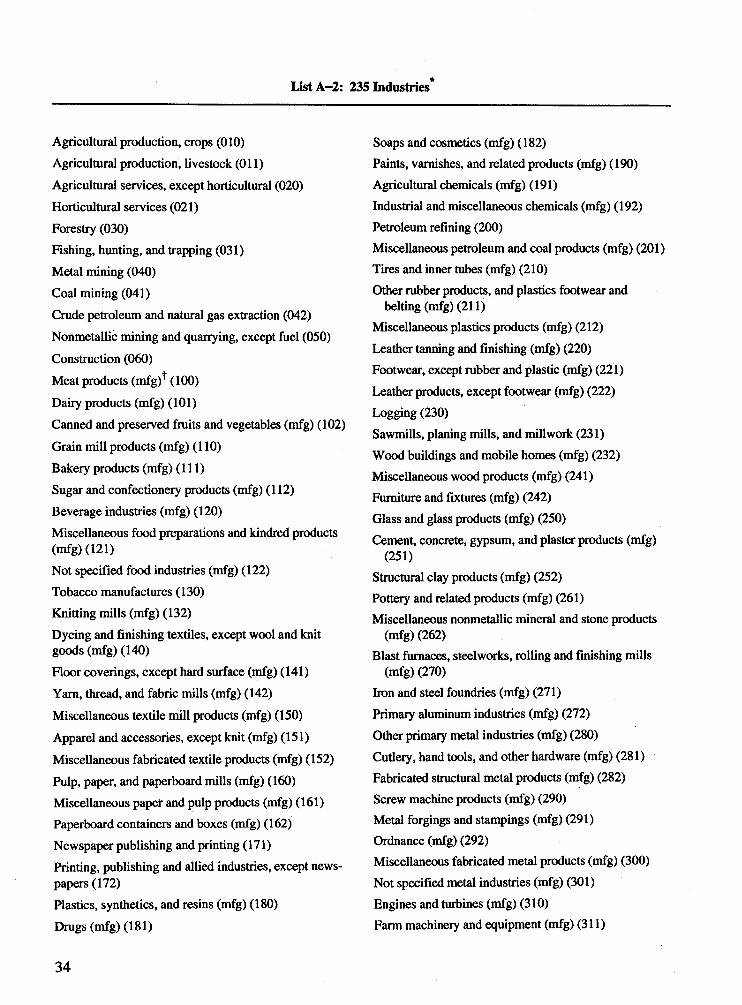
ListA-2: 235 Industries*
Agricultural production, crops (010)Agricultural production, livestock (Oil)Agricultural services, except horticultural (020) Horticultural services (021)Forestry (030)Fishing, hunting, and trapping (031)Metal mining (040)Coal mining (041)Crude petroleum and natural gas extraction (042) Nonmetallic mining and quarrying, except fuel (050) Construction (060)Meat products (mfg)^ (100)Daily products (mfg) (101)Canned and preserved fruits and vegetables (mfg) (102)Grain mill products (mfg) (110)Bakery products (mfg) (111)Sugar and confectionery products (mfg) (112)Beverage industries (mfg) (120)Miscellaneous food preparations and kindred products (mfg) (121)Not specified food industries (mfg) (122)Tobacco manufactures (130)Knitting mills (mfg) (132)Dyeing and finishing textiles, except wool and knit goods (mfg) (140)Floor coverings, except hard surface (mfg) (141)Yam, thread, and fabric mills (mfg) (142)Miscellaneous textile mill products (mfg) (150)Apparel and accessories, except knit (mfg) (151)Miscellaneous fabricated textile products (mfg) (152)Pulp, paper, and paperboard mills (mfg) (160)Miscellaneous paper and pulp products (mfg) (161)Paperboard containers and boxes (mfg) (162)Newspaper publishing and printing (171)Printing, publishing and allied industries, except newspapers (172)Plastics, synthetics, and resins (mfg) (180)Drugs (mfg) (181)
Soaps and cosmetics (mfg) (182)Paints, varnishes, and related products (mfg) (190) Agricultural chemicals (mfg) (191)Industrial and miscellaneous chemicals (mfg) (192) Petroleum refining (200)Miscellaneous petroleum and coal products (mfg) (201)Tires and inner tubes (mfg) (210)Other rubber products, and plastics footwear and
belting (mfg) (211)Miscellaneous plastics products (mfg) (212)Leather tanning and finishing (mfg) (220)Footwear, except rubber and plastic (mfg) (221)Leather products, except footwear (mfg) (222)Logging (230)Sawmills, planing mills, and millwork (231)Wood buildings and mobile homes (mfg) (232)Miscellaneous wood products (mfg) (241)Furniture and fixtures (mfg) (242)Glass and glass products (mfg) (250)Cement, concrete, gypsum, and plaster products (mfg)
(251)Structural clay products (mfg) (252)Pottery and related products (mfg) (261)Miscellaneous nonmetallic mineral and stone products
(mfg) (262)Blast furnaces, steelworks, rolling and finishing mills
(mfg) (270)Iron and steel foundries (mfg) (271)Primary aluminum industries (mfg) (272)Other primary metal industries (mfg) (280)Cutlery, hand tools, and other hardware (mfg) (281)Fabricated structural metal products (mfg) (282)Screw machine products (mfg) (290)Metal forgings and stampings (mfg) (291)Ordnance (mfg) (292)Miscellaneous fabricated metal products (mfg) (300) Not specified metal industries (mfg) (301)Engines and turbines (mfg) (310)Farm machinery and equipment (mfg) (311)
34
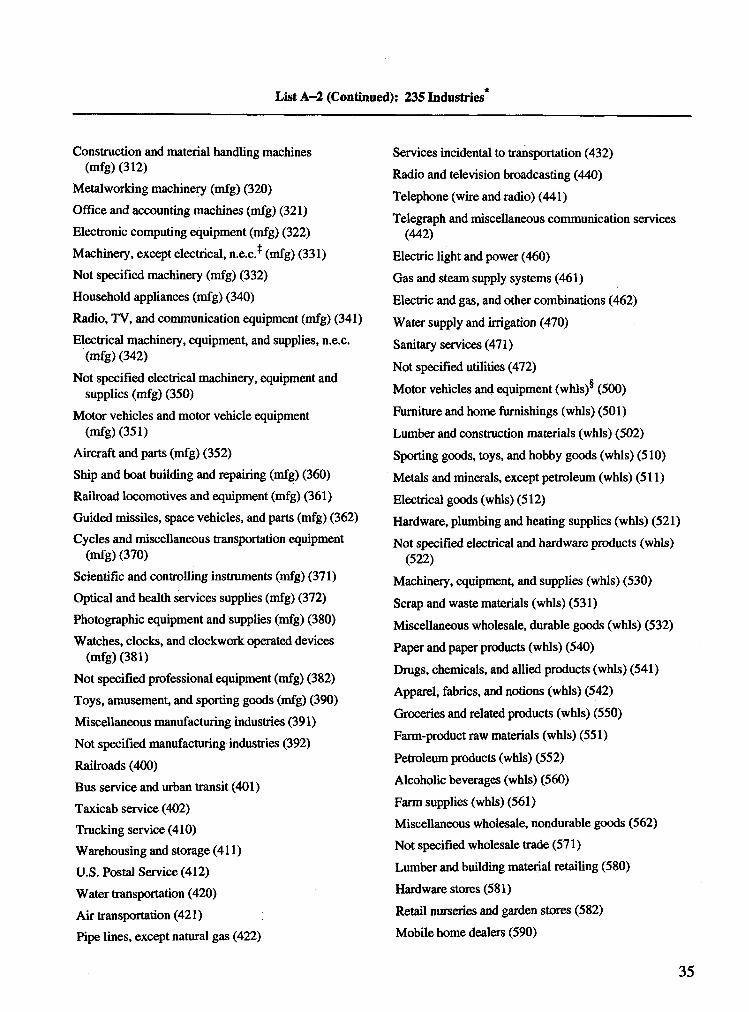
List A-2 (Continued): 235 Industries*
Construction and material handling machines (mfg) (312)
Metalworking machinery (mfg) (320)Office and accounting machines (mfg) (321)Electronic computing equipment (mfg) (322)Machinery, except electrical, n.e.c.* (mfg) (331)Not specified machinery (mfg) (332)Household appliances (mfg) (340)Radio, TV, and communication equipment (mfg) (341)Electrical machinery, equipment, and supplies, n.e.c.
(mfg) (342)Not specified electrical machinery, equipment and
supplies (mfg) (350)Motor vehicles and motor vehicle equipment
(mfg) (351)Aircraft and parts (mfg) (352)Ship and boat building and repairing (mfg) (360)Railroad locomotives and equipment (mfg) (361)Guided missiles, space vehicles, and parts (mfg) (362)Cycles and miscellaneous transportation equipment
(mfg) (370)Scientific and controlling instruments (mfg) (371)Optical and health services supplies (mfg) (372)Photographic equipment and supplies (mfg) (380)Watches, clocks, and clockwork operated devices
(mfg) (381)Not specified professional equipment (mfg) (382) Toys, amusement, and sporting goods (mfg) (390) Miscellaneous manufacturing industries (391)Not specified manufacturing industries (392)Railroads (400)Bus service and urban transit (401)Taxicab service (402)Trucking service (410)Warehousing and storage (411)U.S. Postal Service (412)Water transportation (420)Air transportation (421)Pipe lines, except natural gas (422)
Services incidental to transportation (432)Radio and television broadcasting (440)Telephone (wire and radio) (441)Telegraph and miscellaneous communication services
(442)Electric light and power (460)Gas and steam supply systems (461)Electric and gas, and other combinations (462)Water supply and irrigation (470)Sanitary services (471)Not specified utilities (472)Motor vehicles and equipment (whls)®* (500)Furniture and home furnishings (whls) (501)Lumber and construction materials (whls) (502) Sporting goods, toys, and hobby goods (whls) (510) Metals and minerals, except petroleum (whls) (511) Electrical goods (whls) (512)Hardware, plumbing and heating supplies (whls) (521)Not specified electrical and hardware products (whls)
(522)Machinery, equipment, and supplies (whls) (530) Scrap and waste materials (whls) (531)Miscellaneous wholesale, durable goods (whls) (532) Paper and paper products (whls) (540)Drugs, chemicals, and allied products (whls) (541) Apparel, fabrics, and notions (whls) (542)Groceries and related products (whls) (550) Farm-product raw materials (whls) (551)Petroleum products (whls) (552)Alcoholic beverages (whls) (560)Farm supplies (whls) (561)Miscellaneous wholesale, nondurable goods (562)Not specified wholesale trade (571)Lumber and building material retailing (580) Hardware stores (581)Retail nurseries and garden stores (582)Mobile home dealers (590)
35
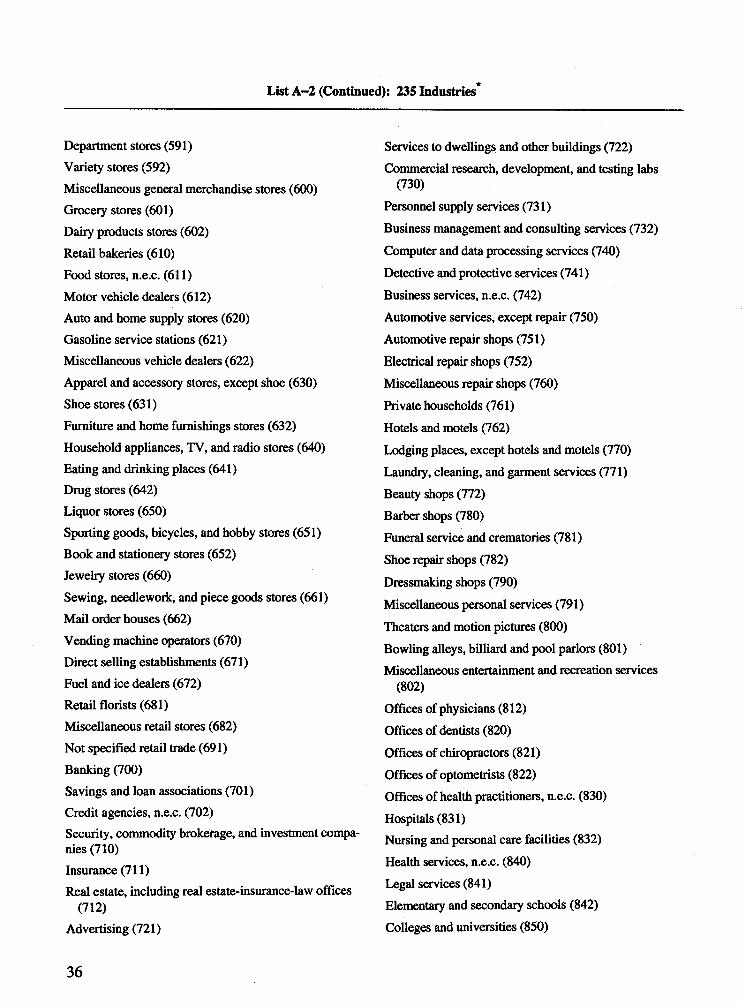
List A-2 (Continued): 235 Industries*
Department stores (591)Variety stores (592)Miscellaneous general merchandise stores (600) Grocery stores (601)Dairy products stores (602)Retail bakeries (610)Food stores, n.e.c. (611)Motor vehicle dealers (612)Auto and home supply stores (620)Gasoline service stations (621)Miscellaneous vehicle dealers (622)Apparel and accessory stores, except shoe (630)Shoe stores (631)Furniture and home furnishings stores (632)Household appliances, TV, and radio stores (640)Eating and drinking places (641)Drug stores (642)Liquor stores (650)Sporting goods, bicycles, and hobby stores (651)Book and stationery stores (652)Jewelry stores (660)Sewing, needlework, and piece goods stores (661)Mail order houses (662)Vending machine operators (670)Direct selling establishments (671)Fuel and ice dealers (672)Retail florists (681)Miscellaneous retail stores (682)Not specified retail trade (691)Banking (700)Savings and loan associations (701)Credit agencies, n.e.c. (702)Security, commodity brokerage, and investment companies (710)Insurance (711)Real estate, including real estate-insurance-law offices
(712)Advertising (721)
Services to dwellings and other buildings (722)Commercial research, development, and testing labs
(730)Personnel supply services (731)Business management and consulting services (732)Computer and data processing services (740)Detective and protective services (741)Business services, n.e.c. (742)Automotive services, except repair (750)Automotive repair shops (751)Electrical repair shops (752)Miscellaneous repair shops (760)Private households (761)Hotels and motels (762)Lodging places, except hotels and motels (770)Laundry, cleaning, and garment services (771)Beauty shops (772)Barber shops (780)Funeral service and crematories (781)Shoe repair shops (782)Dressmaking shops (790)Miscellaneous personal services (791)Theaters and motion pictures (800)Bowling alleys, billiard and pool parlors (801)Miscellaneous entertainment and recreation services
(802)Offices of physicians (812)Offices of dentists (820)Offices of chiropractors (821)Offices of optometrists (822)Offices of health practitioners, n.e.c. (830)Hospitals (831)Nursing and personal care facilities (832)Health services, n.e.c. (840)Legal services (841)Elementary and secondary schools (842)Colleges and universities (850)
36
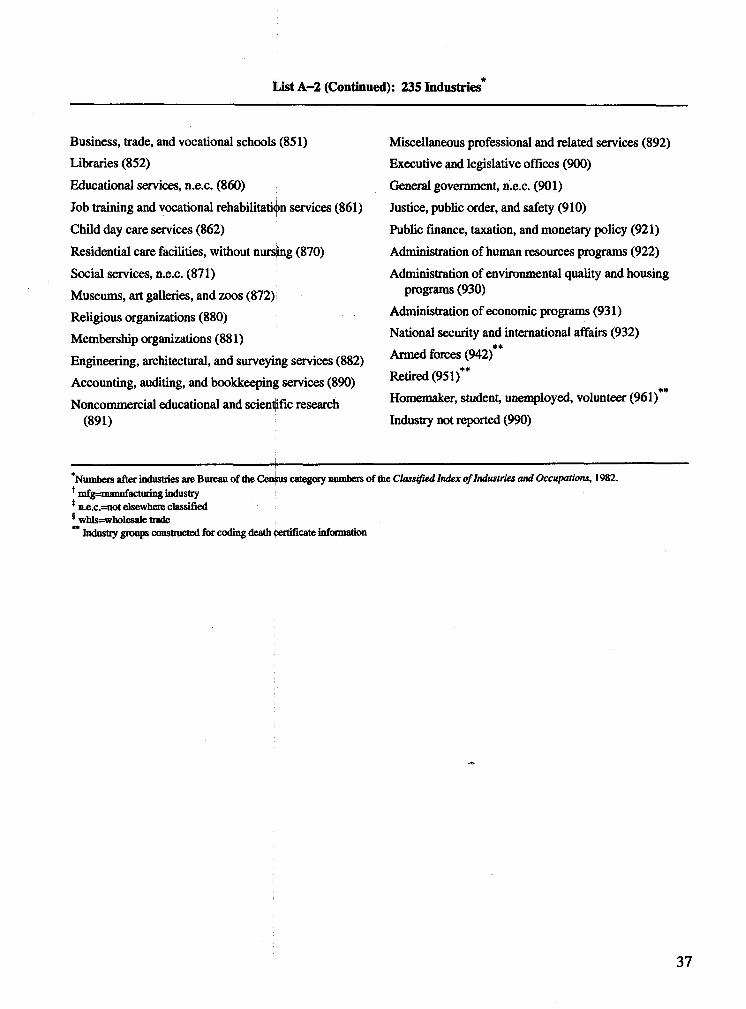
List A-2 (Continued): 235 Industries*
Business, trade, and vocational schools (851)Libraries (852)Educational services, n.e.c. (860)Job training and vocational rehabilitation services (861)Child day care services (862)Residential care facilities, without nursing (870)Social services, n.e.c. (871)Museums, art galleries, and zoos (872)Religious organizations (880)Membership organizations (881)Engineering, architectural, and surveying services (882)Accounting, auditing, and bookkeeping services (890)Noncommercial educational and scientific research
(891)
Miscellaneous professional and related services (892)Executive and legislative offices (900)General government, n.e.c. (901)Justice, public order, and safety (910)Public finance, taxation, and monetary policy (921)Administration of human resources programs (922)Administration of environmental quality and housing
programs (930)Administration of economic programs (931)National security and international affairs (932)
**Armed forces (942)Retired (951)**
#♦Homemaker, student, unemployed, volunteer (961) Industry not reported (990)
Numbers after industries are Bureau of the Census category numbers of the Classified Index of Industries and Occupations, 1982. mfg=manufacturing industry n.e.c.=not elsewhere classified whls=wholesale tradeIndustry groups constructed for coding death certificate information
37
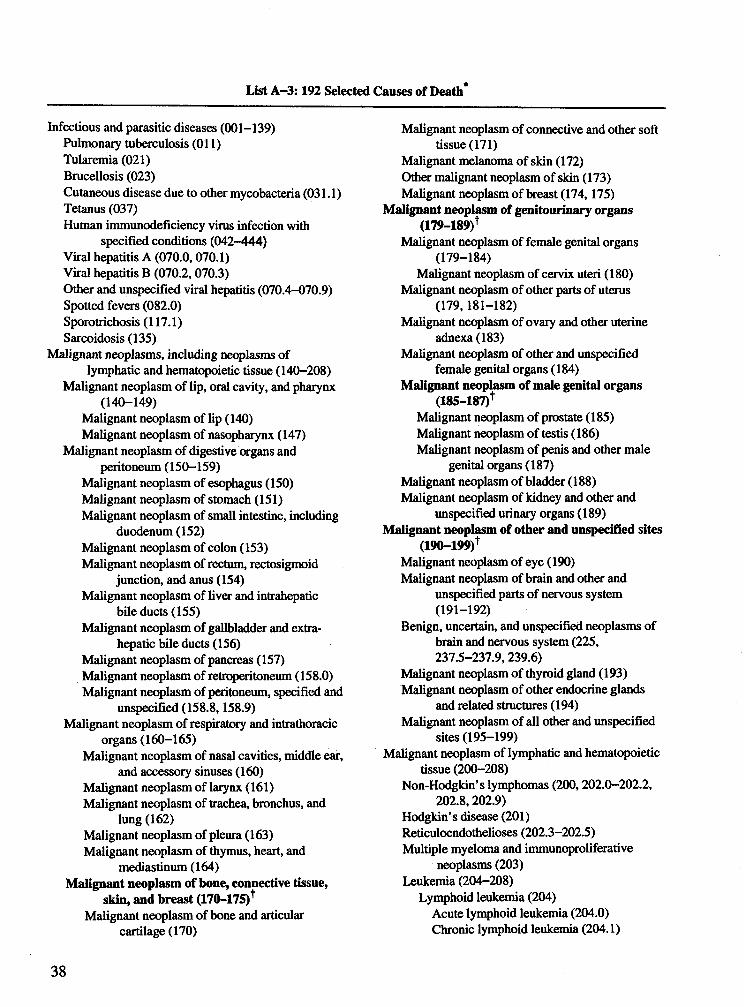
List A -3 :192 Selected Causes of Death*
Infectious and parasitic diseases (001-139)Pulmonary tuberculosis (Oil)Tularemia (021)Brucellosis (023)Cutaneous disease due to other mycobacteria (031.1) Tetanus (037)Human immunodeficiency virus infection with
specified conditions (042-444)Viral hepatitis A (070.0,070.1)Viral hepatitis B (070.2,070.3)Other and unspecified viral hepatitis (070.4-070.9) Spotted fevers (082.0)Sporotrichosis (117.1)Sarcoidosis (135)
Malignant neoplasms, including neoplasms oflymphatic and hematopoietic tissue (140-208)
Malignant neoplasm of lip, oral cavity, and pharynx (140-149)
Malignant neoplasm of lip (140)Malignant neoplasm of nasopharynx (147)
Malignant neoplasm of digestive organs and peritoneum (150-159)
Malignant neoplasm of esophagus (150) Malignant neoplasm of stomach (151)Malignant neoplasm of small intestine, including
duodenum(152)Malignant neoplasm of colon (153)Malignant neoplasm of rectum, rectosigmoid
junction, and anus (154)Malignant neoplasm of liver and intrahepatic
bile ducts (155)Malignant neoplasm of gallbladder and extra-
hepatic bile ducts (156)Malignant neoplasm of pancreas (157)Malignant neoplasm of retroperitoneum (158.0) Malignant neoplasm of peritoneum, specified and
unspecified (158.8,158.9)Malignant neoplasm of respiratory and intrathoracic
organs (160-165)Malignant neoplasm of nasal cavities, middle ear,
and accessory sinuses (160)Malignant neoplasm of larynx (161)Malignant neoplasm of trachea, bronchus, and
lung (162)Malignant neoplasm of pleura (163)Malignant neoplasm of thymus, heart, and
mediastinum (164)Malignant neoplasm of bone, connective tissue,
skin, and breast (170-175)^Malignant neoplasm of bone and articular
cartilage (170)
Malignant neoplasm of connective and other soft tissue (171)
Malignant melanoma of skin (172)Other malignant neoplasm of skin (173) Malignant neoplasm of breast (174,175)
Malignant neoplasm of genitourinary organs (179-189)+
Malignant neoplasm of female genital organs (179-184)
Malignant neoplasm of cervix uteri (180) Malignant neoplasm of other parts of uterus
(179,181-182)Malignant neoplasm of ovary and other uterine
adnexa(183)Malignant neoplasm of other and unspecified
female genital organs (184)Malignant neoplasm of male genital organs
(185-187)+Malignant neoplasm of prostate (185) Malignant neoplasm of testis (186)Malignant neoplasm of penis and other male
genital organs (187)Malignant neoplasm of bladder (188)Malignant neoplasm of kidney and other and
unspecified urinary organs (189) Malignant neoplasm of other and unspecified sites
(190-199)*Malignant neoplasm of eye (190)Malignant neoplasm of brain and other and
unspecified parts of nervous system (191-192)
Benign, uncertain, and unspecified neoplasms of brain and nervous system (225, 237.5-237.9,239.6)
Malignant neoplasm of thyroid gland (193) Malignant neoplasm of other endocrine glands
and related structures (194)Malignant neoplasm of all other and unspecified
sites (195-199)Malignant neoplasm of lymphatic and hematopoietic
tissue (200-208)Non-Hodgkin’s lymphomas (200,202.0-202.2,
202.8,202.9)Hodgkin’s disease (201)Reticuloendothelioses (202.3-202.5)Multiple myeloma and immunoproliferative
neoplasms (203)Leukemia (204-208)
Lymphoid leukemia (204)Acute lymphoid leukemia (204.0)Chronic lymphoid leukemia (204.1)
38
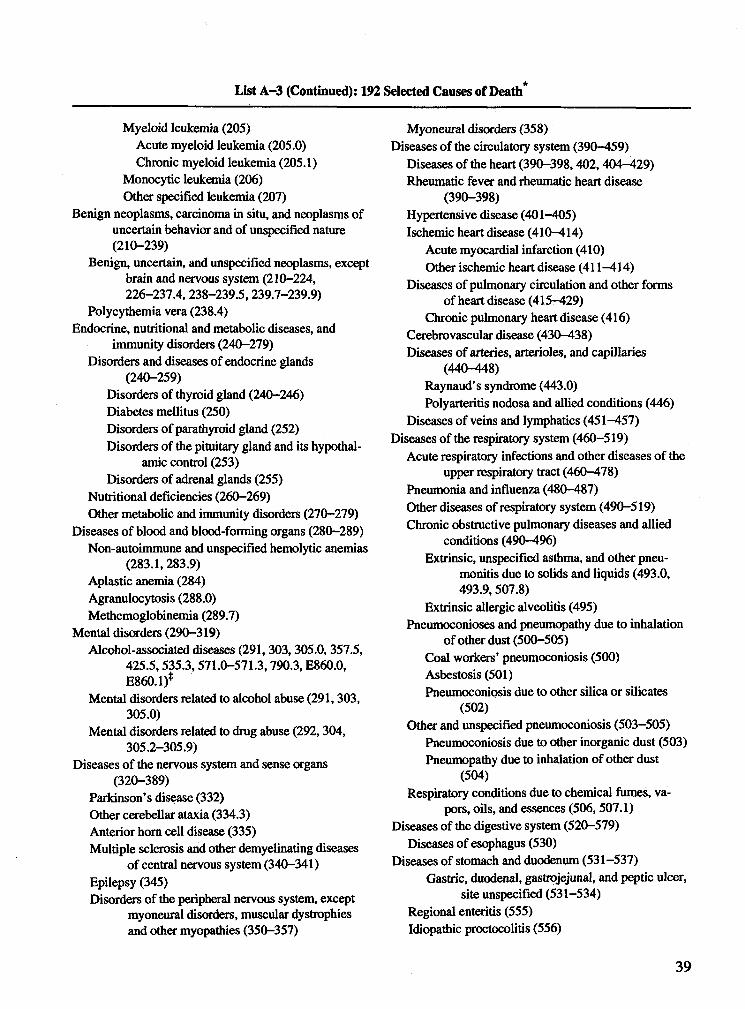
List A-3 (Continued): 192 Selected Causes of Death*
Myeloid leukemia (205)Acute myeloid leukemia (205.0)Chronic myeloid leukemia (205.1)
Monocytic leukemia (206)Other specified leukemia (207)
Benign neoplasms, carcinoma in situ, and neoplasms of uncertain behavior and of unspecified nature (210-239)
Benign, uncertain, and unspecified neoplasms, except brain and nervous system (210-224, 226-237.4, 238-239.5,239.7-239.9)
Polycythemia vera (238.4)Endocrine, nutritional and metabolic diseases, and
immunity disorders (240-279)Disorders and diseases of endocrine glands
(240-259)Disorders of thyroid gland (240-246)Diabetes mellitus (250)Disorders of parathyroid gland (252)Disorders of the pituitary gland and its hypothal
amic control (253)Disorders of adrenal glands (255)
Nutritional deficiencies (260-269)Other metabolic and immunity disorders (270-279)
Diseases of blood and blood-forming organs (280-289) Non-autoimmune and unspecified hemolytic anemias
(283.1,283.9)Aplastic anemia (284)Agranulocytosis (288.0)Methemoglobinemia (289.7)
Mental disorders (290-319)Alcohol-associated diseases (291,303,305.0, 357.5,
425.5,535.3,571.0-571.3,790.3, E860.0, E860.1)*
Mental disorders related to alcohol abuse (291,303, 305.0)
Mental disorders related to drug abuse (292, 304, 305.2-305.9)
Diseases of the nervous system and sense organs (320-389)
Parkinson’s disease (332)Other cerebellar ataxia (334.3)Anterior horn cell disease (335)Multiple sclerosis and other demyelinating diseases
of central nervous system (340-341)Epilepsy (345)Disorders of the peripheral nervous system, except
myoneural disorders, muscular dystrophies and other myopathies (350-357)
Myoneural disorders (358)Diseases of the circulatory system (390-459)
Diseases of the heart (390-398,402,404-429) Rheumatic fever and rheumatic heart disease
(390-398)Hypertensive disease (401-405)Ischemic heart disease (410-414)
Acute myocardial infarction (410)Other ischemic heart disease (411-414)
Diseases of pulmonary circulation and other forms of heart disease (415-429)
Chronic pulmonary heart disease (416) Cerebrovascular disease (430-438)Diseases of arteries, arterioles, and capillaries
(440-448)Raynaud’s syndrome (443.0)Polyarteritis nodosa and allied conditions (446)
Diseases of veins and lymphatics (451-457)Diseases of the respiratory system (460-519)
Acute respiratory infections and other diseases of the upper respiratory tract (460-478)
Pneumonia and influenza (480-487)Other diseases of respiratory system (490-519) Chronic obstructive pulmonary diseases and allied
conditions (490—496)Extrinsic, unspecified asthma, and other pneu
monitis due to solids and liquids (493.0, 493.9,507.8)
Extrinsic allergic alveolitis (495)Pneumoconioses and pneumopathy due to inhalation
of other dust (500-505)Coal workers’ pneumoconiosis (500)Asbestosis (501)Pneumoconiosis due to other silica or silicates
(502)Other and unspecified pneumoconiosis (503-505)
Pneumoconiosis due to other inorganic dust (503) Pneumopathy due to inhalation of other dust
(504)Respiratory conditions due to chemical fumes, va
pors, oils, and essences (506, 507.1)Diseases of the digestive system (520-579)
Diseases of esophagus (530)Diseases of stomach and duodenum (531-537)
Gastric, duodenal, gastrojejunal, and peptic ulcer, site unspecified (531-534)
Regional enteritis (555)Idiopathic proctocolitis (556)
39
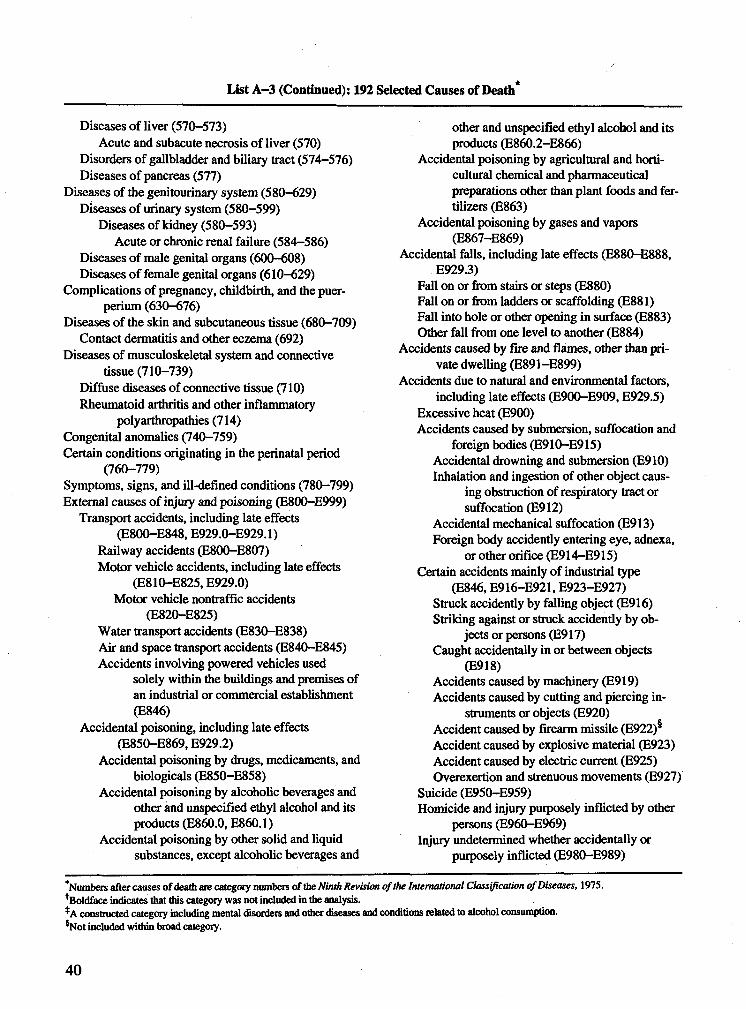
List A-3 (Continued): 192 Selected Causes of Death*
Diseases of liver (570-573)Acute and subacute necrosis of liver (570)
Disorders of gallbladder and biliary tract (574-576) Diseases of pancreas (577)
Diseases of the genitourinary system (580-629) Diseases of urinary system (580-599)
Diseases of kidney (580-593)Acute or chronic renal failure (584-586)
Diseases of male genital organs (600-608)Diseases of female genital organs (610-629)
Complications of pregnancy, childbirth, and the puer- perium (630-676)
Diseases of the skin and subcutaneous tissue (680-709) Contact dermatitis and other eczema (692)
Diseases of musculoskeletal system and connective tissue (710-739)
Diffuse diseases of connective tissue (710) Rheumatoid arthritis and other inflammatory
polyarthropathies (714)Congenital anomalies (740-759)Certain conditions originating in the perinatal period
(760-779)Symptoms, signs, and ill-defined conditions (780-799) External causes of injury and poisoning (E800-E999)
Transport accidents, including late effects (E800-E848, E929.0-E929.1)
Railway accidents (E800-E807)Motor vehicle accidents, including late effects
(E810-E825, E929.0)Motor vehicle nontraffic accidents
(E820-E825)Water transport accidents (E830-E838)Air and space transport accidents (E840-E845) Accidents involving powered vehicles used
solely within the buildings and premises of an industrial or commercial establishment (E846)
Accidental poisoning, including late effects (E850-E869, E929.2)
Accidental poisoning by drugs, medicaments, and biologicals (E850-E858)
Accidental poisoning by alcoholic beverages and other and unspecified ethyl alcohol and its products (E860.0, E860.1)
Accidental poisoning by other solid and liquidsubstances, except alcoholic beverages and
other and unspecified ethyl alcohol and its products (E860.2-E866)
Accidental poisoning by agricultural and horticultural chemical and pharmaceutical preparations other than plant foods and fertilizers (E863)
Accidental poisoning by gases and vapors (E867-E869)
Accidental falls, including late effects (E880-E888, E929.3)
Fall on or from stairs or steps (E880)Fall on or from ladders or scaffolding (E881)Fall into hole or other opening in surface (E883) Other fall from one level to another (E884)
Accidents caused by fire and flames, other than private dwelling (E891-E899)
Accidents due to natural and environmental factors, including late effects (E900-E909, E929.5)
Excessive heat (E900)Accidents caused by submersion, suffocation and
foreign bodies (E910-E915)Accidental drowning and submersion (E910) Inhalation and ingestion of other object caus
ing obstruction of respiratory tract or suffocation (E912)
Accidental mechanical suffocation (E913) Foreign body accidently entering eye, adnexa,
or other orifice (E914-E915)Certain accidents mainly of industrial type
(E846, E916-E921, E923-E927)Struck accidently by falling object (E916) Striking against or struck accidently by ob
jects or persons (E917)Caught accidentally in or between objects
(E918)Accidents caused by machinery (E919) Accidents caused by cutting and piercing in
struments or objects (E920)Accident caused by firearm missile (E922) Accident caused by explosive material (E923) Accident caused by electric current (E925) Overexertion and strenuous movements (E927)
Suicide (E950-E959)Homicide and injury purposely inflicted by other
persons (E960—E969)Injury undetermined whether accidentally or
purposely inflicted (E980-E989)
'Numbers after causes of death are category numbers of the Ninth Revision of the International Classification of Diseases, 1975. ^Boldface indicates that this category was not included in the analysis.*A constructed category including mental disorders and other diseases and conditions related to alcohol consumption. sNot included within broad category.
40
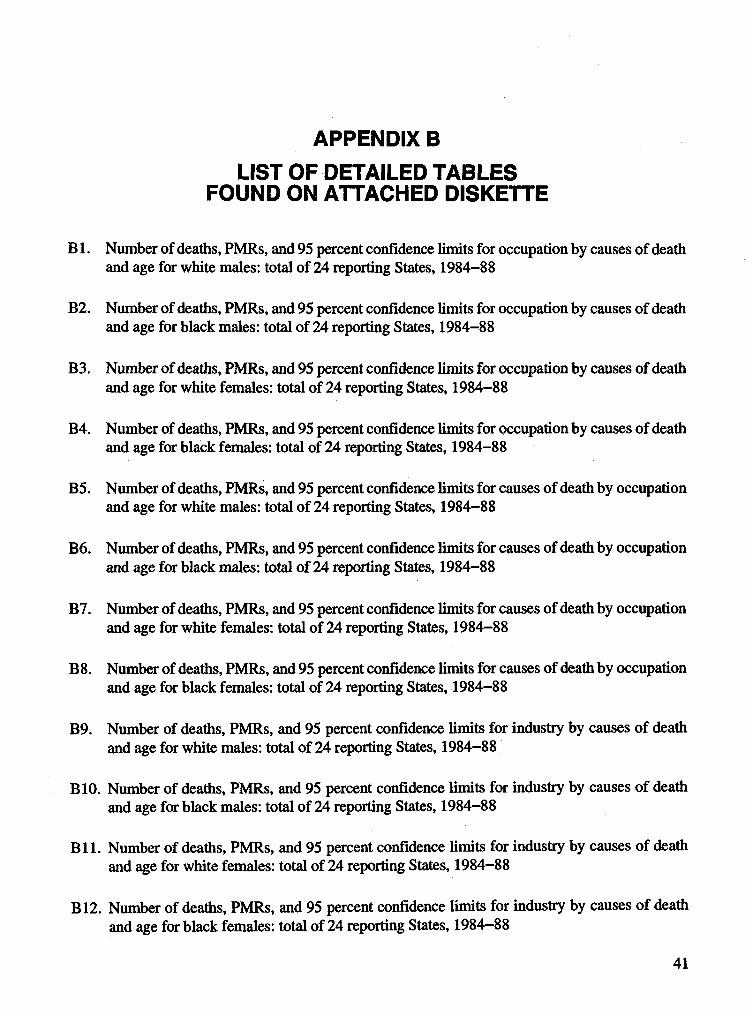
A P P E N D IX B
L IS T O F D E T A IL E D T A B L E S F O U N D O N A T T A C H E D D IS K E T T E
B 1. Number of deaths, PMRs, and 95 percent confidence limits for occupation by causes of death and age for white males: total of 24 reporting States, 1984-88
B2. Number of deaths, PMRs, and 95 percent confidence limits for occupation by causes of death and age for black males: total of 24 reporting States, 1984-88
B3. Number of deaths, PMRs, and 95 percent confidence limits for occupation by causes of death and age for white females: total of 24 reporting States, 1984-88
B4. Number of deaths, PMRs, and 95 percent confidence limits for occupation by causes of death and age for black females: total of 24 reporting States, 1984-88
B5. Number of deaths, PMRs, and 95 percent confidence limits for causes of death by occupation and age for white males: total of 24 reporting States, 1984-88
B6. Number of deaths, PMRs, and 95 percent confidence limits for causes of death by occupation and age for black males: total of 24 reporting States, 1984-88
B7. Number of deaths, PMRs, and 95 percent confidence limits for causes of death by occupation and age for white females: total of 24 reporting States, 1984-88
B8. Number of deaths, PMRs, and 95 percent confidence limits for causes of death by occupation and age for black females: total of 24 reporting States, 1984-88
B9. Number of deaths, PMRs, and 95 percent confidence limits for industry by causes of death and age for white males: total of 24 reporting States, 1984-88
BIO. Number of deaths, PMRs, and 95 percent confidence limits for industry by causes of death and age for black males: total of 24 reporting States, 1984-88
B l l . Number of deaths, PMRs, and 95 percent confidence limits for industry by causes of deathand age for white females: total of 24 reporting States, 1984-88
B12. Number of deaths, PMRs, and 95 percent confidence limits for industry by causes o f deathand age for black females: total of 24 reporting States, 1984-88
41
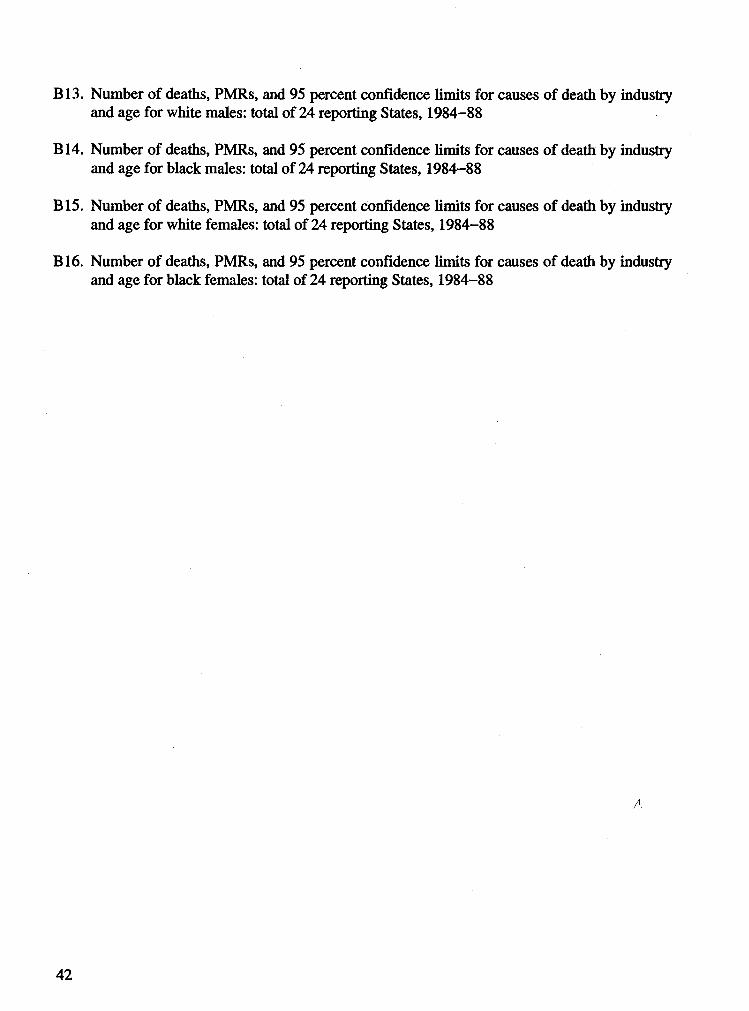
B13. Number of deaths, PMRs, and 95 percent confidence limits for causes of death by industry and age for white males: total of 24 reporting States, 1984-88
B14. Number of deaths, PMRs, and 95 percent confidence limits for causes of death by industry and age for black males: total of 24 reporting States, 1984-88
B15. Number of deaths, PMRs, and 95 percent confidence limits for causes of death by industry and age for white females: total of 24 reporting States, 1984-88
B16. Number of deaths, PMRs, and 95 percent confidence limits for causes of death by industry and age for black females: total of 24 reporting States, 1984-88
42

Delivering on the Nation's promise:Safety and health at work
For all people Through research and prevention
DHHS (NIOSH) Publication No. 97 -114