Embed Size (px)
Citation preview
Mortality Trends in Pacific Island States
June 2014
MortalityTrendsinPacificIslandStates
Secretariat of the Pacific Community School of Population Health, University of Queensland School of Public Health and Community Medicine, University of New South Wales June 2014

Authors
Christine Linhart (3)
Karen Carter (1,2)
Richard Taylor (1,3)
Chalapati Rao (1)
Alan Lopez (1)
1 SPH UQ
2. SPC
3. SPHCM, UNSW
Funding
Funding was provided for this work under an Australian Development Research Assistance Award (ADRA)
research grant, along with contributions (including in‐kind contributions) from the School of Population
Health (SPH), University of Queensland (UQ), the School of Public Health and Community Medicine
(SPHCM), University of New South Wales (UNSW) and the Secretariat of the Pacific Community (SPC).
Acknowledgements
The authors would like to acknowledge Naomi Jatrya, Yuri Zelenski, Claire Mowry, and Syed Azim for their
assistance in searching published material for additional data, and the Western Pacific Regional Office
(WPRO) of the World Health Organisation (WHO) for their support and input.
COPYRIGHT
SPC 2014 This report may be reproduced in whole or part, provided there is a clear written acknowledgement of the source.

‐ i ‐
EXECUTIVESUMMARY
Mortality is an essential measure of the health of populations. Examining mortality trends over
time allows governments and development partners to better understand key priorities for
intervention, whether health investments are having the desired impact, and how the health of
the population is changing over time. This report examines mortality trends through measures of
infant mortality rate (IMR) ‐ deaths in children aged <1 year per 1000 live births; under five
mortality rate (U5MR) ‐ deaths in children aged less than 5 years per 1000 live births; and life
expectancy (LE) ‐ average number of years a person could expect to live given the current
conditions for males and females. These are important development indicators, both for the
health sector and in a broader development context.
Data in this report are derived from local sources such as censuses, surveys, and vital registration
where available, and refer to both the data collection and analytical method used wherever possible.
Estimates were excluded from this analysis if: based on an assumed annual improvement; they are
implausible; derived from flawed data (such as from incomplete registration not corrected for
undercount); or no primary source or method could be identified. Also excluded were data sources
which provided contradictory estimates for the same time period.
There is considerable diversity in levels and trends in mortality amongst Pacific Island States, and
some caution must be taken when making general statements of trends across the region, or even
within subregions.
The data show commendable declines in IMR and U5MR in many Pacific Island States over the past
decades, and maintenance of relatively low levels in others. For many of these States, further declines
in infant and child mortality will require significant investment as many of the less difficult
interventions around safe births, nutrition and sanitation have already been made. A greater
understanding of the relative components of infant mortality (both neonatal and post‐neonatal
mortality) will also be necessary to target and monitor future investments. However, there are still
instances where IMR and U5MR are unacceptably elevated compared with expected norms, with
countries such as Papua New Guinea and Kiribati experiencing an IMR >40 deaths per 1000 live births
despite a consistent downward trend; while just over a third of all the countries have an IMR greater
than 20 deaths per 1000 live births, and therefore have scope for further improvement.
Many countries show continued improvement in LE for both males and females, but others have
experienced plateaux with no sustained improvement over the last two decades. Although there is
no clear evidence to suggest that life expectancy is actually falling in any Pacific Island State once
previous estimates were excluded based on method and quality, in several countries stagnation in
life expectancy has occurred at relatively low life expectancies, and indicates significant health
concerns. Given declines in infant and childhood mortality, these LE patterns are most likely a
consequence of the impact of premature adult mortality from non‐communicable disease (NCDs).
There was substantial variation in the quality of data available. While in some Pacific Island states
mortality data by age and sex from routine death registration is of acceptable coverage and
completeness, and direct and indirect demographic estimates from censuses and surveys are
credible, in others routine death registration is significantly incomplete and it has been necessary
‐ ii ‐
to rely solely on demographic analyses of censuses or surveys which may underestimate true
levels of mortality. Improving registration data in these countries should be a priority.
‐ iii ‐
CONTENTS1. Introduction _____________________________________________________________________ 1
2. Background ______________________________________________________________________ 1
3. Methods ________________________________________________________________________ 2
3.1 Data sources ________________________________________________________________ 2
3.2. Level of mortality ____________________________________________________________ 2
3.3. Mortality trends _____________________________________________________________ 3
4. Summary Results _________________________________________________________________ 3
4.1 Infant and Child Mortality ______________________________________________________ 3
4.2 Life Expectancy ______________________________________________________________ 4
4.3 Data sources and quality _______________________________________________________ 6
5. Mortality Trends by Country ________________________________________________________ 7
1. American Samoa ______________________________________________________________ 8
2. Cook Islands _________________________________________________________________ 11
3. Fiji _________________________________________________________________________ 15
4. French Polynesia _____________________________________________________________ 19
5. Guam ______________________________________________________________________ 22
6. Kiribati _____________________________________________________________________ 25
7. Marshall Islands, Republic of the _________________________________________________ 28
8. Micronesia, Federated States of _________________________________________________ 32
9. Nauru ______________________________________________________________________ 35
10. New Caledonia ______________________________________________________________ 38
11. Niue ______________________________________________________________________ 41
12. Northern Mariana Islands, Commonwealth of the __________________________________ 44
13. Palau ______________________________________________________________________ 47
14. Papua New Guinea ___________________________________________________________ 50
15. Samoa _____________________________________________________________________ 53
16. Solomon Islands _____________________________________________________________ 57
17. Tokelau ____________________________________________________________________ 60
18. Tonga _____________________________________________________________________ 63
19. Tuvalu _____________________________________________________________________ 67
20. Vanuatu ___________________________________________________________________ 70
21. Wallis and Futuna ___________________________________________________________ 73
Additional References ______________________________________________________________ 76
Appendices _______________________________________________________________________ 78
Appendix 1: Outline of mortality and life expectancy calculation methods __________________ 78
Appendix 2: Additional notes on data quality _________________________________________ 81

‐ 1 ‐
1.Introduction
Mortality in populations is an important measure of health status, in addition to measures of illness (or
morbidity). Reduction in premature mortality is one of the most important objectives of public health
and health services.
This report presents mortality data from all Pacific Island countries and territories of Melanesia,
Micronesia and Polynesia which are members of the Secretariat for the Pacific Community (SPC). These
dispersed Island nations and territories show great variation in land mass, colonial history, population
size, social and economic development, endemic malaria, health services, governance structures,
ethnicity and culture. This diversity is reflected in differences in important health status indicators such
as child mortality and life expectancy (at birth).
For many Pacific Island countries and territories there are a number of contradictory estimates of
mortality level from multiple sources with little information often available on the methods used to
calculate the figures provided. This necessitates a circumspect approach and critical appraisal of
published estimates so that data from credible primary sources are emphasised and data are clearly
referenced.
Compared to cross‐sectional estimates from one period, trends over time are of much greater value in
the interpretation of mortality and morbidity data in populations since they indicate improvement,
stagnation or worsening of the health situation, as well as providing for comparisons with other
populations.
2.Background
Much of the work to produce this report was funded through an Australian Development Assistance
Award (ADRA) research grant funded by AusAID entitled: Strengthening Mortality and Cause of Death
Reporting in Pacific Island Health Information Systems (ADRA Application HSS024, ADRA Agreement
44738). The Principal Investigator (PI) was Richard Taylor. This study was implemented through the
School of Population Health (SPH), University of Queensland (UQ), and later in collaboration with the
School of Public Health and Community Medicine (SPHCM), University of New South Wales (UNSW) and
SPC. The Western Pacific Regional Office of the World Health Organisation (WPRO) also supported the
study and rendered assistance when needed. Although the project included working closely with Fiji,
Kiribati, Nauru, Palau, Solomon Islands, Tonga, and Vanuatu, to identify weaknesses and gaps in their
current mortality data collection and reporting systems, it also involved producing best possible
estimates of mortality for other states in the Pacific Islands region which are summarised in this report.

‐ 2 ‐
3.Methods
3.1 Data Sources
Mortality indicators used in this report are extracted from: (a) country sources, including Ministry of
Health (MoH), Departments of Statistics, Census Reports, Year Books, etc.; (b) international agencies
including WHO, SPC, the United Nations Inter‐Agency Group for Child Mortality Estimation (UNIGME),
United Nations International Children's Emergency Fund (UNICEF), etc.; and (c) publications in the
scientific literature.
Reports were accessed in hard copy, including inter‐library loan (ILL) and through direct contact with the
reporting authority, and in electronic form through country and organisational web sites. Reports
accessed were in English or French.
When multiple sources reported the same estimate and time period, the primary source of the data was
identified and the duplicate removed. In instances where the primary source could not be determined
all estimates were included in the graph. Estimates for the same year are slightly offset for graphical
display. The summary table for each country indicates the time period represented by each data point.
In some countries mortality data are recorded through vital registration which involves recording of vital
events (births, deaths, marriages) in a population through a civil system (civil vital registration), and/or
through a health system (registration of births), and/or by other means (such as through local
government, or by churches).
In other countries mortality data are collected intermittently through censuses or population sample
surveys using direct methods including questions on deaths in the household in a defined retrospective
period, or a complete maternal history, or indirect demographic techniques including questions on
survival of parents, spouse or siblings.
3.2 Level of Mortality
Measures of infant mortality rate (IMR) (deaths <1 year/1000 live births), under‐five mortality rate
(U5MR) (deaths <5 years/1000 live births) and life expectancy (LE) (at birth) were chosen as mortality
measures because of their availability. Data were (1) extracted from published reports, journal articles
and life tables; or (2) directly calculated by the authors based on published and unpublished vital
registration data of infant and under‐five deaths, and live births for the same period.
For each data point, the original source of data and the analytic method of calculation were recorded,
where possible. Data sources were assessed for reliability and plausibility of estimates based on the
analytic method of estimation, original source of data, and data consistency. Unreliable sources were
considered for exclusion if they met any of the following criteria: (a) data were derived, or were
considered likely to have been derived, from projections assuming a given improvement by year, as
evidenced by perfectly linear or curvi‐linear improvements in LE or IMR by period; (b) multiple
incompatible estimates were given by the source for a single year or adjacent years; (c) source data
included implausible estimates (based on equivalent measures for developed countries) or U5MR less
than IMR estimates; (d) calculations were based on uncorrected vital registration data known to be

‐ 3 ‐
significantly under‐reported or with no assessment of reporting completeness. In the absence of
primary data some credible international agency estimates have been included.
Estimates published by the United Nations Inter‐agency Group for Child Mortality Estimation (UNIGME)
comprised of UNICEF, WHO, the World Bank, and the United Nations, for infant mortality (1990; 2012)
and under‐five mortality (1990; 2000; 2012) for Pacific Island states (except territories) are derived from
trends with projections based on selected data (see full report for more detailed methodology [UNIGME
2013]. While the UNIGME estimates meet the exclusion criteria for this report, they have been included
in the graphs as an acknowledged international reference source for comparison purposes only and
have not been included in generating the trend lines shown. Similarly, estimates from the Global Burden
of Disease (GBD) Studies have been included on the graphs for comparison purposes only due to their
use as an international reference source, but have not been included in generating the trend lines
shown. The estimates generated for the GBD are secondary sources derived from models using a range
of data inputs including available country mortality data, economic data, and data from similar countries
(see publications for full details [Wang 2010; Wang 2013]).
Estimates from some primary sources which are considered implausible because they are inconsistent
with credible sources, are included in graphs for comparison purposes only and have not been included
in generating the trend lines shown in this report. A footnote beneath the graphs indicates where this
has occurred.
3.3 Mortality Trends
Mortality data are plotted by period and appropriate trend lines fitted to IMR, U5MR and LE data points.
Rather than using a linear function (y = a + bx) to describe trends, the most suitable function for IMR and
U5M was found to be exponential (y = aebx). For LE, the most suitable curve was found to be quadratic (y
= a + bx + cx2), however, exponential curves are fitted to LE data in populations characterised by a
continuous increasing trend. Where data are unstable a trend line was fitted to a two‐point average.
Curves were not fitted where there are insufficient data points or where there is no obvious trend over
time.
y = IMR, U5M or LE ; x = period (year); a = intercept; b, c = coefficients (slope);
e = base of the natural logarithm
4.SummaryResults
4.1 Infant and Child Mortality
Overall, most countries showed a consistent decline in IMR, although a clear trend could not be
discerned in Nauru and Niue, where small population sizes may result in wide variation in rates from
only a few events (stochastic variation). There was significantly more data on IMR available than under
U5MR, which only began to be measured or reported with any consistency with the introduction of the
Millennium Development Goals (MDGs).
‐ 4 ‐
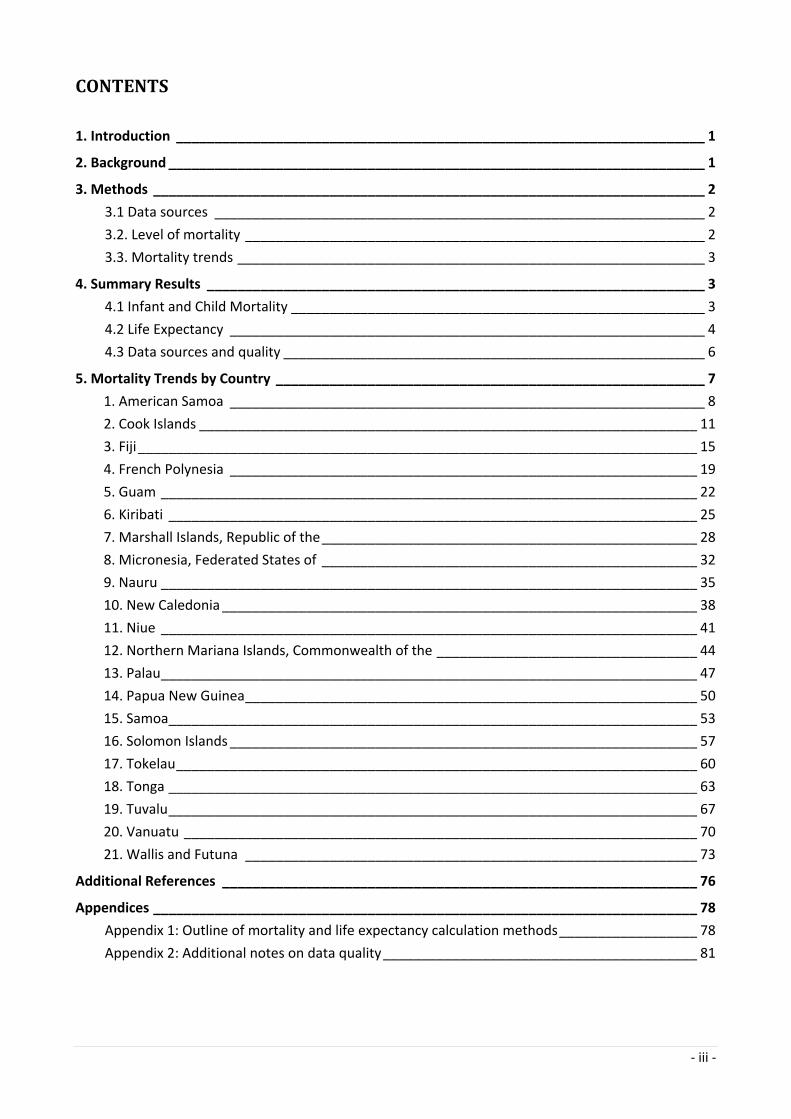
While many countries demonstrate quite low levels of IMR, others still have scope for further
improvements (Table 1).
Table 1: Recent Infant Mortality Rates (IMR) Summary Table
IMR per 1000 births Countries
<10 Cook islands French Polynesia Guam New Caledonia Niue Northern Mariana Islands, Commonwealth of (CNMI) Wallis and Futuna Australia* France* New Zealand* United States of America*
10‐19 American Samoa Fiji Palau Samoa Tonga Tuvalu
20‐29 Marshall Islands, Republic of the (RMI) Micronesia, Federated States of (FSM) Solomon Islands Vanuatu
30‐39 Nauru Tokelau
40‐49 Kiribati
50‐59 Papua New Guinea (PNG)
* Included for comparison References: Australia ‐ Australian Bureau of Statistics; France ‐ Institut National de la
Statistique et des Etudes Economiques; New Zealand ‐ Statistics New Zealand; United
States of America ‐ United States Census Bureau
Estimates published by UNIGME, included in the country graphs for comparison purposes only, were
generally comparable with the empirical data from countries, although must be used with caution since
they show ongoing improvements in some countries that is not supported by the empirical data.
4.2 Life Expectancy
Just over half of the Pacific Island States show a consistent increase in life expectancy for males and
females (Tables 2 and 3), with the remainder showing no sustained improvement over the previous two
decades.

‐ 5 ‐
Table 2: Recent Male Life Expectancy at birth (years) Summary Table
Life expectancy Countries
Increasing Trend Plateau
≥80
75‐79 Guam Australia* France* New Zealand* United States of America*
70‐74 American Samoa+
Cook Islands French Polynesia Marshall Islands, Republic of the (RMI)New Caledonia Niue Samoa Wallis and Futuna
Northern Mariana Islands, Commonwealth of the (CNMI)
65‐69 Solomon Islands Vanuatu
Micronesia, Federated States of (FSM) Fiji Palau Tokelau Tonga
60‐64 Tuvalu
55‐59 Kiribati
<55 Nauru Papua New Guinea (PNG)
* Included for comparison
+ Increasing trend is dependent on an unverified source References: Australia ‐ Australian Bureau of Statistics; France ‐ Institut National de la Statistique et des Etudes Economiques; New Zealand ‐ Statistics New Zealand; United States of America ‐ United States Census Bureau
Very few states show a comparable LE to countries such as Australia or New Zealand, with only Guam in
the same category for both males and females; although this may be heavily influenced by the large
military population present there. With the exception of CNMI, many of these plateaux in LE have
occurred at relatively low levels. Given continued declines in infant (and child) mortality, these
demonstrate the substantial impact of premature adult mortality on Pacific populations. In the absence
of major conflict or a substantial epidemic of HIV/AIDS, this is most likely attributable to the impact of
non‐communicable diseases, although external causes such as accidents and injuries may also
contribute to these results. Detailed analysis of trends in cause of death by age group and sex are
required to further understand these trends, where data is available to do so.

‐ 6 ‐
Table 3: Recent Female Life Expectancy at birth (years) Summary Table
Life expectancy (at birth) years
Countries
Increasing Trend Plateau
≥80 Guam New Caledonia Australia* France* New Zealand* United States of America*
75‐79 American Samoa+
French Polynesia Niue Wallis and Futuna
Northern Mariana Islands, Commonwealth of the
70‐74 Cook Islands Marshall Islands, Republic of the Micronesia, Federated States of Samoa Vanuatu
Tokelau Tonga Palau
65‐69 Tuvalu Fiji
60‐64 Solomon Islands Kiribati
55‐59 Nauru
<55 Papua New Guinea
* Included for comparison
+ Increasing trend is dependent on an unverified source References: Australia ‐ Australian Bureau of Statistics; France ‐ Institut National de la Statistique et des Etudes Economiques; New Zealand ‐ Statistics New Zealand; United States of America ‐ United States Census Bureau
4.3 Data Sources and Quality
There was substantial variation in the data available for each country. Some Pacific Island states had
reliable mortality data by age and sex from routine death registration, while for others it was necessary
to rely on census or survey data of uncertain validity, as routine registration data collections were either
incomplete (and produced implausible estimates), or were otherwise not available. Improving the
reliability and availability of registration data in these countries should be a priority. Previous studies
have found that significantly more data is collected in many Pacific Island countries on mortality and
causes of death than is published or publically available. Common issues in collection include poor
legislative framework, poor coordination between departments, and a lack of technical skills and
resources [Carter 2010; Carter2012]. A regional Pacific Vital Statistics Action Plan (2011‐2014) has been
established by development partners under the Ten Year Pacific Statistics Strategy (2011‐2020) to assist
countries to improve their civil registration and vital statistics [BAG, 2014] and governments have
committed to improvements of civil registration and vital statistics as a priority through both the Pacific
Ministers of Health and the Heads of Planning and Statistics.
Direct and indirect analysis of census and survey data in some cases provided suspiciously low estimates
of mortality, potentially disguising major health issues. Where possible, comparisons between multiple
approaches (including with results of direct registration) should be undertaken to improve overall
understanding of the data.

‐ 7 ‐
5.MortalityTrendsbyCountry
For each Pacific Island state, the following pages outline background information, trends in life
expectancy and child mortality, and data sources and methods. Brief comments are also provided on
trends and data sources. Detailed notes on specific estimates are included in the appendices.
‐ 8 ‐
1.AmericanSamoaLand area (Km2) 199 2013‐mid‐year population estimate 56,500 Population growth rate (%) ‐0.3
[Source: SPC Pocket Summary 2013]
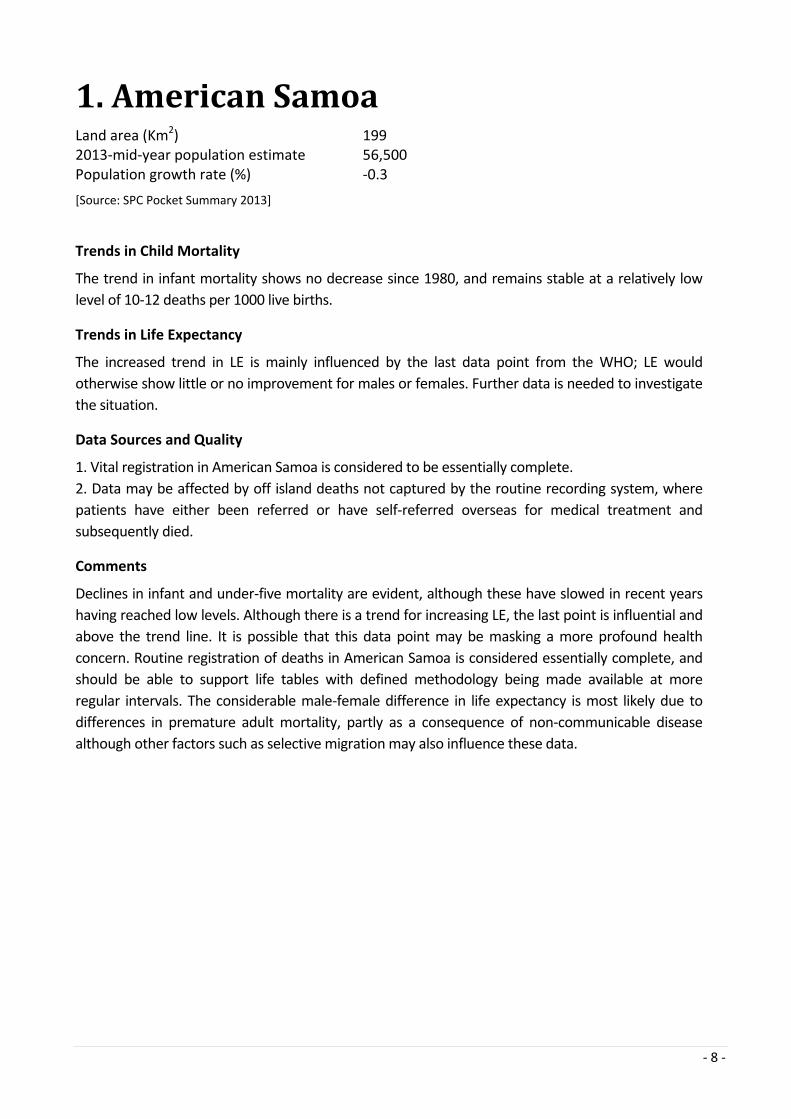
Trends in Child Mortality
The trend in infant mortality shows no decrease since 1980, and remains stable at a relatively low
level of 10‐12 deaths per 1000 live births.
Trends in Life Expectancy
The increased trend in LE is mainly influenced by the last data point from the WHO; LE would
otherwise show little or no improvement for males or females. Further data is needed to investigate
the situation.
Data Sources and Quality
1. Vital registration in American Samoa is considered to be essentially complete.
2. Data may be affected by off island deaths not captured by the routine recording system, where
patients have either been referred or have self‐referred overseas for medical treatment and
subsequently died.
Comments
Declines in infant and under‐five mortality are evident, although these have slowed in recent years
having reached low levels. Although there is a trend for increasing LE, the last point is influential and
above the trend line. It is possible that this data point may be masking a more profound health
concern. Routine registration of deaths in American Samoa is considered essentially complete, and
should be able to support life tables with defined methodology being made available at more
regular intervals. The considerable male‐female difference in life expectancy is most likely due to
differences in premature adult mortality, partly as a consequence of non‐communicable disease
although other factors such as selective migration may also influence these data.
‐ 9 ‐
American Samoa
Infant Mortality Under‐Five Mortality
Life Expectancy; American Samoa
Key SPC: Secretariat of the Pacific Community WHO: World Health Organisation
Stat Div: Statistics Division American Samoa THS: Territorial Household Survey
0
10
20
30
40
50
60
Per 1,000 live births
Period (year)
SPC
Stat Div
Exponential
0
10
20
30
40
50
60
Period (year)
Stat Div
Exponential
40
50
60
70
80
Years
Period (year)
SPC
Stat Div
WHO
Census
THS
Male
Exponential
40
50
60
70
80
Period (year)
SPC
Stat Div
WHO
Census
THS
Female
Exponential

‐ 10 ‐
Source Year Data Analysis Ref
Infant Mortality
SPC 1991‐95(1993) Unknown Unknown 1
Stat Div 1961‐2011* Vital registration Direct calculation 2‐5
Under Five Mortality
Stat Div 1990 Vital registration Life table (direct calculation +/‐model life table) 5
1997‐2011* Vital registration Direct calculation 5,6
Life Expectancy
SPC 1978‐82(1980) Vital registration Unknown 7
1995 Unknown Unknown 1
2000 Vital registration Direct calculation using 2000 Census population 8
Stat Div 1990 Vital registration Life tables (direct calculation +/‐model life table) 5
WHO 2005 Unknown Unknown (cited as US Census Bureau – not located) 9
Census 1974 Census CEBCS data used to impute complete model life tables (Coale/Demeny West)
10
THS 1978‐82(1980); 1981‐85(1983)
Vital registration Age‐standardised death rates converted into life table values (Reed‐Merrell method)
11
* Data points represent average of three‐year period around the estimate References 1. South Pacific Commission. Pacific Island Populations – Revised Edition. Report prepared by the South Pacific Commission for the International Conference on Population and Development 1994: Cairo, Egypt. Noumea: SPC; 1998. Estimate cited in; Taylor R, Lopez A. Differential mortality among Pacific Island countries and territories. Asia‐Pacific Population Journal. 2007;22(3):45‐58. 2. Economic Development and Planning Office, Government of American Samoa. Statistical Bulletin 1982. Pago Pago: American Samoa Government; 1982. 3. LBJ Tropical Medical Centre, Planning and Development Division, Economic Development Planning Office; Research and Statistics Division. Estimate cited in; Economic Development Planning office, Research and Statistics Division. American Samoa Statistical Digest 1995. Pago Pago: American Samoa Government; no date. 4. Health Information Systems Office, ASG Department of Health; American Samoa Hospital Authority, LBJ Tropical Medical Centre. Estimate cited in; Department of Commerce, Statistics Division. American Samoa Statistical Yearbook 2006 [Internet]. 2007 [cited 2012 Oct 3]. Available from: http://www.doc.as/wp‐content/uploads/2011/11/Statistical‐Yearbook_2008.pdf 5. Health Information Systems Office, American Samoa Government Department of Health. Estimate cited in; Department of Commerce Statistics Division. American Samoa Statistical Yearbook 2011. Pago Pago, American Samoa: Department of Commerce. 6. Health Information System Office, Department of Health, Government of American Samoa. Estimate cited in; Department of Commerce Statistics Division. American Samoa Statistical Yearbook 2000. Pago Pago, American Samoa: Department of Commerce. 7. ESCAP/SPC. Population of American Samoa. ESCAP/SPC Country Monograph Series No 7.1. Bangkok, United Nations; Noumea, South Pacific Commission, 1979. And; Siliga N. Country report, American Samoa. Working paper No 13. Tenth Regional Conference of Permanent Heads of Health Services. Noumea, South Pacific Commission, 1983. Estimate cited in; Taylor R, Lewis N, Levy S. Societies in transition: mortality patterns in Pacific Island populations. International Journal of Epidemiology. 1989;18(3):634‐646. 8. United States Census 2000, data for American Samoa. Estimate cited in; Secretariat of the Pacific Community. Table 7: Recent developments in fertility and mortality [Internet]. 2010 [cited 2012 Oct 5]. Available from: http://www.spc.int/sdp/index.php?option=com_docman&task=cat_view&gid=28&dir 9. United States Census Bureau. Estimate cited in; World Health Organisation Western Pacific Region. Western Pacific Country Health Information Profiles 2008 Revision. Geneva: WHO; 2008. 10. Levin MJ, Wright PA. Report on the 1974 Census of American Samoa: Part II. Pago Pago 11. Groenewold WGF, de Jong SP. The American Samoa Territorial Household Survey of 1985. Description, evaluation and preliminary analysis of demographic data. The Netherlands: Geographical Institute, Groningen State University; 1986.

‐ 11 ‐
2.CookIslandsLand area (Km2) 237 2013‐mid‐year population estimate 15,200 Population growth rate (%) ‐0.5
[Source: SPC Pocket Summary 2013]
Trends in Child Mortality
The trend in infant mortality has declined to below 10 deaths per 1000 live births by 2010, with a
commensurate decline in under‐five mortality.
Trends in Life Expectancy
LE has increased to the high 60s (years) for males and mid‐70s (years) for females.
Data Sources and Quality
1. Mortality rates and estimates of life expectancy are likely to be affected by small numbers,
producing stochastic variation over time.
2. There is significant variation between sources of life expectancy, with lower levels reported by the
Ministry of Health more likely to be correct.
3. Civil registration in the Cook Islands is regarded as essentially 99% complete [NMDI website].
Records are frequently reconciled with the Ministry of Health records [Cook Islands Statistical
Bulletin, 2013].
4. Many mortality events for Cook Islanders may occur off‐island in New Zealand, and would
subsequently not be captured in routine death registration.
Comments
There are commendable decreases in infant and under‐five mortality, with the latest estimates are
below the trend line. Although life expectancy shows increasing trends, there are systematic
differences between various sources (and methodologies) with the Ministry of Health data showing
lower levels and lesser increases. Such differences require resolution. Infant and under‐five mortality
and life expectancy from the Cook Islands should be based on 3‐5 year data, and presented with
statistical confidence intervals (95%).

‐ 12 ‐
Cook Islands
Infant Mortality Under‐Five Mortality
Life Expectancy; Cook Islands
Key SPC: Secretariat of the Pacific Community WHO: World Health Organisation Stats Off: Statistics Office Cook Islands
MoH: Ministry of Health UNIGME: United Nations Inter‐agency Group for Child Mortality Estimation
0
10
20
30
40
50
60
Per 1,000 live births
Period (year)
Census
Stats Off
MoH
UNIGME
Exponential
0
10
20
30
40
50
60
Period (year)
SPC
MoH
Census
Stats Off
UNIGME
Exponential
40
50
60
70
80
Years
Period (year)
MoHSPCCensusWHO
Male
Quadratic
40
50
60
70
80
Period (year)
MoH
SPC
Census
WHO
Female
Quadratic
UNIGME estimates are not included in the trendline as they are not a primary source of data ‐ they are for comparison purposes only.

‐ 13 ‐
Source Year Data Analysis Ref
Infant Mortality
Census 1991‐96(1993) Vital registration Direct calculation 1
2001‐06(2004) Vital registration Life table based on vital registration data using software package PAS, procedure LTPOPDTH, of the US Census Bureau
2
2001‐12(2006) Vital registration and Census
Life tables based on vital registration and CEBCS data using software package PAS, procedure LTPOPDTH, of the US Census Bureau
3
Stats Off 1969‐2012^ Vital registration Direct calculation 4,5
MoH 1987‐2010^ Vital registration Direct calculation 6
UNIGME 1990;2012 UNIGME Projection (see UNIGME methodology page 3) 7
Under Five Mortality
SPC 1996‐2002(1999)
Vital registration Life table –smoothed (direct calculation +/‐ model life table) 8
MoH 2008‐10(2009) Vital registration Direct calculation 6
Census 2001‐06(2004) Vital registration Life table based on vital registration data using software package PAS, procedure LTPOPDTH, of the US Census Bureau
2
2001‐12(2006) Vital registration and Census
Life tables based on vital registration and CEBCS data using software package PAS, procedure LTPOPDTH, of the US Census Bureau
3
Stats Off 1970‐1977^; 1987‐1992*
Vital registration Direct calculation 9‐11
UNIGME 1990; 2000; 2012
UNIGME Projection (see UNIGME methodology page 3) 7
Life Expectancy
MoH 1997‐2005* Vital registration Life tables (direct calculation +/‐model life table) 12
2006‐07(2007) Vital registration Life tables (direct calculation +/‐model life table) 13
SPC 1966; 1971; 1974‐81~
Vital registration Life tables (direct calculation +/‐model life table) 14
1996‐2002(1999)
Vital registration Life tables – smoothed (using model life tables) 7
Census 1995‐97 1996) Vital registration Based on model life tables (Far East Asian) using MORTPAK3.0
1
2001‐06(2004) Vital registration Life table based on vital registration data using software package PAS, procedure LTPOPDTH, of the US Census Bureau
2
2001‐12(2006) Vital registration and Census
Life tables based on vital registration and CEBCS data using software package PAS, procedure LTPOPDTH, of the US Census Bureau
3
WHO 1999; 2000 Unknown Unknown 15
Data points represent average of: * three‐year period; ^ four‐year period; ~ five‐year period around the estimate

‐ 14 ‐
References 1. Secretariat of the pacific Community. Cook Islands population profile based on 1996 Census. A guide for planners and policy‐makers. Noumea: SPC; 1999. 2. Statistics Department Cook Islands, Statistics and Demography Programme Secretariat of the Pacific Community. Cook Islands 2006 Census of Population and Housing, Analytical Report [Internet]. 2007 [cited 2012 Oct 10]. Available from: http://www.spc.int/prism/country/ck/stats/Statistics/CensusSurveys/censurvnav.htm 3. Secretariat for the Pacific Community. Population Profile of the Cook Islands 2006‐2011 [provisional report]. 4. Statistics Office Cook Islands. Annual Statistical Bulletin 2011 [Internet]. 2011 [cited 2012 Oct 10]. Available from: http://www.health.gov.ck/index.php/publications/health‐statistics/annual‐bulletins 5. Ministry of Finance and Economic Management, Government of the Cook Islands. Vital statistics and population estimates June Quarter 2013 [Internet]. 2013 [cited 2014 Jan 15]. Available from: http://www.mfem.gov.ck/population‐and‐social‐statistics/vital‐stats‐pop‐est 6. Cook Islands Ministry of Health. Health Statistics Tables 2008‐2010. Medical Records Unit Rarotonga Hospital. Rarotonga: Ministry of Health; July 2011. 7. The United Nations Inter‐agency Group for Child Mortality Estimation (UNIGME). Levels and trends in child mortality: Report 2013. The United Nations Children’s Fund; 2013. 8. Secretariat of the Pacific Community. Demographic Profile of Cook Islands 1996‐2002 [Internet]. 2005 [cited 2012 Oct 2]. Available from: http://www.spc.int/prism/country/ck/stats/NewsEvents/CIDemogProf.pdf 9. Statistics Office. Quarterly Statistical Bulletin July‐December 1997.Rarotonga: Government of the Cook Islands; 1978. 10. Statistics Office. Cook Islands Statistical Abstract. Vital Statistics (1987‐1991). Rarotonga: Statistics Office; 1992. 11. Statistics Office. Cook Islands Statistical Abstract. Vital Statistics (1988‐1992). Rarotonga: Statistics Office; 1993. 12. Cook Islands Ministry of Health (Medical Records Unit). Annual Statistics, Table 6. Health Indicators. 2006. 13. Cook Islands Ministry of Health. Annual Statistical Bulletin 2007. Rarotonga: Ministry of Health; 2008 Jul. 14. South Pacific Commission and United Nations ESCAP Population Division. Population of the Cook Islands, Country Monograph Series, No. 7.3. ESCAP and SPC, 1983. 15. Lopez A, Salomon J, Ahmad O, Murray C, Mafat D. Life Tables for 191 Countries: Data, Methods and Results. GPE Discussion Paper Series: No.9. EIP/GPE/EBD. Geneva: World Health Organisation; 2000.

‐ 15 ‐
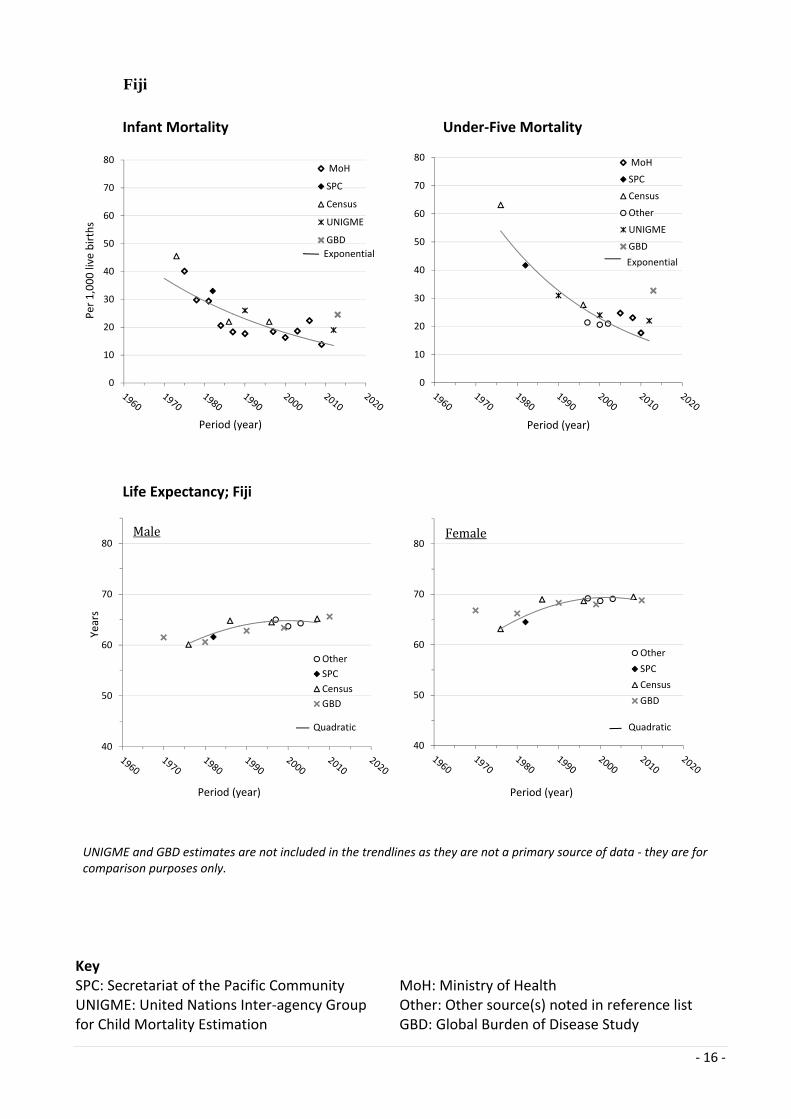
3.FijiLand area (Km2) 18,333 2013‐mid‐year population estimate 859,200 Population growth rate (%) 0.8
[Source: Secretariat of the Pacific Community Pocket Summary 2013]
Trends in Child Mortality
There has been a decline in infant mortality to about 15 deaths per 1000 live births by 2010, with a
commensurate trend in under‐five mortality.
Trends in Life Expectancy
LE has plateaued out in the mid‐60s (years) in males and late 60s (years) in females since 1985.
Data Sources and Quality
Vital registration data collected through the Ministry of Health have previously been evaluated and
found to be reasonably complete [Carter et al. 2011].
Comments
Substantial reductions in infant and under‐five mortality are shown. There has been a plateau in male
and female LE for approximately 25 years at 64 years for males and 69 years for females due to
premature adult mortality, most likely a consequence of non‐communicable disease. Divergent trends
have been demonstrated by ethnicity [Taylor et al. 2013], although are not shown here.
‐ 16 ‐
Fiji
Infant Mortality Under‐Five Mortality
Life Expectancy; Fiji
Key SPC: Secretariat of the Pacific Community UNIGME: United Nations Inter‐agency Group for Child Mortality Estimation
MoH: Ministry of Health Other: Other source(s) noted in reference list GBD: Global Burden of Disease Study
0
10
20
30
40
50
60
70
80
Per 1,000 live births
Period (year)
MoH
SPC
Census
UNIGME
GBD
Exponential
0
10
20
30
40
50
60
70
80
Period (year)
MoH
SPC
Census
Other
UNIGME
GBD
Exponential
40
50
60
70
80
Years
Period (year)
Other
SPC
Census
GBD
Male
Quadratic
40
50
60
70
80
Period (year)
Other
SPC
Census
GBD
Female
Quadratic
UNIGME and GBD estimates are not included in the trendlines as they are not a primary source of data ‐ they are for comparison purposes only.

‐ 17 ‐
Source Year Data Analysis Ref
Infant Mortality
MoH 1974‐91* Vital registration Direct calculation 1,2,
1994‐2010* Vital registration Direct calculation 3‐6
SPC 1981‐83(1982) Vital registration Direct calculation (adjusted for under‐reporting using Brass method)
7
Census 1976 Census CEBCS (+/‐model life table) 8
1986 Census CEBCS (+/‐model life table) 9
1995‐97(1996) Vital registrationand Census
Vital registration and Census data used to impute a model life table (UN Far Eastern 2 parameter model)
10
UNIGME 1990; 2012 UNIGME Projection (see UNIGME methodology page 3) 11
GBD 2013 GBD Modelled data (see reference) – added early neonatal mortality, late neonatal mortality, and post neonatal infant mortality.
16
Under Five Mortality
Other 1996‐2004* Vital registration Life tables from age specific deaths and populations 12
MoH 2004‐09*; 2010 Vital registration Direct calculation 5,13
SPC 1981‐83(1982) Vital registration Direct calculation (adjusted for under‐reporting using Brass method)
14
Census 1976 Census Census survivorship data used to impute a model life table 8
1995‐97(1996) Vital registrationand Census
Vital registration and Census data used to impute a model life table (UN Far Eastern 2 parameter model)
10
UNIGME 1990; 2000; 2012 UNIGME Projection (see UNIGME methodology page 3) 11
GBD 2013 GBD Modelled data (see reference) 16
Life Expectancy
Other 1996‐2004* Vital registration Life tables from age specific deaths and populations 6,12
SPC 1981‐83(1982) Vital registration Life tables (adjusted for under‐reporting using Brass method)
7
Census 1976 Census Census survivorship data used to impute model life tables 8
1986 Census Child and adult survival data used to impute logit model life tables
9
1995‐97(1996) Vital registrationand Census
Vital registration and Census data used to impute model life tables (UN Far Eastern 2 parameter model)
10
2006‐08(2007) Vital registration Direct calculation 15
GBD 1970; 1980; 1990; 2000; 2010
GBD Modelled data (see reference) 17
*Data points represent average of three‐year period around the estimate

‐ 18 ‐
References 1. Ministry of Health. Annual report for the years 1987‐1988. Fiji: paper number 13; 1991. 2. Ministry of Health. Annual Report 1991‐1992. Fiji: paper number 59; 1993. 3. Fiji Bureau of Statistics. Key Statistics December 2012. Table 1.15 Births, deaths and marriages by major ethnic group [Internet]. 2012 Dec [cited 2014 Jan 15]. Available from: http://www.statsfiji.gov.fj 4. Fiji Bureau of Statistics. Key Statistics June 2012. Table 1.17 Vital and health statistics [Internet]. 2012 June [cited 2014 Jan 15. Available from: http://www.statsfiji.gov.fj 5. Fiji Ministry of Health. Fiji Annual Report 2010. Suva: Ministry of Health; 2011 Sep. 6. Carter K, Cornelius M, Taylor R, Ali S, Rao C, Lopez A, Lewai V, Goundar R, Mowry C. Mortality trends in Fiji. Australian and
New Zealand Journal of Public Health. 35(5):412‐420, 2011.
7. Ministry of Health. Estimate cited in; South Pacific Commission. Population monograph No.1 Population of Fiji. Noumea; SPC: 1990. Available from: http://www.spc.int/sdp/index.php?option=com_docman&task=cat_view&gid=28&dir 8. Zwart F. Report on the Census of the Population 1976, Volume II, Demographic Characteristics. Parliamentary Paper No. 43. Suva: Parliament of Fiji; 1979. 9. Fiji Islands Bureau of Statistics. Report on Fiji Population Census 1986. Analytic report on the demographic, social and economic characteristics of the population. Suva: Bureau of Statistics; 1989. 10. Fiji Islands Bureau of Statistics. 1996 Fiji Census of population and housing. Analytic report part 1 demographic characteristics. Suva: Parliament of Fiji; 1998. 11. The United Nations Inter‐agency Group for Child Mortality Estimation (UNIGME). Levels and trends in child mortality: Report 2013. The United Nations Children’s Fund; 2013. 12.Carter K, Cornelius M, Taylor R et al. An assessment of mortality estimates for Fiji, 1949‐2008: findings and life tables. Health Information Systems Knowledge Hub. Documentation note series. Number 12; November 2010. 13. Ministry of Health – Annual Reports. Estimates cited in; Fiji Islands Bureau of Statistics. Key Statistics: June 2012 [Internet]. No date [cited 2014 Jan 10]. Available from: http://www.statsfiji.gov.fj/index.php/social/9‐social‐statistics/social‐general/113‐population‐and‐demography 14. Balkaran S, Taylor R, Naroba V. Mortality trends and differentials in Fiji (Chapter 5) in: Chandra R, Bryant J, editors Population of Fiji. Table A.1.12. Secretariat of the Pacific Community; 1990. 15. Fiji Bureau of Statistics. Life Tables. Personal Communication. Unpublished. 16. Wang H, Liddell CA, Coates MM, Mooney M ,Levitz CE, Schumacher AE, et al. Global, regional, and national levels of neonatal, infant, and under‐5 mortality during 1990–2013: a systematic analysis for the Global Burden of Disease Study 2013. Lancet. Published Online. May 2, 2014. http://dx.doi.org/10.1016/S0140‐6736(14)60497‐9. 17. Wang H, Dwyer‐Lindgren L, Lofgren KT, Knoll Rajaratnam J, Marcus JR, Levin‐Rector A et al. Age‐specific and sex‐specific mortality in 187 countries, 1970‐2010: a systematic analysis for the Global Burden of Disease Study 2010. Lancet. 380:2071‐94; 2012.

‐ 19 ‐
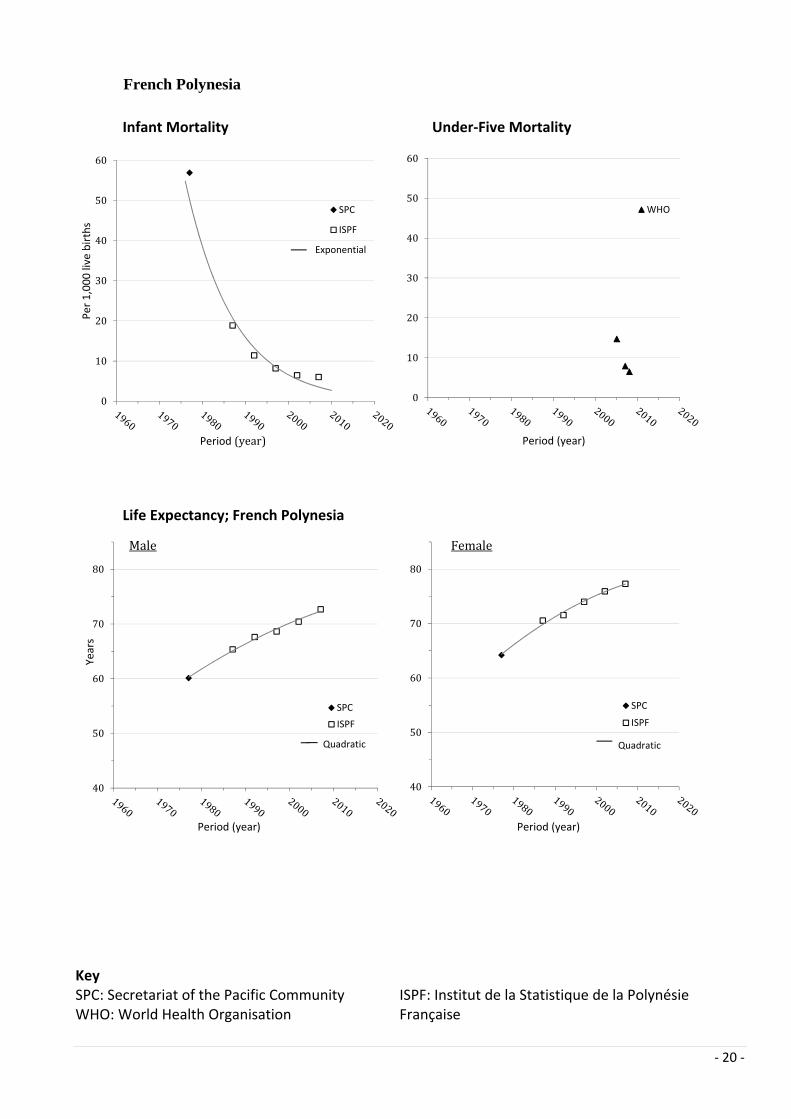
4.FrenchPolynesia
Land area (Km2) 3,521 2013‐mid‐year population estimate 261,400 Population growth rate (%) 1.8
[Source: SPC Pocket Summary 2013]
Trends in Child Mortality
Infant mortality has now stabilised at around 5 deaths per 1000 live births, with commensurate
levels of under‐five mortality.
Trends in Life Expectancy
LE increased to the mid‐70s (years) in males and late 70s (years) in females by 2010, with no
apparent plateau.
Data Sources and Quality
Although not explicitly stated it is likely that all mortality data from French Polynesia emanates from
accurate vital registration.
Comments
There have been substantial falls in infant and under‐five mortality to levels comparable to
developed countries. Progressive increases have occurred in life expectancy into the 70s for males
and females, although LE remains lower than for developed countries, including France.
‐ 20 ‐
French Polynesia
Infant Mortality Under‐Five Mortality
Life Expectancy; French Polynesia
Key SPC: Secretariat of the Pacific Community WHO: World Health Organisation
ISPF: Institut de la Statistique de la Polynésie Française
0
10
20
30
40
50
60
Per 1,000 live births
Period (year)
SPC
ISPF
Exponential
0
10
20
30
40
50
60
Period (year)
WHO
40
50
60
70
80
Years
Period (year)
SPC
ISPF
Male
Quadratic
40
50
60
70
80
Period (year)
SPC
ISPF
Female
Quadratic
‐ 21 ‐
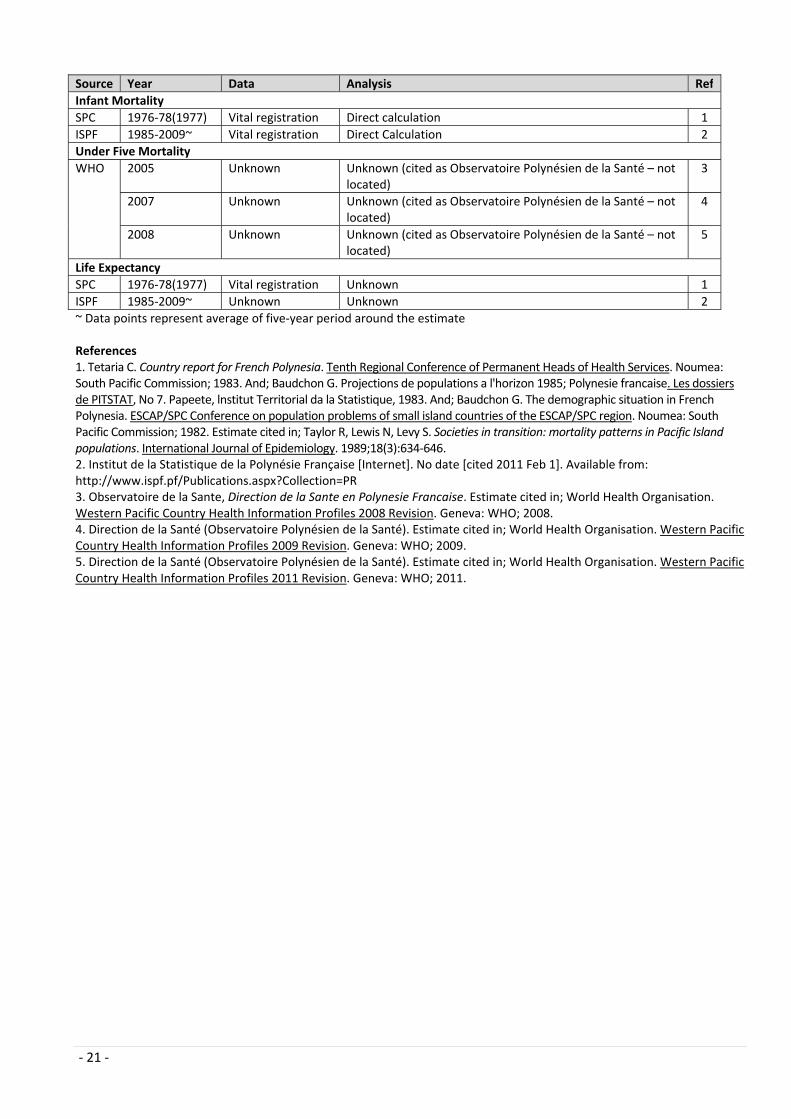
Source Year Data Analysis Ref
Infant Mortality
SPC 1976‐78(1977) Vital registration Direct calculation 1
ISPF 1985‐2009~ Vital registration Direct Calculation 2
Under Five Mortality
WHO 2005 Unknown Unknown (cited as Observatoire Polynésien de la Santé – notlocated)
3
2007 Unknown Unknown (cited as Observatoire Polynésien de la Santé – notlocated)
4
2008 Unknown Unknown (cited as Observatoire Polynésien de la Santé – not located)
5
Life Expectancy
SPC 1976‐78(1977) Vital registration Unknown 1
ISPF 1985‐2009~ Unknown Unknown 2
~ Data points represent average of five‐year period around the estimate References 1. Tetaria C. Country report for French Polynesia. Tenth Regional Conference of Permanent Heads of Health Services. Noumea: South Pacific Commission; 1983. And; Baudchon G. Projections de populations a l'horizon 1985; Polynesie francaise. Les dossiers de PITSTAT, No 7. Papeete, lnstitut Territorial da la Statistique, 1983. And; Baudchon G. The demographic situation in French Polynesia. ESCAP/SPC Conference on population problems of small island countries of the ESCAP/SPC region. Noumea: South Pacific Commission; 1982. Estimate cited in; Taylor R, Lewis N, Levy S. Societies in transition: mortality patterns in Pacific Island populations. International Journal of Epidemiology. 1989;18(3):634‐646. 2. Institut de la Statistique de la Polynésie Française [Internet]. No date [cited 2011 Feb 1]. Available from: http://www.ispf.pf/Publications.aspx?Collection=PR 3. Observatoire de la Sante, Direction de la Sante en Polynesie Francaise. Estimate cited in; World Health Organisation. Western Pacific Country Health Information Profiles 2008 Revision. Geneva: WHO; 2008. 4. Direction de la Santé (Observatoire Polynésien de la Santé). Estimate cited in; World Health Organisation. Western Pacific Country Health Information Profiles 2009 Revision. Geneva: WHO; 2009. 5. Direction de la Santé (Observatoire Polynésien de la Santé). Estimate cited in; World Health Organisation. Western Pacific Country Health Information Profiles 2011 Revision. Geneva: WHO; 2011.
‐ 22 ‐
5.GuamLand area (Km2) 541 2013‐mid‐year population estimate 174,900 Population growth rate (%) 0.3
[Source: SPC Pocket Summary 2013]
Trends in Child Mortality
Infant mortality reached below 10 deaths per 1000 live births by 2000, however, trends in the most
recent decade suggest a sustained increase.
Trends in Life Expectancy
Increasing trends in LE to the mid‐70s (years) for males and early 80s (years) for females by 2010,
with no apparent plateaux.
Data Sources and Quality
1. LE estimates may be artificially inflated by the considerable and mobile military population of
healthy younger adults
2. No empirical data on U5MR in Guam was available, and projected estimates have been excluded.
Comments
Low infant mortality and increasing LE are comparable with developed country levels, although
differences in estimates by source are evident. Further review of infant and child mortality levels
should be encouraged given the data gaps and potential shift in IMR trends over the previous decade.

‐ 23 ‐
Guam
Infant Mortality
Life Expectancy; Guam
Key SPC: Secretariat of the Pacific Community WHO: World Health Organisation
DoPH: Department of Public Health and Social Services
0
10
20
30
40
50
60
Per 1,000 live births
Period (year)
DoPH
SPC
WHO
Exponential
40
50
60
70
80
Years
Period (year)
SPC
DoPH
Male
Exponential
40
50
60
70
80
Period (year)
SPC
DoPH
Female
Exponential

‐ 24 ‐
Source Year Data Analysis Ref
Infant Mortality
DoPH 1991‐2011* Vital registration Direct calculation 1,2
SPC 1979‐81(1980) Vital registration Direct calculation 3
WHO 2008 Unknown Unknown (cited as US Census Bureau – not located)
4
Life Expectancy
SPC 1979‐81(1980) Vital registration Unknown 3
1990 Unknown Unknown 5
2000 Vital registration Unknown 6
DoPH 2000‐08* Unknown Unknown 7
* Data points represent average of three‐year period around the estimate References 1. Office of Vital Statistics, Department of Public Health and Social Services, Government of Guam. Estimate cited in; Bureau of Statistics and Plans. 2004 Guam Statistical Yearbook. Hagatna, Guam; 2005. 2. Office of Vital Statistics, Department of Public Health and Social Services, Government of Guam. Estimate cited in; Bureau of Statistics and Plans. Guam Statistical Yearbook 2011. Hagatna, Guam; 2012. 3. Tung, Shui‐Liang. The demographic situation in Guam. Carolina Population Centre Paper, No 21. Chapel Hill, University of North Carolina Population Centre, 1982. And; Taylor R. Review of the Epidemiological and Health Information Services in Guam. Noumea: South Pacific Commission; 1985. Estimate cited in; Taylor R, Lewis N, Levy S. Societies in transition: mortality patterns in Pacific Island populations. International Journal of Epidemiology. 1989;18(3):634‐646. 4. US Census Bureau. Estimate cited in; World Health Organisation. Western Pacific Country Health Information Profiles 2009 Revision. Geneva: WHO; 2009. 5. Secretariat of the Pacific Community. Pacific Islands population data sheet. Complied by the Population and Demography Programme. Noumea, SPC, 1999. Estimate cited in; Taylor R, Lopez A. Differential mortality among Pacific Island countries and territories. Asia‐Pacific Population Journal. 2007;22(3):45‐58. 6. Secretariat of the Pacific Community. Table 7: Recent developments in fertility and mortality [Internet]. 2010 [cited 2012 Feb 5]. Available from: http://www.spc.int/sdp/index.php?option=com_docman&task=cat_view&gid=28&dir 7. International database, international programmes centre, U.S Census Bureau. Estimate cited in; Bureau of Statistics and Plans. Guam Statistical Yearbook 2008. Hagatna, Guam; 2009.
‐ 25 ‐
6.KiribatiLand area (Km2) 811 2013‐mid‐year population estimate 108,800 Population growth rate (%) 2.2
[Source: SPC Pocket Summary 2013]
Trends in Child Mortality
Trends in infant and under‐five mortality are declining, but still unacceptably high with infant
mortality over 40 deaths per 1000 live births in 2010.
Trends in Life Expectancy
LE reached a plateau from the 1990s at 60 (years) in males and 65 (years) in females, with no
subsequent increase.
Data Sources and Quality
Registration of vital events, including deaths, in Kiribati is considered to be incomplete and indirect
demographic estimation techniques are used for estimation of mortality and LE.
Comments
There is evidence of reductions in infant and under‐five mortality, but rates remain high in relation
to most other Pacific Island states. In the context of declining under‐five mortality, the lack of
further improvements in LE over the same period imply increasing premature adult mortality.

‐ 26 ‐
Kiribati
Infant Mortality Under‐Five Mortality
Life Expectancy; Kiribati
Key SPC: Secretariat of the Pacific Community UNIGME: United Nations Inter‐agency Group for Child Mortality Estimation
KNSO: Kiribati National Statistics Office WHO: World Health Organisation GBD: Global Burden of Disease Study
0
10
20
30
40
50
60
70
80
90
100
Per 1,000 live births
Period (year)
Census
UNIGME
DHS
GBD
Exponential
0
10
20
30
40
50
60
70
80
90
100
Period (year)
Census
UNIGME
GBD
Exponential
40
50
60
70
80
Years
Period (year)
KNSO
SPC
Census
GBD
Male
Quadratic
40
50
60
70
80
Period (year)
KNSO
SPC
Census
GBD
Female
Quadratic
UNIGME and GBD estimates are not included in the trendlines as they are not a primary source of data ‐ they are for comparison purposes only.

‐ 27 ‐
Source Year Data Analysis Ref
Infant Mortality
Census 1973‐78 (1976); 1978‐85 (1882); 1985‐90 (1988)
Census CEBCS and adult survivorship data from paternal orphanhood method used to impute a model life table
1
1995 Census CEBCS using MORTPAK3.0 2
2003; 2010 Census CEBCS used to impute a model life table (UN Far East Asian) using MORTPAK4.1
3,4
DHS 1995‐2009~ Survey Retrospective maternal history 5
UNIGME 1990; 2012 UNIGME Projection (see UNIGME methodology page 3) 6
GBD 2013 GBD Modelled data (see reference) – added early neonatal mortality, late neonatal mortality, and post neonatal infant mortality.
10
Under Five Mortality
Census 2003 Census CEBCS used to impute a model life table (UN Far East Asian) using MORTPAK4.1
3
2010 Census CEBCS used to impute a model life table (UN Far East Asian) using MORTPAK4.1
4
DHS 1995‐2009~ Survey Retrospective maternal history 5
UNIGME 1990; 2000; 2012 UNIGME Projection (see UNIGME methodology page 3) 6
GBD 2013 GBD Modelled data (see reference) 10
Life Expectancy
KNSO 2000 Unknown Unknown 7
SPC 1992 Unknown Unknown 8
2000 Unknown Unknown 9
Census 1973‐78 (1976); 1978‐85 (1982); 1985‐90 (1988)
Census CEBCS and adult survivorship data from paternal orphanhood method used to impute a model life table
1
1995 Census CEBCS and adult survivorship data from paternal orphanhood method used to impute a model life table (Coale/Demeny West)
2
2003; 2010 Census CEBCS used to impute model life tables (UN Far East Asian) using MORTPAK4.1
3,4
GBD 1970; 1980; 1990; 2000; 2010
GBD Modelled data (see reference) 11
~ Data points represent average of five‐year period around the estimate References 1. Kiribati National Statistics Office. Social statistics – demographic indicators. Key demographic indicators from Census of population and housing [Internet]. 2006 [cited 2012 Oct 2]. Available from: http://www.spc.int/prism/country/ki/stats/Social/demo_rates.htm 2. Demmke A, Haberkorn G, Rakaseta VL, Lepers C, Beccalossi G. Kiribati Population Profile based on the 1995 Census. Noumea; Secretariat of the Pacific Community: 1998. 3. Secretariat of the Pacific Community. Kiribati 2005 Census, volume 2: analytic report. SPC; 2007 Jan. 4. Kiribati National Statistics Office. & the SPC Statistics for Development Programme. Kiribati 2010 Census. Volume 2: Analytic Report. Noumea; 2012. 5. Kiribati National Statistics Office and the Secretariat of the Pacific Community. Kiribati Demographic and Health Survey 2009. Noumea; Secretariat of the Pacific Community: 2010 Dec. 6. The United Nations Inter‐agency Group for Child Mortality Estimation (UNIGME). Levels and trends in child mortality: Report 2013. The United Nations Children’s Fund; 2013. 7. Kiribati National Statistics Office. Key Statistics spreadsheet ‐ Health Indicators [Internet]. 2006 [cited 2008 Mar 2]. Available from: http://www.spc.int/prism/country/ki/Stats/index.htm 8. Secretariat of the Pacific Community 1999, Pacific Island Populations Data Sheet, Compiled by the Population/Demography Programme. Nouméa: SPC. 9. Secretariat of the Pacific Community, 2004. Pacific Island Populations 2004 (in print). Noumea, SPC. 10. Wang H, Liddell CA, Coates MM, Mooney M ,Levitz CE, Schumacher AE, et al. Global, regional, and national levels of neonatal, infant, and under‐5 mortality during 1990–2013: a systematic analysis for the Global Burden of Disease Study 2013. Lancet. Published Online. May 2, 2014. http://dx.doi.org/10.1016/S0140‐6736(14)60497‐9. 11. Wang H, Dwyer‐Lindgren L, Lofgren KT, Knoll Rajaratnam J, Marcus JR, Levin‐Rector A et al. Age‐specific and sex‐specific mortality in 187 countries, 1970‐2010: a systematic analysis for the Global Burden of Disease Study 2010. Lancet. 380:2071‐94; 2012.

‐ 28 ‐
7.MarshallIslands, Republicofthe(RMI)
Land area (Km2) 181 2013‐mid‐year population estimate 54,200 Population growth rate (%) 0.4
[Source: SPC Pocket Summary 2013]
Trends in Child Mortality
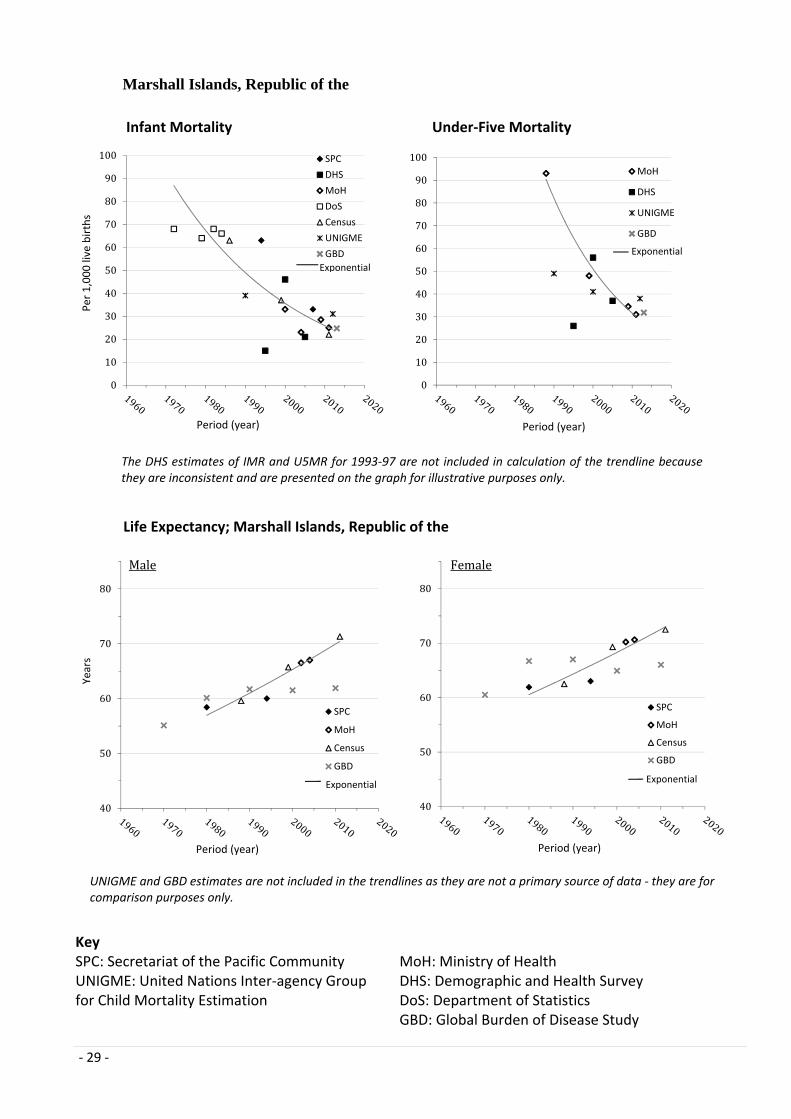
There has been a significant reduction in infant mortality to below 30 deaths per 1000 live births by
2010. Under‐5 mortality has declined even more rapidly.
Trends in Life Expectancy
Trends show a sustained increase in LE to around 70 (years) in males and females.
Data Sources and Quality
There is limited routine death registration data available, although some infant and under‐five
mortality estimations are based on vital registration of deaths and births. Further review of data is
required to assess completeness.
Comments
Infant and under‐five mortality have declined, but further reductions are required to bring the infant
mortality rate below 20 and the under‐five mortality rate below 30 deaths per 1000 live births. LE
appears to be increasing, but life tables for the most recent estimates have been imputed from
mortality for children aged <2 from data produced through indirect demographic methods (CEBCS),
and may therefore underestimate adult premature mortality. Gains in LE may be starting to level off,
especially in females, and should be further investigated.
‐ 29 ‐
Marshall Islands, Republic of the
Infant Mortality Under‐Five Mortality
Life Expectancy; Marshall Islands, Republic of the
Key SPC: Secretariat of the Pacific Community UNIGME: United Nations Inter‐agency Group for Child Mortality Estimation
MoH: Ministry of Health DHS: Demographic and Health Survey DoS: Department of Statistics GBD: Global Burden of Disease Study
0
10
20
30
40
50
60
70
80
90
100
Per 1,000 live births
Period (year)
SPC
DHS
MoH
DoS
Census
UNIGME
GBD
Exponential
0
10
20
30
40
50
60
70
80
90
100
Period (year)
MoH
DHS
UNIGME
GBD
Exponential
40
50
60
70
80
Years
Period (year)
SPC
MoH
Census
GBD
Male
Exponential
40
50
60
70
80
Period (year)
SPC
MoH
Census
GBD
Female
Exponential
The DHS estimates of IMR and U5MR for 1993‐97 are not included in calculation of the trendline because they are inconsistent and are presented on the graph for illustrative purposes only.
UNIGME and GBD estimates are not included in the trendlines as they are not a primary source of data ‐ they are for comparison purposes only.

‐ 30 ‐
Source Year Data Analysis Ref
Infant Mortality
SPC 1994 Unknown Child mortality data used to impute a model life table
1
2007 Unknown Unknown 2
DHS 1993‐2007~ Survey Retrospective maternal history 3
MoH 2000; 2004; 2008‐09 (2009); 2010‐11 (2011)
Vital registration
Direct calculation 4,5
DoS 1972; 1979; 1982; 1984 Vital registration
Direct calculation 6
Census 1986; 1999 Census CEBCS data used to impute a model life table (Coale/Demeny West)
7,8
2011 Census <2 mortality CEBCS data used to impute model life tables (Coale/Demeny West)
9
UNIGME 1990; 2012 UNIGME UNIGME methodology (see page 3) 10
GBD 2013 GBD Modelled data (see reference) – added early neonatal mortality, late neonatal mortality, and post neonatal infant mortality.
14
Under Five Mortality
MoH 1988; 1999; 2008‐09 (2009); 2010‐11 (2011)
Vital registration
Direct calculation 5, 11
DHS 1993‐2007~ Survey Retrospective maternal history 3
UNIGME 1990; 2000; 2012 UNIGME UNIGME methodology (see page 3) 10
GBD 2013 GBD Modelled data (see reference) 14
Life Expectancy
SPC 1979‐81 (1980) Vital registration
Unknown (data adjusted for underreporting) 12
1994 Unknown Child mortality data used to impute model life tables
1
MoH 2002; 2004 Unknown Unknown 13
Census 1988; 1999 Census CEBCS and adult survivorship data from paternal orphanhood method used to impute model life tables (Coale/Demeny West)
7,8
2011 Census Mortality in children aged <2 years from CEBCS data used to impute model life tables (Coale/Demeny West)
9
GBD 1970; 1980; 1990; 2000; 2010
GBD Modelled data (see reference) 15
~ Data points represent average of five‐year period around the estimate
‐ 31 ‐
References 1. South Pacific Commission. South Pacific Commission 1998. Pacific Island Populations ‐ Revised edition. Report prepared by the South Pacific Commission for the International Conference on Population and Development 1994: Cairo, Egypt. SPC, Noumea. Estimate cited in; Taylor R, Lopez A. Differential mortality among Pacific Island countries and territories. Asia‐Pacific Population Journal. 2007;22(3):45‐58. 2. Secretariat of the Pacific Community. South‐South cooperation among Pacific island countries ‐a regional overview [Internet]. 2010 [cited 2010 Dec 17]. Available from: http://www.unicef.org/eapro/South‐South_Cooperation_among_Pacific__island_countries_‐_a_regional_overview_‐_November_2011.pdf 3. Economic Policy, Planning and Statistics Office (EPPSO) Marshall Islands, Secretariat of the Pacific Community and Macro International Inc. Republic of the Marshall Islands Demographic and Health Survey 2007. Noumea: SPC; 2008. 4. Ministry of Health. Annual Report 2004 [Internet]. No date [cited 2012 Oct 5]. Available from: http://www.rmiembassyus.org/Health/RMI%20MOH%20Annual%20Report%20FY%202004.pdf 5. Ministry of Health, Republic of the Marshall Islands. Annual Report FY 2011 [Internet]. No date [cited 2014 Jan 10]. Available from: http://www.spc.int/nmdi/nmdi_documents/RMIFY2011AnnualHealthDataReportFinal.pdf 6. Economic policy, planning and statistics office. Republic of the Marshall Islands Statistical Abstract 2001. No date. 7. Office of Planning and Statistics. Republic of the Marshall Islands. Census of Population and Housing 1988 Final Report. Majuro, Marshall Islands: Office of Planning and Statistics; no date. 8. Office of Planning and Statistics. Republic of the Marshall Islands. Census of Population and Housing 1998 Final Report. Majuro, Marshall Islands: Office of Planning and Statistics. 9. Economic Policy, Planning and Statistics Office, Republic of the Marshall Islands, and the Secretariat of the Pacific Community (SPC) Statistics for Development Programme. Report of the Marshall Islands 2011 Census Report. Noumea: SPC; 2012. 10. The United Nations Inter‐agency Group for Child Mortality Estimation (UNIGME). Levels and trends in child mortality: Report 2013. The United Nations Children’s Fund; 2013. 11. Bureau of Health Planning and Statistics, Ministry of Health. Statistical abstract 1999‐2001. Majuro, Marshall Islands. 12. Taylor R, Lewis N, Levy S. Societies in transition: mortality patterns in Pacific Island populations. International Journal of Epidemiology. 1989;18(3):634‐646. 13. Economic Policy, Planning and Statistics Office. Estimate cited in; Ministry of Health. Annual Report 2004 [Internet]. No date [cited 2012 Oct 5]. Available from:http://www.rmiembassyus.org/Health/RMI%20MOH%20Annual%20Report%20FY%202004.pdf 14. Wang H, Liddell CA, Coates MM, Mooney M ,Levitz CE, Schumacher AE, et al. Global, regional, and national levels of neonatal, infant, and under‐5 mortality during 1990–2013: a systematic analysis for the Global Burden of Disease Study 2013. Lancet. Published Online. May 2, 2014. http://dx.doi.org/10.1016/S0140‐6736(14)60497‐9. 15. Wang H, Dwyer‐Lindgren L, Lofgren KT, Knoll Rajaratnam J, Marcus JR, Levin‐Rector A et al. Age‐specific and sex‐specific mortality in 187 countries, 1970‐2010: a systematic analysis for the Global Burden of Disease Study 2010. Lancet. 380:2071‐94; 2012.
‐ 32 ‐
8.Micronesia,FederatedStatesof(FSM)Land area (Km2) 701 2013‐mid‐year population estimate 103,000 Population growth rate (%) 0.3
[Source: SPC Pocket Summary 2013]
Trends in Child Mortality
Infant mortality has declined, although is still around 30 deaths per 1000 live births for the latest
estimate, with a commensurate trend in plausible under‐five mortality.
Trends in Life Expectancy
There is limited data available on LE, and while this has increased over the period reviewed, these
gains appear to have started to level off from 2000 in the late 60s (years) in males and the early 70s
(years) in females.
Data Sources and Quality
1. Direct and indirect demographic estimation techniques are predominantly used for estimation of
mortality and LE.
2. The most recent Census estimates use a single input parameter (child mortality for under 2 year
olds) and is therefore likely to underestimate adult mortality based on experience elsewhere in the
Pacific.
3. Vital registration data may be incomplete, and is therefore not currently used for the calculation
of LE.
Comments
Sustained decreases in infant and under‐five mortality are evident, but further reductions are
required to bring the infant mortality rate below 20 and the under‐five mortality rate below 30
deaths per 1000 live births. LE in both sexes has flattened since 2000 at levels from which further
improvement should be expected. Since LE is derived from life tables imputed from a single input
parameter using indirect demographic methods (CEBCS) they may underestimate premature adult
mortality. Flattening of LE in the context of declining under‐five mortality implies increasing
premature adult mortality, which may be associated with non‐communicable disease.

‐ 33 ‐
Micronesia, Federated States of
Infant Mortality Under‐Five Mortality
Life Expectancy; Micronesia, Federated States of
Key SPC: Secretariat of the Pacific Community GBD: Global Burden of Disease Study
UNIGME: United Nations Inter‐agency Group for Child Mortality Estimation
0
10
20
30
40
50
60
70
80
Per 1,000 live births
Period (year)
SPC
Census
UNIGME
GBDExponential
0
10
20
30
40
50
60
70
80
Period (year)
Census
UNIGME
GBD
Exponential
40
50
60
70
80
Years
Period (year)
SPC
Census
GBD
Male
Quadratic
40
50
60
70
80
Period (year)
SPC
Census
GBD
Female
Quadratic
UNIGME and GBD estimates are not included in the trendlines as they are not a primary source of data ‐ they are for comparison purposes only.

‐ 34 ‐
Source Year Data Analysis Ref
Infant Mortality
SPC 1979‐81 (1980) Vital registration (adjusted)
Unknown 1
Census 1969; 1976; 1990; 1996; 2010
Census CEBCS data used to impute a model life table (Coale/Demeny West)
2,3
UNIGME 1990; 2012 UNIGME Projection (see UNIGME methodology page 3) 4
GBD 2013 GBD Modelled data (see reference) – added early neonatal mortality, late neonatal mortality, and post neonatal infant mortality.
6
Under Five Mortality
Census 1991‐92 (1992); 1997‐98 (1998); 2010
Census CEBCS data used to impute a model life table (Coale/Demeny West)
2,3,5
UNIGME 1990; 2000; 2012 UNIGME Projection (see UNIGME methodology page 3) 4
GBD 2013 GBD Modelled data (see reference) 6
Life Expectancy
SPC 1979‐81 (1980) Death recording Health Department (adjusted)
Unknown 1
Census 1969; 1976; 1991‐92 (1992); 1997‐98 (1998); 2010
Census CEBCS data used to impute model life tables (Coale/Demeny West)
2,3,5
GBD 1970; 1980; 1990; 2000; 2010
GBD Modelled data (see reference) 7
References 1. Pretrick E. Country statement for the Federated States of Micronesia. Working paper 17. Tenth Regional Conference of Permanent Heads of Health Services. Noumea; South Pacific Commission: 1983. And; Health Planning and Development Agency, Trust Territory of the Pacific Islands. Five Year Comprehensive Health Plan. Siapan, TTP1, 1980. And; Department of State, USA. Annual Report to the United Nations on the administration of the Pacific Islands 34, 1981; 35,1982; 36, 1983. Estimate cited in; Taylor R, Lewis N, Levy S. Societies in transition: mortality patterns in Pacific Island populations. International Journal of Epidemiology. 1989;18(3):634‐646. 2. Division of Statistics, Department of Economic Affairs, FSM National Government. Federated States of Micronesia 2000 population and housing Census report. Pohnpei: FSM National Government; 2002 May. 3. Division of Statistics, FSM Office of Statistics, Budget, Overseas Development Assistance and Compact Management. FSM 2010 Census of Population and Housing. [provisional report]. 4. The United Nations Inter‐agency Group for Child Mortality Estimation (UNIGME). Levels and trends in child mortality: Report 2013. The United Nations Children’s Fund; 2013. 5. Federated States of Micronesia Division of Statistics. Federated States of Micronesia 1994 Population and Housing Census. FSM Office of Planning and Statistics; 1996. 6. Wang H, Liddell CA, Coates MM, Mooney M ,Levitz CE, Schumacher AE, et al. Global, regional, and national levels of neonatal, infant, and under‐5 mortality during 1990–2013: a systematic analysis for the Global Burden of Disease Study 2013. Lancet. Published Online. May 2, 2014. http://dx.doi.org/10.1016/S0140‐6736(14)60497‐9. 7. Wang H, Dwyer‐Lindgren L, Lofgren KT, Knoll Rajaratnam J, Marcus JR, Levin‐Rector A et al. Age‐specific and sex‐specific mortality in 187 countries, 1970‐2010: a systematic analysis for the Global Burden of Disease Study 2010. Lancet. 380:2071‐94; 2012.

‐ 35 ‐
9.NauruLand area (Km2) 21 2013‐mid‐year population estimate 10,500 Population growth rate (%) 1.8
[Source: SPC Pocket Summary 2013]
Trends in Child Mortality
Infant and under‐five mortality are relatively high with no clear trend. Some under‐five mortality
values are lower than infant mortality, and are thus implausible.
Trends in Life Expectancy
LE is low at around the mid‐50s (years) for males and around 60 (years) for females in 2010, without
any clear evidence of improvement over recent decades.
Data Sources and Quality
1. Mortality rates and estimates of LE are likely to be affected by small numbers, producing stochastic
variation over time.
2. Mortality data and populations are for Nauruans only.
Comments
There are no clear trends in infant or under‐five mortality which remain at high levels requiring
further improvement. Very low life expectancies are demonstrated in males (mid 50s) and females
(around 60 yrs). The latest female life expectancy estimate is higher than the trend line, and
suggests that while LE is stable rather than declining. Further investigation of cause of death by age
and sex is required to better understand the reasons for such high premature mortality.

‐ 36 ‐
Nauru
Infant Mortality Under‐Five Mortality
Life Expectancy; Nauru
Key SPC: Secretariat of the Pacific Community DHS: Demographic and Health Survey Other: other source noted in reference list
UNIGME: United Nations Inter‐agency Group for Child Mortality Estimation
0
10
20
30
40
50
60
Per 1,000 live births
Period (year)
DHS
SPC
Census
UNIGME0
10
20
30
40
50
60
Period (year)
DHS
Other
Census
UNIGME
40
50
60
70
80
Years
Period (year)
Other
SPC
Census
Male
Quadratic (twoptavg)
40
50
60
70
80
Period (year)
Other
SPC
Census
Female
Quadratic (two pt avg)
UNIGME estimates are not included in the trendline as they are not a primary source of data ‐ they are for comparison purposes only. The DHS estimates of IMR and U5MR for 1993‐97 are not included in calculation of the trendline because they are inconsistent and are presented on the graph for illustrative purposes only.
‐ 37 ‐
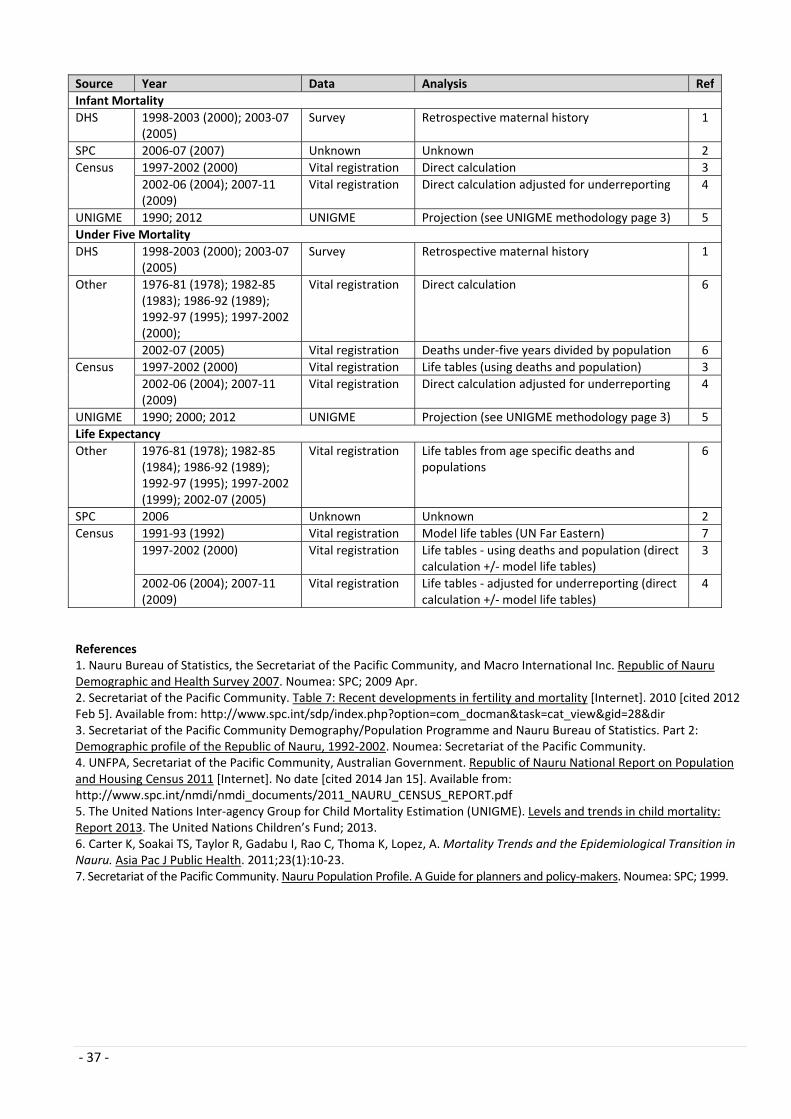
Source Year Data Analysis Ref
Infant Mortality
DHS 1998‐2003 (2000); 2003‐07 (2005)
Survey Retrospective maternal history 1
SPC 2006‐07 (2007) Unknown Unknown 2
Census 1997‐2002 (2000) Vital registration Direct calculation 3
2002‐06 (2004); 2007‐11 (2009)
Vital registration Direct calculation adjusted for underreporting 4
UNIGME 1990; 2012 UNIGME Projection (see UNIGME methodology page 3) 5
Under Five Mortality
DHS 1998‐2003 (2000); 2003‐07 (2005)
Survey Retrospective maternal history 1
Other
1976‐81 (1978); 1982‐85 (1983); 1986‐92 (1989); 1992‐97 (1995); 1997‐2002 (2000);
Vital registration Direct calculation 6
2002‐07 (2005) Vital registration Deaths under‐five years divided by population 6
Census 1997‐2002 (2000) Vital registration Life tables (using deaths and population) 3
2002‐06 (2004); 2007‐11 (2009)
Vital registration Direct calculation adjusted for underreporting 4
UNIGME 1990; 2000; 2012 UNIGME Projection (see UNIGME methodology page 3) 5
Life Expectancy
Other
1976‐81 (1978); 1982‐85 (1984); 1986‐92 (1989); 1992‐97 (1995); 1997‐2002 (1999); 2002‐07 (2005)
Vital registration Life tables from age specific deaths and populations
6
SPC 2006 Unknown Unknown 2
Census 1991‐93 (1992) Vital registration Model life tables (UN Far Eastern) 7
1997‐2002 (2000) Vital registration Life tables ‐ using deaths and population (direct calculation +/‐ model life tables)
3
2002‐06 (2004); 2007‐11 (2009)
Vital registration Life tables ‐ adjusted for underreporting (direct calculation +/‐ model life tables)
4
References 1. Nauru Bureau of Statistics, the Secretariat of the Pacific Community, and Macro International Inc. Republic of Nauru Demographic and Health Survey 2007. Noumea: SPC; 2009 Apr. 2. Secretariat of the Pacific Community. Table 7: Recent developments in fertility and mortality [Internet]. 2010 [cited 2012 Feb 5]. Available from: http://www.spc.int/sdp/index.php?option=com_docman&task=cat_view&gid=28&dir 3. Secretariat of the Pacific Community Demography/Population Programme and Nauru Bureau of Statistics. Part 2: Demographic profile of the Republic of Nauru, 1992‐2002. Noumea: Secretariat of the Pacific Community. 4. UNFPA, Secretariat of the Pacific Community, Australian Government. Republic of Nauru National Report on Population and Housing Census 2011 [Internet]. No date [cited 2014 Jan 15]. Available from: http://www.spc.int/nmdi/nmdi_documents/2011_NAURU_CENSUS_REPORT.pdf 5. The United Nations Inter‐agency Group for Child Mortality Estimation (UNIGME). Levels and trends in child mortality: Report 2013. The United Nations Children’s Fund; 2013. 6. Carter K, Soakai TS, Taylor R, Gadabu I, Rao C, Thoma K, Lopez, A. Mortality Trends and the Epidemiological Transition in Nauru. Asia Pac J Public Health. 2011;23(1):10‐23. 7. Secretariat of the Pacific Community. Nauru Population Profile. A Guide for planners and policy‐makers. Noumea: SPC; 1999.
‐ 38 ‐
10.NewCaledoniaLand area (Km2) 18,576 2013‐mid‐year population estimate 259,000 Population growth rate (%) 1.9
[Source: SPC Pocket Summary 2013]
Trends in Child Mortality
Trends in infant mortality have declined significantly to around 5 deaths per 1000 live births from
2000.
Trends in Life Expectancy
There have been sustained increases in LE to the mid‐70s (years) in males and to 80 (years) in
females by 2010.
Data Sources and Quality
The civil vital registration system in New Caledonia is considered to be complete.
Comments
Commendable reductions in infant and under‐five mortality to developed country levels are evident.
LE has increased to over 80 years in females and to the mid‐70s in males.

‐ 39 ‐
New Caledonia
Infant Mortality Under‐Five Mortality
Life Expectancy; New Caledonia
Key ISEE: Institut de la Statistique et des Etudes Economiques
0
10
20
30
40
50
60
Per 1,000 live births
Period (year)
ISEE
Exponential
0
10
20
30
40
50
60
Period (year)
ISEE
Exponential
40
50
60
70
80
Years
Period (year)
ISEE
Male
Quadratic
40
50
60
70
80
Period (year)
ISEE
Female
Quadratic
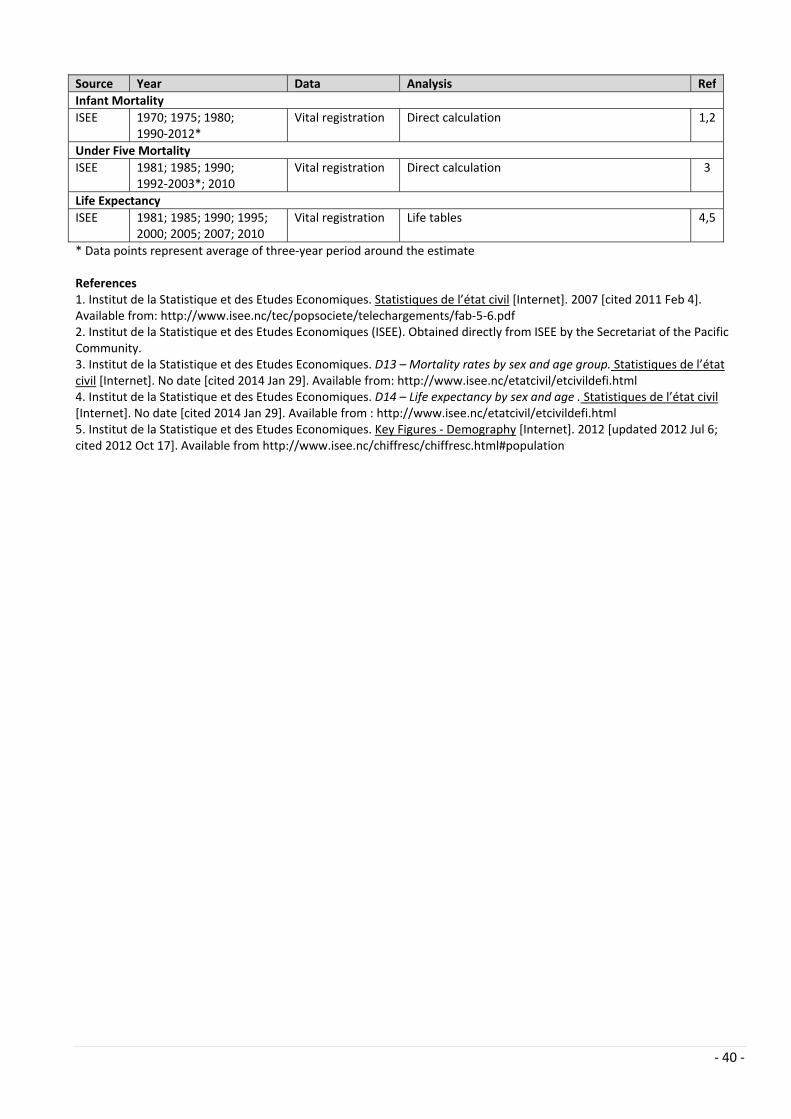
‐ 40 ‐
Source Year Data Analysis Ref
Infant Mortality
ISEE 1970; 1975; 1980; 1990‐2012*
Vital registration Direct calculation 1,2
Under Five Mortality
ISEE 1981; 1985; 1990; 1992‐2003*; 2010
Vital registration Direct calculation 3
Life Expectancy
ISEE 1981; 1985; 1990; 1995; 2000; 2005; 2007; 2010
Vital registration Life tables 4,5
* Data points represent average of three‐year period around the estimate References 1. Institut de la Statistique et des Etudes Economiques. Statistiques de l’état civil [Internet]. 2007 [cited 2011 Feb 4]. Available from: http://www.isee.nc/tec/popsociete/telechargements/fab‐5‐6.pdf 2. Institut de la Statistique et des Etudes Economiques (ISEE). Obtained directly from ISEE by the Secretariat of the Pacific Community. 3. Institut de la Statistique et des Etudes Economiques. D13 – Mortality rates by sex and age group. Statistiques de l’état civil [Internet]. No date [cited 2014 Jan 29]. Available from: http://www.isee.nc/etatcivil/etcivildefi.html 4. Institut de la Statistique et des Etudes Economiques. D14 – Life expectancy by sex and age . Statistiques de l’état civil [Internet]. No date [cited 2014 Jan 29]. Available from : http://www.isee.nc/etatcivil/etcivildefi.html 5. Institut de la Statistique et des Etudes Economiques. Key Figures ‐ Demography [Internet]. 2012 [updated 2012 Jul 6; cited 2012 Oct 17]. Available from http://www.isee.nc/chiffresc/chiffresc.html#population

‐ 41 ‐
11.NiueLand area (Km2) 259 2013‐mid‐year population estimate 1,500 Population growth rate (%) ‐0.2
[Source: SPC Pocket Summary 2013]
Trends in Child Mortality
Infant and under‐five mortality rates are relatively low for the most recent estimates, although clear
trends are difficult to discern due to stochastic variation from small numbers.
Trends in Life Expectancy
Steady increases in life expectancy are shown to around 70 (years) for males and mid‐70s (years) for
females by 2010.
Data Sources and Quality
1. Mortality rates and estimates of LE are likely to be affected by small numbers, producing stochastic
variation over time.
2. Infant mortality rates from the Niue Statistics Division are based on vital registration system, which
is considered fairly complete. However, some mothers travel to New Zealand to give birth, and as this
changes over time according to the medical staff on island, this is likely to account for some of the
higher estimates of infant and child mortality (because of the impact of births missing from
denominators).
3. Some of the differences in reported infant mortality rates between Census reports and the Statistics
Division are due to different denominators; the Statistics Division estimates use births to resident
mothers, whereas Census reports use all registered births.
Comments
Recent trends in infant and under‐five mortality appear satisfactory, however, trends are difficult to
discern because of stochastic variation due to small numbers. LE has increased for males and females,
although remains at levels at which further improvement should be expected. Numbers of deaths are
low in Niue because of the very small population, and mortality and life expectancy should be
aggregated for at least 5‐year intervals and presented with statistical confidence intervals (95%).
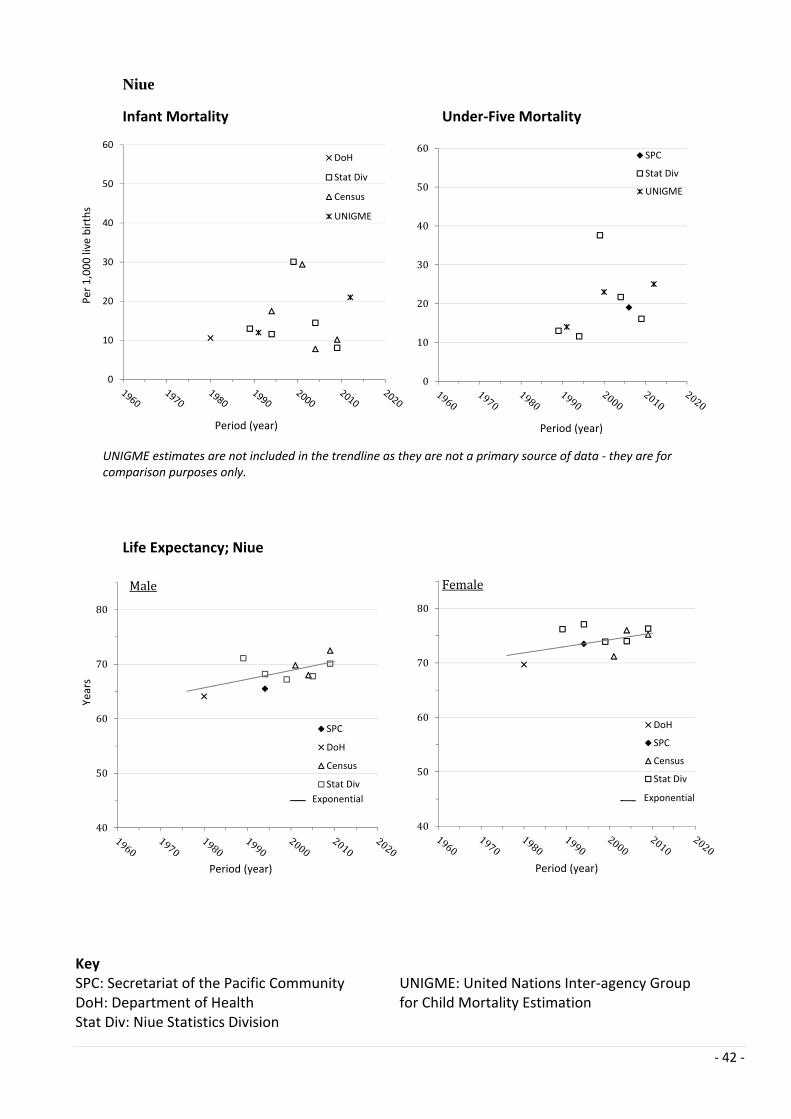
‐ 42 ‐
Niue
Infant Mortality Under‐Five Mortality
Life Expectancy; Niue
Key SPC: Secretariat of the Pacific Community DoH: Department of Health Stat Div: Niue Statistics Division
UNIGME: United Nations Inter‐agency Group for Child Mortality Estimation
0
10
20
30
40
50
60
Per 1,000 live births
Period (year)
DoH
Stat Div
Census
UNIGME
0
10
20
30
40
50
60
Period (year)
SPC
Stat Div
UNIGME
40
50
60
70
80
Years
Period (year)
SPC
DoH
Census
Stat Div
Male
Exponential
40
50
60
70
80
Period (year)
DoH
SPC
Census
Stat Div
Female
Exponential
UNIGME estimates are not included in the trendline as they are not a primary source of data ‐ they are for comparison purposes only.

‐ 43 ‐
Source Year Data Analysis Ref
Infant Mortality
DoH 1978‐82(1980) Vital registration Direct calculation 1
Census 1991‐97(1994) Vital registration Direct calculation 2
2001 Vital registration Direct calculation 3
2001‐06(2004) Vital registration Direct calculation 4
2006‐11(2009) Vital registration Direct calculation 5
Stat Div 1987‐2011~ Vital registration Direct calculation 6
UNIGME 1990; 2012 UNIGME Projection (see UNIGME methodology page 3) 7
Under Five Mortality
SPC 2006 Unknown Unknown 8
Stat Div 1987‐2011~ Vital registration Direct calculation 6
UNIGME 1990; 2000; 2012
UNIGME Projection (see UNIGME methodology page 3) 7
Life Expectancy
DoH 1978‐82(1980) Vital registration Sex‐specific LE estimated from both sexes LE derived from direct calculation
1
SPC 1991‐97(1994) Survey Sex‐specific LE estimated from both sexes LE from the 1997 Census which used CEBCS data to impute Model Life Tables (Coale/Demeny West and UN’s far Eastern model)
9
Census 2001 Unknown Model Life tables 3
2001‐06(2004) Vital registration Age specific death rates used to impute Model Life Tables (Coale/Demeny West) using US Census Bureau PAS software and UN Mortpak4 program
4
2006‐11(2009) Census CEBCS data used to impute Model Life Tables (Coale/Demeny West) using US Census Bureau PAS software and UN Mortpak 4.1 program.
5
Stat Div 1987‐2011~ Vital registration Direct calculation using deaths and populations 6
~ Data points represent average of five‐year period around the estimate References 1. Department of Health Niue. Annual reports 1971‐1982. Niue. Estimate cited in; Taylor R, Nemaia H, Connell J. Mortality in Niue, 1978‐82. NZ Med J. 1987 Aug 12; 100(829):447‐81. 2. Secretariat of the Pacific Community. Niue population profile based on 1997 Census – a guide for planners and policy‐makers. Noumea; 1999. 3. Economic, Planning, Development and Statistics Unit Premiers Department. Niue 2001 Census of Population and Housing. 4. Secretariat of the Pacific Community. Niue population profile based on 2006 Census of population and housing. A guide for planners and policy makers. Noumea; 2008. 5. Statistics Niue, Government of Niue. Niue Census of Population and Households 2011 [Internet]. 2012 [cited 2014 Jan 10]. Available from: http://www.spc.int/prism/niue/index.php/niue‐documents/cat_view/12‐surveys/13‐census/14‐census‐2011 6. Niue Statistics Unit & Statistics for Development, Secretariat of the Pacific Community. Niue Vital Statistics Report: 1987‐2011 [Internet]. No date [cited Jan 14 2014]. Available from: www.spc.int/prism/niue/index.php/niue.../120‐vital‐a‐health‐statistics 7. The United Nations Inter‐agency Group for Child Mortality Estimation (UNIGME). Levels and trends in child mortality: Report 2013. The United Nations Children’s Fund; 2013. 8. Secretariat of the Pacific Community. South‐South cooperation among Pacific island countries ‐a regional overview. High level meeting on cooperation for child rights in the Asia‐Pacific Region. Beijing, China, 4‐6 November 2010 [Internet]. 2010 [cited 2012 Oct 2]. Available from: http://www.unicef.org/eapro/South‐South_Cooperation_among_Pacific__island_countries_‐_a_regional_overview_‐_November_2011.pdf. 9. Secretariat of the Pacific Community. Table 7: Recent developments in fertility and mortality [Internet]. 2010 [cited 2012 Feb 5]. Available from: http://www.spc.int/sdp/index.php?option=com_docman&task=cat_view&gid=28&dir

‐ 44 ‐
12.NorthernMarianaIslands,Commonwealthofthe(CNMI)Land area (Km2) 457 2013‐mid‐year population estimate 55,600 Population growth rate (%) ‐2.5
[Source: SPC Pocket Summary 2013]
Trends in Child Mortality
Infant mortality has declined and stabilised at below 10 deaths per 1000 live births.
Trends in Life Expectancy
Pronounced flattening of LE from the mid‐1990s in the mid‐70s (years) for males and late‐70s (years)
for females is evident.
Data Sources and Quality
1. Mortality and LE are based on vital registration; however, methods of calculation are not given in
any detail. As registration is expected to be complete, it is likely these were derived from direct
calculation.
2. There is only limited published data on under‐five mortality in CNMI available, although with
complete registration, routine publication of this indicator should be encouraged.
Comments
Infant mortality has declined, and infant and under‐five mortality are now at levels comparable to
developed countries. LE trends display distinct plateaux since the mid‐1990s in the mid‐70s for men
and late 70s for women. In the context of the low under‐five mortality these trends would be due to
increasing premature adult mortality, most likely contributed to by non‐communicable disease.
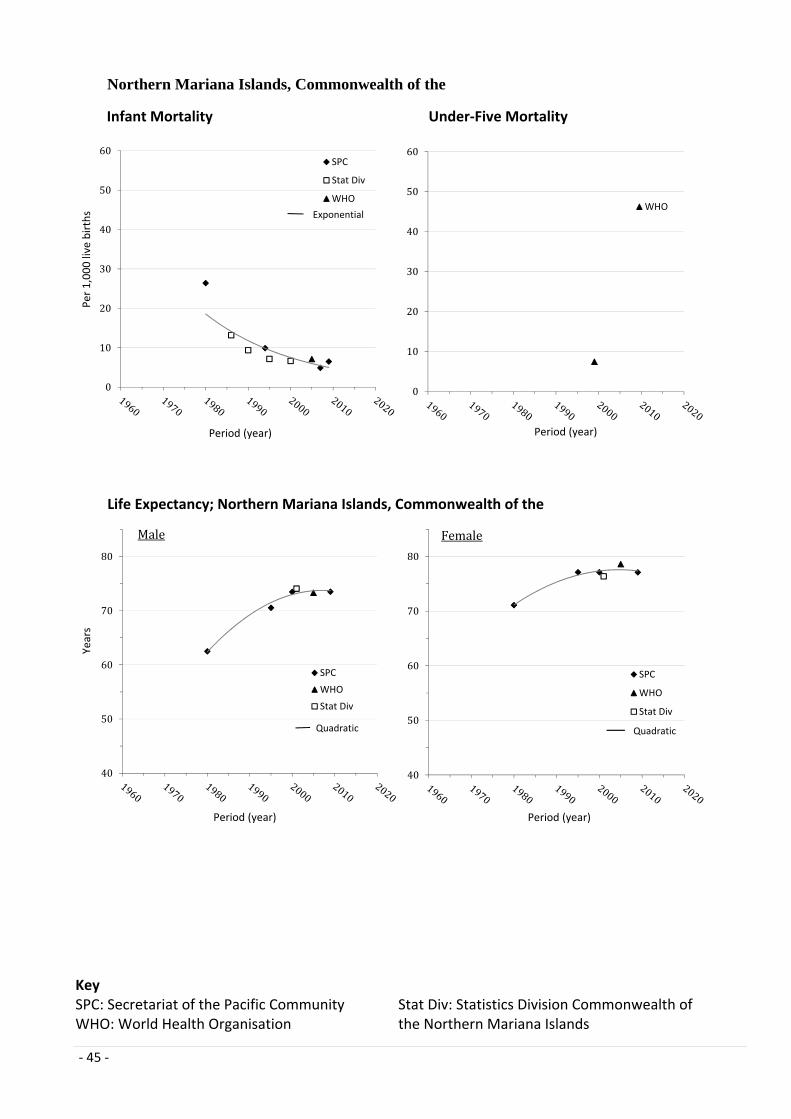
‐ 45 ‐
Northern Mariana Islands, Commonwealth of the
Infant Mortality Under‐Five Mortality
Life Expectancy; Northern Mariana Islands, Commonwealth of the
Key SPC: Secretariat of the Pacific Community WHO: World Health Organisation
Stat Div: Statistics Division Commonwealth of the Northern Mariana Islands
0
10
20
30
40
50
60
Per 1,000 live births
Period (year)
SPC
Stat Div
WHO
Exponential
0
10
20
30
40
50
60
Period (year)
WHO
40
50
60
70
80
Years
Period (year)
SPC
WHO
Stat Div
Male
Quadratic
40
50
60
70
80
Period (year)
SPC
WHO
Stat Div
Female
Quadratic
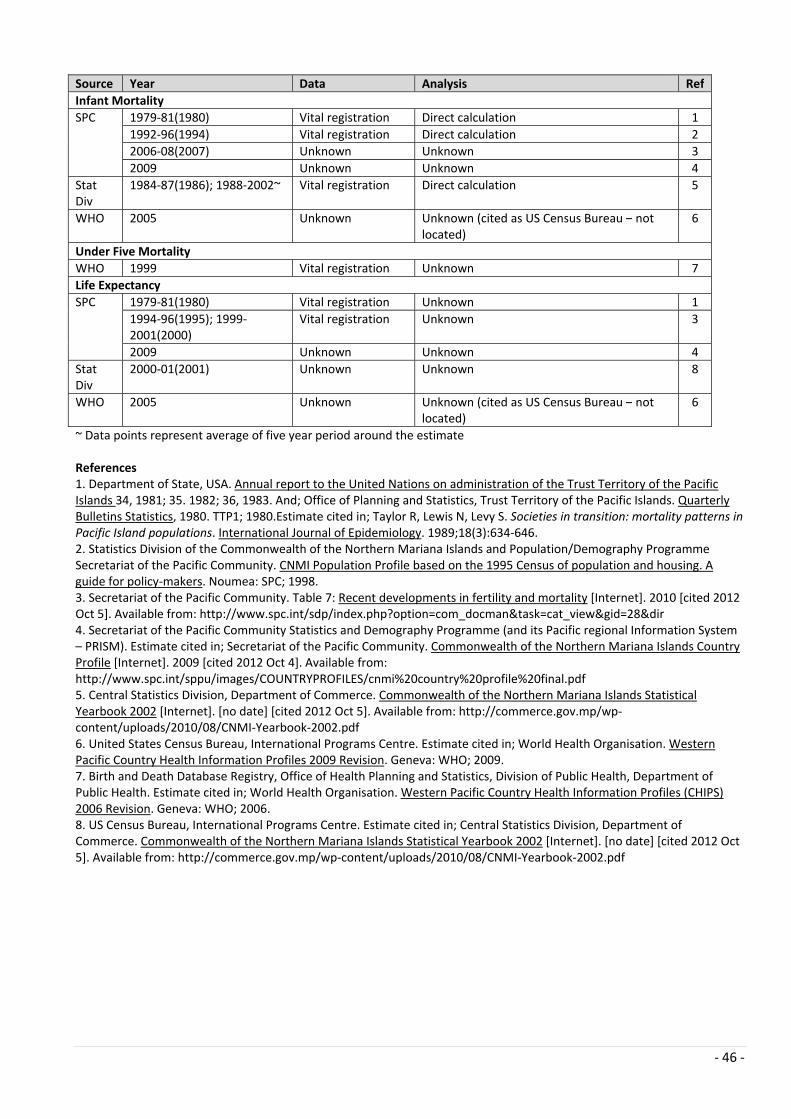
‐ 46 ‐
Source Year Data Analysis Ref
Infant Mortality
SPC 1979‐81(1980) Vital registration Direct calculation 1
1992‐96(1994) Vital registration Direct calculation 2
2006‐08(2007) Unknown Unknown 3
2009 Unknown Unknown 4
Stat Div
1984‐87(1986); 1988‐2002~ Vital registration Direct calculation 5
WHO 2005 Unknown Unknown (cited as US Census Bureau – not located)
6
Under Five Mortality
WHO 1999 Vital registration Unknown 7
Life Expectancy
SPC 1979‐81(1980) Vital registration Unknown 1
1994‐96(1995); 1999‐2001(2000)
Vital registration Unknown 3
2009 Unknown Unknown 4
Stat Div
2000‐01(2001) Unknown Unknown 8
WHO 2005 Unknown Unknown (cited as US Census Bureau – not located)
6
~ Data points represent average of five year period around the estimate References 1. Department of State, USA. Annual report to the United Nations on administration of the Trust Territory of the Pacific Islands 34, 1981; 35. 1982; 36, 1983. And; Office of Planning and Statistics, Trust Territory of the Pacific Islands. Quarterly Bulletins Statistics, 1980. TTP1; 1980.Estimate cited in; Taylor R, Lewis N, Levy S. Societies in transition: mortality patterns in Pacific Island populations. International Journal of Epidemiology. 1989;18(3):634‐646. 2. Statistics Division of the Commonwealth of the Northern Mariana Islands and Population/Demography Programme Secretariat of the Pacific Community. CNMI Population Profile based on the 1995 Census of population and housing. A guide for policy‐makers. Noumea: SPC; 1998. 3. Secretariat of the Pacific Community. Table 7: Recent developments in fertility and mortality [Internet]. 2010 [cited 2012 Oct 5]. Available from: http://www.spc.int/sdp/index.php?option=com_docman&task=cat_view&gid=28&dir 4. Secretariat of the Pacific Community Statistics and Demography Programme (and its Pacific regional Information System – PRISM). Estimate cited in; Secretariat of the Pacific Community. Commonwealth of the Northern Mariana Islands Country Profile [Internet]. 2009 [cited 2012 Oct 4]. Available from: http://www.spc.int/sppu/images/COUNTRYPROFILES/cnmi%20country%20profile%20final.pdf 5. Central Statistics Division, Department of Commerce. Commonwealth of the Northern Mariana Islands Statistical Yearbook 2002 [Internet]. [no date] [cited 2012 Oct 5]. Available from: http://commerce.gov.mp/wp‐content/uploads/2010/08/CNMI‐Yearbook‐2002.pdf 6. United States Census Bureau, International Programs Centre. Estimate cited in; World Health Organisation. Western Pacific Country Health Information Profiles 2009 Revision. Geneva: WHO; 2009. 7. Birth and Death Database Registry, Office of Health Planning and Statistics, Division of Public Health, Department of Public Health. Estimate cited in; World Health Organisation. Western Pacific Country Health Information Profiles (CHIPS) 2006 Revision. Geneva: WHO; 2006. 8. US Census Bureau, International Programs Centre. Estimate cited in; Central Statistics Division, Department of Commerce. Commonwealth of the Northern Mariana Islands Statistical Yearbook 2002 [Internet]. [no date] [cited 2012 Oct 5]. Available from: http://commerce.gov.mp/wp‐content/uploads/2010/08/CNMI‐Yearbook‐2002.pdf

‐ 47 ‐
13.PalauLand area (Km2) 444 2013‐mid‐year population estimate 17,800 Population growth rate (%) ‐1.9
[Source: SPC Pocket Summary 2013]
Trends in Child Mortality
Infant mortality has declined to below 20 deaths per 1000 live births since 2005. Limited data and
stochastic variation make it difficult to identify any clear trends in under‐five mortality.
Trends in Life Expectancy
LE increased to the mid‐60s (years) in males and early 70s (years) in females, before flattening
around 2000 in both sexes. The decline in the exponential trend shown is mainly influenced by the
last data point by the WHO; which should be interpreted with caution as the primary source could
not be located.
Data Sources and Quality
1. There are divergent estimates of infant mortality and under‐five mortality for Palau.
2. Vital registration was used for calculations of infant and under‐five mortality; no estimates were
derived from censuses or surveys.
3. LE, as reported by the census and “other” sources (excluding WHO) has been generated from age
specific mortality rates and model life tables and is therefore likely to be reliable; indirect
demographic techniques were not used.
4. Mortality rates and estimates of LE are likely to be affected by small numbers, producing
stochastic variation over time.
Comments
Sustained declines in infant mortality are noted, although estimates of under‐five mortality are
divergent and should be further investigated. While LE has reached moderate levels in Palau, there
has been a distinct flattening of LE since 2000, at levels from which further improvements should be
expected. This flattening, in view of the trends in infant mortality, indicates high premature adult
mortality, most likely due to non‐communicable diseases. Further investigation of deaths by age and
cause should be encouraged.

‐ 48 ‐
Palau
Infant Mortality Under‐Five Mortality
Life Expectancy; Palau
Key SPC: Secretariat of the Pacific Community WHO: World Health Organisation MoH: Ministry of Health
Other: other source noted in reference list UNIGME: United Nations Inter‐agency Group for Child Mortality Estimation
0
10
20
30
40
50
60
Per 1,000 live births
Period (year)
MoH
WHO
UNIGME
Other
Exponential
0
10
20
30
40
50
60
Period (year)
Census
UNIGME
Other
40
50
60
70
80
Years
Period (year)
SPC
Census
WHO
Other
Male
Quadratic
40
50
60
70
80
Period (year)
SPC
Census
WHO
Other
Female
Quadratic
UNIGME estimates are not included in the trendline as they are not a primary source of data ‐ they are for comparison purposes only.

‐ 49 ‐
Source Year Data Analysis Ref
Infant Mortality
MoH 1977‐1988* Vital registration Direct calculation 1
1990‐2004*; 2005‐06(2006)
Vital registration Direct calculation 2
WHO 2007 Unknown Unknown 3
2010 Unknown Unknown 4
Other 2004‐09(2006) Vital registration Direct calculation using population mortality rate (population <1 year) and converted to a probability using life table methods.
5
UNIGME 1990; 2012 UNIGME Projection (see UNIGME methodology page 3) 6
Under Five Mortality
Census 2000; 2005 Vital registration Age specific death rates used to impute a model life table (Coale/Demeny West)
7,8
Other 2004‐09(2006) Vital registration Direct calculation using population mortality rate (population <5 year) and converted to a probability using life table methods.
5
UNIGME 1990; 2000; 2012 UNIGME Projection (see UNIGME methodology page 3) 6
Life Expectancy
SPC 1979‐81(1980) Vital registration Life table 9
1995 Unknown Unknown 10
Census 2000; 2005 Vital registration Age specific death rates used to impute a model life table (Coale/Demeny West)
7,8
WHO 2004 Unknown Unknown 11
2010 Unknown Unknown 12
Other 2004‐09(2006) Vital registration Smoothed empirical data used to impute model life tables (Coale/Demeny West)
5
* Data points represent average of three‐year period around the estimate References 1. Bureau of Health Services. 1988 Annual Statistical Report. Republic of Palau. 2. Bureau of Public Health, Ministry of Health & Planning Office, Ministry of Finance, Republic of Palau. Table 14.1 Vital Statistics: 1990 to 2006 [Internet]. No date [cited 2012 Oct 2]. Available from: http://www.palaugov.net/stats/PalauStats/Social/Health&Vital/Health.pdf 3. Family Health Unit Statistics, Bureau of Public Health, Ministry of Health Palau; and Public Health Data and Statistics, Epidemiology, Bureau of Public Health, Ministry of Health, Palau. Estimate cited in; World Health Organisation. Western Pacific Country Health Information Profiles 2009 Revision. Geneva: WHO; 2009. 4. Family Health Unit Statistics and Public Health Data and Statistics, Bureau of Public Health, Ministry of Health, Palau. Estimate cited in; World Health Organisation. Western Pacific Country Health Information Profiles 2009 Revision. Geneva: WHO; 2009. 5. Karen Carter. 2013. Mortality and cause of death in the Pacific [Doctoral Thesis]. University of Queensland. Brisbane. Available from: http://espace.library.uq.edu.au/view/UQ:309197 6. The United Nations Inter‐agency Group for Child Mortality Estimation (UNIGME). Levels and trends in child mortality: Report 2013. The United Nations Children’s Fund; 2013. 7. Office of Planning and Statistics. Republic of Palau 2000 Census population and housing profile. Koror; 2004 Nov. 8. Office of Planning and Statistics. Republic of Palau 2005 Census volume 2: Census monograph population and housing profile. Koror; 2006 May. 9. Ueki M. Palau country report on main causes of morbidity and mortality. Tenth Regional Conference of Permanent Heads of Health Services. Noumea: South Pacific Commission; 1983. Estimate cited in; Taylor R, Lewis N, Levy S. Societies in transition: mortality patterns in Pacific Island populations. International Journal of Epidemiology. 1989;18(3):634‐646. 10. South Pacific Commission. Pacific Island Populations – Revised Edition. Report prepared by the South Pacific Commission for the International Conference on Population and Development 1994: Cairo, Egypt. Nouméa: SPC; 1998. And; Secretariat of the Pacific Community. Pacific Islands population data sheet. Complied by the Population and Demography Programme. Noumea, SPC, 1999. Estimate cited in; Taylor R, Lopez A. Differential mortality among Pacific Island countries and territories. Asia‐Pacific Population Journal. 2007;22(3):45‐58. 11.Palau Statistics. Estimate cited in; World Health Organisation. Western Pacific Country Health Information Profiles 2006 Revision. Geneva: WHO; 2006. 12. Public Health Data and Statistics, Epidemiology, Bureau of Public Health, Ministry of Health, Palau. Estimate cited in; World Health Organisation. Western Pacific Country Health Information Profiles 2009 Revision. Geneva: WHO; 2009.

‐ 50 ‐
14.PapuaNewGuinea(PNG)Land area (Km2) 462,840 2013‐mid‐year population estimate 7,398,500 Population growth rate (%) 2.3
[Source: SPC Pocket Summary 2013]
Trends in Child Mortality
Infant and under‐five mortality have declined significantly, with estimates of infant mortality now
around 60 deaths per 1000 live births and under‐five mortality around 70 deaths per 1000 live
births. Nevertheless, these levels are the highest in the Pacific Islands region.
Trends in Life Expectancy
LE appears to plateau at the mid‐50s (years) for both males and females, although there are no
recent data after 2000 to confirm this trend.
Data Sources and Quality
Mortality and LE in PNG are based on indirect demographic methods and there is no accurate
national vital registration data.
Comments
There have been considerable declines in infant and under‐five mortality since 1970 in PNG;
however, both infant and under‐five mortality remain at higher levels than any other Pacific Island
country. LE appears to plateau at the mid‐50s (years) for both sexes, the lowest in the Pacific region,
but there are no recent data to confirm such a trend.

‐ 51 ‐
Papua New Guinea
Infant Mortality Under‐Five Mortality
Life Expectancy; Papua New Guinea
Key Other: other source noted in reference list DHS 1996: Demographic and Health Survey DHS 2006: Demographic and Health Survey
UNIGME: United Nations Inter‐agency Group for Child Mortality Estimation GBD: Global Burden of Disease Study
0
20
40
60
80
100
120
140
160
180
200
220
Per 1,000 live births
Period (year)
Census
DHS
Other
UNIGME
GBD
Exponential
0
20
40
60
80
100
120
140
160
180
200
220
Period (year)
Census
DHS
Other
UNIGME
GBD
Exponential
30
40
50
60
70
80
Years
Period (year)
Census
Other
GBD
Male
Quadratic
30
40
50
60
70
80
Period (year)
Census
Other
GBD
Female
Quadratic
UNIGME and GBD estimates are not included in the trendlines as they are not a primary source of data ‐ they are for comparison purposes only.

‐ 52 ‐
Source Year Data Analysis Ref
Infant Mortality
Census 1971; 1980; 2000
Census CEBCS used to impute a model life table (Coale/Demeny West) 1‐3
Other 1991 Survey CEBCS used to impute a model life table (Coale/Demeny Far East) 4
DHS 2006
1993‐2007~ Survey Retrospective maternal history 5
DHS 1996
1982‐1996~ Survey Retrospective maternal history 6
UNIGME 1990; 2012 UNIGME Projection (see UNIGME methodology page 3) 7
GBD 2013 GBD Modelled data (see reference) – added early neonatal mortality, late neonatal mortality, and post neonatal infant mortality.
8
Under Five Mortality
Census 1971; 1980; 2000
Census CEBCS used to impute a model life table (Coale/Demeny West) 1,3
DHS 2006
1993‐2007~ Survey Retrospective maternal history 5
DHS 1996
1982‐1996~ Survey Retrospective maternal history 6
Other 1991 Survey CEBCS used to impute a model life table (Coale/Demeny Far East) 4
UNIGME 1990; 2000; 2012
UNIGME Projection (see UNIGME methodology page 3) 7
GBD 2013 GBD Modelled data (see reference) 8
Life Expectancy
Census 1980 Census CEBCS and maternal orphanhood data used to impute a model life table
1
1971; 2000 Census CEBCS used to impute a model life table (Coale/Demeny West) 3,2
Other 1991 Survey CEBCS used to impute a model life table (Coale/Demeny Far East) 4
GBD 1970; 1980; 1990; 2000; 2010
GBD Modelled data (see reference) 9
~ Data points represent average of five‐year period around the estimate References 1. Bakker, ML. The mortality situation in Papua New Guinea: levels, differentials, patterns and trends. Port Moresby; National Statistical Office: 1986. 2. National Statistics Office Working Paper No. 3, M.L.Bakker, 1983, p.51 Table XXIV. Estimate cited in: Policy Planning and Evaluation Division, Department of Health, Ministry of Health. Handbook on Health Statistics PNG 1987. Papua New Guinea. Port Moresby; Ministry of Health: 1989. 3. National Statistical Office. Recent fertility and mortality indices and trends in Papua New Guinea. A report based on the analysis of 2000 Census data. National Statistics Office: Port Moresby; 2003 April. 4. Hayes G. Estimates of mortality in Papua New Guinea based on the 1990 Census and the 1991 Demographic and Health Survey. UNFPA/ILO Project PNG/94/P01: Port Moresby; 1996 July. 5. National Statistics Office. Papua New Guinea Demographic and Health Survey 2006. National Report. Port Moresby: National Statistics Office; 2009. 6. National Statistics Office. Papua New Guinea Demographic and Health Survey 1996. National Report. Port Moresby: National Statistics Office; 1997. 7. The United Nations Inter‐agency Group for Child Mortality Estimation (UNIGME). Levels and trends in child mortality: Report 2013. The United Nations Children’s Fund; 2013. 8. Wang H, Liddell CA, Coates MM, Mooney M ,Levitz CE, Schumacher AE, et al. Global, regional, and national levels of neonatal, infant, and under‐5 mortality during 1990–2013: a systematic analysis for the Global Burden of Disease Study 2013. Lancet. Published Online. May 2, 2014. http://dx.doi.org/10.1016/S0140‐6736(14)60497‐9. 9. Wang H, Dwyer‐Lindgren L, Lofgren KT, Knoll Rajaratnam J, Marcus JR, Levin‐Rector A et al. Age‐specific and sex‐specific mortality in 187 countries, 1970‐2010: a systematic analysis for the Global Burden of Disease Study 2010. Lancet. 380:2071‐94; 2012.

‐ 53 ‐
15.SamoaLand area (Km2) 2.934 2013‐mid‐year population estimate 187,400 Population growth rate (%) 0.8
[Source: SPC Pocket Summary 2013]
Trends in Child Mortality
Infant mortality has decreased to below 20 deaths per 1000 live births. Less data are available on
under‐five mortality, which displays no trend.
Trends in Life Expectancy
Trends in LE increased to the early 70s (years) in males and mid‐70s (years) in females; however,
adult premature mortality may be under‐estimated and affected by the methodologies employed.
There is some indication that these gains are not sustained, and should be monitored over future
periods.
Data Sources and Quality
1. Estimates of infant mortality and under‐five mortality from the 2009 Samoa Demographic and
Health Survey (DHS) have been excluded from calculation of the trendline as they are inconsistent
with other sources of mortality estimates for the country. The survey report notes that “...the
number of reported births and deaths in the Samoan DHS was not sufficient to give reliable
mortality estimates” [Samoa DHS 2009].
2. The estimate of infant mortality from the 1999 Samoa DHS has been included in calculation of
the trendline.
3. While vital registration data have been used for some earlier estimates of infant mortality in
Samoa, it is likely that registration is not fully complete.
Comments
Infant mortality has shown sustained declines to below 20 deaths per 1000 live births, however
there is insufficient data to show a commensurate decline in under‐five mortality, although this is
likely. LE has reached reasonably high levels and shows continued increases, although there is some
suggestion this is starting to slow. Some care must be taken in interpretation as all data is sourced
from retrospective collection and may be subject to recall and reporting biases which may tend to
under‐estimate mortality levels. An assessment of vital registration data is encouraged to assess
under‐reporting and provide an alternative data source for comparison.
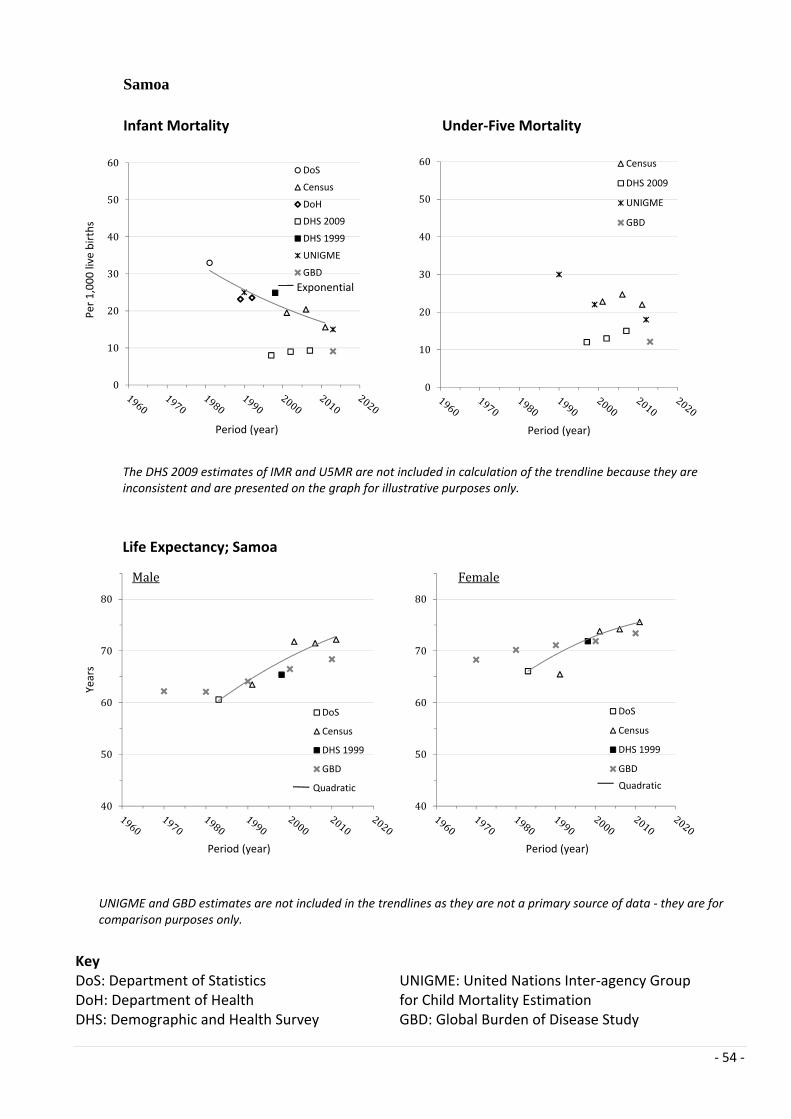
‐ 54 ‐
Samoa
Infant Mortality Under‐Five Mortality
Life Expectancy; Samoa
Key DoS: Department of Statistics DoH: Department of Health DHS: Demographic and Health Survey
UNIGME: United Nations Inter‐agency Group for Child Mortality Estimation GBD: Global Burden of Disease Study
0
10
20
30
40
50
60
Per 1,000 live births
Period (year)
DoS
Census
DoH
DHS 2009
DHS 1999
UNIGME
GBD
Exponential
0
10
20
30
40
50
60
Period (year)
Census
DHS 2009
UNIGME
GBD
40
50
60
70
80
Years
Period (year)
DoS
Census
DHS 1999
GBD
Male
Quadratic
40
50
60
70
80
Period (year)
DoS
Census
DHS 1999
GBD
Female
Quadratic
The DHS 2009 estimates of IMR and U5MR are not included in calculation of the trendline because they are inconsistent and are presented on the graph for illustrative purposes only.
UNIGME and GBD estimates are not included in the trendlines as they are not a primary source of data ‐ they are for comparison purposes only.
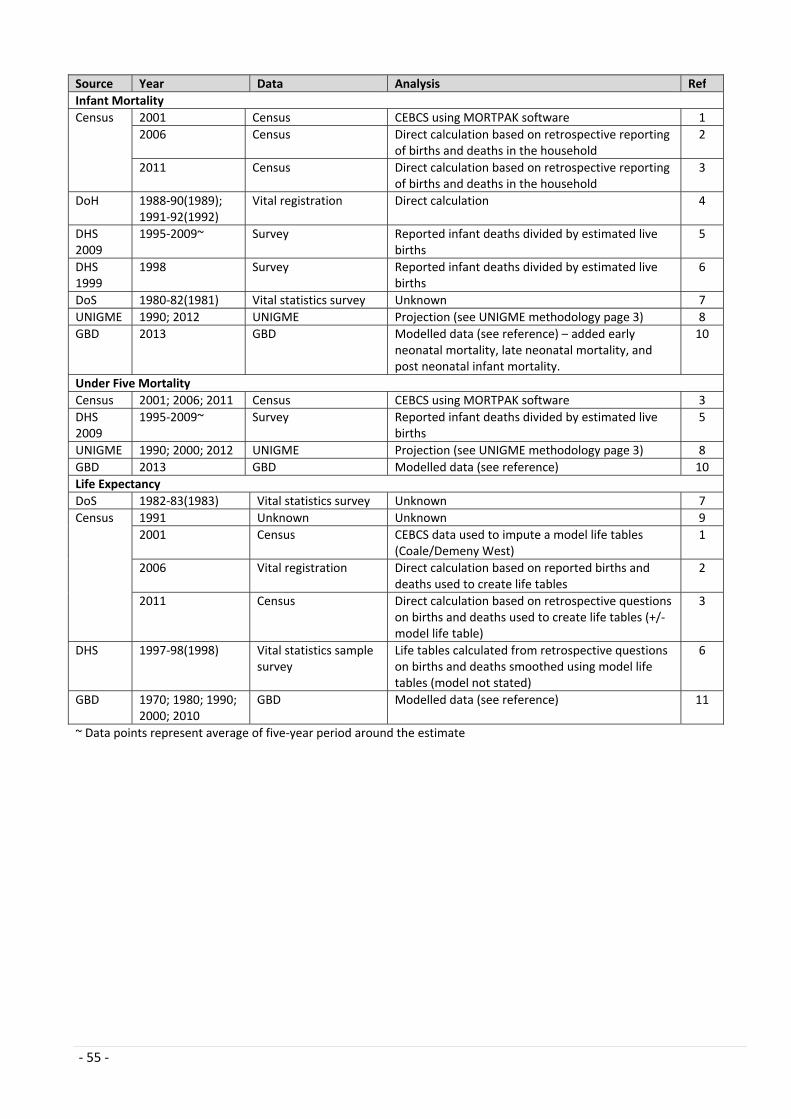
‐ 55 ‐
Source Year Data Analysis Ref
Infant Mortality
Census 2001 Census CEBCS using MORTPAK software 1
2006 Census Direct calculation based on retrospective reporting of births and deaths in the household
2
2011 Census Direct calculation based on retrospective reporting of births and deaths in the household
3
DoH 1988‐90(1989); 1991‐92(1992)
Vital registration Direct calculation 4
DHS 2009
1995‐2009~ Survey Reported infant deaths divided by estimated live births
5
DHS 1999
1998 Survey Reported infant deaths divided by estimated live births
6
DoS 1980‐82(1981) Vital statistics survey Unknown 7
UNIGME 1990; 2012 UNIGME Projection (see UNIGME methodology page 3) 8
GBD 2013 GBD Modelled data (see reference) – added early neonatal mortality, late neonatal mortality, and post neonatal infant mortality.
10
Under Five Mortality
Census 2001; 2006; 2011 Census CEBCS using MORTPAK software 3
DHS 2009
1995‐2009~ Survey Reported infant deaths divided by estimated live births
5
UNIGME 1990; 2000; 2012 UNIGME Projection (see UNIGME methodology page 3) 8
GBD 2013 GBD Modelled data (see reference) 10
Life Expectancy
DoS 1982‐83(1983) Vital statistics survey Unknown 7
Census 1991 Unknown Unknown 9
2001 Census CEBCS data used to impute a model life tables (Coale/Demeny West)
1
2006 Vital registration Direct calculation based on reported births and deaths used to create life tables
2
2011 Census Direct calculation based on retrospective questions on births and deaths used to create life tables (+/‐ model life table)
3
DHS 1997‐98(1998) Vital statistics sample survey
Life tables calculated from retrospective questions on births and deaths smoothed using model life tables (model not stated)
6
GBD 1970; 1980; 1990; 2000; 2010
GBD Modelled data (see reference) 11
~ Data points represent average of five‐year period around the estimate
‐ 56 ‐
References 1. Government of Samoa, Ministry of Finance, Statistical Services Division. Report of the Census of Population and Housing Samoa 2001. Apia, Samoa; 2001. 2. Samoa Bureau of Statistics. Samoa Population and Housing Census Report 2006. Apia, Samoa: Government of Samoa; 2008 Jul. 3. Samoa Bureau of Statistics. Population and Housing Census 2011 Analytic Report. Apia, Samoa: Bureau of Statistics; 2012. 4. Department of Health. Annual Report 1991 and 1992. APIA, Western Samoa. 5. Samoa Bureau of Statistics, Ministry of Health, ICF Macro. Samoa Demographic and Health Survey 2009. Apia, Samoa: Ministry of Health; 2010. 6. Government of Samoa, Department of Statistics and Secretariat of the Pacific Community. Samoa Demographic and Health Survey 1999 Analytic Report. Noumea; SPC. 7. Department of Statistics. Vital statistics sample survey report, 1983. Apia, Government of Western Samoa, 1984. Estimate cited in; Taylor R, Lewis N, Levy S. Societies in transition: mortality patterns in Pacific Island populations. International Journal of Epidemiology. 1989;18(3):634‐646. 8. The United Nations Inter‐agency Group for Child Mortality Estimation (UNIGME). Levels and trends in child mortality: Report 2013. The United Nations Children’s Fund; 2013. 9. Department of Statistics. Census of population and housing, 1991. Apia; Department of Statistics: 1992. 10. Wang H, Liddell CA, Coates MM, Mooney M ,Levitz CE, Schumacher AE, et al. Global, regional, and national levels of neonatal, infant, and under‐5 mortality during 1990–2013: a systematic analysis for the Global Burden of Disease Study 2013. Lancet. Published Online. May 2, 2014. http://dx.doi.org/10.1016/S0140‐6736(14)60497‐9. 11. Wang H, Dwyer‐Lindgren L, Lofgren KT, Knoll Rajaratnam J, Marcus JR, Levin‐Rector A et al. Age‐specific and sex‐specific mortality in 187 countries, 1970‐2010: a systematic analysis for the Global Burden of Disease Study 2010. Lancet. 380:2071‐94; 2012.

‐ 57 ‐
16.SolomonIslandsLand area (Km2) 28,000 2013‐mid‐year population estimate 610,800 Population growth rate (%) 2.8
[Source: SPC Pocket Summary 2013]
Trends in Child Mortality
Infant mortality has decreased to below 30 deaths per 1000 live births, and under‐five mortality to
below 40 deaths per 1000 live births.
Trends in Life Expectancy
LE is reported to have increased to the mid‐60s (years) for males and over 70 (years) for females.
Data Sources and Quality
1. All mortality data from the Solomon Islands are based on direct or indirect analytic methods from
Censuses or surveys – none are from vital registration data.
2. Reported mortality estimates appear implausibly low in relation to the economic development
and availability of health services within the country, and in comparison with other countries in the
region.
Comments
All mortality and LE estimates in the Solomon Islands are based on direct or indirect demographic
methods from censuses or surveys. Reported estimates show declines in infant and under‐five
mortality and increases in LE, however, the relatively high life expectancies reported are directly
attributable to the most recent census estimate and indicate an improbable rapid improvement in
overall mortality levels. Although based on two input parameters, rather than a single input model
life table, census estimates are derived from indirect methods applied to retrospective data and may
under‐estimate true levels of mortality.
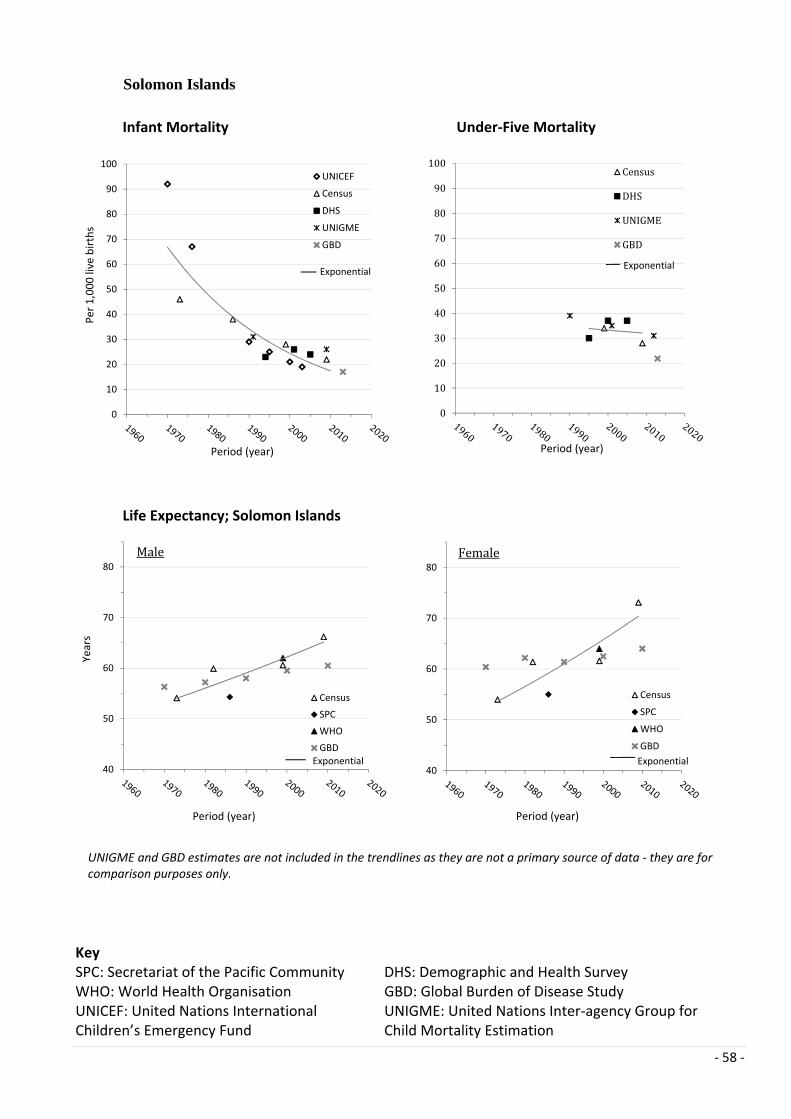
‐ 58 ‐
Solomon Islands
Infant Mortality Under‐Five Mortality
Life Expectancy; Solomon Islands
Key SPC: Secretariat of the Pacific Community WHO: World Health Organisation UNICEF: United Nations International Children’s Emergency Fund
DHS: Demographic and Health Survey GBD: Global Burden of Disease Study UNIGME: United Nations Inter‐agency Group for Child Mortality Estimation
0
10
20
30
40
50
60
70
80
90
100
Per 1,000 live births
Period (year)
UNICEF
Census
DHS
UNIGME
GBD
Exponential
0
10
20
30
40
50
60
70
80
90
100
Period (year)
Census
DHS
UNIGME
GBD
Exponential
40
50
60
70
80
Years
Period (year)
Census
SPC
WHO
GBDExponential
Male
40
50
60
70
80
Period (year)
Census
SPC
WHO
GBD
Exponential
Female
UNIGME and GBD estimates are not included in the trendlines as they are not a primary source of data ‐ they are for comparison purposes only.
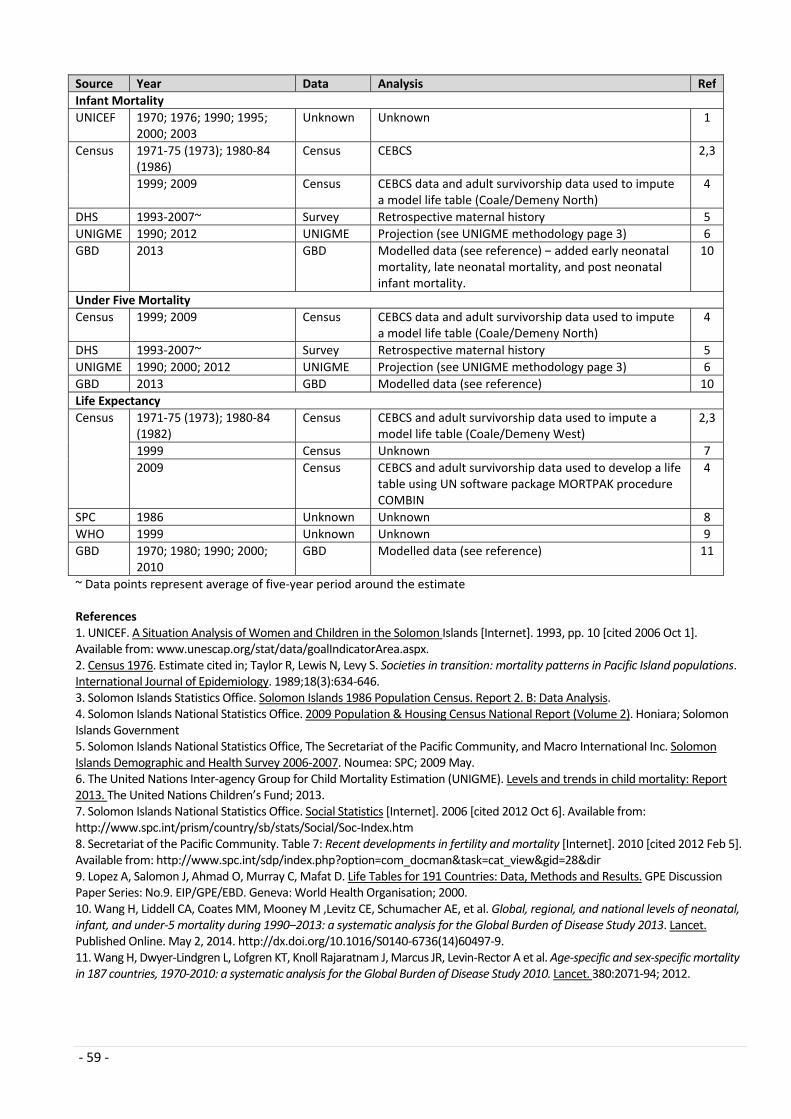
‐ 59 ‐
Source Year Data Analysis Ref
Infant Mortality
UNICEF 1970; 1976; 1990; 1995; 2000; 2003
Unknown Unknown 1
Census 1971‐75 (1973); 1980‐84 (1986)
Census CEBCS 2,3
1999; 2009 Census CEBCS data and adult survivorship data used to impute a model life table (Coale/Demeny North)
4
DHS 1993‐2007~ Survey Retrospective maternal history 5
UNIGME 1990; 2012 UNIGME Projection (see UNIGME methodology page 3) 6
GBD 2013 GBD Modelled data (see reference) – added early neonatal mortality, late neonatal mortality, and post neonatal infant mortality.
10
Under Five Mortality
Census 1999; 2009 Census CEBCS data and adult survivorship data used to impute a model life table (Coale/Demeny North)
4
DHS 1993‐2007~ Survey Retrospective maternal history 5
UNIGME 1990; 2000; 2012 UNIGME Projection (see UNIGME methodology page 3) 6
GBD 2013 GBD Modelled data (see reference) 10
Life Expectancy
Census 1971‐75 (1973); 1980‐84 (1982)
Census CEBCS and adult survivorship data used to impute a model life table (Coale/Demeny West)
2,3
1999 Census Unknown 7
2009 Census CEBCS and adult survivorship data used to develop a life table using UN software package MORTPAK procedure COMBIN
4
SPC 1986 Unknown Unknown 8
WHO 1999 Unknown Unknown 9
GBD 1970; 1980; 1990; 2000; 2010
GBD Modelled data (see reference) 11
~ Data points represent average of five‐year period around the estimate References 1. UNICEF. A Situation Analysis of Women and Children in the Solomon Islands [Internet]. 1993, pp. 10 [cited 2006 Oct 1]. Available from: www.unescap.org/stat/data/goalIndicatorArea.aspx. 2. Census 1976. Estimate cited in; Taylor R, Lewis N, Levy S. Societies in transition: mortality patterns in Pacific Island populations. International Journal of Epidemiology. 1989;18(3):634‐646. 3. Solomon Islands Statistics Office. Solomon Islands 1986 Population Census. Report 2. B: Data Analysis. 4. Solomon Islands National Statistics Office. 2009 Population & Housing Census National Report (Volume 2). Honiara; Solomon Islands Government 5. Solomon Islands National Statistics Office, The Secretariat of the Pacific Community, and Macro International Inc. Solomon Islands Demographic and Health Survey 2006‐2007. Noumea: SPC; 2009 May. 6. The United Nations Inter‐agency Group for Child Mortality Estimation (UNIGME). Levels and trends in child mortality: Report 2013. The United Nations Children’s Fund; 2013. 7. Solomon Islands National Statistics Office. Social Statistics [Internet]. 2006 [cited 2012 Oct 6]. Available from: http://www.spc.int/prism/country/sb/stats/Social/Soc‐Index.htm 8. Secretariat of the Pacific Community. Table 7: Recent developments in fertility and mortality [Internet]. 2010 [cited 2012 Feb 5]. Available from: http://www.spc.int/sdp/index.php?option=com_docman&task=cat_view&gid=28&dir 9. Lopez A, Salomon J, Ahmad O, Murray C, Mafat D. Life Tables for 191 Countries: Data, Methods and Results. GPE Discussion Paper Series: No.9. EIP/GPE/EBD. Geneva: World Health Organisation; 2000. 10. Wang H, Liddell CA, Coates MM, Mooney M ,Levitz CE, Schumacher AE, et al. Global, regional, and national levels of neonatal, infant, and under‐5 mortality during 1990–2013: a systematic analysis for the Global Burden of Disease Study 2013. Lancet. Published Online. May 2, 2014. http://dx.doi.org/10.1016/S0140‐6736(14)60497‐9. 11. Wang H, Dwyer‐Lindgren L, Lofgren KT, Knoll Rajaratnam J, Marcus JR, Levin‐Rector A et al. Age‐specific and sex‐specific mortality in 187 countries, 1970‐2010: a systematic analysis for the Global Burden of Disease Study 2010. Lancet. 380:2071‐94; 2012.

‐ 60 ‐
17.Tokelau Land area (Km2) 12 2013‐mid‐year population estimate 1,200 Population growth rate (%) 0.9
[Source: SPC Pocket Summary 2013]
Trends in Child Mortality
Available data suggest slow decline in infant mortality to around 30 deaths per 1000 live births.
There are no data available on under‐five mortality.
Trends in Life Expectancy
LE appears to have stabilised at the late 60s (years) for males and around 70 (years) in females, but
there are no available data since 2000.
Data Sources and Quality
1. Mortality rates and estimates of LE are likely to be affected by small numbers, producing
stochastic variation over time. Mortality and LE data from Tokelau should span at least 5 years, and
should be presented with statistical confidence intervals (95%).
2. No recent life expectancy estimates available since 2000.
3. High risk pregnancies are referred to either Samoa or New Zealand, and births generally do not
occur on island. There are no reliable figures for infant births or deaths off island, although Tokelau
is working to implement reporting procedures to capture these.
Comments
Both infant and child mortality show slow but consistent declines, with LE stable at moderate levels.
Although the small population size and overseas referrals make calculation of mortality rates for
Tokelau difficult, these data suggest mortality levels at which further improvements could be made.

‐ 61 ‐
Tokelau
Infant Mortality
Life Expectancy; Tokelau
Key SPC: Secretariat of the Pacific Community
UN Stat Div: United Nations Statistics Division
0
10
20
30
40
50
60
Per 1,000 live births
Period (year)
SPC
UNStatdiv
Exponential
40
50
60
70
80
Years
Period (year)
SPC
Male
40
50
60
70
80
Period (year)
SPC
Female
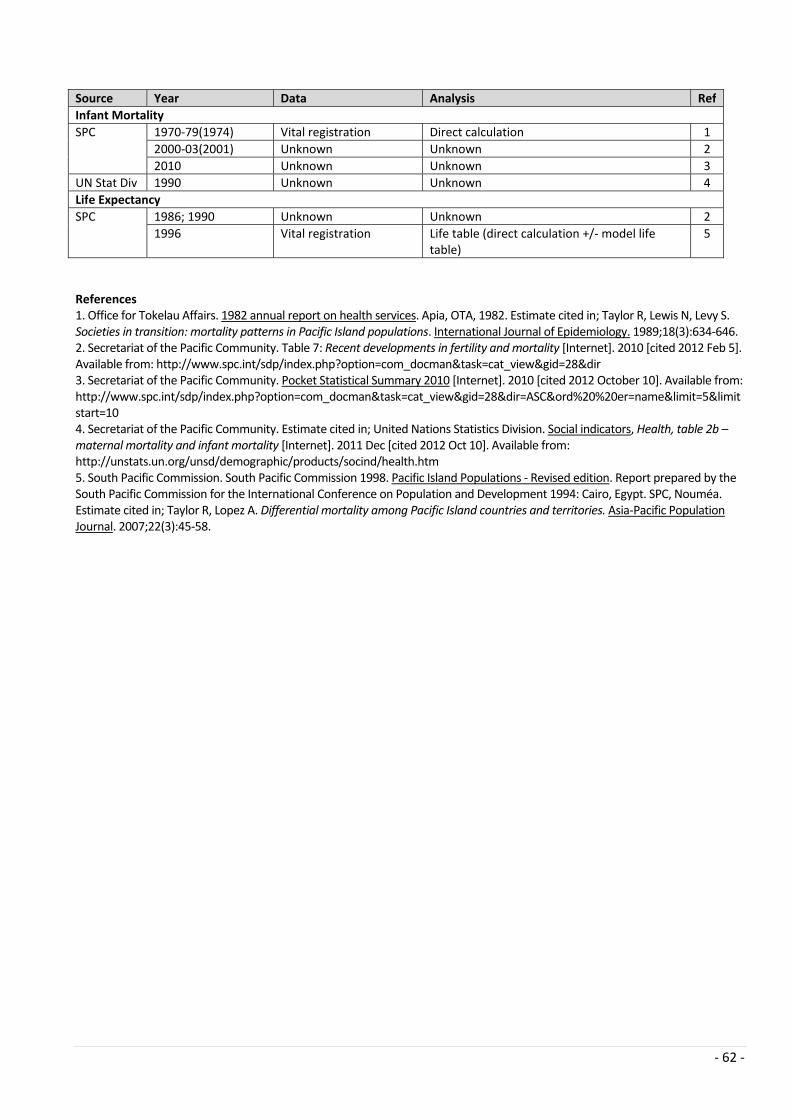
‐ 62 ‐
Source Year Data Analysis Ref
Infant Mortality
SPC 1970‐79(1974) Vital registration Direct calculation 1
2000‐03(2001) Unknown Unknown 2
2010 Unknown Unknown 3
UN Stat Div 1990 Unknown Unknown 4
Life Expectancy
SPC 1986; 1990 Unknown Unknown 2
1996 Vital registration Life table (direct calculation +/‐ model life table)
5
References 1. Office for Tokelau Affairs. 1982 annual report on health services. Apia, OTA, 1982. Estimate cited in; Taylor R, Lewis N, Levy S. Societies in transition: mortality patterns in Pacific Island populations. International Journal of Epidemiology. 1989;18(3):634‐646. 2. Secretariat of the Pacific Community. Table 7: Recent developments in fertility and mortality [Internet]. 2010 [cited 2012 Feb 5]. Available from: http://www.spc.int/sdp/index.php?option=com_docman&task=cat_view&gid=28&dir 3. Secretariat of the Pacific Community. Pocket Statistical Summary 2010 [Internet]. 2010 [cited 2012 October 10]. Available from: http://www.spc.int/sdp/index.php?option=com_docman&task=cat_view&gid=28&dir=ASC&ord%20%20er=name&limit=5&limitstart=10 4. Secretariat of the Pacific Community. Estimate cited in; United Nations Statistics Division. Social indicators, Health, table 2b – maternal mortality and infant mortality [Internet]. 2011 Dec [cited 2012 Oct 10]. Available from: http://unstats.un.org/unsd/demographic/products/socind/health.htm 5. South Pacific Commission. South Pacific Commission 1998. Pacific Island Populations ‐ Revised edition. Report prepared by the South Pacific Commission for the International Conference on Population and Development 1994: Cairo, Egypt. SPC, Nouméa. Estimate cited in; Taylor R, Lopez A. Differential mortality among Pacific Island countries and territories. Asia‐Pacific Population Journal. 2007;22(3):45‐58.

‐ 63 ‐
18.TongaLand area (Km2) 749 2013‐mid‐year population estimate 103,300 Population growth rate (%) 0.2 Crude birth rate (per 1000 population) 27.1 Total fertility rate (year) 3.9 (2011)
[Source: SPC Pocket Summary 2013]
Trends in Child Mortality
Infant mortality declined to below 20 deaths per 1000 live births, and under‐five mortality below 30
deaths per 1000 live births.
Trends in Life Expectancy
LE appears to be mid‐60s (years) for males and high 60s (years) for females based on reconciliation
of four sources of vital registration, and estimates from capture‐recapture. The degree to which
trends represent declines in LE is difficult to determine because previous estimates were probably
too high; however life expectancies have at the very least flattened and show no consistent
improvement.
Data Sources and Quality
1. Estimates of mortality in Tonga, prior to recent analyses based on reconciliation of vital
registration data from four sources, are probably unreliable.
2. Recent analyses involving reconciliation of civil and health vital registration (labelled ‘Other’ on the
graphs) indicate that previous measures of life expectancy are likely to have been overestimated.
Comments
Infant mortality is below 20 deaths per 1000, with recent increases attributable to the reconciliation of
data between sources, with previous estimates potentially biased by undercount. While reconciled
data (labelled “other”) from Hufunga et al. [2012] demonstrate that LE is likely to have been over‐
estimated and is closer to low 60s (years) for males and high 60s (years) for females, it is apparent that
there has been no improvement in LE since the early 1990s, and that flattening in LE has occurred at
levels where further improvements should be sought. These patterns of LE, when combined with
relatively low infant and child mortality, demonstrate the impact of premature adult mortality, most
likely as a result of non‐communicable diseases.
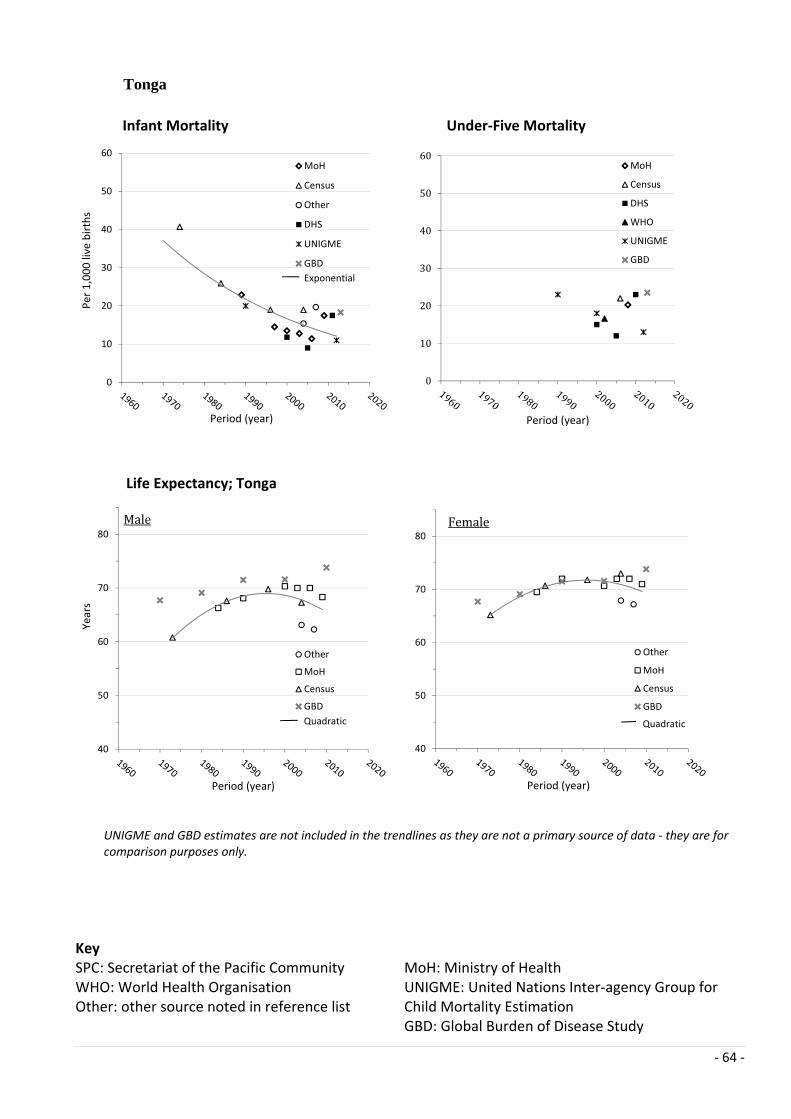
‐ 64 ‐
Tonga
Infant Mortality Under‐Five Mortality
Life Expectancy; Tonga
Key SPC: Secretariat of the Pacific Community WHO: World Health Organisation Other: other source noted in reference list
MoH: Ministry of Health UNIGME: United Nations Inter‐agency Group for Child Mortality Estimation GBD: Global Burden of Disease Study
0
10
20
30
40
50
60
Per 1,000 live births
Period (year)
MoH
Census
Other
DHS
UNIGME
GBD
Exponential
0
10
20
30
40
50
60
Period (year)
MoH
Census
DHS
WHO
UNIGME
GBD
40
50
60
70
80
Years
Period (year)
Other
MoH
Census
GBD
Male
Quadratic
40
50
60
70
80
Period (year)
Other
MoH
Census
GBD
Female
Quadratic
UNIGME and GBD estimates are not included in the trendlines as they are not a primary source of data ‐ they are for comparison purposes only.
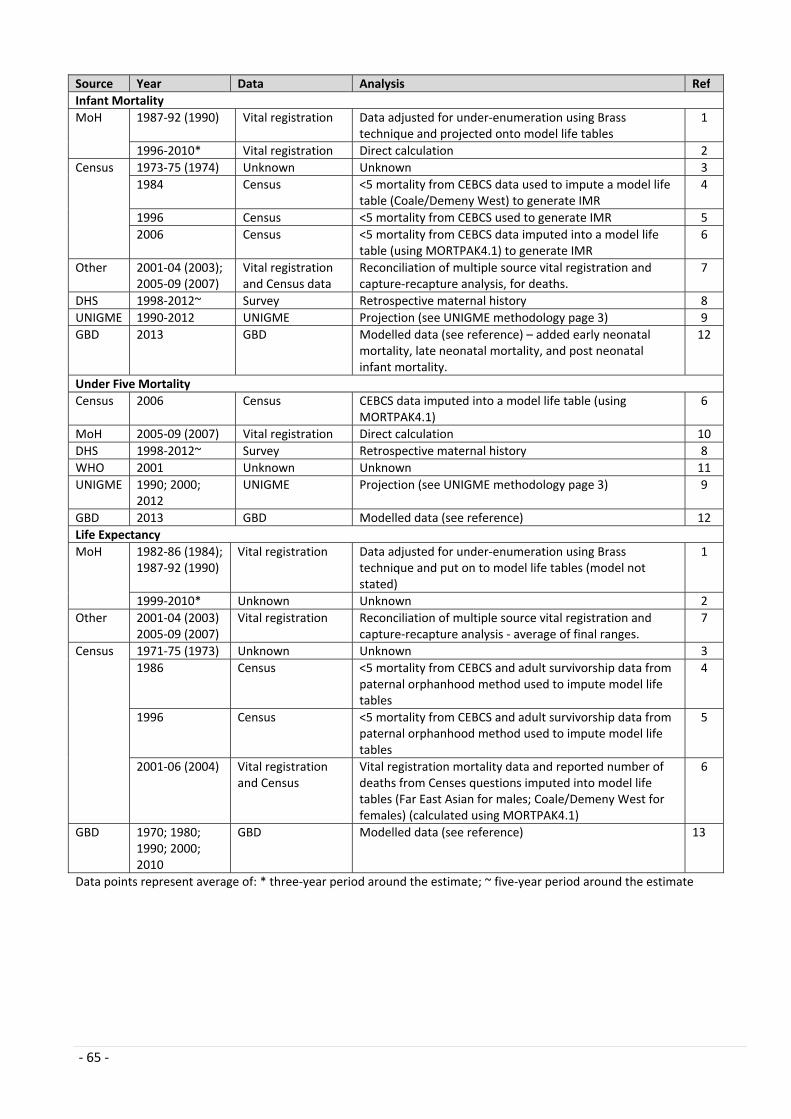
‐ 65 ‐
Source Year Data Analysis Ref
Infant Mortality
MoH 1987‐92 (1990) Vital registration Data adjusted for under‐enumeration using Brass technique and projected onto model life tables
1
1996‐2010* Vital registration Direct calculation 2
Census 1973‐75 (1974) Unknown Unknown 3
1984 Census <5 mortality from CEBCS data used to impute a model life table (Coale/Demeny West) to generate IMR
4
1996 Census <5 mortality from CEBCS used to generate IMR 5
2006 Census <5 mortality from CEBCS data imputed into a model life table (using MORTPAK4.1) to generate IMR
6
Other 2001‐04 (2003); 2005‐09 (2007)
Vital registration and Census data
Reconciliation of multiple source vital registration and capture‐recapture analysis, for deaths.
7
DHS 1998‐2012~ Survey Retrospective maternal history 8
UNIGME 1990‐2012 UNIGME Projection (see UNIGME methodology page 3) 9
GBD 2013 GBD Modelled data (see reference) – added early neonatal mortality, late neonatal mortality, and post neonatal infant mortality.
12
Under Five Mortality
Census 2006 Census CEBCS data imputed into a model life table (using MORTPAK4.1)
6
MoH 2005‐09 (2007) Vital registration Direct calculation 10
DHS 1998‐2012~ Survey Retrospective maternal history 8
WHO 2001 Unknown Unknown 11
UNIGME 1990; 2000; 2012
UNIGME Projection (see UNIGME methodology page 3) 9
GBD 2013 GBD Modelled data (see reference) 12
Life Expectancy
MoH 1982‐86 (1984); 1987‐92 (1990)
Vital registration Data adjusted for under‐enumeration using Brass technique and put on to model life tables (model not stated)
1
1999‐2010* Unknown Unknown 2
Other 2001‐04 (2003) 2005‐09 (2007)
Vital registration Reconciliation of multiple source vital registration and capture‐recapture analysis ‐ average of final ranges.
7
Census 1971‐75 (1973) Unknown Unknown 3
1986 Census <5 mortality from CEBCS and adult survivorship data frompaternal orphanhood method used to impute model life tables
4
1996 Census <5 mortality from CEBCS and adult survivorship data frompaternal orphanhood method used to impute model life tables
5
2001‐06 (2004) Vital registration and Census
Vital registration mortality data and reported number of deaths from Censes questions imputed into model life tables (Far East Asian for males; Coale/Demeny West for females) (calculated using MORTPAK4.1)
6
GBD 1970; 1980; 1990; 2000; 2010
GBD Modelled data (see reference) 13
Data points represent average of: * three‐year period around the estimate; ~ five‐year period around the estimate

‐ 66 ‐
References 1. Kupu S. Mortality Analysis for Tonga, 1982‐1992. Pacific Health Dialog. 1999;6(2):221‐235. 2. Government of Tonga. Report of the Minister for Health for the year 2000/2005/2010 [Internet]. No date [cited 2014 February 10]. Available from: http://health.gov.to/Annualreport_Public 3. 1976 Census. Estimate cited in; Taylor R, Lewis N, Levy S. Societies in transition: mortality patterns in Pacific Island populations. International Journal of Epidemiology. 1989;18(3):634‐646. 4. Kingdom of Tonga Statistics Department. Demographic analysis of 1986 Census data: fertility, mortality and population projections. Volume 2. Nuku’alofa: Government of Tonga; 1993. 5. Statistics Department. Tonga population Census 1996 demographic analysis. Nuku’alofa, Tonga: Statistics Department; 1999. 6. Tonga Statistics Department and the Secretariat of the Pacific Community. Tonga 2006 Census of population and housing, volume 2: analytic report. Noumea: SPC; 2008. 7. Hufanga S, Carter K, Rao C, Lopez A, Taylor R. Mortality trends in Tonga: an assessment based on a synthesis of local data. Population Health Metrics. 2012;10(14): doi:10.1186/1478‐7954‐10‐14 8. Tonga Department of Statistics and Tonga Ministry of Health, Secretariat of the Pacific Community, and UNFPA. Tonga Demographic and Health Survey, 2012. Noumea: SPC; 2013. 9. The United Nations Inter‐agency Group for Child Mortality Estimation (UNIGME). Levels and trends in child mortality: Report 2013. The United Nations Children’s Fund; 2013. 10. Government of Tonga. Report of the Minister for Health for the year 2005/2006/2007/2008/2009 [Internet]. No date [cited 2014 February 10]. Available from: http://health.gov.to/Annualreport_Public 11. Tonga Statistics Department. Estimate cited in; World Health Organisation. Western Pacific Country Health Information Profiles 2008 Revision. Geneva: WHO; 2008. 12. Wang H, Liddell CA, Coates MM, Mooney M ,Levitz CE, Schumacher AE, et al. Global, regional, and national levels of neonatal, infant, and under‐5 mortality during 1990–2013: a systematic analysis for the Global Burden of Disease Study 2013. Lancet. Published Online. May 2, 2014. http://dx.doi.org/10.1016/S0140‐6736(14)60497‐9. 13. Wang H, Dwyer‐Lindgren L, Lofgren KT, Knoll Rajaratnam J, Marcus JR, Levin‐Rector A et al. Age‐specific and sex‐specific mortality in 187 countries, 1970‐2010: a systematic analysis for the Global Burden of Disease Study 2010. Lancet. 380:2071‐94; 2012.

‐ 67 ‐
19.TuvaluLand area (Km2) 26 2013‐mid‐year population estimate 10,900 Population growth rate (%) 1.1
[Source: SPC Pocket Summary 2013]
Trends in Child Mortality
Infant and under‐five mortality have consistently decreased, with infant mortality below 30 deaths
per 1000 live births. The decline in under‐five mortality has been even more pronounced, and now
appears to be comprised almost exclusively of infant deaths.
Trends in Life Expectancy
LE has increased to early 60s (years) in males and mid‐60s (years) in females, although no LE data are
available since 2000.
Data Sources and Quality
1. No LE data is available for Tuvalu since 2000.
2. Mortality rates and estimates of LE are likely to be affected by small numbers, producing stochastic
variation over time.
Comments
Infant and under‐five mortality show declines, and LE increased to early‐mid 60s, although there are
no LE data available since 2000. Small numbers lead to stochastic variation, especially for infant and
under‐five mortality. Analyses of mortality and LE for Tuvalu should use 3‐5 year periods and should
be presented with statistical confidence intervals (95%).
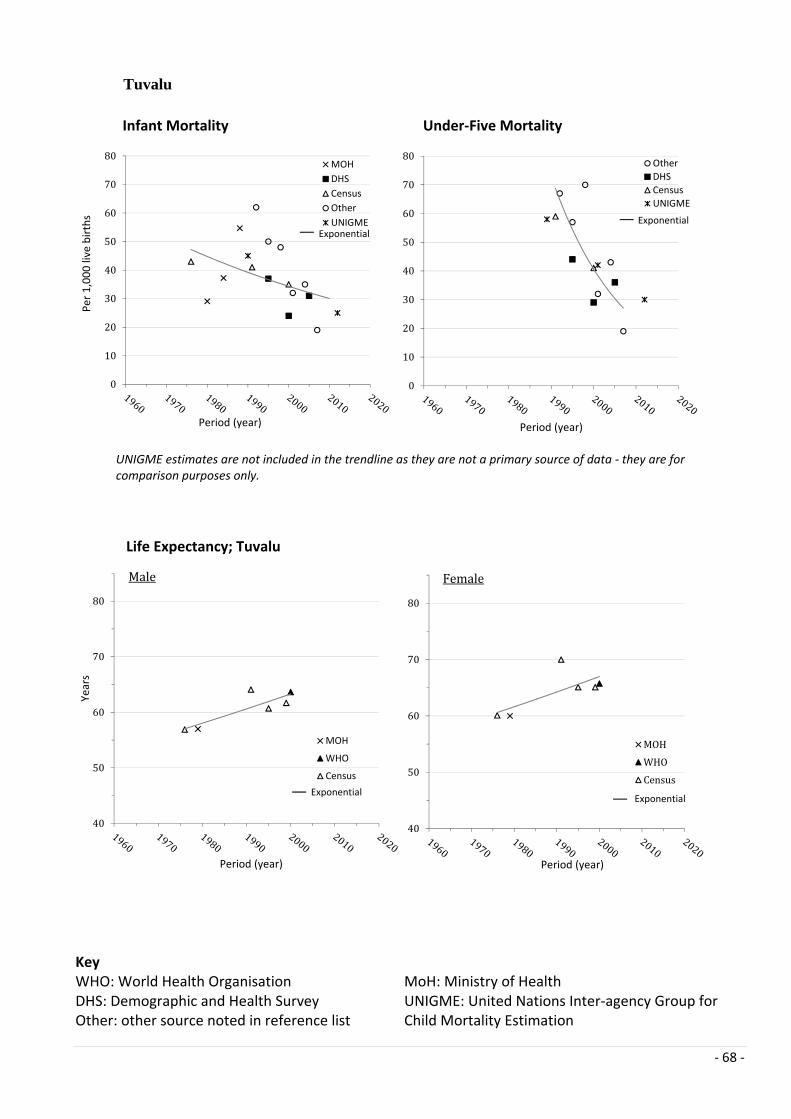
‐ 68 ‐
Tuvalu
Infant Mortality Under‐Five Mortality
Life Expectancy; Tuvalu
Key WHO: World Health Organisation DHS: Demographic and Health Survey Other: other source noted in reference list
MoH: Ministry of Health UNIGME: United Nations Inter‐agency Group for Child Mortality Estimation
0
10
20
30
40
50
60
70
80
Per 1,000 live births
Period (year)
MOH
DHS
Census
Other
UNIGMEExponential
0
10
20
30
40
50
60
70
80
Period (year)
Other
DHS
Census
UNIGME
Exponential
40
50
60
70
80
Years
Period (year)
MOH
WHO
Census
Male
Exponential
40
50
60
70
80
Period (year)
MOH
WHO
Census
Female
Exponential
UNIGME estimates are not included in the trendline as they are not a primary source of data ‐ they are for comparison purposes only.

‐ 69 ‐
Source Year Data Analysis Ref
Infant Mortality
MoH 1979‐81 (1980) Unknown Unknown 1
1982‐85 (1984); 1986‐89 (1988)
Unknown Unknown 2
Other 1991‐2008* Vital registration
Direct calculation 3
DHS 1993‐2007~ Survey Retrospective maternal history 4
Census 1974‐78 (1976) Unknown Unknown 5
1990‐91 (1991) Census <5 mortality from CEBCS and adult survivorship data frompaternal orphanhood method used to impute a model life table to generate IMR
6
1997‐2002 (2000) Vital registration
Direct calculation 7
UNIGME 1990; 2012 UNIGME Projection (see UNIGME methodology page 3) 8
Under Five Mortality
Other 1991‐2008* Vital registration
Direct calculation 3
DHS 1993‐2007~ Survey Retrospective maternal history 4
Census 1990‐91 (1991) Census CEBCS and adult survivorship data from paternal orphanhood method used to impute a model life table
6
1997‐2002 (2000) Vital registration
Direct calculation 7
UNIGME 1990; 2000; 2012 UNIGME Projection (see UNIGME methodology page 3) 8
Life Expectancy
MoH 1979 Unknown Unknown 9
WHO 1999 Unknown Unknown 10
Census 1976 Unknown Unknown 5
1990‐91 (1991) Census CEBCS and adult survivorship data from paternal orphanhood method used to impute a model life table
6
1992‐97 (1995); 1997‐2002 (1999)
Vital registration
Vital registration data imputed into model life tables using US Census Bureau and MORTPAK LITE 3.0
7
Data points represent: *average of three‐year; ~average of five‐year; period around the estimate References 1. Ministry of Social Services. Health Division Annual Report 1985. Government of Tuvalu. 2. Ministry of Health, Education and Community Affairs. Health Division Annual Report 1989. Funafuti: Government of Tuvalu. 3. Taylor R, Linhart C, Homasi S, Hayes G. Measuring progress towards achieving Millennium Development Goals in small populations: is under‐five mortality in Tuvalu declining? ANZJPH; 2014. In press. 4. Central Statistics Division (TCSD), SPC and Macro International Inc. Tuvalu Demographic and Health Survey 2007. Noumea: SPC; 2009. 5. Census 1979. Estimate cited in; Taylor R, Lewis N, Levy S. Societies in transition: mortality patterns in Pacific Island populations. International Journal of Epidemiology. 1989;18(3):634‐646. 6. Central Statistics Division. Tuvalu 1991 Population and Housing Census, Volume 2: Analytical Report. Funafuti: Government of Tuvalu, 1992. 7. Secretariat of the Pacific Community. Tuvalu 2002 population and housing Census, volume 2 demographic profile, 1991‐2002. Noumea, New Caledonia: SPC; 2005. 8. The United Nations Inter‐agency Group for Child Mortality Estimation (UNIGME). Levels and trends in child mortality: Report 2013. The United Nations Children’s Fund; 2013. 9. Ministry of Health. Health Division Annual Report. Education and Community Affairs. Funafuti, Tuvalu: Government of Tuvalu; 1986. 10. Lopez A, Salomon J, Ahmad O, Murray C, Mafat D. Life Tables for 191 Countries: Data, Methods and Results. GPE Discussion Paper Series: No.9. EIP/GPE/EBD. Geneva: World Health Organisation; 2000.
‐ 70 ‐
20.VanuatuLand area (Km2) 12,281 2013‐mid‐year population estimate 264,700 Population growth rate (%) 2.5
[Source:SPCPocketSummary2013]
Trends in Child Mortality
Trends in infant mortality show a decline to below 30 deaths per 1000 live births, with a
commensurate decrease in under‐five mortality.
Trends in Life Expectancy
Trends show an increase in LE to the late 60s (years) in males and early 70s (years) in females.
Data Sources and Quality
1. All data are from indirect analytic methods from surveys and censuses. Vital registration data is
not yet sufficiently complete for calculation of mortality estimates.
2. Reported mortality estimates are suspiciously low in relation to the circumstance of the country.
Comments
Levels of child mortality are suspiciously low in relation to the circumstance of the country and in
comparison with other countries in the region. It would seem unlikely that the recorded minor
declines in infant and under‐five mortality in the last decade would explain the increase in LE over
the same period. Mortality estimates from Vanuatu emanate from direct and indirect demographic
methods through censuses and surveys, and life expectancy is derived from model life tables
imputed from estimates of under‐five mortality (from CEBCS). Models based on single input
parameters have been shown to under‐estimate adult mortality in other Pacific countries, and
highlight the need for development of robust and reliable vital registration systems.
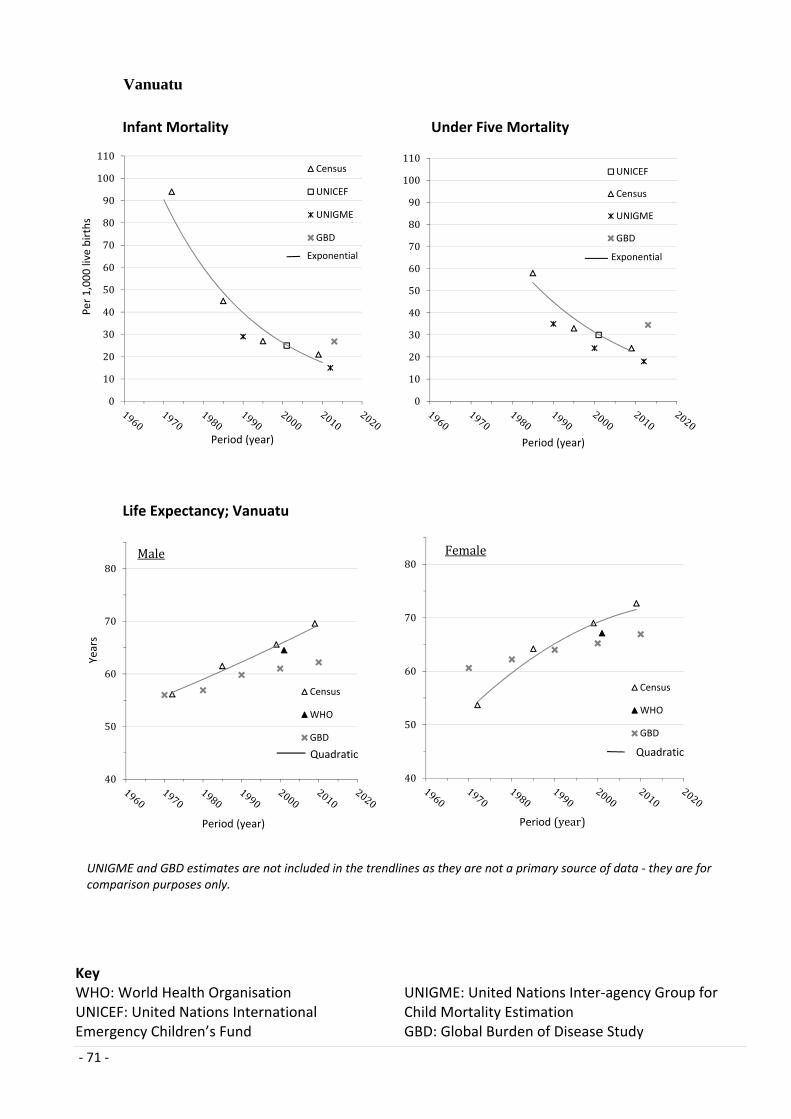
‐ 71 ‐
Vanuatu
Infant Mortality Under Five Mortality
Life Expectancy; Vanuatu
Key WHO: World Health Organisation UNICEF: United Nations International Emergency Children’s Fund
UNIGME: United Nations Inter‐agency Group for Child Mortality Estimation GBD: Global Burden of Disease Study
0
10
20
30
40
50
60
70
80
90
100
110
Per 1,000 live births
Period (year)
Census
UNICEF
UNIGME
GBD
Exponential
0
10
20
30
40
50
60
70
80
90
100
110
Period (year)
UNICEF
Census
UNIGME
GBD
Exponential
40
50
60
70
80
Years
Period (year)
Census
WHO
GBD
Male
Quadratic
40
50
60
70
80
Period (year)
Census
WHO
GBD
Female
Quadratic
UNIGME and GBD estimates are not included in the trendlines as they are not a primary source of data ‐ they are for comparison purposes only.

‐ 72 ‐
Source Year Data Analysis Ref
Infant Mortality
Census 1967‐79 (1972)
Census Intercensal fertility data from Own Children Technique used to impute a model life table (Coale/Demeny West)
1
1979‐89 (1985)
Census CEBCS data used to impute a model life table (Coale/Demeny West)
2
1995 Census CEBCS using MORTPAK 3
2009 Census CEBCS used to impute a model life table (Coale/Demeny West) 4
UNICEF 2001 Survey CEBCS data used to impute a model life table (Coale/Demeny West)
5
UNIGME 1990; 2012 UNIGME Projection (see UNIGME methodology page 3) 6
GBD 2013 GBD Modelled data (see reference) – added early neonatal mortality, late neonatal mortality, and post neonatal infant mortality.
8
Under Five Mortality
Census 1979‐89 (1985)
Survey CEBCS data used to impute a model life table (Coale/Demeny West)
2
1995 Survey CEBCS using MORTPAK 3
2009 Unknown Unknown 4
UNICEF 2001 Survey CEBCS data used to impute a model life table (Coale/Demeny West)
5
UNIGME 1990; 2000; 2012
UNIGME Projection (see UNIGME methodology page 3) 6
GBD 2013 GBD Modelled data (see reference) 8
Life Expectancy
Census 1967‐79 (1972) Census Intercensal fertility data from Own Children Technique used to impute a model life table (Coale/Demeny West)
1
1979‐89 (1985) Census CEBCS and intercensal estimates of adult death rates used to impute model life tables (Coale/Demeny West)
2
1999 Census CEBCS and orphanhood data used to calculate life tables using MORTPAK procedure ORPHAN (+/‐ model life tables)
3
2009 Census CEBCS and orphanhood data used to calculate life tables using MORTPAK procedure ORPHAN (+/‐ model life tables)
4
WHO 2001 Unknown Unknown 7
GBD 1970; 1980; 1990; 2000; 2010
GBD Modelled data (see reference) 9
References 1. Booth, H. Fertility and Mortality in Vanuatu: The demographic analysis of the 1979 Census. Pacific Population Paper No. 1. Noumea: South Pacific Commission; 1985. 2. Vanuatu National Planning & Statistics Office. The demographic analysis of the 1989 Census of Vanuatu: fertility, mortality and population projections. Statistics Office; 1993. 3. Vanuatu National Statistics Office. Vanuatu National population Census 1999. Demographic analysis report. Port Vila: National Statistics Office; 2001. 4. Vanuatu National Statistics Office. 2009 National Population and Housing Census. Analytic Report Volume 2. [provisional report]. 5. United Nations Children’s Fund, Ministry of Health Government of Vanuatu. Vanuatu multiple indicator cluster survey (MICS) 2007 Final Report. Port Vila, Vanuatu: 2008. 6. The United Nations Inter‐agency Group for Child Mortality Estimation (UNIGME). Levels and trends in child mortality: Report 2013. The United Nations Children’s Fund; 2013. 7. World Health Organisation 2001, Life Tables for 191 Countries: World Mortality 2000, Vanuatu 2001, viewed 24 September 2006 http://www3.who.int/whosis/life/life_tables/life_tables_process.cfm?country=vut&language=en 8. Wang H, Liddell CA, Coates MM, Mooney M ,Levitz CE, Schumacher AE, et al. Global, regional, and national levels of neonatal, infant, and under‐5 mortality during 1990–2013: a systematic analysis for the Global Burden of Disease Study 2013. Lancet. Published Online. May 2, 2014. http://dx.doi.org/10.1016/S0140‐6736(14)60497‐9. 9. Wang H, Dwyer‐Lindgren L, Lofgren KT, Knoll Rajaratnam J, Marcus JR, Levin‐Rector A et al. Age‐specific and sex‐specific mortality in 187 countries, 1970‐2010: a systematic analysis for the Global Burden of Disease Study 2010. Lancet. 380:2071‐94; 2012.

‐ 73 ‐
21.WallisandFutunaLand area (Km2) 142 2013‐mid‐year population estimate 12,100 Population growth rate (%) ‐2.1
[Source:SPCPocketSummary2013]
Trends in Child Mortality
Infant mortality has decreased to a very low level of around 5 deaths per 1000 live births.
Trends in Life Expectancy
LE has increased to the early 70s (years) in males and mid‐70s (years) in females.
Data Sources and Quality
1. Mortality data has been derived from vital registration, which is considered to be essentially
complete.
2. Mortality data may be affected by out‐migration.
3. No published estimates of under‐five mortality are available.
4. Mortality rates and estimates of LE are likely to be affected by small numbers, producing
stochastic variation over time.
Comments
Infant mortality has declined to developed country levels. LE estimates are similar to French
Polynesia, but may be affected by out‐migration.
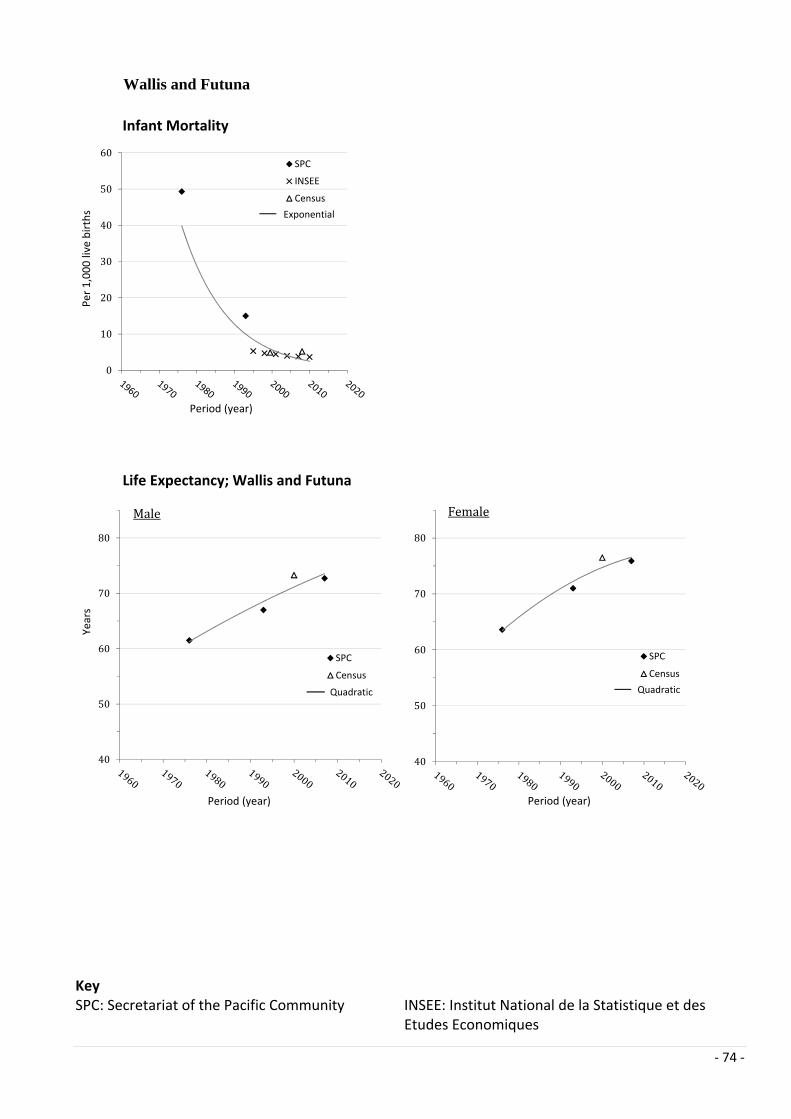
‐ 74 ‐
Wallis and Futuna
Infant Mortality
Life Expectancy; Wallis and Futuna
Key SPC: Secretariat of the Pacific Community
INSEE: Institut National de la Statistique et des Etudes Economiques
0
10
20
30
40
50
60
Per 1,000 live births
Period (year)
SPC
INSEE
Census
Exponential
40
50
60
70
80
Years
Period (year)
SPC
Census
Male
Quadratic
40
50
60
70
80
Period (year)
SPC
Census
Female
Quadratic

‐ 75 ‐
Source Year Data Analysis Ref
Infant Mortality
SPC 1974‐78 (1976) Vital registration Direct calculation 1
1990‐95 (1993) Vital registration Direct calculation 2
INSEE 1994‐2011* Unknown Unknown 3
Census 1996‐2003 (1999) Vital registration Direct calculation 4
2005‐08 (2007) Vital registration Direct calculation 5
Life Expectancy
SPC 1974‐78 (1976) Vital registration Unknown 1
1990‐95 (1993) Vital registration Unknown 2
2005‐08 (2007) Unknown Unknown 6
Census 1996‐2003 (2000) Vital registration Unknown 5
* Data points represent average of three year period around the estimate References 1. Colliez J. Donnees demographique sur Wallis et Futuna, 1936 a 1978. Notes et documents, No 12. Noumea, Service de la Statistique de la Nouvelle Caledonie, 1981. 46. And; Department of Health. Country report for Wallis and Futuna. Tenth Regional Conference of Permanent Heads of Health Services, Noumea, South Pacific Commission, 1983. Estimate cited in; Taylor R, Lewis N, Levy S. Societies in transition: mortality patterns in Pacific Island populations. International Journal of Epidemiology. 1989;18(3):634‐646. 2. Estimate cited in Taylor R, Lopez A. Differential mortality among Pacific Island countries and territories. Asia‐Pacific Population Journal. 2007; 22(3):45‐58. 3. Institut National de la Statistique et des Etudes Economiques. Evolution des deces, du taux de mortalite et du taux de mortalite infantile [Internet]. No date [cited 2012 Oct 20] Available from: http://www.insee.fr/fr/themes/tableau.asp?reg_id=0&ref_id=NATnon02230 4. Secretariat of the Pacific Community. Demographic profile of Wallis and Futuna based on the Census of 2003. Noumea: SPC; 2007. 5. Institut National de la Statistique et des Etudes Economiques. Wallis and Futuna: Census of population 2008. [Internet]. 2009 [cited 2014 Jan 15. Available from: http://www.spc.int/prism/wf/index.php/documents/cat_view/63‐recensements‐et‐enquetes/64‐recensements‐generaux‐de‐population‐rgp‐/69‐rgp‐2008 6. Secretariat of the Pacific Community. Table 7: Recent developments in fertility and mortality [Internet]. 2010 [cited 2012 Feb 5]. Available from: http://www.spc.int/sdp/index.php?option=com_docman&task=cat_view&gid=28&dir

‐ 76 ‐
AdditionalReferences
(forin‐textreferencesinreportandappendices)
Australian Bureau of Statistics. 4125.0 – Gender Indicators, Australia, Jan 2013. Life expectancy at birth [Internet].
2013 Jan [cited 2014 Jan 10]. Available from: http://www.abs.gov.au/ausstats/
Brisbane Accord Group (BAG). Civil Registration and Vital Statistics and the Pacific Vital Statistics Action Plan. 2014.
Available at: www.spc.int/sdd/index.php/en/downloads/cat_view/107‐vital‐statistics
Carter KL, Rao C, Taylor R, Lopez AD. Routine mortality and cause‐of‐death reporting and analysis in seven Pacific island countries. University of Queensland Health Information Knowledge Hub. November 2010. Available from: www.uq.edu.au/hishub/dn8
Carter K, Cornelius M, Taylor R, Ali S, Rao C, Lopez A, Lewai V, Goundar R, Mowry C. Mortality trends in Fiji. Australian and New Zealand Journal of Public Health. 35(5):412‐420, 2011.
Carter KL, Rao C, Lopez AD, Taylor R. Mortality and cause‐of‐death reporting and analysis systems in seven pacific island countries. BMC Public Health 2012, 12;436: doi: 10.1186/1471‐2458‐12‐436.
Cook Islands Ministry of Health. Health Statistics Tables 2008‐2010. Medical Records Unit Rarotonga Hospital. Rarotonga: Ministry of Health; July 2011.
[Cook Islands Statistics Office 2011] Statistics Office Cook Islands. Annual Statistical Bulletin 2011 [Internet]. 2011 [cited 2012 Oct 10]. Available from: http://www.health.gov.ck/index.php/publications/health‐statistics/annual‐bulletins
Institut National de la Statistique et des Etudes Economiques. Deaths – Mortality – Life Expectancy [Internet]. 2013 [cited 2014 Jan 10]. Available from : http://www.insee.fr/en/themes/
Ministry of Finance and Economic Management, Government of the Cook Islands. Vital statistics and population estimates June Quarter 2013 [Internet]. 2013 [cited 2014 Jan 15]. Available from: http://www.mfem.gov.ck/population‐and‐social‐statistics/vital‐stats‐pop‐est
Hufanga S, Carter K, Rao C, Lopez A, Taylor R. Mortality trends in Tonga: an assessment based on a synthesis of local data. Population Health Metrics. 2012;10(14): doi:10.1186/1478‐7954‐10‐14
Statistics Niue, Government of Niue. Niue Census of Population and Households 2011 [Internet]. 2012 [cited 2014 Jan 10]. Available from: http://www.spc.int/prism/niue/index.php/niue‐documents/cat_view/12‐surveys/13‐census/14‐census‐2011
Secretariat of the Pacific Community. National Minimum Development Indicators [Internet]. 2014 [cited 2014 May 2]. Available from: http://www.spc.int/nmdi/
Secretariat of the Pacific Community. Pocket Statistical Summary [Internet]. 2013 [cited 2014 May 2]. Available from: http://www.spc.int/prism/
Ministry of Health Samoa, Bureau of Statistics Samoa, and ICF Macro. Samoa Demographic and Health Survey 2009. Apia: Ministry of Health Samoa; 2010
Statistics New Zealand. Life expectancy [Internet]. 2014 [cited 2014 Jan 10]. Available from:
http://www.stats.govt.nz/browse_for_stats/health/life_expectancy.aspx

‐ 77 ‐
Taylor R, Carter K, Naidu S, Linhart C, Azim S, Rao C, Lopez A. Divergent mortality trends by ethnicity in Fiji. Aust NZ J Public Health. 2013; 37.6: 509‐515.Online doi: 10.1111/1753‐6405.12116
United Nations. Manual X: Indirect techniques for demographic estimation. United Nations Publication. Sales No. E.83.XIII.2; 1983.
United Nations Inter‐agency Group for Child Mortality Estimation (UNIGME). Levels and Trends in Child Mortality: Report 2013. The United Nations Children’s Fund; 2013.
United Nations Population Division. Instruction Manual: Mortpak for Windows (Version 4.3). United Nations New York, 2013
United States Census Bureau: Population Analysis System (PAS) Overview [Internet]. 2014 [cited 2014 June 10]. Available from: http://www.census.gov/population/international/software/pas/
United States Census Bureau. Births, deaths, marriages, & divorce: Life expectancy [Internet]. 2014 [cited 2014 Jan 10]. Available from: http://www.census.gov/compendia/statab/cats/births_deaths_marriages_divorces/life_expectancy.html
Shryock HS, Siegel JS , and Larmon EA. The methods and materials of demography. Vol. 2. Department of Commerce, Bureau of the Census, United States. 1980.
Wang H, Liddell CA, Coates MM, Mooney M ,Levitz CE, Schumacher AE, et al. Global, regional, and national levels of
neonatal, infant, and under‐5 mortality during 1990–2013: a systematic analysis for the Global Burden of Disease
Study 2013. Lancet. Published Online. May 2, 2014. http://dx.doi.org/10.1016/S0140‐6736(14)60497‐9.
Wang H, Dwyer‐Lindgren L, Lofgren KT, Knoll Rajaratnam J, Marcus JR, Levin‐Rector A et al. Age‐specific and sex‐
specific mortality in 187 countries, 1970‐2010: a systematic analysis for the Global Burden of Disease Study 2010.
Lancet. 380:2071‐94; 2012.
‐ 78 ‐
Appendices
Appendix 1: Outline of mortality and life expectancy calculation methods
Adjusting for under‐reporting: Registration data that is not complete, but is not severely undercounted,
may be adjusted to correct for this under‐count, and used for the calculation of mortality indices. It is
generally accepted that data should be at least 70‐80 % complete to be corrected in this manner, otherwise
it is unlikely to be representative of the population. There are several methods for adjusting for undercount
of deaths, including capture‐recapture analysis and the Brass method.
Adult survivorship: are indirect methods of estimation adult mortality based on ’widowhood’ or
’orphanhood’ of the respondent. Survey respondents are asked whether their spouses (‘widowhood’) or
parents (‘orphanhood’) are still alive. The resulting deaths are distributed in time according to the age of
the respondent and the length of ‘exposure to risk’ as “in both cases, a particular target person is known to
have been alive at the time of some past event (the birth of the respondent in the case of mothers, the
conception of the respondent in the case of fathers, and marriage in the case of spouses)” [United Nations
1983, pg 97].
Direct calculation: in relation to calculating infant or under five mortality rates this method involves
dividing the number of reported deaths under 1‐year (IMR) or under five‐years (U5MR) by the number of
reported live births in the same period.
Brass Method: (1) The Brass Growth Balance method is an approach for assessing the completeness of
adult mortality data, where the completeness equals the inverse slope of the line when the partial deaths
(deaths over age x) are plotted against the partial population (population over age x) for each age.
(2) The ‘Brass method’ for estimating child mortality is an indirect estimate using data on the mean number
of children born by five‐year age range to women 15 to 49 years old, and the proportion of these children
who are dead, by the same age groups. The technique converts the data into probabilities of dying by
taking into account both the mortality risks children are exposed to, and their length of exposure to the risk
of dying, assuming a particular model age pattern of mortality [United Nations 1983].
Children Ever Born / Children Surviving (CEBCS): is a method of collecting a partial birth history for use in
indirect estimation of child mortality indicators. Women of childbearing age are asked during a survey to
answer how many children they have ever given birth to, and how many of those children are still alive
Coale and Demeny model life tables: is a set of model life tables developed by Coale and Demeny in the
1960's. These models classify the life tables into four different sets, labelled West, East, North, and South,
according to the patterns of mortality (especially the relationship between child and adult mortality)in the
predominant regions of Europe represented in the original data.
Life table: is a set of tabulated calculations which converts observed population based mortality rates into
risk of dying at each age. The risk of dying can then be applied to a hypothetical cohort to calculate
survivors at each age, and the average life span that someone could expect to live at each age (life
expectancy), based on the observed mortality rates. It is conventionally calculated separately for males and
females.

‐ 79 ‐
Model life tables: are sets of life tables derived from empirical data from groups of countries with a similar
mortality pattern. Data is aggregated to derive “typical” patterns of mortality by age at differing levels of adult
and child mortality. An estimated life table can then be derived for countries which are not able to generate a
life table directly from their empirical data by matching known mortality. One parameter life tables often use
infant or child mortality, and two parameter life tables often employ child and adult mortality.
MORTPAK: MORTPAK is a UN developed software package for demographic measurement in developing
countries, with an emphasis on mortality measurement. It is available free from the UN Population
Division. [UN Population Division, 2013]
LTPOPDTH: A programmed spreadsheet in the PAS set that constructs and smooths a life table for both
sexes, or one sex at a time, using population and death data. [US Census Bureau, 2014]
ORPHAN: a function in MORTPAK that carries out variations of the maternal orphanhood technique to
estimate levels of adult mortality. Female adult mortality is estimated from tabulations on proportion of
population with mothers still alive by age group of respondents. [UN Population Division, 2013]
Own child method: this method “permits the estimation of age‐specific fertility rates for the 10 or 15 years
preceding a census from information on the enumerated number of children classified by single year of age
and single year of mother”. Age‐specific fertility rates are calculated essentially through “reverse‐projection
of these enumerated children back to the time of their birth” and an “estimate made of survivorship
probabilities for children” based on the Coale and Demeny model life tables. [United Nations 1983, pg 182‐
184].
PAS: The Population Analysis System (PAS) is a set of Microsoft Excel workbooks developed by the U.S.
Census Bureau containing frequently used procedures and methods in basic demographic analysis. [US
Census Bureau, 2014]
Projection: An estimate for a future period in time based on past data and a set of assumptions of how this
value should change based on mathematical characteristics of previous data, and/or under a prescribed set
of conditions, such as economic projections such as GDP.
Reconciliation: a process whereby two or more data sets (such as from Health Department reporting and
Civil Registration) are compared and combined to arrive at a single list of unique events, which can then be
used for direct calculation of mortality indices (or further adjusted for under‐count, if required).
Retrospective maternal history: is where an interviewer, as part of a survey, asks all women of
childbearing age how many children she has ever had, when they were born, and whether each of these
children are still alive, or if they have died, when this occurred. The births and deaths are summed for each
year and used to directly calculate mortality as would be done using registration data.
Reed‐Merrell method: is an approach for converting age‐standardised death rates to life table values for
probability of dying by reading values of q of a set of standard conversion tables for central death rates
(mx) by age group. [Shyrock et. al. 1980]
Smoothing: a process whereby the age‐specific mortality rates are adjusted to remove outlier values and
minimise fluctuations by fitting a trend line to various age‐groups when the age‐specific mortality is graphed
(on a log scale). This may also be performed by fitting empirical values to a closely matched model life table.
‐ 80 ‐
UN Model Life tables: a set of model life tables based on the mortality experience of developing countries
with reliable information published by the UN in the 1980s. Empirical life tables for developing countries
were grouped into four sets, plus a general set including all of them. These sets refer to the Latin American,
Chilean, South Asian, Far Eastern, and General patterns.
UNIGME methodology: Estimates for infant mortality and under‐five mortality for countries by a UN
committee derived from trends with projections based on selected data (see full report for more detailed
methodology) [UNIGME 2013]

‐ 81 ‐
Appendix 2: Additional notes on data quality
American Samoa
The 2006 to 2011 Revisions of the Western Pacific Country Health Information Profiles (CHIPS) by the World Health Organisation Western Pacific Regional Office give the under‐five mortality rate in American Samoa as 4.9 in 2002. The American Samoa Statistical Yearbook is cited as the primary source, which quotes this figure as the crude death rate per 1,000. Therefore these estimates have not been included in this report.
The life expectancy estimate for 2005 in the World Health Organisation Western Pacific CHIPS 2008 Revision (cited as the US Census Bureau) has been included on the graph as it is the only estimates in the most recent decade. It should be interpreted with caution, however, as the Western Pacific CHIPS 2011 Revision does not republish this estimate and does not give any life expectancy estimates for American Samoa.
The life expectancy estimates published in the Western Pacific CHIPS 2009 and 2010 Revision state that they refer to 2008 – however, the primary source refers to 2000, and is already included on the graph under the Secretariat of the Pacific Community series.
The life table used for the 1990 estimates of under‐five mortality and life expectancy from the American Samoa Bureau of Statistics was published in the 2000 Statistical Yearbook and has been duplicated in subsequent Statistical Yearbooks up to 2010. This table has been used once for under‐five mortality and life expectancy for 1990.
Cook islands
Records of births and deaths are compiled from the records of the Births, Deaths and Marriages Registrar of the Ministry of Justice and Lands. For the islands outside of Rarotonga, the Deputy Registrars of each island furnish these records directly to the Cook Islands Statistics Office [Cook Islands Statistical Bulletin, 2013]
All records are compiled for each inhabited island of the Cook Islands and are tabulated by the date of occurrence.
The 1996 Census states that life expectancy is “Probably overestimated by about 1 year due to under‐reporting of the number of deaths by up to 10%.”
Figures of live births and infant deaths for 1987‐2010 differ slightly between tabulations from the Ministry of Health Report [Cook Islands MoH 2011] and the Statistics Office Annual Report [Statistics Office Cook Islands 2011], with the MoH reporting higher births and infant deaths in many years, although only by a small number. Both sources have been included on the graph to allow comparison.
The under‐five mortality rate calculated from the Ministry of Health Annual Statistical Tables 2008‐2010 [Cook Islands MoH 2011] is 7 deaths per 1000 live births; however, further deaths under 5 years in this period were recorded in subsequent updates. For this reason the estimate is included on the graph, but excluded from the exponential trend line.
Fiji
French Polynesia
Guam
All Revisions of the World Health Organisation Western Pacific Country Health Information Profiles (CHIPS) contain only projections of estimated under‐five mortality in Guam.
Kiribati

‐ 82 ‐
Marshall Islands, Republic of the
Estimates of infant and under‐five mortality are derived from retrospective maternal histories or CEBCS, as well as direct calculation from births and deaths.
Life expectancies are from indirect demographic methods of CEBCS +/‐ parental survivorship data, with imputed life tables.
Micronesia, Federated States of
Nauru
New Caledonia
Niue
Estimates of infant mortality in recent periods of around 10 deaths per 1000 live births should be interpreted with caution as only one infant death reported in the 5 years (2006‐2011) was used for the calculation of this estimate [Niue Census Report 2011]. While this figure may be plausible, 10 years ago Niue’s infant mortality was 29.4/1000 (4 infant deaths recorded over 1997‐2001) [Niue Census Report 2011].
No estimates of under‐five mortality are published in the World Health Organisation Western Pacific Country Health Information Profiles (CHIPS) for Niue.
Northern Mariana Islands, Commonwealth of
Under‐five mortality estimates for the Northern Marianas are only published in the World Health Organisation Western Pacific Country Health Information Profiles (CHIPS) 2006 Revision.
Palau
Papua New Guinea
Samoa
Solomon Islands
Tokelau
The Tokelau Ministry of Health reported no deaths to the Secretariat of the Pacific Community in 2011, however, single year estimates are not considered sufficient in such a small population.
Tonga
Tuvalu
Vanuatu
Wallis and Futuna
No estimates of under‐five mortality are published in the World Health Organisation Western Pacific Country Health Information Profiles (CHIPS) for Wallis and Futuna.