Embed Size (px)
Citation preview
Mortgage REIT Sector Dynamics and Performance
Eva Steiner∗
Working Paper, January 11, 2019
Abstract
I test the hypothesis that growth and performance in the Mortgage REIT (MREIT)sector are related to bank capital ratios. Using a cross-sectional experiment across thethree main types of MREITs, I show that expansion and contraction in MREITs issignificantly related to variation in bank capital. These sector dynamics coincide withvariation in MREIT performance in terms of dividend yields. I also document howMREITs adjust investment and financing choices in response to variation in bank capital.The results constitute novel evidence on the relationships between the capitalization oftraditional banks and growth and performance in non-depository financial institutions.
∗Cornell SC Johnson College of Business, 465B Statler Hall, Ithaca, NY 14853, Email: [email protected] gratefully acknowledge support for this project from the Real Estate Research Institute. I thank BrentAmbrose, Andreas Christopoulos, Andra Ghent, Tim Riddiough, Calvin Schnure, Sheridan Titman, JohnWorth and seminar participants at UNC Chapel Hill for helpful comments.
1 Introduction
Mortgage REITs (MREITs) are specialized investment vehicles that invest in whole mortgages
and/or mortgage-backed securities (MBS). They represent an important source of credit in
the U.S. mortgage market (Adrian, Ashcraft, and Cetorelli, 2013).1 The recent past has seen a
record number of active MREITs and at a total market capitalization of $68 billion the sector
is more valuable than ever (Schnure, 2018). Since 2016 MREITs have also outperformed
Equity REITs in the stock market.2 However, despite the growing economic significance of
MREITs, little is known about the drivers of growth and performance in this sector.
A leading hypothesis posits that the growth of non-depository financial institutions in general
is related to the capitalization of traditional banks.3 When banks are well capitalized, they
have capacity to hold risky assets (He, Kelly, and Manela, 2017); when banks are forced to
lower the risk profile of their assets, this creates a growth opportunity for (better-capitalized)
non-bank financial institutions. The narrative of rapidly expanding non-depository financial
institutions during the re-capitalization of traditional banks in the aftermath of the financial
crisis fits the MREIT sector well (Schwarcz, 2012).4 In this study, I empirically assess the
importance of bank capital ratios for growth and performance in the MREIT sector.
1MREITs hold approximately 7 percent of the total Agency MBS market (Adrian, Ashcraft, and Cetorelli, 2013). Accordingto Nareit, MREITs help finance 1.8 million U.S. homes and own residential MBS worth $285 billion. Gete and Reher (2018)report that non-depository financial institutions in general originate around 80 percent of loans insured by the Federal HousingAdministration (FHA) and more than 50 percent of all mortgage loans.
2According to Nareit, MREITs had a total return of 19.79 percent in 2017 (22.85 in 2016), compared to 5.23 percent (8.52)for Equity REITs. In October 2018, dividend yields averaged 10.32 percent, more than twice the average of Equity REITs.
3See, for instance, Acharya, Schnabl, and Suarez (2013); Gorton and Metrick (2010); Plantin (2015); Pozsar, Adrian,Ashcraft, and Boesky (2013).
4MREITs are registered with the SEC but not subject to prudential regulation. Yet some MREITs invest in long-datedMBS issued by U.S. government-sponsored agencies financed with short-term repo debt, engaging in maturity transformation.Other MREITs invest in whole mortgages and/or commercial mortgage-backed securities (CMBS), providing liquidity and credittransformation. Anecdotal evidence confirms that the regulatory scrutiny of traditional banks benefits MREITs. Barry Stern-licht, CEO of Starwood Property Trust, an MREIT, notes that there are “capacity issues when your Office of the Comptrollerof Currency is staring at you the whole time. We like them to keep staring.” See Investor’s Business Daily, 2016.
1
To better identify the relationship between bank capital ratios and MREIT outcomes, I
conduct a cross-sectional experiment comparing the three main types of MREITs. Agency
Residential MREITs invest mainly in Agency Residential MBS guaranteed by U.S. government-
sponsored agencies (Fannie Mae and Freddie Mac). These MREITs are exposed to prepayment
and interest rate risk but no material credit risk. Non-Agency Residential MREITs invest in
private-label residential MBS and are thus exposed to credit risk in addition to prepayment
and interest rate risk. Commercial MREITs invest in commercial MBS and whole loans
backed by commercial properties, taking on credit and interest rate risk but little prepayment
risk given common pre-payment restrictions in commercial mortgage contracts. The three
types of MREITs provide a natural cross-sectional experiment because they are all subject to
the same statutory requirements but hold very different portfolios of assets.5
In the estimation, I control for the interest rates driving MREIT profitability.6 MREITs earn
the difference between the interest on long-term assets and their cost of capital, hedging costs,
and operating expenses. The level and slope of the term structure thus affect profitability
for all MREITs. Non-Agency Residential and Commercial MREITs take on credit risk, so I
control for the credit risk premium. I include the option-adjusted mortgage spread as Agency
Residential MREITs are exposed to prepayment risk. Many MREITs commonly finance
their assets with short-term variable-rate debt and hedge their exposure to interest rate risk
through derivatives, hence I account for the spread on interest rate swaps.
5This approach similar to Chakraborty, Goldstein, and MacKinlay (2017); Rodnyansky and Darmouni (2017); and Frameand Steiner (2018).
6Some pundits suggest that the recent emergence of MREITs is in fact primarily a result of the prevailing interest rateenvironment. See for instance Adrian, Ashcraft, and Cetorelli (2013): “The rapid growth of [mortgage] REITs since the financialcrisis can be primarily attributed to the interest rate environment.” In addition, I also control for economic fundamentals interms of recessions/expansionary periods, house prices and commercial property prices.
2

Over the period 2001-Q1 to 2017-Q4, I document that expansion and contraction in the
different MREIT sectors is significantly related to variation in bank capital ratios. The results
suggest that Agency Residential MREITs expand when bank capital ratios increase while
Non-Agency Residential and Commercial MREITs contract. I estimate that the marginal
effect of a one percentage point increase in bank capital ratios is associated with an increase in
the number of Agency Residential MREITs of 1.1 and a decline in the number of Non-Agency
Residential and Commercial MREITs of 1.6 and 1.1. I also estimate that, concurrent with
the expansion and contraction in the number of institutions, aggregate assets of Agency
Residential MREITs increase by 17.7 percent relative to the unconditional mean for a one
percentage point increase in bank capital ratios, while aggregate assets for Non-Agency
Residential and and Commercial MREITs shrink by 39.9 and 26.4 percent.
Next, I document the relationships between bank capital ratios and MREIT investment
performance. The results suggest that the expansion of Agency Residential MREITs in
response to increased bank capital ratios is accompanied by an improvement in average
Agency Residential MREIT dividend yields. I estimate that a one percentage point increase
in bank capital ratios is associated with a 55 basis points increase in dividend yields for this
MREIT type, which implies an improvement in dividend yields of 5 percent relative to the
unconditional mean. Reflecting the contraction in Non-Agency Residential and Commercial
MREITs, I estimate that a one percentage point increase in bank capital ratios is associated
with a decline in dividend yields of 34 and 157 basis points (4 and 21 percent relative to the
unconditional mean) respectively for these MREIT types. By contrast, I find little evidence
that price or total returns of MREITs are sensitive to variation in bank capital ratios.
3
Further, I estimate the response in MREIT profitability metrics as well as investment and
financing choices to variation in bank capital. The results suggest that Agency Residential
MREITs experience a decline in the yield on interest-bearing assets of 33 basis points for a one
percentage point increase in bank capital ratios. As bank capital ratios increase, banks are
able to hold riskier (higher-yielding) securities, crowding out specialized Agency Residential
MREITs which are then left with lower-yielding assets. I also estimate that these institutions
increase their holdings of repo debt and short-term debt by approximately 1 and 2 percent
relative to the unconditional mean for a one percentage point increase in bank capital ratios.
The results suggest that shortening debt maturities allows Agency Residential MREITs to
reduce their cost of capital when the yield on interest-bearing assets declines, leaving the
overall net interest margin unaffected. The results further suggest that Agency Residential
MREITs manage the increased financing risk associated with shorter debt maturities by
simultaneously reducing leverage by 7 percent relative to the unconditional mean.
By contrast, I estimate that the net interest margin of Non-Agency Residential MREITs
increases by 11 basis points for a percentage point increase in bank capital ratios, mainly
driven by a 36 basis points increase in the yield on interest-bearing assets. This result suggests
that Non-Agency Residential MREITs are pushed further up the risk curve into higher-yielding
securities when bank capitalization improves. The estimates further suggest that Non-Agency
Residential MREITs concurrently mitigate financing risk by reducing leverage slightly by 0.3
percent and lengthening debt maturities by 1.6 percent relative to the unconditional mean. I
document similar patterns for Commercial MREITs except the results suggest that for these
institutions the net interest margin is unaffected by variation in bank capital ratios.
4
Since the 2008 financial crisis, there has been a broad push towards tighter financial regulation,
notably through the re-capitalization of banks (Admati, DeMarzo, Hellwig, and Pfleiderer,
2013; Thakor, 2014). The relationship between the health of bank balance sheets and growth
in non-bank financial institutions is important for designing prudential regulation (Freixas,
Laeven, and Peydró, 2015) but empirical evidence is limited. Higher capital requirements may
increase regulatory arbitrage benefiting the growth of shadow banking institutions (Adrian and
Ashcraft, 2012; Irani, Iyer, Meisenzahl, and Peydró, 2017; Kashyap, Stein, and Hanson, 2010;
Plantin, 2015; Stein, 2010).7 My results contribute to this debate by providing novel evidence
on the relationships between bank capital ratios and growth as well as performance and
investment/financing choices of the rapidly expanding non-depository financial institutions in
the MREIT sector.
In the mortgage market, Fuster, Lo, and Willen (2017) document increased cost of financial
intermediation due to the regulatory burden on traditional banks. Buchak, Matvos, Piskorski,
and Seru (2017) and Fuster, Plosser, Schnabl, and Vickery (2018) focus on the emergence of
Fintech lenders. Gete and Reher (2018), Demyanyk and Loutskina (2016), Ganduri (2018),
and Huszar and Yu (2018) document riskier lending practices among non-bank lenders in
the mortgage market. This paper documents first-order effects of bank capitalization on
institution-level growth and performance in the MREIT sector. However, I find little evidence
that investment and financing practices of MREITs become significantly riskier as bank
capital and thus competition with regulated banks varies over time.
7There may also be other reasons for the emergence of shadow banking activities, such as technological advances or superiorknowledge (Buchak, Matvos, Piskorski, and Seru, 2017; Ordoñez, 2018). Growth in the shadow banking sector may also befacilitated by the low interest rate environment characterizing the period of time since the 2008 financial crisis (Adrian, Ashcraft,and Cetorelli, 2013).
5
Within the REIT industry, empirical evidence on the performance of MREITs is scarce
and often outdated. For instance, Chen and Peiser (1999) include mortgage REITs in their
performance analysis but the study period ends in 1997. Frame and Steiner (2018) study the
effects of unconventional monetary policy on the Agency Residential MREIT market, with a
focus on risk taking in that sector. Pellerin, Sabol, and Walter (2013) provide a descriptive
overview of these institutions. Expanding on prior work, this paper analyzes the sensitivity of
MREIT growth and performance to the capitalization of institutions in the traditional banking
sector, and characterizes time series and cross-sectional variation in MREIT performance as
a function of the prevailing interest rate environment and macroeconomic fundamentals.
Lastly, the results presented in this study also contribute to the well-established literature on
the interest rate sensitivity of REITs, see for instance, Allen, Madura, and Springer (2000);
Bae (1990); Chen and Tzang (1988); He, Webb, Myer, et al. (2003); Mueller and Pauley
(1995); Swanson, Theis, and Casey (2002) and Liow, Ooi, and Wang (2003). This literature
is predominantly focused on equity REITs and ignores MREITs, with the notable exception
of Liang and Webb (1995). However, the evidence in that study significantly predates the
2008 financial crisis and does not address the relative importance of interest rate factors and
the capitalization of traditional banks in the performance of different MREIT types.
The remainder of this paper is structured as follows. Section 2 presents data sources,
descriptive statistics, and univariate trends. Section 3 discusses identification and empirical
approach. Section 4 presents the main empirical results. Section 5 concludes.
6
2 Data and Sample Description
2.1 Data Sources and Variable Construction
I study MREITs with non-missing assets over the period 2001-Q1 to 2017-Q4. I sort MREITs
into three categories which reflect the typical business models in the sector: Agency Residential
MREITs, Non-Agency Residential MREITs, and Commercial MREITs (see Schnure, 2018).
The distinction between Residential and Commercial MREITs is based on the Nareit Index
Classification. The distinction between Agency and Non-Agency Residential MREITs is based
on the average amount of agency securities held relative to total assets, where an institution
is classified as an Agency MREIT is the average share of agency securities is greater than 50
percent over the life of the institution in the sample (Frame and Steiner, 2018).
I obtain all MREIT-level data from the Real Estate section of S&P Global. For each institution,
I collect quarterly data on total assets to calculate institution size. Further, I collect quarterly
data on dividend yields, price return and total stock return as equity market-based measures
of performance. I also collect quarterly data on net interest margin (spread between interest
income on assets and funding costs) and interest yield (yield on interest-bearing assets)
as accounting-based measures of MREIT profitability. To characterize MREIT investment
profiles on the asset side of the balance sheet, I collect quarterly data on agency securities
held (as a measure of prepayment risk exposure) and investment-grade securities held (credit
risk exposure). On the liability side, I collect quarterly data on total leverage, measured as
the ratio of total equity to assets (liquidity risk exposure), as well as repurchase agreements
(repo debt) and short-term debt (refinancing risk exposure).
7

Further, I obtain data on the quarterly number of MREIT IPOs and quarterly dollar volume
of equity raised in MREIT IPOs from Nareit’s REIT Capital Offering files. The Nareit files
provide IPO data on the level of individual institutions and indicate institution categories,
allowing me to calculate the quarterly number and volume of IPOs by MREIT category.
The main independent variable of interest should reflect the capacity of depository institutions
to hold risky assets on-balance sheet. I use the Banking section of S&P Global to obtain
data on the ratio of tier-1 capital to total risk-weighted assets for traditional banks in the
U.S.. Tier-1 capital is the capital reported under the U.S. Basel III revised rules. Total
risk-weighted assets are defined by the latest regulatory and supervisory guidelines. In my
analysis, I use the quarterly aggregate tier-1 capital ratio across institutions.
To construct the covariates, I obtain the following interest rate data from the Federal Reserve
Bank of St Louis’s Economic Database (FRED). The level and slope of the term structure are
based on the 3-month and 1-year Constant Maturity Treasury rate. The term spread is the
difference between the 10-year and 3-month rates. I obtain data on Baa-rated corporate bond
yields and calculate the credit spread as the difference between those yields and the 10-year
Treasury rate. I obtain data on the 1-Year ICE Swap Rate from Bloomberg as a proxy for
the cost of hedging interest rate exposure. I use the Barclays US MBS Fixed Rate Average
option-adjusted mortgage spread (OAS) from Bloomberg as a proxy for prepayment risk. I
control for property market and macroeconomic fundamentals using quarterly changes in the
Case-Shiller House Price Index, obtained from FRED, quarterly changes in the Commercial
Property Price Index published by Real Capital Analytics (RCA), and a quarterly indicator
for recessionary periods as defined by the National Bureau of Economic Research.
8
2.2 Descriptive Statistics
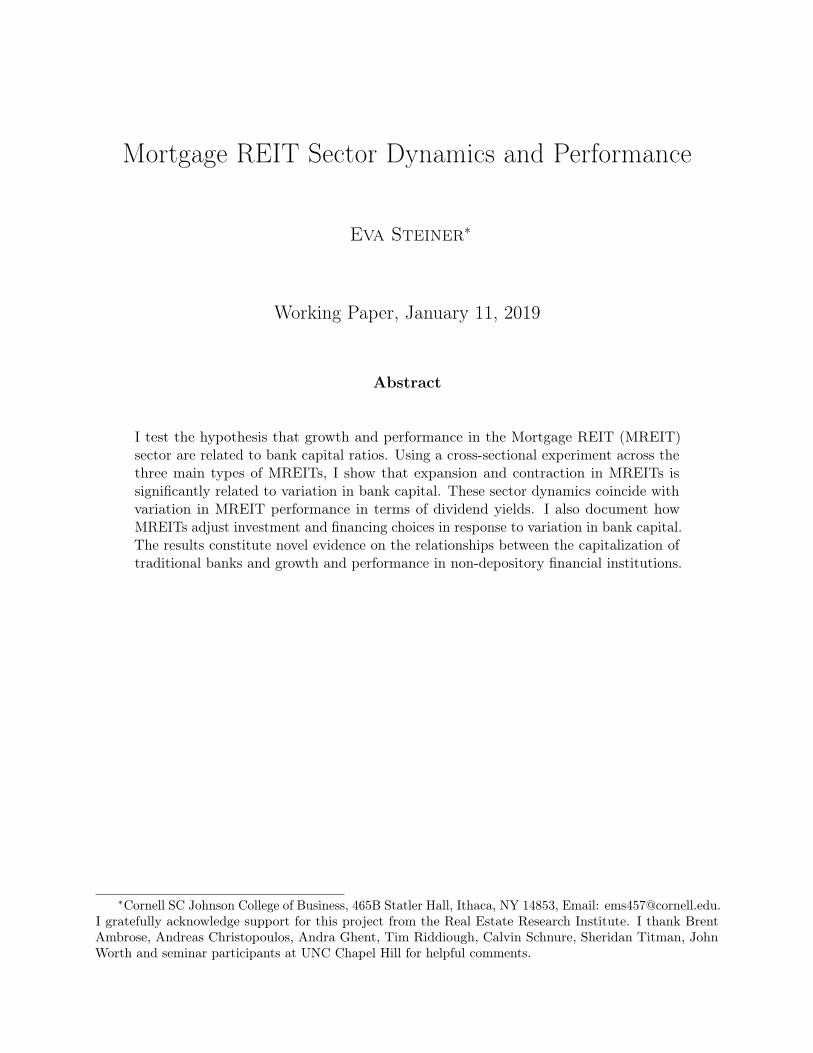
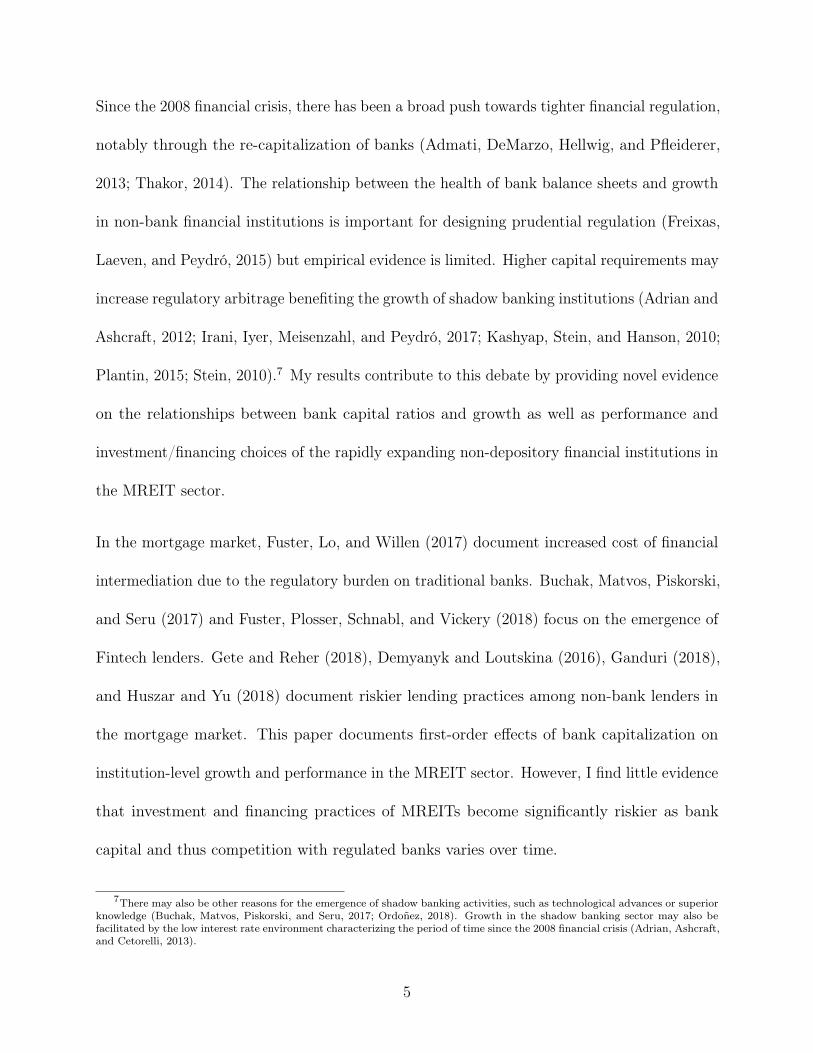
Figure 1 presents the time series of the number of institutions (Panel (a)) and aggregate
assets (Panel (b)) in the Equity and MREIT sectors between 2001-Q1 and 2017-Q4. As of
2017-Q4, there are 39 active MREITs and 189 Equity REITs, while aggregate assets total $476
billion for MREITs and approximately $1 trillion for Equity REITs. The MREIT sector is
thus smaller than the Equity REIT sector but it is larger than ever by number of institutions
and aggregate assets after a period of strong growth since the end of the financial crisis.
Equity REITs and MREITs: Number of Institutions and Aggregate Assets
0
50
100
150
200
250
2001
-Q1
2002
-Q1
2003
-Q1
2004
-Q1
2005
-Q1
2006
-Q1
2007
-Q1
2008
-Q1
2009
-Q1
2010
-Q1
2011
-Q1
2012
-Q1
2013
-Q1
2014
-Q1
2015
-Q1
2016
-Q1
2017
-Q1
Num
ber o
f Ins
titut
ions
Equity REIT Mortgage REIT
(a) Number of Institutions
0
200
400
600
800
1,000
1,200
1,400
1,600
1,800
2001
-Q1
2002
-Q1
2003
-Q1
2004
-Q1
2005
-Q1
2006
-Q1
2007
-Q1
2008
-Q1
2009
-Q1
2010
-Q1
2011
-Q1
2012
-Q1
2013
-Q1
2014
-Q1
2015
-Q1
2016
-Q1
2017
-Q1
Agg
rega
te A
sset
s ($
bn)
Equity REIT Mortgage REIT
(b) Aggregate Assets
Figure 1: The Figure shows the time series evolution of the number of institutions in the Equityand MREIT sectors (Panel (a)) and aggregate assets (in $ bn) by sector (Panel (b)) over the period2001-Q1 to 2017-Q4. The data used to produce this Figure is obtained from S&P Global.
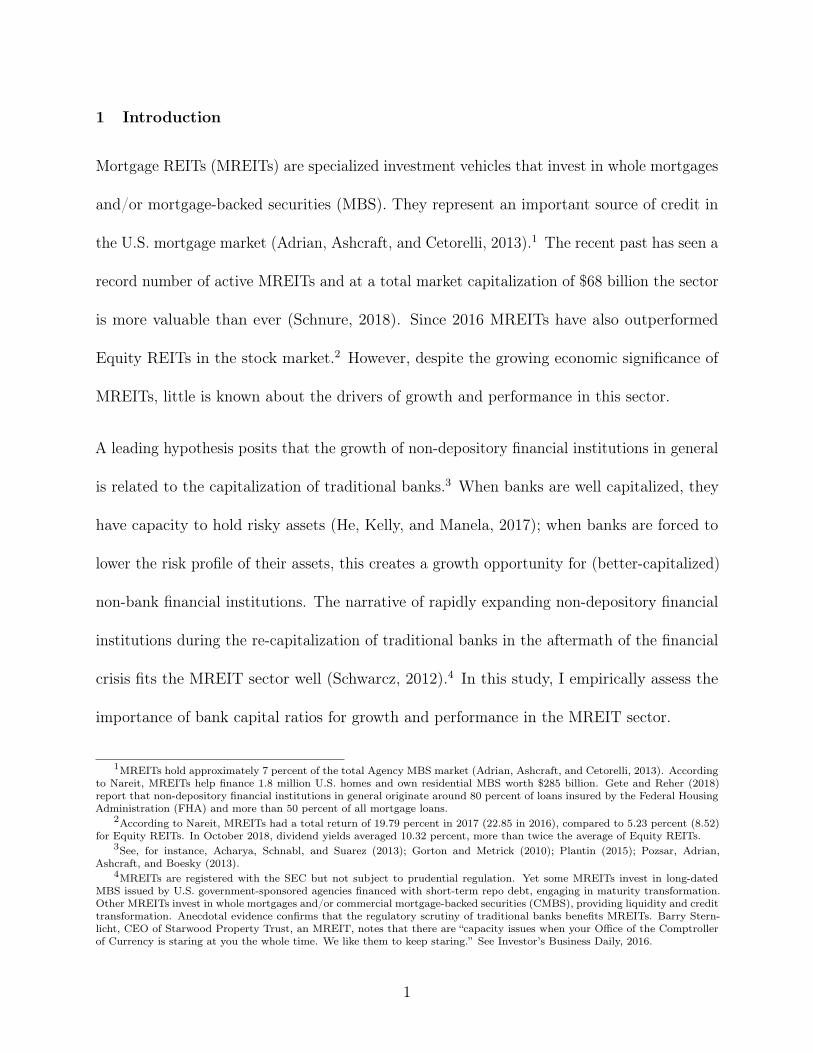
Figure 2 presents the time series of the number of institutions (Panel (a)) and aggregate assets
(Panel (b)) by MREIT type over the period 2001-Q1 to 2017-Q4. The Figure shows that the
MREIT sector is dominated by Agency Residential MREITs, which account for 44 percent
of institutions and 75 percent of aggregate assets as of 2017-Q4, followed by Commercial
MREITs (36 and 14 percent) and Non-Agency Residential MREITs (22 and 11 percent). The
9

period leading up to the financial crisis was characterized by the expansion of Non-Agency
Residential MREITs, while Agency Residential and Commercial MREITs have expanded
more since the end of the financial crisis.
Number of Institutions and Aggregate Assets By MREIT Type
0
5
10
15
20
25
30
35
40
45
2001
-Q1
2002
-Q1
2003
-Q1
2004
-Q1
2005
-Q1
2006
-Q1
2007
-Q1
2008
-Q1
2009
-Q1
2010
-Q1
2011
-Q1
2012
-Q1
2013
-Q1
2014
-Q1
2015
-Q1
2016
-Q1
2017
-Q1
Num
ber o
f Ins
titut
ions
Agency Residential MREIT Non-Agency Residential MREIT Commercial MREIT
(a) Number of Institutions
0
100
200
300
400
500
600
2001
-Q1
2002
-Q1
2003
-Q1
2004
-Q1
2005
-Q1
2006
-Q1
2007
-Q1
2008
-Q1
2009
-Q1
2010
-Q1
2011
-Q1
2012
-Q1
2013
-Q1
2014
-Q1
2015
-Q1
2016
-Q1
2017
-Q1
Agg
rega
te A
sset
s ($
bn)
Agency Residential MREIT Non-Agency Residential MREIT Commercial MREIT
(b) Aggregate Assets
Figure 2: The Figure shows the time series evolution of the number of institutions (Panel (a)) andaggregate assets (Panel (b)) by MREIT type over the period 2001-Q1 to 2017-Q4. The data used toproduce this Figure is obtained from S&P Global.
Panel A of Table 1 presents descriptive statistics on quarterly institution-level variables
between 2001-Q1 and 2017-Q4. On average, there were 13 Agency Residential, 7 Non-Agency
Residential and 8 Commercial MREITs active over the study period. Commercial MREITs
were most likely to go public during the study period, followed by Non-Agency Residential
and then Agency Residential MREITs. Correspondingly, quarterly aggregate IPO volume
totaled $46 million for Agency Residential, $67 million for Non-Agency Residential and $71
million for Commercial MREITs. Agency Residential MREITs are the largest MREIT type
by quarterly aggregate assets with $190 billion on average, as compared to $40 billion for
Non-Agency Residential and $21 billion for Commercial MREITs.
10
On average, Agency Residential MREITs produced the highest quarterly dividend yield and
total return across the three MREIT types (10.88 and 3.54 percent), whereas Commercial
MREITs produced the highest quarterly price return (0.56 percent). Commercial MREITs
also exhibit the highest quarterly net interest margin (4.48 percent) and the highest yield
on interest-bearing assets (7.30 percent). The Table further shows that even Non-Agency
MREITs hold some agency securities albeit significantly less than dedicated Agency Residential
MREITs with an average share of agency securities to total assets of 85 percent. The focus
on high-quality agency securities is also reflected in the average share of investment-grade
securities held by Agency Residential MREITs as compared to the other MREIT types (79
percent as compared to 26 and 17 percent for Non-Agency Residential and Commercial
MREITs). Agency Residential MREITs also have the highest leverage with a ratio of equity
to assets of 14 percent; at the same time, these institutions hold the highest shares of repo
debt (63 percent) and short-term debt (44 percent) across the three MREIT types.
Panel B of Table 1 presents descriptive statistics on the macroeconomic variables used in this
study. The bank capital ratio averages 12.56 percent over the study period. The yield on the
3-month Treasury averages 1.30 percent during the study period; the mean term spread is
2.02 percent; the 1-year swap rate (cost of hedging) averages 1.90 percent; the mean credit
spread is 2.70 percent, and the OAS averages 0.50 percent. The quarterly change in the
House Price Index (HPI) is 0.90 percent as compared to 1.01 percent for the Commercial
Property Price Index (CPPI). The likelihood of a given quarter experiencing a recession as
defined by the NBER was 13 percent on average.
[Table 1 about here.]
11
3 Method
3.1 Empirical Approach
To better identify the relationships between bank capital and MREIT outcomes, I compare the
three MREIT types. Agency Residential MREITs invest predominantly in Agency Residential
MBS guaranteed by the GSEs and thus do not take on material credit risk. By contrast, these
MREITs are exposed to prepayment and interest rate risk. Non-Agency Residential MREITs
invest in private-label residential MBS without implicit government guarantees and are thus
exposed to credit risk in addition to prepayment and interest rate risk. Commercial MREITs
invest in commercial MBS and whole loans backed by commercial properties, exposing them
to credit and interest rate risk, albeit little prepayment risk. These three types of institutions
provide a natural cross-sectional comparison as they are all subject to the same statutory
requirements but hold very different portfolios of assets with varying risk profiles.8
I expect a positive relationship between higher bank capital ratios and Agency Residential
MREITs but a an inverse relationship with the other two MREIT types. When banks are
well capitalized they have the capacity to hold riskier assets such as private-label residential
MBS and commercial real estate debt, curtailing growth in the Non-Agency Residential and
Commercial MREIT sectors relative to Agency Residential MREITs. By contrast, when
banks are capital-constrained, forcing them to retain only the safest assets, this creates a
growth opportunity for Non-Agency Residential and Commercial MREITs while growth for
Agency Residential MREITs, which now compete with banks for the safest MBS, is curtailed.
8This approach similar to Chakraborty, Goldstein, and MacKinlay (2017); Rodnyansky and Darmouni (2017); and Frameand Steiner (2018).
12
3.2 Regression Specification
To test the hypothesis that bank capital ratios are related to MREIT sector dynamics, I study
the quarterly number of active institutions, number of IPOs, aggregate IPO dollar volume
and aggregate assets by MREIT type over the period 2001-Q1 to 2017-Q4. To better identify
the empirical relationships, I contrast the response to variation in bank capital ratios across
the three types of MREITs (Agency Residential MREIT, Non-Agency Residential MREIT,
Commercial MREIT) as discussed. I begin by regressing the number of active MREITs by
MREIT category on bank capital ratios9 and control variables as shown in Equation (1):
NOi,t = β1MREITi ×BankCapt + β2MREITi + β3BankCapt + β4Macrot + ui,t (1)
where NOi,t denotes the number of institutions active in MREIT category i at time t.
MREITi denotes the three MREIT categories, where Agency Residential MREITs are
excluded as the base category. BankCapt is the tier-1 capital ratio of traditional banks at
time t. MREITi×BankCapt is an interaction term between MREIT type indicators and the
bank capital ratio. I control for the following macroeconomic factors (Macrot): interest rate
risk (level and slope of the term structure); the cost of hedging interest rate exposure; the
credit risk premium; and prepayment risk. I control for house as well as commercial property
market prices and for recessions/expansions; ui,t is the residual. I estimate equation (1)
using OLS with robust standard errors. In alternative specifications, I replace the dependent
variable with the number of IPOs, log of IPO volume and log of aggregate assets.
9Note that all results are robust to lagging the regulatory capital ratio as well. For brevity, results are not tabulated butcan be made available on request.
13

To assess the relationship between MREIT performance and bank capital ratios, I replicate
equation (1) but replace the dependent variable with the quarterly average dividend yield,
price return and total return by MREIT type. To characterize the relationship between
MREIT performance drivers and bank capital ratios, I replace the dependent variable in (1)
with measures of MREIT profitability by MREIT type (average net interest margin and yield
on interest-bearing asset) as well as characteristics on the asset side of the balance sheet
(agency securities to total assets and investment-grade securities to total assets) and liability
side of the balance sheet (equity to assets, repo debt to asset and short-term debt to assets).
4 Results
4.1 MREIT Sector Dynamics and Bank Capital
Table 2 presents the results from estimating Equation (1). The equation describes quarterly
MREIT sector dynamics by MREIT type as a function of bank capital ratios and covariates.
[Table 2 about here.]
Column (1) presents the results for the number of active institutions. I estimate that
the number of active Agency Residential MREITs increases by approximately 1.1 for each
percentage point increase in the bank capital ratio while the numbers of active Non-Agency
Residential and Commercial MREITs decline by 1.6 and 1.1. The results suggest that as
bank capitalization improves, banks have capacity to carry riskier assets on their balance
sheet, leaving less risky Agency Residential MBS for MREITs specializing in this asset class
while curtailing growth opportunities for Non-Agency Residential and Commercial MREITs,
which predominantly invest in riskier real estate debt and related securities.
14
Columns (2) and (3) present the results for the number of IPOs and the log of aggregate IPO
dollar volume. I estimate a weakly positive relationship between bank capital ratios and the
number of Agency Residential MREIT IPOs and insignificant results relating to the number
of IPOs in the Non-Agency Residential and Commercial MREIT sectors and IPO volume in
any MREIT sector. The results suggest that the relationships between bank capital ratios
and the number of active MREITs are driven by existing institutions leaving the market in
response to variation in bank capital ratios, rather than by institutions entering the market.
Column (4) presents the results for aggregate assets by MREIT type. Given the log-lin
specification, the results suggest that an increase in the bank capital ratio of one percentage
point is associated with an increase in aggregate assets of Agency Residential MREITs of
17.7 percent relative to the unconditional mean, whereas aggregate assets for Non-Agency
Residential and Commercial MREITs decline by 39.3 and 26.4 percent. The estimates suggest
that the number of active institutions in the different MREIT categories and the aggregate
assets of those institutions respond in similar ways to variation in bank capital ratios.
In all, the evidence is consistent with the hypothesis that MREIT sector dynamics are linked
to the capitalization of the traditional banking sector. The results suggest that when banks
are well capitalized, they are able to carry riskier assets on their balance sheet, creating a
growth opportunity for Agency Residential MREITs that focus on investing in lower-risk,
institutional-grade, government-guaranteed Agency MBS. On the other hand, when banks
are capital-constrained and have to prune their portfolios of riskier assets, retaining only
the safest investments, this creates a growth opportunity for Non-Agency Residential and
Commercial MREITs that focus on investing in riskier real estate debt and related securities.
15
4.2 MREIT Performance as a Function of Bank Capital
Next, I assess the relationships between bank capital and quarterly measures of MREIT stock
market performance. Table 3 presents the results from estimating Equation (1) for average
dividend yields, price return and total return by MREIT type as dependent variables.
[Table 3 about here.]
Column (1) presents the results for the quarterly average dividend yield by MREIT type. I
estimate that a one percentage point increase in bank capital is associated with an increase in
the dividend yield for for Agency Residential MREITs of 55 basis points or 5 percent relative
to the unconditional mean while dividend yields decline by 34 and 157 basis points (4 and
21 percent, respectively) for Non-Agency Residential and Commercial MREITs. The results
suggest that the growth opportunities for the different MREIT types associated with variation
in bank capital are concurrently reflected in MREIT performance in terms of dividend yields.
The estimates in Column (2) suggest that a one percentage point increase in bank capital is
associated with an increase in the quarterly price return for Commercial MREITs of 1.65
percentage points (almost three times the unconditional average). Given the evidence on
lower dividend yields for these MREITs when bank capital increases, the estimates indicate
that investors anticipate future growth in this sector. I find no evidence that price returns
for Agency or Non-Agency Residential MREITs are affected by variation in bank capital, or
that total returns of any MREIT type are affected (Column (3)). The results suggest that
price and total returns of of most MREIT types are resilient to variation in bank capital even
though dividends may be significantly affected.
16
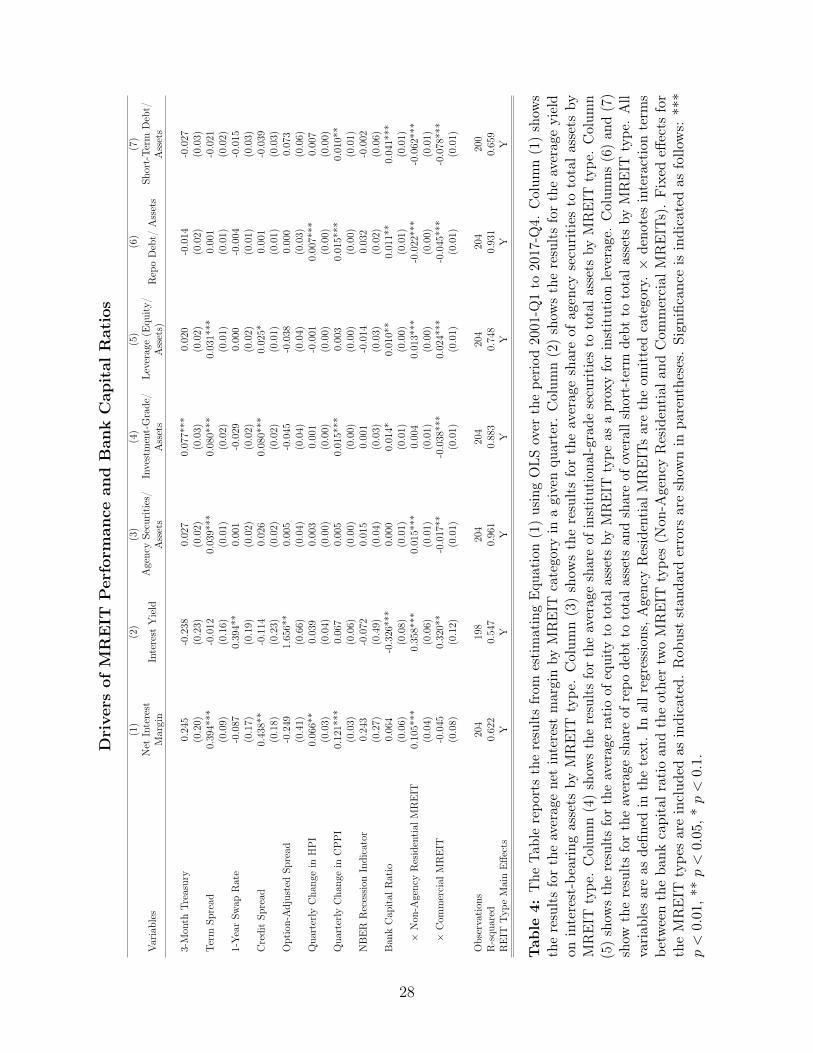
4.3 Drivers of MREIT Performance
In this section, I document the drivers through which bank capital influences MREIT perfor-
mance. MREITs may modify their investment and/or financing choices to take advantage of
the growth opportunities afforded to them through variation in bank capital ratios. Table
4 presents the estimation results for Equation (1), regressing a set of MREIT profitability
measures as well as asset and liability characteristics on bank capital and covariates.
[Table 4 about here.]
For Agency Residential MREITs, Column (1) shows that the net interest margin is insensitive
to variation in bank capital. By contrast, Column (2) shows that a one percentage point
increase in bank capital ratios is associated with a 33 basis points decline in the yield on
interest-bearing assets. As bank capitalization improves, banks are able to hold riskier assets
and thus invest in higher-yielding securities, leaving safer, lower-yielding securities for Agency
Residential MREITs. This relationship is also reflected in the slight increase in investment-
grade securities held by Agency Residential MREITs in response to higher bank capital ratios
(Column (4)). The results in Column (5) suggest that Agency Residential MREITs reduce
leverage (increase equity-to-assets ratios) by 0.01 or 7 percent relative to the unconditional
mean. At the same time, I estimate that Agency Residential MREITs increase their exposure
to repo debt, which is mostly short-term, and short-term debt overall by approximately 1 and
2 percent (Columns (6) and (7)). The increased reliance of Agency Residential MREITs on
less costly shorter-term debt while the average yield on interest-bearing assets declines allows
these institutions to keep net interest margins stable when bank capital ratios increase.
17

For Non-Agency Residential MREITs, the estimates in Column (1) show that the marginal
effect on the net interest margin of a one percentage point increase in bank capital is 11 basis
points, while the marginal effect on the yield on interest-bearing assets is 36 basis points
(Column (2)). As bank capitalization improves, banks are able to hold riskier assets and thus
invest in higher-yielding securities, forcing Non-Agency Residential MREITs into even higher-
yielding assets. The estimates in Column (3) suggest that Non-Agency Residential MREITs
seek to counteract this exposure to higher-yielding, riskier assets when bank capital ratios rise
by increasing their holdings of safer Agency MBS. By contrast, the share of investment-grade
securities held by Non-Agency Residential MREITs is insensitive to variation in bank capital
ratios (Column (4)). The results in Column (5) suggest that Non-Agency Residential MREITs
slightly reduce leverage by 0.013 or 0.3 percent relative to the unconditional mean. At the
same time, I estimate that Non-Agency Residential MREITs reduce their exposure to repo
debt and short-term debt by approximately 0.5 and 1.6 percent (Columns (6) and (7)). The
results suggest that Non-Agency Residential MREITs hedge their increased exposure to
higher-yielding, riskier securities in response to higher bank capital ratios by adopting a more
conservative financing profile with lower leverage and longer debt maturities.
For Commercial MREITs, I find no association between variation in bank capital and the
net interest margin (Column (1)) but I estimate that the marginal effect on the yield on
interest-bearing assets of a one percentage point increase in bank capital is 32 basis points
(Column (2)). As for Non-Agency Residential MREITs, higher bank capital ratios crowd
Commercial MREIT investment into higher-yielding assets. In contrast to Non-Agency
Residential MREITs, the results suggest that Commercial MREITs concurrently reduce their
18
holdings of safer assets such as Agency MBS and investment-grade securities (Column (3)
and (4)). However, the results in Column (5) suggest that Commercial MREITs reduce
leverage by 0.024 or almost 1 percent relative to the unconditional mean. At the same time,
I estimate that Commercial MREITs reduce their exposure to repo debt and short-term debt
by approximately 0.7 and 0.6 percent (Columns (6) and (7)). The results suggest that, similar
to Non-Agency Residential MREITs, Commercial MREITs hedge their increased exposure
to higher-yielding, riskier securities in response to higher bank capital ratios by reducing
financing risk through lowering leverage and lengthening debt maturities.
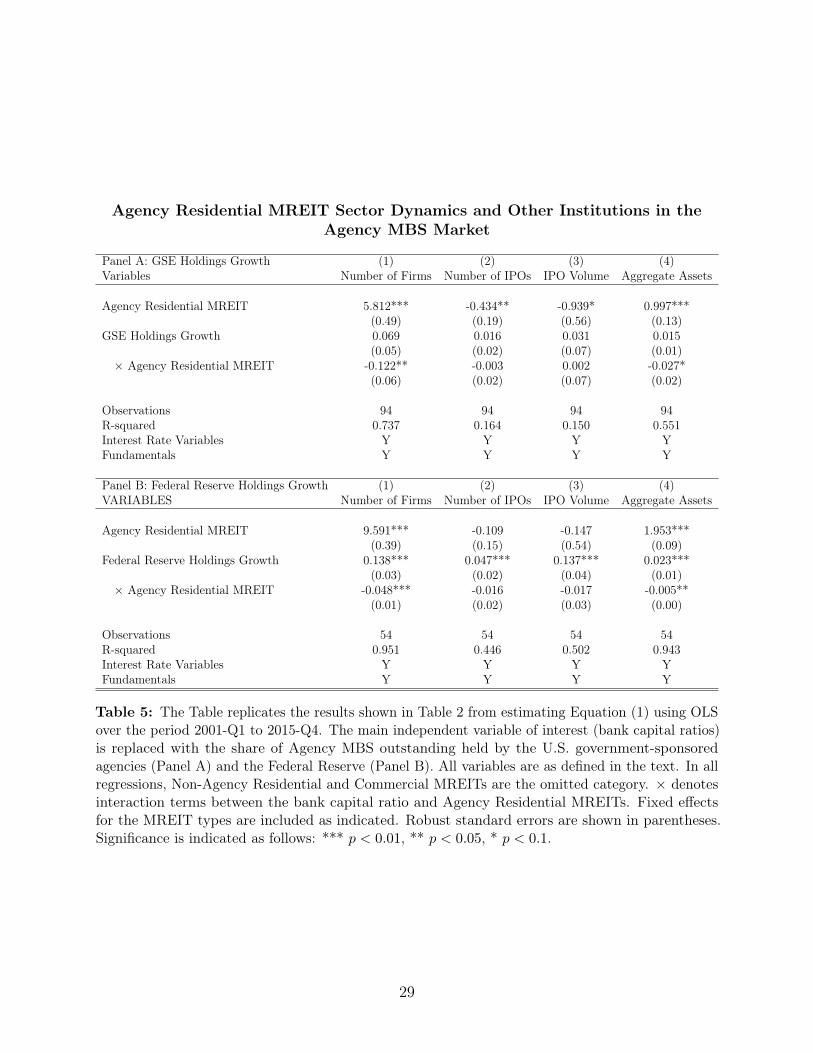
4.4 The Role of Other Institutions in the Agency Residential MBS Market
In the Agency MBS market, traditional banks are not the only institutions whose activity might
affect MREIT outcomes. Frame and Steiner (2018), who analyze the effect of unconventional
monetary policy and Agency MREIT growth and risk taking in detail, report that the increase
in Agency MREIT market share coincided with the shrinkage of Agency MBS holdings by the
U.S. government-sponsored agencies, which had long been the largest investors in this market.
Starting with QE1 in 2009-Q1, the central bank quickly became the largest investor in the
Agency MBS market. In this section, I assess the relationships between the activity of the U.S.
government-sponsored agencies and the Federal Reserve Bank in the Agency MBS market
and Agency Residential MREIT outcomes versus the other two MREIT types. I obtain data
on the Agency MBS holdings of the central bank and the U.S. government-sponsored agencies
as a share of total Agency MBS outstanding from the Federal Reserve Bank of New York. I
then employ quarterly growth rates of the holdings shares to replace bank capital ratios as
the independent variable in re-estimating equation (1).
19
The results in Table 5 suggest that an increase in the share of Agency MBS held by the U.S.
government-sponsored agencies (Panel A) and the Federal Reserve (Panel B) is associated
with a decline in the number of Agency Residential MREITs and their aggregate assets
relative to the other two MREIT types. This result is consistent with Frame and Steiner
(2018), who document that the central bank’s activity in the Agency MBS market crowds
out investment by Agency Residential MREITs. I find no evidence that Agency Residential
MREIT IPO activity is affected by the holdings shares of the U.S. government-sponsored
agencies or the central bank.
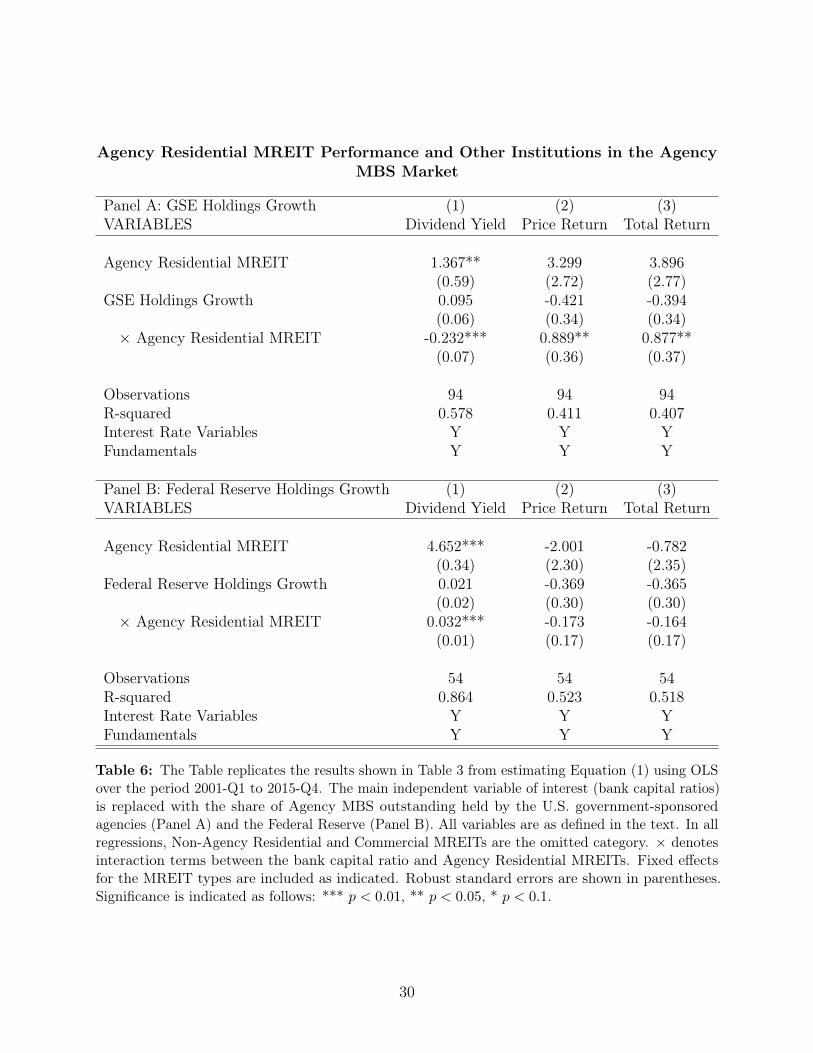
[Tables 5 to 7 about here.]
The estimates in Table 6 show that Agency Residential MREIT dividend yields benefitted
when the U.S. government-sponsored agencies withdrew from the Agency MBS market. The
results also suggest that Agency Residential MREIT price and total returns increase in the
U.S. government-sponsored agencies’ holdings share, likely as markets anticipate a future
growth opportunity. I also document a positive relationship between the Federal Reserve’s
Agency MBS holdings share and Agency Residential MREIT dividend yields.
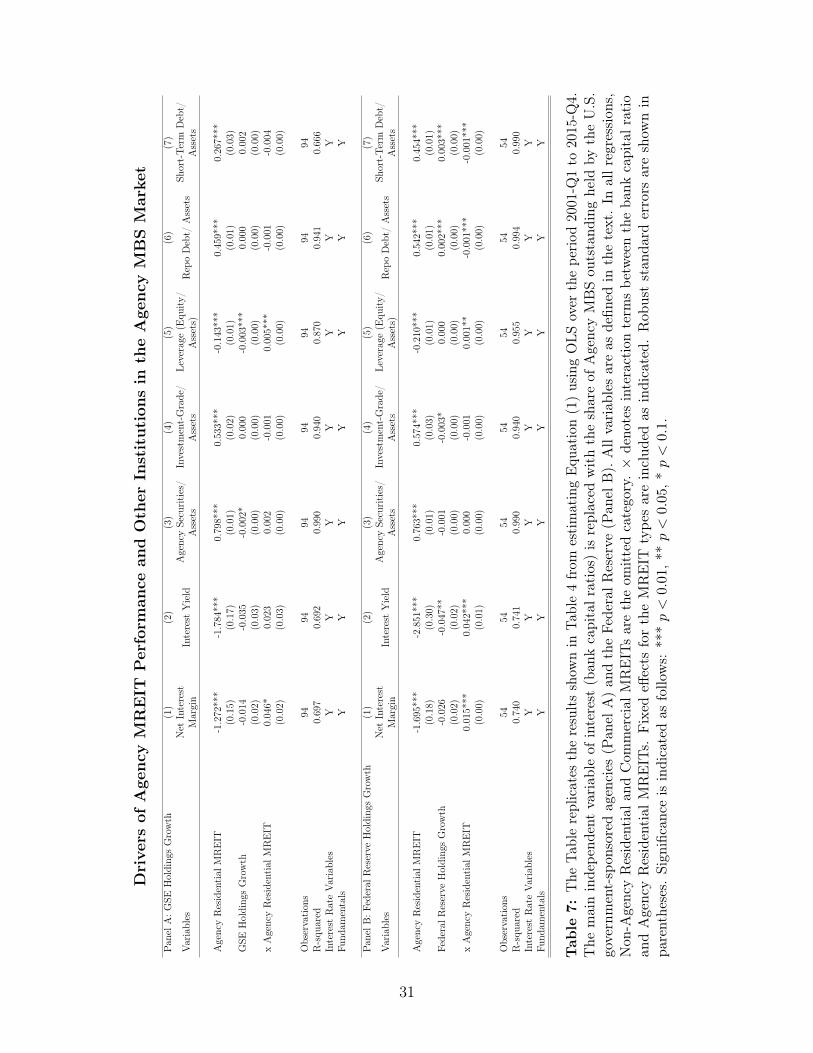
The estimates in Table 7 suggest that Agency MREIT profitability improves in response to
greater holdings shares by the U.S. government-sponsored agencies and the Federal Reserve
as Agency Residential MREITs are crowded into holding higher-yielding securities. At the
same time, the estimates suggest that this trend is counter-balanced by Agency Residential
MREIT adopting a more conservative posture in terms of their financing choices with higher
equity-to-assets ratios and reduced exposure to repo and general short-term debt.
20
5 Conclusion
MREITs represent an important source of capital in the U.S. mortgage market but little is
known about the drivers of growth and performance in this sector. I test the hypothesis that
growth and performance in MREITs are related to bank capital ratios. To better identify the
effects, I employ a cross-sectional experiment across the three main types of MREITs, Agency
and Non-Agency Residential as well as Commercial MREITs. Over the period 2000-Q1 to
2017-Q4, I show that expansion and contraction in MREITs is significantly related to variation
in bank capital. I also document that these sector dynamics coincide with variation in MREIT
performance in terms of dividend yields. The results further illustrate how MREITs adjust
investment and financing choices in response to variation in bank capital. However, I find
little evidence that MREITs adopt riskier investment or financing policies as bank capital
and thus competition from banks for assets varies. The findings presented in this study
constitute novel evidence on the relationships between the capitalization of traditional banks
and growth and performance in non-depository financial institutions. The results here also
contribute to the long-standing literature on the performance and interest rate sensitivity of
REITs, which often excludes MREITs from empirical analyses.
21
References
Acharya, V. V., P. Schnabl, and G. Suarez (2013): “Securitization Without RiskTransfer,” Journal of Financial Economics, 107(3), 515–536.
Admati, A. R., P. M. DeMarzo, M. F. Hellwig, and P. C. Pfleiderer (2013):“Fallacies, irrelevant facts, and myths in the discussion of capital regulation: Why bankequity is not socially expensive,” SSRN Working Paper.
Adrian, T., A. Ashcraft, and N. Cetorelli (2013): “Shadow Bank Monitoring,” StaffReports 638, Federal Reserve Bank of New York.
Adrian, T., and A. B. Ashcraft (2012): “Shadow Banking Regulation,” Annual Reviewof Financial Economics, 4(1), 99–140.
Allen, M. T., J. Madura, and T. M. Springer (2000): “REIT Characteristics andthe Sensitivity of REIT Returns,” Journal of Real Estate Finance and Economics, 21(2),141–152.
Bae, S. C. (1990): “Interest rate changes and common stock returns of financial institutions:revisited,” Journal of Financial Research, 13(1), 71–79.
Buchak, G., G. Matvos, T. Piskorski, and A. Seru (2017): “Fintech, RegulatoryArbitrage, and the Rise of Shadow Banks,” Working Paper 23288, National Bureau ofEconomic Research.
Chakraborty, I., I. Goldstein, and A. MacKinlay (2017): “Monetary Stimulus andBank Lending,” Discussion paper, Finance Down Under Conference.
Chen, J., and R. Peiser (1999): “The Risk and Return Characteristics of REITs 1993-1997,”Real Estate Finance, 16(1), 61–68.
Chen, K., and D. D. Tzang (1988): “Interest-Rate Sensitivity of Real Estate InvestmentTrusts,” Journal of Real Estate Research, 3(3), 13–22.
Demyanyk, Y., and E. Loutskina (2016): “Mortgage Companies and Regulatory Arbi-trage,” Journal of Financial Economics, 122(2), 328–351.
Frame, W. S., and E. Steiner (2018): “Unconventional Monetary Policy and Risk-Taking:Evidence from Agency Mortgage REITs,” SSRN Working Paper.
Freixas, X., L. Laeven, and J.-L. Peydró (2015): Systemic Risk, Crises, and Macro-prudential Regulation. MIT Press.
Fuster, A., S. H. Lo, and P. S. Willen (2017): “The Time-Varying Price of FinancialIntermediation in the Mortgage Market,” Working Paper 23706, National Bureau ofEconomic Research.
22
Fuster, A., M. Plosser, P. Schnabl, and J. Vickery (2018): “The Role of Technologyin Mortgage Lending,” Working Paper 24500, National Bureau of Economic Research.
Ganduri, R. (2018): “Repo Regret?,” SSRN Working Paper.
Gete, P., and M. Reher (2018): “Nonbanks and Lending Standards in Mortgage Markets:The Spillovers from Liquidity Regulation,” SSRN Working Paper.
Gorton, G., and A. Metrick (2010): “Regulating the Shadow Banking System,” BrookingsPapers on Economic Activity, 41(2), 261–312.
He, L. T., J. R. Webb, F. N. Myer, et al. (2003): “Interest rate sensitivities of REITreturns,” International Real Estate Review, 6(1), 1–21.
He, Z., B. Kelly, and A. Manela (2017): “Intermediary asset pricing: New evidencefrom many asset classes,” Journal of Financial Economics, 126(1), 1–35.
Huszar, Z. R., and W. Yu (2018): “Mortgage Lending Regulatory Arbitrage: A Cross-Sectional Analysis of Nonbank Lenders,” Journal of Real Estate Research, Forthcoming.
Irani, R. M., R. Iyer, R. R. Meisenzahl, and J.-L. Peydró (2017): “The Rise ofShadow Banking: Evidence from Capital Regulation,” Working Paper.
Kashyap, A. K., J. C. Stein, and S. Hanson (2010): “An analysis of the impact of‘substantially heightened’ capital requirements on large financial institutions,” Mimeo,Booth School of Business, University of Chicago.
Liang, Y., and J. Webb (1995): “Pricing interest-rate risk for mortgage REITs,” Journalof Real Estate Research, 10(4), 461–469.
Liow, K. H., J. Ooi, and L. K. Wang (2003): “Interest rate sensitivity and risk premiumof property stocks,” Journal of Property Research, 20(2), 117–132.
Mueller, G., and K. Pauley (1995): “The effect of interest-rate movements on real estateinvestment trusts,” Journal of Real Estate Research, 10(3), 319–325.
Ordoñez, G. (2018): “Sustainable Shadow Banking,” American Economic Journal: Macroe-conomics, 10(1), 33–56.
Pellerin, S. R., S. J. Sabol, and J. R. Walter (2013): “MBS Real Estate InvestmentTrusts: A Primer,” Federal Reserve Bank of Richmond Economic Quarterly, 99(3), 193–227.
Plantin, G. (2015): “Shadow Banking and Bank Capital Regulation,” Review of FinancialStudies, 28(1), 146–175.
Pozsar, Z., T. Adrian, A. Ashcraft, and H. Boesky (2013): “Shadow Banking,”FRBNY Economic Policy Review, 19(2).
Rodnyansky, A., and O. M. Darmouni (2017): “The Effects of Quantitative Easing onBank Lending Behavior,” Review of Financial Studies, 30(11), 3858–3887.
23
Schnure, C. (2018): “Mortgage REITs,” Discussion paper, Nareit.
Schwarcz, S. L. (2012): “Shadow Banking, Financial Markets, and the Real Estate Sector,”Review of Banking and Financial Law, 32, 179–192.
Stein, J. C. (2010): “Securitization, shadow banking & financial fragility,” Daedalus, 139(4),41–51.
Swanson, Z., J. Theis, and K. M. Casey (2002): “REIT risk premium sensitivity andinterest rates,” Journal of Real Estate Finance and Economics, 24(3), 319–330.
Thakor, A. V. (2014): “Bank Capital and Financial Stability: An Economic Trade-Off or aFaustian Bargain?,” Annual Review of Financial Economics, 6(1), 185–223.
24

Tables
Descriptive Statistics on MREITs and Macroeconomic Variables
Panel A: Institution-Level Variables Agency ResidentialMREITs
Non-AgencyResidential MREITs Commercial MREITs
Mean SD Mean SD Mean SD
Number of Institutions 12.76 4.78 6.51 1.82 8.32 2.64Number of IPOs 0.18 0.38 0.26 0.73 0.34 0.70IPO Volume 46.06 137.47 66.71 201.64 70.74 177.04Total Assets 190.44 155.17 39.61 26.53 21.48 18.62Dividend Yield 10.88 3.25 9.48 2.74 7.45 4.34Price Return 0.26 10.77 -0.95 12.62 0.56 21.54Total Return 3.54 11.22 1.84 13.00 2.65 21.40Net Interest Margin 2.26 0.56 3.35 0.83 4.48 1.30Interest Yield 4.59 1.32 5.71 1.00 7.30 2.19Agency Securities/Assets 0.85 0.07 0.11 0.05 0.08 0.12Investment-Grade Securities/Assets 0.79 0.10 0.26 0.13 0.17 0.14Leverage (Equity/Assets) 0.14 0.03 0.23 0.08 0.37 0.11Repo Debt/Assets 0.63 0.08 0.22 0.07 0.16 0.09Short-Term Debt/Assets 0.44 0.21 0.25 0.11 0.08 0.12
Panel B: Macroeconomic Variables N Mean SD P25 Median P75
Bank Capital Ratio 68 12.56 2.22 10.32 13.11 14.973-Month Treasury 68 1.30 1.56 0.08 0.83 1.76Term Spread 68 2.02 1.02 1.43 2.10 2.741-Year Swap Rate 68 1.90 1.69 0.50 1.26 3.08Credit Spread 68 2.70 0.83 2.15 2.63 3.12Option-Adjusted Spread 68 0.50 0.30 0.28 0.41 0.59Quarterly Change in HPI 68 0.90 2.33 -0.41 1.15 2.85Quarterly Change in CPPI 68 1.01 2.49 0.58 1.76 2.66NBER Recession Indicator 68 0.13 0.34 0.00 0.00 0.00
Table 1: The Table reports descriptive statistics on MREITs (Panel A) and macroeconomic variables(Panel B) on a quarterly frequency over the period 2001-Q1 to 2017-Q4. The variables Number ofInstitutions, Number of IPOs, IPO Volume and Total Assets are aggregated across the institutions ineach MREIT category. The remaining institution-level variables are averaged across the institutionsin each MREIT category. All variables are defined in the text. The institution-level data in Panel Ais obtained from S&P Global. The data on bank capital is also from S&P Global, and the variable iscalculated as described in the text. The data on interest rates and fundamentals is obtained fromthe Federal Reserve Bank of St Louis’s Economic Database, Bloomberg, Real Capital Analytics andthe National Bureau of Economic Research, as outlined in the text.
25

MREIT Sector Dynamics and Bank Capital Ratios
(1) (2) (3) (4)Variables Number of Institutions Number of IPOs IPO Volume Aggregate Assets
3-Month Treasury -2.365*** -0.098 -0.730 -0.799***(0.39) (0.12) (0.56) (0.12)
Term Spread -2.413*** 0.061 -0.012 -0.810***(0.26) (0.09) (0.25) (0.07)
1-Year Swap Rate 0.348 0.156* 0.734* 0.158(0.31) (0.08) (0.40) (0.10)
Credit Spread -1.861*** -0.197** -0.936** -0.603***(0.33) (0.10) (0.38) (0.10)
Option-Adjusted Spread -0.220 0.218 1.012 0.096(0.75) (0.20) (0.86) (0.22)
Quarterly Change in HPI -0.060 0.020 0.083 -0.046**(0.07) (0.02) (0.08) (0.02)
Quarterly Change in CPPI 0.021 -0.037 -0.089 0.000(0.07) (0.04) (0.11) (0.02)
NBER Recession Indicator 1.544*** -0.140 -0.211 0.300*(0.51) (0.23) (0.76) (0.17)
Bank Capital Ratio 1.079*** 0.078* 0.252 0.177***(0.18) (0.04) (0.16) (0.04)
× Non-Agency Residential MREIT -1.619*** -0.015 -0.147 -0.393***(0.12) (0.04) (0.16) (0.04)
× Commercial MREIT -1.087*** -0.010 -0.129 -0.264***(0.13) (0.04) (0.17) (0.04)
Observations 204 204 204 204R-squared 0.815 0.077 0.077 0.829REIT Type Main Effects Y Y Y Y
Table 2: The Table reports the results from estimating Equation (1) using OLS over the period2001-Q1 to 2017-Q4. Column (1) shows the results for the number of institutions active in thethree MREIT categories in a given quarter. Column (2) shows the results for the number of IPOsby MREIT type. Column (3) shows the results for the log of aggregate equity volume raised inIPOs by MREIT type. Column (4) shows the results for quarterly aggregate assets held by theinstitutions in the three MREIT categories. All variables are as defined in the text. In all regressions,Agency Residential MREITs are the omitted category. × denotes interaction terms between the bankcapital ratio and the other two MREIT types (Non-Agency Residential and Commercial MREITs).Fixed effects for the MREIT types are included as indicated. Robust standard errors are shown inparentheses. Significance is indicated as follows: *** p < 0.01, ** p < 0.05, * p < 0.1.
26

MREIT Performance and Bank Capital Ratios
(1) (2) (3)Variables Dividend Yield Price Return Total Return
3-Month Treasury 0.119 0.631 0.835(0.61) (3.39) (3.36)
Term Spread -0.960*** 4.800*** 4.738***(0.33) (1.63) (1.67)
1-Year Swap Rate -0.794 3.163 2.788(0.59) (3.03) (3.04)
Credit Spread 1.523*** -0.072 0.202(0.57) (3.15) (3.19)
Option-Adjusted Spread 1.766 -14.810** -15.253**(1.34) (6.30) (6.47)
Quarterly Change in HPI -0.027 1.948*** 1.967***(0.10) (0.66) (0.68)
Quarterly Change in CPPI -0.003 -1.852 -1.763(0.17) (1.19) (1.19)
NBER Recession Indicator 1.365 -5.279 -3.989(1.09) (6.55) (6.54)
Bank Capital Ratio 0.547** 0.575 0.571(0.24) (0.95) (0.99)
× Non-Agency Residential MREIT -0.339* 1.258 1.235(0.20) (0.85) (0.88)
× Commercial MREIT -1.573*** 1.653* 1.460(0.20) (0.94) (0.96)
Observations 204 204 204R-squared 0.552 0.246 0.236REIT Type Main Effects Y Y Y
Table 3: The Table reports the results from estimating Equation (1) using OLS over the period2001-Q1 to 2017-Q4. Column (1) shows the results for the average dividend yield by MREIT categoryin a given quarter. Column (2) shows the results for the average price return by MREIT type.Column (3) shows the results for the average total return by MREIT type. All variables are as definedin the text. In all regressions, Agency Residential MREITs are the omitted category. × denotesinteraction terms between the bank capital ratio and the other two MREIT types (Non-AgencyResidential and Commercial MREITs). Fixed effects for the MREIT types are included as indicated.Robust standard errors are shown in parentheses. Significance is indicated as follows: *** p < 0.01,** p < 0.05, * p < 0.1.
27
Dri
vers
ofM
REIT
Per
form
ance
and
Ban
kC
apit
alR
atio
s
(1)
(2)
(3)
(4)
(5)
(6)
(7)
Variables
Net
Interest
Margin
Interest
Yield
AgencySecurities/
Assets
Investment-Grade/
Assets
Leverage
(Equ
ity/
Assets)
Rep
oDeb
t/Assets
Short-Te
rmDebt/
Assets
3-Mon
thTr
easury
0.24
5-0.238
0.02
70.07
7***
0.02
0-0.014
-0.027
(0.20)
(0.23)
(0.02)
(0.03)
(0.02)
(0.02)
(0.03)
Term
Spread
0.39
4***
-0.012
0.03
9***
0.08
0***
0.03
1***
0.00
1-0.021
(0.09)
(0.16)
(0.01)
(0.02)
(0.01)
(0.01)
(0.02)
1-YearSw
apRate
-0.087
0.39
4**
0.00
1-0.029
0.00
0-0.004
-0.015
(0.17)
(0.19)
(0.02)
(0.02)
(0.02)
(0.01)
(0.03)
CreditSp
read
0.43
8**
-0.114
0.02
60.08
0***
0.02
5*0.00
1-0.039
(0.18)
(0.23)
(0.02)
(0.02)
(0.01)
(0.01)
(0.03)
Option-AdjustedSp
read
-0.249
1.65
6**
0.00
5-0.045
-0.038
0.00
00.07
3(0.41)
(0.66)
(0.04)
(0.04)
(0.04)
(0.03)
(0.06)
Qua
rterly
Cha
ngein
HPI
0.06
6**
0.03
90.00
30.00
1-0.001
0.00
7***
0.00
7(0.03)
(0.04)
(0.00)
(0.00)
(0.00)
(0.00)
(0.00)
Qua
rterly
Cha
ngein
CPPI
0.12
1***
0.06
70.00
50.01
5***
0.00
30.01
5***
0.01
0**
(0.03)
(0.06)
(0.00)
(0.00)
(0.00)
(0.00)
(0.01)
NBER
Recession
Indicator
0.24
3-0.072
0.01
50.00
1-0.014
0.03
2-0.002
(0.27)
(0.49)
(0.04)
(0.03)
(0.03)
(0.02)
(0.06)
Ban
kCap
ital
Ratio
0.06
4-0.326
***
0.00
00.01
4*0.01
0**
0.01
1**
0.04
1***
(0.06)
(0.08)
(0.01)
(0.01)
(0.00)
(0.01)
(0.01)
×Non
-AgencyResidential
MREIT
0.10
5***
0.35
8***
0.015*
**0.00
40.01
3***
-0.022
***
-0.062
***
(0.04)
(0.06)
(0.01)
(0.01)
(0.00)
(0.00)
(0.01)
×Com
mercial
MREIT
-0.045
0.32
0**
-0.017
**-0.038**
*0.02
4***
-0.045
***
-0.078
***
(0.08)
(0.12)
(0.01)
(0.01)
(0.01)
(0.01)
(0.01)
Observation
s20
419
820
420
420
420
420
0R-squ
ared
0.62
20.54
70.96
10.88
30.74
80.93
10.65
9REIT
Typ
eMainEffe
cts
YY
YY
YY
Y
Tab
le4:
The
Tablerepo
rtstheresultsfrom
estimatingEqu
ation(1)usingOLS
over
thepe
riod
2001-Q
1to
2017
-Q4.
Colum
n(1)show
stheresultsfortheaverag
ene
tinterest
marginby
MREIT
catego
ryin
agivenqu
arter.
Colum
n(2)show
stheresultsfortheaverag
eyield
oninterest-bearing
assets
byMREIT
type
.Colum
n(3)show
stheresultsfortheaverageshareof
agen
cysecu
rities
tototalassets
byMREIT
type
.Colum
n(4)show
stheresultsfortheaverag
eshareof
institutiona
l-grade
secu
rities
tototala
ssetsby
MREIT
type
.Colum
n(5)show
stheresultsfortheaverag
eratioof
equity
tototala
ssetsby
MREIT
type
asaproxyforinstitutionleverage.Colum
ns(6)an
d(7)
show
theresultsfortheaverageshareof
repo
debt
tototala
ssetsan
dshareof
overalls
hort-term
debt
tototala
ssetsby
MREIT
type
.All
variab
lesareas
defin
edin
thetext.In
allr
egressions,A
genc
yResidential
MREITsaretheom
ittedcatego
ry.×
deno
tesinteractionterm
sbe
tweentheba
nkcapitalratio
andtheothe
rtw
oMREIT
type
s(N
on-A
genc
yResidential
andCom
mercial
MREIT
s).Fixed
effects
for
theMREIT
type
sareinclud
edas
indicated.
Rob
uststan
dard
errors
areshow
nin
parenthe
ses.
Sign
ificanc
eisindicatedas
follo
ws:
***
p<
0.01,
**p<
0.05,
*p<
0.1.
28
Agency Residential MREIT Sector Dynamics and Other Institutions in theAgency MBS Market
Panel A: GSE Holdings Growth (1) (2) (3) (4)Variables Number of Firms Number of IPOs IPO Volume Aggregate Assets
Agency Residential MREIT 5.812*** -0.434** -0.939* 0.997***(0.49) (0.19) (0.56) (0.13)
GSE Holdings Growth 0.069 0.016 0.031 0.015(0.05) (0.02) (0.07) (0.01)
× Agency Residential MREIT -0.122** -0.003 0.002 -0.027*(0.06) (0.02) (0.07) (0.02)
Observations 94 94 94 94R-squared 0.737 0.164 0.150 0.551Interest Rate Variables Y Y Y YFundamentals Y Y Y Y
Panel B: Federal Reserve Holdings Growth (1) (2) (3) (4)VARIABLES Number of Firms Number of IPOs IPO Volume Aggregate Assets
Agency Residential MREIT 9.591*** -0.109 -0.147 1.953***(0.39) (0.15) (0.54) (0.09)
Federal Reserve Holdings Growth 0.138*** 0.047*** 0.137*** 0.023***(0.03) (0.02) (0.04) (0.01)
× Agency Residential MREIT -0.048*** -0.016 -0.017 -0.005**(0.01) (0.02) (0.03) (0.00)
Observations 54 54 54 54R-squared 0.951 0.446 0.502 0.943Interest Rate Variables Y Y Y YFundamentals Y Y Y Y
Table 5: The Table replicates the results shown in Table 2 from estimating Equation (1) using OLSover the period 2001-Q1 to 2015-Q4. The main independent variable of interest (bank capital ratios)is replaced with the share of Agency MBS outstanding held by the U.S. government-sponsoredagencies (Panel A) and the Federal Reserve (Panel B). All variables are as defined in the text. In allregressions, Non-Agency Residential and Commercial MREITs are the omitted category. × denotesinteraction terms between the bank capital ratio and Agency Residential MREITs. Fixed effectsfor the MREIT types are included as indicated. Robust standard errors are shown in parentheses.Significance is indicated as follows: *** p < 0.01, ** p < 0.05, * p < 0.1.
29
Agency Residential MREIT Performance and Other Institutions in the AgencyMBS Market
Panel A: GSE Holdings Growth (1) (2) (3)VARIABLES Dividend Yield Price Return Total Return
Agency Residential MREIT 1.367** 3.299 3.896(0.59) (2.72) (2.77)
GSE Holdings Growth 0.095 -0.421 -0.394(0.06) (0.34) (0.34)
× Agency Residential MREIT -0.232*** 0.889** 0.877**(0.07) (0.36) (0.37)
Observations 94 94 94R-squared 0.578 0.411 0.407Interest Rate Variables Y Y YFundamentals Y Y Y
Panel B: Federal Reserve Holdings Growth (1) (2) (3)VARIABLES Dividend Yield Price Return Total Return
Agency Residential MREIT 4.652*** -2.001 -0.782(0.34) (2.30) (2.35)
Federal Reserve Holdings Growth 0.021 -0.369 -0.365(0.02) (0.30) (0.30)
× Agency Residential MREIT 0.032*** -0.173 -0.164(0.01) (0.17) (0.17)
Observations 54 54 54R-squared 0.864 0.523 0.518Interest Rate Variables Y Y YFundamentals Y Y Y
Table 6: The Table replicates the results shown in Table 3 from estimating Equation (1) using OLSover the period 2001-Q1 to 2015-Q4. The main independent variable of interest (bank capital ratios)is replaced with the share of Agency MBS outstanding held by the U.S. government-sponsoredagencies (Panel A) and the Federal Reserve (Panel B). All variables are as defined in the text. In allregressions, Non-Agency Residential and Commercial MREITs are the omitted category. × denotesinteraction terms between the bank capital ratio and Agency Residential MREITs. Fixed effectsfor the MREIT types are included as indicated. Robust standard errors are shown in parentheses.Significance is indicated as follows: *** p < 0.01, ** p < 0.05, * p < 0.1.
30
Dri
vers
ofA
gency
MR
EIT
Per
form
ance
and
Oth
erIn
stit
uti
ons
inth
eA
gency
MB
SM
arke
t
Pan
elA:G
SEHolding
sGrowth
(1)
(2)
(3)
(4)
(5)
(6)
(7)
Variables
Net
Interest
Margin
Interest
Yield
AgencySecurities/
Assets
Investment-Grade/
Assets
Leverage
(Equ
ity/
Assets)
Rep
oDebt/
Assets
Short-Te
rmDebt/
Assets
AgencyResidential
MREIT
-1.272
***
-1.784
***
0.79
8***
0.53
3***
-0.143**
*0.45
9***
0.26
7***
(0.15)
(0.17)
(0.01)
(0.02)
(0.01)
(0.01)
(0.03)
GSE
Holding
sGrowth
-0.014
-0.035
-0.002
*0.00
0-0.003
***
0.00
00.00
2(0.02)
(0.03)
(0.00)
(0.00)
(0.00)
(0.00)
(0.00)
xAgencyResidential
MREIT
0.04
6*0.02
30.00
2-0.001
0.00
5***
-0.001
-0.004
(0.02)
(0.03)
(0.00)
(0.00)
(0.00)
(0.00)
(0.00)
Observation
s94
9494
9494
9494
R-squ
ared
0.69
70.69
20.99
00.94
00.87
00.94
10.66
6Interest
RateVariables
YY
YY
YY
YFu
ndam
entals
YY
YY
YY
Y
Pan
elB:F
ederal
Reserve
Holding
sGrowth
(1)
(2)
(3)
(4)
(5)
(6)
(7)
Variables
Net
Interest
Margin
Interest
Yield
AgencySecurities/
Assets
Investment-Grade/
Assets
Leverage
(Equ
ity/
Assets)
Rep
oDebt/
Assets
Short-Te
rmDebt/
Assets
AgencyResidential
MREIT
-1.695
***
-2.851
***
0.76
3***
0.57
4***
-0.210**
*0.54
2***
0.45
4***
(0.18)
(0.30)
(0.01)
(0.03)
(0.01)
(0.01)
(0.01)
FederalR
eserve
Holding
sGrowth
-0.026
-0.047
**-0.001
-0.003
*0.00
00.00
2***
0.003*
**(0.02)
(0.02)
(0.00)
(0.00)
(0.00)
(0.00)
(0.00)
xAgencyResidential
MREIT
0.01
5***
0.04
2***
0.00
0-0.001
0.00
1**
-0.001**
*-0.001**
*(0.00)
(0.01)
(0.00)
(0.00)
(0.00)
(0.00)
(0.00)
Observation
s54
5454
5454
5454
R-squ
ared
0.74
00.74
10.99
00.94
00.95
50.99
40.99
0Interest
RateVariables
YY
YY
YY
YFu
ndam
entals
YY
YY
YY
Y
Tab
le7:
The
Tablereplicates
theresultsshow
nin
Table4from
estimatingEqu
ation(1)usingOLS
over
thepe
riod
2001
-Q1to
2015
-Q4.
The
maininde
pend
entvariab
leof
interest
(ban
kcapitalratios)
isreplaced
withtheshareof
Agenc
yMBSou
tstand
inghe
ldby
theU.S.
government-spon
soredag
encies
(Pan
elA)an
dtheFe
deralR
eserve
(Pan
elB).Allvariab
lesareas
defin
edin
thetext.In
allregressions,
Non
-Agenc
yResidential
andCom
mercial
MREITsaretheom
ittedcatego
ry.×
deno
tesinteractionterm
sbe
tweentheba
nkcapitalr
atio
andAgencyResidential
MREIT
s.Fixed
effects
fortheMREIT
type
sareinclud
edas
indicated.
Rob
uststan
dard
errors
areshow
nin
parentheses.
Sign
ificanceis
indicatedas
follo
ws:
***p<
0.01,
**p<
0.05,
*p<
0.1.
31


![nAmerican American Capital Mortgage (] Capital Bethesd ... · We intend to qualify as a REIT for U.S. federal income tax purposes and will elect to be taxed as a REIT under the Internal](https://img.pdfslide.net/doc/110x75/5ffd2662fb9a330d1c01de0b/namerican-american-capital-mortgage-capital-bethesd-we-intend-to-qualify.jpg)