Embed Size (px)
Citation preview

Most EFFICIENT MFI on the GLOBEBharat Financial Inclusion Limited
Annual Report 2016
(formerly known as ‘SKS Microfinance Limited’)
Bharat Financial Inclusion Ltd(formerly known as ‘SKS Microfinance Limited’)CIN: L65999MH2003PLC250504Registered office: Unit No. 410, Madhava, Bandra-Kurla Complex, Bandra (East), Mumbai - 400 052, Maharashtra, India Email: [email protected] | www.sksindia.comPhone: 040-44526000 | Fax No: 040-44526001/022-26592375
Spine to be adjusted by printerdi
cken
son
w
ww
. dic
kens
onw
orld
.com
Spine to be adjusted by printer
1
BHARAT FINANCIAL INCLUSION LIMITED Annual Report 2016 BHARAT FINANCIAL INCLUSION LIMITED Annual Report 2016
We are the largest MFI in India by number of borrowers, branches and districts as on March 31, 2016 and have a gross loan portfolio of `7,677 crore*. We are primarily engaged in providing microfinance for income generating activities to low-income individuals in rural India.
Our Unique service proposition are:
yy We lend only to Women
yy We lend for Income generation activities
yy We offer loans with repayment frequency mirroring cash flows of our customers
yy We follow Joint liability group model
yy We provide door step delivery of our services through center meetings in villages
yy We primarily focus on rural areas
Our operating model gives us an edge in understanding and servicing the needs of our customers and places us at a leading position in most of our operating geographies.
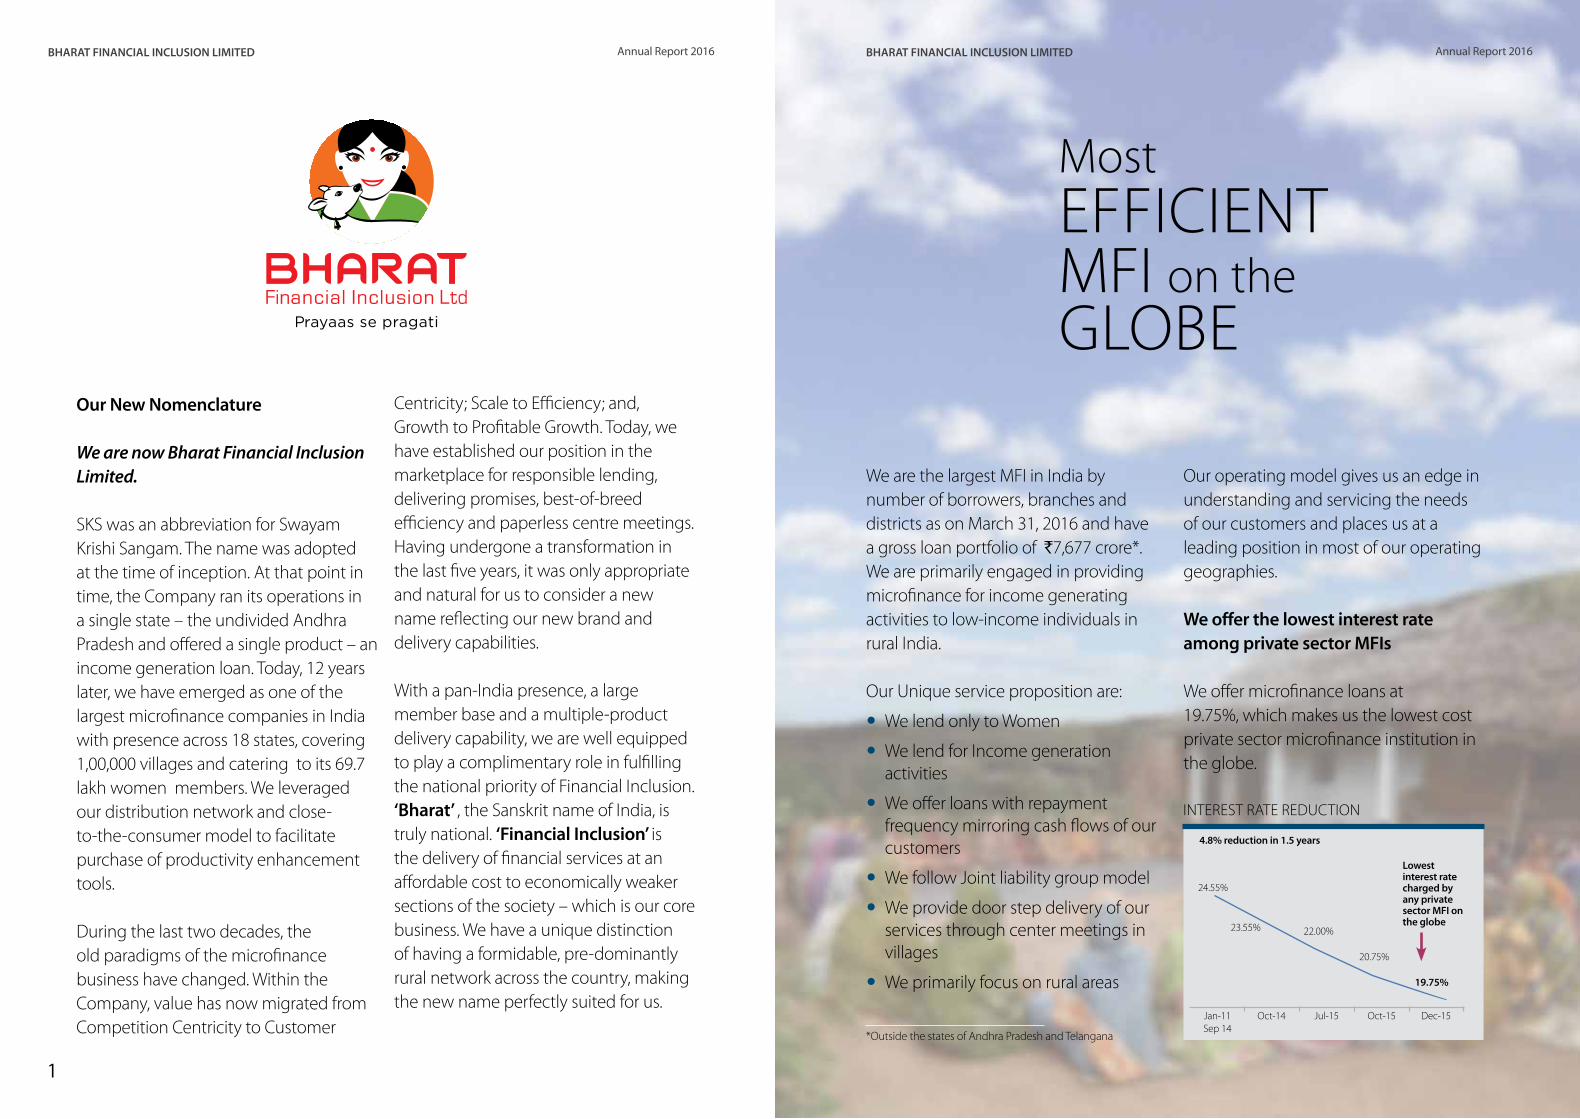
We offer the lowest interest rate among private sector MFIs
We offer microfinance loans at 19.75%, which makes us the lowest cost private sector microfinance institution in the globe.
Most EFFICIENT MFI on the GLOBE
Oct-14Jan-11 Sep 14
23.55% 22.00%
4.8% reduction in 1.5 years
Lowest interest rate charged by any private sector MFI on the globe
20.75%
19.75%
Jul-15 Oct-15 Dec-15
INTEREST RATE REDUCTION
24.55%
*Outside the states of Andhra Pradesh and Telangana
Our New Nomenclature We are now Bharat Financial Inclusion Limited. SKS was an abbreviation for Swayam Krishi Sangam. The name was adopted at the time of inception. At that point in time, the Company ran its operations in a single state – the undivided Andhra Pradesh and offered a single product – an income generation loan. Today, 12 years later, we have emerged as one of the largest microfinance companies in India with presence across 18 states, covering 1,00,000 villages and catering to its 69.7 lakh women members. We leveraged our distribution network and close-to-the-consumer model to facilitate purchase of productivity enhancement tools. During the last two decades, the old paradigms of the microfinance business have changed. Within the Company, value has now migrated from Competition Centricity to Customer
Centricity; Scale to Efficiency; and, Growth to Profitable Growth. Today, we have established our position in the marketplace for responsible lending, delivering promises, best-of-breed efficiency and paperless centre meetings. Having undergone a transformation in the last five years, it was only appropriate and natural for us to consider a new name reflecting our new brand and delivery capabilities. With a pan-India presence, a large member base and a multiple-product delivery capability, we are well equipped to play a complimentary role in fulfilling the national priority of Financial Inclusion. ‘Bharat’ , the Sanskrit name of India, is truly national. ‘Financial Inclusion’ is the delivery of financial services at an affordable cost to economically weaker sections of the society – which is our core business. We have a unique distinction of having a formidable, pre-dominantly rural network across the country, making the new name perfectly suited for us.

3
BHARAT FINANCIAL INCLUSION LIMITED Annual Report 2016 BHARAT FINANCIAL INCLUSION LIMITED Annual Report 2016
AT A GLANCE ........................................................................................................................... 1
UNMATCHED LEADERSHIP............................................................................................... 3
BFIL’S FINANCIAL INCLUSION COVERAGE .............................................................. 4
KEY PERFORMANCE INDICATORS ................................................................................ 5
MOST COMPETITIVE RATES .............................................................................................. 9
OPERATIONAL EFFICIENCY.............................................................................................11
CAPITAL ADEQUACY ..........................................................................................................13
TECHNOLOGICAL EFFICIENCY .....................................................................................15
CUSTOMER PROTECTION ................................................................................................17
MANAGEMENT DISCUSSION AND ANALYSIS ................................................... 19
DIRECTORS’ REPORT ......................................................................................................... 39
SECRETARIAL AUDIT REPORT ...................................................................................... 45
REPORT ON CSR ACTIVITIES ......................................................................................... 49
BUSINESS RESPONSIBILITY REPORT ........................................................................ 53
REPORT ON CORPORATE GOVERNANCE ...............................................................71
FINANCIALS
INDEPENDENT AUDITORS’ REPORT ...........................................................................87
BALANCE SHEET ...................................................................................................................91
STATEMENT OF PROFIT AND LOSS ............................................................................92
CASH FLOW STATEMENT .................................................................................................93
NOTES TO FINANCIAL STATEMENTS .........................................................................95
ContentsBOARD OF DIRECTORS
Mr. Rajender Mohan Malla Additional and Independent Director
Dr. Punita Kumar-Sinha Independent Director
Mr. K. G. Alai Nominee Director - SIDBI
Mr. Geoffrey Tanner Woolley Independent Director
Mr. M. R. Rao Managing Director and CEO
Mr. P. H. Ravikumar Non-Executive Chairman and Independent Director
Mr. S. Balachandran Independent Director
Mr. Paresh D. Patel Non-Independent and Non-Executive Director
Dr. Tarun Khanna Independent Director
Table of

1 2
BHARAT FINANCIAL INCLUSION LIMITED Annual Report 2016 BHARAT FINANCIAL INCLUSION LIMITED Annual Report 2016
OVERVIEW We, Bharat Financial Inclusion Limited (formerly ‘SKS Microfinance Limited’), are the second largest microfinance company in India with a gross loan portfolio of ` 7,677 crore*, a membership base of 5.6* million and 1,324 branches. We are the most efficient MFI providing loans for income generating activities to low income women borrowers at industry’s lowest lending rate of sub 20%.
Our core business is providing small value loans and certain other basic financial services to our members. Our members are predominantly located in rural areas in India and we extend loans to them mainly for income generating activities and not for personal consumption. These individuals often have no, or very limited, access to loans from institutional sources of financing. We believe that non-institutional sources typically charge very high rates of interest.
We intend to grow at a healthy pace, driven by our vast geographical presence, experienced management, efficient operating metrics, a comfortable capital position and optimal utilisation of existing infrastructure.
Large unmet credit demand in the microfinance sector, low competitive intensity, supportive regulations, strong balance sheet and best-in-class operating metrics help us secure leadership position in the industry.
* Outside the states of Andhra Pradesh and Telangana
Most efficient MFI providing loans for income generating
activities to low income women
borrowers at industry’s lowest
lending rate of sub 20%
AT A
GLAN
CE
OUR MISSIONOur mission is to provide financial services to the economically weaker sections.
OUR VISIONOur vision is to serve 50 million households across India and other parts of the world and also create a commercial microfinance model that delivers high value to our customers.
CORE VALUES
Right Focus – Customer FirstOur products, processes and people are all focused on creating the highest value for the customer. This includes being respectful to customers, understanding the needs of customers and being transparent with customers.
Right Means – Ethics AlwaysWe will follow ethical practices in all our relationships at all times, including following the law both in letter and spirit. This includes not offering bribes, not paying or taking commissions, or any other short-cuts.
Right Way – Consistent QualityWe will have standardised processes as this will enable us to reach out to the most customers cost effectively. We will foster innovation but in a way that ensures consistent quality.
* Outside the states of Andhra Pradesh and Telangana
** Excluding Security Deposit
^ Includes on and off Balance Sheet borrowings and processing fees for Q4FY16
^^ Excluding Managed Loans (`1,064 crore)
# Net fee post the incentive payout and sans transfer pricing of other operating cost
OPE
RATI
ON
AL
PERF
ORM
AN
CESO
LVEN
CY &
LIQ
UID
ITY
EFFI
CIEN
CY R
ATIO
S
1,324 Branches
6,323 Sangam Managers*
5.6 millionMembers*
Up 24%
Up 84%
`52,040 crore Cumulative Disbursement Till FY16
`12,088 croreDisbursements
Up 75%
`7,677 croreGross Loan Portfolio*
`1,383 croreNetworth
23.1%Capital Adequacy Ratio
`7,317 croreDrawdowns^^
`1,660 croreCash & Cash Equivalents**
9.3%Marginal Cost of Borrowing^
48.3%Cost to Income
9.3%Facilitation Fee from Cross Sell Income % of PAT For FY16#

3 4
BHARAT FINANCIAL INCLUSION LIMITED Annual Report 2016 BHARAT FINANCIAL INCLUSION LIMITED Annual Report 2016
BFIL’S FINANCIAL INCLUSION COVERAGE
STRONG REACH IN UNDER-BANKED AREASWEAKER & MINORITY SECTION COVERAGE
DOOR STEP SERVICE
FINANCIAL LITERACY
DEDICATED CUSTOMER SERVICE
Doorstep delivery (i.e. at Center meetings).
68% of BFIL branches are in RBI underbanked district list
BFIL covers 68% of below average & low financial districts identified by CRISIL
2-day pre-disbursement training consisting of hour-long sessions designed to educate clients on BFIL processes and credit discipline.
Toll-free helpline number with seven different vernacular languages.
BFIL Toll free Number
1800 300 10000Calling Timings:
Morning 7:30 am to Evening 9:00 pm
^BFIL data as on September 30, 2014* Source: RBI under-banked districts data[1] Source: CRISIL Inclusix: An index to measure India’s progress on Financial Inclusion, June 2013
96
200
175
RBI 375 districts*
BFIL 296 districts^
CRISIL level of financial inclusion
BFIL Coverage of those districts
High 18%
Above 15%
Below Average 51%
Low 16%
Grand Total 100%
68%}
Wom
en10
0%
72%
17%
Min
ority
Econ
omic
ally
W
eake
r Sec
tion
UNMATCHEDLEADERSHIP
UNIQUE OPERATING MODEL EXTENSIVE REACH
100%Group
Lending
75%Rural
Customer base
305Districts#
5.6 MnTotal
Members#
BEST OF BREED FINANCIAL RATIOS
7.1%Opex to GLP
61% YoYEarnings Growth
48.3%Cost to Income
9.3%Marginal cost of
borrowing*
Lowest interest rate of
19.75% Among Global Private Sector MFIs
EXTERNAL ENDORSEMENTS
Highest Long-term rating (A+) and Short-term rating (A1+)
among NBFC - MFIs
LOWEST COST PRODUCER
#Outside the states of Andhra Pradesh and Telangana*Includes on and off balance sheet borrowings and processing fees for Q4 FY16

5 6
BHARAT FINANCIAL INCLUSION LIMITED Annual Report 2016 BHARAT FINANCIAL INCLUSION LIMITED Annual Report 2016
KEY PERFORMANCE INDICATORS
During FY16, the Company witnessed robust growth in disbursements, which grew by 75% over the last year, while Gross Loan Portfolio grew by 84% year-on-year. The Company also had robust growth in Net Interest Income, which grew by 69% over the last year. In line with the overall strong performance, PAT grew by 61% year-on-year.
FY2014 FY2015 FY2016
DISBURSEMENTSAmount in ` crore
6,891
4,788
12,088
FY2014 FY2015 FY2016
GROSS LOAN PORTFOLIO*
Amount in ` crore
4,171
2,837
7,677
* Outside the states of Andhra Pradesh and Telangana
FY2014 FY2015 FY2016
NET INTEREST INCOME^Amount in ` crore
423
278
714
FY2014 FY2015 FY2016
PROFIT AFTER TAXAmount in ` crore
188
303
70
The Company is well capitalised with a networth of `1,383 crore and capital adequacy of 23.1% as on FY16, which is above the mandated regulatory requirement of 15%. During FY16, the Company’s incremental drawdowns grew by 46% and, it maintained adequate liquidity (i.e. Cash and Cash equivalents of `1,660 crore as on FY16), in line with the business requirements.
FY2014 FY2015 FY2016
NETWORTHAmount in ` crore
1,383
1,046
459
FY2014 FY2015 FY2016
DRAWDOWNS^
Amount in ` crore
5,020
3,503
7,317
^ Excluding Managed Loans
FY2014 FY2015 FY2016
CASH AND CASH EQUIVALENTS*
Amount in ` crore
1,660 1,437
415
* Excluding Security Deposits
CAPITAL ADEQUACY RATIO % AGAINST RBI STIPULATED 15%
23.07%
FY2016
15.00%
^ Interest income on Portfolio loans + Excess interest spread on securitization/Income from assignment + Loan processing fees + BC Fee – Financial Cost

7 8
BHARAT FINANCIAL INCLUSION LIMITED Annual Report 2016 BHARAT FINANCIAL INCLUSION LIMITED Annual Report 2016
KEY PERFORMANCE INDICATORS
FY2014 FY2015 FY2016
OPEX TO GROSS LOAN PORTFOLIO %Amount in ` crore
9.5%9.6%
7.1%
FY2014 FY2015 FY2016
COST TO INCOME%
61.1%
74.5%
48.3%
FY2014 FY2015 FY2016
MARGINAL COST OF BORROWING^
%
11.9% 12.6%
10.2%
^ Includes on and off Balance Sheet borrowings, including processing fees
GEOGRAPHICAL CONCENTRATION % OF GROSS LOAN PORTFOLIO
PORTFOLIO OUTSTANDING BY ECONOMIC ACTIVITY
Odisha Karnataka Maharashtra Bihar West Bengal Uttar Pradesh Kerala Madhya Pradesh
Rajasthan Jharkhand Haryana Punjab Chhattisgarh Uttarakhand
2%4%
5%5%
6%9%
10%
18%1%
2%1%
14%
12%
11%
The Company’s marginal cost of borrowing witnessed a sharp decline of 1.7% (170 basis points) in FY16 and was at 9.3% for Q4FY16. Operating expenses to Gross Loan Portfolio reduced from 9.5% in FY15 to 7.1% in FY16 and Cost to Income declined from 61.1% in FY15 to 48.3% in FY16. Net facilitation fee income* from cross-sell products (such as Mobile Phones, Solar Lamps, Sewing Machines, Bicycles, Bio-Mass Stove, Water Purifier and Solar Fans) contributed to 9.3% of Profit After Tax in FY16.
*Net fee post the incentive payout and sans transfer pricing of other operating cost
FY2016
FACILITATION FEE FROM CROSS SELL INCOME % OF PAT*
9.3%
BHARAT FINANCIAL INCLUSION LIMITED Annual Report 2016 BHARAT FINANCIAL INCLUSION LIMITED Annual Report 2016
109
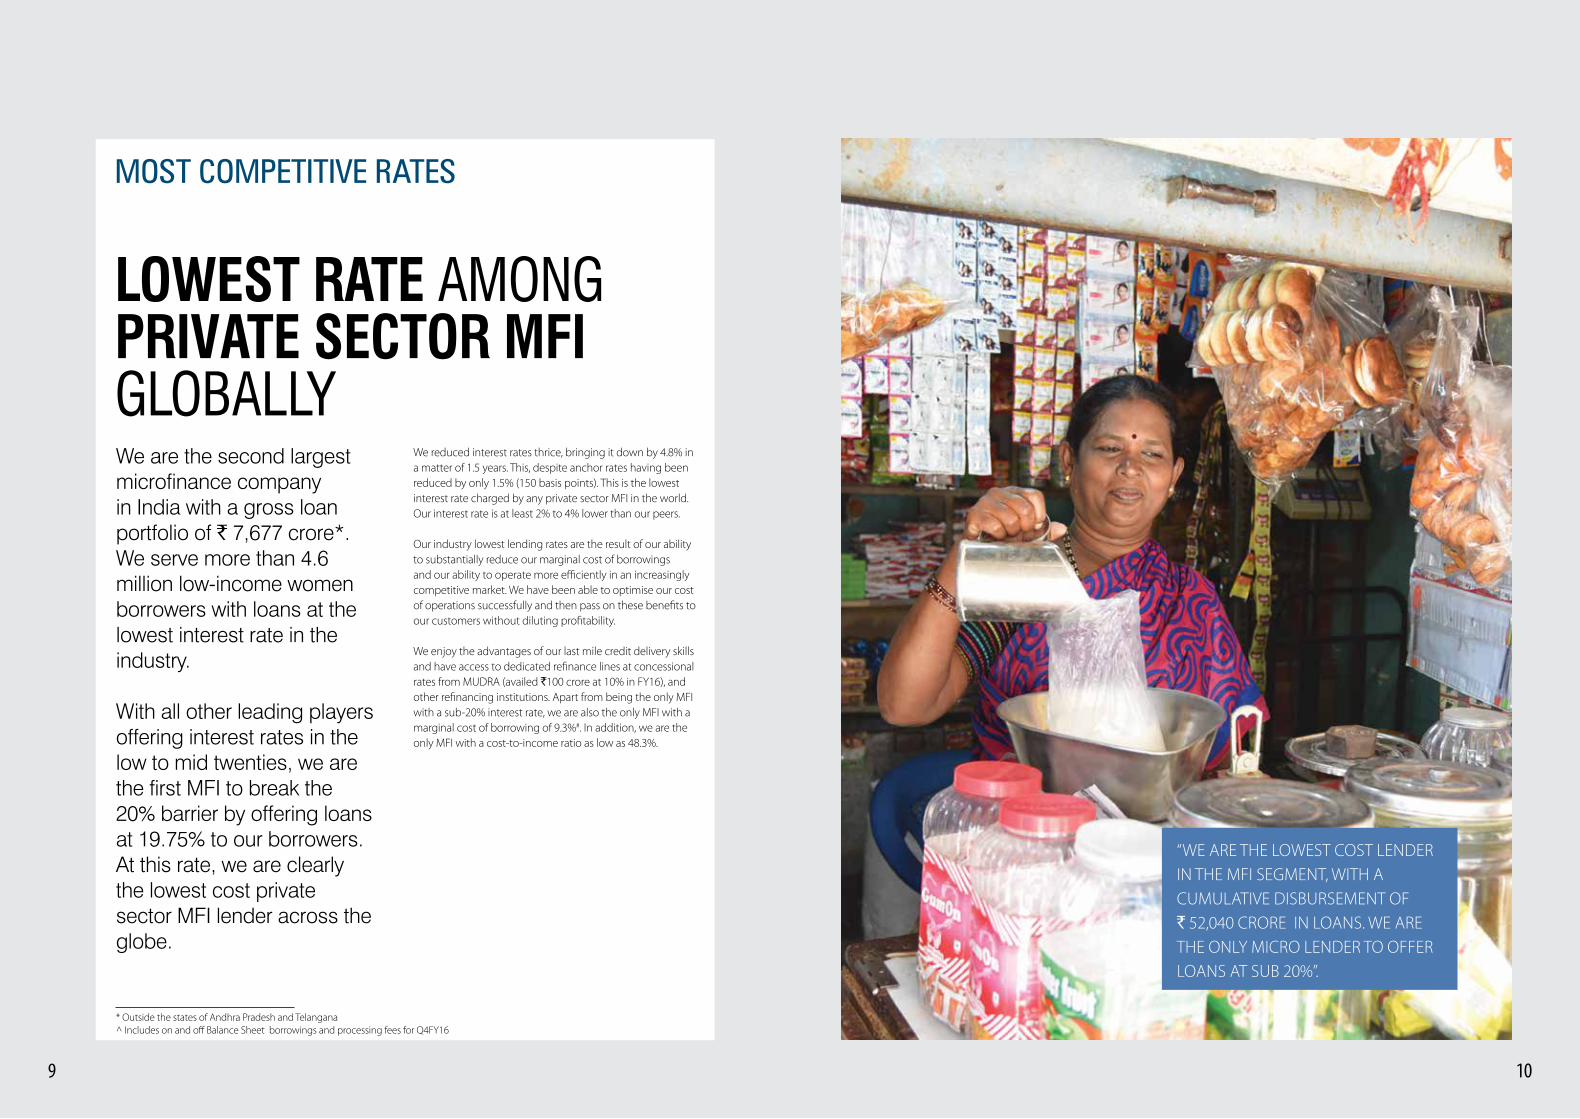
“WE ARE THE LOWEST COST LENDER IN THE MFI SEGMENT, WITH A CUMULATIVE DISBURSEMENT OF ` 52,040 CRORE IN LOANS. WE ARE THE ONLY MICRO LENDER TO OFFER LOANS AT SUB 20%”.
MOST COMPETITIVE RATES
We are the second largest microfinance company in India with a gross loan portfolio of ` 7,677 crore*. We serve more than 4.6 million low-income women borrowers with loans at the lowest interest rate in the industry.
With all other leading players offering interest rates in the low to mid twenties, we are the first MFI to break the 20% barrier by offering loans at 19.75% to our borrowers. At this rate, we are clearly the lowest cost private sector MFI lender across the globe.
We reduced interest rates thrice, bringing it down by 4.8% in a matter of 1.5 years. This, despite anchor rates having been reduced by only 1.5% (150 basis points). This is the lowest interest rate charged by any private sector MFI in the world. Our interest rate is at least 2% to 4% lower than our peers.
Our industry lowest lending rates are the result of our ability to substantially reduce our marginal cost of borrowings and our ability to operate more efficiently in an increasingly competitive market. We have been able to optimise our cost of operations successfully and then pass on these benefits to our customers without diluting profitability.
We enjoy the advantages of our last mile credit delivery skills and have access to dedicated refinance lines at concessional rates from MUDRA (availed `100 crore at 10% in FY16), and other refinancing institutions. Apart from being the only MFI with a sub-20% interest rate, we are also the only MFI with a marginal cost of borrowing of 9.3%#. In addition, we are the only MFI with a cost-to-income ratio as low as 48.3%.
LOWEST RATE AMONG PRIVATE SECTOR MFI GLOBALLY
* Outside the states of Andhra Pradesh and Telangana^ Includes on and off Balance Sheet borrowings and processing fees for Q4FY16
BHARAT FINANCIAL INCLUSION LIMITED Annual Report 2016 BHARAT FINANCIAL INCLUSION LIMITED Annual Report 2016
1211
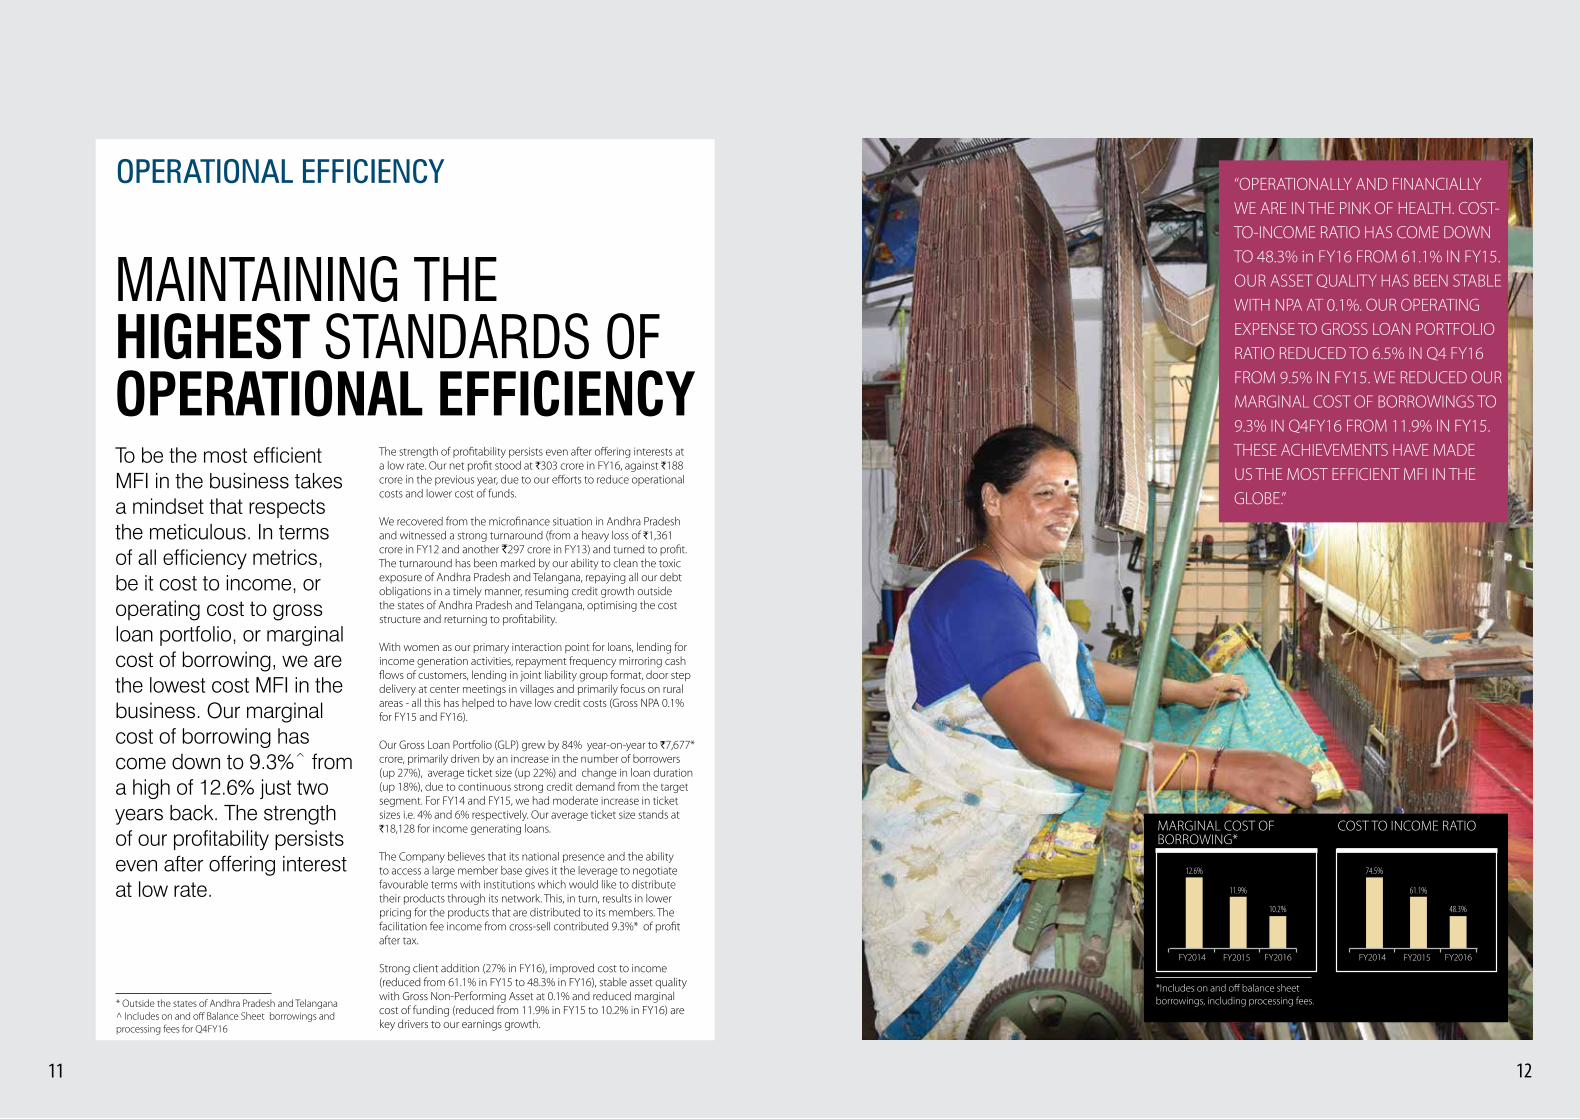
“OPERATIONALLY AND FINANCIALLY WE ARE IN THE PINK OF HEALTH. COST-TO-INCOME RATIO HAS COME DOWN TO 48.3% in FY16 FROM 61.1% IN FY15. OUR ASSET QUALITY HAS BEEN STABLE WITH NPA AT 0.1%. OUR OPERATING EXPENSE TO GROSS LOAN PORTFOLIO RATIO REDUCED TO 6.5% IN Q4 FY16 FROM 9.5% IN FY15. WE REDUCED OUR MARGINAL COST OF BORROWINGS TO 9.3% IN Q4FY16 FROM 11.9% IN FY15. THESE ACHIEVEMENTS HAVE MADE US THE MOST EFFICIENT MFI IN THE GLOBE.”
FY2014FY2014 FY2015FY2015 FY2016FY2016
COST TO INCOME RATIOMARGINAL COST OF BORROWING*
74.5%12.6%
61.1%11.9%
48.3%10.2%
OPERATIONAL EFFICIENCY
To be the most efficient MFI in the business takes a mindset that respects the meticulous. In terms of all efficiency metrics, be it cost to income, or operating cost to gross loan portfolio, or marginal cost of borrowing, we are the lowest cost MFI in the business. Our marginal cost of borrowing has come down to 9.3%^ from a high of 12.6% just two years back. The strength of our profitability persists even after offering interest at low rate.
The strength of profitability persists even after offering interests at a low rate. Our net profit stood at `303 crore in FY16, against `188 crore in the previous year, due to our efforts to reduce operational costs and lower cost of funds.
We recovered from the microfinance situation in Andhra Pradesh and witnessed a strong turnaround (from a heavy loss of `1,361 crore in FY12 and another `297 crore in FY13) and turned to profit. The turnaround has been marked by our ability to clean the toxic exposure of Andhra Pradesh and Telangana, repaying all our debt obligations in a timely manner, resuming credit growth outside the states of Andhra Pradesh and Telangana, optimising the cost structure and returning to profitability.
With women as our primary interaction point for loans, lending for income generation activities, repayment frequency mirroring cash flows of customers, lending in joint liability group format, door step delivery at center meetings in villages and primarily focus on rural areas - all this has helped to have low credit costs (Gross NPA 0.1% for FY15 and FY16).
Our Gross Loan Portfolio (GLP) grew by 84% year-on-year to `7,677* crore, primarily driven by an increase in the number of borrowers (up 27%), average ticket size (up 22%) and change in loan duration (up 18%), due to continuous strong credit demand from the target segment. For FY14 and FY15, we had moderate increase in ticket sizes i.e. 4% and 6% respectively. Our average ticket size stands at `18,128 for income generating loans.
The Company believes that its national presence and the ability to access a large member base gives it the leverage to negotiate favourable terms with institutions which would like to distribute their products through its network. This, in turn, results in lower pricing for the products that are distributed to its members. The facilitation fee income from cross-sell contributed 9.3%* of profit after tax.
Strong client addition (27% in FY16), improved cost to income (reduced from 61.1% in FY15 to 48.3% in FY16), stable asset quality with Gross Non-Performing Asset at 0.1% and reduced marginal cost of funding (reduced from 11.9% in FY15 to 10.2% in FY16) are key drivers to our earnings growth.
MAINTAINING THE HIGHEST STANDARDS OF OPERATIONAL EFFICIENCY
*Includes on and off balance sheet borrowings, including processing fees.* Outside the states of Andhra Pradesh and Telangana
^ Includes on and off Balance Sheet borrowings and processing fees for Q4FY16

BHARAT FINANCIAL INCLUSION LIMITED Annual Report 2016 BHARAT FINANCIAL INCLUSION LIMITED Annual Report 2016
1413
CAPITAL ADEQUACY
We believe solvency and liquidity are two most important things. Our motto is to remain well capitalised, stay liquid and contain the concentration risk. We have a capital adequacy ratio of 23.1%. With a networth of ` 1,383 crore, we choose prudence over profitability.
We are well capitalised with a networth of ` 1,383 crore and capital adequacy of 23.1% as of March 31, 2016, which is well above the mandated regulatory requirement of 15% prescribed by RBI. Our cash and cash equivalents stood at ` 1,660 crore to ensure sufficient liquidity in line with the business requirements.
Our marginal cost of borrowing* reduced from 11.9% in FY15 to 10.2% in FY16 and was at 9.3% during for Q4FY16. This has helped us to reduce our weighted average cost of borrowing and thus reduce the interest rate offered to our customers from 24.55% (in Oct’14) to 19.75% (in Dec’15). We ensure competitive borrowing of funds from the market at low interest rates. Our full year drawdowns in FY16 were `7,317 crore (growth of 46% YoY) excluding origination under managed loans. We have also originated `1,064 crore loans under managed portfolio and completed securitization transactions of `2,320 crore rated as ‘AA(SO)’ and asset assignment of `507 crore in FY16. The Company now has access to low cost refinance and has received ` 100 crore refinance from MUDRA in FY16.
The Company is eligible to borrow funds from banks which are classified as priority sector lending.
As of March 31, 2016, the average maturity of its arrear-free Gross Loan Portfolio as assets was 6.2 months, while the average maturity of its outstanding borrowings including principal amounts outstanding for securitisation transactions was 10.2 months. The Company believes this strategy allows it to better manage liquidity and meet the growing loan demands of an increasing membership, even if external borrowings and funding sources face temporary disruption.
PRUDENT MINDSET GOVERNING CAPITAL ADEQUACY & COST-EFFECTIVE FUNDING
CARE has provided the Company with a grading of ‘MFI 1’ or ‘MFI One’ as an MFI, which is the highest obtainable grading on an eight-point scale. The Company has also obtained bank debt ratings for a funding exposure of ` 4,500 crore as CARE ‘A1+’ (for its short-term facilities) and CARE ‘A+’ (for its long-term facilities). The Company also has a long-term NCD rating of ‘A+’ for ` 400 crore and short-term (CP/ NCD) rating of ‘A1+’ for ` 200 crore from CARE. The Company has also obtained long term debt rating of ‘A+’ and short-term debt rating of ‘A1+’ for a total sum of ` 750 crore from ICRA. The Company’s securitised transactions during FY16 were provisionally rated by CARE at ‘AA(SO)’ and ICRA at ‘AA(SO)’, signifying levels of safety regarding timely servicing of financial obligations and levels of credit risk.
*Includes on and off balance sheet borrowings, including processing fees

BHARAT FINANCIAL INCLUSION LIMITED Annual Report 2016 BHARAT FINANCIAL INCLUSION LIMITED Annual Report 2016
1615
“OUR END-TO-END TECH SOLUTION BY IBM INCLUDES PROVIDING 7,000 TABLETS TO OUR RURAL AND SEMI-RURAL LOCAL AREA OFFICES, A HELP DESK TO MANAGE THESE DEVICES IN EACH OF THESE CENTRES, AND SOFTWARE SERVICES SUCH AS IBM MOBILEFIRST DEVICE PROCUREMENT AND DEPLOYMENT SERVICES AND IBM’S MOBILEFIRST MANAGED MOBILITY SERVICES TO TAKE LOAN PROCESSING ONLINE.”
Efficient usage of technology enabled us to improve our work efficiency and service our customer base in FY16. We adopted several technological innovations to become more efficient. We partnered with IBM to enhance the use of technology in our operations and make our processes paperless. This is aimed towards reducing the time consumed in completing loan disbursal related transactions, saving back office time, improving staff productivity and customer addition.
With this, each Sangam Manager saves approximately one-and-a-half hours and serves more members per day. The Sangam Manager is able to do six centre meetings per day as against the earlier five, registering a 20% increase in field productivity and reducing concomitant costs.
We have 6,323 loan officers operating out of 1,191* branch offices. A centre meeting, where women borrowers who are part of a group come together to discuss the progress in utilising the loans and making repayments, earlier took around 45 minutes to conclude. However, with our new technology, we have brought the time down to 30 minutes.
2000 Installed Computers at all branches with in-house lending system
2012 All branch connectivity with daily data receipt (1,215 remote locations)
2014-15 Re-factoring of in-house lending system
2015-16 Equipped Loan Officers with tablets
TECHNOLOGICAL EFFICIENCY
INVESTING IN THE LATEST TECHNOLOGY TO KEEP AHEAD IN EFFICIENCY
* Outside the states of Andhra Pradesh and Telangana

BHARAT FINANCIAL INCLUSION LIMITED Annual Report 2016 BHARAT FINANCIAL INCLUSION LIMITED Annual Report 2016
1817
THE COMPANY HAS BEEN CONDUCTING CLIENT PROTECTION AWARENESS PROGRAMMES FOR ITS MEMBERS AND EMPLOYEES PAN-INDIA IN MAJOR VERNACULAR LANGUAGES. THE CLIENT PROTECTION PROGRAMME OF THE COMPANY HAS BEEN CERTIFIED BY SMART CAMPAIGN, USA
yy Strengthening privacy of its client data: Ensuring that clients data is kept confidential at all levels and shared only with government agencies, government appointed agencies, or on approval of the concerned member.
yy Transparent and responsible pricing of loans: Lowest cost microfinance lender in the Industry by offering loans at sub 20%. All the pass books/ loan documents are printed in the respective vernacular language for better communication and understanding of client.
yy Timely redressal of queries and grievances of its members: Dedicated customer helpline served in seven languages, to address the customer grievances and ensure the timely resolution.
yy Avoidance of over-indebtedness and multiple borrowing among its borrowers: We adhere to RBI mandated Credit Bureau checks for each loan application and mandated KYCs with application to avoid multiple borrowing among our borrowers.
yy Establishing appropriate collection practices by its employees: Design and Implementation of collection practices in alignment with the RBI and SRO guidelines.
CLIENT PROTECTION

19 20
BHARAT FINANCIAL INCLUSION LIMITED Annual Report 2016 BHARAT FINANCIAL INCLUSION LIMITED Annual Report 2016
In its core business, the Company follows a village-centric, group-lending model to provide unsecured loans to its Members. This model relies on a form of ‘social collateral’, and ensures credit discipline through peer support within the group.
THE CORE BUSINESS OF THE COMPANY IS PROVIDING SMALL VALUE LOANS AND CERTAIN OTHER BASIC FINANCIAL SERVICES TO ITS MEMBERS. THE BUSINESS MODEL RELIES ON A FORM OF SOCIAL COLLATERAL AND ENSURES CREDIT DISCIPLINE THROUGH PEER SUPPORT WITHIN THE GROUP.
OVERVIEWBharat Financial Inclusion Limited (BFIL) (Formerly known as ‘SKS Microfinance Limited’) is the second largest microfinance institution (MFI) in India by Gross Loan Portfolio as on March 31, 2016 and the first MFI to be publicly listed in India. The Company is primarily engaged in providing microfinance to low income households in India. The Company focuses its operations in 16 states (excluding Andhra Pradesh and Telangana) in India, has 1,324 branches and 11,991 employees as on March 31, 2016.
The core business of the Company is providing small value unsecured loans and certain other basic financial services to its Members (Individuals from low income households who are clients of the Company are classified as “Members” and Members whose loans are outstanding are classified as “Borrowers”). These individuals often have no, or very limited, access to loans from institutional sources of financing. The Company believes that non-institutional sources typically charge very high rates of interest. The Company aims to bridge this gap by providing financial services at the doorstep of its Members. The Members are predominantly located in rural areas in India, and
the Company extends loans to them mainly for use in small businesses or for other income-generating activities and not for personal consumption.
In its core business, the Company follows a village-centric, group-lending model to provide unsecured loans to its Members. This model relies on a form of ‘social collateral’, and ensures credit discipline through peer support within the group. The Company believes this model makes its Members prudent in conducting their financial affairs and prompt in repaying their loans. Failure by an individual Borrower to make timely loan repayments will prevent other Members in the group from being able to borrow from the Company in future. Therefore, the group will use peer support to encourage the delinquent Borrower to make timely repayments or will often make a repayment on behalf of a defaulting Borrower, effectively providing an informal joint guarantee on the Borrower’s loan.In addition to its core business of providing micro credit, the Company uses its distribution channel to provide certain other financial products and services that its Members may need.
MANAGEMENT DISCUSSION AND ANALYSIS
1#

22
BHARAT FINANCIAL INCLUSION LIMITED Annual Report 2016 BHARAT FINANCIAL INCLUSION LIMITED Annual Report 2016
Portfolio Growth – SHG and MFIIn contrast to the MFIs, the self-help group (“SHG”) portfolio grew by 20% (as compared to 66% YoY for MFIs) in FY15. The total portfolio outstanding of SHGs as on March 31, 2015 was ` 51,545 crore.
GROSS LOAN PORTFOLIO Amount in ` crore
53,233
2013 2014 2015 2016
17,100
42,927
28,940
51,545
11,636
39,375
47%
84%69%
8% 9% 20%
4%
MFI SHG Growth MFI Growth SHG
N/A
Source: SHG data – Status of Microfinance 2014-15; MFI data - MFIN Micrometer 2016
Geographical MixThe SHG portfolio remains concentrated in the states of Andhra Pradesh (hitherto undivided state including Telangana), Tamil Nadu, Karnataka and West Bengal with a 76% share. The SHG exposure in these states is given in the graph below.
SHG PORTFOLIO IN TOP 4 STATES
Andhra Pradesh Tamil Nadu Karnataka West Bengal
47%
12% 11%
6%
Source – NABARD – Status of Microfinance 2015
Karnataka13%
Maharashtra12%
UP11%
MP8%
Orissa6%
WB6%
Bihar5%
Kerala5%Other States
18%
TIN16%
MFI PORTFOLIO STATES
Source – MFIN Micrometer 2016
MFIs now cover 30 states/ union territories of India. The coverage of microfinance institutions is now geographically well dispersed with GLP in South at 35%, East at 15%, North at 25% and West at 25%. Tamil Nadu has the largest MFI exposure at 16% of gross loan portfolio.
Credit Quality of MFIsPortfolio at Risk (PAR) figures (PAR 30, 90, 180 days) remained under 1% as on March 2016 (excluding figures from MFIs under CDR)Source: MFIN Micrometer 2016
Debt funding to MFIsDuring FY16, MFIs received a total of ` 33,706 crore in debt funding from banks and other financial institutions. Out of the total debt funding, 60% came from banks and the rest came from other financial institutions. 29% of total debt funding was through securitization of MFI’s portfolio at ` 9,632 crore.
Source: MFIN Micrometer 2016
MANAGEMENT DISCUSSION & ANALYSIS
21
The Company offers loans for the purchase of mobile phones and solar lamps. The Company also operates a number of pilot programmes that may gradually convert into separate business verticals or operate through subsidiaries, subject to satisfactory results of the pilot programmes and receipt of regulatory approvals. The existing pilot programmes primarily relate to giving loans to its Members for the purchase of certain productivity-enhancing products such as sewing machines, bicycles, bio-mass stoves and water purifiers. The Company intends to expand its involvement in these other financial products and services to the extent consistent with its mission, client-focus and commercial viability.
In 2005, the Company registered with and has since been regulated by the Reserve Bank of India (RBI) as a Non-Deposit taking Non-Banking Financial Company (NBFC-ND). In 2009, the Company became a public limited Company. The Company
completed its IPO and its equity shares were listed on BSE Limited and the National Stock Exchange of India Limited in August 2010. In November 2013, the RBI re-classified the Company as an NBFC-MFI permitting it to carry on the business of a Non-Banking Financial Company - Micro Finance Institution, a separate category of Non-Deposit taking Non-Banking Financial Companies engaged in microfinance activities.For FY16, the Company’s total revenue and profit after tax was ` 1,320.7 crore and ` 303.0 crore respectively. As on March 31, 2016, the Company had 69.7 lakh Members (55.7 lakh members outside the states of Andhra Pradesh and Telangana), including 58.1 lakh Borrowers (46.4 lakh Borrowers outside the states of Andhra Pradesh and Telangana), with a Gross Loan Portfolio of ` 7,688.0 crore (` 7,676.9 crore outside states of Andhra Pradesh and Telangana) and 1,324 branches (1,191 branches outside the states of Andhra Pradesh and Telangana). The Company charges the lowest interest rate at 19.75% among all private sector MFIs.
I. INDUSTRY STRUCTURE AND DEVELOPMENTS
THE MICROFINANCE INDUSTRYFY16 witnessed strong growth in the microfinance industry in India, continuing the momentum from the last two years. The microfinance industry posted strong growth in increase in new loan disbursements, loan Portfolio, clients, employees and branches.
During FY16, the Microfinance Institution (“MFI”) industry disbursed new loans of ` 61,860 crore representing a 65% increase over previous year. This resulted in 84% growth in the total Gross Loan Portfolio (“GLP”) to ` 53,233 crore. During the same period, the number of clients increased by 44% to 3.25 crore, while the number of people employed by the industry grew by 38% to 85,888 and the number of branches rose by 22%. Average loan amount disbursed per account was ` 17,805.
Particulars FY16 FY15 % increaseDisbursements (` crore) 61,860 37,599 65%Gross Loan Portfolio (` crore) 53,233 28,940 84%No. of clients (crore) 3.25 2.26 44%No. of employees 85,888 62,407 38%No. of branches 9,669 7,934 22%
Source: MFIN Micrometer, 2016
MANAGEMENT DISCUSSION & ANALYSIS
23
BHARAT FINANCIAL INCLUSION LIMITED Annual Report 2016 BHARAT FINANCIAL INCLUSION LIMITED Annual Report 2016
24
Priority Sector Lending (PSL)Priority Sector funds have been a major contributor to the funding source for the overall MFI sector. On April 23, 2015 and July 16, 2015, the RBI issued revised guidelines (FIDD.CO.Plan.BC.54/04.09.01/2014-15 & FIDD.CO.Plan.BC.08/04.09.01/2015-16) for PSL, which are as follows:
S.no. Sector Category Target for Banks %*
1
Agriculture Target 18%
- Direct Agriculture Sub-Target ~13.5%#
- Direct Small & Marginal Farmers Sub-Target7% (with effect from Mar’16)
8% (with effect from Mar’17)
2 Weaker Target 10%
3 Micro-enterprises7% 7% (with effect from Mar’16)
7.50% 7.5% (with effect from Mar’17)
* Target details given in the table are applicable to domestic scheduled commercial banks and foreign banks with 20 branches and above# As per RBI notification dated July 16, 2015, Banks are directed to ensure that overall direct lending to non-corporate farmers does not fall below the system wide average of last three years achievement. In an RBI notification dated November 18, 2015, the applicable system wide average figure for FY15-16 was notified as 11.57%. Banks should also continue to maintain all efforts to reach the level of 13.5% direct lending to beneficiaries.
The revised guidelines envisage banks to monitor their PSL compliance every quarter (with effect from FY17) instead of annually, which will lead to a flow of PSL funds throughout the year rather than being skewed towards financial year-end.
On April 7, 2016, the RBI has issued guidelines on priority sector lending certificates (PSLCs) that detail criteria for banks to issue and invest in PSLCs.
Credit Bureau ReportingAs per the Microfinance India Social Performance Report 2014 (an ACCESS publication), CRIF High Mark Credit Information Services Private Limited and Equifax Credit Information Services Private Limited collect and collate data from MFIs and banks’ lending directly to the client segment of MFIs. MFIs use credit bureau data for checking regulatory compliances.
In February 2015, the RBI mandated all NBFCs to become members of all credit bureaus, viz Credit Information Bureau (India) Limited, Equifax Credit Information Services Private Limited, Experian Credit Information Company of India Private Limited and CRIF High Mark Credit Information Services Private Limited and submit data with respect to lending to its clients (including historical data).
The Company is a member of all the above-named credit bureaus.
Andhra Pradesh & Telangana – The AP MFI ActIn January 2011, the then Government of the hitherto undivided Andhra Pradesh state enacted the Andhra Pradesh Micro Finance Institutions (Regulation of Money Lending) Act, 2011
(the “AP MFI Act”) to regulate the activities of the microfinance institutions in the hitherto undivided Andhra Pradesh. The AP MFI Act imposed significant restrictions on the business and operations of microfinance companies in the hitherto undivided Andhra Pradesh, and several companies, including your Company, challenged the validity of the AP MFI Act. The proceedings are pending before the Honourable Supreme Court of India and, pursuant to the interim orders of the Honourable Supreme Court in March 2013, the Company is required to comply with only Sections 9 and 16 of the AP MFI Act to carry on its business in the hitherto undivided Andhra Pradesh. These provisions limit the amount of interest recoverable on loans to no more than the principal amount loaned as well as prohibit coercive actions in connection with the conduct of microfinance
MANAGEMENT DISCUSSION & ANALYSIS
MFIs and Market shareAs on March 31, 2016, top five (5) NBFC-MFIs accounted in aggregate for approximately 54% of the Gross Loan Portfolio (outside Andhra Pradesh and Telangana) of all NBFC-MFIs. Top 2 MFIs were Janalakshmi Financial Services (GLP - ` 10,983 crore) and SKS Microfinance Limited (now known as “Bharat Financial Inclusion Limited”) (GLP - ` 7,677 crore).
Source: MFIN Micrometer 2016
Overview of the Regulatory Framework and recent Regulatory DevelopmentsThe Non-Banking Financial Company - Micro Finance Institutions (Reserve Bank) – Directions, 2011 (“NBFC-MFI Directions”) were issued in December 2011 by the Reserve Bank of India (RBI) pursuant to the Reserve Bank of India Act, 1934 (“RBI Act”). The NBFC-MFI directions apply to all Non-Deposit taking Non-
Banking Financial Companies (“NBFCs”) (other than companies registered under Section 25 of the Companies Act, 1956) (now section 8 of the Companies Act, 2013 that satisfy certain conditions.
The Company satisfies these conditions and was re-classified as a Non-Banking Financial Company - Micro Finance Institution (“NBFC-MFI”) on November 18, 2013. As a result, the Company is required to comply with the NBFC-MFI Directions. These Directions include guidelines on qualifying assets criteria, asset classification and provisioning, pricing of credit, capital adequacy and fair practices.
Changes in NBFC – MFI directionsOn November 26, 2015, the RBI vide its notification DNBR.CC.D.No. 047/03.10.119/2015-16 modified certain regulations related to operations. Key guidelines and modifications are highlighted below:
Earlier/Existing RevisedNBFC – MFIs Qualifying assets to constitute not less than
85% of its total assets(excluding cash and bank balances)
No change
At least 50% of loans for income generation activities
No change
Qualifying assets criteriaAnnual Income of borrowers Household Rural <= ` 1,00,000 No change
Non-Rural <= ` 1,60,000 No changeTicket Size <= `60,000 - 1st cycle No change
<= ` 1,00,000 - subsequent cycle No changeIndebtedness <= ` 1,00,000 No changeTenure If Loan amount > ` 15,000, then >= 24 months If Loan amount > ` 30,000,
then >= 24 monthsCollateral without collateral No changeRepayment frequency Weekly, Fortnightly and Monthly No changePricing guidelines No change
A. Margin cap - 10% above cost of borrowings No changeInterest Rate B. Avg. base rate of top 5 commercial banks X
2.75No change
Lower of the A and B. No changeProcessing Fee <= 1% of the loan amount No changeInsurance Premium Actual cost of insurance can be recovered from
borrower and spouseNo change
Administrative charges can be recovered as per the Insurance Regulatory and Development Authority
No change
Security deposit No security deposit/ margin to be taken No changeCapital Adequacy 15% No changeMargin Cap 10% for MFIs with loan portfolio > ` 100 crore No change
MANAGEMENT DISCUSSION & ANALYSIS
25 26
BHARAT FINANCIAL INCLUSION LIMITED Annual Report 2016 BHARAT FINANCIAL INCLUSION LIMITED Annual Report 2016
manufacturing, trading and service activities. MUDRA would not only help in increasing access to finance to the unbanked but also bring down the cost of finance for the last-mile financers and, in turn, to the micro/ small enterprises, most of which are in the informal sector.
In Budget 2015-16, it was decided that a sum of ` 20,000 crore would be allocated to MUDRA from the money available from the shortfall of Priority Sector Lending for creating a Refinance Fund to provide refinance to the last-mile financers. Another ` 3,000 crore would be provided to MUDRA from the Union budget to create a credit guarantee corpus for guaranteeing loans being provided to the micro enterprises. Source – http://pib.nic.in/newsite/PrintRelease.aspx?relid=116209
The Secretary of the Department of Financial Services clarified in January 2016 that MUDRA will not be the regulator of NBFC-MFIs. NBFC-MFIs will continue to be under the supervision of RBI.
Source – Indian Express http://indianexpress.com/article/business/business-others/mudra-not-to-regulate-micro-finance-institutions-govt/
There are three offerings, based on the ticket size, launched under MUDRA as part of PMMY (Pradhan Mantri MUDRA Yojana).
1) Shishu – for ticket size less than ` 50,000
2) Kishore –for ticket size between ` 50,000 to ` 5 lakh
3) Tarun – for ticket size between ` 5 lakh and ` 10 lakh
As on March 25, 2016, the performance of 3 schemes is as below-
Scheme No. of Sanctions
Disbursed (` Cr)
Avg. Ticket Size (`)
Shishu 3,02,75,600 56,884 18,789
Kishore 20,31,902 39,354 1,93,681
Tarun 3,82,497 27,705 724,327
Total 3,26,89,999 1,23,943 37,915
Source: http://www.mudra.org.in/PMMYReport
During FY16, the total disbursements made under Prime Minister Mudra Yojana (PMMY) scheme was ` 1.24 lakh crore. In Budget 2016-17, the target of amount to be sanctioned under Prime Minister Mudra Yojana has been set at `1.85 lakh crore. Also ` 2,400 crore has been allocated as equity capital to MUDRA and Credit Guarantee Fund under Pradhan Mantri Mudra Yojana.
Source – India Budget 2016-17
NBFC-MFIs to act as channelizing agents for schemes operated by Central/State government agenciesRBI vide circular dated April 13, 2016 permitted NBFC-MFIs to act as channelizing agents for distributing loans under special
schemes of Central/State government agencies to targeted socio-economic sections of the population.
Source: RBI Circular Notification No. DNBR 041/CGM (CDS)-2016
II. OUTLOOK ON THE SECTOR BY ICRAAccording to the ICRA report “Microfinance Institutions: Industry Outlook and Performance Review of Microfinance Institutions”, the MFI industry market size as on September 30, 2015 was only 20-30% of the total potential market, leading to tremendous scope for growth.
ICRA estimates the potential size of the Microfinance market at `2.8-3.4 trillion against the current market size of ` 1.1 trillion as on September 30, 2015, covered by Self Help Groups, Microfinance Institutions and Bandhan bank. Given the large potential, ICRA suggests that the overall MFI industry can grow at 30-35% in the next three years, while non-AP MFIs can report a growth of 40-50%.
The report also states that while the asset quality indicators for MFIs continue to hold, the sector is still vulnerable to political risks, increase in competitive pressures, expansion to newer geographies, marginal borrower profile and high employee attrition across the industry.
Source – ICRA Report - Industry Outlook and Performance Review of Microfinance Institutions, January 2016
III. OPPORTUNITIES AND STRENGTHSThe Microfinance industry continues to be one of the sectors in India that has a huge potential for sustainable growth, based on industry reports. According to MFIN Micrometer, as on March 31, 2016, the MFI industry GLP grew by 84% YoY while the disbursements during the year grew by 65%. The industry grew by 69% in FY15 and 47% in FY14. As on March 2016, the MFI industry served 3.25 crore clients.
World Bank and EDA Rural Systems’ reports indicate that 150 million households in India require microcredit with an average credit requirement per household at ` 20,000. This translates into an annual aggregate demand of ` 2,40,000 crore for microcredit in India (post 20% downward adjustment for inaccessible households in rural and urban areas).
GLP outstanding for MFI and SHG together was ` 1,04,778 crore (GLP for SHG for - `51,545 crore for FY15 and GLP for MFI – ` 53,233 crore FY16).
Source –MFIN Micrometer 2016; NABARD - Status of Microfinance 2015
Hence there is a huge demand-supply gap and a large part of this gap is currently being met by informal sources, including moneylenders.
MANAGEMENT DISCUSSION & ANALYSIS
business. The Company complies with the interim orders of the Honourable Supreme Court and the two provisions of the AP MFI Act.
MFI as Business CorrespondentsThe Reserve Bank of India permitted Non-Deposit taking NBFCs to act as business correspondents for banks with effect from June 2014. The Company has an arrangement to act as business correspondent with a leading private sector bank and had a managed loan portfolio of ` 688.5 crore as on March 31, 2016 under the said arrangement.
Small Finance Bank LicenseIn November 2014, the RBI issued guidelines for Licensing of ‘Small Finance Banks’ in the private sector. The objectives of setting up of small finance banks will be to further financial inclusion by (a) provision of savings vehicles, and (b) supply of credit to small business units; small and marginal farmers; micro and small industries; and other unorganised sector entities, through high technology-low cost operations.
(Source – RBI Small Finance Bank Guidelines)
On September 16, 2015, RBI granted “In-Principle” approval to 10 applicants to set up small finance banks. Of the 10 applicants who received the “in-principle” approval, 8 are NBFC-MFIs. The “in-principle” approval will be valid for 18 months to allow applicants to comply with the requisite conditions stipulated by RBI. On being satisfied that applicants have complied with the requisite conditions, RBI would consider granting them a license for commencement of banking business under Section 22(1) of the Banking Regulation Act, 1949.Until a regular licence is issued, the applicants cannot undertake any banking business. Source – RBI Press Release
Government’s promotion on Financial Inclusion Schemes Pradhan Mantri Jan Dhan Yojana (PMJDY)The Pradhan Mantri Jan-Dhan Yojana (PMJDY) is a National Mission for Financial Inclusion to ensure access to financial services, namely, banking/ savings and deposit accounts, remittance, credit, insurance and pension in an affordable manner. Accounts can be opened in any bank branch or Business Correspondent (Bank Mitra) outlet. PMJDY accounts are being opened with zero balance. These accounts can help the MFI industry to implement cashless disbursements directly to customer bank accounts and help MFIs reduce the related operating cost.
As on June 1, 2016, 22 crore bank accounts have been opened under this scheme (public sector banks opened 17.3 crore accounts, Regional Rural Banks 3.9 crore accounts and private sector banks opened 0.81 crore accounts). The Balance per Jan Dhan Account has seen a consistent rise from ` 1,065 in March 2015 to ` 1,745 in June 2016. The non-operative accounts also have seen a consistent decline from 58% in March 2015 to 26% in June 2016.
Source: http://www.pmjdy.gov.in/
Micro Units Development & Refinance Agency Ltd. (MUDRA)The Central Government proposes to set up a Micro Units Development and Refinance Agency (MUDRA) Bank through a statutory enactment. Pending the enactment it has been set up as a subsidiary of SIDBI. MUDRA would be responsible for developing and refinancing all MFIs which are in the business of lending to micro/ small business entities engaged in
27
BHARAT FINANCIAL INCLUSION LIMITED Annual Report 2016 BHARAT FINANCIAL INCLUSION LIMITED Annual Report 2016
28
crore through its IPO, followed by a QIP and preferential allotment, raising ` 263.5 crore in FY13 and another QIP raising ` 397.6 crore in May 2014. Its incremental borrowings from banks and financial and other institutions, including net proceeds from securitizations between April 1, 2011 and March 31, 2016 were ` 20,199.6 crore. As on March 31, 2016, the Company had an outstanding debt in principal amount of ` 5,129.7 crore (` 7,382.7 crore outstanding in principal amount including securitization and assignment transactions) from more than 15 banks, financial and other institutions. During FY16, the Company received net proceeds of ` 2,620.5 crore from securitization and assignment of loans and also raised ` 200.0 crore through private placement of Non-Convertible Debentures (NCDs) rated ‘A+’ and ` 677.3 crore through issuance of Commercial Papers (CPs) rated ‘A1+’.
Historically, the MFI sector has significantly relied on PSL funds from commercial banks. The Company believes that the cost of such funds is considerably lower than the cost of other bank funds. The Company is eligible to borrow PSL funds from banks as an NBFC-MFI.
CARE has provided the Company with a grading of ‘MFI 1’ or ‘MFI One’ as an MFI, which is the highest obtainable grading on an eight-point scale. The Company has also obtained bank debt ratings for a funding exposure of ` 4,500 crore as CARE ‘A1+’ (for its short-term facilities) and CARE ‘A+’ (for its long-term facilities). The Company also has a long-term NCD rating of ‘A+’ for ` 400 crore and short-term (CP/ NCD) rating of ‘A1+’ for ` 200 crore from CARE. The company has also obtained long term debt rating of A+ and short-term debt rating of ‘A1+’ for a total sum of ` 750 crore from ICRA. Company’s securitized transactions during FY16 were provisionally rated by CARE at ‘AA(SO)’ and ICRA at ‘AA(SO)’,
signifying levels of safety regarding timely servicing of financial obligations and levels of credit risk.
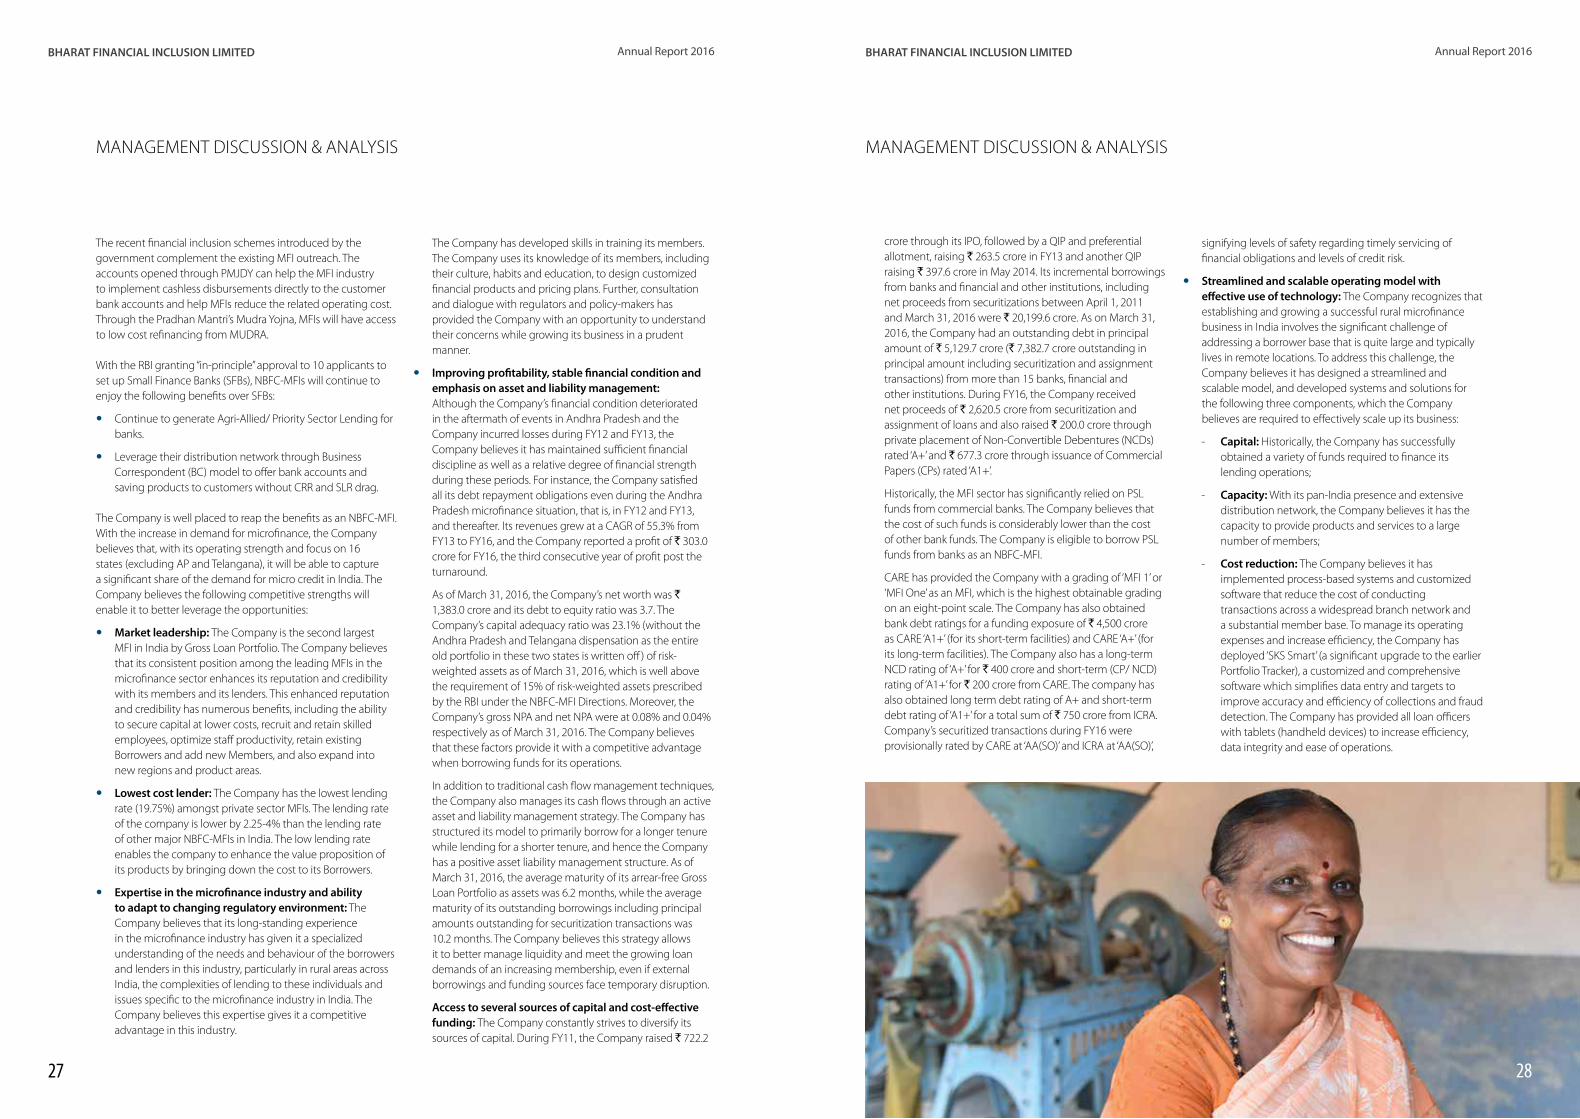
yy Streamlined and scalable operating model with effective use of technology: The Company recognizes that establishing and growing a successful rural microfinance business in India involves the significant challenge of addressing a borrower base that is quite large and typically lives in remote locations. To address this challenge, the Company believes it has designed a streamlined and scalable model, and developed systems and solutions for the following three components, which the Company believes are required to effectively scale up its business:
- Capital: Historically, the Company has successfully obtained a variety of funds required to finance its lending operations;
- Capacity: With its pan-India presence and extensive distribution network, the Company believes it has the capacity to provide products and services to a large number of members;
- Cost reduction: The Company believes it has implemented process-based systems and customized software that reduce the cost of conducting transactions across a widespread branch network and a substantial member base. To manage its operating expenses and increase efficiency, the Company has deployed ‘SKS Smart’ (a significant upgrade to the earlier Portfolio Tracker), a customized and comprehensive software which simplifies data entry and targets to improve accuracy and efficiency of collections and fraud detection. The Company has provided all loan officers with tablets (handheld devices) to increase efficiency, data integrity and ease of operations.
MANAGEMENT DISCUSSION & ANALYSIS
The recent financial inclusion schemes introduced by the government complement the existing MFI outreach. The accounts opened through PMJDY can help the MFI industry to implement cashless disbursements directly to the customer bank accounts and help MFIs reduce the related operating cost. Through the Pradhan Mantri’s Mudra Yojna, MFIs will have access to low cost refinancing from MUDRA.
With the RBI granting “in-principle” approval to 10 applicants to set up Small Finance Banks (SFBs), NBFC-MFIs will continue to enjoy the following benefits over SFBs:
yy Continue to generate Agri-Allied/ Priority Sector Lending for banks.
yy Leverage their distribution network through Business Correspondent (BC) model to offer bank accounts and saving products to customers without CRR and SLR drag.
The Company is well placed to reap the benefits as an NBFC-MFI. With the increase in demand for microfinance, the Company believes that, with its operating strength and focus on 16 states (excluding AP and Telangana), it will be able to capture a significant share of the demand for micro credit in India. The Company believes the following competitive strengths will enable it to better leverage the opportunities:
yy Market leadership: The Company is the second largest MFI in India by Gross Loan Portfolio. The Company believes that its consistent position among the leading MFIs in the microfinance sector enhances its reputation and credibility with its members and its lenders. This enhanced reputation and credibility has numerous benefits, including the ability to secure capital at lower costs, recruit and retain skilled employees, optimize staff productivity, retain existing Borrowers and add new Members, and also expand into new regions and product areas.
yy Lowest cost lender: The Company has the lowest lending rate (19.75%) amongst private sector MFIs. The lending rate of the company is lower by 2.25-4% than the lending rate of other major NBFC-MFIs in India. The low lending rate enables the company to enhance the value proposition of its products by bringing down the cost to its Borrowers.
yy Expertise in the microfinance industry and ability to adapt to changing regulatory environment: The Company believes that its long-standing experience in the microfinance industry has given it a specialized understanding of the needs and behaviour of the borrowers and lenders in this industry, particularly in rural areas across India, the complexities of lending to these individuals and issues specific to the microfinance industry in India. The Company believes this expertise gives it a competitive advantage in this industry.
The Company has developed skills in training its members. The Company uses its knowledge of its members, including their culture, habits and education, to design customized financial products and pricing plans. Further, consultation and dialogue with regulators and policy-makers has provided the Company with an opportunity to understand their concerns while growing its business in a prudent manner.
yy Improving profitability, stable financial condition and emphasis on asset and liability management: Although the Company’s financial condition deteriorated in the aftermath of events in Andhra Pradesh and the Company incurred losses during FY12 and FY13, the Company believes it has maintained sufficient financial discipline as well as a relative degree of financial strength during these periods. For instance, the Company satisfied all its debt repayment obligations even during the Andhra Pradesh microfinance situation, that is, in FY12 and FY13, and thereafter. Its revenues grew at a CAGR of 55.3% from FY13 to FY16, and the Company reported a profit of ` 303.0 crore for FY16, the third consecutive year of profit post the turnaround.
As of March 31, 2016, the Company’s net worth was ` 1,383.0 crore and its debt to equity ratio was 3.7. The Company’s capital adequacy ratio was 23.1% (without the Andhra Pradesh and Telangana dispensation as the entire old portfolio in these two states is written off ) of risk-weighted assets as of March 31, 2016, which is well above the requirement of 15% of risk-weighted assets prescribed by the RBI under the NBFC-MFI Directions. Moreover, the Company’s gross NPA and net NPA were at 0.08% and 0.04% respectively as of March 31, 2016. The Company believes that these factors provide it with a competitive advantage when borrowing funds for its operations.
In addition to traditional cash flow management techniques, the Company also manages its cash flows through an active asset and liability management strategy. The Company has structured its model to primarily borrow for a longer tenure while lending for a shorter tenure, and hence the Company has a positive asset liability management structure. As of March 31, 2016, the average maturity of its arrear-free Gross Loan Portfolio as assets was 6.2 months, while the average maturity of its outstanding borrowings including principal amounts outstanding for securitization transactions was 10.2 months. The Company believes this strategy allows it to better manage liquidity and meet the growing loan demands of an increasing membership, even if external borrowings and funding sources face temporary disruption.
Access to several sources of capital and cost-effective funding: The Company constantly strives to diversify its sources of capital. During FY11, the Company raised ` 722.2
MANAGEMENT DISCUSSION & ANALYSIS

29 30
BHARAT FINANCIAL INCLUSION LIMITED Annual Report 2016 BHARAT FINANCIAL INCLUSION LIMITED Annual Report 2016
Product pricing power: The Company believes that its national presence and the ability to access a large member base gives it the leverage to negotiate favourable terms with institutions which would like to distribute their products through its network. This, in turn, results in lower pricing for the products that are distributed to its members.
For instance, the Company currently works with Microsoft Corporation (India) Private Limited for the financing of mobile phones, with D. Light Energy Private Limited and Green Light Planet India Private Limited for the financing of solar lamps, Environfit (India) Private Limited for the financing of bio-mass stove, Usha International Limited and Singer India Limited for the financing of sewing machine, Eureka Forbes Limited for the financing of water purifier and Hero Cycles Limited and T.I.Cycles of India for the financing of bicycle. The Company financed 7.1 lakh mobile phones and 5.3 lakh solar lamps during FY16.
yy Experienced management team and Board: The Company’s Board comprises experienced investors, industry experts and management professionals. The Company believes that it has a strong Senior Management team to lead it, which includes Mr. M. R. Rao, Managing Director and Chief Executive Officer, as well as Mr. S. Dilli Raj, President. The Company’s Senior Management team has members who have significant experience in the microfinance and financial services industry. The team has developed the knowledge to identify and offer products and services that meet the needs of its members, while maintaining effective risk management and competitive margins. The Company’s mid-level management personnel also have years of experience, in-depth industry knowledge and expertise.
IV. BUSINESS STRATEGYTarget a large share of industry’s portfolio outside the states of Andhra Pradesh and Telangana Given the huge gap in demand and supply in micro credit in India and that a large part of this gap is serviced by informal sources, including moneylenders, this represents an attractive business opportunity for MFIs such as SKS Microfinance Limited (now known as ‘Bharat Financial Inclusion Limited’). The Company believes that, with its operating strength and focus on 16 states (excluding AP and Telangana), it will be able to capture a significant share of the demand for micro credit in India.
Leverage NBFC-MFI status and strategic partnerships to address the missed SFB opportunityAs part of the financial inclusion drive, RBI, on September 16, 2015, granted in-principle approval to 8 NBFC-MFI applicants for Small Finance Bank. Small finance banks will offer basic banking services, accepting deposits and lending to unserved and underserved sections including small business units, small and marginal farmers, micro and small industries, and entities in the unorganized sector.
The Company was an applicant for SFB license but did not receive in-principle approval from RBI. The Company believes SFB license is a missed opportunity but not a setback. The following four reasons substantiate the belief:
The Company’s business processes, from member acquisition to cash collections, have been standardized and documented. Its branch offices are similarly structured, allowing for quick rollout of new branches. In addition, the terms and conditions of its loan products are generally uniform throughout India. Further, the Company has standardized its recruitment and training programmes and materials so that they are easily replicated across its entire organization. This standardized approach also allows employees to efficiently move from one region to the other based on demand and growth requirements.
yy Pan-India presence and extensive distribution network: As of March 31, 2016 the Company had 69.7 lakh Members (55.7 lakh members outside the states of Andhra Pradesh and Telangana), including 58.1 lakh Borrowers (46.4 lakh Borrowers outside the states of Andhra Pradesh and Telangana) and 1,324 branches. The Company focuses its operations across 16 states (excluding Andhra Pradesh
and Telangana) in India. Further, as of March 31, 2016, the Company had 10,468 (9,695 outside the states of Andhra Pradesh and Telangana) Branch Managers, Assistant Branch Managers and Sangam Managers, including Trainees, who comprise 87.3% (86.9% non-AP) of its total workforce. During FY16, each of its Sangam Managers managed 880 members on an average in states other than Andhra Pradesh and Telangana. The Company believes that its presence throughout India and its distribution network in rural India results in significant competitive advantages, particularly in the following areas:
Distribution platform: The Company’s pan-India presence allows it to lend across the country and enables it to mitigate its exposure to local economic factors and disruptions resulting from political circumstances or natural disasters. Furthermore, its well-developed distribution network in rural India gives it the capability to offer a variety of financial products nationally in areas that the Company believes most companies do not currently reach.
MANAGEMENT DISCUSSION & ANALYSIS
Jammu & Kashmir
Himachal Pradesh
Punjab
Haryana
DelhiUttarakhand
Uttar PradeshRajasthan
Gujarat
Maharashtra
Madhya Pradesh
Karnataka
Kerala
Tamilnadu
Andhra Pradesh
Telangana
Bihar
SikkimAssam Nagaland
West Bengal
Chhattisg
arh
Odisha
Tripura
Arunachal Pradesh
JharkhandMizoram
MeghalayaManipur
3
18121
59
22
139
169
150
28
136
47 126
125
58
75
202
53
(1.3)
(6.7)
(4.8)
(6.6) (5.5)
(7.4)(6.0)
(7.6)(8.3)
(6.9)
(6.4)
(7.7)
(7.4)
(7.4)
(7.0)
(5.9)
(7.2)
(7.4)
(5.5)
Total branches = 1,324
As of March 2016
(Weighted Avg. Vintage in years)

32
BHARAT FINANCIAL INCLUSION LIMITED Annual Report 2016 BHARAT FINANCIAL INCLUSION LIMITED Annual Report 2016
31
performance is regularly reviewed by, Mr. Verghese Jacob who is appointed as an independent ombudsman since January 1, 2012.
The Company has also proactively reached out to its customers through Voice of Customer programme to identify their needs and collect their feedback on existing products. More than 1,00,000 customers were surveyed under different surveys, in major vernaculars, and assessed for their need of new products, satisfaction with existing products and processes, and awareness on client protection principles.
Bring down the cost to borrowersThe Company has reduced the interest rates it charges on loans, with the objective of bringing down the cost to its borrowers. During FY16, the Company reduced the interest rate on its income-generating loans from 23.55% to 20.75% effective from October 1, 2015. With diversification of funding sources and further reduction in cost of borrowing, the Company again reduced the interest rate on its income-generating loans to 19.75% effective from December 7, 2015, making the Company’s interest rate the lowest among private sector MFIs. The Company intends to leverage opportunities in future to further reduce the interest rates to borrowers.
Diversification of revenue streams and cross selling of products and servicesThe Company has built a large distribution network in rural India. The Company believes it can leverage this network to distribute financial and non-financial products of other institutions to its members at a cost lower than competition. Its network also allows such distributors to access a segment of the market to which many do not otherwise have access.
While the Company continues to focus on its core business of providing micro credit services, it seeks to diversify into other businesses by scaling up certain pilot projects involving fee-based services, and will gradually convert them into separate business verticals or operate them through subsidiaries. Its objective in these other businesses is to focus on lending that will allow it to maintain repayment rates, increase member loyalty and also provide economic benefits to its members and their families. The Company believes that such other products and services may offer higher operating margins as compared to micro credit under the new regulatory framework and will help it increase its overall RoA.
The Company’s existing initiatives in relation to financial products and services other than micro credit include providing:
- Loans to its members for the purchase of mobile handsets in association with Microsoft Corporation (India) Private Limited and solar lamps in association with D. Light Energy Private Limited and Green Light India Private Limited.
- Loans to its members to facilitate the purchase of sewing machines in association with Usha International Limited and Singer India Limited, bicycles in association with Hero Cycles Limited and T.I.Cycles of India, bio-mass stoves in association with Envirofit (India) Private Limited and water purifiers in association with Eureka Forbes Limited.
Enhance operating and financial leverageThe Company provides collateral-free credit to a majority of its members in their neighbourhood, and its Sangam Managers assist with the processes related to credit verification. While this helps its borrowers save on travel costs, it results in high operating expenses for the Company, particularly personnel and administrative costs. Personnel costs accounted for 72.4% of its operating expenses during FY16.
The Company has embarked on cost-optimization initiatives by improving its ratio of Borrowers per Sangam Manager, while realizing the benefits of economies of scale. The Borrowers per Sangam Manager ratio (outside the states of Andhra Pradesh and Telangana) was 312 as of March 31, 2012 and has been improved to 733 as of March 31, 2016. Further, the Company has merged branches, both in the hitherto undivided Andhra Pradesh and other states. In addition, the Company grew its loan portfolio in FY14, FY15 and FY16 without adding a significant number of new branches or incurring additional capital expenditure. There was a net reduction of approximately 200 branches during FY13, six branches during FY14 and net addition of 13 branches in FY15 and 56 branches in FY16. As of March 31, 2016, the Company had 1,324 branches. Its total headcount was reduced from 16,194 as of March 31, 2012 to 8,932 as of March 31, 2014. With resumption of hiring, the headcount increased to 9,698 as of March 31, 2015 and 11,991 as of March 31, 2016. To implement its growth strategy, though the Company plans to increase its headcount and open branches in certain areas, it will continue to focus on efficiencies to maintain and improve operating leverage.
Other factors that the Company continues to focus on to optimize its cost structure include enhancing the productivity of employees, introducing technology for expedient reporting and re-engineering the internal processes. The results of cost optimization are evident in the reduction in cost-to-income ratio from 74.5% in FY14 to 48.3% in FY16.
Its debt to equity ratio was 3.7 as of March 31, 2016. With a return to full-year profitability in FY14, improved profitability in FY15 and FY16, growth in its portfolio outside the states of Andhra Pradesh and Telangana, and increase in the availability of financing, the Company aims to maximize its operating and financial leverage.
MANAGEMENT DISCUSSION & ANALYSIS
yy The Company is the lowest cost lender among all MFIs including those who have received in-principle approval for SFB. Low lending rate mitigates political risks.
yy The Company now has access to low cost refinance. The Company received ` 100 crore refinance from MUDRA.
yy The Company can tie up with banks to provide bank accounts to its borrows and aim to move to a cashless regime, thereby reduce operating costs.
yy The Company has the highest rating in the MFI sector, A1+ for short term and A+ for long term instruments. It is already the lowest cost borrower in the sector.
Continue to strengthen Client Protection initiativesThe Company continues to implement several client protection initiatives. They have helped to ingrain the client protection practices and customer grievance redressal mechanism which are aligned with globally recognised benchmarks, deep in all its processes, policies, and culture. These two are now the guiding principles for design, development, and implementation of all the processes and policies. The Company has identified five elements for these initiatives:
yy Strengthening privacy of its client data: Ensuring that clients data is kept confidential at all levels and shared only with government agencies, government appointed agencies, or on approval of the concerned member.
yy Transparent and responsible pricing of loans: Pricing of the products are well explained to members and done within the regulatory framework of RBI. At 19.75% interest rate, BFIL becomes the cheapest loan providing MFI.
yy Timely redressal of queries and grievances of its members: BFIL has a well-defined and fully automated Complaint Grievance Redressal Mechanism (CGRM) for ensuring timely redressal.
It also proactively reaches out to members for their feedback on different products through “Voice of Customers” program.
yy Avoidance of over-indebtedness and multiple borrowing among its borrowers: Adherence of strict KYC policy and Credit Bureau and automated systems ensures the seamless implementation with controls thereby avoiding over-indebtedness and multiple borrowing among our borrowers.
yy Establishing appropriate collection practices by its employees: Design and Implementation of collection practices, in alignment with the RBI and SRO guidelines and regulatory frameworks.
The Company has been conducting Client Protection awareness programmes for its members and employees pan-India in major vernacular languages with greater focus for the last four years. The Client Protection Programme of the Company has been certified by Smart Campaign, USA. The Company has also voluntarily adopted a ceiling of 3% Return on Assets (RoA) from its micro credit business.
During FY16, the Company’s well-established inbound toll-free member helpline successfully serviced 5,94,779 customer calls (an increase of 67% over FY15) . Inbound calls have doubled over the previous year indicating growing awareness amongst customers about the member helpline. Effective CGR processes has ensured that 98% of these calls were closed within the defined turn-around time (TAT). Turnaround times and CGR
MANAGEMENT DISCUSSION & ANALYSIS

33 34
BHARAT FINANCIAL INCLUSION LIMITED Annual Report 2016 BHARAT FINANCIAL INCLUSION LIMITED Annual Report 2016
are systematically addressed through mitigating actions on a continuing basis. These are discussed with both the Management and the Risk Management Committee. Some of the risks relate to competitive intensity and the changing legal and regulatory environment. The Risk Management Committee of the Board reviews the risk management policies in relation to various risks and regulatory compliance issues.
The Company identifies the following as key risks:
Political Risk The Company recognizes political risk as one of the major risks facing the industry and believes that political risk can be mitigated through Responsible lending and fair pricing by way of:
yy Lowest cost lender – The Company charges the lowest interest rates among MFIs to its borrowers.
yy Voluntary Cap on RoA from core lending – The Company has voluntarily capped its returns from core lending at 3%.
yy Robust Customer grievance redressal (CGR) Mechanism with Independent Ombudsman
yy Calibrated Growth – The Company’s growth strategy aims to meet requirements of its members and also address concerns of various stakeholders.
Concentration RiskThe Company aims to avoid unbalanced concentration in both its loan portfolio and borrowings. To mitigate the concentration risk, the company has well defined Geographic & Borrower dependence norms
Geographic concentration norms – In order to mitigate the risk of external intervention, concentration in any particular state, district or Branch, as well as to manage non-payment risk, the Company has implemented the following limits
Disbursement Related Caps:The disbursement limits stipulate each state to entail less than 15% of the total disbursements for the Company (except states of Karnataka and Odisha which have a 20% limit); each district to entail less than 3% of the total disbursements for the Company (except districts in states of Karnataka and Odisha which have a 4% limit); each Branch to entail less than 1% of the total disbursements for the Company (except branches in states of Karnataka and Odisha which have a 1.25% limit); no disbursements to be made by branches that have an NPA of more than 1% or collection efficiency of less than 95%;
Portfolio Outstanding Related Caps:
- Gross Loan Portfolio:
Each state to ensure that its Gross Loan Portfolio will not exceed 75% of the Company’s net worth (except states of Karnataka, Odisha and Maharashtra which have a 100% limit); each district to maintain that its Gross Loan Portfolio will not exceed 5% of the Company’s net worth (up to 5% of the operating districts may go up to 10% of the Company’s net worth); each Branch to maintain that its Gross Loan Portfolio will not exceed 1% of the Company’s net worth (up to 5% of the operating branches may go up to 2% of the Company’s net worth).
- Loan Portfolio Outstanding:
Each state to ensure that its Gross Loan Portfolio will not exceed 15% of the Company’s total portfolio (except states of Karnataka and Odisha which have a 20% limit).
Caps are subject to tolerance of 10%.
yy Borrowing dependence norms – In order to reduce dependence on a single borrower, the Company has adopted a cap on borrowing from any single credit granter at 15%. The share of borrowing from top 3 banks reduced significantly from 61% in March 2013 to 34% in March 2016.
Operational Risk The core business of the Company is to provide collateral-free loans in rural areas and consequently requires enhanced operational risk management. To mitigate the operational risk, the company adopts the following strategy.
yy Integrated cash management system –
- The Company’s disbursements to and collections from borrowers are predominantly in cash, making cash management an important element of the business. To reduce the potential risks of theft, fraud and mismanagement, the Company has been implementing an integrated cash management system since July 2009 which is operational in approximately 1,274 of its branches as of March 31, 2016. The system utilizes an Internet banking software platform that interfaces with various banks to provide the Company with real-time cash information for these branches and the loan activity therein.
- The Company believes this integrated system augments its management information systems and facilitates its bank reconciliations, audits and cash flow management. The system also reduces errors.
yy Product and Process Design – The Company adopts a standardized approach to product design and operational procedures at the branches and centers to enable predictability of transactions, as a risk mitigant.
MANAGEMENT DISCUSSION & ANALYSIS
Information Technology as an enabler Technology combined with innovation and business process change brings in the greatest return. Pursuing this line, the Company has focussed on advanced technology solutions that drive it to growth through the following:
yy As a part of Enterprise Mobility strategy, BFIL digitally empowered its loan officers with tablets. The SMART Tab project involved provisioning and deployment of 7,000 tablets across all their branches in the country, and a help desk to assist loan officers to manage their devices. As a result, back office job is completely moved to field computing at the point of delivery in the remote villages of the country. With minimal paper work and time savings it has resulted in significant increase in efficiencies. BFIL has applied to patent this innovative technology.
yy The Enterprise Mobility project, an innovative offline solution was awarded SKOCH Order-of-Merit Award, SKOCH Smart Technology Award, and Dataquest Technology Award.
yy Branch Health Monitor (BHM) software was launched across the enterprise for raising any service request from branches. With strictly defined TAT’s, it has significantly improved service quality for branches and in turn better servicing of clients.
yy Migrated to IPV6 from IPV4 in order to have more efficient and security features.
yy Strengthened data analytics to gain insights for analyzing service delivery, process adherence/deviations and to understand different patterns across the geographies. In addition, data analytics is used for analyzing proposal trending across geographies and to report on major KPIs.
yy BFIL lays lot of emphasis on training its employees for continuous growth and development to meet Organization objective and development of employee as an individual. Training Interface Module (TIM) software for training team has been launched to track all the trainings conducted, schedules, attendance, online tests, monitoring and further certification of all employees.
yy BFIL started seamless integration with Credit Bureau (CB) through web service technology for CB enquiry, resulting in faster service to clients.
yy Initiated a pilot towards cashless disbursements into the member accounts through NEFT.
V. RISKS AND MANAGEMENT
STRATEGIESRisk is an integral part of the Company’s business, and sound risk management is critical to the success of the organization. As a financial intermediary, the Company is exposed to risks that are particular to its lending and the environment within which it operates. The Company has identified and implemented comprehensive policies and procedures to assess, monitor and manage risk throughout the Company. The risk management process is continuously improved and adapted to the changing risk scenario and the agility of the risk management process is monitored and reviewed for its appropriateness in the changing risk landscape. The process of continuous evaluation of risks includes taking stock of the risk landscape on an event-driven basis.
The Company has an elaborate process for risk management. This rests on the three pillars of Business Risk Assessment, Operational Controls Assessment and Policy Compliance Processes. Major risks identified by the businesses and functions

36
BHARAT FINANCIAL INCLUSION LIMITED Annual Report 2016 BHARAT FINANCIAL INCLUSION LIMITED Annual Report 2016
35
MANAGEMENT DISCUSSION & ANALYSIS
Operational Performance
Operational highlights Mar-12 Mar-13 Mar-14 Mar-15 Mar-16
No. of branches 1,461 1,261 1,255 1,268 1,324
No. of districts 329 298 294 314 323
No. of employees 16,194 10,809 8,932 9,698 11,991
No. of members (in Lakh) 53.5 50.2 57.8 64.0 69.7
Disbursements for the year (` in crore) 2,737 3,320 4,788 6,891 12,088
Gross loan portfolio (` in crore)* 1,669 2,359 3,113 4,185 7,688
*Includes securitized, assigned and managed loan portfolio
Financial highlights Mar-12 Mar-13 Mar-14 Mar-15 Mar-16
Incremental borrowings* (` in crore) 1,823 3,149 3,703 5,561 8,309
Total revenue (` in crore) 472 353 545 803 1,321
Profit after tax (` in crore) (1,361) (297) 70 188 303
Total assets (` in crore) 1,681 2,511 2,497 4,699 7,154
Return on average asset ^ -40.3% -11.7% 2.3% 4.3% 4.2%
Return on average equity -118.9% -74.4% 16.7% 21.6% 25.1%
*Amount of sanctions received from banks and financial institutions^ Assets include securitized, assigned and managed loan portfolio
Financial Performance (Comparison of FY16 with FY15)
Particulars FY16 FY15 Increase / Decrease` in crore Per cent to
Revenue` in crore Per cent to
RevenueIncome from operations 1,169.1 88.5% 724.0 90.1% 61.5%
Other income 151.5 11.5% 79.1 9.9% 91.6%
Gross revenue 1,320.7 100.0% 803.1 100.0% 64.5%
Employee benefit expenses 292.4 22.1% 231.9 28.9% 26.1%
Finance costs 484.6 36.7% 279.0 34.7% 73.7%
Other expenses 102.8 7.8% 84.0 10.5% 22.4%
Depreciation and amortization 8.4 0.6% 4.6 0.6% 83.4%
Provisions and write-offs 38.6 2.9% 10.0 1.3% 284.7%
Total expenditure 926.8 70.2% 609.5 75.9% 52.1%
Profit before tax 393.9 29.8% 193.6 24.1% 103.5%
Tax expense 90.9 6.9% 5.9 0.7% 1440.3%
Profit after tax 303.0 22.9% 187.7 23.4% 61.4%
MANAGEMENT DISCUSSION & ANALYSIS
yy ISO Certified Internal audit – The Company has adequate controls and processes in place with respect to its operations. The Internal Audit department acts as the third line of defence by monitoring adherence to controls and processes and provides inputs for strengthening risk management.
Liquidity Risk The Company places significant importance on liquidity management and has a bias for liquidity mainly to address operational requirements and corporate commitments. Along with funding strategy and asset liability management, the Company has well defined liquidity metrics viz, cash burn, business continuity and growth tests to ensure sufficient liquidity in line with business requirements and aid risk mitigation. VI. INTERNAL CONTROL SYSTEMS AND
THEIR ADEQUACYThe Company has a well-established Internal Audit Department which ensures adherence to systems, policies and procedures to maintain financial discipline. The Internal Audit Department aims at checking the operational risks through its control mechanism and by conducting inspection of branches/ offices. Based on the guidelines received on various issues of control from the Reserve Bank of India and the Government of India, the Company’s Board of Directors and the Audit Committee of the Board have become part of the Internal Control System for better compliance at all levels.
The Company’s Internal Control Systems are commensurate with the nature of its business and the size and complexity of its operations. These are routinely tested and cover all Branches, Regional Offices and the Head Office. Significant audit
observations and follow-up actions thereon are reported to the Audit Committee.
The Audit Committee of the Board oversees the Internal Audit function of the Company. The Audit Committee reviews the adequacy and effectiveness of the Company’s Internal Control System, and monitors the implementation of audit recommendations including those related to strengthening of the Company’s risk management policies and systems. The Audit Committee monitors compliance with inspection and audit reports of the Reserve Bank of India, other regulators and statutory auditors.
VII. FY16 - UPDATE
OPERATIONAL AND FINANCIAL HIGHLIGHTSDuring FY16, the Company reported a profit after tax of ` 303.0 crore as compared to a profit of ` 187.7 crore in FY15. The Company reported profits for 14 consecutive quarters and for three full years - FY14, FY15 and FY16 since the turnaround.
Revenue increased by 64.5% during FY16. The Company obtained incremental drawdowns (including securitization) of ` 7,317.4 crore in FY16, an increase of 45.8% compared to FY15. This aided higher disbursements and the Company registered growth in the loan portfolio in states other than Andhra Pradesh and Telangana during FY16. Gross Loan Portfolio in states other than Andhra Pradesh and Telangana increased by 84.0% from ` 4,171.2 crore crore as on March 31, 2015 to ` 7,676.9 crore as on March 31, 2016. Gross Loan Portfolio in states other than Andhra Pradesh and Telangana increased at a CAGR of 55.3% from ` 1,320.0 crore as on March 31, 2012 to ` 7,676.9 crore as on March 31, 2016. Further, average loan recovery rates in states other than Andhra Pradesh and Telangana were robust at 99.8% for FY16.
Income from operationsIncome from operations increased by 61.5%, from ` 724.0 crore in FY15 to ` 1,169.1 crore in FY16. This growth is primarily due to an increase in average (quarterly) Gross Loan Portfolio by 68.6% from ` 3,362.9 crore in FY15 to ` 5,670.4 crore in FY16. The opening and closing Gross Loan Portfolio for FY16 were ` 4,184.5 crore (March 2015) and ` 7,688.0 crore (March 2016) respectively.
Other incomeOther income increased by 91.6%, from ` 79.1 crore in FY15 to ` 151.5 crore in FY16. The increase in other income was primarily due to an increase in the Company’s other fee income. Other fee income relates to fees for acting as business correspondent with regard to managed loans and fee received from strategic alliance partners for financing their products, such as mobile phones, solar lamps, sewing machine, bicycle etc.

38
BHARAT FINANCIAL INCLUSION LIMITED Annual Report 2016 BHARAT FINANCIAL INCLUSION LIMITED Annual Report 2016
total borrowed funds and funds from securitization/assignment of loans. As of March 31, 2015, its total outstanding borrowings and funds from securitization/assignment of loans from public sector banks, domestic private banks, foreign banks, and financial institutions and other institutions were 26.4%, 55.2%, 5.1% and 13.2% respectively of its total borrowed funds and funds from securitization/assignment of loans.
The Company meets the requirements of PSL guidelines and regularly accesses bank financing that qualifies as PSL. The RBI on April 23, 2015 revised PSL norms for all the scheduled commercial banks (excluding regional rural banks). The scope of PSL has been expanded to include new segments for lending such as medium enterprises, social infrastructure and renewable energy. PSL norms have been detailed earlier in this section.
The PSL guidelines also specify that, going forward, the monitoring on compliance for banks on Priority Sector targets will be done on a more frequent basis, that is, quarterly (instead of yearly) and banks will have to publish the information of their Priority Sector advances on both quarterly as well as annual basis. With the quarterly compliance on PSL reporting for banks, the seasonality in funding may reduce and ensure credit flow to the MFI sector on a regular basis through the year VIII. HUMAN RESOURCE MANAGEMENT The Company always banks on the contributions of its field employees in embarking on a new growth journey. During FY16, the Company continued to show signs of positivity and growth, providing the Management an appetite for enhancing potential and driving growth and development of its people. Talent Engagement, Talent Management, Leadership Development and HR Technology were the key focus areas for the period.
Company continued to conduct various learning programs for enhancing potential and providing growth opportunity to its people. Continuing the thrust on developing and grooming of internal leadership among middle-level managers, a series of programmes were initiated. ‘GOAL’ is a 30 hours program on Business communication which provides an opportunity to internal leadership among middle-level managers to learn business language ‘English’ though an instructor led training delivery model. ‘Lakshya’ continues to serve its purpose of developing Unit managers to the next level through a robust development cum assessment model. Contribution of field employees is crucial and so is welcoming them into the company. Company ensured that field trainees, the first entry level employees of the organization are WELCOMED in the organization in the right way and in the right spirit through a program called ‘WELCOME – One Day Induction’.
As part of building process capabilities for field staff, company provided 6,79,409 man-hours of technical training in seven vernacular languages.
The Company has been chosen as Aon Best Employers – 2016. The Aon Emerging Best Employers India 2016 study is done, in partnership with BW Businessworld and Bloomberg TV India.
As part of HR Automation, self-manager services were extended to field staff through HRIS (Human Resources Information System) – SPARK. Processes related to statutory compliance was automated through online compliance tracker. In order to monitor field HR reports, the Company introduced DAMS – Disciplinary Actions Management system and HR connect.
To support its growing business, the Company hired business leaders from banking industry to head various regional offices. The Company also started hiring talent from various Rural Management Colleges and trained them to create a talent pool for future leadership positions. The company has provided internal growth opportunities to consistent performing employees.
During FY16, there was a net addition of 24% manpower at various levels. As on 31st March, 2016, the overall employee strength of the Company was 11,991. The human resource distribution shows that the field employees in branch offices totalled 10,468 (87.3%) and Head Office & Regional Office staff totalled 1,523 (12.7%). Voluntary attrition rate during FY16 was 20.1%.
Cautionary StatementThis document contains statements about expected future events, financial and operating results of BFIL, which are forward-looking. By their nature, forward-looking statements require the Company to make assumptions and are subject to inherent risks and uncertainties. There is significant risk that the assumptions, predictions and other forward-looking statements will not prove to be accurate. Readers are cautioned not to place undue reliance on forward-looking statements as a number of factors could cause assumptions, actual future results and events to differ materially from those expressed in the forward-looking statements. Accordingly, this document is subject to the disclaimer and qualified in its entirely by the assumptions, qualifications and risk factors referred to in the management’s discussion and analysis of BFIL’s Annual Report, FY2016.
MANAGEMENT DISCUSSION & ANALYSIS
37
MANAGEMENT DISCUSSION & ANALYSIS
Financial expensesThe Company’s financial expenses represent 52.3% of the total expenses for FY16. Financial expenses increased by 73.7% from ` 279.0 crore in FY15 to ` 484.6 crore in FY16 due to an increase in average (quarterly) borrowings by 83.8% from ` 2,286.7 crore in FY15 to ` 4,203.2 crore in FY16.
Employee benefit expensesEmployee benefit expenses consist of salaries and other employee benefits. Employee benefit expenses increased by 26.1% from `231.9 crore in FY15 to ` 292.4 crore in FY16, due to annual increments and increase in the number of employees from 9,698 at the end of FY15 to 11,991 at the end of FY16.
Other expensesOther expenses represented 11.1% of the total expenses for FY16 and increased by 22.4% from ` 84.0 crore in FY15 to ` 102.8 crore in FY16. This increase was primarily due to an increase in travelling and conveyance expenses.
Depreciation and amortizationDepreciation and amortization increased by 83.4%, from ` 4.6 crore in FY15 to ` 8.4 crore in FY16. This increase was primarily on account of net additions of fixed and intangible assets of ` 14.6 crore during FY16.
Provisions and write-offsProvisions and write-offs represented 4.2% of the total expenses for FY16 and increased by ` 28.6 crore, from ` 10 crore in FY15 to ` 38.6 crore in FY16. This is due to standard assets provision of ` 30.8 crore made towards its Joint Liability Group (JLG) loan portfolio to maintain provisioning required by the NBFC-MFI Directions issued by the Reserve Bank of India vide its circular dated December 2, 2011 and as amended vide circular dated March 20, 2012.
FUND RAISINGIn FY16, the Company received sanctions for 8,309.0 crore as compared to ` 5,561.0 crore during FY15. The Company raised funds of ` 7,317.4 crore in FY16 as compared to ` 5,019.9 crore in FY15. Funds raised in FY16 include ` 2,139.3 crore through securitization of portfolio loans, `481.2 crore through assignment and ` 200.0 crore through private placement of Non-Convertible Debentures (NCDs) and ` 677.3 through issuance of Commercial Papers (CPs).
The Company’s debt funding sources are broad based and, as of March 31, 2016, its total outstanding borrowings and funds from securitization/assignment of loans from public sector banks, domestic private banks, foreign banks, and financial and other institutions were 38.2%, 42.3%, 6.1% and 13.4% respectively of its

39 40
BHARAT FINANCIAL INCLUSION LIMITED Annual Report 2016 BHARAT FINANCIAL INCLUSION LIMITED Annual Report 2016
DIRECTORS’ REPORT DIRECTORS’ REPORT (Contd.)
Dear Members,
Your Board of Directors (the “Board”) takes pleasure in presenting the Thirteenth Annual Report of Bharat Financial Inclusion Limited (formerly known as “SKS Microfinance Limited“)(the “Company”) together with the audited financial statements for the year ended March 31, 2016.
FINANCIAL HIGHLIGHTS
The financial performance of the Company for the year ended March 31, 2016 is summarized below:
Year ended March 31 2016 2015 Change (%)
Total revenue (` in crore) 1,320.7 803.1 64.5
Less: Total expenditure (` in crore) 926.8 609.5 52.1
Profit Before Tax (` in crore) 393.9 193.6 103.5
Profit After Tax (` in crore) 303.0 187.7 61.4
Earnings Per Share (EPS) (`) 23.9 15.2 57.0
Diluted EPS (`) 23.6 15.0 56.8
y The Company has posted a profit after tax (PAT) of `303.0 crore for FY16 as compared to a PAT of `187.7 crore for FY15. A sum of `60.6 crore is transferred to statutory reserve as against `37.5 crore for FY15. Consequently, the deficit in the P&L Account to be carried forward has reduced to `900.3 crore as against `1143.1 crore for FY15.
y ROA (including securitized, assigned and managed loan portfolio) and ROE for FY16 were 4.2% and 25.1% respectively.
OPERATIONAL HIGHLIGHTS
Year ended March 31 2016 2015 Change (%)
Number of branches 1,324 1,268 4.4
Number of members (in lakh) 69.7 64.0 8.9
Number of employees 11,991 9,698 23.6
Amount disbursed (` in crore) 12,087.8 6,890.8 75.4
Gross loan portfolio (` in crore) 7,688.0 4,184.5 83.7
Gross loan portfolio outside Andhra Pradesh and Telangana (` in crore)
7,676.9 4,171.2 84.0
RESOURCE MOBILISATION
During the year under review, the Company has diversified the sources of funds and raised a sum of `7,317.4 crore by way of short-term and long-term loans, commercial papers and also non-convertible debentures (NCDs), which was 45.8% higher as compared to `5,019.9 crore raised during FY15 and 43.3% higher as compared to `3,503.1 crore during FY14.
The net worth of the Company as on March 31, 2016 was `1,383.0 crore and capital adequacy as on March 31, 2016 was 23.1%, well in excess of the mandated 15%.
The Company’s cost of borrowings reduced to 11.6% in FY16 as compared to 12.8% for FY15. This reduction was mainly driven by sustained turnaround and diversification of sources of funding. In line with the Company’s policy of passing on the cost advantages accruing from economies of scale, operational efficiency and reduction in the cost of borrowing to its borrowers, the Company reduced the rate of interest by 1.55% in July 2015, 1.25% in October, 2015 and 1% in December, 2015. With the aforesaid and reduction in FY15, the Company has reduced the rate of interest by 4.8%.
The rate of interest charged by the Company is the lowest rate among Non-Banking Financial Company - Micro Finance Institutions (NBFC-MFIs) on its core Income Generating Loans (IGL).
In addition to the listing of equity shares on NSE and BSE, the NCDs issued by the Company are listed on wholesale debt segment of BSE Limited.
In order to capitalize on various opportunities for the further growth of the business and to meet capital adequacy requirement, the Board at its meeting held on May 4, 2016, approved raising of capital by issue of securities to the extent of `750 crore in one or more tranches in accordance with the provisions of the Companies Act, 2013 (“CA 2013”), SEBI (Issue of Capital and Disclosure Requirements) Regulations, 2009 and other laws/guidelines. Your approval for the said proposal has been sought by inclusion of the Special Resolution at sr. no. 6 of the Notice of the Thirteenth Annual General Meeting (AGM).
BUSINESS OVERVIEW
During FY16, the Company’s total revenue and profit after tax was `1,320.7 crore and `303.0 crore respectively. As of March 31, 2016, the Company had 69.7 lakh Members (55.7 lakh Members in states other than Andhra Pradesh and Telangana), including 58.1 lakh Borrowers (46.4 lakh Borrowers in states other than Andhra Pradesh and Telangana) spread across 1,324 branches (1,191 branches in states other than Andhra Pradesh and Telangana) in India, with a gross loan portfolio of `7,688.0 crore (`7,676.9 crore in states other than Andhra Pradesh and Telangana).
Please refer Management Discussion and Analysis Report for more information on the Company’s Business Overview.
CHANGE OF COMPANY’S NAME
The Company was incorporated in 2003 with the prefix “SKS” as part of its Corporate name which is an abbreviation for Swayam Krishi Sangam (‘Swayam’ - ‘self’, ‘Krishi’ - hard work and ‘Sangam’ - society) and started its operations in a single state (the hitherto undivided Andhra Pradesh) with a single product (income-generation loan). Today, 12 years after incorporation, the Company is among the largest Microfinance Institution (“MFI”) in India with presence across 18 states covering over 1,00,000 villages catering to its 69.7 lakh woman members, leveraged its distribution network and the close-to-the-consumer business model.
With a pan-India presence, large member base and multiple-product delivery capability, the Company is equipped to play a major complimentary role in fulfilling the national priority of Financial Inclusion. In view of this and pursuant to your approval and approval of the Government of India- Ministry of Corporate Affairs, Registrar of Companies, Mumbai, Maharashtra, the name of the Company has been changed from “SKS Microfinance Limited” to “Bharat Financial Inclusion Limited” w.e.f. June 13, 2016. The new identity signifies the Company’s evolution over the years, how the Company interacts with its members in delivering financial services at an affordable cost, emphasis on client protection practices, responsible lending and reflects the Company’s pan-India presence.
DIVIDEND
In order to conserve resources and, given extant provisions of the CA 2013, the Directors have not recommended any dividend for the year under review.
DIRECTORS AND KEY MANAGERIAL PERSONNEL
Changes in the composition of the Board of Directors
During the year under review, Small Industries Development Bank of India (SIDBI) withdrew nomination of its nominee Mr. P. Krishnamurthy and nominated Mr. Kartik Gopal Alai as its nominee on the Board of the Company in October, 2015.
Mr. Sumir Chadha resigned as Non-Executive Director of the Company effective May 4, 2016.
The Board wish to place on record its appreciation for the valuable contribution of Mr. P. Krishnamurthy and Mr. Sumir Chadha in the sustained growth of the Company during their tenure as Directors of the Company.
The Board, based on the recommendation of the Nomination and Remuneration Committee, appointed Mr. Rajender Mohan Malla as an Additional and Independent Director of the Company with effect from March 11, 2016. A proposal to appoint Mr. Malla as an Independent Director of the Company for a period of five (5) years with effect from March 11, 2016, is being included in the Notice of the ensuing AGM to seek your approval.

41 42
BHARAT FINANCIAL INCLUSION LIMITED Annual Report 2016 BHARAT FINANCIAL INCLUSION LIMITED Annual Report 2016
Directors Retiring by Rotation
In terms of Section 152 of the CA 2013, Mr. Paresh D. Patel is due to retire by rotation at the ensuing AGM and, being eligible, offered himself for re-appointment.
Declaration of Independence
The Company has received declarations from all Independent Directors of the Company confirming that they meet the criteria of independence as prescribed under Section 149(6) of the CA 2013 and the Securities and Exchange Board of India (Listing Obligations and Disclosure Requirements) Regulations, 2015 (“SEBI LODR Regulations”). Key Managerial Personnel
Mr. M. R. Rao, Managing Director & CEO, Mr. S. Dilli Raj, President, Mr. K. V. Rao, Chief Operating Officer, Mr. Ashish Damani, Chief Financial Officer and Mr. Rajendra Patil, Company Secretary of the Company are the Key Managerial Personnel (“KMP”) of the Company.
There are no changes in the KMP during the year under review.
DIRECTORS’ RESPONSIBILITY STATEMENT
Pursuant to the requirement under Section 134(3) (c) of the CA 2013 with respect to Directors’ Responsibility Statement, it is hereby confirmed that:
1. In the preparation of the accounts for the year ended March 31, 2016, the applicable accounting standards have been followed and there are no material departures from the same;
2. The Directors had selected such accounting policies and applied them consistently, and made judgments and estimates that were reasonable and prudent so as to give a true and fair view of the state of affairs of the Company as at March 31, 2016 and of the profit of the Company for the year under review;
3. The Directors had taken proper and sufficient care for the maintenance of adequate accounting records in accordance with the provisions of the CA 2013 for safeguarding the assets of the Company and for preventing and detecting fraud and other irregularities;
4. The Directors had prepared annual accounts of the Company on a ‘going concern’ basis;
5. The Directors had laid down internal financial controls to be followed by the Company and that such internal financial controls are adequate and were operating effectively; and
6. The Directors had devised proper systems to ensure compliance with the provision of all applicable laws and that such systems were adequate and operating effectively.
POLICY FOR SELECTION AND APPOINTMENT OF DIRECTORS
In compliance with the provisions of the CA 2013 and SEBI LODR Regulations, the Board, on the recommendation of the Nomination and Remuneration Committee, approved the Policy for Selection and Appointment of Directors.
The aforesaid policy provides a framework to ensure that suitable and efficient succession plans are in place for appointment of Directors on the Board so as to maintain an appropriate balance of skills and experience within the Board. The Policy also provides for selection criteria for appointment of directors, viz., educational and professional background, general understanding of the Company’s business dynamics, global business and social perspective, personal achievements and Board diversity.
AUDITORS
(a) Statutory Auditors
At the Eleventh AGM held on September 29, 2014, the Members approved the appointment of M/s. S. R. Batliboi & Co. LLP, Chartered Accountants (ICAI Firm’s Registration No. 301003E) as Statutory Auditors for a period of three (3) years commencing from the Eleventh AGM till the conclusion of the Fourteenth AGM, subject to ratification by Members every year. As recommended by the Audit Committee, the appointment of M/s. S. R. Batliboi & Co. LLP, Chartered Accountants as Statutory Auditors of the Company until the conclusion of the Fourteenth AGM, proposal for ratification is being included in the Notice of the ensuing AGM for your approval. There is no qualification, reservation or adverse remark in the Auditors’ Report, save and except disclaimer made by them in discharge of their professional obligation.
DIRECTORS’ REPORT (Contd.)
(b) Secretarial Auditors
Pursuant to Section 204 of the CA 2013, the Company had appointed M/s. BS & Company, Company Secretaries LLP, as its Secretarial Auditors to conduct the secretarial audit of the Company for FY16. The Report of Secretarial Auditor for FY16 is annexed herewith as Annexure - I to Directors’ Report. There is no qualification, reservation or adverse remark in the Secretarial Auditors report, save and except disclaimer made by them in discharge of their professional obligation. PARTICULARS OF LOANS OR GUARANTEES OR INVESTMENTS
Pursuant to the clarification dated February 13, 2015 issued by the Ministry of Corporate Affairs and Section 186(11) of the CA 2013, the provision of Section 134 (3)(g) of the CA 2013 requiring disclosure of particulars of the loans given, investments made or guarantees given or securities provided is not applicable to the Company.
RELATED PARTY TRANSACTIONS
All transactions entered into with Related Parties as defined under the CA 2013 and SEBI LODR Regulations during the year under review were in the ordinary course of business and at an arm’s length pricing basis and do not attract the provisions of Section 188 of the CA 2013. The details of the transactions with related parties, if any, are placed before the Audit Committee from time to time.
Details of the related party transactions, which are exempted according to a proviso to Section 188 of the CA 2013, during FY16 are disclosed in Note 27 of the financial statements.
The policy on Related Party Transactions, as approved by the Board, is displayed on the website of the Company at http://www.sksindia.com/downloads/SKS-Related%20Party%20Transaction%20Policy-Version%201-October%2029%202014.pdf.
MATERIAL CHANGES AND COMMITMENTS, IF ANY, AFFECTING THE FINANCIAL POSITION OF THE COMPANY
There are no material changes and commitments affecting the financial position of the Company, which has occurred between the end of the financial year of the Company i.e. March 31, 2016 and the date of the Directors’ Report.
CONSERVATION OF ENERGY, TECHNOLOGY ABSORPTION, FOREIGN EXCHANGE EARNINGS AND OUTGO UNDER SECTION 134(3)(m) OF THE CA 2013The provisions of Section 134(3) (m) of the CA 2013 relating to conservation of energy and technology absorption do not apply to the Company. The Company has, however, used information technology extensively in its operations. During the year under review, the Company’s earning and outgo in foreign exchange earning was Nil and `0.25 crore respectively. In connection with the foreign exchange outgo, you are also advised to refer Note 32 of the Financial Statements.
RISK MANAGEMENT POLICY
The Board of the Company has adopted the Risk Management Policy based on the recommendation of the Risk Management Committee in order to assess, monitor and manage risk throughout the Company. Risk is an integral part of the Company’s business, and sound risk management is critical to the success of the organization.
Detailed information on risk management is provided in the Management Discussion and Analysis Report.
CORPORATE SOCIAL RESPONSIBILITY (CSR)
In compliance with Section 135 of the CA 2013 read with the Companies (Corporate Social Responsibility Policy) Rules 2014, the Company has established the Corporate Social Responsibility Committee (CSR Committee).
The Board adopted the CSR Policy, formulated and recommended by the CSR Committee, and the same is available on the Company’s website. During FY16, the Company has pursued four (4) CSR Projects in the states of Bihar, Chhattisgarh, Jharkhand, Karnataka, Kerala, Maharashtra, Odisha and Rajasthan. CSR activities carried out by the Company are detailed below: Jagruti Se Unnati is an awareness program through which the Company has tried to build awareness about various Central and State Government benefit schemes, amongst people in the state of Maharashtra.
DIRECTORS’ REPORT (Contd.)

43 44
BHARAT FINANCIAL INCLUSION LIMITED Annual Report 2016 BHARAT FINANCIAL INCLUSION LIMITED Annual Report 2016
DIRECTORS’ REPORT (Contd.)
Drishti is a program through which the Company sponsored HelpAge India and Operations Eyesight India to organize eye screening camps to identify cataract affected people and conduct free cataract surgeries in the states of Bihar, Chhattisgarh, Jharkhand, Karnataka, Kerala, Maharashtra, Odisha and Rajasthan. IHHL (Individual Household Latrine) is a scheme under Swachh Bharat Mission which has been widely promoted by the Company in the rural areas of Amravati district of Maharashtra, motivating people to construct toilets and avail the benefits of the scheme. Animal Wellness Camps is a treatment cum awareness program through which the Company in collaboration with JK Trust Gram Vikas Yojana and Animal Husbandry Department of Odisha State Government, conducted animal welfare camps in rural areas of Odisha with the objective to provide primary and emergency veterinary services to the animals.
The disclosure of contents of CSR policy pursuant to clause (o) of sub-section (3) of section 134 of CA 2013 and Rule 9 of the Companies (Corporate Social Responsibility) Rules, 2014 is annexed herewith as Annexure - II to the Directors’ Report.
DEPOSITS
During the year under review, the Company has not accepted any deposit from the public.
DETAILS OF SIGNIFICANT AND MATERIAL ORDERS PASSED BY THE REGULATORS OR COURTS OR TRIBUNALS IMPACTING THE GOING CONCERN STATUS AND COMPANY OPERATIONS IN FUTURE There are no significant material orders passed by the Regulators, Courts or Tribunals which would impact the going concern status of the Company and its future operations.
INFORMATION REQUIRED UNDER SEXUAL HARASSMENT OF WOMEN AT WORKPLACE (PREVENTION, PROHIBITION & REDRESSAL) ACT, 2013
The Company has a policy against sexual harassment and a formal process for dealing with complaints of harassment or discrimination. The Company seeks to ensure that all such complaints are resolved within defined timelines. During FY16, the Company has received 10 complaints, of these 9 complaints have been resolved and 1 complaint was pending as on March 31, 2016. The Company has conducted 20 workshops/ awareness programs on prevention of sexual harassment.
AUCTION OF PLEDGED GOLD
During FY16, the Company has conducted auction of pledged gold jewellery pertaining to 2,603 loan accounts with total outstanding amount of ` 4.4 crore (principal of ` 3.4 crore plus outstanding interest of `1.1 crore) and the value fetched was ` 4.3 crore. The Company does not have any sister concerns, who have participated in these auctions. Further, the Company has a policy on refund to Borrowers of any surplus that arises on auction of pledged gold after settling amount due to your Company.
INTERNAL FINANCIAL CONTROLS
The Company has adequate internal controls and processes in place with respect to its operations, which provide reasonable assurance regarding the reliability of the preparation of financial statements and financial reporting as also functioning of other operations. These controls and processes are driven through various policies and procedures.
Detailed information on Internal Financial Controls is provided in the Management Discussion and Analysis Report.
VIGIL MECHANISM
The Company has adopted the Whistle-blower Policy, and details of the same are explained in the Corporate Governance Report. The Policy is also available on the Company’s website.
PARTICULARS OF EMPLOYEES
The ratio of the remuneration of each director to the median employee’s remuneration and other details in terms of Section 197(12) of the CA 2013 read with Rule 5(1) of the Companies (Appointment and Remuneration of Managerial Personnel) Rules, 2014, have been annexed herewith as Annexure – III to the Directors’ Report.
The statement containing particulars of employees as required under Section 197 (12) of the CA 2013 read with Rules 5(2) and 5(3) of the Companies (Appointment and Remuneration of Managerial Personnel) Rules, 2014 is provided in a separate annexure forming part of the Directors’ Report. In terms of Section 136 of the CA 2013, the Directors’ Report and the Accounts are being sent to the Members excluding the aforesaid annexure and the same is open for inspection at the Registered Office of the Company. A copy of the statement may be obtained by the Members, by writing to the Company Secretary of the Company.
MANAGEMENT DISCUSSION AND ANALYSIS
The Management Discussion and Analysis Report for the year under review is presented separately in this Annual Report.
CORPORATE GOVERNANCE
The Company has adopted best corporate practices, and is committed to conducting its business in accordance with the applicable laws, rules and regulations. The Company follows the highest standards of business ethics. A report on Corporate Governance is provided separately in this Annual Report.
BUSINESS RESPONSIBILITY REPORT
The Business Responsibility Report for the year under review is annexed as Annexure - IV to the Directors’ Report.
EMPLOYEE STOCK OPTION PLAN (“ESOP”) AND EMPLOYEE SHARE PURCHASE SCHEME (“ESPS”)
Presently, employee stock options have been granted or shares have been issued under the following schemes:
A. SKS Microfinance Employee Share Purchase Scheme 2007;
B. SKS Microfinance Employee Stock Option Plan 2008 (Independent Directors) ;
C. SKS Microfinance Employee Stock Option Plan 2008;
D. SKS Microfinance Employee Stock Option Plan 2009;
E. SKS Microfinance Employee Stock Option Plan 2010; and
F. SKS Microfinance Employee Stock Option Plan 2011.
The disclosures with respect to each of the above-mentioned ESPS and ESOP, as required by the Securities and Exchange Board of India (Share Based Employee Benefits) Regulations, 2014, is displayed at http://www.sksindia.com. EXTRACT OF ANNUAL RETURN
Pursuant to Section 134 (3a) and Section 92 (3) of the CA 2013, read with Rule 12 of the Companies (Management and Administration) Rules, 2014, an extract of the Annual Return as at March 31, 2016 in Form MGT 9 is annexed as Annexure - V to the Directors’ Report.
ACKNOWLEDGEMENTS
Your Directors take this opportunity to express their deep and sincere gratitude to the Sangam Members for their confidence and patronage, as well as to the Reserve Bank of India, the Government of India and Regulatory Authorities for their cooperation, support and guidance. Your Directors would like to express a profound sense of appreciation for the commitment shown by the employees in supporting the Company in its endeavor of becoming one of the leading microfinance institutions of the country. Your Directors would also like to express their gratitude to the members, bankers and other stakeholders for their trust and support.
For and on behalf of the Board of Directors
sd/- sd/- P. H. Ravikumar M. R. Rao Date: June 14, 2016 Non-Executive Chairman Managing Director & CEO DIN No.: 00280010 DIN No.: 03276291
DIRECTORS’ REPORT (Contd.)
45 46
BHARAT FINANCIAL INCLUSION LIMITED Annual Report 2016 BHARAT FINANCIAL INCLUSION LIMITED Annual Report 2016
Form No. MR-3[Pursuant to section 204(1) of the Companies Act, 2013 and rule No.9 of the Companies
(Appointment and Remuneration of Managerial Personnel) Rules, 2014]
SECRETARIAL AUDIT REPORT
FOR THE FINANCIAL YEAR ENDED MARCH 31, 2016
To, The Members,SKS Microfinance Limited
We were appointed by the Board of Directors of SKS Microfinance Limited (“the Company”) to conduct the Secretarial Audit for the financial year ended March 31, 2016.
We have conducted the Secretarial audit in respect of compliance with applicable statutory provisions and the adherence to good corporate practices by the Company. Secretarial Audit was conducted in a manner that provided us a reasonable basis for evaluating the corporate conducts/statutory compliances and expressing our opinion thereon.
Based on our verification of the Company’s books, papers, minute books, forms and returns filed and other documents/records maintained by the Company and also the information provided by the Company, its officers, agents and authorized representatives during the conduct of Secretarial audit, we hereby report that in our opinion, the Company has, during the audit period covering the financial year ended on March 31, 2016 complied with the statutory provisions listed hereunder and also that the Company has proper Board-processes and compliance mechanism in place to the extent, in the manner and subject to the reporting made hereinafter:
We have examined the books, papers, minute books, forms and returns filed and other records maintained by the Company for the financial year ended March 31, 2016, according to the provisions of:
(i) The Companies Act, 2013 (“the Act”) and the rules made there under;
(ii) The Securities Contracts (Regulation) Act, 1956 and the rules made there under;
(iii) The Depositories Act, 1996 and the Regulations and Bye-laws framed thereunder;
(iv) The Foreign Exchange Management Act, 1999 and the rules and regulations made thereunder to the extent of Foreign Direct Investment;
(v) The following Regulations and Guidelines prescribed under the Securities and Exchange Board of India Act, 1992:-
(a) The Securities and Exchange Board of India (Substantial Acquisition of Shares and Takeovers) Regulations, 2011;
(b) The Securities and Exchange Board of India (Prohibition of Insider Trading) Regulations, 1992 applicable upto May 14, 2015 and the Securities and Exchange Board of India (Prohibition of Insider Trading) Regulations, 2015 w.e.f. May 15, 2015;
(c) The Securities and Exchange Board of India (Issue of Capital and Disclosure Requirements) Regulations, 2009;
(d) The Securities and Exchange Board of India (Employee Stock Option Scheme and Employee Stock Purchase Scheme) Guidelines, 1999/the Securities and Exchange Board of India (Share Based Employee Benefits) Regulations, 2014;
(e) The Securities and Exchange Board of India (Issue and Listing of Debt Securities) Regulations, 2008;
(f ) The Securities and Exchange Board of India (Registrars to an Issue and Share Transfer Agents) Regulations, 1993 regarding the Act and dealing with client;
The Company has identified Master Circular and guidelines issued by the Reserve Bank of India as applicable to NBFCs–ND- SI (Microfinance Institutions) dated July 1st, 2015 as specifically applicable to the Company.
The Company has identified the following laws, Regulations, Guidelines, Rules, etc., as applicable to the Company:
1. The Employees’ Provident Fund and Miscellaneous Provisions Act, 1952 & Employees’ Provident Fund Schemes, 1952
2. The Employees’ State Insurance Act, 1948 and Rules made thereunder
3. The Minimum Wages Act, 1948 and Rules made thereunder
4. The Payment of Wages Act, 1936 and Rules made thereunder
5. The Payment of Bonus Act, 1965 and Rules made thereunder
6. The Payment of Gratuity Act and Rules made thereunder
7. The Maternity Benefit Act, 1961
8. The Equal Remuneration Act, 1976
9. The Employment Exchange (Compulsory Notification of Vacancies) Act, 1959
10. The Sexual Harassment of Women at Workplace (Prevention, Prohibition and Redressal) Act, 2013
11. Shops and Establishments Acts under various state legislations where the Company has offices.
12. The Contract Labour (Regulation and Abolition) Act, 1970 and rules made thereunder
We have also examined compliance with the applicable clauses of the following:
(i) Secretarial Standards issued by The Institute of Company Secretaries of India (ICSI) applicable with effect from July 01, 2015.
(ii) The Listing Agreements entered into by the Company with National Stock Exchange of India Ltd & BSE Ltd applicable upto November 30, 2015.
(iii) The Securities and Exchange Board of India (Listing Obligations and Disclosure Requirements) Regulations, 2015 applicable w.e.f. December 1, 2015.
During the period under review, the Company has complied with the provisions of the Act, Rules, Regulations, Guidelines, Standards, etc. mentioned above.
We further report that: a. the Board of Directors of the Company is duly constituted with proper balance of Executive Director, Non-Executive Directors and
Independent Directors. The changes in the composition of the Board of Directors that took place during the period under review were carried out in compliance with the provisions of the Act.
b. adequate notice was given to all directors to schedule the Board meetings, agenda and detailed notes on agenda were sent at least seven days in advance, and a system exists for seeking and obtaining further information and clarifications on the agenda items before the meeting and for meaningful participation at the meeting.
c. during the period under review, resolutions were carried through majority. The minutes of the meetings held during the audit period did not reveal any dissenting member’s view. As confirmed by the Management, there were no dissenting views expressed by any of the members on any business transacted at the meetings held during the period under review.
d. based on the information, documents provided and the representations made by the Company, its officers during our audit process and also on review of the compliance reports of the Company Secretary taken on record by the Board of Directors of the Company periodically, in our opinion, there are adequate systems and processes exists in the Company to commensurate with the size and operations of the Company, to monitor and ensure compliance with applicable laws, rules, regulations and guidelines.
ANNEXURE - I TO DIRECTORS’ REPORT ANNEXURE - I TO DIRECTORS’ REPORT

47 48
BHARAT FINANCIAL INCLUSION LIMITED Annual Report 2016 BHARAT FINANCIAL INCLUSION LIMITED Annual Report 2016
e. the compliance by the Company of the applicable financial laws like direct and indirect tax laws and maintenance of financial records and books of accounts has not been reviewed by us since the same have been subject to review by statutory auditors and other professionals.
f. during the audit period the Company has issued and allotted 2,000 11.95% Secured, Non-Cumulative, Redeemable, Taxable, Listed, Rated Non-Convertible Debentures (NCDs) of face value of `10,00,000/- (Rupees Ten Lakh only) each aggregating to `200 crore (Rupees Two Hundred Crore only) on private placement basis and listed on wholesale debt market (WDM) segment of BSE Limited.
For B S & Company, Company Secretaries LLP Sd/- K. V. S. SubramanyamDate: April 26, 2016 FCS No.: 5400Place: Hyderabad C P No.: 4815
Note: This report is to be read with our letter of even date which is annexed as ‘Annexure’ and forms an integral part of this report.
To, The Members,SKS Microfinance Limited
Our report of even date is to be read along with this letter.
1. Maintenance of Secretarial records is the responsibility of the Management of the Company. Our responsibility is to express as opinion on these secretarial records based on our audit.
2. We have followed the audit practices and process as were appropriate to obtain reasonable assurance about the correctness of the contents of the Secretarial records. The verification was done on test basis to ensure that correct facts are reflected in secretarial records. We believe that the processes and practices, we followed provide a reasonable basis for our opinion.
3. We have not verified the correctness and appropriateness of financial records and Books of Accounts of the Company.
4. Wherever required, we have obtained the Management representation about the compliance of applicable laws, rules and regulations etc.
5. The compliance of the provisions of Companies Act, 2013 and other applicable laws, Rules, Regulations, secretarial standards issued by ICSI is the responsibility of the Management. Our examination was limited to the verification of procedures on test basis.
6. The Secretarial Audit report is neither an assurance as to the future viability of the Company, nor of the efficacy or effectiveness with which the Management has conducted the affairs of the Company.
7. We further report that, based on the information provided by the Company, its officers, authorized representatives during the conduct of the audit and also on the review of quarterly compliance report by the respective departmental heads/Company Secretary/Managing Director taken on record by the Board of the Company, in our opinion adequate systems and process and control mechanism exist in the Company to monitor compliance with applicable general laws like labour laws & Environment laws and Data protection policy.
8. We further report that the compliance by the Company of applicable fiscal laws like Direct & Indirect tax laws have not been reviewed in this audit since the same has been subject to review by the statutory financial audit and other designated professionals.
For B S & Company, Company Secretaries LLP Sd/- K. V. S. SubramanyamDate: April 26, 2016 FCS No.: 5400Place: Hyderabad C P No.: 4815
ANNEXURE - I TO DIRECTORS’ REPORT ANNEXURE - I TO DIRECTORS’ REPORT

49 50
BHARAT FINANCIAL INCLUSION LIMITED Annual Report 2016 BHARAT FINANCIAL INCLUSION LIMITED Annual Report 2016
ANNEXURE - II TO DIRECTORS’ REPORT
Report on Corporate Social Responsibility (CSR) activities in FY16
CORPORATE SOCIAL RESPONSIBILITY
In compliance with Section 135 of the CA 2013 read with the Companies (Corporate Social Responsibility Policy) Rules 2014, the Company has established the Corporate Social Responsibility Committee (“CSR Committee”).
The Board adopted the CSR Policy, formulated and recommended by the CSR Committee, and the same is available on the Company’s website.
During FY16, the Company has pursued four (4) CSR Projects in the states of Bihar, Chhattisgarh, Jharkhand, Karnataka, Kerala, Maharashtra, Odisha and Rajasthan. CSR activities carried out by the Company are detailed below:
Jagruti Se Unnati is an awareness program through which the Company has tried to build awareness about various Central and State Government benefit schemes, amongst people in the state of Maharashtra.
Drishti is a program through which Company sponsored HelpAge India and Operations Eye Sight India to organize eye screening camps to identify cataract affected people and conduct free cataract surgeries in the states of Bihar, Chhattisgarh, Jharkhand, Karnataka, Kerala, Maharashtra, Odisha and Rajasthan.
IHHL (Individual Household Latrine) is a scheme under Swachh Bharat Mission which has been widely promoted by the Company in the rural areas of Amravati district of Maharashtra, motivating people to construct toilets and avail the benefits of the scheme.
Animal Wellness Camps is a treatment cum awareness program through which the Company in collaboration with JK Trust Gram Vikas Yojana and Animal Husbandry Department of Odisha State Government, conducted animal welfare camps in rural areas of Odisha with the objective to provide primary and emergency veterinary services to the animals.
The disclosure of the contents of the CSR policy pursuant to Section 134(3)(o) of CA 2013 and Rule 9 of the Companies (Corporate Social Responsibility) Rules, 2014, are as follows:
S. No.
Particulars Remarks
1 A brief outline of the Company’s CSR policy, including overview of projects or programmes proposed to be undertaken and a reference to the web link to the CSR policy and projects or programmes.
Please refer to the overview of programmes undertaken by the Company, as mentioned above.The CSR policy is available on the web link : https://www.sksindia.com/downloads/SKS-CSR%20Policy%20-%20Version%201%20-%20dated%20October%20292014.pdf
2 The Composition of the CSR Committee. Mr. Geoffrey Tanner Woolley (Chairman);Mr. M. R. Rao;Dr. Punita Kumar-Sinha; andDr. Tarun Khanna.
3 Average net profit of the Company for last three financial years. Loss of `367 crore
4 Prescribed CSR Expenditure (two per cent of the amount as in item 3 above)
Not Applicable
5 Details of CSR spent during the financial year:
a) Total amount to be spent for the financial year; Considering the fact that the Company incurred loss in FY13, the Company was not required to spend any amount towards CSR. However, the Board approved a budget of ` 2.5 crore for CSR Projects and a sum of ` 1.93 crore was spent towards the same. A sum of ` 0.57 crore has not been spent for the reason stated at Sr. No 6.
b) Amount unspent, if any
c) Manner in which the amount spent during the financial year is detailed below
6 In case the Company has failed to spend the two per cent of the average net profit of the last three financial years or any part thereof, the company shall provide the reasons for not spending the amount in its Board report
- The Jharkhand Intervention, though proposed to be launched in January, 2016 was deferred and started in April, 2016;- Due to unfavorable weather conditions, project Drishti was delayed as cataract operations could not be performed;
ANNEXURE - II TO DIRECTORS’ REPORT
Table A
(1) (2) (3) (4) (5) (6) (7) (8)
S. No.
CSR Project or Activity Identified
Sector in which the Project is covered
Projects or programmes
(1) Local area or others
(2) Specify the State and Dis-trict where projects or programmes were under-taken.
Amount Outlay
(Budget) Project or Programme wise (` in Crore)
Amount spent on the Projects or Programme Sub Heads:
(1) Direct Expenditure on Projects or Programmes (` in Crore)
Amount spent on the Projects or Programme Sub Heads: (2) Overheads (` in Crore)
Cumulative Expenditure up to the reporting period i.e. FY 2015- 2016 (` in Crore)
Amount Spent Direct or through Implement-ing Agency
1 Education-Jagruti se Unnnati
Clause (ii) livelihoodenhancementClause (iii) measuresfor reducing inequalitiesfaced by socially &economically backward groups
Maharashtra - Amravati, Kolhapur, Nagpur, Nanded, Pune, Sangli and Yavatmal.
0.5 0.197 0.06 0.257 Spent directly and through SOSVA Training and Promotion Institute
2 Swachh Bharat Mission - IHHL (Individual Household Latrine) scheme
Clause (i)Sanitation
Maharashtra – Amravati
0.0329 0.028 0.0609 Spent directly
3 Health Care -Drishti
Clause (i)Promoting preventive health care
Bihar - Arwal, Gaya, Nalanda, Patna, Vaishali, Jehanabad, Samastipur, Lakhisari and Bhojpur.
1.5 1.08 0.014 1.09 HelpAge India and Operation Eyesight India
Chhattisgarh - Raipur, Rajnandgaon, Durg, Balod and Bemtara;
Jharkhand - Hazaribagh, Koderma, Giridih and Chatra;

51 52
BHARAT FINANCIAL INCLUSION LIMITED Annual Report 2016 BHARAT FINANCIAL INCLUSION LIMITED Annual Report 2016
Karnataka - Bidar, Shimoga, Bellary, Haveri and Raichur;
Kerala - Ernakulum, Aleppy, Thrissur and Palakkad;
Maharashtra - Nashik, Aurangabad, Jalgaon and Latur;
Odisha - Bhadrak, Baleswar, Keonjhar, Cuttack and Khurda;
Rajasthan – Jaipur
4 Animal Wellness Camp
Clause (iv)Animal Welfare
Odisha - Cuttack, Ganjam and Bargarh district
0.5 0.22 0.078 0.29 Spent directly and through JK Trust Gram Vikas Yojana
Total 2.5 1.53 0.18 1.71*
*Excluding staff cost
RESPONSIBILITY STATEMENT
The Responsibility Statement of the Corporate Social Responsibility Committee of the Board of Directors of the Company, has been reproduced below:
The implementation and monitoring of the Corporate Social Responsibility (CSR) Policy is in compliance with the CSR objectives and policy of the Company.
Sd/- Sd/- M. R. Rao Geoffrey Tanner Woolley Managing Director & CEO Chairman, Corporate Social Responsibility CommitteeJune 14, 2016 DIN No.: 03276291 DIN No.: 00306749
ANNEXURE - II TO DIRECTORS’ REPORT
The ratio of the remuneration of each Director to the median employee’s remuneration and such other details in terms of Section 197(12) of the CA 2013 read with Rule 5 of the Companies (Appointment and Remuneration of Managerial Personnel) Rules, 2014.
S. No. Requirements Disclosure
i. The ratio of the remuneration of each director to the median remuneration of the employees of the Company for the financial year
Mr. P. H. RavikumarMr. S. BalachandranMr. Geoffrey Tanner WoolleyMr. Kartik Gopal AlaiMr. M. R. RaoMr. P. KrishnamurthyDr. Punita Kumar - SinhaMr. Rajender Mohan MallaDr. Tarun Khanna
38.2 : 133.1 : 132.5 : 1
1.5 : 1277.4 : 1
5.3 : 16.4 : 1
-26.2 : 1
ii The percentage increase in remuneration of each director, Chief Financial Officer, Chief Executive Officer, Company Secretary or Manager, if any, in the financial year
Mr. M. R. Rao, MD & CEOMr. S. Dilli Raj, PresidentMr. K. V. Rao, Chief Operating OfficerMr. Ashish Damani, Chief Financial OfficerMr. Rajendra Patil, Company Secretary
22.0%22.0%16.0%16.0%11.0%
iii. The percentage increase in the median remuneration of employees in the financial year
The percentage increase in the median remuneration of employees in the financial year is around 9.0%.
iv. The number of permanent employees on the rolls of the Company 11,991
v. The explanation on the relationship between average increase in remuneration and company performance
y Performance of the Company
y Variable compensation is an integral part of the total pay package and is based on an individual’s performance rating and business unit performance.
vi. Comparison of the remuneration of the Key Managerial Personnel against the performance of the Company
For FY16, the Key Managerial Personnel were paid around 2.5% of the Profit After Tax.
vii. Variations in the market capitalization of the Company, price earnings ratio as at the closing date of the current financial year and previous financial year and percentage increase or decrease in the market quotations of the shares of the Company in comparison to the rate at which the Company came out with the last public offer in case of listed companies
The market capitalization of the Company as at March 31, 2016 was `6,949.3 crore as compared to `5,783.6 crore as at March 31, 2015. The earning per share of the Company was `23.9 as at March 31, 2016 which was `15.2 as at March 31, 2015. The stock price of the Company as at March 31, 2016 has increased by 19.2% to `545.85 from `457.95 as at March 31, 2015.
viii. Average percentile increase already made in the salaries of employees other than the managerial personnel in the last financial year and its comparison with the percentile increase in the managerial remuneration and justification thereof and point out if there are any exceptional circumstances for increase in the managerial remuneration
The average percentage increase made in the salaries of total employees other than the Key Managerial Personnel is around 11.0%, while the average increase in the remuneration of the Key Managerial Personnel is in the range of 11.0% to 22.0%.
ix. Comparison of remuneration of each of the Key Managerial Personnel against the performance of the Company
The ratio of the remuneration of each KMP to the PAT of the Company is:Mr. M. R. Rao, MD & CEO 0.9%Mr. S. Dilli Raj, President 0.8%Mr. K. V. Rao, Chief Operating Officer 0.3%Mr. Ashish Damani, Chief Financial Officer 0.2%Mr. Rajendra Patil, Company Secretary 0.2%
x. The key parameters for any variable component of remuneration availed by the Directors
The variable components of remuneration payable to executive director is determined by the Nomination and Remuneration Committee (NRC) / Board based on overall performance of the Company. The non-executive independent directors collectively contribute to the growth and efficient performance of the Company and accordingly annual commission is paid to them in addition to sitting fee, as determined by NRC / Board.
xi. The ratio of the remuneration of the highest paid Director to that of the employees who are not directors but receive remuneration in excess of the highest paid Director during the year
Not Applicable
xii. Affirmation that the remuneration is as per the remuneration policy of the Company
Yes
ANNEXURE - III TO DIRECTORS’ REPORT
(1) (2) (3) (4) (5) (6) (7) (8)
Ratio of the remuneration of each Director to the median employee’s remuneration

53 54
BHARAT FINANCIAL INCLUSION LIMITED Annual Report 2016 BHARAT FINANCIAL INCLUSION LIMITED Annual Report 2016
ANNEXURE - IV TO DIRECTORS’ REPORT
Business Responsibility Report
ANNEXURE - IV TO DIRECTORS’ REPORT
Section A: General Information about the Company
1 Corporate Identity Number (CIN) of the Company L65999MH2003PLC250504
2 Name of the Company Bharat Financial Inclusion Limited ( Formerly known as ‘SKS Microfinance Limited’)
3- Registered address Unit No. 410, Madhava, Bandra-Kurla Complex, Bandra East, Mumbai – 400 051, Maharashtra, India
4 Website www.sksindia.com
5 E-mail id [email protected]
6 Financial Year reported 2015-16
7 Sector(s) that the Company is engaged in (industrial activity code-wise) Financial Services (Microfinance)
8 List three key products/services that the Company manufactures/provides (as in balance sheet)
Microfinance Services i.e. providing loans for income generation activities to economically weaker section.
9 Total number of locations where business activity is undertaken by the Company
i. Number of International Locations (Provide details of major 5) Nil
ii. Number of National Locations Branches : 1324 Registered Office: 1 Head Office: 1Regional Offices: 22
10 Markets served by the Company – Local/ State/ National/ International National
Section B: Financial Details of the Company
1 Paid-up Capital (`) 127.31 crore
2 Total Turnover (`) 1,320.7 crore
3 Total profit after taxes (I`) 303 crore
4 Total Spending on Corporate Social Responsibility (CSR) as percentage of profit after tax (%)
Considering the fact that the Company incurred losses in FY13, the Company was not required to spend any amount towards CSR. However, the Company spent ` 1.93 crore which constitute 0.56% of PAT for FY16.
5 List of activities in which expenditure in 4 above has been incurred:- Refer Report on CSR activities forming part of Directors’ Report
Section C: Other Details
1 Does the Company have any Subsidiary Company/ Companies? The Company does not have any subsidiary
2 Do the Subsidiary Company/Companies participate in the BR Initiatives of the parent company? If yes, then indicate the number of such subsidiary company
- Not Applicable -
3 Do any other entity/entities (e.g. suppliers, distributors etc.) that the Company does business with, participate in the BR initiatives of the Company? If yes, then indicate the percentage of such entity/entities? [Less than 30%, 30-60%, More than 60%]
No
Section D: BR Information
1 Details of Director/Directors responsible for BR
a) Details of the Director/Director responsible for implementation of the BR policy/policies
1. DIN Number 03276291
2. Name Mr. M. Ramachandra Rao
3. Designation Managing Director & CEO
b) Details of the BR head
1. DIN Number 03276291
2. Name Mr. M. Ramachandra Rao
3. Designation Managing Director & CEO
4. Telephone number 040-44526000
5. e-mail id [email protected]
2. Principle-wise (as per NVGs) BR Policy/policies (Reply in Y/N) The National Voluntary Guidelines on Social, Environmental and Economic Responsibilities of Business (NVGs) released by the Ministry of Corporate Affairs has adopted nine areas of Business Responsibility. These briefly are as under:
P1 Businesses should conduct and govern themselves with Ethics, Transparency and Accountability.
P2 Businesses should provide goods and services that are safe and contribute to sustainability throughout their life cycle.
P3 Businesses should promote the wellbeing of all employees.
P4 Businesses should respect the interests of, and be responsive towards all stakeholders, especially those who are disadvantaged, vulnerable and marginalised.
P5 Businesses should respect and promote human rights.
P6 Business should respect, protect, and make efforts to restore the environment.
P7 Businesses, when engaged in influencing public and regulatory policy, should do so in a responsible manner.
P8 Businesses should support inclusive growth and equitable development.
P9 Businesses should engage with and provide value to their customers and consumers in a responsible manner.

55 56
BHARAT FINANCIAL INCLUSION LIMITED Annual Report 2016 BHARAT FINANCIAL INCLUSION LIMITED Annual Report 2016
ANNEXURE - IV TO DIRECTORS’ REPORT ANNEXURE - IV TO DIRECTORS’ REPORT
Busi
ness
Eth
ics
Prod
uct R
espo
nsib
ility
Wel
lbei
ng o
f em
ploy
ees
Stak
ehol
ders
eng
agem
ent
Hum
an ri
ghts
Envi
ronm
ent
Publ
ic P
olic
y
CSR
Cust
omer
Rel
atio
ns
S.No Questions P P P P P P P P P
1 2 3 4 5 6 7 8 9
1 Do you have a policy/policies for .... Y Y Y Y Y Y Y Y Y
2 Has the policy being formulated in consultation with the relevant stakeholders? Y Y Y Y Y Y Y Y Y
3 Does the policy conform to any national/ international standards? If yes, specify? (50 words)
N N N N N N N N N
The spirit and intent of the Company’s Code of Conduct, Fair Practices Code and other Codes/Policies are prepared in compliance with applicable laws/rules/guidelines. In addition, they reflect the vision and mission of the Company of providing financial services to the economically weaker sections that create a commercial microfinance model that delivers high value to our customers.
4 Has the policy being approved by the Board? If yes, has it been signed by MD/ owner/ CEO/ appropriate Board Director?
Y Y Y Y Y Y Y Y Y
5 Does the company have a specified committee of the Board/ Director/ Official to oversee the implementation of the policy?
Y Y Y Y Y Y Y Y Y
6 Indicate the link for the policy to be viewed online? www.sksindia.com
7 Has the policy been formally communicated to all relevant internal and external stakeholders?
Y Y Y Y Y Y Y Y Y
8 Does the company have in-house structure to implement the policy/ policies Y Y Y Y Y Y Y Y Y
9 Does the Company have a grievance redressal mechanism related to the policy/ policies to address stakeholders’ grievances related to the policy/policies?
Y Y Y Y Y Y Y Y Y
10 Has the company carried out independent audit/evaluation of the working of this policy by an internal or external agency?
Y Y Y Y Y Y Y Y Y
3. Governance related to BR
y Indicate the frequency with which the Board of Directors, Committee of the Board or CEO to assess the BR performance of the Company. Within 3 months, 3-6 months, Annually, More than 1 year
Quarterly
y Does the Company publish a BR or a Sustainability Report? What is the hyperlink for viewing this report? How frequently it is published?
Yes. There is no separate a BR or a sustainability Report. However, the Business Plan constitutes the Company’s Sustainability Report which is reflected in the Quarterly / Annual Report of the Company and available at https://www.sksindia.com/reporting.php
Section E: Principle-wise performance
Principle 1 - Businesses should conduct and govern themselves with Ethics, Transparency and Accountability
1. Does the policy relating to ethics, bribery and corruption cover only the company? Yes/ No. Does it extend to the Group/ Joint Ventures/ Suppliers/ Contractors/ NGOs / Others?
Yes
2. How many stakeholder complaints have been received in the past financial year and what percentage was satisfactorily resolved by the management? If so, provide details thereof, in about 50 words or so.
1. Please refer note 40 (t) of financial statement for customer complaints redressal status.
2. Please refer Corporate Governance Report for investor complaints redressal status.
Principle 2 - Businesses should provide goods and services that are safe and contribute to sustainability throughout their lifecycle
1. List up to 3 of your products or services whose design has incorporated social or environmental concerns, risks and/or opportunities.
Microfinance Services i.e. providing loans for Income Generation activities to economically weaker section.
2. For each such product, provide the following details in respect of resource use (energy, water, raw material etc.) per unit of product(optional):i. Reduction during sourcing/ production/ distribution achieved since the previous
year throughout the value chain?
ii. Reduction during usage by consumers (energy, water) has been achieved since the previous year?
Not applicable
3. Does the Company have procedures in place for sustainable sourcing (including transportation)?i If yes, what percentage of your inputs was sourced sustainably? Also, provide
details thereof, in about 50 words or so
Yes. The Company has policy on raising borrowings from different sources to optimise mix at the lowest cost of funds.
4. Has the Company taken any steps to procure goods and services from local & small producers, including communities surrounding their place of work?If yes, what steps have been taken to improve their capacity and capability of local and small vendors?
Yes, wherever possible.
5. Does the company have a mechanism to recycle products and waste? If yes what is the percentage of recycling of products and waste (separately as <5%, 5-10%, >10%).Also, provide details thereof, in about 50 words or so.
Yes, wherever possible
Principle 3 - Businesses should promote the well-being of all employees
1. Please indicate the Total number of employees. 11991 employees
2. Please indicate the Total number of employees hired on temporary/ contractual/ casual basis Nil
3. Please indicate the Number of permanent women employees. 323
4. Please indicate the Number of permanent employees with disabilities Nil
5. Do you have an employee association that is recognized by management? No
6. What percentage of your permanent employees is members of this recognized employee association? Not applicable
7. Please indicate the Number of complaints relating to child labour, forced labour, involuntary labour, sexual harassment in the last financial year and pending, as on the end of the financial year
57 58
BHARAT FINANCIAL INCLUSION LIMITED Annual Report 2016 BHARAT FINANCIAL INCLUSION LIMITED Annual Report 2016
S. No.
Category No of complaintsfiled during the
financial year
No of complaintspending as on end of
the financial year1 Child Labour/ forced labour/ involuntary labour 0 0
2 Sexual harassment 10 1
3 Discriminatory employment 0 0
8. What percentage of your under-mentioned employees were given safety & skill up gradation training in the last year?
y Permanent Employees y Permanent Women Employees y Casual/Temporary/Contractual Employees y Employees with Disabilities
Certain selected employees of the Company at Registered Office, Head Office, Regional Offices and Branches have been given fire & other safety training and first-aid training.
Principle 4 - Businesses should respect the interests of, and be responsive towards all stakeholders, especially those who are disadvantaged, vulnerable and marginalised.
1. Has the company mapped its internal and external stakeholders? Yes/ No
Yes
2. Out of the above, has the company identified the disadvantaged, vulnerable & marginalized stakeholders
Yes
3. Are there any special initiatives taken by the company to engage with the disadvantaged, vulnerable and marginalized stakeholders. If so, provide details thereof, in about 50 words or so.
The Company’s is engaged in providing financial products at the lowest cost to rural women belonging to weaker section of society to enable them to start economic activity and generate income for their family.
Principle 5 - Businesses should respect and promote human rights
1. Does the policy of the company on human rights cover only the company or extend to the Group/Joint Ventures/ Suppliers/ Contractors/ NGOs/ Others?
The Company’s policy on Codes of Conduct apply to staff, borrowers and vendors.
2. How many stakeholder complaints have been received in the past financial year and what percent was satisfactorily resolved by the management?
1. Please refer note 40 (t) of financial statements for customer complaints redressal status.
2. Please refer Corporate Governance Report for investor complaints redressal status.
Principle 6 - Business should respect, protect, and make efforts to restore the environment1. Does the policy related to Principle 6 cover only the company or extends to the Group/ Joint Ventures/ Suppliers/
Contractors/ NGOs/ others.Not applicable
2. Does the company have strategies/ initiatives to address global environmental issues such as climate change, global warming, etc? Y/N. If yes, please give hyperlink for webpage etc
Not applicable
3. Does the company identify and assess potential environmental risks? Y/N Not applicable
4. Does the company have any project related to Clean Development Mechanism? If so, provide details thereof, in about 50 words or so. Also, if Yes, whether any environmental compliance report is filed?
Not applicable
5. Has the company undertaken any other initiatives on – clean technology, energy efficiency, renewable energy, etc. Y/N. If yes, please give hyperlink for web page etc.
Not applicable
6. Are the Emissions/ Waste generated by the company within the permissible limits given by CPCB/ SPCB for the financial year being reported?
Not applicable
7. Number of show cause/ legal notices received from CPCB/ SPCB which are pending (i.e. not resolved to satisfaction) as on end of Financial Year.
Not applicable
Principle 7 - Businesses, when engaged in influencing public and regulatory policy, should do so in a responsible manner
1. Is your company a member of any trade and chamber or association? If Yes, Name only those major ones that your business deals with:
The Company is member of the following associations:
1. Microfinance Institutions Network (MFIN)
2. Sa-Dhan
2. Have you advocated/ lobbied through above associations for the advancement or improvement of public good? Yes/No; if yes specify the broad areas (drop box: Governance and Administration, Economic Reforms, Inclusive Development Policies, Energy security, Water, Food Security, Sustainable Business Principles, Others)
MFIN and Sa-Dhan do MFI industry advocacy and are part of policy making related to MFI industry.
Principle 8 - Businesses should support inclusive growth and equitable development
1. Does the company have specified programmes/ initiatives/ projects in pursuit of the policy related to Principle 8? If yes details thereof.
The Company focusses on responsible business practices with community-centric interventions. The thrust areas are sustainable livelihood – especially skill development and employability training, education and health care, all of which constitute the Human Development Index – a quality of life indicator.
2. Are the programmes/ projects undertaken through in-house team/ own foundation/ external NGO/ government structures/ any other organization?
The Company collaborates with Government bodies, NGOs and donor agencies to implement community initiatives in the thematic areas of livelihoods, health, education, environment and ethnicity. Through employee volunteerism it also utilises in-house resource persons in areas like skill development, etc. The entire gamut of CSR activities are implemented through the following delivery arms:
3. Have you done any impact assessment of your initiative?
Yes
4. What is your company’s direct contribution to community development projects- Amount in INR and the details of the projects undertaken.
Please refer to Report on CSR Activities for details..
5. Have you taken steps to ensure that this community development initiative is successfully adopted by the community? Please explain in 50 words, or so
Please refer to Report on CSR Activities for details.
Principle 9 - Businesses should engage with and provide value to their customers and consumers in a responsible manner
1. What percentage of customer complaints/ consumer cases are pending as on the end of financial year.
1. Please refer note 40 (t) of financial statements for customer complaints redressal status.
2. Please refer Corporate Governance Report for investor complaints redressal status.
3. Does the company display product information on the product label, over and above what is mandated as per local laws? Yes/No/N.A. /Remarks (additional information)
Yes. As per Fair Practices code, the Company is required to display interest being charged and other practices being adopted by the Company in lending loans to its Borrowers.
4. Is there any case filed by any stakeholder against the company regarding unfair trade practices, irresponsible advertising and/or anti-competitive behaviour during the last five years and pending as on end of financial year. If so, provide details thereof, in about 50 words or so
There are no cases filed by any stakeholder in the last five years and such case is pending as on March 31, 2016.
5. Did your company carry out any consumer survey/ consumer satisfaction trends?
Yes. This is done periodically.
ANNEXURE - IV TO DIRECTORS’ REPORT ANNEXURE - IV TO DIRECTORS’ REPORT

59 60
BHARAT FINANCIAL INCLUSION LIMITED Annual Report 2016 BHARAT FINANCIAL INCLUSION LIMITED Annual Report 2016
ANNEXURE - V TO DIRECTORS’ REPORT ANNEXURE - V TO DIRECTORS’ REPORT
Form No. MGT-9EXTRACT OF ANNUAL RETURN
as on the financial year ended on March 31, 2016[Pursuant to section 92(3) of the Companies Act, 2013 and rule 12(1) of the Companies (Management and Administration) Rules, 2014]
I. REGISTRATION AND OTHER DETAILS:i CIN L65999MH2003PLC250504
ii Registration Date September 22, 2003
iii Name of the Company Bharat Financial Inclusion Limited(Formerly known as ‘SKS Microfinance Limited’)
iv Category/ Sub-Category of the Company Non-Banking Finance Company – Microfinance Institution (NBFC-MFI)
v Address of the Registered Office and contact details Registered Office: Unit No. 410, Madhava, Bandra-Kurla Complex, Bandra East, Mumbai – 400 051, Maharashtra, India
Email: [email protected]; Website: www.sksindia.com; Phone 040-44526000 Fax No. 040-44526001 / 022-26592375.
vi Whether listed company Yes
vii Name, Address and Contact details of Registrar and Transfer Agent, if any
Karvy Computershare Pvt. Ltd.Unit: Bharat Financial Inclusion Limited(Formerly known as ‘SKS Microfinance Limited’)Karvy Selenium Tower B, Plot 31-32, Gachibowli Financial District, Nanakramguda, Hyderabad - 500 032, TelanganaEmail: [email protected]; Website: www.karvycomputershare.com; Phone 040-23312454Fax No. 040-23311968
II. PRINCIPAL BUSINESS ACTIVITIES OF THE COMPANY
All the business activities contributing 10 % or more of the total turnover of the Company shall be stated:-
S. No Name and Description of main products/ services
NIC Code of the Product / service % to total turnover of the Company
1. Microfinance Services 64990Other financial service activities
88.6%
III. PARTICULARS OF HOLDING, SUBSIDIARY AND ASSOCIATE COMPANIES –
S. No NAME AND ADDRESS OF THE COMPANY
CIN/GLN HOLDING/ SUBSIDIARY/ ASSOCIATE
% of shares held Applicable Section
-Not Applicable -
IV. SHARE HOLDING PATTERN (Equity Share Capital Breakup as percentage of Total Equity)
1. Category-wise Shareholding
Category of Shareholders No. of Shares held at the beginning of the year
(April 1, 2015)
No. of Shares held at the end of the year
(March 31, 2016)
% Change during
the year#
Demat Physical Total % of Total
Shares
Demat Physical Total % of Total
Shares
A. Promoters
(1) Indian
a) Individual / HUF - - - - - - - - -
b) Central Government - - - - - - - - -
c) State Government(s) - - - - - - - - -
d) Bodies Corp. - - - - - - - - -
e) Banks/Financial Institutions - - - - - - - - -
f ) Any Other….
- Trusts - - - - - - - - -
Sub-total (A) (1):- - - - - - - - - -
(2) Foreign
a) NRIs - Individuals - - - - - - - - -
b) Other – Individuals - - - - - - - - -
c) Bodies Corp. 9125231 - 9125231 7.23% 3377333 - 3377333 2.65% -4.58%
d) Banks/ FI - - - - - - - - -
e) Any Other - - - - - - - - -
FII Sub Account 2560292 - 2560292 2.03% - - - - -
Sub-total (A) (2):- 11685523 - 11685523 9.25% 3377333 - 3377333 2.65% -4.58%
B. Public Shareholding
1. Institutions
a) Mutual Funds 16507581 - 16507581 13.07% 15269226 - 15269226 11.99% -1.08%
b) Venture Capital Funds - - - - - - - - -
c) Alternate Investment Funds - - - - - - - - -
d) Foreign Venture Capital Funds
- - - - - - - - -
e) Foreign Portfolio Investors 59536054 - 59536054 47.14% 72155113 - 72155113 56.68% 9.54%
f ) Financial Institutions/Banks 1702618 - 1702618 1.35% 1553807 - 1553807 1.22% -0.13%
g) Insurance companies - - - - - - - - -
h) Provident Funds/Pension Funds
- - - - - - - - -
i) Foreign Bodies corporate 10355100 - 10355100 8.20% 9114004 - 9114004 7.16% -1.04%
j) Others (specify) - - - - - - - - -

61 62
BHARAT FINANCIAL INCLUSION LIMITED Annual Report 2016 BHARAT FINANCIAL INCLUSION LIMITED Annual Report 2016
Category of Shareholders No. of Shares held at the beginning of the year
(April 1, 2015)
No. of Shares held at the end of the year
(March 31, 2016)
% Change during the year#
Demat Physical Total % of Total
Shares
Demat Physical Total % of Total
Shares
Sub-total (B)(1):- 88101353 - 88101353 69.76% 98092150 - 98092150 77.05% 7.29%
2. Central Government / State Government(s) / President of India
- - - - - - - - -
Sub-total (B)(2):- - - - - - - - - -
3. Non-Institutions
a) Individuals
i) Individual shareholders holding nominal share capital up to ` 1 lakh
7012569 113238 7125807 5.64% 8067648 225380# 8293028 6.51% 0.81%
ii) Individual shareholders holding nominal share capital in excess of ` 1 lakh
3499072 417577 3916649 3.10% 3397625 120692 3518317 2.76% -0.34%
b) NBFCs Registered with RBI - - - - 4130 - 4130 0.00 0.00
c) Employee Trusts - - - - - - - - -
d) Overseas Depositories (Holding DRs) (Balancing -figure)
- - - - - - - - -
e) Others (specify)
1. Trusts - - - - 5000 - 5000 0.00 0.01%
2. Resident Directors 10500 294166 304666 0.24% 26666 187500 214166 0.17% -0.07%
3. Non-resident Director 8080 - 8080 0.00% 74080 - 74080 0.06% 0.06%
4. Non-resident Indians 1659901 4238866 5898767 4.67% 1187973 4238866 5426839 4.26% -0.41%
5. Clearing Members 343848 - 343848 0.27% 1214725 - 1214725 0.95% 0.68%
6. Bodies Corporate 8890389 - 8890389 7.04% 7074677 - 7074677 5.56% -1.48
Sub-total (B)(3):- 31779459 3081258 36860717 29.19% 21052524 4772438 25819962 20.28% 8.91%
Total Public Shareholding (B) = (B)(1) + (B)(2) + (B)(3)
109525712 5081258 114606970 90.75% 119144674 4772438 123912112 97.33% 6.58%
C. Employee Benefit Trust (under SEBI (Share based Employee Benefit) Regulations 2014)
- 17411 17411 0.01% - 16661 16661 0.01% 0.00
Grand Total (A+B+C) 121211235 5081258 126292493 100.00% 122522007 4789099 127311106 100.00%
# Company issued equity shares under various ESOP Plans to employees during FY16.
(ii) Shareholding of Promoters
S No. Shareholder’s Name Shareholding at the beginningof the year (April 1, 2015)
Shareholding at the end of theYear (March 31, 2016)
% Change inShareholdingduring theyear
No. of Shares
% of totalShares of the Company
% of Shares Pledged/ encumbered to total shares
No. of Shares
% of totalShares of the Company
% of Shares Pledged/ encumberedto total shares
1 WestBridge Ventures II LLC 3490422 2.76% - Nil - - - - -2.76%
2 Kismet Microfinance 5634809 4.46% - Nil - 3377333 2.65% - Nil - 1.81%
3 Kumaon Investment Holdings 2560292 2.03% - Nil - - - - -2.03%
(iii) Change in Promoters’ Shareholding (please specify, if there is no change)
S No. Shareholder’s name
Shareholding at the beginning of the year
(As on April 1, 2015)
Date# Increase / Decrease
In shareholding
Reason Cumulative shareholding
during the year (01.04.2015 –31.3.2016)
No. of shares % of total shares of the
Company
No. of shares
% of total shares of the
Company
1 WestBridge Ventures II LLC(Formerly Sequoia Capital India II, LLC)
3490422 2.76% 21/08/201528/08/201530/10/2015
-980000-150000
-2360422
Transfer Transfer Transfer
0 0.00%
2 Kismet Microfinance
5634809 4.46% 09/10/201516/10/201523/10/201530/10/201506/11/201513/11/201520/11/201527/11/201504/12/2015
-388418-339385
-77315-347564-355368-186513-170904
-9018-382991
Transfer Transfer Transfer Transfer Transfer Transfer Transfer Transfer Transfer
3377333 2.65%
3 Kumaon Investment Holdings [FII Sub Account with HSBC Bank (Mauritius) Limited]
2560292 2.03% 14/08/201521/08/2015
-1601300-958992
Transfer Transfer
0 0.00%
# Date of transfer has been considered as the date on which the beneficiary position was provided by the Depositories to the Company
ANNEXURE - V TO DIRECTORS’ REPORT ANNEXURE - V TO DIRECTORS’ REPORT

63 64
BHARAT FINANCIAL INCLUSION LIMITED Annual Report 2016 BHARAT FINANCIAL INCLUSION LIMITED Annual Report 2016
(iv) Shareholding Pattern of Top Ten Shareholders (other than Directors, Promoters and Holders of GDRs and ADRs):
S No. Shareholder’s name
Shareholding at the beginning of the year (As on April 1, 2015)
Date# Increase/Decrease in
shareholding
Reason Cumulative shareholding during the year
(01.04.2015 - 31.3.2016)
No. of shares
% of total shares of the
Company
No. of shares
% of total shares of the
Company
1. MORGAN STANLEY ASIA (SINGAPORE) PTE.
6907651 5.47 10/04/2015 -616456 Transfer 5560823 4.36
17/04/2015 -299796
24/04/2015 -50124
01/05/2015 -37771
08/05/2015 -1248604
15/05/2015 +674112
22/05/2015 -197784
29/05/2015 -33304
05/06/2015 -556311
12/06/2015 -743966
19/06/2015 -89007
26/06/2015 -54830
30/06/2015 -50500
03/07/2015 -39713
10/07/2015 -10363
17/07/2015 -28662
24/07/2015 -471
31/07/2015 +684527
07/08/2015 +67175
14/08/2015 -8154
21/08/2015 -138809
28/08/2015 +97538
04/09/2015 +202660
11/09/2015 -450175
18/09/2015 -567400
25/09/2015 +78363
09/10/2015 +225246
16/10/2015 +29
23/10/2015 +6281
30/10/2015 +630942
06/11/2015 +597825
13/11/2015 +590658
S No. Shareholder’s name
Shareholding at the beginning of the year (As on April 1, 2015)
Date# Increase/Decrease in
shareholding
Reason Cumulative shareholding during the year
(01.04.2015 - 31.3.2016)
No. of shares
% of total shares of the
Company
No. of shares
% of total shares of the
Company
20/11/2015 +390445
27/11/2015 -3559
04/12/2015 -464985
11/12/2015 +327631
18/12/2015 +23817
25/12/2015 -207457
31/12/2015 +222401
01/01/2016 +72000
08/01/2016 -1374819
15/01/2016 -19355
22/01/2016 +5677
29/01/2016 -365728
05/02/2016 +332714
12/02/2016 -71293
19/02/2016 +1052639
26/02/2016 +108747
04/03/2016 -206339
11/03/2016 +1648
25/03/2016 +103491
31/03/2016 +92341
2 IDFC * 6888100 5.45 22/05/2015 +236991 Transfer 4300500 3.38
29/05/2015 +19909
09/10/2015 +207000
23/10/2015 +50000
25/12/2015 -35000
31/12/2015 -442214
01/01/2016 -62786
08/01/2016 -200000
15/01/2016 -406500
29/01/2016 -540000
05/02/2016 -100000
12/02/2016 -15000
19/02/2016 -253000
26/02/2016 -304510
ANNEXURE - V TO DIRECTORS’ REPORT ANNEXURE - V TO DIRECTORS’ REPORT
* Multiple folios consolidated

65 66
BHARAT FINANCIAL INCLUSION LIMITED Annual Report 2016 BHARAT FINANCIAL INCLUSION LIMITED Annual Report 2016
S No. Shareholder’s name
Shareholding at the beginning of the year (As on April 1, 2015)
Date# Increase/Decrease in
shareholding
Reason Cumulative shareholding during the year
(01.04.2015 - 31.3.2016)
No. of shares
% of total shares of the
Company
No. of shares
% of total shares of the
Company
04/03/2016 -300000
31/03/2016 -442490
3 SANDSTONE INVESTMENT PARTNERS I
5838900 4.62 04/09/2015 -679398 Transfer 5159502 4.05
4 AMANSA HOLDINGS PRIVATE LIMITED
5038813 3.99 01/05/2015 +346019 Transfer 5400000 4.24
15/05/2015 +87440
12/06/2015 +47934
19/06/2015 +209750
28/08/2015 +297623
04/09/2015 +43308
11/09/2015 +13883
18/09/2015 +200000
25/09/2015 -778577
12/02/2016 -106193
5 DSP BLACKROCK* 4719707 3.74 10/04/2015 -15350 Transfer 0 0.00
17/04/2015 -45665
01/05/2015 -82857
08/05/2015 -30715
15/05/2015 +129958
05/06/2015 -300000
12/06/2015 -90897
26/06/2015 -238867
24/07/2015 -342435
21/08/2015 -108760
28/08/2015 +20096
28/08/2015 -10931
04/09/2015 +106237
11/09/2015 +48593
11/09/2015 -53130
18/09/2015 -275026
23/10/2015 -1218922
06/11/2015 -40530
15/01/2016 -357012
S No. Shareholder’s name
Shareholding at the beginning of the year (As on April 1, 2015)
Date# Increase/Decrease in
shareholding
Reason Cumulative shareholding during the year
(01.04.2015 - 31.3.2016)
No. of shares
% of total shares of the
Company
No. of shares
% of total shares of the
Company
22/01/2016 -838046
29/01/2016 -469104
05/02/2016 -506344
6 TREE LINE ASIA MASTER FUND (SINGAPORE) PTE LTD*
3850000 3.05 - - - 3850000 3.02
7 MAX LIFE INSURANCE COMPANY LIMITED A/C - ULIF00725*
3805453 3.01 10/04/2015 +580894 Transfer 4549968 3.57
24/04/2015 -147362
01/05/2015 +85789
05/06/2015 +215000
19/06/2015 -188000
24/07/2015 +219107
31/07/2015 +200000
31/07/2015 -95000
07/08/2015 -67478
28/08/2015 +125000
09/10/2015 -70000
23/10/2015 -249959
04/12/2015 +1000
18/12/2015 +4385
08/01/2016 +300
29/01/2016 +2000
12/02/2016 +60659
12/02/2016 -52182
26/02/2016 +60362
04/03/2016 +60000
8 ROUTE ONE FUND I, L.P. 3090267 2.45 05/06/2015 -123479 Transfer 0 0.00
03/07/2015 +13257
31/07/2015 -114925
07/08/2015 -175487
14/08/2015 -57695
21/08/2015 -501700
25/09/2015 1000817
23/10/2015 -739606
ANNEXURE - V TO DIRECTORS’ REPORT ANNEXURE - V TO DIRECTORS’ REPORT
* Multiple folios consolidated* Multiple folios consolidated

67 68
BHARAT FINANCIAL INCLUSION LIMITED Annual Report 2016 BHARAT FINANCIAL INCLUSION LIMITED Annual Report 2016
S No. Shareholder’s name
Shareholding at the beginning of the year (As on April 1, 2015)
Date# Increase/Decrease in
shareholding
Reason Cumulative shareholding during the year
(01.04.2015 - 31.3.2016)
No. of shares
% of total shares of the
Company
No. of shares
% of total shares of the
Company
30/10/2015 -412567
06/11/2015 -910500
27/11/2015 -404826
04/12/2015 -334374
11/12/2015 -329182
9 KISMET SKS II 3023276 2.39 02/10/2015 -11698 Transfer 2461578 1.93
09/10/2015 -82092
16/10/2015 -87297
23/10/2015 -19036
30/10/2015 -86741
06/11/2015 -88393
13/11/2015 -46292
20/11/2015 -42808
27/11/2015 -3192
04/12/2015 -94149
10 GOVERNMENT PENSION FUND GLOBAL
2791664 2.21 10/04/2015 -62864 Transfer 0 0.00
17/04/2015 -38030
01/05/2015 -142244
08/05/2015 -253524
12/06/2015 -338288
10/07/2015 -330345
31/07/2015 -100000
07/08/2015 -55000
14/08/2015 -61000
21/08/2015 -150000
28/08/2015 -187759
04/09/2015 -65000
11/09/2015 -570000
18/09/2015 -437610
# Date of transfer has been considered as the date on which the beneficiary position was provided by the Depositories to the Company.
(v) Shareholding of Directors and Key Managerial Personnel:
S .No.
Director’s / KMP name
Category of Directors/ KMP
Shareholding at the beginning of the year (As on April 1, 2015)
Date# Increase/Decrease In
shareholding
Reason Cumulative shareholding during the year
(01.04.2015 - 31.3.2016)
No. of shares
% of total shares of the
Company
No. of shares
% of total shares of the
Company
1 Mr. P. H. Ravikumar Independent Director
10500 0.00% 16.04.201515.06.201531.07.201502.11.201503.11.201523.12.201524.12.2015
+30000+15000
+9000-13000
-9500-17143
-4857
AllotmentAllotmentAllotmentTransferTransferTransferTransfer
20000 0.01%
2 Mr. Geoffrey Tanner Woolley
Independent Director
0 0 31.07.201501.12.201531.12.201504.01.201625.02.2016
1800033000
-18000-3200018000
AllotmentAllotmentTransferTransferAllotment
19000 0.01%
3 Mr. M. R. Rao Managing Director & CEO
294166 0.24% 31.03.2016 -100000 Transfer 194166 0.15%
4 Mr. P. Krishnamurthy1
Nominee Director (SIDBI)
Nil Nil Nil Nil Nil Nil Nil
5 Mr. K. G. Alai Nominee Director (SIDBI)
Nil Nil Nil Nil Nil Nil Nil
6 Dr. Punita Kumar-Sinha
Independent Director
Nil Nil Nil Nil Nil Nil Nil
7 Mr. Paresh D. Patel Director Nil Nil Nil Nil Nil Nil Nil
8 Mr. Rajender Mohan Malla2
Independent Director
Nil Nil Nil Nil Nil Nil Nil
9 Mr. S. Balachandran Independent Director
Nil Nil Nil Nil Nil Nil Nil
10 Mr. Sumir Chadha Director Nil Nil Nil Nil Nil Nil Nil
11 Dr. Tarun Khanna Independent Director
8080 0.00% 02.12.201506.01.201625.02.2016
330002200036000
AllotmentTransferAllotment
55080 0.04%
12 Mr. S. Dilli Raj President 127666 0.12% 31.03.2016 62500 Transfer 65166 0.05%13 Mr. K. V. Rao Chief Operating
Officer25892 0.02% 0 0 - 25892 0.02%
14 Mr. Ashish Damani Chief Financial Officer
17726 0.01% 16.02.2016 11250 Allotment 28976 0.02%
15 Mr. Rajendra Patil Company Secretary
Nil Nil 01.12.201517.12.2015
2042020420
AllotmentTransfer
Nil Nil
1. SIDBI nominated Mr. K. G. Alai as its new director in place of its existing Nominee Director i.e. Mr. P. Krishnamurthy in October 2015.
2. Mr. Rajender Mohan Malla was appointed as Additional & Independent Director of the Company with effect from March 11, 2016.
3. Mr. Sumir Chadha resigned with effect from May 4, 2016
ANNEXURE - V TO DIRECTORS’ REPORT ANNEXURE - V TO DIRECTORS’ REPORT

69 70
BHARAT FINANCIAL INCLUSION LIMITED Annual Report 2016 BHARAT FINANCIAL INCLUSION LIMITED Annual Report 2016
ANNEXURE - V TO DIRECTORS’ REPORT ANNEXURE - V TO DIRECTORS’ REPORT
V. INDEBTEDNESS
Indebtedness of the Company including interest outstanding/ accrued but not due for payment
S. No Particulars Secured Loans excluding deposits
Unsecured Loans
Deposits Total Indebtedness
1 Indebtedness at the beginning of the financial yeari) Principal Amountii) Interest due but not paidiii) Interest accrued but not dueTotal (i+ii+iii)
31,841,494,892 63,530,296
101,846,187 32,006,871,375
956,874,510
- -
956,874,510
- - - -
32,798,369,402
63,530,296 101,846,187
32,963,745,885
2 Change in Indebtedness during the financial yeari) Addition (Only principal)ii) Reduction (Only principal)Net Change
62,852,874,016 46,431,626,428 16,421,247,588
6,848,078,295 4,770,857,593 2,077,220,702
- - -
69,700,952,311 51,202,484,021 18,498,468,290
3 Indebtedness at the end of the financial yeari) Principal Amountii) Interest due but not paidiii) Interest accrued but not due
48,262,742,480
- 368,196,935
3,034,095,212
- 9,381,245
- -
-
51,296,837,692
- 377,578,180
Total (i+ii+iii) 48,630,939,415 3,043,476,457 - 51,674,415,872
VI. REMUNERATION OF DIRECTORS AND KEY MANAGERIAL PERSONNEL
A. Remuneration to Managing Director, Whole-time Directors and/ or Manager:
(` In lakhs)
S. No
Particulars of Remuneration Name of Managing Director
Mr. M. R. Rao
1 Gross salary
(a) Salary as per provisions contained in section 17(1) of the Income-tax Act, 1961 169.93
(b) Value of perquisites u/s 17(2) Income-tax Act, 1961 10.14
(c) Profits in lieu of salary under section 17(3) Income-tax Act, 1961 -
2 Stock Options (1) -
3 Sweat Equity -
4 Commission - as % of profit - others, specify… -
5 Others, please specify
a) Bonusb) Contribution to PFc) Leave encashment
94.5011.60
-
Total (A) 286.18
Ceiling as per the CA 2013 2159.20
Mr. M. R. Rao holds 194166 equity shares allotted prior to FY16.
B. Remuneration to other Directors
(` In lakhs)
A Name of the Independent Director
Mr. P. H. Ravikumar Mr. Geoffrey Tanner Woolley
Mr. S. Balachandran
Dr. Tarun Khanna
Dr. Punita Kumar Sinha
1 Fee for attending Board/ committee meetings
14.45 8.50 16.95 2.00 6.00
2 Commission 25.00 25.00 17.19 25.00 0.613 Others, please specify - - - - -
Total 39.45 33.50 34.14 27.00 6.61Total (A) 140.70
B Name of Non-executive Director
Mr. P. Krishnamurthy
Mr. Paresh D. Patel
Mr. Sumir Chadha
Mr. K.G.Alai
1 Fee for attending Board/ committee meetings
5.50 - - 1.50
2 Commission - - - -3 Others, please specify - - - -
Total 5.50 - - 1.50Total (B) 7.0TOTAL (A)+(B) 147.70Total Managerial Remuneration
433.88
Overall Ceiling as per the CA 2013
2591.04
C. REMUNERATION TO KEY MANAGERIAL PERSONNEL OTHER THAN MD/ MANAGER/ WTD
(` In lakhs)
Sr.No Particulars of Remuneration Key Managerial PersonnelMr. S. Dilli Raj, President
Mr. K. V. Rao, Chief Operating Officer
Mr. Ashish Damani, Chief Financial Officer
Mr. Rajendra Patil, Company Secretary
Total
1. Gross salarya) Salary as per provisions contained in section 17(1)
of the Income-tax Act, 1961145.11 55.00 41.65 44.86 286.62
b) Value of perquisites u/s 17(2) Income-tax Act, 1961 - 11.34 6.32 5.71 23.37c) Profits in lieu of salary under section 17(3) Income-
tax Act, 1961- - - - -
2. Stock Options (1) - - - - -3. Sweat Equity - - - - -4. Commission - - - - -
- as % of profit - others, specify
- - - - -
5 Others, please specify- Bonus- Contribution to PF- Leave encashment
76.109.354.28
21.934.281.38
15.853.09
-
11.373.25
-
125.2319.97
5.66Total 234.84 93.93 66.91 65.19 460.87
VII. PENALTIES / PUNISHMENT/ COMPOUNDING OF OFFENCES:
There are no penalties / punishment / compounding of offences for the year ending March 31, 2016

71 72
BHARAT FINANCIAL INCLUSION LIMITED Annual Report 2016 BHARAT FINANCIAL INCLUSION LIMITED Annual Report 2016
COMPANY’S PHILOSOPHY ON CODE OF GOVERNANCE
Bharat Financial Inclusion Limited (Formerly known as ‘SKS Microfinance Limited) (“BFIL” or “the Company”) follows the highest standards of governance principles, given the profile of customers that the Company works with. This approach has helped the Company weathering the turbulent times that the MFI sector has faced over the last five years. This approach has also demonstrated that the vulnerability to a financial crisis is reduced through acceptance of the Company’s approach by other stakeholders in the eco-system in which the Company operates. It has also ensured sustained access to capital and debt markets on a continuing basis. The Company is committed to strengthen this approach through adoption of ‘best in class’ philosophy, systems and processes in the realm of governance.
In India, corporate governance standards for listed companies are mandated under the Companies Act, 2013 (“the Act”) and the regulations and guidelines prescribed by Securities and Exchange Board of India (SEBI). Till November 30, 2015, all listed entities were required to adhere to the corporate governance standards prescribed in the clause 49 of the listing agreement prescribed by SEBI. SEBI with the objective of bringing the basic framework governing the regime of listed entities in line with the Act and at the same time compiling all the mandates of varied SEBI regulations/circulars governing equity as well as debt segments of capital market under the ambit of a single document, has notified SEBI (Listing Obligations and Disclosure Requirements) Regulations, 2015 (hereinafter referred as “SEBI LODR Regulations”) on September 2, 2015. The SEBI LODR Regulations came into force on the ninetieth day from their publication i.e. December 1, 2015. While many of the existing provisions of the listing agreement have been retained in the SEBI LODR Regulations, but it has added many new obligations on the listed entities and their boards/ key managerial personnel.
In addition to the above, corporate governance standards for Non-Banking Finance Companies are also prescribed by Reserve Bank of India.
The Company has always believed in implementing corporate governance guidelines and practices that go beyond meeting the letter of the law and has comprehensively adopted practices mandated in the Act and SEBI LODR Regulations to fulfil its responsibility towards the stakeholders. These guidelines ensure that the Board of Directors (“the Board”) will have the necessary authority to review and evaluate the operations when required. Further, these guidelines allow the Board to make decisions that are independent of the Management.
This chapter, along with the chapters on Management Discussion and Analysis and Additional Shareholders Information, reports the Company’s compliance with Regulation 34 and 53 of SEBI LODR Regulations.
BOARD OF DIRECTORS Composition and category of the Directors
As on March 31, 2016, the Company’s Board comprised of ten (10) Directors, including six (6) Independent Directors, the Chairman of the Board is a Non-Executive and Independent Director. The composition of the Board is in conformity with Regulations 17 of SEBI LODR Regulations, which stipulates that the board should have an optimum combination of executive and non-executive directors with at least one (1) woman director and at least fifty per cent (50%) of the board should consist of non-executive directors. It further stipulates that if the chairperson of the board is a non-executive and non-promoter Director then at least one-third of the board should comprise of independent directors.
During the year under review, the Board met five (5) times on May 4, 2015, July 22, 2015, October 19, 2015, October 30, 2015 and January 27, 2016. The time gap between any two meetings was less than four months.
The names of the members of the Board, their status, their attendance at the Board Meetings and the last Annual General Meeting (“AGM”), number of other Directorships and Committee membership(s)/ chairmanship(s) of each Director are as under:
REPORT ON CORPORATE GOVERNANCE REPORT ON CORPORATE GOVERNANCE (Contd.)
Sr. No Name of the Director
Category of Directors No. of meetings
held in FY16
No. of meetings attended
(including through
electronic mode)
in FY16
Whether attended last AGM
No. of other Director-
ships held in other public companies
No. of other Board
CommitteeMember-
ships
No. of Chairman-
ships of other
Board Committees
1. Mr. P. H. Ravikumar Non-executive Chairman & Independent Director
5 5 Yes 8 5 1
2. Mr. S. Balachandran Independent Director 5 5 Yes 1 - 1
3. Mr. Geoffrey Tanner Woolley Independent Director 5 5 - - - -
4. Mr. K. G. Alai(w.e.f. October 30, 2015)
Nominee Director (SIDBI) 1 1 NA - - -
5. Mr. M. Ramachandra Rao Managing Director & CEO 5 5 Yes - - -
6. Mr. P. Krishnamurthy(Up to October 19, 2015)
Nominee Director (SIDBI) 2 2 - NA NA NA
7. Mr. Paresh D. Patel Director 5 3 - - - -
8. Dr. Punita Kumar-Sinha Independent Director 5 5 - 9 4 1
9. Mr. Rajender Mohan Malla(w.e.f. March 11, 2016)
Additional & Independent Director
- - NA 3 - -
10. Mr. Sumir Chadha* Director 5 3 - 1 - -
11. Dr. Tarun Khanna Independent Director 5 2 - - - -
* Resigned w.e.f. May 4, 2016
Notes:1. None of the Directors of the Company were members in more than ten (10) committees or acted as Chairpersons of more than five (5) committees across
all public limited companies in which they were Directors. For the purpose of reckoning the limit, Chairmanship/ membership of the Audit Committee and the Stakeholders’ Relationship Committee alone have been considered;
2. None of the Directors held directorships in more than ten (10) public limited companies;
3. None of the Directors is related to any Director or is a member of an extended family;
4. None of the employees of the Company is related to any of the Directors;
5. None of the Directors has any business relationship with the Company;
6. None of the Directors has received any loans or advances from the Company during the year.
No. of Shares and convertible instruments held by the Non-Executive Directors
Details of shares or convertible instruments of the Company held by the Non-Executive Directors as on March 31, 2016 are given below:
S.No Director’s name No. of stock options No. of equity shares
1 Mr. P. H. Ravikumar 100,000 20,000
2 Mr. Geoffrey Tanner Woolley 167,000 19,000
3 Dr. Tarun Khanna 167,000 55,080
Familiarization programme
The Board has been apprised/ familiarized about the business performance, product and processes, business model, nature of the industry in which the Company operates, roles and responsibilities of the Board Members under the applicable laws, etc., on a periodic basis and the details of such familiarization programmes are available at https://www.sksindia.com/downloads/FamilirisationProgramme.pdf
All new Directors inducted into the Board are introduced to the Company through appropriate orientation sessions. Presentations are made by senior management officers to provide an overview of the Company’s operations and to familiarize the new Directors with the operations. They are also introduced to the organization’s culture, services, constitution, Board procedures, matters reserved for the Board and risk management strategy.

73 74
BHARAT FINANCIAL INCLUSION LIMITED Annual Report 2016 BHARAT FINANCIAL INCLUSION LIMITED Annual Report 2016
The Company also facilitates the continual education requirements of its Directors. Support is provided for Independent Directors, if they choose to attend professional educational programmes in the areas of Board/ corporate governance.
Information Supplied to the Board
The Board has complete access to all relevant information of the Company. The quantum and quality of information supplied by the management to the Board goes well beyond the minimum requirement stipulated in Regulation 17 (7) of SEBI LODR Regulations. All information, except critical unpublished price sensitive information (which is circulated at a shorter notice than the period prescribed under Secretarial Standard on Meetings of the Board of Directors), is given to the Directors well in advance of the Board and the Committee meetings.
The Board works closely with the Executive Management Team to constantly review the evolving operating environment and strategies best suited to enhance the Company’s performance and periodically reviews compliance reports of all laws applicable to the Company as well as steps taken by the Company to rectify instances of non-compliance, if any.
Code of Conduct
The Board has laid down a Code of Conduct for all the Board Members and Senior Management of the Company. The Code of Conduct is available on the website of the Company at www.sksindia.com. All Board Members and Senior Management personnel have affirmed compliance with the Code of Conduct. A declaration signed by the Chief Executive Officer (CEO) to this effect is enclosed at the end of this report.
Committees of the Board
The Board has constituted committees to delegate particular matters that require greater and more focused attention in the affairs of the Company.
All decisions pertaining to the constitution of committees, appointment of members and fixing of terms of reference for committee members is taken by the Board. Details on the role and composition of these committees, including the number of meetings held during the financial year and the related attendance, are provided below:
(a) Audit Committee
Till May 4, 2016, the Audit Committee was comprised of three (3) members including two (2) Independent Directors:
1. Mr. P. H. Ravikumar (Chairman);
2. Mr. S. Balachandran; and
3. Mr. K. G. Alai.
The Audit Committee oversees the financial reporting process and reviews, with the Management, the financial statements to ensure that the same are correct and credible. The Audit Committee has the ultimate authority and responsibility to select and evaluate the Independent Auditors in accordance with the law. The Audit Committee also reviews performance of the Statutory Auditors, the Internal Auditors, adequacy of the internal control system and Whistle-blower mechanism.
During the year under review, the Audit Committee met five (5) times on May 4, 2015, July 22, 2015, October 19, 2015, October 30, 2015 and January 27, 2016. The time gap between any two meetings was less than four months. The details of attendance at the Audit Committee meetings are given below:
Attendance record of the Audit Committee
Name of the Member Position Status No. of Meetings held
No. of Meetings Attended
Mr. P. H. Ravikumar Independent Director Chairman 5 5
Mr. S. Balachandran Independent Director Member 5 5
Mr. K. G. Alai (w.e.f. October 30, 2015) Nominee Director - SIDBI Member 1 1
Mr. P. Krishnamurthy (Upto October 19, 2015) Nominee Director - SIDBI Member 2 2
REPORT ON CORPORATE GOVERNANCE (Contd.)
The President and the Chief Financial Officer, who are responsible for the finance function, the Head of Internal Audit and the representative of the Statutory Auditors are invited to attend meetings of the Audit Committee. Mr. Rajendra Patil, Company Secretary & Compliance Officer, is the Secretary to the Audit Committee.
All members of the Audit Committee have accounting and financial management expertise. Mr. P. H. Ravikumar, Chairman of the Audit Committee, was present at the Company’s Twelfth AGM held on September 23, 2015 to answer queries of the shareholders.
(b) Asset Liability Management Committee
Till May 4, 2016, the Asset Liability Management Committee (“ALM Committee”) was comprised of three (3) members:
1. Mr. S. Balachandran (Chairman);
2. Mr. M. R. Rao; and
3. Mr. P. H. Ravikumar
The functions of the ALM Committee include addressing concerns regarding asset liability mismatches, interest rate risk exposure, and achieving optimal return on capital employed while maintaining acceptable levels of risk including and relating to liquidity, market and operational aspects and adhering to the relevant policies and regulations.
During the year under review, the ALM Committee met three (3) times on May 4, 2015, November 24, 2015 and February 13, 2016. The details of attendance at the ALM Committee meetings are given below:
Attendance record of the ALM Committee
Name of the Member Position Status No. of Meetings held
No. of Meetings Attended
Mr. S. Balachandran (w.e.f. November 24, 2015) Independent Director Chairman 2 2
Mr. M. R. Rao Managing Director & CEO Member 3 2
Mr. Paresh D. Patel (Up to May 4, 2015) Director Member 1 0
Mr. P. H. Ravikumar Independent Director Member 3 3Mr. P. Krishnamurthy (Up to October 19, 2015) Nominee Director – SIDBI Member 1 1
(c) Corporate Social Responsibility Committee
Till May 4, 2016, the Corporate Social Responsibility Committee (“CSR Committee”) was comprised of four (4) members including two (2) Independent Directors:
1. Mr. Geoffrey Tanner Woolley (Chairman);
2. Mr. M. R. Rao;
3. Dr. Punita Kumar-Sinha; and
4. Dr. Tarun Khanna
The functions of the CSR Committee include formulation and monitoring of CSR Policy, recommending CSR Projects and budgets thereof, review of CSR initiatives undertaken/ to be undertaken by the Company and to do such other things as directed by the Board and in compliance with the applicable laws.
During the year under review, the CSR Committee met three (3) times on May 4, 2015, July 22, 2015 and October 30, 2015. The details of attendance at the CSR Committee meetings are given below:
REPORT ON CORPORATE GOVERNANCE (Contd.)

75 76
BHARAT FINANCIAL INCLUSION LIMITED Annual Report 2016 BHARAT FINANCIAL INCLUSION LIMITED Annual Report 2016
Attendance record of the CSR Committee
Name of the Member Position Status No. of Meetings held
No. of Meetings Attended
Mr. Geoffrey Tanner Woolley Independent Director Chairman 3 3
Mr. S. Balachandran (Up to May 4, 2015) Independent Director Member 1 1
Mr. M. R. Rao Managing Director & CEO Member 3 3
Mr. P. Krishnamurthy (Up to October 19, 2015) Nominee Director Member 2 2
Dr. Punita Kumar-Sinha (w.e.f. July 22, 2015) Independent Director Member 2 2Dr. Tarun Khanna (w.e.f. July 22, 2015) Independent Director Member 2 1
(d) Nomination and Remuneration Committee
Till May 4, 2016, the Nomination and Remuneration Committee (“NRC Committee”) was comprised of six (6) members including four (4) Independent Directors:
1. Mr. S. Balachandran (Chairman);
2. Mr. Geoffrey Tanner Woolley;
3. Mr. Paresh D. Patel;
4. Dr. Punita Kumar-Sinha
5. Mr. Sumir Chadha
6. Dr. Tarun Khanna During the year under review, the NRC Committee met four (4) times on May 4, 2015, July 22, 2015, October 30, 2015 and February12, 2016.
The details of attendance at the NRC Committee meetings are given below:
Attendance record of the NRC Committee
Name of the Member Position Status No. of Meetings held
No. of Meetings Attended
Mr. S. Balachandran Independent Director Chairman 4 4
Mr. Geoffrey Tanner Woolley Independent Director Member 4 4
Mr. Paresh D. Patel Director Member 4 1
Mr. P. H. Ravikumar (up to May 4, 2015) Independent Director Member 1 1
Dr. Punita Kumar-Sinha (w.e.f. July 22, 2015) Independent Director Member 3 3
Mr. Sumir Chadha* Director Member 4 1Dr. Tarun Khanna Independent Director Member 4 1
* Resigned w.e.f. May 4, 2016
Performance evaluation of Board Members
The Act and SEBI LODR Regulations stipulates the performance evaluation of the Directors including Chairperson, Board and its Committees. Considering the said provisions, the Company has devised a process and criteria for the performance evaluation which has been recommended by the NRC Committee and approved by the Board.
The evaluations for the Directors and the Board were done through separate structured questionnaires, one each for Independent and Non-Executive Directors, Managing Director & CEO, Board and the Committees of the Board.
REPORT ON CORPORATE GOVERNANCE (Contd.) REPORT ON CORPORATE GOVERNANCE (Contd.)
A separate exercise was carried out to evaluate the performance of all Directors including the Chairman of the Board, who were evaluated on parameters such as level of engagement and contribution; knowledge, skill and understanding of the areas which are relevant to them in their capacity as members of the Board; independence of judgement; safeguarding the interest of the Company, etc. The performance of the Managing Director & CEO was evaluated on additional parameters such as strategy formulation and execution; financial performance; leadership; knowledge of the product, etc. The performance evaluation of each Independent Director was carried out by the entire Board, excluding the Independent Director concerned. The performance evaluation of the Non-Executive Directors was carried out by the Independent Directors.
Remuneration Policy
The NRC Committee determines and recommends to the Board the compensation payable to the Directors. The NRC Committee reckons the performance of the team, the manner in which the sector is performing and the prevailing and emerging levels of compensation while submitting to the Board their views. All Board-level compensation is approved by the shareholders and disclosed separately in the financial statements.
Remuneration for the Managing Director and CEO and other senior executives consists of a fixed component and a variable component. The NRC Committee conducts an annual appraisal of the performance of the Managing Director and CEO and other senior executives based on a performance-related matrix. The annual compensation of the senior executives is approved by the NRC Committee. It also recommends the annual compensation of the Managing Director and CEO, which is approved by the Board.
The Managing Director and CEO of the Company is entitled to an annual variable pay each fiscal year, which is subject to the achievement of certain fiscal year milestones by the Company, as determined by the Board.
The compensation payable to the Independent Directors is as decided by the Board, the sum of which does not exceed 1% of the net profits for the year, calculated as per the provisions of the Act. The performance of the Independent Directors is reviewed by the Board on an annual basis.
Remuneration paid to all Directors for FY16
(` In lakhs)
Name of the Director Sitting Fees Salary and Perquisites
Contribution to Provident and
Other Funds
Performance linked
incentive
Commis-sion &
Others#
Total
Mr. P.H. Ravikumar 14.45 - - - 25.00 39.45
Mr. S. Balachandran 16.95 - - - 17.19 34.14
Mr. Geoffrey Tanner Woolley 8.50 - - - 25.00 33.50
Mr. K.G. Alai(w.e.f. October 30, 2015)
1.50 - - - - 1.50
Mr. M. Ramachandra Rao - 180.07 11.60 94.50 - 286.18
Mr. P. Krishnamurthy(Up to October 11, 2016)
5.50 - - - - 5.50
Dr. Punita Kumar-Sinha 6.00 - - - 0.62 6.62
Mr. Rajender Mohan Malla(w.e.f. March 11, 2016)
- - - - - -
Dr. Tarun Khanna 2.00 - - - 25.00 27.00
# The commission to Independent Directors for the FY15 was paid during FY16. Further, the commission was paid to Independent Directors based on the tenure
of their association with the Company for FY15.
During FY16, the Company has not advanced loans to any of its Directors.

77 78
BHARAT FINANCIAL INCLUSION LIMITED Annual Report 2016 BHARAT FINANCIAL INCLUSION LIMITED Annual Report 2016
e) Risk Management Committee
The Company follows well-established and detailed risk assessment and minimization procedures. The Company especially focuses on improving its sensitivity to the assessment of risks and improving methods of computation of risk weights. The risk assessment and mitigation procedures are reviewed by the Board periodically. The Company’s risk management framework is discussed in detail in the chapter on Management Discussion and Analysis.
Till May 4, 2016, the Risk Management Committee (“RM Committee”) was comprised of three (3) members including two (2) Independent Directors:
1. Mr. P. H. Ravikumar (Chairman);
2. Mr. S. Balachandran; and
3. Mr. M. R. Rao.
The functions of the RM Committee include monitoring and reviewing risk management plan, operational risk, information technology risk, integrity risk, etc., and taking strategic actions in mitigating risk associated with the business.
During the year under review, the RM Committee met three (3) times on July 22, 2015, December 3, 2015 and February 13, 2016. The details of attendance at the RM Committee meetings are given below:
Attendance record of the RM Committee
Name of the Member Position Status No. of Meetings held No. of Meetings Attended
Mr. P. H. Ravikumar Independent Director Chairman 3 3
Mr. S. Balachandran Independent Director Member 3 3
Mr. M. R. Rao(w.e.f. December 3, 2015)
Managing Director & CEO Member 2 1
Mr. P. Krishnamurthy (Upto October 19, 2015)
Nominee Director Member 1 1
(f ) Stakeholders’ Relationship Committee
Till May 4, 2016, the Stakeholders’ Relationship Committee (“SR Committee”) was comprised of three (3) members, who are all Independent Directors:
1. Mr. P. H. Ravikumar (Chairman);
2. Mr. S. Balachandran; and
3. Mr. Geoffrey Tanner Woolley
The functions and powers of the SR Committee include review and resolution of grievances of shareholders, debenture holders and other security holders; dealing with all aspects relating to the issue and allotment of shares, debentures and other securities; approve sub-division, consolidation, transfer and issue of duplicate share/ debenture certificate.
During the year under review, the SR Committee met twice (2) on May 4, 2015 and October 30, 2015. Details of attendance at SR Committee meetings are given below:
REPORT ON CORPORATE GOVERNANCE (Contd.)
Attendance record of the SR Committee
Name of the Member Position Status No. of Meetings held No. of Meetings Attended
Mr. P. H. Ravikumar Independent Director Chairman 2 2
Mr. S. Balachandran(w.e.f. October 30, 2015)
Independent Director Member 1 1
Mr. Geoffrey Tanner Woolley Independent Director Member 2 2
Mr. P. Krishnamurthy(Upto October 19, 2015)
Independent Director Member 1 1
Mr. Rajendra Patil, Company Secretary & Compliance Officer, is the Secretary to the SR Committee.
Nature of complaints received and attended to during FY16
Details of queries and grievances received and attended to by the Company during FY16 are given below:
Nature of Complaint Pending as on April 1, 2015
Received during 2015-16
Resolved during 2015-16
Pending as onMarch 31, 2016
1. Transfer / Transmission / Duplicate 0 2 2 0
2. Non-receipt of Dividend Nil Nil Nil Nil
3. Dematerialization / Rematerialization of shares Nil Nil Nil Nil
4. Complaints received from:
- Securities and Exchange Board of India Nil Nil Nil Nil
- Stock Exchanges Nil Nil Nil Nil
- Registrar of Companies/ Ministry of Corporate Affairs
Nil Nil Nil Nil
- Company & Registrar Nil 71 71 Nil
5. Legal Nil Nil Nil Nil
The Board, at its meeting held on May 4, 2016, revised composition of some of the committees and the details of the said committees are given in Annexure.
Terms of reference of the aforesaid committees are available on the website of the Company: www.sksindia.com
In addition to the aforesaid Committees, the Board has constituted two (2) non-mandatory Committees to oversee specific operational activities, namely the ESOP Allotment Committee and the Finance Committee.
GENERAL BODY MEETINGS
Details of location and time, where last three AGMs held are given below:
Financial Year Category Location of the meeting
Date Time
2014-15 AGM Y. B. Chavan Auditorium, General Jagannath Bhosle Marg, Mumbai - 400 021, Maharashtra
23.09.2015 11.00 a.m.
2013-14 AGM - do - 29.09.2014 11.00 a.m.
2012-13 AGM - do - 03.12.2013 11.00 a.m.
REPORT ON CORPORATE GOVERNANCE (Contd.)
79 80
BHARAT FINANCIAL INCLUSION LIMITED Annual Report 2016 BHARAT FINANCIAL INCLUSION LIMITED Annual Report 2016
The following Special Resolutions were taken up in the last three AGMs, and were passed with the requisite majority:
FY15: Special Resolutions passed at the Twelfth AGM 1. Revision in the commission payable to the Independent Directors of the Company; and 2. Issue and allotment of Non-Convertible Debentures and other debt securities on private placement basis.
FY14: Special Resolutions passed at the Eleventh AGM 1. Revision in the commission payable to the Independent Directors of the Company; 2. Adoption of new Articles of Association of the Company containing regulations in conformity with the Act.
FY13: Special Resolutions passed at the Tenth AGM 1. Re-appointment of Mr. M. R. Rao as the Managing Director and Chief Executive Officer of the Company; and 2. Payment of Commission to Independent Directors.
There was no special resolution passed during FY16 through Postal Ballot.
A postal ballot is proposed to be conducted vide postal ballot notice dated June 14, 2016 for passing of the special resolutions for the following:
1. Enhancement of the Borrowing Limits.
2. Creation of charge on the Company’s movable and immovable properties to secure borrowings.
3. Issue and allotment of Non-convertible Debenture and other debt securities on private placement basis.
Means of Communication with Shareholders
All important information relating to the Company and its performance, including financial results and shareholding pattern, are posted on the website of the Company: www.sksindia.com. The website also displays all official press releases and presentation to analysts made by the Company.
The quarterly, half yearly and annual results of the Company’s performance are published in leading newspapers like The Financial Express (English) and Loksatta (Marathi).
General Shareholder Information
(i) Annual General Meeting Date: July 21, 2016 Time: 2.30 p.m. Venue: Rangaswar Auditorium, Y. B. Chavan Centre, General Jagannath Bhosle Marg, Mumbai - 400 021, Maharashtra
(ii) Financial Calendar Financial year: April 1 to March 31
For the year ended March 31, 2016, results were announced on:
y July 22, 2015: First quarter
y October 19, 2015 : Second quarter and Half yearly
y January 27, 2016 : Third quarter
y May 4, 2016: Fourth quarter and Annual
REPORT ON CORPORATE GOVERNANCE (Contd.)
For the year ending March 31, 2017, results will be announced
y On or before August 14, 2016: First quarter
y On or before November 14, 2016: Second quarter and Half yearly
y On or before February 14, 2017: Third quarter
y On or before May 30, 2017: Fourth quarter and Annual
(iii) Dates of Book Closure The dates of book closure are from July 18, 2016 to July 21, 2016 inclusive of both days.
(iv) Name and address of each Stock Exchange(s) at which the Company’s securities are listed and a confirmation about payment of annual listing fee to each of such stock exchange(s) At present, the equity shares of the Company are listed on:
1. BSE Limited (BSE)
Phiroze Jeejeebhoy Towers
Dalal Street, Mumbai – 400 00, Maharashtra
2. National Stock Exchange of India Limited (NSE).
Exchange Plaza, Bandra-Kurla Complex
Bandra (East), Mumbai – 400 050
The annual listing fees for FY16 to BSE and NSE has been paid.
(v). Stock Exchange codes
Name of the Stock Exchange Stock Code
The National Stock Exchange of India Limited, Mumbai SKSMICRO
BSE Limited, Mumbai 533228
(vi). Market Price Data & Performance in comparison to broad-based indices.
High, lows and volumes of the Company’s shares for FY16 at BSE and NSE
Month BSE NSE
High Low Volume High Low Volume
April 2015 525.00 420.20 5192198 524.95 420.30 30652743
May 2015 496.75 421.20 4727517 497.15 421.00 31872749
June 2015 474.90 415.05 3345168 474.90 414.90 20659991
July 2015 589.50 462.10 4206704 589.60 464.70 34348533
Aug 2015 588.00 425.40 6954907 588.15 425.10 28228226
Sept 2015 477.00 369.45 8768184 477.00 360.60 58813563
Oct 2015 472.30 398.00 8685915 474.00 398.10 51507499
Nov 2015 460.75 419.75 2984310 461.60 419.90 28283500
Dec 2015 497.50 434.85 2120079 505.00 434.95 24572474
Jan 2016 545.95 435.00 4262455 546.25 435.50 42149643
Feb 2016 577.50 458.90 4513094 577.70 457.70 40673405
March 2016 549.90 488.20 2613267 543.25 486.00 25600367
Note: High and low are in ` per traded share
Volumes is the total monthly volume of trade in number of Company’s shares.
REPORT ON CORPORATE GOVERNANCE (Contd.)

81 82
BHARAT FINANCIAL INCLUSION LIMITED Annual Report 2016 BHARAT FINANCIAL INCLUSION LIMITED Annual Report 2016
Performance on BSE versus BSE Sensex
BSE SensexSKS (High)
April2015
May2015
June2015
July2015
August2015
September2015
October2015
November2015
December2015
January2016
February2016
March2016
700.00
600.00
500.00
400.00
300.00
200.00
100.00
0.00
Note: Company’s share prices at the BSE and the BSE Sensex have been indexed to 100 as on the first working day of FY16
Share Performance on NSE versus Nifty
April2015
May2015
June2015
July2015
August2015
September2015
October2015
November2015
December2015
January2016
February2016
March2016
1600.00
1400.00
1200.00
1000.00
800.00
600.00
400.00
200.00
0.00
SKS (High)NSE Nifty (High)
Note: Company’s share prices at NSE and the NSE S&P Nifty have been indexed to 10 as on the first working day of FY16
REPORT ON CORPORATE GOVERNANCE (Contd.)
(vii). Registrar & Share Transfer Agents
The Company has appointed Karvy Computershare Private Limited (Karvy) as its Registrar and Transfer Agent. All share transfers and related operations are conducted by Karvy, which is registered with the SEBI.
Karvy Computershare Private Limited (Unit : Bharat Financial Inclusion Limited (Formerly known as ‘SKS Microfinance Limited’) Karvy Selenium Tower B, Plot 31-32, Gachibowli Financial District, Nanakramguda, Hyderabad 500 032. Email: [email protected] Phone No: 040-67162222 Fax No: 040-23001153
(viii). Share Transfer System
The Company has constituted a Stakeholders Relationship Committee for redressing shareholder and investor complaints.
(ix). Distribution of shareholding as on March 31, 2016
Category (Amount)
No. of Members
% of Members Total Shares Amount % of Shareholding
1-5000 49737 93.52 3533801 35338010 2.78
5001- 10000 1542 2.90 1187360 11873600 0.93
10001- 20000 783 1.47 1176108 11761080 0.92
20001- 30000 273 0.51 700887 7008870 0.55
30001- 40000 133 0.25 481162 4811620 0.38
40001- 50000 84 0.16 391692 3916920 0.31
50001- 100000 201 0.38 1511250 15112500 1.19
100001 & Above 430 0.81 118328846 1183288460 92.94
TOTAL 53183 100.00 127311106 12723111060 100.00
(x). Dematerialization of Shares and liquidity
As at March 31, 2016, over 96.24% shares of the Company were held in dematerialized form.
(xi). Outstanding GDRs/ ADRs/ Warrants/ or any Convertible instruments, conversion date and likely impact on equity
Nil
(xii). Branch Offices
The Company had 1324 branches as on March 31, 2016 across India.
(xiii). Commodity price risk or foreign exchange risk and hedging activites.
Nil
REPORT ON CORPORATE GOVERNANCE (Contd.)

83 84
BHARAT FINANCIAL INCLUSION LIMITED Annual Report 2016 BHARAT FINANCIAL INCLUSION LIMITED Annual Report 2016
(xiv). Address for correspondence
Shareholders/ Investors may write to the Company Secretary at the following address
The Company Secretary Bharat Financial Inclusion Limited (formerly known as “SKS Microfinance Limited”) Registered Office Address: Unit No. 410, ‘Madhava’, Bandra-Kurla Complex Bandra (East), Mumbai – 400 051. Email: [email protected] Phone No: 040-4452 6000 Fax No: 040-4452 6001/ 022-2659 2375
In addition to the aforesaid, Debentureholders may write to the Debenture Trustee at the following address: IDBI Trusteeship Services Limited Asian Building, Ground Floor, 17, R. Kamani Marg, Ballard Estate, Mumbai 400 001 Email: [email protected] Phone No: +91 22 4080 7000 Fax No: +91 22 6631 1776 Investor Grievance Email: [email protected] OTHER DISCLOSURES
Materially significant related party transactions No materially significant related party transactions that may have potential conflict with the interests of the Company at large were reported during FY16.
Details of non-compliance by the Company
The Company has complied with all the requirements of regulatory authorities. No penalties/ strictures were imposed on the Company by the stock exchanges or the SEBI or any statutory authority on any matter relating to the capital market during the last three years.
Whistle-blower mechanismThe Company has adopted the Whistle-blower Policy pursuant to which employees of the Company can raise their concerns relating to malpractices, inappropriate use of funds or any other activity or event which is against the interest of the Company. Further, the mechanism adopted by the Company encourages the employees to report genuine concerns or grievances, and provides for adequate safeguards against victimization of employees who avail of such a mechanism and also provides for direct access to the Chairperson of the Audit Committee, in exceptional cases.
Code of Conduct for prevention of insider tradingIn compliance with the SEBI (Prohibition of Insider Trading) Regulations, 2015 on prevention of insider trading, the Company has adopted a revised Code of Conduct for prevention of Insider Trading to regulate, monitor and report trading; and preserve confidentiality of unpublished price sensitive information to prevent misuse of such information by its employees and other connected persons. The Code of Conduct lays down guidelines which advise them on procedures to be followed and disclosures to be made while dealing with shares of the Company, and cautioning them of the consequences of violations.
Details of compliance with mandatory requirements
The Company is fully compliant with the applicable mandatory requirements of Regulation 34 of SEBI LODR Regulations.
REPORT ON CORPORATE GOVERNANCE (Contd.) REPORT ON CORPORATE GOVERNANCE (Contd.)
Adoption of non-mandatory requirements
Although it is not mandatory, the Board has appointed separate persons for the post of Chairman of the Board [Non-Executive (Independent) Director] and Managing Director and CEO; and the Internal Auditor reports directly to the Audit Committee.
Weblink where policy on dealing with related party transactions
The policy on Related Party Transactions, as approved by the Board, is displayed on the website of the Company at http://www. sksindia.com/downloads/SKS-Related%20Party%20Transaction%20Policy-Version%201-October%2029%202014.pdf.
Compliance certificate regarding compliance of conditions of corporate governance
As required by Schedule V (E) to SEBI LODR Regulations, the Compliance certificate regarding compliance of conditions of corporate governance is annexed to this report.
Disclosures of the compliance with corporate governance requirements specified in regulation 17 to 27 and Regulation 46 (2) (b) to (i) of SEBI LODR Regulations
Particulars Regulation Number Compliance status (Yes/ No/ NA)
Board composition 17(1) YesMeeting of Board of directors 17(2) YesReview of Compliance Reports 17(3) YesPlans for orderly succession for appointments 17(4) YesCode of Conduct 17(5) YesFees/compensation 17(6) YesMinimum Information 17(7) YesCompliance Certificate 17(8) YesRisk Assessment & Management 17(9) YesPerformance Evaluation of Independent Directors 17(10) YesComposition of Audit Committee 18(1) YesMeeting of Audit Committee 18(2) YesComposition of Nomination & Remuneration Committee 19(1) & (2) YesComposition of Stakeholders Relationship Committee 20(1) & (2) YesComposition and role of Risk Management Committee 21(1),(2),(3),(4) YesVigil Mechanism 22 YesPolicy for related party Transactions 23(1),(5),(6),(7) & (8) YesPrior or Omnibus approval of Audit Committee for all related party transactions 23(2), (3) NAApproval for material related party transactions 23(4) NAComposition of Board of Directors of unlisted material Subsidiary 24(1) NAOther Corporate Governance requirements with respect to subsidiary of listed entity 24(2),(3),(4),(5) & (6) NAMaximum Directorship & Tenure 25(1) & (2) YesMeeting of independent directors 25(3) & (4) YesFamiliarization of independent directors 25(7) YesMemberships in Committees 26(1) YesAffirmation with compliance to code of conduct from members of Board of Directors and Senior management personnel
26(3) Yes
Disclosure of Shareholding by Non-Executive Directors 26(4) YesPolicy with respect to Obligations of directors and senior management 26(2) & 26(5) YesOther corporate governance requirements 27 YesWebsite 46 (b) to (i) Yes
CEO CERTIFICATION ON CODE OF CONDUCT
I, M. Ramachandra Rao, Managing Director and CEO of the Company, hereby certify that all the Board Members and Senior Managerial Personnel (Core Management Team) have affirmed compliance with the Code of Conduct of the Company laid down by the Board of Directors, for the year ended March 31, 2016.
Sd/-M. R. Rao
Managing Director and CEO

85 86
BHARAT FINANCIAL INCLUSION LIMITED Annual Report 2016 BHARAT FINANCIAL INCLUSION LIMITED Annual Report 2016
Annexure
CORPORATE GOVERNANCE CERTIFICATE
Under Regulation 34(3) read with Schedule V(E) of the Securities and Exchange Board of India (Listing Obligations and Disclosure Requirements) Regulations, 2015
ToThe MembersSKS Microfinance Limited
We have examined all the relevant records of SKS Microfinance Limited (the Company) for the purpose of certifying the compliance of the conditions of Corporate Governance as stipulated under Clause 49 of the erstwhile listing agreements entered with BSE Limited and National Stock Exchange of India Limited for the period commencing from April 01, 2015 till November 30,2015 and under Regulation 17 to 27 and Clauses (b) to (i) of sub-regulation (2) of Regulation 46 of the Securities and Exchange Board of India (Listing Obligations and Disclosure Requirements) Regulations, 2015 for the period commencing from December 01, 2015 and ended on March 31, 2016. We have obtained all the information and explanations which to the best of our knowledge and belief were necessary for the purpose of certification.
The compliance of the conditions of Corporate Governance is the responsibility of the Management. Our examination was limited to the procedures and implementation thereof, adopted by the Company for ensuring the compliance of the conditions of the Corporate Governance. It is neither an audit nor an expression of opinion on the financial statements of the Company.
In our opinion and to the best of our information and according to the explanations given to us, we certify that the Company has complied with the conditions of Corporate Governance as stipulated under Clause 49 of the erstwhile listing agreement entered with BSE Limited and National Stock Exchange of India Limited for the period commencing from April 01, 2015 till November 30, 2015 and under Regulation 17 to 27 and Clauses (b) to (i) of sub-regulation (2) of regulation 46 of the Securities and Exchange Board of India (Listing Obligations and Disclosure Requirements) Regulations, 2015 for the period commencing from December 01, 2015 and ended on March 31, 2016.
This Certificate is neither an assurance as to the future viability of the Company nor of the efficacy or effectiveness with which the Management has conducted the affairs of the Company.
For BS & Company Company Secretaries LLP
Sd/-Place: Hyderabad (Soumya Dafthardar) Date: April 26, 2016 Designated Partner
C. P No. 13199
REPORT ON CORPORATE GOVERNANCE (Contd.) REPORT ON CORPORATE GOVERNANCE (Contd.)
Revised composition of Committees of the Board w.e.f. May 4, 2016
Forum Revised Composition
Chairman Members
Audit Committee Mr. P.H. Ravikumar Mr. S. Balachandran Mr. K. G. AlaiMr. Rajender Mohan Malla
Stakeholders’ Relationship Committee Mr. P. H. Ravikumar Mr. S. BalachandranMr. Geoffrey WoolleyMr. Rajender Mohan Malla
Risk Management Committee Mr. P. H. Ravikumar Mr. S. BalachandranMr. M. R. RaoMr. Rajender Mohan Malla
Nomination & Remuneration Committee Mr. S. Balachandran Mr. Paresh PatelMr. Geoffrey WoolleyDr. Tarun Khanna Dr. Punita Kumar-Sinha
Asset Liability Management Committee Mr. S. Balachandran Mr. P.H. RavikumarMr. M. R. RaoMr. Rajender Mohan Malla

87 88
BHARAT FINANCIAL INCLUSION LIMITED Annual Report 2016 BHARAT FINANCIAL INCLUSION LIMITED Annual Report 2016
INDEPENDENT AUDITORS’ REPORT
To the Members of SKS Microfinance Limited
Report on the Financial Statements
We have audited the accompanying financial statements of ‘SKS Microfinance Limited’ (“the Company”), which comprise the Balance Sheet as at March 31, 2016, the Statement of Profit and Loss and Cash Flow Statement for the year then ended, and a summary of significant accounting policies and other explanatory information.
Management’s Responsibility for the Financial Statements
The Company’s Board of Directors is responsible for the matters stated in Section 134(5) of the Companies Act, 2013 (“the Act”) with respect to the preparation of these financial statements that give a true and fair view of the financial position, financial performance and cash flows of the Company in accordance with accounting principles generally accepted in India, including the Accounting Standards specified under section 133 of the Act, read with Rule 7 of the Companies (Accounts) Rules, 2014. This responsibility also includes maintenance of adequate accounting records in accordance with the provisions of the Act for safeguarding of the assets of the Company and for preventing and detecting frauds and other irregularities; selection and application of appropriate accounting policies; making judgments and estimates that are reasonable and prudent; and the design, implementation and maintenance of adequate internal financial control that were operating effectively for ensuring the accuracy and completeness of the accounting records, relevant to the preparation and presentation of the financial statements that give a true and fair view and are free from material misstatement, whether due to fraud or error.
Auditor’s Responsibility
Our responsibility is to express an opinion on these financial statements based on our audit. We have taken into account the provisions of the Act, the accounting and auditing standards and matters which are required to be included in the audit report under the provisions of the Act and the Rules made thereunder. We conducted our audit in accordance with the Standards on Auditing, issued by the Institute of Chartered Accountants of India, as specified under Section 143(10) of the Act. Those Standards require that we comply with ethical requirements and plan and perform the audit to obtain reasonable assurance about whether the financial statements are free from material misstatement.
An audit involves performing procedures to obtain audit evidence about the amounts and disclosures in the financial statements. The procedures selected depend on the auditor’s judgment, including the assessment of the risks of material misstatement of the financial statements, whether due to fraud or error. In making those risk assessments, the auditor considers internal financial control relevant to the Company’s preparation of the financial statements that give a true and fair view in order to design audit procedures that are appropriate in the circumstances. An audit also includes evaluating the appropriateness of accounting policies used and the reasonableness of the accounting estimates made by the Company’s Directors, as well as evaluating the overall presentation of the financial statements. We believe that the audit evidence we have obtained is sufficient and appropriate to provide a basis for our audit opinion on the financial statements.
Opinion
In our opinion and to the best of our information and according to the explanations given to us, the financial statements give the information required by the Act in the manner so required and give a true and fair view in conformity with the accounting principles generally accepted in India of the state of affairs of the Company as at March 31, 2016, its profit, and its cash flows for the year ended on that date.
Report on Other Legal and Regulatory Requirements
1. As required by the Companies (Auditor’s report) Order, 2016 (“the Order”) issued by the Central Government of India in terms of sub-section (11) of section 143 of the Act, we give in the Annexure 1, a statement on the matters specified in paragraphs 3 and 4 of the Order.
2. As required by section 143 (3) of the Act, we report that:
(a) We have sought and obtained all the information and explanations which to the best of our knowledge and belief were necessary for the purpose of our audit;
(b) In our opinion proper books of account as required by law have been kept by the Company so far as it appears from our examination of those books;
(c) The Balance Sheet, Statement of Profit and Loss, and Cash Flow Statement dealt with by this Report are in agreement with the books of account;
INDEPENDENT AUDITORS’ REPORT
(d) In our opinion, the aforesaid financial statements comply with the Accounting Standards specified under section 133 of the Act, read with Rule 7 of the Companies (Accounts) Rules, 2014;
(e) On the basis of written representations received from the directors as on March 31, 2016, and taken on record by the Board of Directors, none of the directors is disqualified as on March 31, 2016, from being appointed as a director in terms of section 164 (2) of the Act;
(f ) With respect to the adequacy of the internal financial controls over financial reporting of the Company and the operating effectiveness of such controls, refer to our separate Report in Annexure 2 to this report;
(g) With respect to the other matters to be included in the Auditor’s Report in accordance with Rule 11 of the Companies (Audit and Auditors) Rules, 2014, in our opinion and to the best of our information and according to the explanations given to us:
i. The Company has disclosed the impact of pending litigations on its financial position in its financial statements – Refer Note 38 to the financial statements.
ii. The Company did not have any long-term contracts including derivative contracts for which there were any material foreseeable losses.
iii. There were no amounts which were required to be transferred to the Investor Education and Protection Fund by the Company.
For S.R. BATLIBOI & CO. LLPICAI Firm’s Registration Number: 301003E/E300005Chartered Accountants
sd/-per Viren H. MehtaPartnerMembership Number: 048749
HyderabadMay 4, 2016
Annexure referred to in paragraph 1 under the heading “Report on other legal and regulatory requirements” of our report of even date
Re: SKS Microfinance Limited
(i) (a) The Company has maintained proper records showing full particulars, including quantitative details and situation of fixed assets.
(b) Fixed assets have been physically verified by the management during the year and no material discrepancies were identified on such verification.
(c) According to the information and explanations given by the management, there are no immovable properties included in fixed assets of the Company and accordingly the requirements under clasue 3(i)(c) of the Order are not applicable to the Company
(ii) The Company’s business does not involve inventories and, accordingly, the requirements under clasue 3(ii) of the Order are not applicable to the Company and hence not commented upon.
(iii) According to the information and explanations given to us, the Company has not granted any loans, secured or unsecured to companies, firms, Limited Liability Partnerships or other parties covered in the register maintained under section 189 of the Act. Accordingly, the provisions of clause 3 (iii)(a), (b) and (c) of the Order are not applicable to the Company and hence not commented upon.
(iv) In our opinion and according to the information and explanations given to us, there are no loans, investments, guarantees, and securities granted in respect of which provisions of section 185 and 186 of the Act are applicable and hence not commented upon.
(v) The Company has not accepted any deposits from the public.
(vi) To the best of our knowledge and as explained, the Central Government has not specified the maintenance of cost records under section 148(1) of the Act, for the products/services of the Company.
(vii) (a) The Company is generally regular in depositing with appropriate authorities undisputed statutory dues including provident fund, employees’ state insurance, income-tax, sales-tax, service tax, customs duty, excise duty, value added tax, cess and other material statutory dues applicable to it.

89 90
BHARAT FINANCIAL INCLUSION LIMITED Annual Report 2016 BHARAT FINANCIAL INCLUSION LIMITED Annual Report 2016
According to the information and explanations given to us, no undisputed amounts payable in respect of provident fund, employees’ state insurance, income-tax, service tax, sales-tax, duty of custom, duty of excise, value added tax, cess and other material statutory dues were outstanding, at the year end, for a period of more than six months from the date they became payable.
(b) According to the records of the Company, the dues outstanding of income-tax, sales-tax, service tax, duty of custom, duty of excise, value added tax and cess on account of any dispute, are as follows:
Name of the Statute Nature of dues
Amount under dispute (`)
Amount paid (`)
Period to which its relates
Forum where dispute is pending
Income tax Act, 1961 Income tax 77,927,037 53,837,948 Assessment Years 2010-11 and 2012-13
The Commissioner of Income Tax (Appeals)
Chapter V of the Finance Act, 1994
Service Tax 654,845,273* 44,574,205** Financial years 2006-07 to 2013-14
Customs Excise & Service Tax Appellate Tribunal (‘CESTAT’)
* Excluding interest and penalty, as applicable.
**The Company has paid this amount under protest
(viii) In our opinion and according to the information and explanations given by the management, the Company has not defaulted in repayment of dues to a financial institution, bank, debenture holders or government.
(ix) According to the information and explanations given by the management, the Company has not raised any money by way of initial public offer or further public offer, hence not commented upon.
Further, monies raised by the Company by way of term loans were applied for the purpose for which those were raised, though idle/surplus funds which were not required for immediate utilization were gainfully invested in liquid assets payable on demand.
(x) Based upon the audit procedures performed for the purpose of reporting the true and fair view of the financial statements and according to the information and explanations given by the management, we report that no material fraud by the Company or on the Company by the officers and employees of the Company has been noticed or reported during the year.
(xi) According to the information and explanations given by the management, the managerial remuneration has been paid and provided in accordance with the requisite approvals mandated by the provisions of section 197, read with Schedule V to the Act.
(xii) In our opinion, the Company is not a nidhi company. Therefore, the provisions of clause 3(xii) of the Order are not applicable to the Company and hence not commented upon.
(xiii) According to the information and explanations given by the management, transactions with the related parties are in compliance with section 177 and 188 of the Act where applicable and the details have been disclosed in the notes to the financial statements, as required by the applicable accounting standards.
(xiv) According to the information and explanations given to us and on an overall examination of the balance sheet, the Company has not made any preferential allotment or private placement of shares or fully or partly convertible debentures during the year and hence, reporting requirements under clause 3(xiv) are not applicable to the Company and, not commented upon.
(xv) According to the information and explanations given by the management, the Company has not entered into any non-cash transactions with directors or persons connected with him.
(xvi) According to the information and explanations given to us, we report that the Company has registered as required, under section 45-IA of the Reserve Bank of India Act, 1934.
For S.R. BATLIBOI & CO. LLPICAI Firm’s Registration Number: 301003E/E300005Chartered Accountants
sd/-per Viren H. MehtaPartnerMembership Number: 048749
HyderabadMay 4, 2016
INDEPENDENT AUDITORS’ REPORT
Annexure referred to in paragraph 2 (f) under the heading “Report on other legal and regulatory requirements” of our report of even date
Report on Internal Financial Controls under Clause (i) of Sub-section 3 of Section 143 of the ActTo the Members of SKS Microfinance Limited We have audited the internal financial controls over financial reporting of SKS Microfinance Limited (“the Company”) as of March 31, 2016 in conjunction with our audit of the standalone financial statements of the Company for the year ended on that date.
Management’s Responsibility for Internal Financial ControlsThe Company’s Management is responsible for establishing and maintaining internal financial controls based on the internal control over financial reporting criteria established by the Company considering the essential components of internal control stated in the Guidance Note on Audit of Internal Financial Controls Over Financial Reporting issued by the Institute of Chartered Accountants of India. These responsibilities include the design, implementation and maintenance of adequate internal financial controls that were operating effectively for ensuring the orderly and efficient conduct of its business, including adherence to the Company’s policies, the safeguarding of its assets, the prevention and detection of frauds and errors, the accuracy and completeness of the accounting records, and the timely preparation of reliable financial information, as required under the Act.
Auditor’s ResponsibilityOur responsibility is to express an opinion on the Company’s internal financial controls over financial reporting based on our audit. We conducted our audit in accordance with the Guidance Note on Audit of Internal Financial Controls Over Financial Reporting (the “Guidance Note”) and the Standards on Auditing as specified under section 143(10) of the Act, to the extent applicable to an audit of internal financial controls, both applicable to an audit of Internal Financial Controls and, both issued by the Institute of Chartered Accountants of India. Those Standards and the Guidance Note require that we comply with ethical requirements and plan and perform the audit to obtain reasonable assurance about whether adequate internal financial controls over financial reporting was established and maintained and if such controls operated effectively in all material respects.
Our audit involves performing procedures to obtain audit evidence about the adequacy of the internal financial controls system over financial reporting and their operating effectiveness. Our audit of internal financial controls over financial reporting included obtaining an understanding of internal financial controls over financial reporting, assessing the risk that a material weakness exists, and testing and evaluating the design and operating effectiveness of internal control based on the assessed risk. The procedures selected depend on the auditor’s judgement, including the assessment of the risks of material misstatement of the financial statements, whether due to fraud or error.
We believe that the audit evidence we have obtained is sufficient and appropriate to provide a basis for our audit opinion on the internal financial controls system over financial reporting.
Meaning of Internal Financial Controls Over Financial Reporting A company’s internal financial control over financial reporting is a process designed to provide reasonable assurance regarding the reliability of financial reporting and the preparation of financial statements for external purposes in accordance with generally accepted accounting principles. A company’s internal financial control over financial reporting includes those policies and procedures that (1) pertain to the maintenance of records that, in reasonable detail, accurately and fairly reflect the transactions and dispositions of the assets of the company; (2) provide reasonable assurance that transactions are recorded as necessary to permit preparation of financial statements in accordance with generally accepted accounting principles, and that receipts and expenditures of the company are being made only in accordance with authorisations of management and directors of the company; and (3) provide reasonable assurance regarding prevention or timely detection of unauthorised acquisition, use, or disposition of the company’s assets that could have a material effect on the financial statements.
Inherent Limitations of Internal Financial Controls Over Financial ReportingBecause of the inherent limitations of internal financial controls over financial reporting, including the possibility of collusion or improper management override of controls, material misstatements due to error or fraud may occur and not be detected. Also, projections of any evaluation of the internal financial controls over financial reporting to future periods are subject to the risk that the internal financial control over financial reporting may become inadequate because of changes in conditions, or that the degree of compliance with the policies or procedures may deteriorate.
OpinionIn our opinion, the Company has, in all material respects, an adequate internal financial controls system over financial reporting and such internal financial controls over financial reporting were operating effectively as at March 31, 2016, based on the internal control over financial reporting criteria established by the Company considering the essential components of internal control stated in the Guidance Note on Audit of Internal Financial Controls Over Financial Reporting issued by the Institute of Chartered Accountants of India.
For S.R. BATLIBOI & CO. LLPICAI Firm’s Registration Number: 301003E/E300005Chartered Accountants
sd/-per Viren H. MehtaPartnerMembership Number: 048749
HyderabadMay 4, 2016
INDEPENDENT AUDITORS’ REPORT

91 92
BHARAT FINANCIAL INCLUSION LIMITED Annual Report 2016 BHARAT FINANCIAL INCLUSION LIMITED Annual Report 2016
BALANCE SHEETAS AT MARCH 31, 2016
As per our report of even date For S. R. BATLIBOI & CO. LLP For and on behalf of the Board of Directors of ICAI Firm registration number : 301003E/E300005 SKS Microfinance LimitedChartered Accountants
sd/- sd/- sd/- per Viren H. Mehta P. H. Ravikumar M. R. Rao Partner Non-Executive Chairman Managing Director and Chief Executive OfficerMembership No.048749 sd/- sd/- S. Dilli Raj Ashish Damani President Chief Financial Officer sd/- Rajendra Patil Company Secretary Date: May 4, 2016Place : Hyderabad Place: Hyderabad
As per our report of even date For S. R. BATLIBOI & CO. LLP For and on behalf of the Board of Directors of ICAI Firm registration number : 301003E/E300005 SKS Microfinance LimitedChartered Accountants
sd/- sd/- sd/- per Viren H. Mehta P. H. Ravikumar M. R. Rao Partner Non-Executive Chairman Managing Director and Chief Executive OfficerMembership No.048749 sd/- sd/- S. Dilli Raj Ashish Damani President Chief Financial Officer sd/- Rajendra Patil Company Secretary Date : May 4, 2016Place : Hyderabad Place: Hyderabad
(Amount in ` unless otherwise stated)
Notes
As at 31st March, 2016
As at 31st March, 2015
EQUITY AND LIABILITIESSHAREHOLDERS' FUNDS Share Capital 3 1,273,111,060 1,262,924,930 Reserves and Surplus 4 12,556,839,779 9,201,633,570
13,829,950,839 10,464,558,500
Share application money pending allotment 5 24,546 64,800 NON-CURRENT LIABILITIES Long Term Borrowings 6 22,687,374,496 10,572,211,910 Long-Term Provisions 7 208,926,876 127,184,909
22,896,301,372 10,699,396,819 CURRENT LIABILITIES Short -Term Borrowings 8 6,443,173,705 6,096,276,475 Other Current Liabilities 9 27,607,034,440 19,271,887,706 Short-Term Provisions 7 760,527,095 455,073,842
34,810,735,240 25,823,238,023 TOTAL 71,537,011,997 46,987,258,142
ASSETSNON-CURRENT ASSETS Fixed Assets Tangible Assets 10 114,164,875 51,505,818 Intangible assets 11 36,147,887 38,019,928
Intangible assets under development 14,215,576 12,447,576 Non-Current Investments 12 2,000,000 2,000,000 Deferred Tax Assets 13 - - Long-Term Loans and Advances 14 4,135,391,693 2,448,460,510 Other Non-Current Assets 15 1,792,671,537 1,252,264,079
6,094,591,568 3,804,697,911 CURRENT ASSETS Trade Receivables 16 63,682,166 34,169,498 Cash And Bank Balances 17 17,662,827,632 15,367,730,515 Short Term Loans and Advances 14 46,080,225,445 27,135,519,718 Other Current Assets 15 1,635,685,186 645,140,500
65,442,420,429 43,182,560,231 TOTAL 71,537,011,997 46,987,258,142 Summary of significant accounting policies 2.1The accompanying notes are an integral part of the financial statements
STATEMENT OF PROFIT AND LOSSFOR THE YEAR ENDED MARCH 31, 2016
(Amount in ` unless otherwise stated)
Notes 31-Mar-16 31-Mar-15
Income
Revenue from Operations 18 11,691,340,741 7,239,568,175
Other Income 19 1,515,387,250 791,088,168
Total revenue (I) 13,206,727,991 8,030,656,343
Expenses
Employee Benefits Expenses 20 2,923,691,210 2,318,537,910
Finance Costs 21 4,845,734,781 2,790,451,852
Other expenses 22 1,028,320,971 839,933,356
Depreciation and Amortization Expense 23 83,643,995 45,612,324
Provisions and write-offs 24 386,414,751 100,456,998
Total expenses (II) 9,267,805,708 6,094,992,440
Profit before tax (III)=(I)-(II) 3,938,922,283 1,935,663,903
Tax expenses
Current tax (MAT) 909,107,324 59,416,387
Excess provision of tax relating to earlier years (net) - (395,920)
Total tax expense (IV) 909,107,324 59,020,467
Profit after tax (III)-(IV) 3,029,814,959 1,876,643,436
Earnings per equity share [Nominal value of share ` 10 (March 31, 2015: `10)]
25
Basic (Computed on the basis of total profit for the year) 23.90 15.22
Diluted (Computed on the basis of total profit for the year) 23.58 15.04
Summary of significant accounting policies
The accompanying notes are an integral part of the financial statements 2.1

93 94
BHARAT FINANCIAL INCLUSION LIMITED Annual Report 2016 BHARAT FINANCIAL INCLUSION LIMITED Annual Report 2016
CASH FLOW STATEMENT FOR THE YEAR ENDED MARCH 31, 2016
(Amount in ` unless otherwise stated)
31-Mar-16 31-Mar-15
Cash Flows from Operating Activities
Profit before tax 3,938,922,283 1,935,663,903
Adjustments to reconcile profit before tax to net cash flows:
Interest on shortfall in payment of advance income tax - 6,078,501
Depreciation and amortization 83,643,995 45,612,324
Provision for employee benefits 66,929,670 38,271,997
(Profit) / loss on sale of fixed assets (770,575) (495,322)
Stock option expenditure 110,277,578 106,334,775
Contingent provision against standard assets 193,565,814 120,947,422
Provision for non-performing assets 11,779,202 (1,779,602,571)
Portfolio loans and other balances written off 63,790,855 1,756,038,528
Provision and loss on securitized / managed portfolio 117,278,880 3,073,619
Other provisions and write offs 46,610,003 31,987,634
Operating profit before working capital changes 4,632,027,705 2,263,910,810
Movements in working capital :
Increase / (decrease) in other current liabilities 2,296,379,913 318,995,725
Decrease / (increase) in trade receivables (29,512,668) (8,441,113)
Decrease / (increase) in loans and advances (20,722,045,769) (13,842,075,260)
Decrease / (increase) in other current assets (990,544,686) (66,006,058)
Decrease / (increase) in other non-current assets (7,594,852) (18,047,435)
Decrease / (increase) in Margin money deposit (net) (599,304,704) 346,150,233
Cash generated from / (used in) operations (15,420,595,061) (11,005,513,098)
Direct taxes paid (net of refunds) (927,191,189) (111,955,405)
Net cash flow from / (used in) operating activities (A) (16,347,786,250) (11,117,468,503)
CASH FLOW STATEMENT FOR THE YEAR ENDED MARCH 31, 2016
31-Mar-16 31-Mar- 15
Cash flows from investing activities
Purchase of fixed assets, including capital work in progress and capital advances (148,670,507) (47,715,256)
Proceeds from sale of fixed assets 1,333,938 1,629,929
Net cash flow from / (used in) investing activities (B) (147,336,569) (46,085,327)
Cash Flows from Financing Activities
Proceeds from issuance of equity share capital (including share application money) 225,259,548 4,047,790,428
Share issue expenses - (147,473,658)
Long-term borrowings (net) (including non-convertible debentures) 18,151,571,060 14,712,974,343
Short-term borrowings (net) (including commercial paper) 346,897,230 2,772,771,723
Net cash flow from / (used in) financing activities (C) 18,723,727,838 21,386,062,836
Net increase / (decrease) in cash and cash equivalents (A + B + C) 2,228,605,019 10,222,509,006
Cash and cash equivalents at the beginning of the year 14,374,638,127 4,152,129,121
Cash and cash equivalents at the end of the year (refer note 17) 16,603,243,146 14,374,638,127
Summary of significant accounting policies 2.1
The accompanying notes are an integral part of the financial statements
(Amount in ` unless otherwise stated)
As per our report of even date For S. R. BATLIBOI & CO. LLP For and on behalf of the Board of Directors of ICAI Firm registration number : 301003E/E300005 SKS Microfinance LimitedChartered Accountants
sd/- sd/- sd/- per Viren H. Mehta P. H. Ravikumar M. R. Rao Partner Non-Executive Chairman Managing Director and Chief Executive OfficerMembership No.048749 sd/- sd/- S. Dilli Raj Ashish Damani President Chief Financial Officer sd/- Rajendra Patil Company Secretary Date : May 4, 2016Place : Hyderabad Place: Hyderabad

95 96
BHARAT FINANCIAL INCLUSION LIMITED Annual Report 2016 BHARAT FINANCIAL INCLUSION LIMITED Annual Report 2016
NOTES TO FINANCIAL STATEMENTS FOR THE YEAR ENDED MARCH 31, 2016
1. Corporate information
SKS Microfinance Limited (‘the Company’) is a public company domiciled in India and incorporated under the provision of the Companies Act, 1956. The Company was registered as a non-deposit accepting Non-Banking Financial Company (‘NBFC-ND’) with the Reserve Bank of India (‘RBI’) and has got classified as a Non-Banking Financial Company – Micro Finance Institution (‘NBFC-MFI’) with effect from November 18, 2013. Its shares are listed on two stock exchanges in India.
The Company is engaged primarily in providing micro finance services to women in the rural areas of India who are enrolled as members and organized as Joint Liability Groups (‘JLG’). The Company has its operation spread across 18 states.
In addition to the core business of providing micro-credit, the Company uses its distribution channel to provide other financialproducts and services to the members. Programs in this regard primarily relate to providing of loans to the members for the purchase of certain productivity-enhancing products such as mobile handsets, solar lamps, bicycle, sewing machines etc.
2. Basis of preparation
The financial statements of the Company have been prepared in accordance with generally accepted accounting principles in India (Indian GAAP). The Company has prepared these financial statements to comply in all material respects with the Accounting Standards notified under section 133 of the Companies Act, 2013 (‘the Act’), read together with rule 7 of the Companies (Accounts) Rules, 2014 and the provisions of the RBI as applicable to a NBFC-MFI and Systemically Important NBFC-ND. The financial statements have been prepared on an accrual basis and under the historical cost convention except as detailed in note 2.1 (b).
The accounting policies adopted in the preparation of financial statements are consistent with those of previous year.
2.1. Summary of significant accounting policies
a. Use of estimates
The preparation of financial statements in conformity with Indian GAAP requires the management to make judgments, estimates and assumptions that affect the reported amounts of revenues, expenses, assets and liabilities and the disclosure of contingent liabilities, at the end of the reporting period. Although these estimates are based on the management’s best knowledge of current events and actions, uncertainty about these assumptions and estimates could result in the outcomes requiring a material adjustment to the carrying amounts of assets or liabilities in future periods.
b. Revenue recognition
Revenue is recognised to the extent that it is probable that the economic benefits will flow to the Company and the revenue can be reliably measured.
i. Interest income on loans given is recognised under the internal rate of return method. Income or any other charges on non-performing asset is recognised only when realised and any such income recognised before the asset became non-performing and remaining unrealised is reversed.
ii. Interest income on deposits with banks is recognised on a time proportion accrual basis taking into account the amount outstanding and the interest rate applicable.
iii. Loan processing fees are amortised over the tenure of the loan on straight-line basis.
iv. Profit / premium arising at the time of securitization / assignment of loan portfolio is amortised over the life of the underlying loan portfolio / securities and any loss arising therefrom is accounted for immediately. Income from interest strip(excess interest spread) is recognized in the statement of profit and loss account net of any losses when redeemed in cash. Interest retained under assignment of loan receivables is recognized on realization basis over the life of the underlying loan portfolio.
v. All other income is recognised on an accrual basis.
c. Tangible fixed assets
All tangible assets are stated at cost net of accumulated depreciation and accumulated impairment losses, if any. The cost comprises purchase price and directly attributable cost of bringing the asset to its working condition for the intended use.
d. Intangible assets
Computer software costs are capitalised and amortised using the written down value method at a rate of 40% per annum. e. Depreciation
Depreciation on tangible fixed assets is provided on the written down value method using the rates arrived at based on useful life of the assets prescribed under Schedule II of the Companies Act, 2013 which is also as per the useful life of the assets estimated by the management
f. Impairment
The Company assesses at each reporting date whether there is an indication that an asset may be impaired. If any indication exists, or when annual impairment testing for an asset is required, the Company estimates the asset’s recoverable amount. An asset’s recoverable amount is the higher of an asset’s net selling price and its value in use. The recoverable amount is determined for an individual asset, unless the asset does not generate cash inflows that are largely independent of those from other assets or groups of assets. Where the carrying amount of an asset exceeds its recoverable amount, the asset is considered impaired and is written down to its recoverable amount. In assessing value in use, the estimated future cash flows are discounted to their present value using a pre-tax discount rate that reflects current market assessments of the time value of money and the risks specific to the asset. In determining net selling price, recent market transactions are taken into account, if available. If no such transactions can be identified, an appropriate valuation model is used.
After impairment, depreciation is provided on the revised carrying amount of the asset over its remaining useful life.
g. Leases (where the Company is the lessee)
Finance leases, which effectively transfer to the Company substantially all the risks and benefits incidental to ownership of the leased item, are capitalised at the lower of the fair value of the leased property and present value of the minimum lease payments at the inception of the lease term and disclosed as leased assets. Lease payments are apportioned between the finance charges and reduction of the lease liability based on the implicit rate of return. Finance charges are recognised as finance costs in the statement of profit and loss. Lease management fees, legal charges and other initial direct costs are capitalised. A leased asset is depreciated on a straight-line basis over the useful life of the asset. However, if there is no reasonable certainty that the company will obtain the ownership by the end of the lease term, the capitalized asset is depreciated on a straight-line basis over the shorter of the estimated useful life of the asset or the lease term.
Leases where the lessor effectively retains, substantially all the risks and benefits of ownership of the leased item, are classified as operating leases. Operating lease payments are recognised as an expense in the statement of profit and loss on a straight-line basis over the lease term.
h. Investments
Investments which are readily realisable and intended to be held for not more than one year from the date on which such investments are made, are classified as current investments. All other investments are classified as long-term investments. Current investments are carried in the financial statement at lower of cost and fair value determined on an individual investment basis. Long-term investments are carried at cost. However, provision for diminution in value is made to recognise a decline other than temporary in the value of the investments. On disposal of an investment, the difference between the carrying amount and net disposal proceeds are charged or credited to the statement of profit and loss.
NOTES TO FINANCIAL STATEMENTS FOR THE YEAR ENDED MARCH 31, 2016 (Contd.)

97 98
BHARAT FINANCIAL INCLUSION LIMITED Annual Report 2016 BHARAT FINANCIAL INCLUSION LIMITED Annual Report 2016
i. Borrowing costs
Borrowing cost includes interest and other costs incurred in connection with the arrangement of borrowings. All borrowing costs are expensed in the period they occur.
j. Foreign currency transactions
i. All transactions in foreign currency are recognised at the exchange rate prevailing on the date of the transaction.
ii. Foreign currency monetary items are reported using the exchange rate prevailing at the close of the financial year.
iii. Exchange differences arising on the settlement of monetary items or on the restatement of Company’s monetary items at rates different from those at which they were initially recorded during the year, or reported in previous financial statements, are recognised as income or as expenses in the year in which they arise.
k. Retirement and other employee benefits
i. Retirement benefit in the form of provident fund is a defined contribution scheme. The Company has no obligation, other than the contribution payable to the provident fund. The Company recognizes contribution payable to the provident fund scheme as an expenditure, when an employee renders the related service.
ii. Gratuity liability is a defined benefit obligation and is provided for on the basis of an actuarial valuation on projected unit credit method made at the end of each financial year. Actuarial gains and losses for defined benefit plans are recognized in full in the period in which they occur in the statement of profit and loss.
iii. The Company treats accumulated leave expected to be carried forward beyond twelve months, as long-term employee benefit for measurement purposes. Such long-term compensated absences are provided for based on the actuarial valuation using the projected unit credit method at the year-end. Actuarial gains/losses are immediately taken to the statement of profit and loss and are not deferred. The Company presents the leave as a current liability in the balance sheet, to the extent it does not have an unconditional right to defer its settlement for 12 months after the reporting date.
iv. Accumulated leave, which is expected to be utilised within the next 12 months, is treated as short-term employee benefit. The Company measures the expected cost of such absences as the additional amount that it expects to pay as a result of the unused entitlement that has accumulated at the reporting date.
v. The Company recognizes termination benefit as a liability and an expense when the Company has a present obligation as a result of past event, it is probable that an outflow of resources embodying economic benefits will be required to settle the obligation and a reliable estimate can be made of the amount of the obligation.
l. Income taxes
i. Tax expense comprises current and deferred tax. Current income tax is measured at the amount expected to be paid to the tax authorities in accordance with the Income Tax Act, 1961, enacted in India. The tax rates and tax laws used to compute the amount are those that are enacted or substantively enacted, at the reporting date. Current income tax relating to items recognised directly in equity is recognised in equity and not in the statement of profit and loss.
ii. Deferred income taxes reflect the impact of timing differences between taxable income and accounting income originating during the current year and reversal of timing differences for the earlier years. Deferred tax is measured using the tax rates and the tax laws enacted or substantively enacted at the reporting date. Deferred income tax relating to items recognised directly in equity is recognised in equity and not in the statement of profit and loss.
iii. Deferred tax liabilities are recognised for all taxable timing differences. Deferred tax assets are recognised for deductible timing differences only to the extent that there is reasonable certainty that sufficient future taxable income will be available against which such deferred tax assets can be realised. In situations where the Company has unabsorbed depreciation or carry forward tax losses, all deferred tax assets are recognised only if there is virtual certainty supported by convincing evidence that they can be realised against future taxable profits.
NOTES TO FINANCIAL STATEMENTS FOR THE YEAR ENDED MARCH 31, 2016 (Contd.)
iv. The carrying amount of deferred tax assets are reviewed at each reporting date. The Company writes-down the carrying amount of deferred tax asset to the extent that it is no longer reasonably certain or virtually certain, as the case may be, that sufficient future taxable income will be available against which deferred tax asset can be realised. Any such write-down is reversed to the extent that it becomes reasonably certain or virtually certain, as the case may be, that sufficient future taxable income will be available.
v. Minimum alternate tax (MAT) paid in a year is charged to the statement of profit and loss as current tax. The Company recognizes MAT credit available as an asset only to the extent that there is convincing evidence that the Company will pay normal income tax during the specified period, i.e., the period for which MAT credit is allowed to be carried forward. In the year in which the Company recognizes MAT credit as an asset in accordance with the Guidance Note on Accounting for Credit Available in respect of Minimum Alternative Tax under the Income-tax Act, 1961, the said asset is created by way of credit to the statement of profit and loss and shown as “MAT Credit Entitlement.” The Company reviews the MAT Credit Entitlement asset at each reporting date and writes down the asset to the extent the Company does not have convincing evidence that it will pay normal tax during the specified period.
m. Earnings per share
Basic earnings per share are calculated by dividing the net profit or loss for the year attributable to equity shareholders by the weighted average number of equity shares outstanding during the year. Partly paid equity shares are treated as fraction of an equity share to the extent that they were entitled to participate in dividends related to a fully paid equity share during the reporting year.
For the purpose of calculating diluted earnings per share, the net profit or loss for the year attributable to equity shareholders and the weighted average number of shares outstanding during the year are adjusted for the effects of all dilutive potential equity shares.
n. Provisions
A provision is recognised when the Company has a present obligation as a result of past event, it is probable that an outflow of resources embodying economic benefits will be required to settle the obligation and a reliable estimate can be made of the amount of the obligation. Provisions are not discounted to their present value and are determined based on the best estimate required to settle the obligation at the reporting date. These estimates are reviewed at each reporting date and adjusted to reflect the current best estimates.
o. Contingent liabilities
A contingent liability is a possible obligation that arises from past events whose existence will be confirmed by the occurrence or non-occurrence of one or more uncertain future events beyond the control of the Company or a present obligation that is not recognised because it is not probable that an outflow of resources will be required to settle the obligation. A contingent liability also arises in extremely rare cases where there is a liability that cannot be recognised because it cannot be measured reliably. The Company does not recognise a contingent liability but discloses its existence in the financial statements.
p. Cash and cash equivalents
Cash and cash equivalents for the purpose of cash flow statement comprise cash in hand and cash at bank and short-term investments with an original maturity of three months or less.
q. Share based payments
In case of stock option plan, measurement and disclosure of the employee share-based payment plans is done in accordance with Securities and Exchange Board of India (Share Based Employee Benefits) Regulations, 2014 and the Guidance Note on Accounting for Employee Share-based Payments, issued by the Institute of Chartered Accountants of India. The Company measures compensation cost relating to employee stock options using the fair value method. Compensation expense is amortised over the vesting period of the option on the straight line basis.
NOTES TO FINANCIAL STATEMENTS FOR THE YEAR ENDED MARCH 31, 2016 (Contd.)

99 100
BHARAT FINANCIAL INCLUSION LIMITED Annual Report 2016 BHARAT FINANCIAL INCLUSION LIMITED Annual Report 2016
r. Classification of loan portfolio
i. Portfolio loans are classified as follows
Asset classification Arrear period
Standard assets Overdue for less than 8 weeks
Non-performing assets
Sub-standard assets Overdue for more than 8 weeks and upto 25 weeks
Loss assets Overdue for more than 25 weeks
“Overdue” refers to interest and / or installment remaining unpaid from the day it became receivable.
The above classification is in compliance with Non-Banking Financial Company – Micro Finance Institutions (NBFC-MFIs) Directions, dated December 02, 2011, as amended from time to time (‘the NBFC-MFI Directions’).
ii. Loans and advances other than portfolio loans are classified as standard, sub-standard, doubtful and loss assets in accordance with the Systemically Important Non – Banking financial (Non-Deposit Accepting or Holding) Companies Prudential Norms (Reserve Bank) Directions, 2015 issued vide Notification No. DNBR. 009/ CGM (CDS) -2015 dated March 27, 2015 (‘the NBFC-ND-SI Prudential Norms’).
s. Provisioning policy for Loan portfolio
i. Provisioning policy for loan portfolio:
Asset Classification Arrear period Provisioning percentage
Standard assets Overdue for less than 8 weeks Refer note 1 and 2
Sub-standard assets Overdue for more than 8 weeks and upto 25 weeks 50%
Loss assets Overdue for more than 25 weeks Written off
Note 1: The above mentioned provision for standard assets is linked to the Portfolio at Risk (PAR) as shown below:
Portfolio at Risk Provisioning percentage (% of Standard Assets)
0 – 1% 0.30%
Above 1% to 1.5% 0.50%
Above 1.5% to 2% 0.75%
Above 2% 1.00%
Provision on standard assets has been made in line with the NBFC-ND-SI Prudential Norms.
Note 2: The overall provision for portfolio loans determined as per the above mentioned provisioning policy is subject to the provision prescribed in the NBFC-MFI Directions. These Directions require the total provision for portfolio loans to be higher of (a) 1% of the outstanding loan portfolio or (b) 50% of the aggregate loan installments which are overdue for more than 90 days and less than 180 days and 100% of the aggregate loan installments which are overdue for 180 days or more.
Such additional provision created in order to comply with the NBFC-MFI Directions is classified and disclosed in the Balance Sheet alongwith the contingent provision for standard assets.
ii. Loans and advances other than portfolio loans are provided for at the higher of management estimates and provision required as per the NBFC-ND-SI Prudential Norms.
iii. Provision on securitized / managed portfolio is made as per the Company’s provisioning policy for portfolio loans mentioned in (i) above net of losses, if any and subject to the maximum guarantee given in respect of these arrangements.
iv. All overdue loans, where the tenure of the loan is completed and in the opinion of the management any amount is not recoverable, are written off.
NOTES TO FINANCIAL STATEMENTS FOR THE YEAR ENDED MARCH 31, 2016 (Contd.)
(Amount in ` unless otherwise stated)
3. Share capital 31-Mar-16 31-Mar-15
Authorized shares
142,000,000 (March 31, 2015: 142,000,000) equity shares of `10/- each 1,420,000,000 1,420,000,000
13,000,000 (March 31, 2015: 13,000,000) preference shares of `10/- each 130,000,000 130,000,000
Issued, subscribed and fully paid-up shares
127,311,106 (March 31, 2015: 126,292,493) equity shares of `10/- each fully paid up 1,273,111,060 1,262,924,930
Total issued, subscribed and fully paid-up share capital 1,273,111,060 1,262,924,930
(a) Reconciliation of the shares outstanding at the beginning and at the end of the reporting year
Equity shares
31-Mar-16 31-Mar-15
No. of Shares ` No. of Shares `
At the beginning of the year 126,292,493 1,262,924,930 108,212,962 1,082,129,620
Issued during the year – Stock options 1,018,613 10,186,130 408,997 4,089,970
Issued during the year - Qualified Institutional Placement
- - 17,670,534 176,705,340
Outstanding at the end of the year 127,311,106 1,273,111,060 126,292,493 1,262,924,930
(b) Terms/ rights attached to equity shares
The Company has only one class of equity shares having par value of `10 per share. Each holder of equity shares is entitled to one vote per share. Any dividend proposed by the Board of Directors is subject to the approval of the shareholders in the ensuing Annual General Meeting. Dividend declared and paid would be in Indian rupees.
In the event of liquidation of the Company, the holders of equity shares will be entitled to receive remaining assets of the Company, after distribution of all preferential amounts. The distribution will be in proportion to the number of equity shares held by the shareholders.
(c) Aggregate number of shares issued for consideration other than cash during the period of five years immediately preceding the reporting date:
The Company has issued 2,719,961 shares (March 31, 2015: 2,871,772) during the period of five years immediately preceding the reporting date on exercise of options granted under stock option plans wherein part consideration was received in the form of services rendered to the Company.
(d) Details of shareholders holding more than 5% shares in the Company
No shareholder hold more than 5% shares in the Company as at March 31, 2016
NOTES TO FINANCIAL STATEMENTS FOR THE YEAR ENDED MARCH 31, 2016 (Contd.)
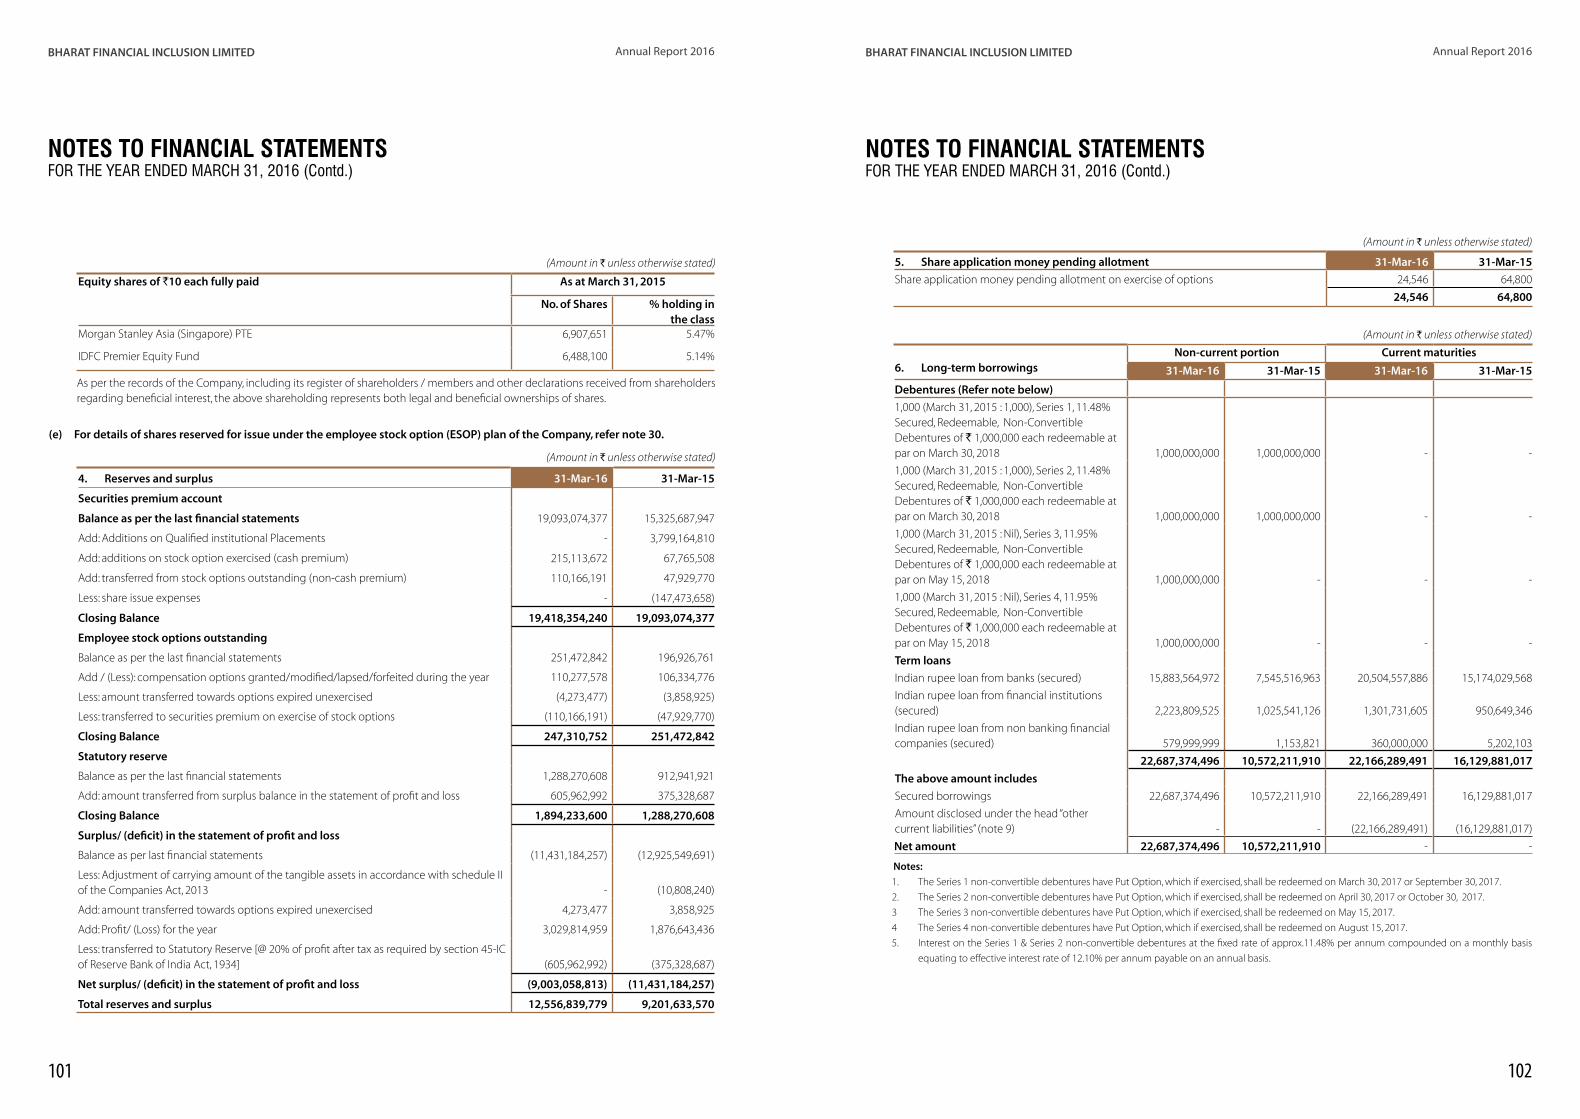
101 102
BHARAT FINANCIAL INCLUSION LIMITED Annual Report 2016 BHARAT FINANCIAL INCLUSION LIMITED Annual Report 2016
(Amount in ` unless otherwise stated)
Equity shares of `10 each fully paid As at March 31, 2015
No. of Shares % holding in the class
Morgan Stanley Asia (Singapore) PTE 6,907,651 5.47%
IDFC Premier Equity Fund 6,488,100 5.14%
As per the records of the Company, including its register of shareholders / members and other declarations received from shareholders regarding beneficial interest, the above shareholding represents both legal and beneficial ownerships of shares.
(e) For details of shares reserved for issue under the employee stock option (ESOP) plan of the Company, refer note 30.
(Amount in ` unless otherwise stated)
4. Reserves and surplus 31-Mar-16 31-Mar-15
Securities premium account
Balance as per the last financial statements 19,093,074,377 15,325,687,947
Add: Additions on Qualified institutional Placements - 3,799,164,810
Add: additions on stock option exercised (cash premium) 215,113,672 67,765,508
Add: transferred from stock options outstanding (non-cash premium) 110,166,191 47,929,770
Less: share issue expenses - (147,473,658)
Closing Balance 19,418,354,240 19,093,074,377
Employee stock options outstanding
Balance as per the last financial statements 251,472,842 196,926,761
Add / (Less): compensation options granted/modified/lapsed/forfeited during the year 110,277,578 106,334,776
Less: amount transferred towards options expired unexercised (4,273,477) (3,858,925)
Less: transferred to securities premium on exercise of stock options (110,166,191) (47,929,770)
Closing Balance 247,310,752 251,472,842
Statutory reserve
Balance as per the last financial statements 1,288,270,608 912,941,921
Add: amount transferred from surplus balance in the statement of profit and loss 605,962,992 375,328,687
Closing Balance 1,894,233,600 1,288,270,608
Surplus/ (deficit) in the statement of profit and loss
Balance as per last financial statements (11,431,184,257) (12,925,549,691)
Less: Adjustment of carrying amount of the tangible assets in accordance with schedule II of the Companies Act, 2013 - (10,808,240)
Add: amount transferred towards options expired unexercised 4,273,477 3,858,925
Add: Profit/ (Loss) for the year 3,029,814,959 1,876,643,436
Less: transferred to Statutory Reserve [@ 20% of profit after tax as required by section 45-IC of Reserve Bank of India Act, 1934] (605,962,992) (375,328,687)
Net surplus/ (deficit) in the statement of profit and loss (9,003,058,813) (11,431,184,257)
Total reserves and surplus 12,556,839,779 9,201,633,570
NOTES TO FINANCIAL STATEMENTS FOR THE YEAR ENDED MARCH 31, 2016 (Contd.)
(Amount in ` unless otherwise stated)
5. Share application money pending allotment 31-Mar-16 31-Mar-15
Share application money pending allotment on exercise of options 24,546 64,800
24,546 64,800
(Amount in ` unless otherwise stated)
6. Long-term borrowings
Non-current portion Current maturities
31-Mar-16 31-Mar-15 31-Mar-16 31-Mar-15
Debentures (Refer note below)
1,000 (March 31, 2015 : 1,000), Series 1, 11.48% Secured, Redeemable, Non-Convertible Debentures of ` 1,000,000 each redeemable at par on March 30, 2018 1,000,000,000 1,000,000,000 - -
1,000 (March 31, 2015 : 1,000), Series 2, 11.48% Secured, Redeemable, Non-Convertible Debentures of ` 1,000,000 each redeemable at par on March 30, 2018 1,000,000,000 1,000,000,000 - -
1,000 (March 31, 2015 : Nil), Series 3, 11.95% Secured, Redeemable, Non-Convertible Debentures of ` 1,000,000 each redeemable at par on May 15, 2018 1,000,000,000 - - -
1,000 (March 31, 2015 : Nil), Series 4, 11.95% Secured, Redeemable, Non-Convertible Debentures of ` 1,000,000 each redeemable at par on May 15, 2018 1,000,000,000 - - -
Term loans
Indian rupee loan from banks (secured) 15,883,564,972 7,545,516,963 20,504,557,886 15,174,029,568
Indian rupee loan from financial institutions (secured) 2,223,809,525 1,025,541,126 1,301,731,605 950,649,346
Indian rupee loan from non banking financial companies (secured) 579,999,999 1,153,821 360,000,000 5,202,103
22,687,374,496 10,572,211,910 22,166,289,491 16,129,881,017
The above amount includes
Secured borrowings 22,687,374,496 10,572,211,910 22,166,289,491 16,129,881,017
Amount disclosed under the head “other current liabilities” (note 9) - - (22,166,289,491) (16,129,881,017)
Net amount 22,687,374,496 10,572,211,910 - -
Notes:
1. The Series 1 non-convertible debentures have Put Option, which if exercised, shall be redeemed on March 30, 2017 or September 30, 2017.
2. The Series 2 non-convertible debentures have Put Option, which if exercised, shall be redeemed on April 30, 2017 or October 30, 2017.
3 The Series 3 non-convertible debentures have Put Option, which if exercised, shall be redeemed on May 15, 2017.
4 The Series 4 non-convertible debentures have Put Option, which if exercised, shall be redeemed on August 15, 2017.
5. Interest on the Series 1 & Series 2 non-convertible debentures at the fixed rate of approx.11.48% per annum compounded on a monthly basis
equating to effective interest rate of 12.10% per annum payable on an annual basis.
NOTES TO FINANCIAL STATEMENTS FOR THE YEAR ENDED MARCH 31, 2016 (Contd.)

103 104
BHARAT FINANCIAL INCLUSION LIMITED Annual Report 2016 BHARAT FINANCIAL INCLUSION LIMITED Annual Report 2016
(Amount in ` unless otherwise stated)
Nature of security 31-Mar-16 31-Mar-15
a) Loans secured by hypothecation (exclusive charge) of portfolio loans 15,521,602,720 9,236,752,745
b) Loans secured by hypothecation (exclusive charge) of portfolio loans and margin money deposits
29,332,061,267 17,465,340,182
Total outstanding 44,853,663,987 26,702,092,927
6. Long-term borrowings (Contd.)
Terms of repayment of long term borrowings (term loans and non convertible debenture) as on March 31, 2016
Original maturity of loan
Interest rate
Due within1 year
Due between 1 to 2 Years
Due between 2 to 3 Years
Due between 3 to 4 Years
Total No. of install-ments
Amount (in `)
No. of install-ments
Amount (in `)
No. of install-ments
Amount (in `)
No. of install-ments
Amount (in `)
Monthly repayment schedule
1-3 Yrs
9.01%-9.50%
9 107,142,858 12 142,857,142 - - - - 250,000,000 8 200,000,000 12 300,000,000 500,000,000
9.51%-10.00%
9 428,571,423 12 571,428,577 - - - - 1,000,000,000 11 523,809,517 10 476,190,483 - - - - 1,000,000,000
9 428,571,423 12 571,428,577 - - - - 1,000,000,000 12 360,000,000 12 360,000,000 7 220,000,000 - - 940,000,000
10.51%-11.00%
11 80,208,333 12 87,500,000 1 7,291,667 - - 175,000,000 12 500,000,004 10 416,666,662 - - - - 916,666,666 12 249,999,996 11 229,166,671 - - - - 479,166,667 12 249,999,996 12 250,000,004 - - - - 500,000,000 12 571,428,564 7 333,333,342 - - - - 904,761,906 10 666,666,670 12 800,000,004 8 533,333,344 - - 2,000,000,018
11.01%-11.50%
12 333,333,333 6 166,666,667 - - - - 500,000,000 2 285,714,286 - - - - - - 285,714,286
12 90,000,000 7 52,500,000 - - - - 142,500,000 12 1,000,000,000 6 500,000,000 - - - - 1,500,000,000
6 288,000,000 - - - - - - 288,000,000 12 1,565,217,391 5 652,173,913 - - - - 2,217,391,304 12 1,043,478,261 9 782,608,696 - - - - 1,826,086,957
11.51%-12.00%
6 83,333,333 - - - - - - 83,333,333 6 83,333,333 - - - - - - 83,333,333
10 972,222,222 - - - - - - 972,222,222 12 625,000,000 6 312,500,000 - - - - 937,500,000 12 375,000,000 7 218,750,000 - - - - 593,750,000 12 75,000,000 1 6,250,000 - - - - 81,250,000 12 136,363,636 - - - - - - 136,363,636
12.51%-13.00%
12 171,428,571 11 157,142,857 - - - - 328,571,429 12 309,090,909 11 283,333,333 - - - - 592,424,242 12 54,545,455 11 50,000,000 - - - - 104,545,455
2 13,333,333 - - - - - - 13,333,333 2 33,333,333 - - - - - - 33,333,333
NOTES TO FINANCIAL STATEMENTS FOR THE YEAR ENDED MARCH 31, 2016 (Contd.)
NOTES TO FINANCIAL STATEMENTS FOR THE YEAR ENDED MARCH 31, 2016 (Contd.)
Original maturity of loan
Interest rate
Due within1 year
Due between 1 to 2 Years
Due between 2 to 3 Years
Due between 3 to 4 Years
Total No. of install-ments
Amount (in `)
No. of install-ments
Amount (in `)
No. of install-ments
Amount (in `)
No. of install-ments
Amount (in `)
Quarterly repayment schedule
1-3 Yrs
9.51%-10.00% 4 375,000,000 4 375,000,000 - - - - 750,000,000
10.01%-10.50%
4 360,000,000 4 360,000,000 - - - - 720,000,000 4 60,000,000 4 60,000,000 - - - - 120,000,000 2 100,000,000 4 200,000,000 4 200,000,000 - - 500,000,000
10.51%-11.00%
4 500,000,000 2 250,000,000 - - - - 750,000,000 4 200,000,000 4 200,000,000 - - - - 400,000,000 3 545,454,570 4 727,272,760 4 727,272,670 - - 2,000,000,000 4 125,000,000 4 125,000,000 - - - - 250,000,000 2 100,000,000 4 200,000,000 4 200,000,000 - - 500,000,000 4 100,000,000 4 100,000,000 - - - - 200,000,000 4 150,000,000 4 150,000,000 - - - - 300,000,000 4 400,000,000 4 400,000,000 1 100,000,000 - - 900,000,000 4 166,672,000 4 166,672,000 4 166,656,000 - - 500,000,000
11.01%-11.50%
4 727,272,760 4 727,272,760 2 363,636,290 - - 1,818,181,810 4 200,000,000 4 200,000,000 2 100,000,000 - - 500,000,000 4 333,600,000 4 333,600,000 3 249,400,000 - - 916,600,000 1 90,000,000 - - - - - - 90,000,000 1 10,000,000 - - - - - - 10,000,000 4 280,000,000 2 140,000,000 - - - - 420,000,000 4 40,000,000 2 20,000,000 - - - - 60,000,000 3 60,000,000 4 80,000,000 3 60,000,000 - - 200,000,000 3 90,000,000 4 120,000,000 3 90,000,000 - - 300,000,000 4 600,000,000 4 600,000,000 2 300,000,000 - - 1,500,000,000 4 400,000,000 4 400,000,000 2 200,000,000 - - 1,000,000,000
11.51%-12.00%
4 114,285,714 2 57,142,857 - - - - 171,428,571 4 100,000,000 4 100,000,000 - - - - 200,000,000 3 321,428,571 - - - - - - 321,428,571 4 428,571,429 1 107,142,857 - - - - 535,714,286 4 166,667,234 - - - - - - 166,667,234 2 125,000,000 - - - - - - 125,000,000 4 500,000,000 1 125,000,000 - - - - 625,000,000 4 363,636,364 4 363,636,364 - - - - 727,272,727 4 200,000,000 4 200,000,000 - - - - 400,000,000 1 41,666,667 - - - - - - 41,666,667
12.01%-12.50%
1 71,428,571 - - - - - - 71,428,571 2 185,714,286 - - - - - - 185,714,286 2 42,857,143 - - - - - - 42,857,143 2 250,000,000 - - - - - - 250,000,000 3 187,500,000 - - - - - - 187,500,000 4 83,600,000 3 61,900,000 - - - - 145,500,000
12.51%-13.00%
4 166,672,000 3 124,988,000 - - - - 291,660,000 3 150,000,000 - - - - - - 150,000,000 4 333,400,000 2 166,500,000 - - - - 499,900,000 4 233,380,000 2 116,550,000 - - - - 349,930,000 4 100,020,000 2 49,950,000 - - - - 149,970,000 4 83,336,000 2 41,660,000 - - - - 124,996,000
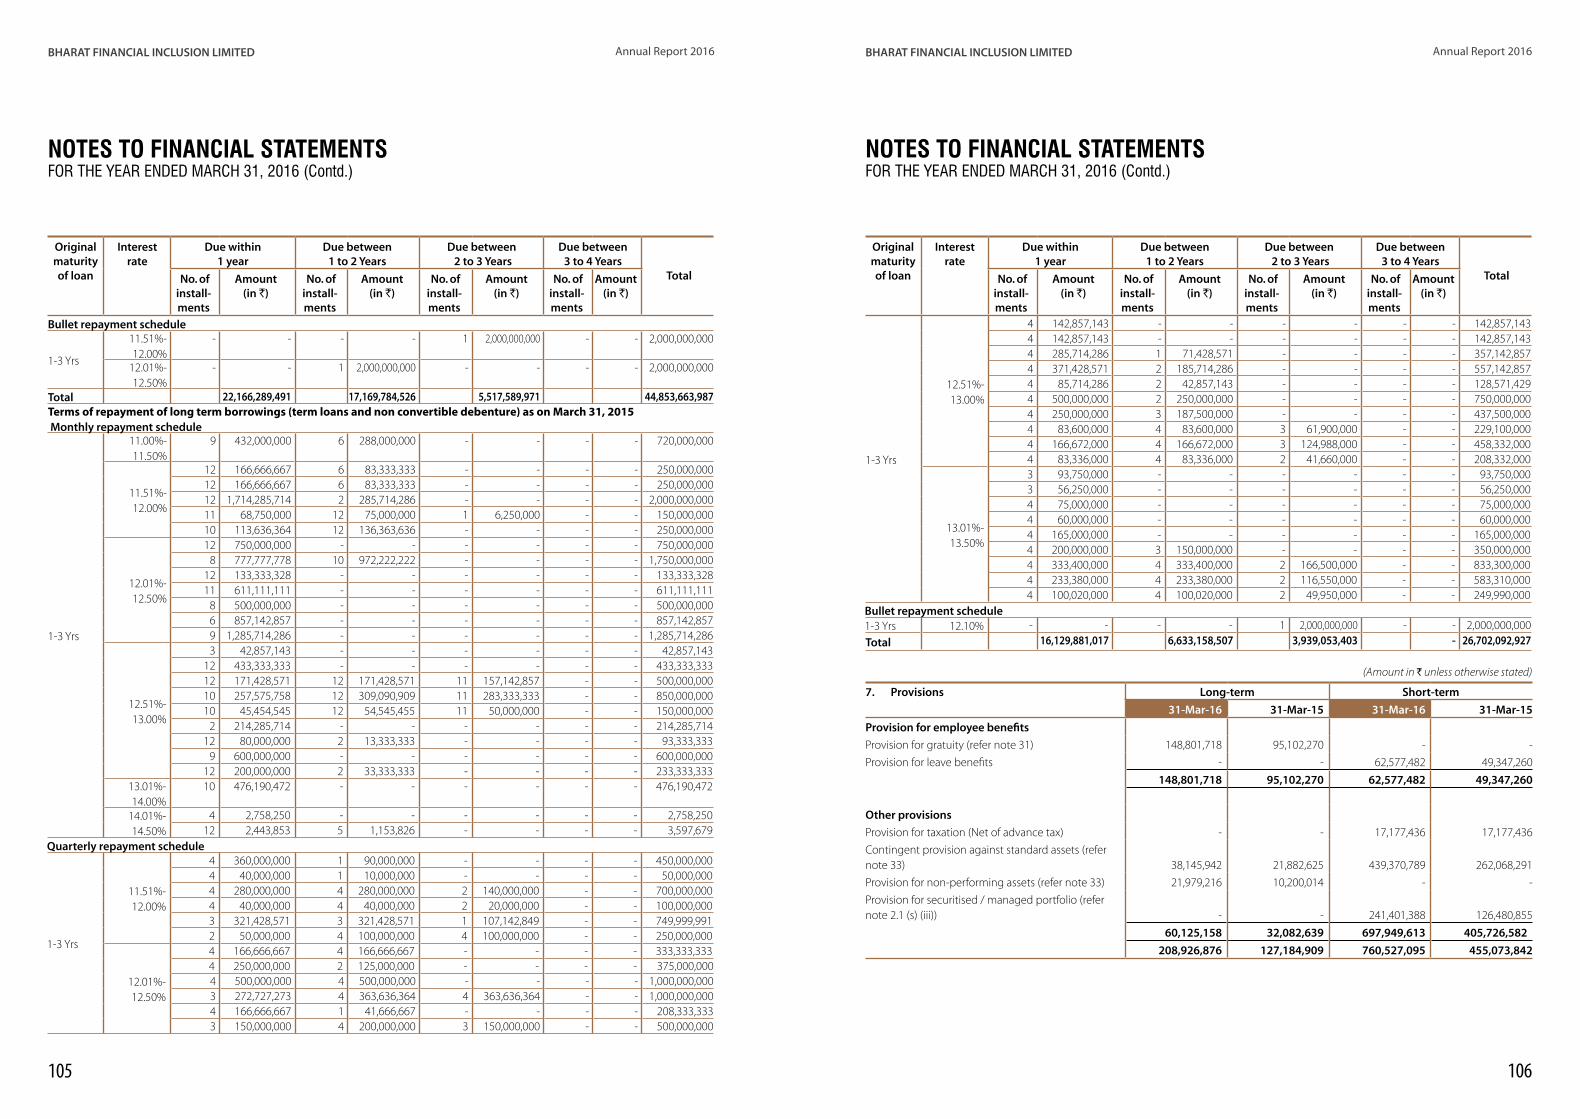
105 106
BHARAT FINANCIAL INCLUSION LIMITED Annual Report 2016 BHARAT FINANCIAL INCLUSION LIMITED Annual Report 2016
Original maturity of loan
Interest rate
Due within1 year
Due between 1 to 2 Years
Due between 2 to 3 Years
Due between 3 to 4 Years
Total No. of install-ments
Amount (in `)
No. of install-ments
Amount (in `)
No. of install-ments
Amount (in `)
No. of install-ments
Amount (in `)
Bullet repayment schedule
1-3 Yrs
11.51%-12.00%
- - - - 1 2,000,000,000 - - 2,000,000,000
12.01%-12.50%
- - 1 2,000,000,000 - - - - 2,000,000,000
Total 22,166,289,491 17,169,784,526 5,517,589,971 44,853,663,987 Terms of repayment of long term borrowings (term loans and non convertible debenture) as on March 31, 2015 Monthly repayment schedule
1-3 Yrs
11.00%-11.50%
9 432,000,000 6 288,000,000 - - - - 720,000,000
11.51%-12.00%
12 166,666,667 6 83,333,333 - - - - 250,000,000 12 166,666,667 6 83,333,333 - - - - 250,000,000 12 1,714,285,714 2 285,714,286 - - - - 2,000,000,000 11 68,750,000 12 75,000,000 1 6,250,000 - - 150,000,000 10 113,636,364 12 136,363,636 - - - - 250,000,000
12.01%-12.50%
12 750,000,000 - - - - - - 750,000,000 8 777,777,778 10 972,222,222 - - - - 1,750,000,000
12 133,333,328 - - - - - - 133,333,328 11 611,111,111 - - - - - - 611,111,111
8 500,000,000 - - - - - - 500,000,000 6 857,142,857 - - - - - - 857,142,857 9 1,285,714,286 - - - - - - 1,285,714,286
12.51%-13.00%
3 42,857,143 - - - - - - 42,857,143 12 433,333,333 - - - - - - 433,333,333 12 171,428,571 12 171,428,571 11 157,142,857 - - 500,000,000 10 257,575,758 12 309,090,909 11 283,333,333 - - 850,000,000 10 45,454,545 12 54,545,455 11 50,000,000 - - 150,000,000
2 214,285,714 - - - - - - 214,285,714 12 80,000,000 2 13,333,333 - - - - 93,333,333
9 600,000,000 - - - - - - 600,000,000 12 200,000,000 2 33,333,333 - - - - 233,333,333
13.01%-14.00%
10 476,190,472 - - - - - - 476,190,472
14.01%-14.50%
4 2,758,250 - - - - - - 2,758,250 12 2,443,853 5 1,153,826 - - - - 3,597,679
Quarterly repayment schedule
1-3 Yrs
11.51%-12.00%
4 360,000,000 1 90,000,000 - - - - 450,000,000 4 40,000,000 1 10,000,000 - - - - 50,000,000 4 280,000,000 4 280,000,000 2 140,000,000 - - 700,000,000 4 40,000,000 4 40,000,000 2 20,000,000 - - 100,000,000 3 321,428,571 3 321,428,571 1 107,142,849 - - 749,999,991 2 50,000,000 4 100,000,000 4 100,000,000 - - 250,000,000
12.01%-12.50%
4 166,666,667 4 166,666,667 - - - - 333,333,333 4 250,000,000 2 125,000,000 - - - - 375,000,000 4 500,000,000 4 500,000,000 - - - - 1,000,000,000 3 272,727,273 4 363,636,364 4 363,636,364 - - 1,000,000,000 4 166,666,667 1 41,666,667 - - - - 208,333,333 3 150,000,000 4 200,000,000 3 150,000,000 - - 500,000,000
NOTES TO FINANCIAL STATEMENTS FOR THE YEAR ENDED MARCH 31, 2016 (Contd.)
NOTES TO FINANCIAL STATEMENTS FOR THE YEAR ENDED MARCH 31, 2016 (Contd.)
Original maturity of loan
Interest rate
Due within1 year
Due between 1 to 2 Years
Due between 2 to 3 Years
Due between 3 to 4 Years
Total No. of install-ments
Amount (in `)
No. of install-ments
Amount (in `)
No. of install-ments
Amount (in `)
No. of install-ments
Amount (in `)
1-3 Yrs
12.51%-13.00%
4 142,857,143 - - - - - - 142,857,143 4 142,857,143 - - - - - - 142,857,143 4 285,714,286 1 71,428,571 - - - - 357,142,857 4 371,428,571 2 185,714,286 - - - - 557,142,857 4 85,714,286 2 42,857,143 - - - - 128,571,429 4 500,000,000 2 250,000,000 - - - - 750,000,000 4 250,000,000 3 187,500,000 - - - - 437,500,000 4 83,600,000 4 83,600,000 3 61,900,000 - - 229,100,000 4 166,672,000 4 166,672,000 3 124,988,000 - - 458,332,000 4 83,336,000 4 83,336,000 2 41,660,000 - - 208,332,000
13.01%-13.50%
3 93,750,000 - - - - - - 93,750,000 3 56,250,000 - - - - - - 56,250,000 4 75,000,000 - - - - - - 75,000,000 4 60,000,000 - - - - - - 60,000,000 4 165,000,000 - - - - - - 165,000,000 4 200,000,000 3 150,000,000 - - - - 350,000,000 4 333,400,000 4 333,400,000 2 166,500,000 - - 833,300,000 4 233,380,000 4 233,380,000 2 116,550,000 - - 583,310,000 4 100,020,000 4 100,020,000 2 49,950,000 - - 249,990,000
Bullet repayment schedule1-3 Yrs 12.10% - - - - 1 2,000,000,000 - - 2,000,000,000
Total 16,129,881,017 6,633,158,507 3,939,053,403 - 26,702,092,927
(Amount in ` unless otherwise stated)
7. Provisions Long-term Short-term
31-Mar-16 31-Mar-15 31-Mar-16 31-Mar-15
Provision for employee benefits
Provision for gratuity (refer note 31) 148,801,718 95,102,270 - -
Provision for leave benefits - - 62,577,482 49,347,260
148,801,718 95,102,270 62,577,482 49,347,260
Other provisions
Provision for taxation (Net of advance tax) - - 17,177,436 17,177,436
Contingent provision against standard assets (refer note 33) 38,145,942 21,882,625 439,370,789 262,068,291
Provision for non-performing assets (refer note 33) 21,979,216 10,200,014 - -
Provision for securitised / managed portfolio (refer note 2.1 (s) (iii)) - - 241,401,388 126,480,855
60,125,158 32,082,639 697,949,613 405,726,582
208,926,876 127,184,909 760,527,095 455,073,842
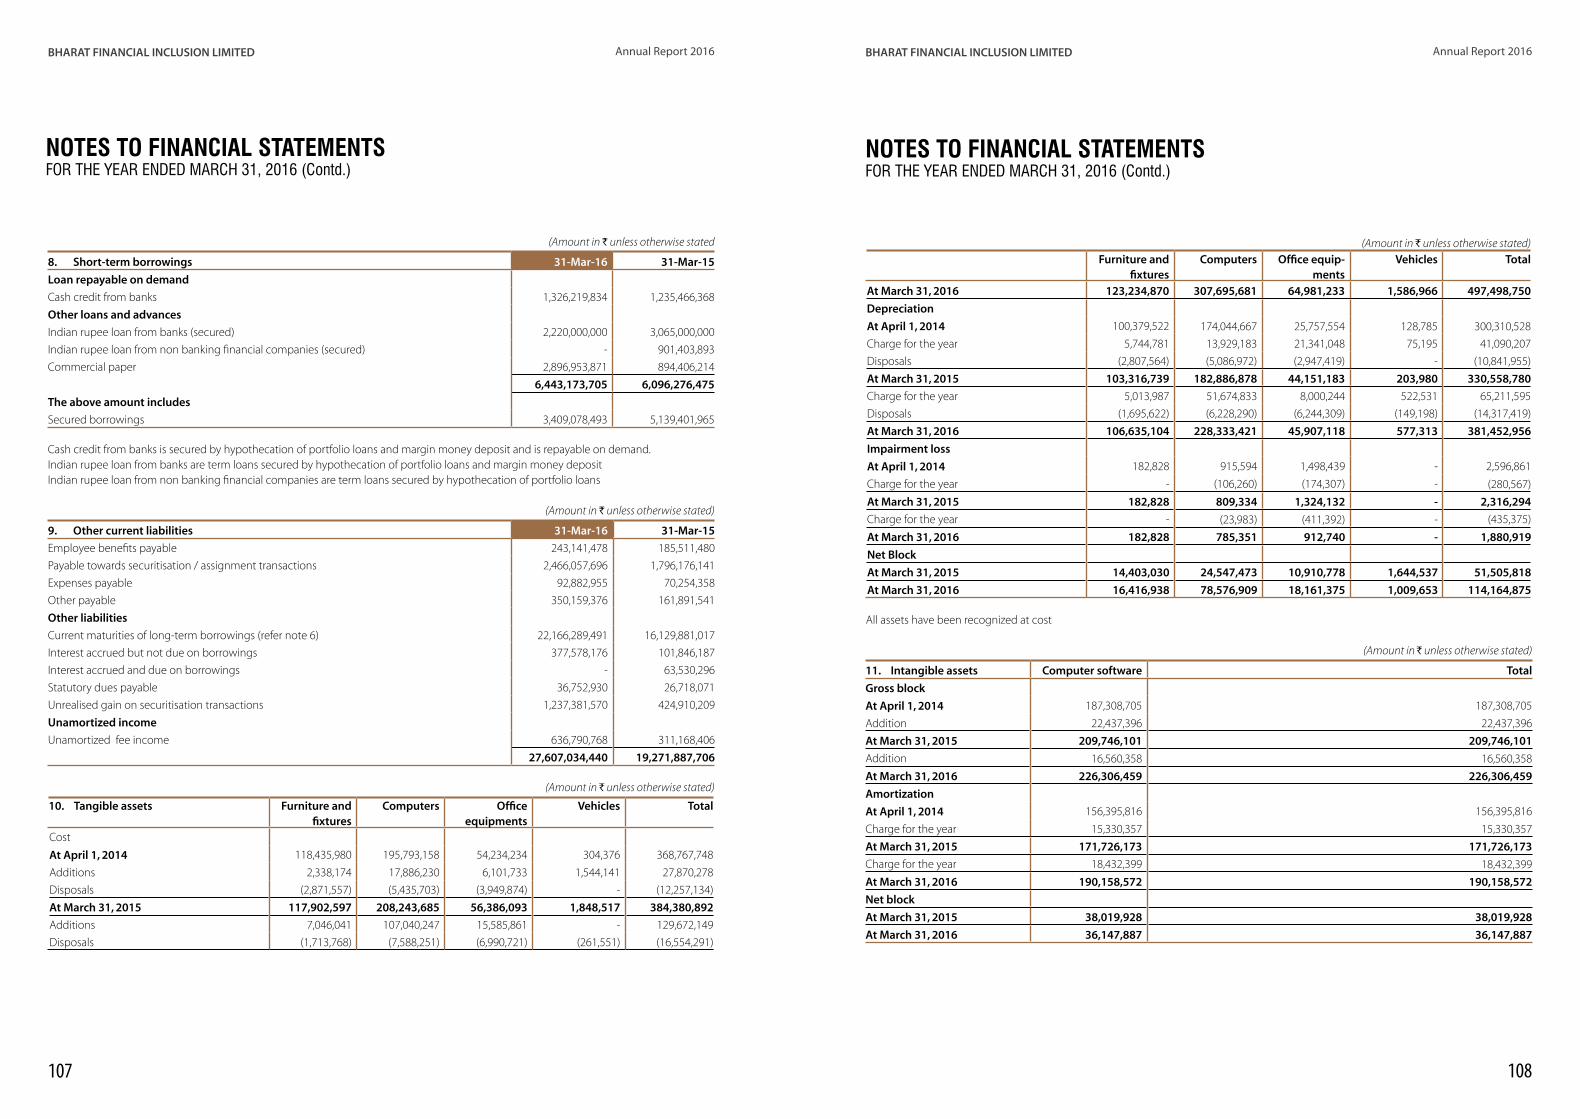
107 108
BHARAT FINANCIAL INCLUSION LIMITED Annual Report 2016 BHARAT FINANCIAL INCLUSION LIMITED Annual Report 2016
(Amount in ` unless otherwise stated
8. Short-term borrowings 31-Mar-16 31-Mar-15
Loan repayable on demand
Cash credit from banks 1,326,219,834 1,235,466,368
Other loans and advances
Indian rupee loan from banks (secured) 2,220,000,000 3,065,000,000
Indian rupee loan from non banking financial companies (secured) - 901,403,893
Commercial paper 2,896,953,871 894,406,214
6,443,173,705 6,096,276,475
The above amount includes
Secured borrowings 3,409,078,493 5,139,401,965
Cash credit from banks is secured by hypothecation of portfolio loans and margin money deposit and is repayable on demand. Indian rupee loan from banks are term loans secured by hypothecation of portfolio loans and margin money deposit Indian rupee loan from non banking financial companies are term loans secured by hypothecation of portfolio loans
(Amount in ` unless otherwise stated)
9. Other current liabilities 31-Mar-16 31-Mar-15
Employee benefits payable 243,141,478 185,511,480
Payable towards securitisation / assignment transactions 2,466,057,696 1,796,176,141
Expenses payable 92,882,955 70,254,358
Other payable 350,159,376 161,891,541
Other liabilities
Current maturities of long-term borrowings (refer note 6) 22,166,289,491 16,129,881,017
Interest accrued but not due on borrowings 377,578,176 101,846,187
Interest accrued and due on borrowings - 63,530,296
Statutory dues payable 36,752,930 26,718,071
Unrealised gain on securitisation transactions 1,237,381,570 424,910,209
Unamortized income
Unamortized fee income 636,790,768 311,168,406
27,607,034,440 19,271,887,706
(Amount in ` unless otherwise stated)
10. Tangible assets Furniture and fixtures
Computers Office equipments
Vehicles Total
Cost
At April 1, 2014 118,435,980 195,793,158 54,234,234 304,376 368,767,748
Additions 2,338,174 17,886,230 6,101,733 1,544,141 27,870,278
Disposals (2,871,557) (5,435,703) (3,949,874) - (12,257,134)
At March 31, 2015 117,902,597 208,243,685 56,386,093 1,848,517 384,380,892
Additions 7,046,041 107,040,247 15,585,861 - 129,672,149
Disposals (1,713,768) (7,588,251) (6,990,721) (261,551) (16,554,291)
NOTES TO FINANCIAL STATEMENTS FOR THE YEAR ENDED MARCH 31, 2016 (Contd.)
(Amount in ` unless otherwise stated)Furniture and
fixturesComputers Office equip-
mentsVehicles Total
At March 31, 2016 123,234,870 307,695,681 64,981,233 1,586,966 497,498,750
Depreciation
At April 1, 2014 100,379,522 174,044,667 25,757,554 128,785 300,310,528
Charge for the year 5,744,781 13,929,183 21,341,048 75,195 41,090,207
Disposals (2,807,564) (5,086,972) (2,947,419) - (10,841,955)
At March 31, 2015 103,316,739 182,886,878 44,151,183 203,980 330,558,780
Charge for the year 5,013,987 51,674,833 8,000,244 522,531 65,211,595
Disposals (1,695,622) (6,228,290) (6,244,309) (149,198) (14,317,419)
At March 31, 2016 106,635,104 228,333,421 45,907,118 577,313 381,452,956
Impairment loss
At April 1, 2014 182,828 915,594 1,498,439 - 2,596,861
Charge for the year - (106,260) (174,307) - (280,567)
At March 31, 2015 182,828 809,334 1,324,132 - 2,316,294
Charge for the year - (23,983) (411,392) - (435,375)
At March 31, 2016 182,828 785,351 912,740 - 1,880,919
Net Block
At March 31, 2015 14,403,030 24,547,473 10,910,778 1,644,537 51,505,818
At March 31, 2016 16,416,938 78,576,909 18,161,375 1,009,653 114,164,875
All assets have been recognized at cost
(Amount in ̀ unless otherwise stated)
11. Intangible assets Computer software Total
Gross block
At April 1, 2014 187,308,705 187,308,705
Addition 22,437,396 22,437,396
At March 31, 2015 209,746,101 209,746,101
Addition 16,560,358 16,560,358
At March 31, 2016 226,306,459 226,306,459
Amortization
At April 1, 2014 156,395,816 156,395,816
Charge for the year 15,330,357 15,330,357
At March 31, 2015 171,726,173 171,726,173
Charge for the year 18,432,399 18,432,399
At March 31, 2016 190,158,572 190,158,572
Net block
At March 31, 2015 38,019,928 38,019,928
At March 31, 2016 36,147,887 36,147,887
NOTES TO FINANCIAL STATEMENTS FOR THE YEAR ENDED MARCH 31, 2016 (Contd.)

109 110
BHARAT FINANCIAL INCLUSION LIMITED Annual Report 2016 BHARAT FINANCIAL INCLUSION LIMITED Annual Report 2016
(Amount in ` unless otherwise stated)
12. Non-current investments 31-Mar-16 31-Mar-15
Non-trade investments (valued at cost)
Investment in equity instruments (unquoted)
200,000 (March 31, 2015 : 200,000) Equity shares of `10/- each fully paid-up in Alpha Micro Finance Consultants Private Limited 2,000,000 2,000,000
2,000,000 2,000,000
Aggregate amount of unquoted investments 2,000,000 2,000,000
(Amount in ` unless otherwise stated)
13. Deferred tax asset 31-Mar-16 31-Mar-15
Deferred tax asset
Impact of expenditure charged to the statement of profit and loss in the current year but allowed for tax purposes on payment basis 21,656,815 16,773,134
Impact of difference between tax depreciation and depreciation/ amortization charged for the financial reporting 15,274,439 19,132,071
Impact of accumulated tax losses and unabsorbed depreciation 3,260,003,277 4,695,288,289
Impact of provision for standard and non performing assets 268,434,517 154,726,119
Others 229,558 68,583
Deferred tax asset 3,565,598,606 4,885,988,195
Deferred tax asset recognised - -
The deferred tax asset amounting to ` 3,565,598,606 as at March 31, 2016 has not been recognized (refer note 2.1 (l)). The said sum of ` 3,565,598,606 will be available to offset tax on future taxable income.
(Amount in ` unless otherwise stated)
14. Loans and advances Non-current Current
31-Mar-16 31-Mar-15 31-Mar-16 31-Mar-15
A. Portfolio Loans
Joint liability group loans
Unsecured, considered good* 3,593,031,504 2,188,262,541 44,333,543,391 25,678,906,608
Unsecured, considered doubtful** 36,744,741 18,693,542 - -
3,629,776,245 2,206,956,083 44,333,543,391 25,678,906,608
Individual loans
Secured, considered good* - - 201,185,956 487,726,853
Secured, considered doubtful** 4,025,434 4,480,560 - -
4,025,434 4,480,560 201,185,956 487,726,853
3,633,801,679 2,211,436,643 44,534,729,347 26,166,633,461
NOTES TO FINANCIAL STATEMENTS FOR THE YEAR ENDED MARCH 31, 2016 (Contd.)
(Amount in ` unless otherwise stated)
14. Loans and advances (Contd.) Non-current Current
31-Mar-16 31-Mar-15 31-Mar-16 31-Mar-15
Joint liability group loans placed as collateral towards securitisation / assignment transaction (refer note 40 (d))
Unsecured, considered good* 221,562,718 - 1,374,769,469 862,800,579
Unsecured, considered doubtful** 634,636 523,120 - -
222,197,354 523,120 1,374,769,469 862,800,579
(A) 3,855,999,033 2,211,959,763 45,909,498,816 27,029,434,040
* Represents standard assets in accordance with Company’s asset classification policy (refer note 2.1 (s) & 33) ** Represents non-performing assets in accordance with Company’s asset classification policy (refer note 2.1 (s) & 33)
B. Security deposits
Unsecured, considered good 39,355,533 38,251,183 - -
(B) 39,355,533 38,251,183 - -
C. Advances recoverable in cash or kind
Unsecured, considered good 51,728,988 6,500,578 129,258,640 74,469,929
Unsecured, considered doubtful 32,864,710 32,262,628 - -
84,593,698 38,763,206 129,258,640 74,469,929
Provision for doubtful advances (32,864,710) (32,262,628) - -
(C) 51,728,988 6,500,578 129,258,640 74,469,929
D. Other loans and advances (unsecured, considered good)
Loans to SKS Microfinance Employees Benefit Trust (refer note 35) 27,444,750 48,969,462 - -
Advance fringe benefit tax (net of provision) 937,183 937,183 - -
Advance income tax (net of provision) 159,926,206 141,842,341 - -
Prepaid expenses - - 41,467,989 31,615,749
(D) 188,308,139 191,748,986 41,467,989 31,615,749
Total (A+B+C+D) 4,135,391,693 2,448,460,510 46,080,225,445 27,135,519,718
NOTES TO FINANCIAL STATEMENTS FOR THE YEAR ENDED MARCH 31, 2016 (Contd.)

111 112
BHARAT FINANCIAL INCLUSION LIMITED Annual Report 2016 BHARAT FINANCIAL INCLUSION LIMITED Annual Report 2016
(Amount in ` unless otherwise stated)
15. Other assets Non-current Current
31-Mar-16 31-Mar-15 31-Mar-16 31-Mar-15
Non-current bank balances (refer note 17) 1,756,317,904 1,223,505,298 - -
Interest accrued but not due on portfolio loans - - 101,271,629 108,263,174
Interest accrued and due on portfolio loans - - 2,090,774 9,231,151
Interest accrued but not due on deposits placed with banks 36,353,633 28,758,781 85,017,383 50,660,716
Interest strip on securitisation transactions - - 1,237,381,583 424,910,209
Unbilled revenue - - 157,095,442 52,075,250
Others-unsecured, considered good - - 52,828,375 -
1,792,671,537 1,252,264,079 1,635,685,186 645,140,500
(Amount in ` unless otherwise stated)
16. Trade receivables Current
31-Mar-16 31-Mar-15
Outstanding for a period less than six months from the date they are due for payment
Unsecured, considered good 62,606,085 34,169,498
Outstanding for a period exceeding six months from the date they are due for payment
Unsecured, considered good 1,076,081 -
63,682,166 34,169,498
(Amount in ` unless otherwise stated)
17. Cash and bank balances Non-current Current
31-Mar-16 31-Mar-15 31-Mar-16 31-Mar-15
Cash and cash equivalents
Balances with banks
On current accounts - - 4,118,461,204 4,896,142,382
Deposits with original maturity of less than three months - - 12,200,000,000 9,000,000,000
Cash on hand - - 284,781,942 478,495,745
- - 16,603,243,146 14,374,638,127
Other bank balances
Margin money deposit (refer note (a) below) 1,756,317,904 1,223,505,298 1,059,584,486 993,092,388
1,756,317,904 1,223,505,298 1,059,584,486 993,092,388
Amount disclosed under non-current assets (refer note 15) (1,756,317,904) (1,223,505,298)
- - 17,662,827,632 15,367,730,515
Note (a): Represent margin money deposits placed to avail term loans from banks, financial institutions and as cash collateral in connection with securitization
transactions.
NOTES TO FINANCIAL STATEMENTS FOR THE YEAR ENDED MARCH 31, 2016 (Contd.)
(Amount in ` unless otherwise stated)
18. Revenue from operations 31-Mar-16 31-Mar-15
Interest income on portfolio loans 9,538,854,573 5,664,537,532
Excess interest spread on securitization / income from assignment (refer note 2.1 (b) (iv) & 40 (d & f ) 1,103,015,705 667,547,446
Other operating revenue
Loan processing fees 725,778,792 455,002,586
Recovery against loans written off 146,897,792 263,824,773
Interest on margin money deposits* 176,793,879 188,655,838
11,691,340,741 7,239,568,175
* Represents interest on margin money deposits placed to avail term loans from banks, financial institutions and on deposits placed as cash collateral in
connection with securitization.
(Amount in ` unless otherwise stated)
19. Other income 31-Mar-16 31-Mar-15
Interest on fixed deposits 385,805,444 253,079,627
Other fee income 1,119,770,406 531,913,971
Profit on sale of assets 770,575 495,322
Miscellaneous income 9,040,825 5,599,248
1,515,387,250 791,088,168
(Amount in ` unless otherwise stated)
20. Employee benefit expenses 31-Mar-16 31-Mar-15
Salaries and bonus / incentives 2,444,815,365 1,978,260,855
Leave benefits 28,564,487 25,945,779
Contribution to provident fund 87,930,813 60,470,402
Contribution to Employee State Insurance Corporation 33,757,294 28,183,640
Gratuity expenses (refer note 31) 89,093,298 40,244,836
Staff welfare expenses 131,725,068 89,458,181
Stock option expenditure 107,804,885 95,974,217
2,923,691,210 2,318,537,910
(Amount in ` unless otherwise stated)
21. Finance costs 31-Mar-16 31-Mar-15
Interest
On term loans from banks 3,382,650,662 2,220,625,342
On term loans from financial institutions 264,183,013 142,004,825
On term loans from non banking financial companies 107,676,532 95,617,336
On bank overdraft facility 35,170,401 47,847,455
On debentures 452,264,137 1,326,027
On commercial paper 429,142,407 60,504,064
On shortfall in payment of advance income tax - 6,078,501
Other finance costs 168,978,468 211,026,575
Bank charges 5,669,161 5,421,727
4,845,734,781 2,790,451,852
NOTES TO FINANCIAL STATEMENTS FOR THE YEAR ENDED MARCH 31, 2016 (Contd.)

113 114
BHARAT FINANCIAL INCLUSION LIMITED Annual Report 2016 BHARAT FINANCIAL INCLUSION LIMITED Annual Report 2016
(Amount in ` unless otherwise stated)
22. Other expenses 31-Mar-16 31-Mar-15
Rent 155,975,638 142,192,035
Rates and taxes 3,834,788 4,179,187
Insurance 18,201,595 18,569,603
Repairs and maintenance
Plant and machinery 54,681,505 26,529,555
Others 84,214,194 74,700,913
Electricity charges 28,653,878 25,688,302
Travelling and conveyance 351,165,396 282,429,640
Communication expenses 69,393,949 58,892,473
Printing and stationery 56,012,758 61,536,397
Legal and professional fees 99,379,104 70,129,965
Directors' sitting fees 5,490,000 4,230,000
Directors stock option expenditure 2,472,693 10,360,558
Auditors' remuneration (refer details below) 12,556,886 10,166,838
Other provisions and write off 46,610,003 31,987,634
CSR expenditure 19,344,705 1,500,000
Miscellaneous expenses 20,333,879 16,840,256
1,028,320,971 839,933,356
(Amount in ` unless otherwise stated)
Payment to auditors 31-Mar-16 31-Mar-15
As auditor:
Audit fee 7,845,000 5,445,000
Limited review 3,150,000 3,150,000
In other capacity:
Other services (certification fees) 440,000 450,000
Reimbursement of expenses 1,121,886 1,121,838
12,556,886 10,166,838
NOTES TO FINANCIAL STATEMENTS FOR THE YEAR ENDED MARCH 31, 2016 (Contd.)
(Amount in ` unless otherwise stated)
23. Depreciation and amortization expense 31-Mar-16 31-Mar-15
Depreciation of tangible assets 65,211,596 30,281,967
Amortization of intangible assets 18,432,399 15,330,357
83,643,995 45,612,324
24. Provisions and write-offs 31-Mar-16 31-Mar-15
Contingent provision against standard assets (refer note 33) 193,565,814 120,947,422
Provision for non-performing assets (refer note 33) 11,779,202 (1,779,602,571)
Portfolio loans and other balances written off 63,790,855 1,756,038,528
Provision and loss on securitized / managed portfolio (refer note 2.1 (s) (iii)) 117,278,880 3,073,619
386,414,751 100,456,998
25. Earnings per share (EPS) 31-Mar-16 31-Mar-15
The following reflects the profit and share data used in the basic and diluted EPS computations:
Net Profit for calculation of basic EPS 3,029,814,959 1,876,643,436
Net Profit for calculation of diluted EPS 3,029,814,959 1,876,643,436
No. of shares No. of shares
Weighted average number of equity shares in calculating basic EPS 126,777,718 123,299,110
Effect of dilution:
Stock options granted under ESOP 1,696,125 1,459,555
Weighted average number of equity shares in calculating diluted EPS 128,473,843 124,758,665
NOTES TO FINANCIAL STATEMENTS FOR THE YEAR ENDED MARCH 31, 2016 (Contd.)

115 116
BHARAT FINANCIAL INCLUSION LIMITED Annual Report 2016 BHARAT FINANCIAL INCLUSION LIMITED Annual Report 2016
26. Segment information
The Company operates in a single reportable segment i.e. financing, which has similar risks and returns for the purpose of AS 17 on ‘Segment Reporting’ specified under section 133 of the Companies Act 2013, read with rule 7 of the Companies (Accounts) Rules, 2014. The Company operates in a single geographical segment i.e. domestic.
27. Related Parties
a. Names of the related parties with whom transactions have been entered
Key Management Personnel Mr. M.R.Rao, Managing Director and Chief Executive Officer Mr. S. Dilli Raj, President Mr. K.V. Rao, Chief Operating OfficerMr. Ashish Damani, Chief Financial Officer Mr. Rajendra Patil, Company Secretary
b. Related party transactions
(Amount in ` unless otherwise stated)
Transactions during the year 31-Mar-16 31-Mar-15
Salary, incentives and perquisites
– Mr. M. R. Rao 28,617,601 22,320,729
– Mr. S. Dilli Raj 23,484,106 17,733,095
– Mr. K.V. Rao 9,393,692 7,310,086
– Mr. Ashish Damani 6,691,740 5,348,975
– Mr. Rajendra Patil 6,519,607 4,835,264
Note: As the provisions for gratuity and leave benefits are made for the Company as a whole, the amounts pertaining to the Key Management
Personnel are not specifically identified and hence are not included above.
28. Capital and other commitments
Estimated amounts of contracts remaining to be executed on capital account (net of advances) and not provided:
(Amount in ` unless otherwise stated)
Particulars March 31, 2016 March 31, 2015
For development of computer software 1,781,424 1,425,424
For purchase of computer and computer peripherals - 172,750
Maintenance cost for computers 3,808,000 -
29. Contingent liabilities not provided for
(Amount in ` unless otherwise stated)
Particulars March 31, 2016 March 31, 2015
Credit enhancements provided by the Company towards securitisation (including cash collaterals, principal and interest subordination)
3,785,994,487 2,216,270,453
Performance security provided by the Company pursuant to business correspondent agreement
862,232,673 477,749,783
Tax on items disallowed by the Income Tax department not acknowledged as debt by the Company *
212,550 5,475,348
*Based on the expert opinion obtained by the Company, crystallisation of liability on these items is not considered probable.
NOTES TO FINANCIAL STATEMENTS FOR THE YEAR ENDED MARCH 31, 2016 (Contd.)
30. Stock option scheme
The Company has provided various share-based payment schemes to its Directors and Employees. The plans in operation are Plan II (Other Independent Directors) and Plan III (Employees). The alphabet a, b, c, etc. represents different grants made under these plans. During the year ended March 31, 2016, the following series were in operation:
(Amount in ` unless otherwise stated)
Particulars Plan II (f ) Plan II (g) Plan III (a) Plan III (c) Plan III (e)
Date of grant Nov 23, 2011 Mar 12, 2013 Nov 3, 2009 Dec 15, 2009 May 4, 2010
Date of Board approval Nov 23, 2011 Mar 12, 2013 July 29, 2009 Nov 4, 2009 May 4, 2010
Date of shareholder's approval Jul 16, 2010 Dec 07, 2011 Sep 30, 2009 Dec 10, 2009 Dec 10, 2009
Number of options granted 300,000 400,000 514,750 568,000 6,000
Exercise price `109.95 `150.00 `300 `300 `300
Method of settlement Equity Equity Equity Equity Equity
Vesting period End of year 1–33% End of year 1–33% End of year 1–40% 20 % equally at the end of each year
20 % equally at the end of each year
End of year 2–33% End of year 2–33% End of year 2–25%
End of year 3–34% End of year 3–34% End of year 3–25%
End of year 4–10%
Exercise period 36 months from the date of vesting
On or before Mar 11, 2018
60 months from the date of grant
72 months from the date of grant
72 months from the date of grant
Vesting conditions Refer note 1 Refer note 1 Refer note 1 Refer note 1 Refer note 1
Name of the plan ESOP 2010 ESOP 2011 ESOP 2009 ESOP 2009 ESOP 2009
yy Exercise period extended upto May 2, 2016 and June 14, 2016 for plan III (a) and III (c) respectively.
yy
Particulars Plan III (f ) Plan III (g) Plan III (h) Plan III (i) Plan III (j) Plan III (k) Plan III (l)
Date of grant Sep 7, 2011 Mar 22, 2013 Aug 23, 2013 Oct 23, 2013 Feb 04, 2014 April 28, 2014
August 16, 2014
Date of Board approval Sep 7, 2011 Mar 22, 2013 Aug 23, 2013 Oct 23, 2013 Feb 04, 2014 April 28, 2014
August 16, 2014
Date of shareholder’s approval
Nov 8, 2008,Sep 30, 2009,July 16, 2010
Dec 07, 2011 Dec 07, 2011 Dec 07, 2011 Dec 07, 2011 Dec 07, 2011 Nov 08, 2008
Number of options granted
1,486,329 119,112 15,760 11,564 58,000 50,000 2,082,200
Exercise price `229.40 `150 `113 `160.45 `174.95 `253.65 `264.75
Method of settlement Equity Equity Equity Equity Equity Equity Equity
NOTES TO FINANCIAL STATEMENTS FOR THE YEAR ENDED MARCH 31, 2016 (Contd.)

117 118
BHARAT FINANCIAL INCLUSION LIMITED Annual Report 2016 BHARAT FINANCIAL INCLUSION LIMITED Annual Report 2016
(Amount in ` unless otherwise stated)
Particulars Plan III (f ) Plan III (g) Plan III (h) Plan III (i) Plan III (j) Plan III (k) Plan III (l)
Vesting period 50 % equally at the end of each year
End of year 1 – 33% End of year 2 – 33%End of year 3 – 34%
25 % equally at the end of each year
25 % equally at the end of each year
25 % equally at the end of each year
25 % equally at the end of each year
End of year 1 – 33% End of year 2 – 33%End of year 3 – 34%
Exercise period 36 months from the date of vesting
On or before Mar 21, 2018
On or before Aug 22, 2018
On or before Oct 22, 2018
On or before Feb 03, 2019
On or before April 27, 2019
On or before August 15, 2018
Vesting conditions Refer note 1 Refer note 1 Refer note 1 Refer note 1 Refer note 1 Refer note 1 Refer note 1
Name of the plan ESOP 2008ESOP 2009ESOP 2010
ESOP 2011 ESOP 2011 ESOP 2011 ESOP 2011 ESOP 2011 ESOP 2008
yy
Particulars Plan III (m) Plan III (n) Plan III (o) Plan III (p) Plan III (q) Plan III (r) Plan III (s)
Date of grant October 29, 2014
January 30, 2015
May 04, 2015 July 22, 2015 October 30, 2015
February 04, 2016
February 13, 2016
Date of Board approval
October 29, 2014
January 30, 2015
May 04, 2015 July 22, 2015 October 30, 2015
February 04, 2016
February 13, 2016
Date of shareholder’s approval
Dec 07, 2011 Dec 07, 2011 Dec 07, 2011 Dec 07, 2011 Dec 07, 2011 Dec 07, 2011 Dec 07, 2011
Number of options granted
87,000 93,500 21,500 45,500 3,000 66,000 4,500
Exercise price `316.15 `426.85 `470.05 `529.15 `433.40 `548.45 `495.65
Method of settlement Equity Equity Equity Equity Equity Equity Equity
Vesting period 25 % equally at the end of each year
25 % equally at the end of each year
25 % equally at the end of each year
25 % equally at the end of each year
25 % equally at the end of each year
25 % equally at the end of each year
25 % equally at the end of each year
Exercise period On or before October 28, 2019
On or before January 29, 2020
On or before May 03, 2020
On or before July 21, 2020
On or before October 29, 2020
On or before February 03, 2021
On or before February 12, 2021
Vesting conditions Refer note 1 Refer note 1 Refer note 1 Refer note 1 Refer note 1 Refer note 1 Refer note 1
Name of the plan ESOP 2011 ESOP 2011 ESOP 2011 ESOP 2011 ESOP 2011 ESOP 2011 ESOP 2011
Note 1: Option holders are required to continue to hold the services being provided to the Company at the time of exercise of options.
NOTES TO FINANCIAL STATEMENTS FOR THE YEAR ENDED MARCH 31, 2016 (Contd.)
The details of all grants in operation during financial year 2015-16 have been summarised below:
(Amount in ` unless otherwise stated)
Plan Grant Date ExercisePrice
Outstanding at the beginning
of the year
Grant during
the year
Exercised during
the year
Lapsed during
the year
Outstandingat the end of
the year
Exercisable at the end of
the year
Weighted average
Remaining contractual life
of options (in years)
Weighted average
Fair value of options
granted
Weighted average share
price during the exercise period
(in `) ^
Plan II (b) 01-Feb-08 70.67 15,000 - 15,000 - - - - 17.72 484.01
Plan II (c) 10-Nov-08 70.67 3,000 - 3,000 - - - - 52.14 484.01
Plan II (d) 29-Jul-09 300.00 18,000 - 18,000 - - - - 21.57 582.18
Plan II (e) 01-Feb-10 300.00 45,000 - 45,000 - - - - 72.53 503.65
Plan II (f ) 23-Nov-11 109.95 245,000 - 111,000 - 134,000 134,000 1.6 77.23 465.01
Plan II (g) 12-Mar-13 150.00 300,000 - - - 300,000 300,000 1.9 71.81 -
Plan III (a) 03-Nov-09 300.00 139,870 - 134,370 4,200 1,300 1,300 0.1 41.18 463.48
Plan III (b) 15-Dec-09 150.00 168,031 - 158,726 9,305 - - - 115.30 478.01
Plan III (c) 15-Dec-09 300.00 105,700 - 65,400 - 40,300 40,300 0.2 69.29 501.07
Plan III (d) 04-May-10 150.00 618 - 618 - - - - 233.75 471.84
Plan III (e) 04-May-10 300.00 3,000 - 2,735 - 265 265 0.1 152.53 499.60
Plan III (f ) 07-Sep-11 229.40 448,683 - 264,375 18,915 165,393 165,393 0.4 146.73 480.41
Plan III (g) 22-Mar-13 150.00 101,370 - 36,202 - 65,168 65,168 2.0 57.43 494.37
Plan III (h) 23-Aug-13 113.00 6,178 - 3,090 - 3,088 - 2.4 57.37 432.83
Plan III (i) 23-Oct-13 160.45 11,564 - 5,782 - 5,782 - 2.6 76.08 519.08
Plan III (j) 04-Feb-14 174.95 58,000 - 10,550 - 47,450 18,450 2.8 91.52 444.83
Plan III (k) 28-Apr-14 253.65 50,000 - 12,500 - 37,500 - 3.1 128.14 456.17
Plan III (l) 16-Aug-14 264.75 2,064,100 - 116,315 35,090 1,912,695 559,236 2.4 109.40 491.33
Plan III (m) 29-Oct-14 316.15 87,000 - 14,500 29,000 43,500 - 3.6 145.08 469.02
Plan III (n) 30-Jan-15 426.85 93,500 - 1,125 15,000 77,375 18,500 3.8 188.68 519.08
Plan III (o) 04-May-15 470.05 21,500 - - 21,500 - 4.1 188.39 -
Plan III (p) 22-Jul-15 529.15 45,500 - 8,000 37,500 - 4.3 221.67 -
Plan III (q) 30-Oct-15 433.40 3,000 - - 3,000 - 4.6 186.16 -
Plan III (r) 04-Feb-16 548.45 66,000 - 29,000 37,000 - 4.8 227.53 -
Plan III (s) 13-Feb-16 495.65 4,500 - - 4,500 - 4.9 217.59 -
3,963,614 140,500 1,018,288 148,510 2,937,316 1,302,612
Plan III (a) - Exercise period ending on November 2, 2015, extended upto May 2, 2016Plan III (c) - Original exercise period ending on December 14, 2015, extended upto June14, 2016Plan III (f ) - Notice of exercise received for 107 options, however the allotment was pending as on March 31, 2016^ Disclosure of weighted average share price during the exercise period is applicable only for plans where there has been an exercise of options in current financial year.
NOTES TO FINANCIAL STATEMENTS FOR THE YEAR ENDED MARCH 31, 2016 (Contd.)
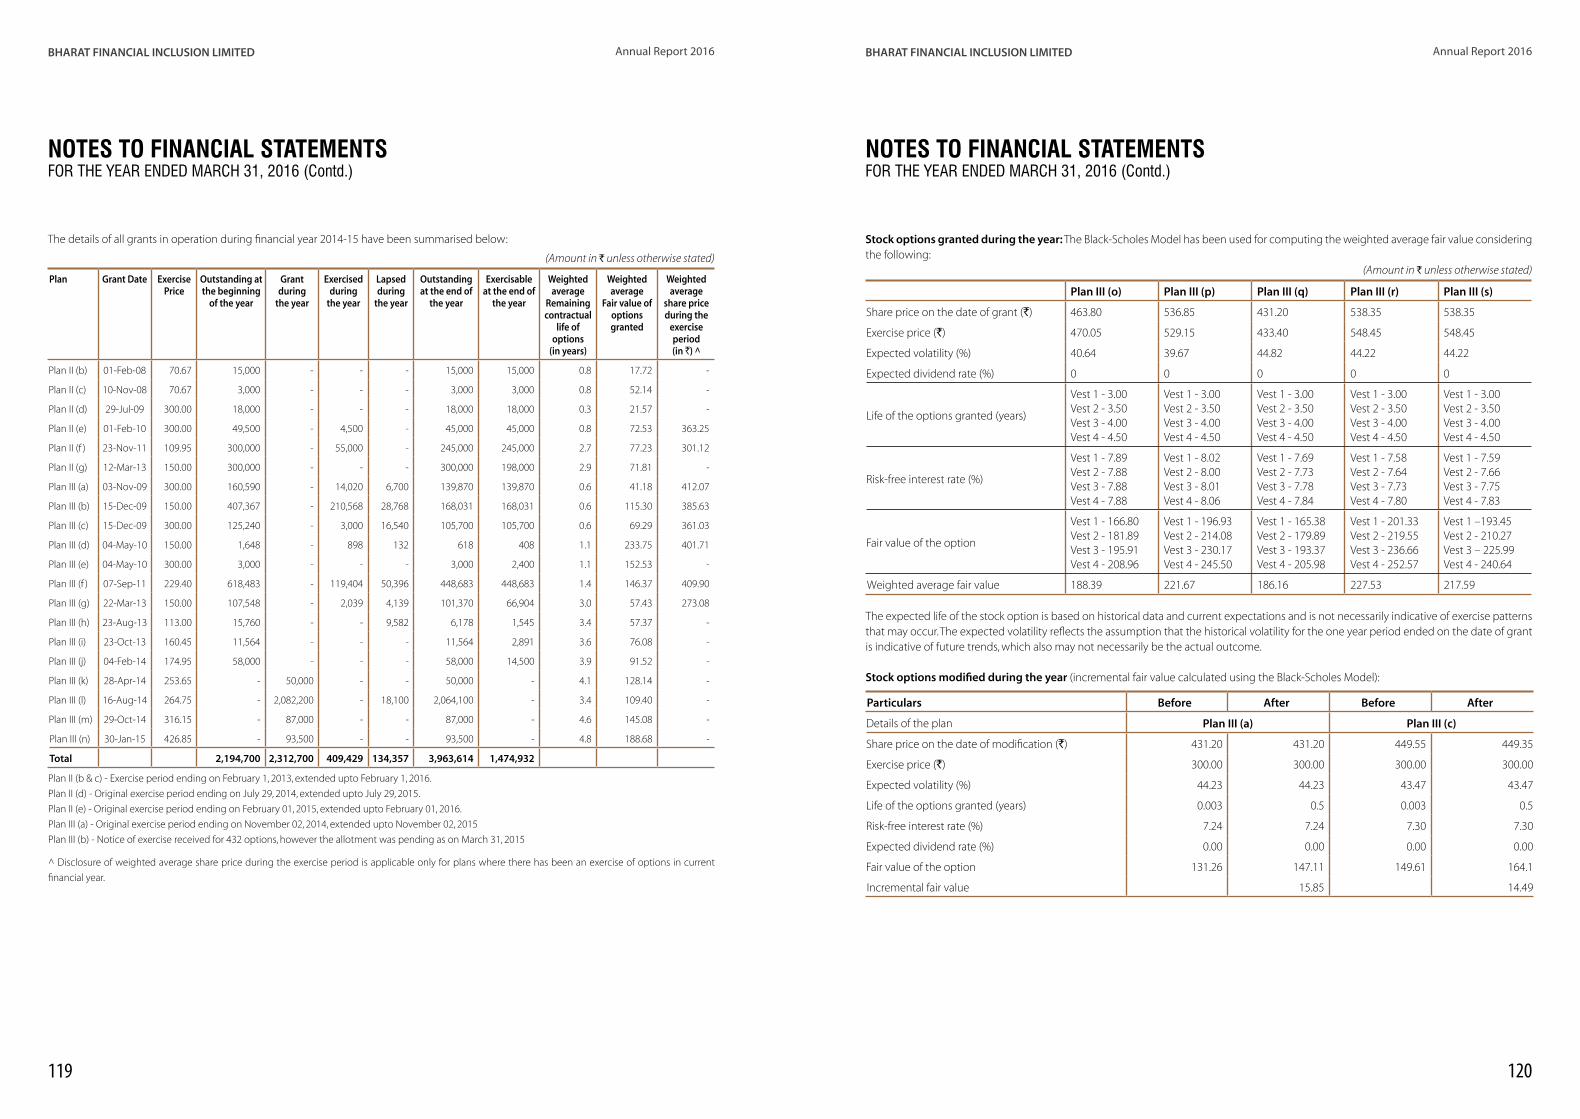
119 120
BHARAT FINANCIAL INCLUSION LIMITED Annual Report 2016 BHARAT FINANCIAL INCLUSION LIMITED Annual Report 2016
The details of all grants in operation during financial year 2014-15 have been summarised below:
(Amount in ` unless otherwise stated)
Plan Grant Date ExercisePrice
Outstanding at the beginning
of the year
Grant during
the year
Exercised during
the year
Lapsed during
the year
Outstandingat the end of
the year
Exercisableat the end of
the year
Weighted average
Remainingcontractual
life of options
(in years)
Weighted average
Fair value ofoptions granted
Weighted average
share price during the
exercise period(in `) ^
Plan II (b) 01-Feb-08 70.67 15,000 - - - 15,000 15,000 0.8 17.72 -
Plan II (c) 10-Nov-08 70.67 3,000 - - - 3,000 3,000 0.8 52.14 -
Plan II (d) 29-Jul-09 300.00 18,000 - - - 18,000 18,000 0.3 21.57 -
Plan II (e) 01-Feb-10 300.00 49,500 - 4,500 - 45,000 45,000 0.8 72.53 363.25
Plan II (f ) 23-Nov-11 109.95 300,000 - 55,000 - 245,000 245,000 2.7 77.23 301.12
Plan II (g) 12-Mar-13 150.00 300,000 - - - 300,000 198,000 2.9 71.81 -
Plan III (a) 03-Nov-09 300.00 160,590 - 14,020 6,700 139,870 139,870 0.6 41.18 412.07
Plan III (b) 15-Dec-09 150.00 407,367 - 210,568 28,768 168,031 168,031 0.6 115.30 385.63
Plan III (c) 15-Dec-09 300.00 125,240 - 3,000 16,540 105,700 105,700 0.6 69.29 361.03
Plan III (d) 04-May-10 150.00 1,648 - 898 132 618 408 1.1 233.75 401.71
Plan III (e) 04-May-10 300.00 3,000 - - - 3,000 2,400 1.1 152.53 -
Plan III (f ) 07-Sep-11 229.40 618,483 - 119,404 50,396 448,683 448,683 1.4 146.37 409.90
Plan III (g) 22-Mar-13 150.00 107,548 - 2,039 4,139 101,370 66,904 3.0 57.43 273.08
Plan III (h) 23-Aug-13 113.00 15,760 - - 9,582 6,178 1,545 3.4 57.37 -
Plan III (i) 23-Oct-13 160.45 11,564 - - - 11,564 2,891 3.6 76.08 -
Plan III (j) 04-Feb-14 174.95 58,000 - - - 58,000 14,500 3.9 91.52 -
Plan III (k) 28-Apr-14 253.65 - 50,000 - - 50,000 - 4.1 128.14 -
Plan III (l) 16-Aug-14 264.75 - 2,082,200 - 18,100 2,064,100 - 3.4 109.40 -
Plan III (m) 29-Oct-14 316.15 - 87,000 - - 87,000 - 4.6 145.08 -
Plan III (n) 30-Jan-15 426.85 - 93,500 - - 93,500 - 4.8 188.68 -
Total 2,194,700 2,312,700 409,429 134,357 3,963,614 1,474,932
Plan II (b & c) - Exercise period ending on February 1, 2013, extended upto February 1, 2016.
Plan II (d) - Original exercise period ending on July 29, 2014, extended upto July 29, 2015.
Plan II (e) - Original exercise period ending on February 01, 2015, extended upto February 01, 2016.
Plan III (a) - Original exercise period ending on November 02, 2014, extended upto November 02, 2015
Plan III (b) - Notice of exercise received for 432 options, however the allotment was pending as on March 31, 2015
^ Disclosure of weighted average share price during the exercise period is applicable only for plans where there has been an exercise of options in current
financial year.
NOTES TO FINANCIAL STATEMENTS FOR THE YEAR ENDED MARCH 31, 2016 (Contd.)
Stock options granted during the year: The Black-Scholes Model has been used for computing the weighted average fair value considering the following:
(Amount in ` unless otherwise stated)
Plan III (o) Plan III (p) Plan III (q) Plan III (r) Plan III (s)
Share price on the date of grant (`) 463.80 536.85 431.20 538.35 538.35
Exercise price (`) 470.05 529.15 433.40 548.45 548.45
Expected volatility (%) 40.64 39.67 44.82 44.22 44.22
Expected dividend rate (%) 0 0 0 0 0
Life of the options granted (years)
Vest 1 - 3.00 Vest 2 - 3.50 Vest 3 - 4.00 Vest 4 - 4.50
Vest 1 - 3.00 Vest 2 - 3.50 Vest 3 - 4.00 Vest 4 - 4.50
Vest 1 - 3.00 Vest 2 - 3.50 Vest 3 - 4.00 Vest 4 - 4.50
Vest 1 - 3.00 Vest 2 - 3.50 Vest 3 - 4.00 Vest 4 - 4.50
Vest 1 - 3.00 Vest 2 - 3.50 Vest 3 - 4.00 Vest 4 - 4.50
Risk-free interest rate (%)
Vest 1 - 7.89 Vest 2 - 7.88 Vest 3 - 7.88 Vest 4 - 7.88
Vest 1 - 8.02 Vest 2 - 8.00 Vest 3 - 8.01 Vest 4 - 8.06
Vest 1 - 7.69 Vest 2 - 7.73 Vest 3 - 7.78 Vest 4 - 7.84
Vest 1 - 7.58 Vest 2 - 7.64 Vest 3 - 7.73 Vest 4 - 7.80
Vest 1 - 7.59 Vest 2 - 7.66 Vest 3 - 7.75 Vest 4 - 7.83
Fair value of the option
Vest 1 - 166.80 Vest 2 - 181.89 Vest 3 - 195.91 Vest 4 - 208.96
Vest 1 - 196.93 Vest 2 - 214.08 Vest 3 - 230.17 Vest 4 - 245.50
Vest 1 - 165.38 Vest 2 - 179.89 Vest 3 - 193.37 Vest 4 - 205.98
Vest 1 - 201.33 Vest 2 - 219.55 Vest 3 - 236.66 Vest 4 - 252.57
Vest 1 –193.45 Vest 2 - 210.27 Vest 3 – 225.99 Vest 4 - 240.64
Weighted average fair value 188.39 221.67 186.16 227.53 217.59
The expected life of the stock option is based on historical data and current expectations and is not necessarily indicative of exercise patterns that may occur. The expected volatility reflects the assumption that the historical volatility for the one year period ended on the date of grant is indicative of future trends, which also may not necessarily be the actual outcome.
Stock options modified during the year (incremental fair value calculated using the Black-Scholes Model):
Particulars Before After Before After
Details of the plan Plan III (a) Plan III (c)
Share price on the date of modification (`) 431.20 431.20 449.55 449.35
Exercise price (`) 300.00 300.00 300.00 300.00
Expected volatility (%) 44.23 44.23 43.47 43.47
Life of the options granted (years) 0.003 0.5 0.003 0.5
Risk-free interest rate (%) 7.24 7.24 7.30 7.30
Expected dividend rate (%) 0.00 0.00 0.00 0.00
Fair value of the option 131.26 147.11 149.61 164.1
Incremental fair value 15.85 14.49
NOTES TO FINANCIAL STATEMENTS FOR THE YEAR ENDED MARCH 31, 2016 (Contd.)

121 122
BHARAT FINANCIAL INCLUSION LIMITED Annual Report 2016 BHARAT FINANCIAL INCLUSION LIMITED Annual Report 2016
Effect of the share-based payment plans on the statement of profit andloss and on the financial position:
(Amount in ` unless otherwise stated)
Particulars For the year ended March 31, 2016
For the year ended March 31, 2015
Directors stock option expenditure 2,472,693 10,360,558
Employees stock option expenditure 107,804,885 95,974,217
Subtotal 110,277,578 106,334,775
Total compensation cost pertaining to equity-settled employee share based payment
110,277,578 106,334,775
Particulars As at March 31, 2016
As at March 31, 2015
Stock options outstanding (gross) 327,939,283 429,975,441
Deferred compensation cost outstanding (80,628,531) (178,502,599)
Stock options outstanding (net) 247,310,752 251,472,842
31. Retirement benefits
The Company has a defined benefit gratuity plan. Every employee who has completed five years or more of service is eligible for gratuity on cessation of employment and it is computed at 15 days salary (last drawn salary) for each completed year of service subject to limit of `1,000,000 as per The Payment of Gratuity Act, 1972. The scheme is funded with an insurance Company in the form of a qualifying insurance policy.
The following tables summarise the components of net benefit expense recognised in the statement of profit and loss and the funded status and amounts recognised in the Balance Sheet for the gratuity plan.
Statement of profit and loss
Net employees benefit expense (recognised in employees benefit expense):
Particulars For the year ended March 31, 2016
For the year ended March 31, 2015
Current service cost 17,218,235 13,793,687
Interest cost on benefit obligation 9,494,099 7,999,270
Expected return on plan assets (2,011,060) (1,535,443)
Net actuarial (gain) / loss recognised in the year 64,392,024 19,987,322
Net employee benefit expense 89,093,298 40,244,836
Actuary return on plan assets* 4,158,694 1,544,268
*Represents expected return as determined by the actuary for financial year 2015-16.
Balance Sheet
Details of provision for gratuity:
Particulars Gratuity
March 31, 2016 March 31, 2015
Defined benefit obligation 200,488,343 118,085,811
Fair value of plan assets (51,686,625) (22,983,541)
Plan liability 148,801,718 95,102,270
NOTES TO FINANCIAL STATEMENTS FOR THE YEAR ENDED MARCH 31, 2016 (Contd.)
Changes in the present value of the defined benefit obligation are as follows:
(Amount in ` unless otherwise stated)
Particulars Gratuity
March 31, 2016 March 31, 2015
Opening defined benefit obligation 118,085,811 87,519,363
Interest cost 9,494,049 7,999,270
Current service cost 17,218,235 13,793,687
Benefits paid (10,849,460) (11,222,656)
Actuarial (gains) / losses on obligation 66,539,658 19,996,147
Closing defined benefit obligation 200,488,343 118,085,811
Changes in the fair value of plan assets are as follows:
Particulars Gratuity
March 31, 2016 March 31, 2015
Opening fair value of plan assets 22,983,541 17,648,775
Expected return 2,011,060 1,535,443
Contributions by employer 35,393,850 15,013,154
Benefits paid (10,849,460) (11,222,656)
Actuarial gains / (losses) 2,147,634 8,825
Closing fair value of plan assets 51,686,625 22,983,541
The Company expects to contribute `27,800,000 (March 31, 2015: `26,944,219) to gratuity in the next year.
The major categories of plan assets as a percentage of the fair value of total plan assets are as follows:
Particulars Gratuity
March 31, 2016 March 31, 2015
Investment with insurer 100% 100%
The overall expected rate of return on assets is determined based on the average long term rate of return expected on investment of the fund during the estimated term of the obligations.
The principal assumptions used in determining gratuity:
Particulars Gratuity
March 31, 2016 March 31, 2015
Discount rate 7.84% 8.04%
Expected rate of return on assets 8.75% 8.75%
Salary escalation rate per annum 12.5% for the first two years and 7%
there after
10% for the first two years and 7% there
after
Rates of leaving service 15% 15%
NOTES TO FINANCIAL STATEMENTS FOR THE YEAR ENDED MARCH 31, 2016 (Contd.)
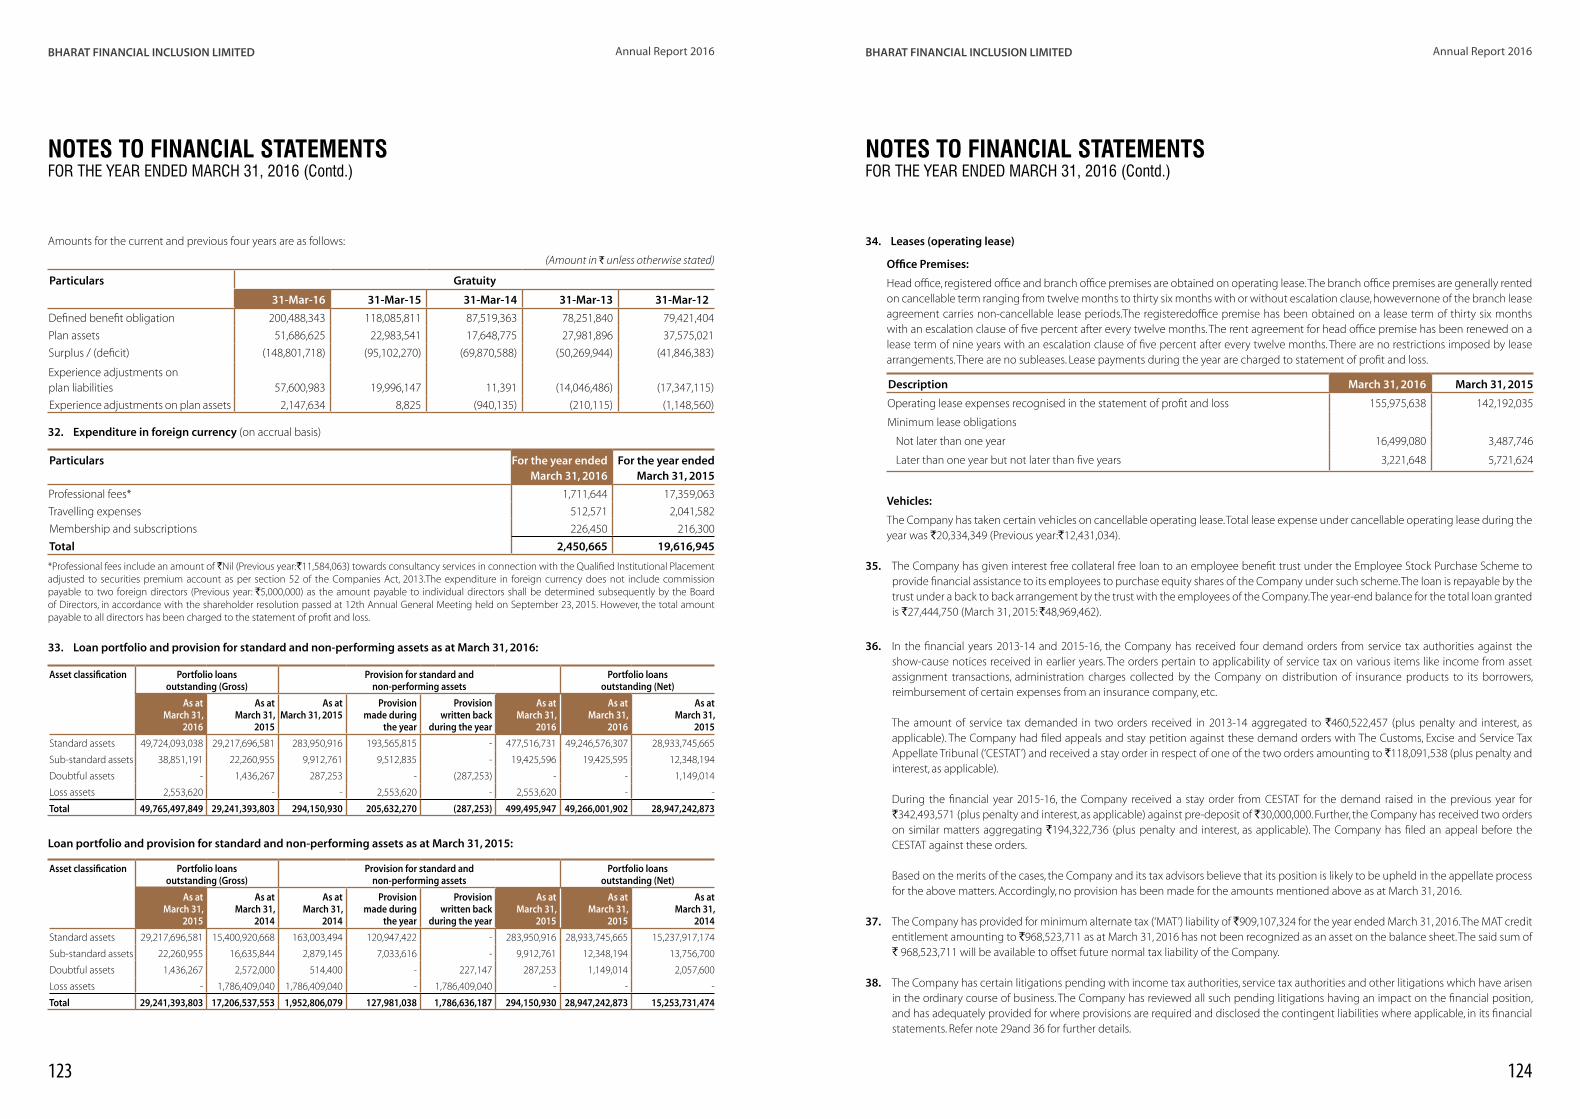
123 124
BHARAT FINANCIAL INCLUSION LIMITED Annual Report 2016 BHARAT FINANCIAL INCLUSION LIMITED Annual Report 2016
Amounts for the current and previous four years are as follows:
(Amount in ` unless otherwise stated)
Particulars Gratuity
31-Mar-16 31-Mar-15 31-Mar-14 31-Mar-13 31-Mar-12
Defined benefit obligation 200,488,343 118,085,811 87,519,363 78,251,840 79,421,404
Plan assets 51,686,625 22,983,541 17,648,775 27,981,896 37,575,021
Surplus / (deficit) (148,801,718) (95,102,270) (69,870,588) (50,269,944) (41,846,383)
Experience adjustments on plan liabilities 57,600,983 19,996,147 11,391 (14,046,486) (17,347,115)
Experience adjustments on plan assets 2,147,634 8,825 (940,135) (210,115) (1,148,560)
32. Expenditure in foreign currency (on accrual basis)
Particulars For the year ended March 31, 2016
For the year ended March 31, 2015
Professional fees* 1,711,644 17,359,063
Travelling expenses 512,571 2,041,582
Membership and subscriptions 226,450 216,300
Total 2,450,665 19,616,945
*Professional fees include an amount of `Nil (Previous year:`11,584,063) towards consultancy services in connection with the Qualified Institutional Placement adjusted to securities premium account as per section 52 of the Companies Act, 2013.The expenditure in foreign currency does not include commission payable to two foreign directors (Previous year: `5,000,000) as the amount payable to individual directors shall be determined subsequently by the Board of Directors, in accordance with the shareholder resolution passed at 12th Annual General Meeting held on September 23, 2015. However, the total amount payable to all directors has been charged to the statement of profit and loss.
33. Loan portfolio and provision for standard and non-performing assets as at March 31, 2016:
Asset classification Portfolio loans outstanding (Gross)
Provision for standard and non-performing assets
Portfolio loans outstanding (Net)
As atMarch 31,
2016
As atMarch 31,
2015
As atMarch 31, 2015
Provision made during
the year
Provision written back
during the year
As atMarch 31,
2016
As atMarch 31,
2016
As atMarch 31,
2015
Standard assets 49,724,093,038 29,217,696,581 283,950,916 193,565,815 - 477,516,731 49,246,576,307 28,933,745,665
Sub-standard assets 38,851,191 22,260,955 9,912,761 9,512,835 - 19,425,596 19,425,595 12,348,194
Doubtful assets - 1,436,267 287,253 - (287,253) - - 1,149,014
Loss assets 2,553,620 - - 2,553,620 - 2,553,620 - -
Total 49,765,497,849 29,241,393,803 294,150,930 205,632,270 (287,253) 499,495,947 49,266,001,902 28,947,242,873
Loan portfolio and provision for standard and non-performing assets as at March 31, 2015:
Asset classification Portfolio loans outstanding (Gross)
Provision for standard and non-performing assets
Portfolio loans outstanding (Net)
As atMarch 31,
2015
As atMarch 31,
2014
As atMarch 31,
2014
Provision made during
the year
Provision written back
during the year
As atMarch 31,
2015
As atMarch 31,
2015
As atMarch 31,
2014
Standard assets 29,217,696,581 15,400,920,668 163,003,494 120,947,422 - 283,950,916 28,933,745,665 15,237,917,174
Sub-standard assets 22,260,955 16,635,844 2,879,145 7,033,616 - 9,912,761 12,348,194 13,756,700
Doubtful assets 1,436,267 2,572,000 514,400 - 227,147 287,253 1,149,014 2,057,600
Loss assets - 1,786,409,040 1,786,409,040 - 1,786,409,040 - - -
Total 29,241,393,803 17,206,537,553 1,952,806,079 127,981,038 1,786,636,187 294,150,930 28,947,242,873 15,253,731,474
NOTES TO FINANCIAL STATEMENTS FOR THE YEAR ENDED MARCH 31, 2016 (Contd.)
34. Leases (operating lease)
yy Office Premises:
yy Head office, registered office and branch office premises are obtained on operating lease. The branch office premises are generally rented on cancellable term ranging from twelve months to thirty six months with or without escalation clause, howevernone of the branch lease agreement carries non-cancellable lease periods.The registeredoffice premise has been obtained on a lease term of thirty six months with an escalation clause of five percent after every twelve months. The rent agreement for head office premise has been renewed on a lease term of nine years with an escalation clause of five percent after every twelve months. There are no restrictions imposed by lease arrangements. There are no subleases. Lease payments during the year are charged to statement of profit and loss.
Description March 31, 2016 March 31, 2015
Operating lease expenses recognised in the statement of profit and loss 155,975,638 142,192,035
Minimum lease obligations
Not later than one year 16,499,080 3,487,746
Later than one year but not later than five years 3,221,648 5,721,624
yy
yy Vehicles:
yy The Company has taken certain vehicles on cancellable operating lease. Total lease expense under cancellable operating lease during the year was `20,334,349 (Previous year:`12,431,034).
yy
35. The Company has given interest free collateral free loan to an employee benefit trust under the Employee Stock Purchase Scheme to provide financial assistance to its employees to purchase equity shares of the Company under such scheme. The loan is repayable by the trust under a back to back arrangement by the trust with the employees of the Company. The year-end balance for the total loan granted is `27,444,750 (March 31, 2015: `48,969,462).
yy
36. In the financial years 2013-14 and 2015-16, the Company has received four demand orders from service tax authorities against the show-cause notices received in earlier years. The orders pertain to applicability of service tax on various items like income from asset assignment transactions, administration charges collected by the Company on distribution of insurance products to its borrowers, reimbursement of certain expenses from an insurance company, etc.
The amount of service tax demanded in two orders received in 2013-14 aggregated to `460,522,457 (plus penalty and interest, as applicable). The Company had filed appeals and stay petition against these demand orders with The Customs, Excise and Service Tax Appellate Tribunal (‘CESTAT’) and received a stay order in respect of one of the two orders amounting to `118,091,538 (plus penalty and interest, as applicable).
During the financial year 2015-16, the Company received a stay order from CESTAT for the demand raised in the previous year for `342,493,571 (plus penalty and interest, as applicable) against pre-deposit of `30,000,000. Further, the Company has received two orders on similar matters aggregating `194,322,736 (plus penalty and interest, as applicable). The Company has filed an appeal before the CESTAT against these orders.
Based on the merits of the cases, the Company and its tax advisors believe that its position is likely to be upheld in the appellate process for the above matters. Accordingly, no provision has been made for the amounts mentioned above as at March 31, 2016.
37. The Company has provided for minimum alternate tax (‘MAT’) liability of `909,107,324 for the year ended March 31, 2016. The MAT credit entitlement amounting to `968,523,711 as at March 31, 2016 has not been recognized as an asset on the balance sheet. The said sum of ` 968,523,711 will be available to offset future normal tax liability of the Company.
38. The Company has certain litigations pending with income tax authorities, service tax authorities and other litigations which have arisen in the ordinary course of business. The Company has reviewed all such pending litigations having an impact on the financial position, and has adequately provided for where provisions are required and disclosed the contingent liabilities where applicable, in its financial statements. Refer note 29and 36 for further details.
yy
NOTES TO FINANCIAL STATEMENTS FOR THE YEAR ENDED MARCH 31, 2016 (Contd.)

125 126
BHARAT FINANCIAL INCLUSION LIMITED Annual Report 2016 BHARAT FINANCIAL INCLUSION LIMITED Annual Report 2016
NOTES TO FINANCIAL STATEMENTS FOR THE YEAR ENDED MARCH 31, 2016 (Contd.)
39. Dues to micro,small and medium enterprises
yy There are no amounts that need to be disclosed in accordance with the Micro Small and Medium Enterprise Development Act, 2006 (the ‘MSMED’) pertaining to micro or small enterprises.
yy
yy For the year ended March 31, 2016, no supplier has intimated the Company about its status as micro or small enterprises or its registration with the appropriate authority under MSMED.
yy
40. Additional disclosures required by the RBI
a. Capital to Risk AssetsRatio (‘CRAR’):
Particulars March 31, 2016 March 31, 2015
i) CRAR (%) 23.07% 31.69%
ii) CRAR – Tier I Capital (%) 23.07% 31.69%
iii) CRAR – Tier II Capital (%) 0.00% 0.00%
iv) Amount of subordinated debt raised as Tier-II capital - -
v) Amount raised by issue of Perpetual Debt Instruments - -
yy b. Investments:
(` in crore)
Particulars March 31, 2016 March 31, 2015
(1) Value of Investments
(i) Gross Value of Investments
(a) in India 0.20 0.20
(a) outside India, - -
(ii) Provisions for Depreciation
(a) in India - -
(a) outside India, - -
(iii) Net Value of Investments
(a) in India 0.20 0.20
(a) outside India, - -
(2) Movement of provisions held towards depreciation on investments
(i) Opening balance - -
(ii) Add : Provisions made during the year - -
(iii) Less : Write-off / write-back of excess provisions during the year - -
(iv) Closing balance - -
yy
yy c. Derivatives:
The Company has no transactions / exposure in derivatives in the current and previous year.
The Company has no unhedged foreign currency exposure as on March 31, 2016 (March 31, 2015: Nil).
NOTES TO FINANCIAL STATEMENTS FOR THE YEAR ENDED MARCH 31, 2016 (Contd.)
yy d. Disclosures relating to Securitisation: During the year the Company has sold loans through securitization. The information on securitization activity of the Company as an
originator is as shown below: (` in crore)
Particulars For the year ended March 31, 2016
For the year ended March 31, 2015
Total number of loans securitized 1,488,135 1,637,891
Total book value of loans securitized 2,139.32 1,432.54
Total book value of loans securitizedincluding loans placed as collateral 2,319.92 1,558.66
Sale consideration received for loans securitized 2,139.32 1,432.54
Excess interest spread recognised in the statement of profit and loss 86.83 66.75
Particulars As at March 31, 2016
As at March 31, 2015
Credit enhancements provided and outstanding (Gross):
Interest subordination 123.74 42.49
Principal subordination 157.92 86.33
Cash collateral 114.14 102.03
(` in crore)
Sr. No.
Particulars For the year ended March 31, 2016
For the year ended March 31, 2015
1. No. of SPVs sponsored by the NBFC for securitisation transactions during the year
7 8
2. Total amount of securitised assets as per the books of the SPVs sponsored by the NBFC as on the date of balance sheet:
1,885.96 1,089.56
3. Total amount of exposures retained to comply with minimum retention requirement (‘MRR’) as on the date of balance sheet:a) Off balance sheet exposures - First loss - - - Others - - b) On balance sheet exposures - First loss 157.92 86.33 - Others - -
4. Amount of exposures to other than MRR:a) Off-balance sheet exposures i) Exposure to own securitisations - First loss - - - Others - - ii) Exposure to third party securitisations - First loss - - - Others - - a) On-balance sheet exposures i) Exposure to own securitisations - First loss 237.88 144.52 - Others ii) Exposure to third party securitisations - First loss - -
- Others - -
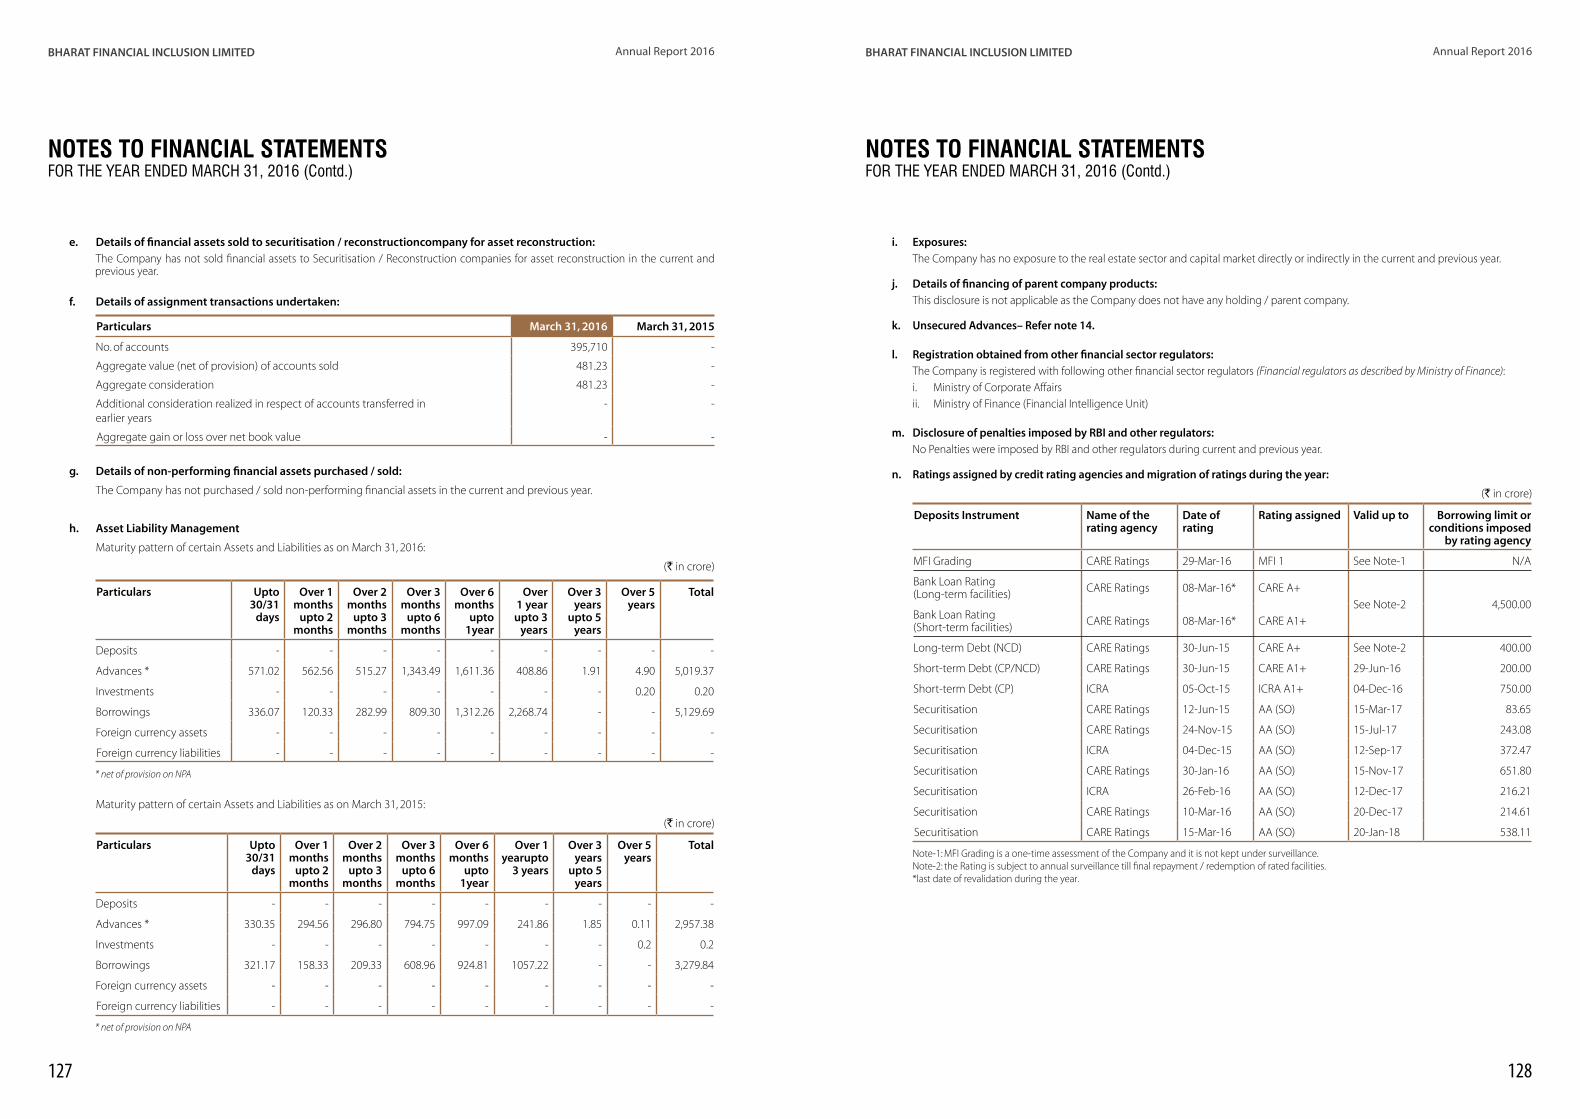
127 128
BHARAT FINANCIAL INCLUSION LIMITED Annual Report 2016 BHARAT FINANCIAL INCLUSION LIMITED Annual Report 2016
yy e. Details of financial assets sold to securitisation / reconstructioncompany for asset reconstruction: The Company has not sold financial assets to Securitisation / Reconstruction companies for asset reconstruction in the current and
previous year.
yy f. Details of assignment transactions undertaken:
Particulars March 31, 2016 March 31, 2015
No. of accounts 395,710 -
Aggregate value (net of provision) of accounts sold 481.23 -
Aggregate consideration 481.23 -
Additional consideration realized in respect of accounts transferred in earlier years
- -
Aggregate gain or loss over net book value - -
yy g. Details of non-performing financial assets purchased / sold:
yy The Company has not purchased / sold non-performing financial assets in the current and previous year.
yy
yy h. Asset Liability Management
yy Maturity pattern of certain Assets and Liabilities as on March 31, 2016:
yy (` in crore)
Particulars Upto 30/31
days
Over 1 months
upto 2 months
Over 2 months
upto 3 months
Over 3 months
upto 6 months
Over 6 months
upto 1year
Over 1 year upto 3
years
Over 3 years
upto 5 years
Over 5 years
Total
Deposits - - - - - - - - -
Advances * 571.02 562.56 515.27 1,343.49 1,611.36 408.86 1.91 4.90 5,019.37
Investments - - - - - - - 0.20 0.20
Borrowings 336.07 120.33 282.99 809.30 1,312.26 2,268.74 - - 5,129.69
Foreign currency assets - - - - - - - - -
Foreign currency liabilities - - - - - - - - -
* net of provision on NPA
yy Maturity pattern of certain Assets and Liabilities as on March 31, 2015:
(` in crore)
Particulars Upto30/31
days
Over 1 months
upto 2 months
Over 2 months
upto 3 months
Over 3 months
upto 6 months
Over 6 months
upto 1year
Over 1 yearupto
3 years
Over 3 years
upto 5 years
Over 5 years
Total
Deposits - - - - - - - - -
Advances * 330.35 294.56 296.80 794.75 997.09 241.86 1.85 0.11 2,957.38
Investments - - - - - - - 0.2 0.2
Borrowings 321.17 158.33 209.33 608.96 924.81 1057.22 - - 3,279.84
Foreign currency assets - - - - - - - - -
Foreign currency liabilities - - - - - - - - -
* net of provision on NPA
NOTES TO FINANCIAL STATEMENTS FOR THE YEAR ENDED MARCH 31, 2016 (Contd.)
i. Exposures: The Company has no exposure to the real estate sector and capital market directly or indirectly in the current and previous year.
j. Details of financing of parent company products: This disclosure is not applicable as the Company does not have any holding / parent company.
k. Unsecured Advances– Refer note 14.
l. Registration obtained from other financial sector regulators: The Company is registered with following other financial sector regulators (Financial regulators as described by Ministry of Finance):
i. Ministry of Corporate Affairsii. Ministry of Finance (Financial Intelligence Unit)
m. Disclosure of penalties imposed by RBI and other regulators: No Penalties were imposed by RBI and other regulators during current and previous year.
n. Ratings assigned by credit rating agencies and migration of ratings during the year:
(` in crore)
Deposits Instrument Name of the rating agency
Date of rating
Rating assigned Valid up to Borrowing limit or conditions imposed
by rating agency
MFI Grading CARE Ratings 29-Mar-16 MFI 1 See Note-1 N/A
Bank Loan Rating (Long-term facilities) CARE Ratings 08-Mar-16* CARE A+
See Note-2 4,500.00Bank Loan Rating (Short-term facilities) CARE Ratings 08-Mar-16* CARE A1+
Long-term Debt (NCD) CARE Ratings 30-Jun-15 CARE A+ See Note-2 400.00
Short-term Debt (CP/NCD) CARE Ratings 30-Jun-15 CARE A1+ 29-Jun-16 200.00
Short-term Debt (CP) ICRA 05-Oct-15 ICRA A1+ 04-Dec-16 750.00
Securitisation CARE Ratings 12-Jun-15 AA (SO) 15-Mar-17 83.65
Securitisation CARE Ratings 24-Nov-15 AA (SO) 15-Jul-17 243.08
Securitisation ICRA 04-Dec-15 AA (SO) 12-Sep-17 372.47
Securitisation CARE Ratings 30-Jan-16 AA (SO) 15-Nov-17 651.80
Securitisation ICRA 26-Feb-16 AA (SO) 12-Dec-17 216.21
Securitisation CARE Ratings 10-Mar-16 AA (SO) 20-Dec-17 214.61
Securitisation CARE Ratings 15-Mar-16 AA (SO) 20-Jan-18 538.11
Note-1: MFI Grading is a one-time assessment of the Company and it is not kept under surveillance. Note-2: the Rating is subject to annual surveillance till final repayment / redemption of rated facilities. *last date of revalidation during the year.
NOTES TO FINANCIAL STATEMENTS FOR THE YEAR ENDED MARCH 31, 2016 (Contd.)

129 130
BHARAT FINANCIAL INCLUSION LIMITED Annual Report 2016 BHARAT FINANCIAL INCLUSION LIMITED Annual Report 2016
o. Provisions and Contingencies (shown under the head expenditure in Statement of Profit and Loss) (` in crore)
Particulars March 31, 2016 March 31, 2015
Provisions for depreciation on Investment - -
Provision made towards Income tax 90.91 6.51
Provision towards NPA 1.18 (177.96)
Provision for standard Assets 19.36 12.09
Provision for securitised / managed portfolio 11.49 (0.04)
Provision for leave benefits 2.86 2.59
Provision for gratuity 8.91 4.02
Provision for advances recoverable in cash or kind 0.06 0.08
Provision for Impairment loss (0.04) (0.03)
p. Draw down from Reserves: There has been no draw down from reserves during the year ended March 31, 2016 (previous year: Nil).
q. Concentration of Advances, Exposures and NPAs:(` in crore)
Particulars March 31, 2016 March 31, 2015
Concentration of Advances
Total advances to twenty largest borrowers 0.26 0.26
(%) of advances to twenty largest borrowers to total advances 0.01% 0.01%
Concentration of Exposures
Total exposure to twenty largest borrowers/customers 0.27 0.26
(%) of exposure to twenty largest borrowers/customers to total exposure 0.01% 0.01%
Concentration of NPAs
Total exposure to top four NPA accounts 0.04 0.04
r. Sector-wise NPAs
Sector (%) of NPAs to total advances in that sector as at March 31, 2016
(%) of NPAs to total advances in that sector as at March 31, 2015
Agriculture and allied activities 0.08% 0.07%
MSME - -
Corporate borrowers - -
Services 0.07% 0.06%
Unsecured personal loans - -
Auto loans - -
Other personal loans 1.96% 0.91%
NOTES TO FINANCIAL STATEMENTS FOR THE YEAR ENDED MARCH 31, 2016 (Contd.)
s. Movement of NPAs (` in crore)
Particulars March 31, 2016 March 31, 2015
(i) Net NPAs to Net Advances (%) 0.04% 0.05%
(ii) Movement of NPAs (Gross)
(a) Opening balance ^ 2.37 180.56
(b) Additions during the year 18.59 2.19
(c) Reductions during the year (incl. loans written off ) (16.82) (180.38)
(d) Closing balance 4.14 2.37
(iii) Movement of Net NPAs
(a) Opening balance 1.35 1.58
(b) Additions during the year 8.97 1.20
(c) Reductions during the year (8.38) (1.43)
(d) Closing balance 1.94 1.35
(iv) Movement of provisions for NPAs
(a) Opening balance 1.02 178.98
(b) Provisions made during the year 9.62 0.99
(c) Write-off / write-back of excess provisions (8.44) (178.95)
(d) Closing balance 2.20 1.02
^ Opening balance of NPAs include amount of `Nil (Previous year: `178.64 crore) representing portfolio in the state of Andhra Pradesh which had been fully provided for.
t. Disclosure of Customer Complaints
Particulars For the year ended March 31, 2016
For the year ended March 31, 2015
(i) No. of complaints pending at the beginning of the year 1,464 239
(ii) No. of complaints received during the year 17,164 13,474
(iii) No. of complaints redressed during the year 18,060 12,249
(iv) No. of complaints pending at the end of the year 568 1,464
The Company has a Customer Grievance Redressal Mechanism including an independent ombudsman for convenience of customers to register their complaints and for the Company to monitor and redress them.
u. Information on instances of fraud Instances of fraud for the year ended March 31, 2016: (` in crore)
Nature of fraud No. of cases Amount of fraud Recovery Amount written-off
Cash embezzlement 65 0.53 0.38 0.15
Loans given against fictitious documents 57 1.31 0.61 0.71
Fraud by borrowers 5 0.03 0.01 0.02
NOTES TO FINANCIAL STATEMENTS FOR THE YEAR ENDED MARCH 31, 2016 (Contd.)

131 132
BHARAT FINANCIAL INCLUSION LIMITED Annual Report 2016 BHARAT FINANCIAL INCLUSION LIMITED Annual Report 2016
Instances of fraud for the year ended March 31, 2015: (` in crore)
Nature of fraud No. of cases Amount of fraud Recovery Amount written-off
Cash embezzlement^ 21 0.20 0.10 0.10
Loans given against fictitious documents 9 0.06 0.04 0.03
Fraud by borrowers 2 0.02 - 0.02
^Includes one case of security misappropriation amounting to `0.02 crore which has been recovered.
v. Information on Net Interest Margin:
Particulars For the year endedMarch 31, 2016
For the year endedMarch 31, 2015
Average interest (a) 21.42% 22.84%
Average effective cost of borrowing (b) 11.84% 13.16%
Net interest margin (a-b) 9.58% 9.68%
w. Outstanding of loans against security of gold as a percentage to total assets is 0.29% (March 31, 2015: 1.05%).yy
41. Previous year’s figures have been regrouped where necessary to conform to this year’s classification.
NOTES TO FINANCIAL STATEMENTS FOR THE YEAR ENDED MARCH 31, 2016 (Contd.)
NOTES
For and on behalf of the Board of Directors of SKS Microfinance Limited
sd/- sd/- sd/- sd/- sd/- P.H. Ravikumar M.R.Rao S.Dilli Raj Ashish Damani Rajendra Patil Non-Executive Chairman Managing Director and President Chief Financial Officer Company Secretary Chief Executive Officer
133 134
BHARAT FINANCIAL INCLUSION LIMITED Annual Report 2016 BHARAT FINANCIAL INCLUSION LIMITED Annual Report 2016
NOTES

Most EFFICIENT MFI on the GLOBEBharat Financial Inclusion Limited
Annual Report 2016
(formerly known as ‘SKS Microfinance Limited’)
Bharat Financial Inclusion Ltd(formerly known as ‘SKS Microfinance Limited’)CIN: L65999MH2003PLC250504Registered office: Unit No. 410, Madhava, Bandra-Kurla Complex, Bandra (East), Mumbai - 400 052, Maharashtra, India Email: [email protected] | www.sksindia.comPhone: 040-44526000 | Fax No: 040-44526001/022-26592375
Spine to be adjusted by printer
dick
enso
n
ww
w. d
icke
nson
wor
ld.c
om
Spine to be adjusted by printer