Embed Size (px)
Citation preview

JOURNALOF NEUROPHYSIOL~GY Vol. 55, No. 6, June 1986. Printed in U.S.A.
Motion Selectivity in Macaque Visual Cortex. I. Mechanisms of Direction and Speed Selectivity in Extrastriate Area MT
AKICHIKA MIKAMI, WILLIAM T. NEWSOME, AND ROBERT H. WURTZ
Laboratory ofSensorimotor Research, National Eye Institute, National Institutes ofHealth, Bethesda, Maryland 20892
SUMMARY AND CONCLUSIONS but not all, MT neurons. The peak discharge 1. Mechanisms of direction selectivity and rate for stroboscopic motion in the preferred
speed selectivity were studied in single neurons direction was more than twice the peak rate of the middle temporal visual area (MT) of to a sin@e flash for w 5o’ Of the neurons in behaving macaque monkeys. Visual stimuli Our samp1eo were presented in both smooth and strobo- 6. The direction selectivity of most MT scopic motion within a neuron’s receptive field neurons showed the effects of both inhibitory as the monkey fixated a stationary point of and facilitator-y mechanisms, and it was not light. possible to segregate MT neurons into distinct
2. Direction selectivity, speed selectivity, groups on the basis of these measures. and the spontaneous discharge characteristics 7. Suppressive mechanisms contributed to of MT neurons in behaving monkeys were speed tuning as well as direction tuning. The similar to those reported in previous studies low-speed cutoff for motion in the preferred in anesthetized monkeys. direction resulted from suppression in 82% of
3. Stroboscopic motion stimuli were se- the neurons tested. The high-speed cutoff re- quences of flashes characterized by the spatial sulted from suppression in 32% of the neurons and temporal intervals between each flash. The tested. The latter mechanism appeared to be spatial and temporal intervals were system- distinct from the inhibitory mechanism which atically varied so that suppressive and facili- acted in the null direction in that large spatial tatory interactions could be studied in both intervals were required for its activation. the preferred and null directions. Suppression and facilitation were measured by subtracting INTRODUCTION the peak discharge rate elicited by a single flash from the peak discharge rate elicited by a stro- boscopic train of flashes.
4. The dominant mechanism of direction selectivity in MT was a pronounced suppres- sion of discharge for motion in the null direc- tion which we interpreted as inhibition. The inhibition was sufficiently potent to abolish the responses to single flashed stimuli when they were embedded in a series of flashes in the null direction, and it frequently reduced the
The middle temporal area (MT) is an ex- trastriate visual area that has been identified in every primate species examined to date (3). A cluster of experimental observations suggests that MT is part of a cortical pathway that se- lectively analyzes visual motion. Dubner and Zeki (8) first reported that a preponderance of MT neurons is selective for the direction of motion of visual stimuli within their receptive fields, and this observation has been confirmed
neuronal discharge to a level below the spon- in several laboratories (2,4, 14, 39, 42). Most taneous firing rate.
5. Facilitation in the preferred direction was a prominent feature of the responses of some,
MT neurons are also selective for the speed of moving stimuli (4, 14, 25). These selectivities for stimulus motion contrast with the rela-

DIRECTION AND SPEED SELECTIVITY IN MT 1309
tively broad tolerance of MT neurons for vari- ations in stimulus color (43) and form (1).
The present study was designed to elucidate further the role of MT in the analysis of visual motion and to determine how its role differs from that of striate cortex, a major source of afferent input to MT. In these experiments we have employed visual stimuli derived from studies of motion perception. Psychophysical experiments have shown that a series of sta- tionary, flashed spots of light presented at ap- propriate spatial and temporal intervals is perceived as a moving spot of light, and this apparent motion has been used to analyze mechanisms of motion perception in humans (see Refs. 23 and 3 1 for discussion). Sequences of flashed stimuli also have been used to ex- amine physiological mechanisms of motion selectivity in several nonprimate species (5, 11, 17, 19, 20, 24, 27, 41).
We have now employed similar stimuli in a study of motion selectivity in monkey visual cortex. Our experiments had three specific goals: I) to examine the mechanisms respon- sible for the direction and speed selectivity of MT neurons; 2) to compare the responses of neurons in MT and Vl to stroboscopic mo- tion; and 3) to compare the ability of cortical neurons to extract motion information from such stimuli with the ability of psychophysical observers to perceive apparent motion in the same stimuli. Each of these topics is considered successively in this series of papers (29, 32).
In this paper we report physiological obser- vations on the mechanisms of direction and speed selectivity in MT. Neural mechanisms of direction selectivity were first studied in the rabbit retina by Barlow and Levick (5). They analyzed the effects of a conditioning stimulus on a neuron’s response to a reference stimulus. By systematically varying the location of the conditioning stimulus within the receptive field, they were able to show that the primary mechanism of direction selectivity in the rabbit retina is a potent inhibition acting in the null direction. Our stimuli consisted of a series of flashed stimuli as opposed to the two flashed stimuli used by Barlow and Levick (5). This “train” of stimuli generally traversed the entire width of the receptive field in the preferred or null direction. We chose to use multiple stim- ulus trains for two reasons. First, psychophys- ical studies indicate that human observers ex- perience better impressions of motion in mul-
tiple flash displays than in two flash displays (26, 38). Second, we observed in our initial experiments that many MT neurons with a strongly directionally selective response to smooth motion and multiple flash sequences were only weakly directional for two flash se- quences; the mechanisms responsible for di- rection selectivity seemed to require summa- tion over several stimuli in these neurons. Multiple flashes have also been employed in a recent study of motion selectivity in cat striate cortex by Cremieux, Orban, and Duy- sens (6).
The results presented in this paper indicate that a suppression of activity in the null di- rection, which we interpret as inhibition, is the most prevalent mechanism of direction selectivity in MT. However, facilitation in the preferred direction is also prominent in many MT neurons. We have also observed a sup- pressive mechanism in the preferred direction that appears to be responsible for speed tuning in many MT neurons. A brief report of this study has appeared previously (28).
METHODS
Behavioral training and electrophysiological recording
We studied the responses of neurons in five alert rhesus monkeys (Macaca mulatta). Monkeys were given a liquid reward for fixating on a small spot of light while visual stimuli were presented at ec- centric locations in the visual field (40). The mon- key’s weight was checked daily, and supplemental water and fi‘uit were given as needed to maintain the animal’s health. Each monkey was returned to its home cage after the day’s training or experi- mental session.
After the initial period of training, surgery was performed under pentobarbital sodium anesthesia. A metal cylinder was implanted over an occipital craniotomy so that electrodes approached MT after passing through striate cortex and the lunate sulcus. An eye coil was implanted under the conjunctiva of one eye (22) and connected to a plug on top of the skull. A stainless steel fixture for stabilizing head position, a recording cylinder, and the eye coil con- nector were all embedded in an acrylic cap that covered the top of the monkey’s skull. Electro- physiological recording sessions generally began af- ter a week of recovery.
At the beginning of a recording session, the mon- key’s head was secured to the chair frame using methods similar to those developed by Evarts (12, 13). A hydraulic microdrive (Narashige) was

1310 MIKAMI, NEWSOME, AND WURTZ
mounted on the recording cylinder, and glass-coated platinum-iridium microelectrodes were used for the initial identification and mapping of MT. Then, under ketamine, a stainless steel guide tube was in- troduced through the dura and held in place by cementing it to the side of the recording cylinder. The tip of the guide tube was positioned - 3-4 mm from MT, and this arrangement allowed us to quickly place a recording electrode in MT at the start of an experimental session. Flexible tungsten microelectrodes (Frederick Haer) were used to re- cord through the guide tube, and isolated neurons could be held for l-3 h using this system. About 5-15 penetrations were usually made through a guide tube before the guide tube location was changed. A slight bend was made in the electrode -3 mm from the tip so that the electrode would take a somewhat different path each day as it ap proached MT from the end of the guide tube. In histological sections, a “spray” of tracks was often seen emanating from the end of the guide tube.
The monkey’s eye position was monitored con- tinuously during recording sessions by the magnetic- search-coil technique (15, 36). During training, the monkeys were rewarded for detecting a dimming of the fixation spot, but during the experiments the monkeys were rewarded for holding their eyes within an electronically defined window whose borders were 0.5- 1 .O” from the fixation spot. A trial was aborted and data from the trial were discarded if the monkey’s eyes left this window during a trial. The monkeys made occasional small saccades within this window that may have affected the spa- tial interval between stroboscopic stimuli flashed immediately before and after such saccades. How- ever, such saccades were few relative to the total number of stimuli in most stroboscopic trains, and any effects on the spatial interval would be averaged over trials. Since there was not a systematic relation between preferred directions of the cells and direc- tions of the saccades, we feel confident that this potential artifact had a negligible effect on our data.
Behavioral control, stimulus presentation, and data collection were all directed by REX, a UNIX- based software system developed for real-time ex- periments in this laboratory (2 1) and run on a PDP 11/34 minicomputer.
Visual stimulation Visual stimuli were back projected onto a tangent
screen placed 1.5 x-ad (86 cm) away from the mon- key. Background illumination was 0.15 cd/m2. A narrow beam projected from a light-emitting diode (LED) served as a fixation point (0.1 O diam, 1.5 cd/m2). The monkey had an unobstructed view of the screen to 40” of eccentricity in all directions. Visual stimuli were presented at eccentric locations while the monkey fixated the central target during individual trials. After a neuronal spike was isolated,
the visual receptive field of the neuron was mapped using a hand-held projector. The neuron’s tuning for the direction and speed of moving visual stimuli was then determined using a beam projected onto the screen from a second LED (0.5” diam, 1.5 cd/ m2) via a pair of galvanometer-driven mirrors also located 1.5 rad from the screen. The galvanometers were controlled by the computer so that stimuli from a systematic range of directions and speeds could be selected and presented in random order. Eight different directions were tested (45” incre- ments) with smoothly moving stimuli to determine the neuron’s preferred and null directions (direction series), and eight (2-256”/s) or in later experiments ten (l-5 12”/s) different speeds were presented in the preferred and null directions to determine the neuron’s speed tuning (speed series). Stimuli com- posing a direction series or speed series were pre- sented in random order until an equal number of trials (6- 10) were obtained for each direction or speed. The preferred and null directions of motion were qualitatively identified by examining histo- grams accumulated on-line during data collection, and then the neuron’s responses to stroboscopic motion in the preferred and null directions were studied.
Stroboscopic stimuli were created by projecting the output of a stroboscope (Grass Instruments) through a four-leaf diaphragm onto the tangent screen via the same pair of galvanometer-driven mirrors described above. The stimulus was always a slit (3.0” X 0.3”) oriented orthogonally to the neuron’s preferred/null axis, and stroboscopic stimuli stepped across the entire width of the re- ceptive field in the preferred or null direction on each trial. One such trial is illustrated in Fig. 1A. The stimulus train began outside the receptive field at the lower left and stepped through the receptive field to the upper right. The center-to-center spatial separation between successive stimuli will be re- ferred to as the spatial interval, or Ax. The temporal sequence for the same trial is outlined in Fig. 1B. The stimuli were presented with a characteristic temporal interval At while the monkey fixated the target light. The stroboscopic stimuli were swept across the receptive field with the mirror-galva- nometer system, but since the duration of the stro- boscopic flash was brief ( 10 ps), each stimulus was effectively stationary. We controlled two parameters of the stimulus trains: the temporal interval between flashes, At, determined by the trigger output to the stroboscope, and the speed of the software ramp output to the galvanometers. We will refer to the galvanometer speed as the “apparent speed” of the stimulus train to indicate that all stimuli were sta- tionary and that no actual motion was present. Of course any combination of apparent speed and temporal interval resulted in a characteristic spatial interval [Ax = At X (apparent speed)], and any of

DIRECTION AND SPEED SELECTIVITY IN MT 1311
these three variables could be held constant simply by covarying the other two. We in fact ran trials in blocks of two types: constant spatial interval blocks, in which Ax was held constant while the temporal interval (and consequently the apparent speed) was randomly varied, and constant apparent speed blocks in which the speed was held constant while the temporal interval (and thus the spatial interval, also) was randomly varied. When a neuron was studied using the constant-speed approach, the ini- tial block of trials was set for the neuron’s optimal speed as previously determined with smoothly moving stimuli, and subsequent blocks varied in apparent speed until the entire range was examined (1 or 2”/s to 256 or 5 12”/s) or until the neuron was
B CD 1 ;tirn I I I I I I
I4 At
H Eye 1
V Eye v
FIG. 1. A schematic representation of the visual stim- ulation paradigm used in these experiments. A: spatial arrangement. The monkey fixated a centrally located point of light (FP), and the boundaries of the receptive field (dashed lines) were mapped during a series of fixations. After the direction and speed tuning of the neuron were determined using smoothly moving stimuli, stroboscopic trains of stimuli (rectangles) stepped across the field in the preferred (arrow) and null directions. The spatial interval, &, was measured as the center-to-center distance between adjacent flashed stimuli. Stimulus trains generally began and ended just outside the neuron’s receptive field. B: temporal sequence. The fixation point (PP) appeared and remained on for 4.0 s. The monkey fixated the target (hor- izontal eye movement, H Eye; vertical eye movement, V Eye), and stroboscopic stimuli were flashed in a regular temporal sequence across the receptive field (Stim). The temporal interval between stimuli, At, was determined by the frequency of the triggering pulse sent from the com- puter to the stroboscope. It was often convenient tochar- acterize the stroboscopic trains by their apparent speed, which is simply Ax divided by At.
lost. A similar procedure was used if a neuron was studied with constant spatial-interval trials. Over 2 h of recording were required to study a neuron completely.
Peristimulus time histograms were constructed on-line during recording sessions so that informa- tion from a particular block of trials could influence the choice of parameters for succeeding blocks. Neuronal spikes were digitized, sampled every mil- lisecond, and stored on a magnetic disk for subse- quent off-line analysis. Horizontal and vertical eye movements were constantly monitored during ex- periments and were occasionally stored on the disk as well.
Data analysis Data were quantitatively analyzed using off-line
computer programs. Peristimulus time histograms were created for each stimulus condition, and the histograms were smoothed by calculating a weighted average of the spikes in neighboring bins. For the ith bin, the weighted average was obtained using the following formula: s(z) = 0.25 X h(i - 1) + 0.5 X h(z) + 0.25 X h(i + l), where h(z) is the number of spikes in the ith bin and s(i) is the weighted av- erage after smoothing. The bin width was 20 ms. A response window was established that began 40- 60 ms after stimulus onset (to allow for the response latency), and continued up to 200 ms after stimulus termination to include the entire response.
Responses to smooth motion were quantified by calculating the average firing rate during the re- sponse window and subtracting from this value the spontaneous firing rate as measured during an 800- ms period before stimulus onset. For stroboscopi- cally presented stimuli, the average firing rate during the response window did not accurately reflect the strength of a neuron’s response, especially for trains with large temporal intervals (see Fig. 4, A, B, C, At = 320 ms). We therefore calculated the peak firing rate during the response window for all of the stroboscopic stimuli. We first identified the bin within the response window which contained the most spikes, and the peak rate was calculated from this bin after the smoothing procedure. Occasionally the first stimulus in a stroboscopic train in the null direction elicited a substantial response (for example in Fig. 4A, for a At = 20 ms). When this occurred, the beginning of the response window was adjusted to exclude this response so that. the degree of suppression in the null direction could be accurately measured.
Localization of MT and histological analysis The first few recording sessions with a monkey
were devoted to obtaining a rough topographic map of MT. Electrodes approached MT in a parasagittal plane at an angle of m20° above horizontal. With

1312 MIKAMI, NEWSOME, AND WURTZ
this approach the electrode passed through a pre- dictable sequence of gray and white matter before entering the superior temporal sulcus. MT was identified on the posterior bank of the sulcus by the characteristic direction selectivity of its neurons, by its receptive-field sizes, which were typically inter- mediate between those of striate cortex and those of MST [the area adjacent to MT along its medial and anterior border (39)], and by the topographic representation of the visual field within MT (18, 39). Neurons were occasionally encountered along the medial border of MT that were strongly direc- tionally selective with large receptive fields that could not be assigned with certainty to either MT or to MST on purely physiological grounds. If sub- sequent histological analysis clearly suggested an assignment to one area or the other then that as- signment was made. If the histology was also am- biguous, the neuron was dropped from further analysis.
Following termination of the experiments, mon- keys were deeply anesthetized with pentobarbital sodium and were perfused through the heart with saline and then formalin. The brain was sectioned
(50 pm) in the sagittal plane, and sections at regular intervals were stained for cell bodies (cresyl violet) or myelinated fibers (16). Figure 2 shows adjacent parasagittal sections through the superior temporal sulcus stained for cell bodies (Fig. 24 and for my- elinated fibers (Fig. 2B). It was not possible after several months of recording to identify each elec- trode track, but it was possible to identify the lo- cation of each guide tube and thus to infer the lo- cation of most penetrations. Each guide tube was found to be directed toward MT as determined from myelin-stained sections. In addition, electrolytic le- sions were sometimes made in MT during the last few experimental sessions on a particular monkey. Such marking lesions were found to be within his- tologically defined MT, and an example of one is shown in Fig. 2.
RESULTS
Direction and speed tuning of MT neurons Several physiological studies of MT per-
formed in anesthetized monkeys have reported
FIG. 2. Identification of the middle temporal area (MT). Micrographs are of adjacent sagittal sections through the superior temporal sulcus stained for cell bodies with cresyl violet (A) and for myelinated fibers by the method of Gallyas (B) (16). The solid white line in B indicates the dorsal border of MT. An electrolytic lesion (20 pA for 2 min), made in physiologically identified MT in the final recording session for this monkey was found to he within the myeloar- chitectonically identified MT boundaries. Calibration bar = I mm.

DIRECTION AND SPEED SELECTIVITY IN MT 1313
that a large majority of MT neurons are se- lective for the direction and speed of moving visual stimuli (2, 4, 8, 14, 25, 39, 42). Since our experiments on MT were the first in alert monkeys, we sought to determine whether there were any qualitative or quantitative dif- ferences in these basic properties between anesthetized and alert monkeys. We calculated an index of directionality for each of 70 MT neurons according to the commonly used for- mula: DI = 1 - (response in the null direction/ response in the preferred direction). The value of this index ranged from zero for neurons with no directionality, through unity for neu- rons with strong directionality, to values greater than unity for neurons that were in- hibited in the null direction. Figure 3A shows the range of direction indexes for our ran- domly selected sample of MT neurons. For comparison, Fig. 3C shows data obtained by Maunsell and Van Essen (25) in a study of
. A
n = 70 m
B n=163 i*,T----
MT in macaque monkeys anesthetized with nitrous oxide. Inspection of the two histograms indicates that the range of direction indexes is similar for neurons sampled from alert and anesthetized monkeys. About 80% of the neu- rons in our sample had direction indexes >0.8 which indicated a preferred-to-null response ratio of 5:l.
We also determined the optimal speed of motion for a sample of directionally selective MT neurons using only those with a direction index >0.8. In a sample of 134 such MT neu- rons, the distribution of optimal speeds in the alert monkey (Fig. 3B) was only slightly skewed to higher speeds than that in the anes- thetized monkey (Fig. 30, Ref. 25). Sponta- neous discharge rates in the alert monkey ranged from 0.2 to 38.8 spikes/s with a mean of 9.1 spikes/s. This value was similar to the mean spontaneous discharge rate of 9.8 spikes/ s observed in anesthetized monkeys (25). In
40
30
m
n 10
. C n=134
m
2 8 32 128
25r
m 15
10
5
0
- D -
L n=89
-
- ,
. - 2 8 32 128
DIRECTION INDEX OPTIMAL SPEED (degkec)
FIG. 3. A comparison of the direction indexes and optimal speeds of randomly isolated populations of MT neurons in the alert monkey, A and C, and in nitrous oxide-anesthetized monkeys, B and D [data replotted from Maunsell and Van Essen (291. Roth distributions are similar for the two preparations. A: distribution of direction indexes for 70 randomly sampled MT neurons recorded in alert monkey. B: distribution of preferred directions in anesthetized monkeys. C distribution of optimal speeds measured for motion in the preferred direction in alert monkeys. D: distribution of optimal speeds in anesthetized monkeys.

1314 MIISAMI, NEWSOME, AND WURTZ
sum, the direction tuning, speed tuning, and spontaneous discharge rate of MT neurons seem quite similar for our sample in alert ma- caque monkeys and the sample obtained by Maunsell and Van Essen in nitrous-oxide- anesthetized animals.
Mechanisms of direction selectivity In the five monkeys used in these experi-
ments, we isolated over 340 directionally se- lective MT neurons, and obtained complete data on the responses to smooth and strobo- scopic motion for 105 of these neurons. The following analysis is based on this sample of 105 neurons.
We measured the degree of suppression or facilitation in response to a particular stro-
boscopic train by calculating the difference between the peak response to that stimulus and the peak response to an isolated flash in the center of the receptive field. Our results indicate that inhibition in the null direction is the most prevalent mechanism of direction selectivity in MT but that facilitation in the preferred neurons.
direction was also present in many
INHIBITION. Responses of a neuron that showed clear inhibition are illustrated in Fig. 4. This neuron was spontaneously active with an average discharge rate of 19 spikes/s, and Fig. 40 shows its transient response to a single stroboscopic flash. The peak firing rate of 110 spikes/s occurred in the bin 100 ms after the flashed stimulus. Neuronal responses to stim-
A Ax = 0.4* B Ax = 1.6* C Ax = 3.60
pref. null pref. null pref. null
FIG. 4. Example of a neuron for which inhibition in the null direction was the primary mechanism of direction selectivity. A-C peristimulus time histograms showing the responses of this neuron to stroboscopic trains in the preferred (pref.) and null (null) directions for 3 different spatial intervals (hx = A, 0.4”; B, 1.6”; C, 3.6”). For each spatiaI interval responses are shown for 5 different temporal intervals (At = 20-320 ms). D: histogram showing the response of this neuron to single flashes identical to those thatcomposed the stroboscopic trains but presented here in isolation. In this and subsequent figures, each flash of the stimulus is indicated by the short, vertical tic marks below the horizontal axis of each histogram. For high-frequency stimulation (small values of At) the stimulus tic marks fused into a solid black line. The calibration mark for the response amplitude is 100 spikes per second per trial. Bin widths are 20 ms. Neuron number is shown on lower right.

DIRECTION AND SPEED SELECTIVITY IN MT 1315
ulus trains of three different spatial intervals (&, see Fig. 2) are illustrated in Fig. 4, A-C. In Fig. 4A, for example, the spatial interval was 0.4O, and the histograms show responses obtained in both the preferred and null direc- tions for five different temporal intervals (Al). In the preferred direction, stroboscopic stimuli elicited transient responses to each individual flash when the temporal interval was large (160 and 320 ms), but the responses fused in time to form a continuous discharge at small tem- poral intervals (20,40, and 80 ms). In no case, however, did the response in the preferred di-
A Pref
rection achieve a peak discharge rate that was significantly higher than that to a single flash (Fig. 40). It is therefore clear that facilitation in the preferred direction was not responsible for the directionally selective response of this neuron.
For stimulus trains in the null direction, the neuron again responded transiently to each individual flash for the largest temporal inter- val. As the temporal interval became progres- sively smaller, (in Fig. 4A, for example), the responses to the stroboscopic trains were re- duced to levels below the response to an iso-
FIG. 5. Threedimensional plot showing inhibition (below the horizontal plane) and facilitation (above the horizontal plane) measured for each pair of spatial and temporal intervals tested. (Same neuron as in Fig. 4). Inhibition and facilitation were measured by subtracting the peak response rate to a single flash from the peak response rate during the presentation of stroboscopic stimuli (see text). A: responses to stroboscopic stimuli presented in the preferred direction. B: responses for stimuli presented in the null direction. Inhibition was the dominant mechanism for generating directionally selective responses in this neuron.

1316 MIKAMI, NEWSOME, AND WURTZ
lated flash, and were eventually abolished al- together. At these smaller temporal intervals, null-direction trains actually depressed the neuron’s firing rate below the spontaneous discharge level, although the first stimulus in the receptive field continued to elicit a clear transient positive response. The suppression of the response in the null direction cannot be attributed to a general mechanism such as ha- bituation since the neuron continued to re- spond well to stimuli of identical spatiotem- poral separation flashed in the preferred di- rection. We infer, therefore, that the direction selectivity of this neuron was due to a specific inhibitory mechanism that was activated when successive stimuli were presented in the null direction with appropriate spatial and tem- poral interflash intervals.
Figure 4, B and C, showed the response of the same neuron over the same range of tem- poral intervals for larger values of AX. For a
spatial interval of 1.6O (Fig. 4B) we continued to observe a complete inhibition of the re- sponse to null direction trains at the smallest temporal interval (excepting the response to the initial flash) although the depression below the spontaneous firing rate was no longer ev- ident. For a spatial interval of 3.2O (Fig. 4C), inhibition in the null direction was minimal.
The spatial and temporal limits of the in- hibitory mechanism in this neuron are shown in Fig. 5. The spatial and temporal intervals are plotted in the horizontal plane, and the amount of facilitation (above the horizontal plane) or inhibition (below the horizontal plane) observed for each combination of AX and At is plotted on the vertical axis. In Fig. 54 some facilitation is evident in the preferred direction for temporal intervals of 20 and 40 ms when the spatial interval was 1.2O or less. However, the dominant effect was a strong in- hibition in the null direction (Fig. 5B), which
SINGLE FLASH PEAK (spikes/set)
FIG. 6. Relation between inhibition in the null direction and peak response to a single flash for 105 directionally selective MT neurons. Neurons fell on the 45” dashed line if the responses to individual flashes were completely inhibited during null-direction stimulation. Neurons above the dashed line were inhibited below the spontaneous discharge rate, whereas neurons below the dashed line were not fully inhibited. Inhibition in the null direction was determined by measuring the peak response rate to stroboscopic trains of all tested spatiotemporal combinations and taking the mean of the three smallest response rates. This mean rate was then subtracted from the peak response rate to a single flash to obtain the measure of inhibition plotted. Note that because of the limit imposed by background rate, points are not free to vary far above the diagonal line; points below the diagonal line are not so constrained. The fact that the neurons, in general, cluster about the 45O line indicates that strong inhibition in the null direction WaS present in most MT neurons.

DIRECTION AND SPEED SELECTIVITY IN MT 1317
was effective for spatial intervals approaching 3.2O and for temporal intervals up to 160 ms.
We found inhibition in the null direction in every directionally selective MT neuron for which a test could be made. Since we measured inhibition by comparing the peak response during a stimulus train to the peak response to a single flash, we could not test for inhibition in those cells that did not respond to a single flash (about 10% of our sample). Figure 6 shows the amount of inhibition measured in each of 105 directionally selective MT neurons as a function of the neuron’s response to an isolated flash. The points for most neurons lie close to the 45’ line, which indicates that in- hibition in the null direction eliminated the response to single flashes for most MT neu- rons. The points clustered about the 45” line even for small, single-flash peak responses; this clustering suggests that the inhibitory mech- anism was present in all directionally selective MT neurons and that our inability to detect
it in a few neurons was simply due to the lim- itation imposed by a lack of response to single flashes. FACILITATION. The direction selectivity of MT neurons was also influenced by a facili- tatory mechanism that was observed in the preferred direction. This effect was most ob vious in neurons that failed to respond to a single stroboscopic flash (- 10% of our sam- ple). For example, the neuron in Fig. 7 had a low spontaneous firing rate (0.7 spikes/s), and the histogram in Fig. 7B shows that the neuron failed to respond to a single flash at the center of the receptive field. In Fig. 7A it is clear that the neuron was unresponsive to stroboscopic trains in either direction for a temporal inter- val of 320 ms. As the temporal interval de- creased, the neuron continued to be unre- sponsive in the null direction but began to respond in the preferred direction (Fig. 7; At 20, 40, 80 ms). The responses elicited in the preferred direction were clearly due to a facil-
A Ax= 1.2
pref. null
At = 20 ms .a 1 Y 11.11.l
B I I 1 I I I I I I 1 I JJ
I I
100 splsec
1 set
Cl04
FIG. 7. Example of a neuron with substantial facilitation in the preferred direction. A: peristimulus time histograms showing responses of this neuron to stroboscopic trains presented in the preferred (pref.) and null (null) directions for a spatial interval of 1.2O. Responses are shown for 5 different temporal intervals (20-320 msec). B: absence of response to single flashes. Bin width and stimulus marks are the same as in Fig. 4.

1318 MIKAMI, NEWSOME, AND WURTZ
itatory effect of multiple stimulus presenta- tions with appropriate temporal intervals. Thus, at a suprathreshold level, the direction selectivity of this neuron was due to a facili- tatory mechanism in the preferred direction. Figure 8 illustrates the facilitation observed in this neuron over the full range of spatial and temporal intervals tested. Figure 8A shows that a prominent facilitation was observed in the preferred direction when the temporal interval was 80 ms or less. We could not measure in- hibition in this neuron because no response was elicited by a single flash.
Facilitation in the preferred direction was observed for many *directionally selective MT
neurons. For -50% of the neurons in our sample, the peak discharge rate for stimulus trains in the preferred direction was more than twice the peak rate to a single flash, but for a small number of neurons we saw no facilita- tion at all.
We found no relation between the amount of facilitation in the preferred direction and the size of the single-flash response, in contrast to the positive correlation of inhibition in the null direction and the single-flash response (Fig. 6). We therefore conclude that the pres- ence of facilitation in the preferred direction was genuinely variable within the population of neurons in contrast with inhibition in the
A Pref
FIG. 8. Three-dimensional plot indicating the amount of facilitation for each combination of spatial and temporal intervals tested. Same neuron as in Fig. 7. Facilitation was measured as described in Fig. 5. A: stimuli presented in the preferred direction. B:
responses to stroboscopic responses to null-direction stimuli.

DIRECTION AND SPEED SELECTIVITY IN MT 1319
null direction, which was probably present in ing in MT neurons. We have obtained evi- all neurons tested. dence for a suppressive mechanism that acts
We also found no relation between the in the preferred direction and appears to de- magnitude of facilitation in the preferred di- termine the low-speed cutoff characteristics of rection and inhibition in the null direction. There is, therefore, no evidence for distinct
many speed-tuned MT neurons. In addition,
classes of neurons separable by these measures. we have observed a suppressive mechanism that is involved in the high-speed cutoff prop
Mechanisms of speed selectivity erties of about one third of MT neurons. We Our experiments have also yielded infor- will describe both of these effects as suppres-
mation concerning mechanisms of speed tun- sion, since we do not have adequate evidence
A
C
load-
so-
O- 2 4 8 16 3264128256
speed (“lsec)
speed = 2*/set
pref . null
40 I-
80 IvIILrllll$eru ll1~llllllllllll~llllllllllllllllllllllllllll~lill I ll,l1‘,l,,,ll,ll,ll,ll,ll,l11l,l1,,1,l,ll11,,l,ll,
D speed = 16Qec
Pref
f ”
LL l1,llllllllll lllllllllllll
OIC 111101 lll~lll
320 hL .I,. h‘l < I 1 I ?Tz ,,i,,l, I I I I I I I I I I I I I I II4 I ‘I,, I I I , I , I I I Ill I I
RG. 9. Suppression in the preferred direction as the basis for the low-speed cutoff of a speed-tuned MT neuron. A: speed tuning of this neuron for a smoothly moving spot of light in the preferred (closed circles) and null (open circIes) directions. B: response to a single stroboscopic flash. C and D: peristimulus time histograms showing the neuron’s response to stroboscopic trains in the preferred (pref.) and null (null) directions for 2 apparent speeds (2”/s and 16”/ s). The temporal intervals shown on the left apply to the histograms in both C and D, except for the bottom histograms in D for which the temporal interval was 224 ms. Bin width and stimulus marks, are the same as in Fig. 4.

1320 MIKAMI, NEWSOME, AND WURTZ
to invoke an inhibitory mechanism (see DIS- CUSSION).
LOW-SPEED CUTOFF MECHANISM. Figure 9A shows the speed tuning curves of one MT neuron for smooth motion in the preferred and null directions. This neuron responded optimally to smooth motion in the preferred direction for speeds between 16 and 128”/s. Figure 9D illustrates this neuron’s responses to stroboscopic motion with the apparent speed held constant at 16”/s, a speed at which smoothly moving stimuli elicited a robust re- sponse. As expected, the progression from large to small interflash intervals resulted in an inhibition of the response in the null di- rection and fusion of the transient responses for stimuli in the preferred direction. A dif- ferent pattern emerged, however, when we held the apparent speed of the stroboscopic trains constant at 2O/s, a speed at which smoothly moving stimuli failed to elicit a re- sponse. It is clear in Fig. 9C that the response of the neuron was suppressed in the preferred as well as the null direction as the interflash
A Pref 10.0
6.0 ,+@ ,+ 6’ +
0 0 0 0 ,6
0 0 0 0 O 8
0 0 0 0 0 0 G2.0
0) 0 0 0 0 O h 73 u 0 0 0 0 0 0
- 4100 x1.0 0 0 0%
2 0.6 - o o 0 0 0 0
2 -0 0 0 0 0
5 0 0 l 0 Jo.2 - O 0 a 0
d: 0 l a i= 2 0.10 - 0 l cn : 0 0
0.06 - 0
0 0 Facilitation 0 Control Level 0 Suppression
interval became smaller. This reduction in re- sponse was due to a suppressive mechanism since stimuli that elicited a reliable response when presented in isolation (Fig. 9B) com- pletely failed to do so when presented within a sequence of flashed stimuli (Fig. SC, left col- umn, At = 20-40 ms).
Figure 10 shows the results we obtained from this neuron for the full range of spatial and temporal intervals tested in both the pre- ferred (Fig. lOA) and null (Fig. 1OB) directions. Spatial and temporal interflash intervals are plotted on the vertical and horizontal axes, re- spectively. The symbols indicate whether fa- cilitation, suppression, or no change (from the single-flash peak rate) occurred for each com- bination tested. Data were collected in blocks of trials in which the apparent speed was held constant, and each diagonal line of symbols (lower left to upper right) indicates data ob- tained from one such block of trials. The number at the upper right termination of each diagonal line in Fig. 1OA gives the apparent speed (in deg/s) for each block. Suppression of responses resulting from inhibition in the
B Null C338 10.0 -
6.0 - 0 0 0 0
0 0 0 0 0
0 0 0 0 0 0 2.0 -
0 0 0 0 0
.o 0 0 0 0 0
1.0 - 10 0 0 0 0
0.6 - l l l 0 0 0
-0 0 0 0 0
0 0 0 0
0.2 - . . . O
0 0 0
0.10 - 0 0
0 0
0.06 - 0
0 0 Focilitotion 0 Control Level
0 Suppression 0.02 ’ I 1 I IIIIlll 1 I I 0.02’ I 1 I I I I I I I I 11,
10 20 40 60 100 200 400 10 20 40 60 100 200 400
TEMPORAL INTERVAL At (msec) TEMPORAL INTERVAL At (msec)
FIG. 10. Two-dimensional plots of the response suppression measured for stroboscopic stimulation in the preferred (A) and null (B) directions. Same neuron as in Fig. 9. Open circles represent spatiotemporal intervals for which facilitation was observed; diamonds indicate control level responses; j/led circles represent suppression. The control response was the peak response rate to single flashes that were randomly presented among the multiple stimulus trains. Facilitation was indicated for peak rates 30% or more above the control level, and inhibition for peak rates 30% or more below the control level. Diagonal fines of symbds (lower lefl to upper right) are lines of constant apparent speed, and the apparent speed for each diagonal is given at its upper right termination in A.
DIRECTION AND SPEED SELECTIVITY IN MT 1321
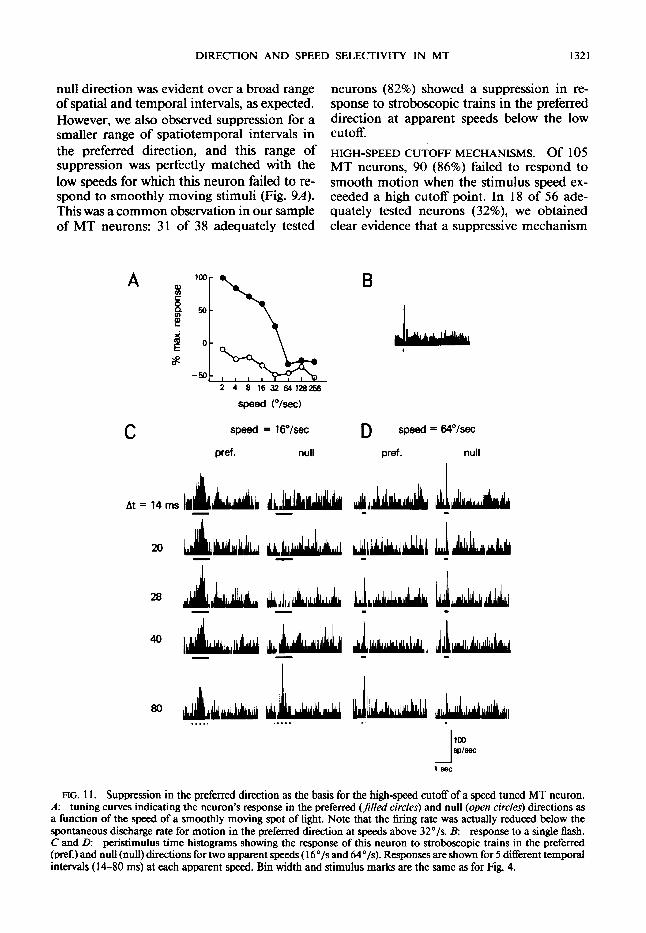
null direction was evident over a broad range of spatial and temporal intervals, as expected. However, we also observed suppression for a smaller range of spatiotemporal intervals in the preferred direction, and this range of suppression was perfectly matched with the low speeds for which this neuron failed to re- spond to smoothly moving stimuli (Fig. 94. This was a common observation in our sample of MT neurons: 31 of 38 adequately tested
A
C
neurons (82%) showed a suppression in re- sponse to stroboscopic trains in the preferred direction at apparent speeds below the low cutoff. HIGH-SPEED CUTOFF MECHANISMS. Of 105 MT neurons, 90 (86%) failed to respond to smooth motion when the stimulus speed ex- ceeded a high cutoff point. In 18 of 56 ade- quately tested neurons (32%), we obtained clear evidence that a suppressive mechanism
2 4 8163264128256
speed (“/SC)
speed = 16”lsec D speed = &l”/sec pref. null pref. null
At = 14 ms h hdh
FIG. 11. Suppression in the preferred direction as the basis for the high-speed cutoff of a speed tuned MT neuron. A: tuning curves indicating the neuron’s response in the preferred (fi!/ed circles) and null (open circles) directions as a function of the speed of a smoothly moving spot of light. Note that the firing rate was actually reduced below the spontaneous discharge rate for motion in the preferred direction at speeds above 32”/s. B: response to a single flash. C and D: peristimulus time histograms showing the response of this neuron to stroboscopic trains in the preferred (pref.) and null (null) directions for two apparent speeds ( 16”/s and 64”/s). Responses are shown for 5 different temporal intervals ( 14-80 ms) at each apparent speed. Bin width and stimulus marks are the same as for Fig. 4.

1322 MIKAMI, NEWSOME, AND WURTZ
was responsible for the high-speed cutoff properties. The responses of one such neuron are shown in Fig. 11. The speed tuning curves for smooth motion in the preferred (closed circles) and null (open circles) directions are shown in Fig. 1 IA. The neuron responded well for speeds between 2 and 32*/s in the preferred direction, but the discharge decreased below the spontaneous firing rate for speeds above 32*/s. The responses in Fig. 11 C show that an inhibitory mechanism in the null direction re- sulted in direction-selective responses for an apparent speed of 16*/s. For apparent speeds above the high cutoff (Fig. 1 lD), a very dif- ferent pattern of responses was obtained. Stro- boscopic trains in the preferred direction re- sulted in a pronounced suppression of the dis- charge, especially for small interflash intervals (14 and 20 ms). In contrast, the response in the null direction was not inhibited at these inter-stimulus intervals. This pattern of re- sponses had the curious effect of reversing the neuron’s direction selectivity in the histograms of Fig. 11 D. This reversal of direction selec- tivity is not evident for smooth motion (Fig. 11A). This is presumably because the inhibi- tory mechanism in the null direction was only
A Pref 10.0 r
6.0 - e6 $ @ + 0 0 0 0 Y6
0 0 0 0 O 8 0 0 0 0 0 0
5i2.0 -
s a 0 0 0 0 L
w l 0 0 0 0 0 x1.0 -
a:... 0 0%
2 0.6 - l 0 0 0 0 0 > - - 0
% -
0 0 0 0
0 0 0 0 Z - 0.2 - O
0 0 0
a! 0 0 0
F 2 O.lO-
0 0
CA : 0 0
0.06 - 0
0 0 Facilitation 0 Control Level
0 Suppression 0.02 @ I , I IUIllll I II
activated for temporal intervals smaller than 14 ms (Fig. 12B).
The data in Fig. 11 suggest that the inhib- itory mechanism in the null direction and the suppressive mechanism in the preferred direc- tion are active over different spatiotemporal ranges. This impression is confirmed by ex- amination of the complete data for this neuron illustrated in Fig. 12. For stimulus trains in the null direction, we observed inhibition over a broad range of spatial and temporal intervals, but in no case did the spatial interval exceed 0.6*. In contrast, the spatiotemporal range for suppression in the preferred direction was vir- tually nonoverlapping with that in the null di- rection: 0.6’ was the minimum effective spatial interval, and suppression was observed for in- tervals up to 1.8*. The apparent speeds for which we observed suppression in the pre- ferred direction corresponded well to speeds above the high cutoff point for smooth motion. These observations emphasize the fact that the suppressive mechanism in the preferred direc- tion had spatiotemporal properties that were strikingly different from the inhibitory mech- anism in the null direction. Six neurons in our sample showed a clear spatiotemporal asso-
B Null c319
6.0 0 0 0 0
J 0.6 - l 0 0 0 0 0
-0 0 0 0 0
0 0 0 0
0.2 - . . . .
0 0 0
0.10 0 0
0 0
0.06 0
FIG. 12. Two-dimensional plots of the response suppression measured for stroboscopic trains in the preferred (A) and null (B) directions. Data are shown for each spatiotemporal combination tested in the same neuron as in Fig. 11. Suppression, control level responses, and facilitation are represented by the same symbols (see key) and were calculated in the same manner as for Fig. 10.

DIRECTION AND SPEED SELECTIVITY IN MT 1323
A Pref 9211 B Null 10.0
9211 lO.OF
6.0 l 6.0 -
.
.
.
3 2.0 l eh + , * 6 -zi . . . . G 2.0 - G . . . .
h . . . . . . . . . .
a x1-O: - . . . . . a x1.0: - . . . . . % .
2 0.6 l . l 0 . . . 0.6 - * l l . l .
iz l . 0 0 0 . . s 2 - . . . . .
P l ooo” . . . .
z
a
0.2 l
O 0 0 O . . .
oo”
. . .
F
2 0.10: . . 0 0.8 =< m : . .
0.06 l
0 0.6 -< . 0 0.4 -<
. 0 0.2 -< . wad mock . 0.2 >
0.024 I 1 1 I111111 11, 0.02 1 I 1 I I.1111 I ‘I 10 20 40 60 100 200 400 10 20 4060 100 200 400
TEMPORAL INTERVAL At (msec) TEMPORAL INTERVAL At (msec)
FIG. 13. Facilitation as a basis for speed tuning. The two-dimensional plot shows the facilitation measured for each spatiotemporal combination tested for this neuron in the preferred (A) and null (B) directions. All responses were attributable to a facilitatory mechanism, since the neuron did not respond to single flashes. We could not measure inhibition, since there was no spontaneous discharge. The symbols therefore represent the amplitude of the response: larger symbols indicate larger responses. Inset in A shows the neuron’s response as a function of smooth stimulus speed in the preferred (closed circles) and null (open circles) directions.
ciation of these mechanisms similar to that illustrated in Fig. 12. Similar neurons have been observed in cat cortex that reverse direc- tion selectivity at high speeds in response to smooth motion (33, 34).
FACILITATION. Facilitatory effects enhanced the speed tuning characteristics of some MT neurons. As with direction tuning, facilitatory effects were particularly clear for neurons that yielded little or no response to a single flash. Data from one such neuron are shown in Fig. 13. We were, of course, unable to measure suppression in this neuron since there was neither a clear response to a single flash nor a clear spontaneous discharge, so the symbols in Fig. 13 simply encode the amplitude of the response with larger circles indicating a larger response (see key). The speed tuning curve for smooth motion is shown in the insert to Fig. 13A. Figure 13A shows that facilitation of re- sponses in the preferred direction occurred for spatiotemporal intervals of 0.5 O and 56 ms or less. We observed no responses in the null di- rection for this neuron at any spatiotemporal
interval. Thus facilitation effects contributed to speed tuning as well as to direction tuning.
DISCUSSION
In a classic study, Barlow and Levick (5) proposed two possible mechanisms for gen- erating directionally selective responses in rabbit retinal ganglion cells: a mechanism by which activity in individual subunits within the ganglion cell receptive field inhibited input from adjacent subunits for motion in the null direction, and a similar mechanism by which activity in subunits facilitated that in adjacent subunits for motion in the preferred direction. Our experiments provide the first analysis of these mechanisms in monkey visual cortex. We have found that both inhibitory and fa- cilitator-y mechanisms contribute to the direc- tion selectivity of MT neurons. In addition we have observed a suppressive mechanism, pos- sibly inhibitory, which acts in the preferred di- rection to limit the response of MT neurons to motion of nonoptimal speeds.

1324 MIKAMI, NEWSOME, AND WURTZ
Inhibition in the null direction Inhibition in the null direction was the most
prevalent mechanism for generating direction selectivity in MT neurons. At appropriate spatiotemporal interflash intervals, we ob- served inhibition in the null direction for most of the directionally selective MT neurons we could test. For the large majority of these neu- rons, the inhibition reduced the neuron’s firing rate to a level near or below the spontaneous discharge rate. Our measure of inhibition was conservative because we compared the peak response rate to a single flash with the peak response during null-direction stimuli. A more favorable measure would have been minimal response rate, or even average response rate during null-direction stimulation. We believe, therefore, that our measure of inhibition probably underestimated the actual value for some neurons, and we suspect that strong in- hibition was present in the null direction for all directionally selective MT neurons.
Investigations of directionally selective neurons in the visual systems of several species have provided evidence for similar null-direc- tion inhibitory mechanisms. Barlow and Lev- ick (5) concluded that inhibition between sub- units was responsible for directionally selective responses in rabbit retinal ganglion cells. Sim- ilar conclusions have been reached by other investigators working in rabbit retina (41), ground squirrel retina (27), lateral geniculate nucleus of the rabbit (24), cat striate cortex (11, 17, 19), and cat extrastriate cortex (2O), and a similar analysis has been made for the optomotor behavior of the fly (35). Most of these studies have also attempted to determine the size of the subunits (determined by the maximum distance between flashes), but we will delay a discussion of subunit size for MT neurons until the following paper, in which the data permit a comparison of MT and striate cortex.
Additional evidence implicating inhibitory mechanisms in the generation of direction- al selectivity comes from experiments by Creutzfeldt et al. (7), who recorded intracel- lularly from directionally selective neurons in cat striate cortex and observed an elevated level of IPSPs for motion in the null direction. Sillito (37) observed a reduction or elimination of direction selectivity when the GABA an- tagonist bicuculline was iontophoretically ap-
plied to neurons in cat striate cortex. These observations leave little doubt that inhibition is the dominant mechanism of direction se- lectivity for neurons in cat striate cortex, and show that the inhibition actually occurs within striate cortex itself rather than at some ante- cedent level of the pathway. Definitive exper- iments of this nature have yet to be performed in the monkey visual system.
Facilitation in the preferred direction We observed a clear facilitation of responses
in the preferred direction in many MT neu- rons. The response to preferred direction stimulation was more than double the re- sponse to a single flash in - 50% of the neurons in our sample, but a small number of our neu- rons showed little or no facilitation at all (Fig. 9). Thus facilitation, while prominent in some neurons, does not appear to be as prevalent in MT as inhibition. Varying degrees of facil- itation have also been observed in rabbit retina (5) and cat striate cortex ( 11, 17,30). However, Barlow and Levick (5) and Ganz and Felder (17) concluded that facilitation was of minor importance compared with inhibition.
Although facilitation contributed to the di- rection selectivity we observed in many MT neurons, it remains to be determined whether the facilitator-y mechanism is itself directional: Does the facilitation act in the preferred di- rection only, or would it be present for stim- ulus trains in any direction were it not over- whelmed by inhibition in the null direction? If the facilitatory effect is in fact directional, it would be best modeled according to the proposal of Barlow and Levick (5) in which individual subunits selectively facilitate the response of adjacent subunits in the preferred direction. Alternatively, facilitation may result from a general subthreshold summation of EPSPs. If so, the facilitation must take place within spatially restricted subunits of the re- ceptive field, since trains of identical temporal composition may or may not yield strong fa- cilitatory effects depending upon the spatial separation of the stimuli. For example, the neuron in Fig. 13 yielded strong facilitation when the temporal interval was 28 ms and the spatial interval was 0.22” but showed no fa- cilitation at the same temporal interval when the spatial interval was 0.9O.

DIRECTION AND SPEED SELECTIVITY IN MT 1325
Speed selectivity In contrast to direction selectivity, neural
mechanisms of speed selectivity are less well understood. In agreement with Maunsell and Van Essen (25), we have found most MT neu- rons to be speed tuned: the neurons responded well to an optimal range of speeds, and re- sponses were attenuated for lower or higher stimulus speeds. While our data do not provide a complete explanation of the speed selectivity of MT neurons, they do indicate that sup- pressive mechanisms exert a considerable ef- fect. When the apparent speed of the stimulus sequence was below the neuron’s low cutoff speed for smooth motion (Fig. 9), we found that the responses to individual flashes could be completely suppressed during stimulus trains in the preferred direction. This obser- vation weakens the case for models in which speed tuning results solely from facilitator-y interactions between subunits of the receptive field and strengthens the view that inhibition in the preferred direction must be involved in the low-cutoff characteristics of speed tuned neurons. We have conservatively referred to this low-cutoff effect as “suppression” since we cannot rule out nonspecific mechanisms such as habituation. Such nonspecific mech- anisms were excluded as the basis for direction selectivity since stimulus trains of identical spatiotemporal composition yielded good re- sponses in the preferred direction and no re- sponse in the null. However, in the case of speed tuning this control was not useful since we have already established that a directionally specific inhibitory mechanism affects respon- ses in the null direction.
Observations similar to ours were made by Wyatt and Daw (4 1) in rabbit retinal ganglion cells. They found that the response of a direc- tionally selective ganglion cell to two succes- sive flashes in the preferred direction was less than the sum of the response to each flash alone except when the spatial and temporal intervals between flashes were within a narrow optimal range. The response to the second flash appeared to be inhibited if the interflash interval was nonoptimal, and Wyatt and Daw (4 1) were able to predict the ganglion cell’s preferred speed for smoothly moving stimuli from the optimal spatial and temporal inter- vals measured for stationary stimuli. They suggested that the suppression of the response
to nonoptimal speeds resulted from inhibition that acted at an acute angle to the ganglion cell’s preferred direction.
For about one third (32%) of our MT neu- rons, suppression in the preferred direction was also involved in eliminating the responses to stimulus speeds above the high cutofl For some neurons, both smooth and stroboscopic motion suppressed the discharge below the spontaneous firing level, and such suppression for stimulus speeds above the high cutoff has also been observed in MT by Maunsell and Van Essen (25). This suppression was notable not only because of its presence in the pre- ferred direction but also because of the large spatial intervals required for its activation. In contrast to the inhibition typically observed in the null direction, we rarely observed high- speed suppression in the preferred direction for spatial intervals < 1 O. It seems likely, then, that the high-speed suppression observed in this subset of MT neurons is mediated by dif- ferent interactions than those underlying di- rection selectivity.
For about two thirds of MT neurons, we did not find any suppressive mechanisms un- derlying the high-speed cutoff. In these neu- rons, each flash that fell within the receptive field elicited a transient response even though the apparent speed of the stroboscopic train was above the high-speed cutoff. Most MT neurons, therefore, appeared capable of re- sponding to any apparent speed as long as one or more flashes fell within the receptive field. This observation is consistent with previous results of Orban et al. (33, 34) and Duysens et al. (9, lo), which showed that the high-speed cutoff properties of many neurons in cat striate cortex could be explained by the spatial and temporal summation properties of the neuron. 1 hus, responses to high speeds were stronger for neurons with large receptive fields that permitted more spatial summation (33, 34) and for neurons with rapid temporal sum- mation properties that allowed responses to brief stimuli (9, 10). It seems likely that the high-speed cutoff characteristic of most MT neurons is related to the speeds over which such summation effects occur.
Finally, we should emphasize that while we have investigated several neuronal mecha- nisms responsible for motion selectivity of MT neurons, we do not know whether the actual

1326 MIKAMI, NEWSOME, AND WURTZ
synaptic interactions are occurring within MT A. Ziminsky, histology by G. Creswell and L. Cooper, and or within structures that project to MT. Fur- typing by J. Steinberg.
ther experiments on motion processing within these afferent structures will be necessary to Present address of A. Mikami: Dept. of Neurophysiol-
determine the location of synaptic interactions ogy, Primate Research Institute, Inuyama 484, Japan.
that give rise to direction and speed selectivity in MT neurons. Present address of W. T. Newsome: Dept. of Neuro-
biology and Behavior, State University of New York, Stony Brook, NY 11789.
ACKNOWLEDGMENTS
Weare grateful for assistance in computer program de- sign by A. Hays and J. Shaw, instrument construction by
REFERENCES
1. ALBRIGHT, T. D. Direction and orientation selectivity of neurons in visual area MT of the macaque. J. Neu- rophysiol. 52: 1106- 1130, 1984.
2. ALBFUGHT, T. D., DESIMONE, R., AND GROSS, C. G. Columnar organization of directionally selective cells in visual area MT of the macaque. J. Neurophysiol. 51: 16-31, 1984.
3. ALLMAN, J. Evolution of the visual system in the early primates. In: Progress in Psychobiology and Physio- logical Psychology, edited by J. M. Sprague and A. N. Epstein. New York: Academic, 1977, vol. 7, p. l-53.
4. BAKER, J. F., PETERSEN, S. E., NEWSOME, W. T., AND ALLMAN, J. M. Visual response properties of neurons in four extrastriate visual areas of the owl monkey (AOZUS trivirgatus): a quantitative comparison of medial, dorsomedial, dorsolateral, and middle temporal areas. J. Neurophysiol. 45: 397-4 16, 198 1.
5. BARLOW, H. B. AND LEVICK, W. R. The mechanism of directionally selective units in rabbit’s retina. J. Physiol. L+ond. 178: 477-504, 1965.
6. CREMIEUX, J., ORBAN, G. A., AND DUYSENS, J. Re- sponse of cat visual cortical cells to continuously and stroboscopically illuminated moving slits compared. Vision Res. 24: 449-457, 1984.
7. CREUTZFELDT, 0. D., KUHNT, U., AND BENEVENTO, L. A. An intracellular analysis of visual cortical neu- rons to moving stimuli: responses in a cooperative neuronal network. Exp. Brain Res. 2 1: 25 l-274, 1974.
8. DUBNER, R. AND ZEIU, S. M. Response properties and receptive fields of cells in an anatomically defined region of the superior temporal sulcus in the monkey. Brain Res. 35: 528-532, 197 1.
9. DUYSENS, J., ORBAN, G. A., AND CREMIEUX, J. Functional basis for the preference for slow movement in area 17 of the cat. Vision Res. 24: 17-24, 1984.
10. DIJYSENS, J., ORBAN, G. A., AND VERBEKE, 0. Ve- locity sensitivity mechanisms in cat visual cortex. Exp. Brain Rex 45: 285-294, 1982.
11. EMERSON, R. C. AND GERSTEIN, G. L. Simple striate neurons in the cat. II. Mechanisms underlying direc- tional asymmetry and directional selectivity. J. Neu- rophysiol. 40: 136-l 55, 1977.
12. EVARTS, E. V. Methods for recording activity of in- dividuaI neurons in moving animals. Methods Med. Res. 11: 241-250, 1966.
13. EVARTS, E. V. A technique for recording activity of subcortical neurons in moving animals. Electroen- cephalogr. Clin. Neurophysiol. 24: 83-86, 1968.
Received 8 August 1985; accepted in final form 18 De- cember 1985.
14. FELLEMAN, D. J. AND KAAS, J. H. Receptive-field properties of neurons in middle temporal visual area (MT) of owl monkeys. J. Neurophysiol. 52: 488-5 13, 1984.
15. FWHS, A. F. AND ROBINSON, D. A. A method for measuring horizontal and vertical eye movement chronically in the monkey. J. Appl. Physiol. 2 1: 1068- 1070, 1966.
16. GALLYAS, F. Silver staining of myelin by means of physical development. Neural. Res. 1: 203-209, 1979.
17. GANZ, L. AND FELDER, R. Mechanism of directional selectivity in simple neurons of the cat’s visual cortex analyzed with stationary flash sequences. J. Neuro- physiol. 5 1: 294-324, 1984.
18. GATTASS, R. AND GROIN, C. G. Visual topography of striate projection zone (MT) in posterior superior temporal sulcus of the macaque. J. Neurophysiol. 46: 621-638, 1981.
19. GOODWIN, A. W., HENRY, G. H., AND BISHOP, P. 0. Direction selectivity of simple striate cells: properties and mechanism. J. Neurophysiol. 38: 1500-l 523, 1975.
20. GRUSSER, O.-J. AND GROSSER-C• RNEHLS, U. Neu- ronal mechanisms of visual movement perception and some psychophysical and behavioral correlations. In: Handbook of Sensory Physiology. Central Processing of Visual Information, edited by R. A. Jung. Berlin: Springer-Verlag, 1973, vol. VII, pt. 3A, p. 333-429.
2 1. HAYS, A. V., RICHMOND, B. J., AND OPTICAN, L. M. A UNIX-based multiple process system for real-time data acquisition and control. WESCON Conf: Proc. Sess. 2, No. l., p. l-10, 1982.
22. JUDGE, S. J., RICHMOND, B. J., AND CHU, F. C. Im- plantation of magnetic search coils for measurement of eye position: an improved method. Vision Res. 20: 535-538, 1980.
23. KOLERS, P. A. Aspects of Motion Perception. Oxford: Pergamon, 1972.
24. LEVICK, W. R., OYSTER, C. W., AND TAKAHASHI, E. Rabbit lateral geniculate nucleus: sharpener of direc- tional information. Science 165: 7 12-i 14, 1969.
25. MAIJNSELL, J. H. R. AND VAN ESSEN, D. C. Func- tional properties of neurons in middle temporal visual area of the macaque monkey. I. Selectivity for stimulus direction, speed, and orientation. J. Neurophysiol. 49: 1127-l 147, 1983.
26. MCKEE, S. P. AND WELCH, L. Sequential recruitment in the discrimination of velocity. J. Opt. Sot. Am. 2: 243-251, 1985.

DIRECTION AND SPEED SELECTIVITY IN MT 1327
27.
28.
29.
30.
31.
32.
33.
34.
35.
MICHAEL, C. R. Receptive fields of single optic nerve fibers in a mammal with an all-cone retina. II: Direc- tionally selective units. J. Neurophysiol. 3 1: 257-267, 36. 1968. MIMI, A., NEWSOME, W. T., AND WURTZ, R. H. Mechanisms of direction and speed selectivity in the 37. middle temporal visual area (MT) of the macaque monkey. Invest. Ophthalmol. Vis. Sci. 24: S 107, 1983. MIKAMI, A., NEWSOME, W. T., AND WURTZ, R. H. Motion selectivity in macaque visual cortex. II. Spa- 38. tiotemporal range of directional interactions in MT and Vl. J. Neurophysiol. 55: 1328-1339, 1986. MOVSHON, J. A., THOMPSON, I. D., AND TOLHURST, 39* D. J. Receptive field organization of complex cells in the cat’s striate cortex. J. Physiol. Land. 283: 79-99, 1978. NAKAYAMA, K. Biological image motion processing: a review. Vision Res. 25: 625-660, 1985.
4. .
NEWSOME, W. T., MIKAMI, A., AND WURTZ, R. H. Motion selectivity in macaque visual cortex. III. Psy- chophysics and physiology of apparent motion. J.
4 1 l
NeurophysioI. 55: 1340- 135 1, 1986. ORBAN, G. A., KENNEDY, H., AND MAES, H. Re- sponse to movement of neurons in areas 17 and 18 42. of the cat: velocity sensitivity. J. Neurophysiol. 45: 1043-1058, 1981.
ORBAN, G. A., KENNEDY, H., AND MAES, H. Re- sponse to movement of neurons in areas 17 and 18 43. of the cat: direction selectivity. J. Neurophysiol. 45: 1059-1073, 1981.
P~GGIO, T. AND REICHARDT, W. Visual control of
orientation behavior in the fly. Q. Rev. Biophys. 9: 377-438, 1976. ROBINSON, D. A. A method of measuring eye move- ment using a scleral search coil in a magnetic field. IEEE Trans. Biomed. Eng. 10: 137-145, 1963. SILLITO, A. M. The contribution of inhibitory mech- anisms to the receptive field properties of neurones in the striate cortex of the cat. J. Physiol. Land. 250: 305-329, 1975. SPEWING, G. Movement perception in computer- driven visual displays. Behav. Res. Meth. Instrum. 8: 144-151, 1976. VAN ESSEN, D. C., MAIJNSELL, J. H. R., AND BIXBY, J. L. The middle temporal visual area in the macaque: myeloarchitecture, connections, functional properties and topographic organization. J. Comp. Neural. 199: 293-326, 198 1. WURTZ, R. H. Visual receptive fields of striate cortex neurons in awake monkeys. J. Neurophysiol. 32: 727- 742, 1969. WYAIT, H. J. AND DAW, N. W. Directionally sensitive ganglion cells in the rabbit retina: specificity for stim- ulus direction, size, and speed, J. Narrophysiol. 38: 613-626, 1975. ZEIU, S. M. Functional organization of a visual area in the posterior bank of the superior temporal sulcus of the rhesus monkey. J. Physiol. Land. 236: 549- 573, 1974. ZEIU, S. M. The distribution of wavelength and ori- entation selective cells in different areas of monkey visual cortex. Proc. R. Sot. Land. Ser. B. 217: 449- 470, 1983.