Embed Size (px)
Citation preview

2040 Sheridan Rd. Evanston, IL 60208-4100 Tel: 847-491-3395 Fax: 847-491-9916 www.ipr.northwestern.edu [email protected]
Institute for Policy Research Northwestern University Working Paper Series
WP-12-10
Motivating Action on Energy in the U.S.
Toby Bolsen Assistant Professor of Political Science
Georgia State University
James Druckman Payson S. Wild Professor of Political Science Faculty Fellow, Institute for Policy Research
Northwestern University
Fay Lomax Cook Professor of Human Development & Social Policy and Political Science
Director and Faculty Fellow, Institute for Policy Research Northwestern University
Version: April 1, 2012
DRAFT Please do not quote or distribute without permission.

Abstract
When do citizens take action for the sake of a public good? Can rhetoric mobilize
individuals to act for the benefit of the collective? Few studies in political science explore
these questions in the context of non-electoral behavior. This working paper draws from
framing theory and models of environmental political activism to provide a framework to
understand how communications highlighting collective benefits (e.g., to the
environment), selective costs (e.g., financial), and different accounts of who is
responsible for dealing with the extant situation (i.e., individuals versus government) will
affect individuals’ decisions regarding (a) capital investments in home energy efficiency,
and (b) actions to curtail home energy use. The researchers test their hypotheses with a
survey experiment (n=1,600) that assesses behavioral intentions regarding energy
conservation and information-seeking behavior. They find that rhetoric can play a crucial
role in shaping behavior. When the government is portrayed as the agent responsible for
addressing energy problems, people are less willing to act; however, emphasizing
individuals’ responsibility significantly increases action. They also find, through a
content analysis of news articles on energy issues in the U.S. from 2001 to 2011, that
government is the agent most often portrayed as responsible for dealing with the nation’s
energy problems. Their results highlight the challenges of inducing actions for the public
good in this domain—because demobilizing messages are more prevalent than rhetoric
that might increase individuals’ contributions. This has implications for information
campaigns promoting energy efficient behaviors.

1
A primary purpose of government is to enact policies that benefit the collective good. In
doing so, governments may consider what actions citizens are willing or likely to take on their
own volition for the public good. When will individuals act in environmentally friendly ways
without selective benefits or sanctions, such as tax breaks or penalties? Can rhetorical appeals
mobilize people to act for the benefit of the collective? These are important questions given that,
in a democracy, individuals’ decisions ultimately determine collective outcomes and the types of
laws that need to be in place to promote the public good (Taylor 1987). However, few studies
explore how persuasive appeals influence non-electoral-politically-relevant actions.
This paper explores how rhetoric can affect individuals’ decisions about whether to take
action for the public good. While a large body of existing research looks at how appeals to civic
duty (Arceneaux and Nickerson 2009; Gerber and Green 2000a; 2000b; Green and Nickerson
2003; Michelson, Bedolla, and McConnell 2009) or social norms (Gerber, Green, and Larimer
2008) shape individuals’ decisions regarding whether or not to vote in elections, scant work
looks at the relative impact of appeals highlighting selective costs versus collective benefits of
taking action. We do so in the context of decisions about home energy conservation.1 These
actions are a key component of energy polices, and the aggregation of individuals’ choices can
play a big role in the balance of national energy availability.2 To explain how persuasive appeals
may influence behavior, we draw from extant research which shows that collectively beneficial
behaviors entail the calculation of costs and benefits (Finkel and Muller 1998; Lubell 2002;
1 We focus on household energy conservation because this is a sector where investment inefficiencies as a result of imperfect information may be greatest (Allcott and Greenstone 2012). The U.S. Bureau of Labor estimates that in 2007, the average U.S. household spent $2,400 on gasoline for transportation and $1,900 on natural gas, electricity, and heating oil. 2 The U.S. Department of Energy identifies four broad sectors of national energy use: transportation, residential, commercial, and industrial. Approximately one-half of U.S. energy consumption is controlled by individual consumers (U.S. Department of Energy, Annual Report, 2009).
2
Lubell, Zahran, and Vedlitz 2007). In deciding whether or not to take an action, individuals form
an attitude toward a behavior that is the result of an assessment about its likely outcomes (Ajzen
and Fishbein 2005). In doing so, salient dimensions – e.g., resulting from exposure to rhetoric -
can play a critical role in driving attitudes and ultimately behavior (Chong and Druckman 2007;
Lubell 2002).
We test predictions motivated by this work with an on-line experiment that involved
recruiting a large sample (n = 1,600) demographically representative of the overall U.S.
population. The experiment involved manipulating: (1) the value associated with the collective
benefit by adding an argument about its value in some conditions (i.e., the behavior helps the
environment); (2) attributions of responsibility for dealing with the nation’s energy problems
(i.e., individuals versus government), and (3) personal financial costs associated with taking
action. We find clear evidence that rhetoric can play a crucial role in shaping behavior. For
instance, attributing responsibility to government for dealing with energy problems demobilizes
willingness to take action. Our results highlight the challenges of inducing actions for the public
good in this domain, because demobilizing messages are more prevalent in the news relative to
messages that might increase individuals’ contributions.
Action on Energy for the Public Good
A key component of U.S. energy policy involves measures aimed at curtailing or
encouraging individual behaviors (see e.g., Borenstein 2012; Knittel 2012; Smith 2002; Stern
2000, 2005). This includes actions such as purchasing fuel efficient vehicles, reducing gasoline
usage, conserving energy at home, purchasing energy efficient appliances, and other related
choices. A challenge in motivating these behaviors is that most actions aimed at conserving
energy involve the promotion of a public good – that is, the payoff is, in part, a contribution to

3
the public good of energy conservation.3 We distinguish between actions that involve capital
investments - e.g., insulating homes, replacing automobiles, furnaces and appliances to achieve
greater energy efficiency – and behaviors that are more day-to-day and involve curtailing
personal energy use – e.g., driving less, adjusting ambient home temperature, and using
appliances less – because prior research has shown that these actions are influenced by distinct
factors (Black, Stern, and Elworth 1985; Stern 2005). Specifically, we look at weatherization
and thermostat adjustment (see Lubell, Zahran, and Vedlitz 2007). Weatherizing, or insulating
one’s home, is an investment because it requires the immediate outlay of capital and effort.
Although it may eventually save money, the initial impact involves assuming a direct financial
cost.4 In contrast, energy curtailment actions such as adjusting one’s home thermostat, installing
a smart energy meter, and obtaining more information about meters are all steps that could save
money in the short-term and collectively benefit the environment in the long-term. In sum, the
cost saving is more direct with respect to energy curtailment relative to capital investments.5
These actions receive attention, not only in policy bills (e.g., Knittel 2012; Smith 2002),
but also in media coverage (Bolsen 2011; Bolsen and Cook 2008; Wagner 2007). To gauge the
frequency with which individuals’ conservation behaviors are covered by the news media, and to
3 Allcott (2010: 5) states that “because some externalities, primarily from power plant greenhouse gas emissions, are not internalized in electricity prices, many consumers perceive that energy conservation helps provide a public good – e.g. more moderate global climate.” 4 Allcott and Greenstone (2012: 15) report that the average weatherization job costs $2,600 in upfront costs and “reduces natural gas use by 20 to 25 percent, or about $260 per year.” 5 There is some debate whether a Smart Energy Meter saves money, because the device can cost as much as $500 to install. “Smart meters” record the real time consumption of electricity and possess two-way communication capabilities that allow for real-time pricing tied to variations in the wholesale pricing of electricity. This allows consumers to shift their consumption patterns to off-peak hours when prices are lower (Joskow 2012). Utilities often provide these technologies to consumers and subsidize installation. As a result of federal subsidies and mandates, as many as 8.7 million smart meters have now been installed in residential and consumer locations – and the rate of adoption is increasing (Joskow 2012: 40-41).

4
identify prominent considerations associated with these actions in public discourse, we
conducted a content analysis of articles related to U.S. energy policy appearing in the New York
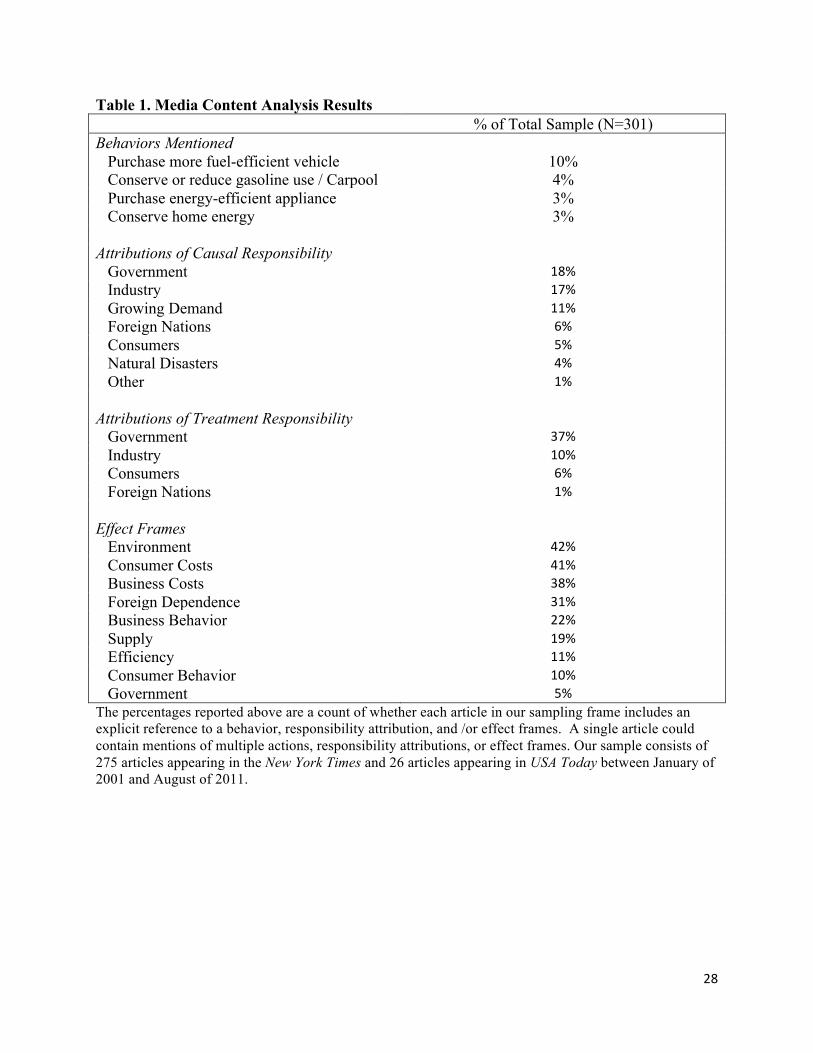
Times and USA Today between 2001 and 2011 (n = 301).6 Table 1 reports our results. First,
approximately 20% of the articles in our sampling frame include an explicit mention of actions
such as purchasing a more fuel efficient vehicle, conserving or reducing gasoline use, purchasing
energy efficient products and appliances, and reducing energy usage within the home. Thus
these actions are included in public discourse related to the larger U.S. energy situation.
[Insert Table 1 About Here]
We also coded our media data for attributions of causal (blame) and treatment (dealing
with, or fixing) responsibility related to the nation’s energy situation. Table 1 shows that there is
little explicit discussion of who is to blame for the existing situation, and when there is,
government is the primary culprit (18% of the articles in our sample blame government, whereas
17% blame industry and only 5% blame consumers). The data also suggest that there is more
discussion of whose responsibility it is to deal with the extant situation – i.e., treatment
responsibility attributions – compared to attributions of causal responsibility. Again,
government is explicitly portrayed as the primary actor responsible for solving energy problems
(37% of the articles in our sample). A smaller percent of treatment frames associate
responsibility for action with consumers (6%) and industry (10%). It is not surprising that the
government is most often seen as the causal and treatment actor responsible for the extant
6 To identify our sample of relevant news articles, we searched the Lexis-Nexis database using the search algorithm “energy policy” or “energy plan” or “energy crisis” or “energy shortage.” Wagner (2007) employs this algorithm to content analyze articles on energy issues appearing in Newsweek between 1975 and 2000. Our guided search on Lexis-Nexis produced hundreds of potentially relevant articles, and from this sample, we selected the universe of articles that focused on energy policy in the U.S between 2001 and 2011. We focused exclusively on articles that included our search terms in the headline and/or lead paragraph.
5
situation because when attributions come up, they often reflect political jockeying by those out
of office who criticize the current government for failed policy. This is a part of blame game
politics.7 We thus see political relevance in exploring the effects of attributions on individual
behavior in the domain of energy. Finally, we also content analyzed each article for any
discussion of the effects (positive and/or negative) resulting from individuals’ actions – e.g.,
effects on the environment, costs to businesses and consumers, dependence on foreign oil, and
several other outcomes. Interestingly, we find that the most prominent mentions related to the
effects of action are on the environment (42%) and consumer costs (41%).8
How Frames Influence Action
A large literature shows that how behaviors or issues are described can influence the
salience of particular dimensions in forming an opinion (Chong and Druckman 2011; Chong and
Druckman 2007; Druckman 2001; Druckman 2004). The term framing has been used by
scholars to refer to the process by which exposure to different types of communications – i.e.,
substantively different or logically equivalent – shapes individuals’ attitudes and preferences
(Druckman 2010).9 Emphasis framing effects involve communications altering the salience
and/or perceived strength of accessible considerations toward an issue or action (Iyengar and
7 These strategic attribution claims are not likely to affect policy views per se – Malhotra et al. (2009: 7) explain, “Whereas party identification may provide substantive information about the content of policy proposals, information about who was to blame for a crisis [or who is responsible for addressing it] does not provide meaningful information about the merits of a specific solution proposed to address the crisis… [but] competing blame judgments between the parties has been a central part of the debate [emphasis added]…” The attributions may affect evaluations of the standing government, however. 8 Our sample of news articles was content analyzed by three trained research assistants using an instrument we developed (available upon request). We report an inter-coder reliability statistic of .86 from a re-analysis of a random subsample of articles. 9 An attitude is an evaluation toward an object – e.g. a policy, candidate, political issue, etc. (Chong and Druckman 2007). Preferences are comparative evaluations between such objects (Druckman and Lupia 2000).

6
Kinder 1987; Zaller 1992; Druckman 2001). Although the literature documenting these effects is
quite large, fewer studies explore whether frames (embedded in persuasive appeals) directly
affect political behavior.10 This is unique because little work has explored framing in the context
of energy policy and little work has looked at the direct effects of rhetoric on non-electoral
behavior (although see Bolsen forthcoming; Brader, Suhay, and Valentino 2008; Gamson 1992;
Miller and Krosnick 2004).
The framing literature provides clear evidence that salient dimensions can play a critical
role in shaping attitudes. A matter of particular interest for us is how two types of frames that
tend to vary across contexts influence actions regarding energy conservation (see Bolsen 2011).
First is what we call an effect frame. That is, when an individual assesses whether or not to
engage in a behavior, he or she develops an attitude toward the behavior (Ajzen and Fishbein
2005). That attitude consists of assessments on various dimensions related to the behavior (e.g.,
its effects), or considerations of frames (Chong and Druckman 2007). Those dimensions are
evaluated on whether the behavior will result in positive or negative outcomes. When it comes
to energy actions, relevant considerations include dimensions that may be affected by the
behavior such as its effect on the environment and/or personal costs. For example, if the
environmental consequences of a behavior are the focus of a communication, it may increase the
likelihood of action because the individual would typically view such action as good for the
environment. On the other hand, if the consumer costs dimension is most salient, it will likely
decrease action because the individual would typically view such action as bad for his/her own
costs (money, time).Thus, which effect dimension is most salient may carry the day. Effect
10 The literature on social movements explores how frames serve as “interpretive packages” that activists use to mobilize potential adherents and constituents, appeal to authorities, and demobilize antagonists (Benford and Snow 2000; Gamson 1988; Polletta and Ho 2006).
7
frames work by increasing the salience of a particular behavioral outcome in forming an attitude
toward a behavior, which in turn increases or decreases the likelihood of the individual taking
action (contingent on belief content – i.e., the extent to which one thinks taking action to protect
the environment is a good thing). Therefore, we hypothesize that exposure to an appeal that
increases the salience of the positive collective outcomes resulting from an action (e.g., benefits
to the environment) will increase individuals’ willingness to take energy investment and
curtailment actions (relative to a control group) (hypothesis 1a). Similarly, we expect that
exposure to an appeal highlighting the selective financial costs of taking action on energy will
decrease individuals’ willingness to take action (relative to a control group) (hypothesis 1b).
Importantly, we argue that the impact of exposure to an appeal highlighting the selective costs of
these actions depends on the type of behavior in question. In the case of capital investments, we
expect that increased investment behavior will require emphasis on both individual responsibility
and the collective benefit (hypothesis 1c). Lacking either component may fail to motivate action
- unless individuals already believe strongly that their own actions make a difference in terms of
influencing collective outcomes, in which case we expect exposure to a frame highlighting the
collective benefits will be enough to motivate action (hypothesis 1d).11 In contrast, energy
curtailment behaviors such as adjusting the thermostat, installing a smart energy meter, and
obtaining more information about smart meters are all steps that could save money. As a result,
exposure to a cost frame may be seen as leading to a positive outcome – that is, highlighting
costs may encourage people to be more likely to engage in energy curtailment, regardless of
attributions since these actions have selective benefits (hypothesis 1e).
Attributions of Treatment Responsibility
11 Lubell, Zahran, and Vedlitz (2007: 395) explain that “the expected value of collective action increases as perceived personal influence increases.”
8
We are not aware of any work that looks at the impact of attributions of responsibility on
individuals’ willingness to act for the public good. Attributions can be in terms of cause or
treatment responsibility (e.g., Iyengar 1991). Iyengar (1991) finds that attribution of treatment
responsibility is a critical mediator for the belief that the government should take action to
address an issue – e.g., when experimental participants increased attribution of responsibility to
societal factors (as a result of exposure to thematic news frames) their support for government
policies to address the respective public issue increased. However, attributions can inadvertently
affect behavioral choices. For example, as people think individuals are more responsible for
collective outcomes, and they focus on that instead of selective costs or environmental benefits,
they will be more likely to take action if they think those actions matter. This can be thought of
as a dimension such that the more individuals see themselves as responsible for collective
outcomes, the more they will take action for the public good. The cognitive dimension is the
salience of individuals’ contributions – i.e., will the behavior have a positive impact on the
collective effort.12
We expect attributions of responsibility will affect behavior for two reasons. First, any
public goods problem introduces disincentives to act, and communications that directly address
the need for action may be critical (e.g., see Benford and Snow 2000; Gamson 1992, Polletta and
Ho 2006). Second, related work on economic voting is telling. This research shows that
individuals base their attitudes not on narrow economic standing but rather on their view of the
collective economy, suggesting that behaviors (outcomes) need to be connected to societal
impact (Brody and Sniderman 1977). Abramowitz, Lanoue, and Ramesh (1988) show personal
considerations (e.g., economic conditions) can affect general attitudes (i.e., voting) when mass
12 Of course, this depends on if individuals believe their actions matter, which in turn, is reflected, in collective efficacy beliefs (Lubell, Zahran, and Vedlitz 2007).
9
communications make the causal attributions clear – that is, when rhetoric portrays government
as a cause of personal economic standing, personal standing matters in vote choice. In short,
attributions of responsibility may affect individuals’ willingness to take action for a public good,
particularly when explicitly connecting individual behavior to collective outcomes.13 These
messages also may be strong insofar as individual responsibility may resonate with deeply
entrenched values in American culture (Feldman 1988). We thus hypothesize that exposure to
communications that focus on individual responsibility for collective outcomes will increase the
salience of the collective efficacy of one’s actions, and the greater one sees their actions as
having an effect, the more likely he/she will act (hypothesis 2a). We compare messages
highlighting individual attributions of responsibility to ones that de-emphasize individual impact
by referencing the government’s responsibility for the nation’s configuration of energy
resources. We expect in all cases that highlighting government’s responsibility for solving
energy problems will decrease participation, as it cancels out any value of the collective benefit
(e.g., even if a collective benefit matters, if people do not think their action can affect it, they will
not act) (hypothesis 2b). This is particularly important given the aforementioned media coverage
that often associates government with responsibility for action. We expect de-mobilization
because such arguments suggest there is little individual reason to engage in such behaviors, or
there are high costs. In contrast, the curtailment behaviors of adjusting the thermostat, investing
in a Smart Energy Meter, and obtaining more information about Smart Meters are all steps that
could save money. As a result, the cost frame may be seen as positive – that is, highlighting costs
may encourage people to be more likely to engage in these behaviors, regardless of attributions
13 The economic voting literature in some sense is the reverse – in this case, societal attributions are critical in holding government responsible; whereas in the energy behavior case, it is personal attributions that will generate personal actions and not a reliance on government.
10
(see hypothesis 1e above). We see treatment attributions as comparable to effect frames
(psychologically), but which is stronger in shaping individual behavior – attributions of
responsibility or effect frames – is not a topic that has been explored (see Entman 2004). Thus,
we have no clear predictions regarding how exposure to a mixture of competing frames
regarding the cost / benefits and attributions of responsibility will influence action. In other
words, which dimension is stronger (i.e., cost/benefits or attributions of responsibility) is not
something that has been explored. Politically this is a relevant question since both attributions
and effect frames are part of the public discourse on U.S. energy policy (see Bolsen 2011).
Experimental Participants, Design, and Procedures
To investigate our hypotheses, we conducted an experiment in the context of a survey in
December of 2009 (n = 1,600). The study was part of a broader survey exploring citizens’
knowledge, attitudes, and support for action regarding a variety of energy sources, new
technologies, and polices. 14 We hired a private company, Bovitz Research Group (BRG), located
in Palo Alto, CA, to implement the study. BRG uses an opt-in online consumer survey panel
service that has more than 1 million respondents.15 Participants are paid a small cash payment
for completing surveys. This means that the overall sample, while matched on key
demographics, consists of people who are online – i.e., have Internet access and a valid email
address. The response rate of the initial invitation is typically 20% to 30%. Then, of those who
agree to participate in the screening, about 80%-90% complete the survey. This results in a 15%
14 The survey was funded through a grant from the Institute for Sustainability at Northwestern (ISEN). 15 They draw a sample from that pool and invite the selected individuals to participate in a study via an email invitation letter. Taking into account response rate differences across demographic groups, the sample is drawn in a way to ensure that the set of potential respondents who complete the screener in order to qualify for the main questionnaire is representative of the U.S. population. The initial invitation to participate occurs via email and then participants click on a link within the invitation to complete the survey on a secure Internet site.

11
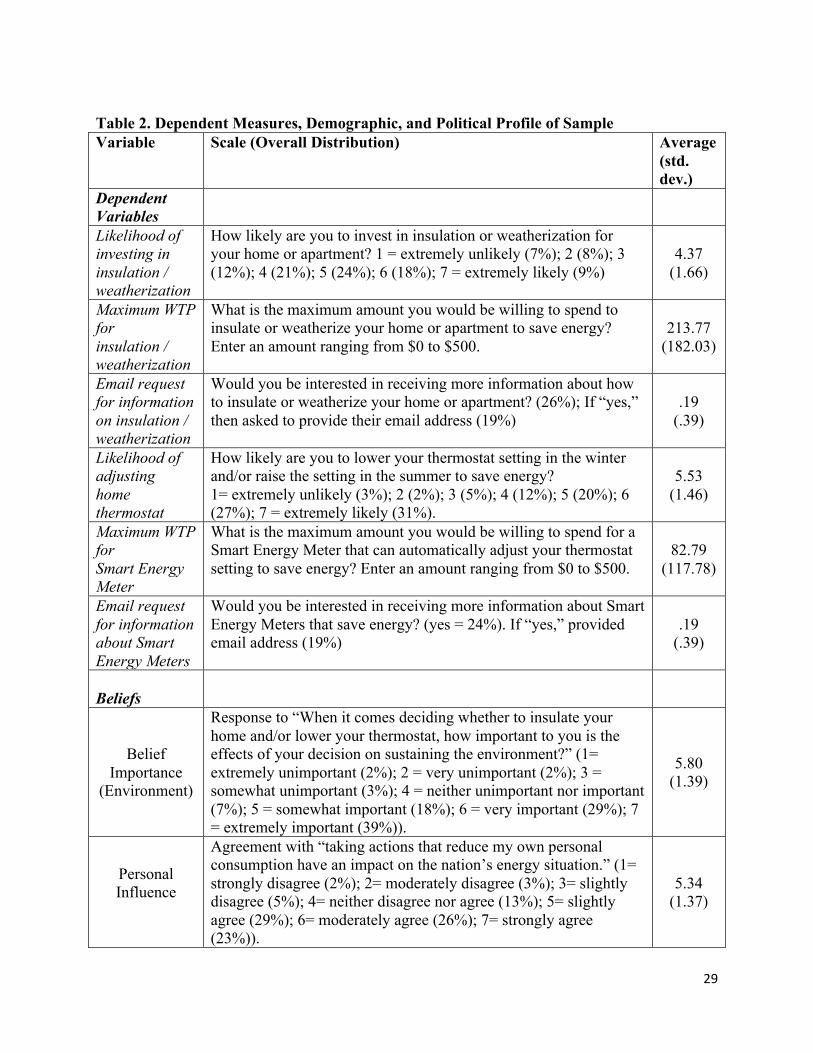
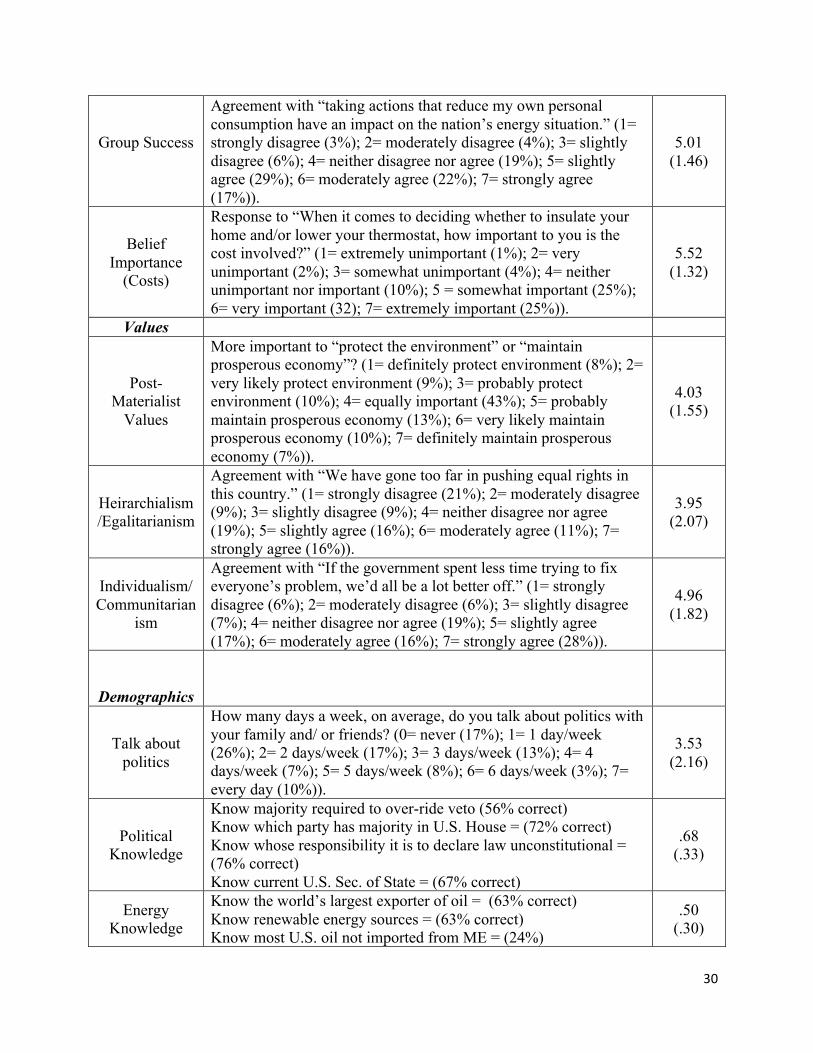
to 25% response rate range. The demographic and political profile of our sample is presented in
Table 2 (we discuss the measures in Table 2 at length below).
[Insert Table 2 About Here]
We designed our experiment to test predictions about the effects of exposure to
competing frames about the collective benefits and selective costs of action on energy, as well as
frames assigning responsibility for action to the government or to consumers. All participants
were informed that they would be asked about “some energy choices you may make.”
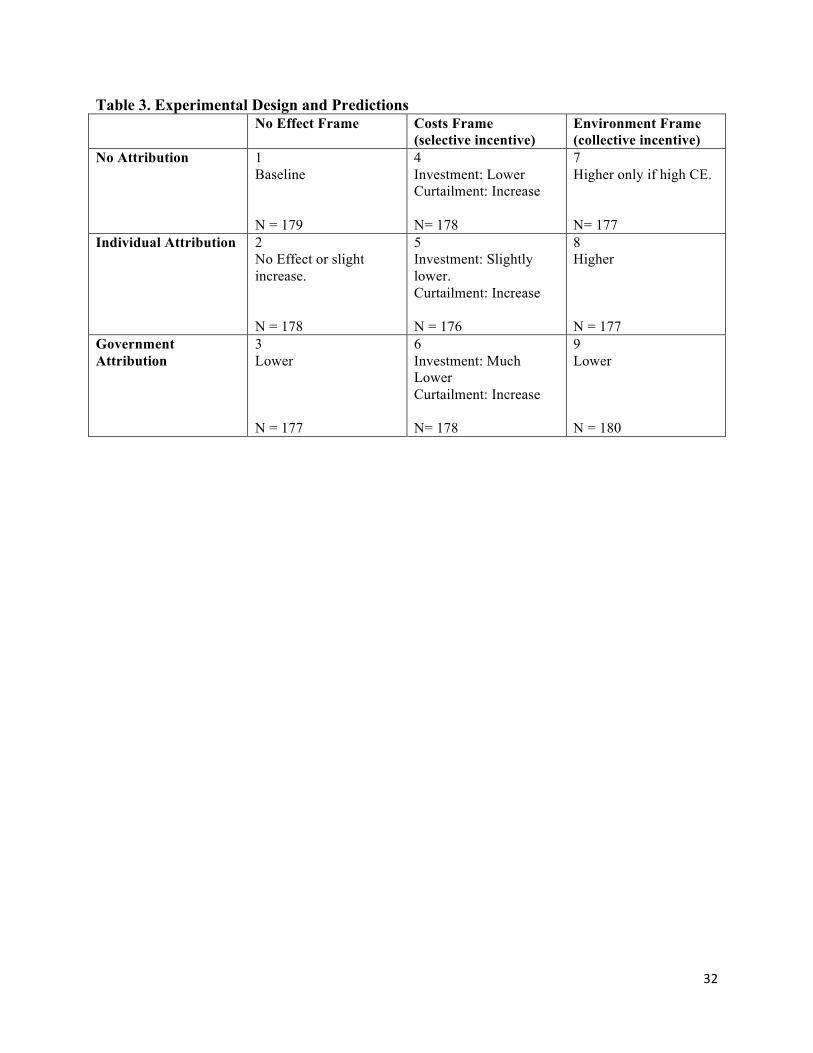
Respondents were randomly assigned to one of nine conditions. As shown in Table 3 (with Ns
appearing in the cells), we crossed three frames having to do with effects resulting from actions
(none, a financial/selective costs frame, and an environment/collective benefit frame) with three
frames about attribution of responsibility (none, individual attribution, and government
attribution). Participants were randomly assigned to a baseline control group (condition 1, Table
3) then proceeded directly to answer our dependent measures (described momentarily). In
conditions 4 and 7, respondents received either a selective cost frame (condition 4) or a
collective benefit frame (condition 7). These conditions mirror traditional studies on framing
effects by exposing participants to opposing frames and measuring their impact relative to a
control group (e.g., see Chong and Druckman 2007). Conditions 2 and 3 matched conditions 4
and 7, however, instead of being exposed to a frame regarding the cost or benefits of action,
respondents were exposed to messages attributing responsibility for dealing with energy
problems to individuals (condition 2) or to the government (condition 3). We anticipate that
frames highlighting individual (or governmental) attributions of responsibility for action on
energy will affect the likelihood of action, ceteris paribus, because they will increase the saliency
of beliefs about the efficacy of one’s own actions.
12
[Insert Table 3 About Here]
The other conditions combine multiple statements. Conditions 5 and 8 both attribute
responsibility to individuals for collective outcomes, but this attribution frame is then paired with
a selective cost frame (condition 5) or a collective benefits frame (condition 8). We anticipate
that the combination of the individual attribution frame and the collective benefits frame should
have a strong positive effect on willingness to act. Conditions 6 and 9, on the other hand, pairs
the government attribution frame with a selective cost frame (condition 6) or a collective benefits
frame (condition 9).
After completing a background questionnaire that included measures designed to tap
existing attitudes and values related to action on energy and environmental issues, as well as a
host of demographic and political characteristics we discuss momentarily, participants were
exposed to one of nine experimental treatments (including the baseline control group, condition
1). To manipulate attribution of responsibility, we include an explicit statement (i.e., “The
ultimate success of our nation’s energy policy depends largely on [individual choices about
energy consumption / governmental decisions about energy supply]), a reference to the need for
action (i.e., “[Individuals / Government] needs to step up to the plate”), and a reference to an
abstract general principle (i.e., [something they have done throughout American history without
having to rely on government / something they often do when individuals alone cannot solve a
problem]). Our collective benefit frame focuses on the “important environmental consequences”
and the impact of action on collective outcomes – i.e., save “the world from millions of metric
tons of greenhouse gases.” In contrast, our selective cost frame highlights “important economic
consequences” that require consumers to “pay a cost premium.”16 We pre-tested these treatments
16 The wording of the treatments for each condition is listed in Appendix B.
13
on a sample of approximately 211 undergraduate students - who did not take part in the study
conducted by BRG - to ensure the directionality and strength of the opposing cost / benefit
frames, and to ensure the attributions portrayed either government or individuals as primarily
responsible for dealing with the nation’s energy problems. We find that the attribution frame
significantly and effectively influences the agent perceived as responsible for dealing with the
nation’s energy problems, and that the cost / benefit frames are perceived directionally as
intended (negative / positive) and equal in terms of strength (the pre-test analyses are available
upon request from the authors).
Following exposure to one of our treatments, participants answered several additional
questions designed to test our hypotheses about the effects of the various types of framing
presented in the treatments. We focus on the impact of our treatments across three dependent
measures for each type of energy action (i.e., behavioral intentions, willingness to pay to save
energy, and information-seeking). To measure behavioral intentions, respondents were asked to
rate on 7-point scales the likelihood that they will “invest in insulation or weatherization” or
“lower your thermostat setting in the winter and/or raise the setting in the summer to save
energy” (e.g., 1 = extremely unlikely, 4 = neither unlikely nor likely, 7 = extremely likely). Our
willingness to pay (WTP) measure of support for investment / curtailment asked “What is the
maximum amount you would be willing to pay to [insulate / weatherize OR for a Smart meter]
save energy? Enter an amount ranging from 0$ to $500.” Our third dependent measure is an
actual behavior measure that first asks respondents if they would like more information about
insulation / weatherization and then about Smart Energy Meters. If the answer to this question
was “yes,” then participants were asked to provide their email address to receive one email with
the information (0 = did not enter email and 1 = entered email address). We focus on
14
participants who actually provided an email address, and do not include those who checked
“yes” requesting more information and then chose not to provide an email address, because
providing an email address requires more of an active commitment to receiving information.
We included measures for previously discussed attitudes, beliefs, and a host of other
factors known to influence opinions about U.S. energy and environmental policy (note that these
measures appeared prior to exposure to a treatment). We measured perceptions about the
personal influence of a collective action by asking respondents the extent to which they agreed
with the statement “Taking actions that reduce my own personal consumption have an impact on
the nation’s energy situation” (1-7 disagree/agree scale, see Lubell, Zahran, and Vedlitz 2007;
Lubell 2002; Finkel, Mueller, and Opp 1989). We expect that higher scores on this measure will
increase the likelihood of action because it will increase perceptions that the behavior will have a
positive, or notable, impact on the likelihood of providing for a public good. To measure beliefs
about the likelihood of group success we asked respondents to report the extent to which their
actions “encourage others in my community to take similar steps” (1-7 disagree/agree scale) (see
Lubell, Zahran, and Vedlitz 2007). We measured the importance associated with attitudes about
the environment by asking respondents “how important to you is… the environment” (1-7
unimportant/important scale). We measured the importance of attitudes associated with the costs
of action by asking “how important to you is… costs to businesses which are often passed on to
consumers” (1-7 unimportant/important). We also asked respondents the degree to which
government (Gov. Response) and consumers (Cons. Response) are responsible for dealing with,
or addressing, the nation’s existing energy problems on a 7-point scale with higher scores
reflecting greater perceived responsibility. Finally, we asked respondents to rate the effectiveness
15
of approaches to energy policy that “induce consumers to shift their behavior” (1-7 ineffective /
effective scale) (Effectiveness Consumer Approaches).
The survey instrument also included measures for values that have been associated with
environmental action, because acting in accordance with important values increases the selective
benefits of an action (Inglehart 1997; Lubell 2002; Lubell, Zahran, and Vedlitz 2007). One item
on our survey tapped post-materialist versus materialist values and asked respondents to rate
what they think is more important “protecting the environment, even at the risk of curbing
economic growth, OR maintaining a prosperous economy, even if the environment suffers to
some extent?” (1 = definitely protect environment, 7 = definitely maintain prosperous economy)
(see Chong and Druckman 2011). We expect lower scores on this measure (prioritizing the
environment over the economy) will be associated with greater willingness to take action. For
hierarchical (as opposed to egalitarian) values (see Kahan et al 2008, 2009), we asked
respondents to rate the extent to which they disagree or agree that “We have gone too far in
pushing equal rights in this country,” on a 7-point scale with higher scores indicating increased
agreement. A similar item gauged individualism (as opposed to communitarianism), but instead
asked, “If the government spent less time trying to fix everyone’s problems, we’d all be a lot
better off?” In both cases, we expect greater action for the public good to be associated with
lower scores on these measures (reflecting greater priority being given to egalitarian and
communitarian values).
We measured a host of other factors that have been related to opinions on energy issues
in surveys including: political knowledge17, energy knowledge18, party identification (7-point
17 Our measure for political knowledge is an average of correct responses across four questions: (1) how much of a majority is required for the U.S. Senate and House to override a Presidential veto; (2) which party currently has the most members in the House of Representatives in
16
scale where 1=Strong Democrat, 7=Strong Republican), ideology (7-point scale with higher
scores indicating conservativeness), trust in government (4-pt scale, 1= never, 4= always), and
media use (see Lubell et al. 2007 for relationships between each of these measures and action on
environmental issues). 19 In addition, the survey included demographic measures that asked
respondents’ gender (0 = male, 1 = female), minority status20, education21, age22, income23,
whether they live in a house or an apartment (1 = house, 2 = apartment), directly pay their
utilities (1 = yes, 2 = no), and live in a moderate or extreme climate relative to others living in
the U.S (1 = moderate, 3 = extreme). The questions, response scales, and distributions for all
measures we use in the analyses below are reported in Table 2.
Results
Table 2 provides the overall means (or in the case of e-mail, percentages) and standard
deviations for each dependent measure for our sample at large. The means and standard
deviations for each dependent variable by experimental condition are reported in Table A1 in
Appendix A. We begin by reporting on the impact of our experimental treatments on capital
investments in energy efficiency. We summarize the results in three figures that present the
Washington D.C.; (3) whose responsibility is it to determine if a law is constitutional; and, (4) who is the current U.S. Secretary of State (open-ended).. 18 The measure of energy knowledge is an average of correct responses across three items: (1) do you know what country is the world’s largest exporter of crude oil; (2) which of the following is not a renewable energy resource; and, (3) is it true or false that most of the oil that the United States imports comes from the Middle East. 19 Our media measure is an average of three individual items for news exposure (alpha = .54): (1) reading the newspaper (1-8 never / everyday); (2) watching news (1-8 never / everyday); (3) online information (1-8 never / everyday) (standardized 0 – 1 scale). 20 We asked respondents to identify their ethnicity and classified African Americans, Asian Americas, and Hispanics as minorities (see Table 2). 21 Respondents reported their highest level of completed education (see Table 2). 22 Respondents entered their age (see Table 2). 23 Respondents reported their income as one of five ranges (see Table 2).

17
results from difference of means tests (t-tests) between the control (baseline) and each other
condition, for each variable.
[Insert Figures 1, 2, and 3 About Here]
The results are striking. First, there is support for both hypothesis 2a and 2b regarding the
impact of attributions of treatment responsibility on willingness to act. Exposure to the
individual attribution frame (condition 2) marginally increases one’s likelihood of investing in
insulation / weatherization (p < .10), while exposure to the government attribution frame
(condition 3) significantly decreases one’s likelihood of action across all three dependent
measures (p < .05). Second, as we anticipated (see Black, Stern, and Elworth 1985; Stern 2000),
mobilization on investment behavior is difficult because of the financial burden associated with
these actions. In looking at the relative impact of highlighting selective costs versus collective
benefits, we compare conditions 4 and 7 to our baseline control group. In support of hypothesis
1b, we find that exposure to a selective cost frame significantly lowers intentions to make
investments across all three dependent measures (p < .05).
Third, to evaluate hypothesis 1a, which predicts that motivating investment behaviors
will require both an appeal to the collective benefits and an individual attribution frame, we
focus initially on the insignificant positive effects the collective environment frame alone
(condition 7) across Figures 1, 2, and 3. Although highlighting the collective benefits to the
environment has a positive effect relative to the control group across measures, the effects are
not significant. However, in support of hypothesis 1a, we find that coupling the collective
benefits appeal with an individual attribution of responsibility appeal significantly increases
intentions to weatherize / insulate (6.38%, p < .01), willingness to pay for a Smart Energy Meter
(10.85%, p < .01), and information-seeking behavior regarding insulation / weatherization
18
(10.41%, p < .01). On the other hand, exposure to the collective benefit appeal paired with a
government attribution appeal (condition 9) significantly decreases willingness to act across
dependent measures. Thus, de-mobilization appears to be quite easy – invoking costs or
attributing responsibility for action to government decreases the value, significantly, on each of
our three dependent variables relative to the baseline. In contrast, mobilization is challenging as
only the use of the individual attribution and emphasis on the environment increases the value
for each dependent variable. Interestingly, both conditions are needed – while referencing the
environment without an attribution creates movement in a positive direction, it never does so
significantly.
To test hypothesis 1d which predicts that individuals who have a greater sense of
personal efficacy – i.e., who strongly believe their actions have an impact on collective outcomes
(see Table 2) – will be more likely to take action in response to exposure to a frame highlighting
the collective benefits to the environment (even in the absence of an appeal regarding the impact
of individual contributions), we focus on our measure for Collective Efficacy which asked
respondents “Do you think the success of energy policy depends on whether individual citizens
take actions that reduce energy demand?” (1- 7 not at all / completely scale). High scores on this
measure, indicating strong beliefs that individuals’ actions matter in terms of collective
outcomes, may moderate some of the experimental conditions effects on behavior – since the
individual attribution may not be needed for individuals who score high on this measure. To test
this prediction, we take a median split of below six and above five on collective efficacy. We
then estimate basic regressions for each group including the experimental conditions for all
dependent variables (and assessing the effects relative to the control group). In the interest of
space, we do not report the results from these regressions (they are available upon request);
19
however, we do note several interesting findings that emerge from these separate regressions.
First, the main result is that receiving a collective benefit frame significantly increases intentions
to pay for insulation / weatherization and WTP for capital investments among participants who
score high on collective efficacy, but this is an ineffective appeal among individuals who score
below the median on this measure. This finding provides clear support for hypothesis 1d, and is
sensible given that individuals who score highly on this measure do not need to be exposed to the
individual attribution appeal because they already believe individuals’ actions matter. A second
notable result from these additional analyses splitting respondents into high and low collective
efficacy groups is that with respect to our information-seeking behavior measure (email request)
the treatment effects are concentrated among the high collective efficacy group. People who do
not believe that individuals actions matter basically exhibit no response to the treatment.
Curtailment Behaviors
Curtailment behaviors include adjusting the thermostat, investing in a Smart Energy
Meter, and obtaining more information about Smart Meters. All involve steps that could save
individuals money. We begin by highlighting the distribution of each dependent variable for
curtailment (see Table 2). The average support for each of these measures (compared to each
investment measure, respectively) is (1) much higher intentions to take action; (2) much lower
willingness to pay for a Smart Meter; and, (3) nearly identical percentages of respondents
requesting an email by providing their personal address. We suspect the reason for greater
intentions to take action to curtail use, again, are because doing the act has dual selective and
collective benefits. Second, willingness to pay less for a Smart Meter to curtail use may be
because the device is perceived as less necessary in order to curtail household usage (moreover,
20
people may suspect that the device should cost less than insulating their house). It perhaps also
may reflect people’s belief that they can adjust the thermostat without a Smart Meter.
As in the previous section on investment behaviors, we summarize the results from our
experiment with three figures (Figures 4, 5, and 6) that report the results from a series of
difference of means tests (t-tests) between the control (baseline) and each other condition, for
each variable.24 The results are again clear, but they are different from the findings for
investment behaviors. An emphasis on the selective costs of action now increases intentions to
curtail energy use (e.g., adjust thermostat to save energy). This is consistent with hypothesis 1e,
which predicts that any reference to costs related to curtailment will increase action, since these
behaviors are a cost-saving move, and thus, emphasizing a selective benefit. Interestingly, even
the governmental attribution does not matter here (see condition 6 across Figures 4, 5, and 6).
This makes sense since selective incentives have little to do with overall responsibility for a
problem. In contrast, we find appeals to collective environmental benefits only work when
paired with an individual attribution of responsibility frame (see condition 8 across Figures 4, 5,
and 6). There is de-mobilization with governmental attributions either with no benefit appeal
(condition 3) or when paired with the environment collective benefit appeal (condition 9).
[Insert Figures 4, 5, and 6 About Here]
Although the information-seeking results (Figure 6) perfectly mimic the results for our
curtailment intention measure (Figure 4) – thus obtaining information which is free is something
people will consider when they think about their intent to adjust - when it comes to paying for an
energy meter (see Figure 5) we find the selective cost frame is not significant. We suspect this
reflects people believing they may not need the meter to adjust and while they think adjusting 24 Note that the means for each dependent variable by condition are reported in Table A1 in Appendix A.

21
will save money. They also may not want to spend money on installation. We continue to see
government attributions decrease willingness to pay for a Smart Meter (see conditions 3 and 9 in
Figure 5) as well as the collective appeal/individual attribution does mobilize (condition 8). In
short, mobilization is easier with curtailment behaviors given their selective benefits. On the
other hand, motivating action through rhetoric focusing on the collective benefits continues to be
difficult – i.e., it requires either a selective cost benefit or multiple frames priming both
collective benefits and the collective efficacy of individuals’ actions (through an individual
attribution of responsibility treatment). We estimated separate regressions for individuals high
and low on our collective efficacy measure across dependent variables (with the conditions as
independent variables). Similar to what we reported on capital investments, exposure to a
collective benefit frame significantly increases behavioral intentions to invest in insulation /
weatherization among the high efficacy group (but not the low group). On the other hand, we
find no differences between the low and high efficacy group for the WTP and information –
seeking behavior measures.
We next investigate the robustness of our observed treatment effects by regressing each
dependent variable for both investment and curtailment behaviors on the experimental conditions
as well as attitudes, values, political and energy specific knowledge, and other demographic
variables.25 Table 4 reports the results from six models predicting the determinants of support
for each main dependent variable.
[Insert Table 4 About Here]
Most importantly, we find that the dummy variables for our experimental conditions are
robust to the inclusion of a large number of other factors known to predict environmental 25 The models predicting intentions in Table 4 assume support scores are measured on interval levels. The results are unchanged if we use OLS regressions.

22
activism. As illustrated in the Figures presented above, both the capital investment and
curtailment models provide clear evidence that attributing responsibility for action on energy to
government significantly reduces willingness to take action for the public good (see row 2, Table
4, No-frame + Government Attribution). Similarly, across all models, the combination of an
appeal to the collective benefit paired with an individual attribution of responsibility significantly
increases intentions, willingness to pay, and e-mail requests for more information on both
insulation and Smart Meters. We also continue to observe that the impact of the cost frame
depends on the type of behavior in question – reducing individuals’ willingness to make capital
investments but marginally increasing the likelihood of curtailing energy usage. In assessing the
relative impact of attribution frames versus cost/benefit frames, the government attribution frame
paired with a collective benefit message significantly reduces willingness to take action across
all six models. However, any reference to cost with respect to capital investments reduces
willingness to take action, even when paired with the individual attribution appeal.
In assessing the impact of the control variables included in Table 4, we highlight a
number of interesting and sensible results. First, as suggested by the results previously reported,
there is a highly significant and large impact across models in the belief that one’s actions affect
the national energy situation (see collective efficacy, Table 4) (this supports the collective interest
model of environmental action discussed above, Lubell 2002; Lubell, Zahran, and Vedlitz 2007).
The single exception is lack of significance for our willingness to pay for Smart Energy Meters
measure, which may reflect the fact that people believe they can curtail energy usage without
installing this device. Second, also supporting collective-interest models of behavior (Finkel and
Muller 1998; Lubell, Zahran, and Vedlitz 2007), we find that perceptions about group success
significantly increase intentions, willingness to pay, and information-seeking behavior across
23
five of six models in Table 4 (the exception is requesting an email regarding home insulation).
Interestingly, the impact of many of the other control variables is spotty and in some cases have
no effect. Post-materialist (as opposed to materialist) values increase willingness to make
capital investments (the negative coefficients are because the measure is coded so that support
for the environment over economic growth is associated with lower scores in making a tradeoff);
however, it has no effect on curtailment behaviors. Political and energy knowledge tend to
increase willingness to take action across models (with the exception of paying for a Smart
Energy Meter), which is consistent with extant work on knowledge lowering costs associated
with collective action (e.g., see Lubell, Zahran, and Vedlitz 2007). Finally, living in a house (as
opposed to an apartment) significantly decreases action across many of the models in Table 4.
There are several other significant variables that are significant in one or two models only; but,
overall, the impact of the remainder of the control variables is not overwhelming. It is
interesting that across both types of behavior party identification and ideology are insignificant
predictor variables (except that liberals are marginally more likely than conservatives to request
an email about Smart Energy Meters).
Conclusion
The question of what shapes citizens’ willingness to make sacrifices for the sake of a
public good is increasingly important as humanity faces the daunting challenge of maintaining an
adequate energy supply and simultaneously mitigating the emission of pollutants associated with
global warming. This paper draws from collective-interest models of environmental activism
and research on framing and persuasion to explore how exposure to rhetoric highlighting factors
believed to influence collective action behavior – i.e., collective benefits, selective costs, and
attributions of treatment responsibility – affect individuals’ intentions and actual behavior via an

24
email request. We test hypotheses motivated by this work in an on-line experiment (n=1,600)
and find that rhetoric can play a crucial role in shaping behavior – e.g., when the government is
portrayed as the agent responsible for addressing energy problems, people are less willing to act;
however, emphasizing individuals’ responsibility significantly increases action. Moreover,
references to selective costs tend to decrease willingness to make investments but increase
curtailment behaviors overall. We also find, through a content analysis of news articles on
energy issues in the U.S. (2001- 2011), that government is the agent most often portrayed as
responsible for dealing with the nation’s energy problems. Our results highlight the challenges of
inducing actions for the public good - because demobilizing messages are more prevalent than
rhetoric that might increase individuals’ contributions. This has implications for practitioners
designing messages to promote energy efficient behaviors.
25
References Abramowitz, Alan I.,David J. Lanoue, and Subha Ramesh. (1988). “Economic Conditions, Causal
Attributions, and Political Evaluations in the 1984 Presidential Election.” Journal of Politics 50(4): 848-863.
Allcott, Hunt, and Michael Greenstone. (2012). “Is There an Energy Efficiency Gap?” Journal of Economic Perspectives 26(1): 3-28.
Allcott, Hunt. (2010). “Social Norms and Energy Conservation.” Typescript, MIT and NYU. Ajzen, Icek, and Martin Fishbein. (2005). “The Influence of Attitudes on Behaviors.” In Dolores
Albarracin, Blair T. Johnson, and Mark P. Zanna (eds.), The Handbook of Attitudes, London: Lawrence Erlbaum Associates.
Arceneaux, Kevin, and David W. Nickerson. (2009). “Who Is Mobilized to Vote? A Re-Analysis of 11 Field Experiments.” American Journal of Political Science 53(1): 1-16.
Benford, Robert D., and David A. Snow. (2000). “Framing Processes and Social Movements: An Overview and Assessment.” Annual Review of Sociology. 26: 611-39.
Black, Stanley J., Paul C. Stern, and Julie T. Elworth. (1985). “Personal and Contextual Influences on Household Energy Adaptations.” Journal of Applied Psychology 70 (1): 3-21.
Bolsen, Toby. (2011). “The Construction of News: Energy Crises, Advocacy Messages, and Frames toward Conservation.” International Journal of Press/Politics 16(2): 143-162.
Bolsen, Toby. (Forthcoming). “A Light Bulb Goes On: Invoking Norms in Appeals for Collective Action.” Political Behavior.
Bolsen, Toby, and Fay Lomax Cook. (2008). “Public Opinion on Energy Policy, 1974-2006.” Public Opinion Quarterly 72(2):364-388.
Borenstein, Severin. (2012). “The Private and Public Economics of Renewable Electricity Generation.” Journal of Economic Perspectives.” Journal of Economic Perspectives 26(1): 67-92.
Brader, Ted, Nicholas, A. Valentino, and Elisabeth Suhay. (2008). “What Triggers Public Opposition to Immigration: Anxiety, Group Cues, and Immigration Threat.” American Journal of Political Science 52 (4): 959-978.
Brody, Richard A., and Paul M. Sniderman (1977). “From Life Space to Polling Place: The Relevance of Personal Concerns for Voting Behavior.” British Journal of Political Science 7(3): 337-360.
Chong, Dennis, and James N. Druckman. (2007). “A Theory of Framing and Opinion Formation in Competitive Elite Environments.” Journal of Communication 57: 99-118.
Chong, Dennis, and James N. Druckman. (2010). “Dynamic Public Opinion: Communication Effects over Time.” American Political Science Review 104(4): 663-680.
Druckman, James N. (2010). “Competing Frames in a Political Campaign.” In B. F. Schaffner and P. J. Sellers, (Eds.), Winning with Words, pp. 101-120. New York: Routledge.
Druckman, James N. (2004). “Political Preference Formation: Competition, Deliberation, and the (Ir)relevance of Framing Effects.” American Political Science Review 98 (4): 671-86.
Druckman, James N., and Arthur Lupia. (2000). “Preference Formation.” Annual Review of Political Science 3: 1-24.
Druckman, James N., and Michael Parkin. (2005). “The Impact of Media Bias: How Editorial Slant Affects Voters.” The Journal of Politics 67: 1030 - 1049.
Druckman, James N. (2005). “Media Matter: How Newspapers and Television News Cover Campaigns and Influence Voters.” Political Communication 22: 463-481.
Entman, Robert M. (2004) Projections of Power: Framing News, Public Opinion, and U.S. Foreign Policy. University of Chicago Press.
Feldman, Stanley. (1988). “Structure and Consistency in Public Opinion: the Role of Core Beliefs and Values.” American Journal of Political Science 32(2): 416-440.
Finkel, Steven E. & Edward N. Muller. (1998). “Rational Choice and the Dynamics of Collective Political Action: Evaluating Alternative Models with Panel Data.” The American Political Science Review 92(1) 37-49.
Finkel, Steven E., Edward N. Muller, and Karl-Dieter Opp. (1989). “Personal Influence,

26
Collective Rationality, and Mass Political Action.” American Political Science Review 83(3): 885-903.
Gamson, William A. (1992) Talking Politics. New York:Cambridge University Press. Gerber, Alan S., and Donald P. Green. (2000a). “The Effects of Canvassing, Telephone Calls, and Direct
Mail on Voter Turnout: A Field Experiment.” American Political Science Review 94: 653-663. Gerber, Alan S., and Donald P. Green. (2000b). “The Effect of a Nonpartisan Get-Out-the-Vote Drive:
An Experimental Study of Leafleting.” The Journal of Politics 62(3): 846-57. Gerber, Alan S., Donald P. Green, and Christopher W. Larimer. (2010). “An Experiment Testing
the Relative Effectiveness of Encouraging Voter Participation by Inducing Feelings of Pride or Shame.” Political Behavior 32: 409-422.
Gerber, Alan S., Donald P. Green, and Christopher W. Larimer. (2008). “Social Pressure and Vote Turnout: Evidence from a Large-Scale Field Experiment.” American Political Science Review 102 (1): 33-48.
Gerber, Alan S., and Todd Rogers. (2009). “Descriptive Social Norms and Motivation to Vote: Everybody’s Voting and So Should You.” The Journal of Politics 71 (1): 178-191.
Green, Donald P., and Alan S. Gerber. (2010). “Introduction to Social Pressure and Voting: New Experimental Evidence.” Political Behavior 32: 331-336.
Green, Donald P., and David W. Nickerson. (2003). “Getting Out the Vote in Local Elections: Results from Six Door-to-Door Canvassing Experiments.” The Journal of Politics 65(4): 1083-1096.
Hart, Philip Solomon. (2011). “One or Many? The Influence of Episodic and Thematic Change Frames on
Policy Preference and Individual Behavior Change.” Science Communication 33(1): 28-51. Inglehart, Ronald. (1997). Modernization and Postmodernization. Princeton University Press. Iyengar, Shanto. (1991). Is Anyone Responsible? How Television Frames Political Issues. Chicago: The University of Chicago. Iyengar, Shanto, and Donald R Kinder. (1987). News That Matters: Television and American
Opinion. Chicago: University of Chicago Press. Joskow, Paul L. (2012). “Creating a Smarter U.S. Electricity Grid.” Journal of Economic Perspectives
26(1): 29-48. Kahan, Dan M., Donald Braman, Paul Slovic, John Gastil and Geoffrey L. Cohen. 2008. “The Future of
Nanotechnology Risk Perceptions: An Experimental Investigation of Two Hypotheses.” Harvard Law School Program on Risk Regulation Research Paper No. 08-24. Available at: http://ssrn.com/abstract=1089230.
Kahan, Dan M., Donald Braman, John Monahan, Lisa Callahan and Ellen Peters. 2009. “Cultural Cognition and Public Policy: The Case of Outpatient Commitment Laws.” Law and Human Behavior, Online First publication. Available at: http://www.springerlink.com/content/fh377338110h7434/.
Knittel, Christopher R. (2012). “Reducing Petroleum Consumption from Transportation.” Journal of Economic Perspectives 26(1): 93-118.
Lubell, Mark, Sammy Zahran, and Arnold Vedlitz. (2007). “Collective Action and Citizen Responses to Global Warming.” Political Behavior 29 (3): 391-414.
Lubell, Mark. (2002). “Environmental Activism as Collective Action.” Environment and Behavior 34 (4): 431-454.
Malhotra, Neil., and Andrew Healy. (2009). “Myopic Voters and Natural Disaster Policy.” American Political Science Review (8): 387-406. Michelson, Melissa R., Lisa Garcia Bedolla, and Margaret A. McConnell. 2009. “Heeding the Call: The
Effect of Targeted Two-Round Phonebanks on Voter Turnout.” The Journal of Politics 71: 1549-63.
Miller, Joanne M., and Jon A. Krosnick. (2004). “Threat as a Motivator of Political Activism: A Field Experiment.” Political Psychology 25(4): 507-523.
Polletta, Francesca, and M. Kai Ho. (2006). “Frames and Their Consequences.” The Oxford Handbook of
27
Contextual Political Analysis. Oxford University Press. Smith, Eric R.A.N. (2002). Energy, the Environment, and Public Opinion. Oxford:
Rowman & Littlefield. Stern, Paul C. (2005). “Understanding Individuals’ Environmentally Significant Behavior.”
Environmental Law Reporter, p. 1-6. Stern, Paul C. (2000). “Toward a Coherent Theory of Environmentally Significant Behavior.”
Journal of Social Issues 56 (3): 407-424. Taylor, Michael. (1987). The Possibility of Cooperation. Cambridge University Press. Wagner, Michael W. (2007). “The Utility of Staying on Message: Competing Partisan Frames
and Public Awareness of Elite Differences on Political Issues.” The Forum 5(3): 1-18. Zaller, John. (1992). The Nature and Origin of Mass Opinion. New York: Cambridge University
Press.
28
Table 1. Media Content Analysis Results % of Total Sample (N=301) Behaviors Mentioned Purchase more fuel-efficient vehicle 10% Conserve or reduce gasoline use / Carpool 4% Purchase energy-efficient appliance 3% Conserve home energy 3% Attributions of Causal Responsibility Government 18% Industry 17% Growing Demand 11% Foreign Nations 6% Consumers 5% Natural Disasters 4% Other 1% Attributions of Treatment Responsibility Government 37% Industry 10% Consumers 6% Foreign Nations 1% Effect Frames Environment 42% Consumer Costs 41% Business Costs 38% Foreign Dependence 31% Business Behavior 22% Supply 19% Efficiency 11% Consumer Behavior 10% Government 5% The percentages reported above are a count of whether each article in our sampling frame includes an explicit reference to a behavior, responsibility attribution, and /or effect frames. A single article could contain mentions of multiple actions, responsibility attributions, or effect frames. Our sample consists of 275 articles appearing in the New York Times and 26 articles appearing in USA Today between January of 2001 and August of 2011.
29
Table 2. Dependent Measures, Demographic, and Political Profile of Sample Variable Scale (Overall Distribution) Average
(std. dev.)
Dependent Variables
Likelihood of investing in insulation / weatherization
How likely are you to invest in insulation or weatherization for your home or apartment? 1 = extremely unlikely (7%); 2 (8%); 3 (12%); 4 (21%); 5 (24%); 6 (18%); 7 = extremely likely (9%)
4.37 (1.66)
Maximum WTP for insulation / weatherization
What is the maximum amount you would be willing to spend to insulate or weatherize your home or apartment to save energy? Enter an amount ranging from $0 to $500.
213.77 (182.03)
Email request for information on insulation / weatherization
Would you be interested in receiving more information about how to insulate or weatherize your home or apartment? (26%); If “yes,” then asked to provide their email address (19%)
.19 (.39)
Likelihood of adjusting home thermostat
How likely are you to lower your thermostat setting in the winter and/or raise the setting in the summer to save energy? 1= extremely unlikely (3%); 2 (2%); 3 (5%); 4 (12%); 5 (20%); 6 (27%); 7 = extremely likely (31%).
5.53 (1.46)
Maximum WTP for Smart Energy Meter
What is the maximum amount you would be willing to spend for a Smart Energy Meter that can automatically adjust your thermostat setting to save energy? Enter an amount ranging from $0 to $500.
82.79 (117.78)
Email request for information about Smart Energy Meters
Would you be interested in receiving more information about Smart Energy Meters that save energy? (yes = 24%). If “yes,” provided email address (19%)
.19 (.39)
Beliefs
Belief Importance
(Environment)
Response to “When it comes deciding whether to insulate your home and/or lower your thermostat, how important to you is the effects of your decision on sustaining the environment?” (1= extremely unimportant (2%); 2 = very unimportant (2%); 3 = somewhat unimportant (3%); 4 = neither unimportant nor important (7%); 5 = somewhat important (18%); 6 = very important (29%); 7 = extremely important (39%)).
5.80 (1.39)
Personal Influence
Agreement with “taking actions that reduce my own personal consumption have an impact on the nation’s energy situation.” (1= strongly disagree (2%); 2= moderately disagree (3%); 3= slightly disagree (5%); 4= neither disagree nor agree (13%); 5= slightly agree (29%); 6= moderately agree (26%); 7= strongly agree (23%)).
5.34 (1.37)
30
Group Success
Agreement with “taking actions that reduce my own personal consumption have an impact on the nation’s energy situation.” (1= strongly disagree (3%); 2= moderately disagree (4%); 3= slightly disagree (6%); 4= neither disagree nor agree (19%); 5= slightly agree (29%); 6= moderately agree (22%); 7= strongly agree (17%)).
5.01 (1.46)
Belief Importance
(Costs)
Response to “When it comes to deciding whether to insulate your home and/or lower your thermostat, how important to you is the cost involved?” (1= extremely unimportant (1%); 2= very unimportant (2%); 3= somewhat unimportant (4%); 4= neither unimportant nor important (10%); 5 = somewhat important (25%); 6= very important (32); 7= extremely important (25%)).
5.52 (1.32)
Values
Post-Materialist
Values
More important to “protect the environment” or “maintain prosperous economy”? (1= definitely protect environment (8%); 2= very likely protect environment (9%); 3= probably protect environment (10%); 4= equally important (43%); 5= probably maintain prosperous economy (13%); 6= very likely maintain prosperous economy (10%); 7= definitely maintain prosperous economy (7%)).
4.03 (1.55)
Heirarchialism /Egalitarianism
Agreement with “We have gone too far in pushing equal rights in this country.” (1= strongly disagree (21%); 2= moderately disagree (9%); 3= slightly disagree (9%); 4= neither disagree nor agree (19%); 5= slightly agree (16%); 6= moderately agree (11%); 7= strongly agree (16%)).
3.95 (2.07)
Individualism/ Communitarian
ism
Agreement with “If the government spent less time trying to fix everyone’s problem, we’d all be a lot better off.” (1= strongly disagree (6%); 2= moderately disagree (6%); 3= slightly disagree (7%); 4= neither disagree nor agree (19%); 5= slightly agree (17%); 6= moderately agree (16%); 7= strongly agree (28%)).
4.96 (1.82)
Demographics
Talk about politics
How many days a week, on average, do you talk about politics with your family and/ or friends? (0= never (17%); 1= 1 day/week (26%); 2= 2 days/week (17%); 3= 3 days/week (13%); 4= 4 days/week (7%); 5= 5 days/week (8%); 6= 6 days/week (3%); 7= every day (10%)).
3.53 (2.16)
Political Knowledge
Know majority required to over-ride veto (56% correct) Know which party has majority in U.S. House = (72% correct) Know whose responsibility it is to declare law unconstitutional = (76% correct) Know current U.S. Sec. of State = (67% correct)
.68 (.33)
Energy Knowledge
Know the world’s largest exporter of oil = (63% correct) Know renewable energy sources = (63% correct) Know most U.S. oil not imported from ME = (24%)
.50 (.30)

31
Income Estimate of family income (before taxes) < $30,000 (24%); $30,000 – $69,999 (42%); $70,000 – $99,999 (19%); $100,000 - $200,000 (13%); > 200,000 (2%)
N/A
Education
What is the highest level of education you have completed? (1 = Less than high school (1%); 2 = High school (16%); 3 = Some college (39%); 4 = Four year college degree (31%); 5 = Advanced degree (13%)).
N/A
Age What is your age?
44.75 (16.43)
Female Are you male (50%) or female (50%) N/A
Minority Which of the following do you consider to be your primary racial or ethnic group? (White = 73%; Minority = 27%). N/A
TrustGov
How much of the time do you think you can trust the government in Washington to do what is right? (4 = just about always (2%); 3 = most of the time (18%); 2 = only some of the time (61%); 1 = never (20%))
2.02 (0.67)
Media How often do you obtain energy information from… newspapers, TV, online (0-1 scale, alpha = .54)
.51 (.27)
Party Identification
Generally speaking, do you consider yourself a Democrat, Independent, or Republican? (1= strong Democrat (16%); 2= weak Democrat (9%); 3= lean Democrat (14%); 4= Independent (33%); 5= lean Republican (12%); 6= weak Republican (6%); 7= strong Republican(12%)).
N/A
Pays Own Utilities
Do you pay directly for the utilities in your home (e.g., gas and/or electric bill), or is this paid for by someone else (e.g., a landlord)? Pay directly = 90%; Do NOT pay directly = 10%
N/A
House or Apt. Do you live in a house (73%) or apartment (27%)? N/A
Government Responsibility
Listed below are different sources people tend to see as responsible for addressing (or fixing) the energy situation. Rate how responsible you think each source is for dealing with the U.S.’s energy problems.
5.35 (1.46)
Consumer (effectiveness) ApphConsum
Response to “Do you think the success of energy policy depends on whether individual citizens take actions that reduce energy demand?” (1= not at all (2%); 2 = not much (3%); 3 = a little (7%); 4 = somewhat (14%); 5 = a good amount (29%); 6 = a great deal (29%); 7 = completely depends (17%))
5.18 (1.38)
Climate warm
How would you describe the climate in which you live (relative to other parts of the U.S. (1= extremely cold (2%); 2 = relatively cold (10%); 3 = moderate (42%); 4= relatively warm (21%); 5 = extremely warm (25%)).
N/A
32
Table 3. Experimental Design and Predictions No Effect Frame Costs Frame
(selective incentive) Environment Frame (collective incentive)
No Attribution 1 Baseline N = 179
4 Investment: Lower Curtailment: Increase N= 178
7 Higher only if high CE. N= 177
Individual Attribution 2 No Effect or slight increase. N = 178
5 Investment: Slightly lower. Curtailment: Increase N = 176
8 Higher N = 177
Government Attribution
3 Lower N = 177
6 Investment: Much Lower Curtailment: Increase N= 178
9 Lower N = 180

33
Table 4. Determinants of Support for Action Likely to
Insulatea Max WTP Weatherizeb
Email on Insulationc
Likely to Curtaila
Max WTP Smart Mtr.b
Email on Smart Mtr.c
No Frame + Individual Attribution (Condition 2)
.01 (.11)
3.90 (17.21)
.08 (.16)
.08 (.11)
-16.06 (11.78)
-.13 (.16)
No-Frame + Government Attribution (Condition 3)
-.30*** (.11)
-42.82*** (17.26)
-.28* (.17)
-.24** (.11)
-25.18** (11.82)
-.64*** (.19)
Cost Frame + No Attribution (Condition 4)
-.32*** (.11)
-42.8*** (17.21)
-.25 (.16)
.37*** (.12)
-8.72 (11.78)
.29* (.15)
Cost Frame + Individual Attribution (Condition 5)
-.26** (.11)
-34.57** (17.32)
-.33* (.17)
.37*** (.12)
-6.03 (11.86)
.28* (.16)
Cost Frame + Government Attribution (Condition 6)
-.36*** (.11)
-49.99*** (17.21)
-.23 (.16)
.27** (.12)
-5.23 (11.78)
.31** (.15)
Environment Benefit Frame + No Attribution (Condition 7)
.07 (.11)
18.43 (17.22)
.20 (.15)
.16 (.11)
5.92 (11.79)
-.14 (.16)
Environment Benefit Frame + Individual Attribution (Condition 8)
.33*** (.11)
63.51*** (17.27)
.42*** (.15)
.31*** (.11)
33.71*** (11.83)
.37** (.15)
Environment Benefit Frame + Government Attribution (Condition 9)
-.30*** (.11)
-43.65*** (17.16)
-.17** (.16)
-.27** (.11)
-31.64*** (11.75)
-.45*** (.18)
Belief Importance (Environment)
.05* (.02)
7.24* (3.79)
-.03** (.04)
.03 (.03)
1.50 (2.60)
.01 (.04)
Belief Importance (Costs)
.03 (.02)
.303 (3.57)
.03 (.03)
.03 (.02)
1.17 (2.44)
.03 (.03)
Collective Efficacy (ActNatImp)
.12*** (.03)
14.83*** (3.96)
.14*** (.04)
.13*** (.03)
2.72 (2.71)
.08** (.04)

34
Likely to Insulatea
Max WTP Weatherizeb
Email on Insulationc
Likely to Curtaila
Max WTP Smart Mtr.b
Email on Smart Mtr.c
Group Success ActComImp
.09*** (.02)
10.14*** (3.66)
.01 (.03)
.10*** (.02)
7.67*** (2.51)
.07** (.04)
Post-materialism / materialism (Econ/Env)
-.04* (.02)
-10.79*** (3.08)
-.05* (.03)
-.02 (.02)
-2.54 (2.11)
-.03 (.03)
Hierarchialism / Egalitarianism (EqRgtsToofar)
.01 (.02)
-2.23 (2.40)
-.01 (.02)
-.00 (.02)
3.01* (1.64)
.01 (.02)
Individualism / Communitarianism (GovOut)
.03* (.02)
.03 (2.82)
-.00 (.03)
.03* (.02)
-2.80 (1.93)
.02 (.03)
Talk about politics
.05*** (.02)
2.96 (2.33)
.00 (.02)
.00 (.02)
3.19** (1.60)
.01 (.02)
Political Knowledge .19* (.10)
47.56*** (15.49)
-.15 (.15)
.33*** (.10)
-18.57* (10.60)
-.05 (.14)
Energy Knowledge .22** (.10)
26.36* (16.21)
.21 (.15)
.06 (.11)
-20.69* (11.10)
-.13 (.15)
Income .00 (.03)
15.55*** (4.46)
-.00 (.04)
-.04 (.03)
15.26*** (3.05)
.05 (.04)
Education .03 (.03)
11.21** (4.84)
.02 (.05)
.10*** (.03)
4.17 (3.31)
-.01 (.05)
Age -.01*** (.00)
.00 (.28)
.00 (.00)
-.00 (.00)
-0.84*** (.19)
.00 (.00)
Female -.01 (.06)
-27.13*** (8.62)
-.05 (.08)
.14** (.06)
-16.66*** (5.90)
-.14* (.08)
Minority .07 (.06)
-17.78* (10.01)
.07 (.09)
-.03 (.07)
7.85 (6.86)
.10 (.09)
Trust Government .05 (.04)
-3.49 (6.65)
.08 (.06)
-.03 (.04)
3.01 (4.55)
.15** (.06)
Media use -.11 (.13)
2.39 (20.02)
-.05 (.19)
.02 (.13)
40.10*** (13.71)
.20 (.19)
Party ID .02 (.02)
-.504 (3.19)
-.02 (.03)
.01 (.02)
1.34 (2.19)
.02 (.03)

35
Likely to Insulatea
Max WTP Weatherizeb
Email on Insulationc
Likely to Curtaila
Max WTP Smart Mtr.b
Email on Smart Mtr.c
Ideology
-.02 (.02)
-1.56 (3.72)
-.03 (.03)
-.02 (.02)
-1.51 (2.54)
-.05* (.03)
Pay own utility -.20 (.09)
-9.99 (14.34)
-.29 (.15)
-.33*** (.09)
1.02 (9.82)
-.10 (.14)
House (1) or Apartment (2) -.52** (.06)
-84.15*** (9.67)
-.15 (.09)
-.20*** (.06)
-9.64 (6.62)
-.19** (.09)
Government Responsible .04** (.02)
.839 (3.11)
.04 (.03)
.05** (.02)
5.33*** (2.13)
.02 (.03)
Consumers Responsible .01 (.02)
10.50*** (3.47)
.01 (.03)
.01 (.02)
3.19 (2.37)
-.02 (.03)
Effectiveness of Consumer Approaches
.03 (.02)
.61 (3.68)
.11*** (.04)
.06** (.02)
1.99 (2.53)
.04 (.04)
Climate warm .03 (.03)
7.24 (5.08)
.05 (.04)
.09*** (.03)
5.94* (3.48)
-.00 (.05)
Constant ----- 51.28
(49.56) -2.04 (0.48) ------ -41.25
(33.93) -2.18 (0.47)
Log-likelihood / R2 -2771.32 .23 -710.12 -2390.11 .14 -712.65
Number of observations 1600 1600 1600 1600 1600 1600 aEntries are ordered probit coefficients with standard errors in parentheses; b Entries are ordinary least squares (OLS) coefficients with standard errors in parentheses; c Entries are probit regression coefficients with standard errors in parentheses. *** p < .01; ** p < .05; * p < .01 (one-tailed tests).
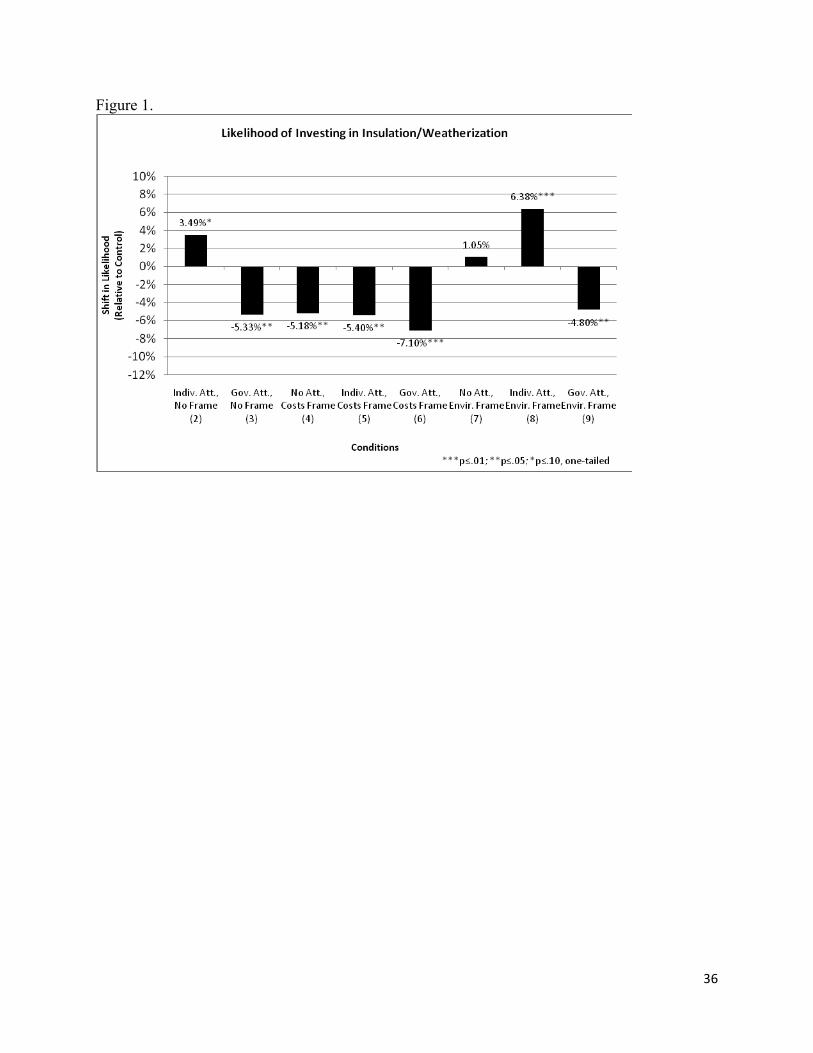
36
Figure 1.
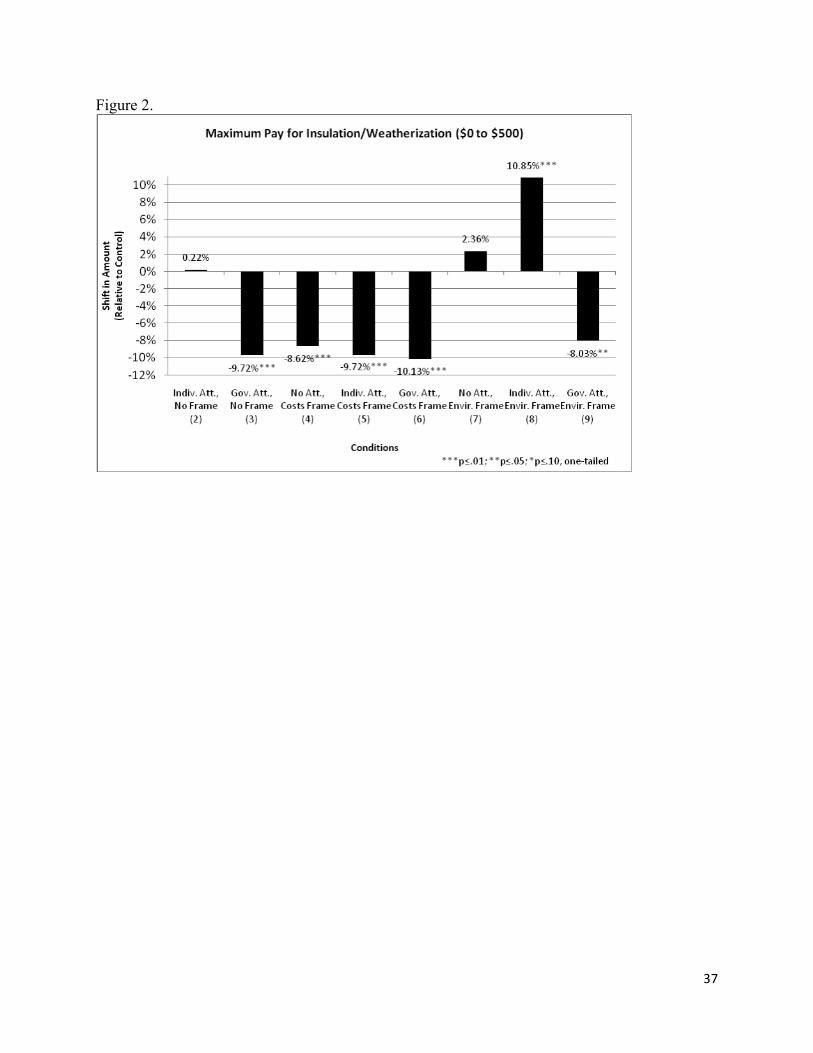
37
Figure 2.

38
Figure 3.

39
Figure 4.
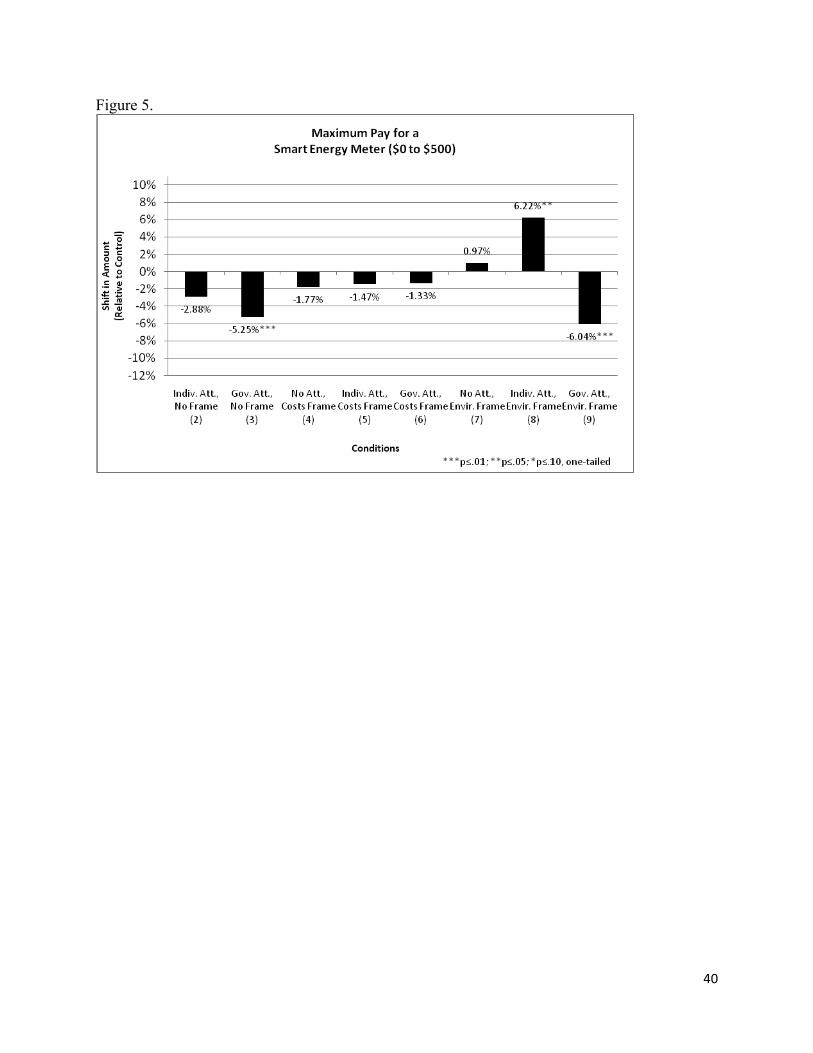
40
Figure 5.
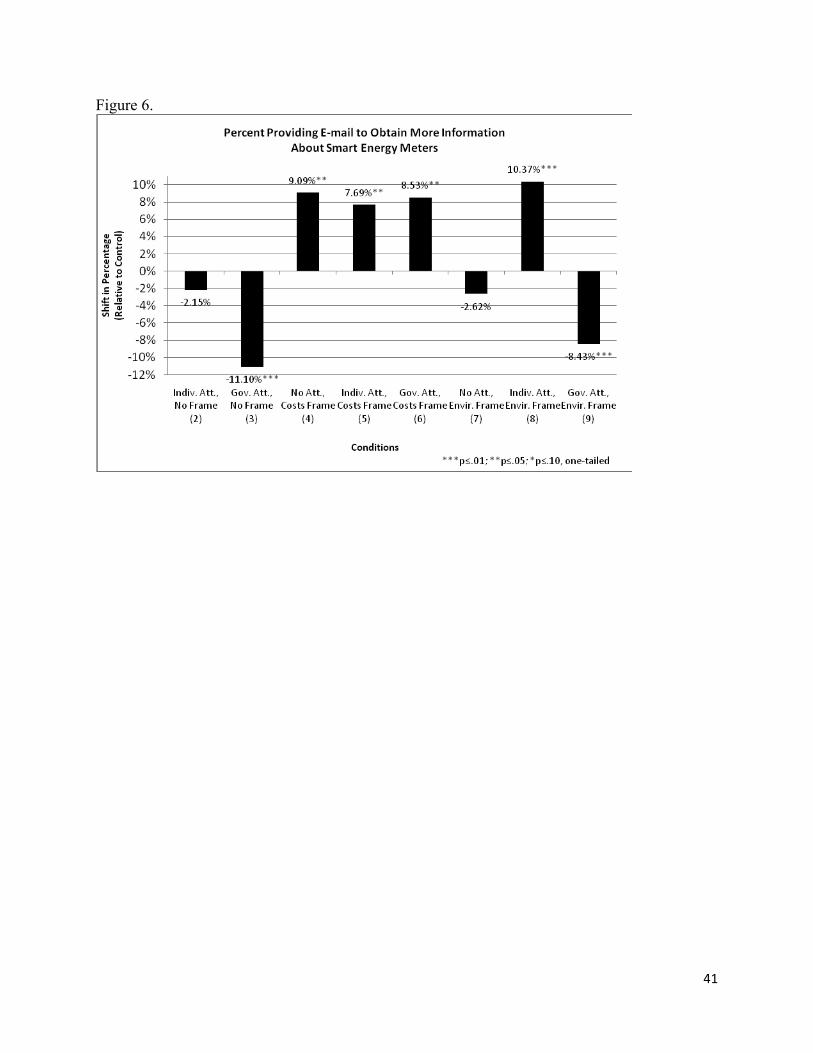
41
Figure 6.
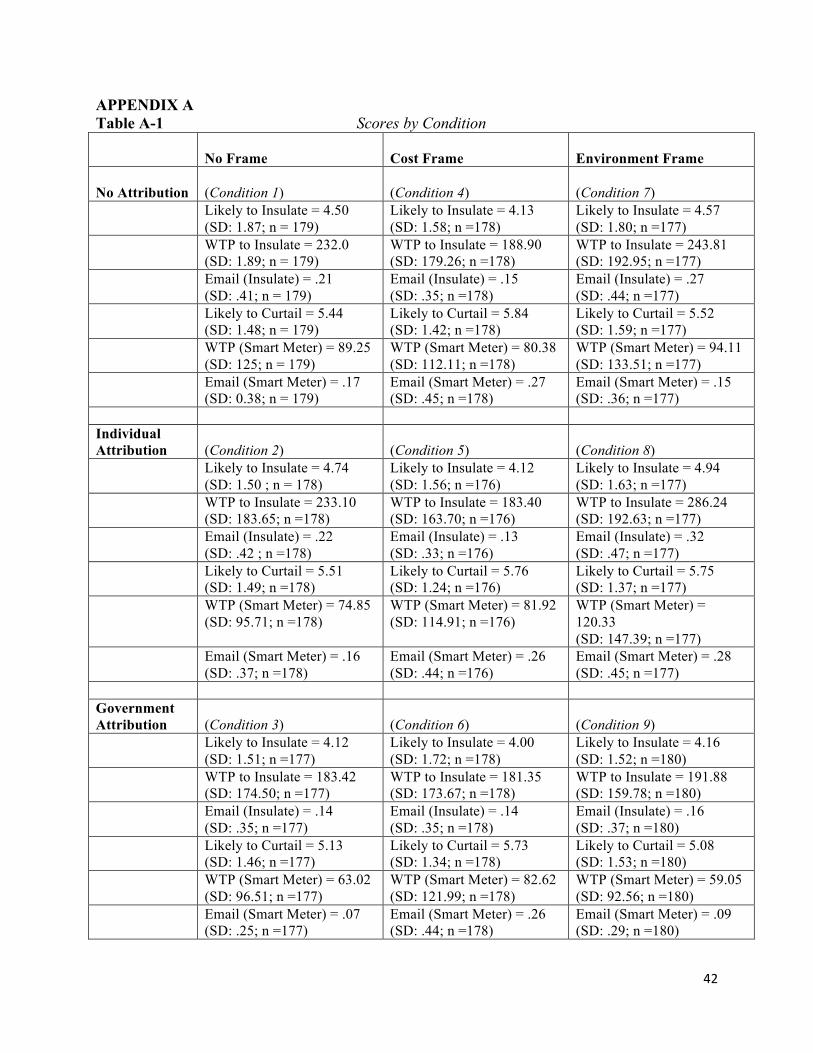
42
APPENDIX A Table A-1 Scores by Condition No Frame Cost Frame Environment Frame No Attribution
(Condition 1) (Condition 4) (Condition 7)
Likely to Insulate = 4.50 (SD: 1.87; n = 179)
Likely to Insulate = 4.13 (SD: 1.58; n =178)
Likely to Insulate = 4.57 (SD: 1.80; n =177)
WTP to Insulate = 232.0 (SD: 1.89; n = 179)
WTP to Insulate = 188.90 (SD: 179.26; n =178)
WTP to Insulate = 243.81 (SD: 192.95; n =177)
Email (Insulate) = .21 (SD: .41; n = 179)
Email (Insulate) = .15 (SD: .35; n =178)
Email (Insulate) = .27 (SD: .44; n =177)
Likely to Curtail = 5.44 (SD: 1.48; n = 179)
Likely to Curtail = 5.84 (SD: 1.42; n =178)
Likely to Curtail = 5.52 (SD: 1.59; n =177)
WTP (Smart Meter) = 89.25 (SD: 125; n = 179)
WTP (Smart Meter) = 80.38 (SD: 112.11; n =178)
WTP (Smart Meter) = 94.11 (SD: 133.51; n =177)
Email (Smart Meter) = .17 (SD: 0.38; n = 179)
Email (Smart Meter) = .27 (SD: .45; n =178)
Email (Smart Meter) = .15 (SD: .36; n =177)
Individual Attribution
(Condition 2) (Condition 5) (Condition 8)
Likely to Insulate = 4.74 (SD: 1.50 ; n = 178)
Likely to Insulate = 4.12 (SD: 1.56; n =176)
Likely to Insulate = 4.94 (SD: 1.63; n =177)
WTP to Insulate = 233.10 (SD: 183.65; n =178)
WTP to Insulate = 183.40 (SD: 163.70; n =176)
WTP to Insulate = 286.24 (SD: 192.63; n =177)
Email (Insulate) = .22 (SD: .42 ; n =178)
Email (Insulate) = .13 (SD: .33; n =176)
Email (Insulate) = .32 (SD: .47; n =177)
Likely to Curtail = 5.51 (SD: 1.49; n =178)
Likely to Curtail = 5.76 (SD: 1.24; n =176)
Likely to Curtail = 5.75 (SD: 1.37; n =177)
WTP (Smart Meter) = 74.85 (SD: 95.71; n =178)
WTP (Smart Meter) = 81.92 (SD: 114.91; n =176)
WTP (Smart Meter) = 120.33 (SD: 147.39; n =177)
Email (Smart Meter) = .16 (SD: .37; n =178)
Email (Smart Meter) = .26 (SD: .44; n =176)
Email (Smart Meter) = .28 (SD: .45; n =177)
Government Attribution
(Condition 3) (Condition 6) (Condition 9)
Likely to Insulate = 4.12 (SD: 1.51; n =177)
Likely to Insulate = 4.00 (SD: 1.72; n =178)
Likely to Insulate = 4.16 (SD: 1.52; n =180)
WTP to Insulate = 183.42 (SD: 174.50; n =177)
WTP to Insulate = 181.35 (SD: 173.67; n =178)
WTP to Insulate = 191.88 (SD: 159.78; n =180)
Email (Insulate) = .14 (SD: .35; n =177)
Email (Insulate) = .14 (SD: .35; n =178)
Email (Insulate) = .16 (SD: .37; n =180)
Likely to Curtail = 5.13 (SD: 1.46; n =177)
Likely to Curtail = 5.73 (SD: 1.34; n =178)
Likely to Curtail = 5.08 (SD: 1.53; n =180)
WTP (Smart Meter) = 63.02 (SD: 96.51; n =177)
WTP (Smart Meter) = 82.62 (SD: 121.99; n =178)
WTP (Smart Meter) = 59.05 (SD: 92.56; n =180)
Email (Smart Meter) = .07 (SD: .25; n =177)
Email (Smart Meter) = .26 (SD: .44; n =178)
Email (Smart Meter) = .09 (SD: .29; n =180)
43
APPENDIX B Condition 1 No Attribution / No Effect Frame We are now going to ask you about energy choices you may make. Condition 2 Individual Attribution / No Effect Frame We are now going to ask you about energy choices you may make. The ultimate success of our nation’s energy policy depends largely on individuals’ choices about energy consumption. Individuals need to step up to the plate – something they have done throughout American history without having to rely on the government. Condition 3 Government Attribution / No Effect Frame We are now going to ask you about energy choices you may make. The ultimate success of our nation’s energy policy depends largely on governmental decisions about the energy supply. Government needs to step up to the plate – something they often do when individuals alone cannot resolve a problem. Condition 4 No Attribution Frame / Con Effect Frame We are now going to ask you about energy choices you may make. These choices have important economic consequences. For instance, switching from regular light bulbs to energy saving bulbs will cost consumers, in general, billions of dollars each year by causing them to pay a cost premium. Condition 5 Individual Attribution / Con Effect Frame We are now going to ask you about energy choices you may make. These choices have important economic consequences. For instance, switching from regular light bulbs to energy saving bulbs will cost consumers, in general, billions of dollars each year by causing them to pay a cost premium. That said, the ultimate success of our nation’s energy policy depends largely on individuals’ choices about energy consumption. Individuals need to step up to the plate – something they have done throughout American history without having to rely on the government. Condition 6 Government Attribution / Con Effect Frame We are now going to ask you about energy choices you may make. These choices have important economic consequences. For instance, switching from regular light bulbs to energy saving bulbs will cost consumers, in general, billions of dollars each year by causing them to pay a cost premium. This is why the ultimate success of our nation’s energy policy depends largely on governmental decisions about the energy supply. Government needs to step up to the plate – something they often do when individuals alone cannot resolve a problem. Condition 7 No Attribution / Pro Effect Frame We are now going to ask you about energy choices you may make. These choices have important environmental consequences. For instance, switching from regular light bulbs to energy saving bulbs will help ensure that individuals, in general, live in a healthy environment by saving the world from millions of metric tons of greenhouse gases.
44
Condition 8 Individual Attribution / Pro Effect Frame We are now going to ask you about energy choices you may make. These choices have important environmental consequences. For instance, switching from regular light bulbs to energy saving bulbs will help ensure that individuals, in general, live in a healthy environment by saving the world from millions of metric tons of greenhouse gases. This is why the ultimate success of our nation’s energy policy depends largely on individuals’ choices about energy consumption. Individuals need to step up to the plate – something they have done throughout American history without having to rely on the government. Condition 9 Government Attribution / Pro Effect Frame We are now going to ask you about energy choices you may make. These choices have important environmental consequences. For instance, switching from regular light bulbs to energy saving bulbs will help ensure that individuals, in general, live in a healthy environment by saving the world from millions of metric tons of greenhouse gases. That said, the ultimate success of our nation’s energy policy depends largely on governmental decisions about the energy supply. Government needs to step up to the plate – something they often do when individuals alone cannot resolve a problem.