Embed Size (px)
Citation preview


MOTIVATION FOR PHEV/BEV FEASIBILITY STUDY
At the outset, replacement of conventional fossil-fuel driven public transportation fleets with cleaner and greener Plug-in Hybrid/BEV alternatives seems lucrative
Parameter Conventional Diesel
Plug-in Hybrid/BEV
Fuel Savings
Fuel Economy
Tailpipe CO2 Emissions
Noise Pollution
Initial Cost
Operating & Running Cost
Favorable Unfavorable

GLOBAL SCENARIO OF ELECTRIC BUSES/PILOTS
City/Country Bus Technology Bus Manufacturer Project Details
Bangalore BEV BYD Pilot tested
Gothenburg PHEV Volvo Test Stage Completed
Stockholm PHEV Volvo Test Stage
London HEV
Alexander Dennis
Volvo
WrightBus
800 diesel-electric hybrids
(NewRoutemasters) are running on
commercial routes
London PHEV Alexander Dennis Test Stage
US (Texas, Collarado,
Iowa) HEV BYD Test Stage
US (Long Beach, Los
Angeles)BEV BYD
Test Stage Complete
Commercial operation to begin
HongKong BEV BYD Test Stage
Shenzhen HEV
BEV
BYD
Wuzhoulong MotorsCommercial operation
Madrid HEV
Tata Hispano Motors
BYD
Hino Motors
Trial Operations with 10 buses
Japan (Hamura, Tokyo) BEV Hno Motors Commercial operation
Amsterdam BEV BYD35 Buses to be supplied for Airport
Operation
Poland BEV BYD Test Stage
Canada BEV BYD Test Stage
Israel BEV BYD700 Buses to be supplied for trials and
operation
Uruguay BEV BYD500 buses to be suppplied to Tourism
Department
Singapore BEV BYD Test Stage

OVERVIEW OF ELECTRIC DRIVE TECHNOLOGIES Technology Main Characteristics
HEV
• Uses electric motor + IC engine to propel vehicle • IC engine powered by conventional fuel • Motor powered by battery (charged through mechanical means such
as Regenerative Braking)
PHEV
• Propulsion similar to HEV • Motor powered by Battery and/or IC engine • Battery charged through plug-in electricity
BEV
• Propulsion through electric traction motor • Battery is only source to power motor and ancillary systems • Relatively large on-board battery
Depending on the degree of electrification
of propulsion system:
• Hybrid Electric Vehicle • Plug-in Hybrid Electric Vehicle • Battery Electric Vehicle • Fuel Cell electric technologies
Figure: Different Degrees of Electrification of Vehicles
Energy Source Propulsion Device
Fuel Economy Benefits
(BEV uses no liquid fuel) HEV PHEV
Tailpipe Emission Reduction Benefits
HEV PHEV BEV
Operating and Running Fuel cost
savings
HEV BEV PHEV Increasing
Comparative Analysis of benefits from different electric drive technologies

PHEV POWERTRAIN ARCHITECTURES
Fig 1: Series Drivetrain Architecture Fig 2: Parallel Drivetrain Architecture Fig 3: Series-Parallel Hybrid Drivetrain Architecture
POWERTRAIN ARCHITECTURE
PARAMETERSSERIES HYBRID PARALLEL HYBRID
Prime Mover• Electric Motor Provides torque to axle
• IC Engine runs generator that charges battery
• Both Electric Motor and IC Engine provide torque
• IC Engine also acts as prime mover when necessary
Modes of Operation
• Charge Depleting Mode (CDM)
• Charge Sustaining Mode (CSM)
• Blended Mode
• CDM
• CSM
• Blended Mode
• Mixed Mode
Battery & All Electric Range• Bigger Battery Size
• Longer electric range
• Comparitively Smaller Battery size
• Limited electric range
Motor Size Larger motor Smaller Motor
Transmission SystemDoes not require conventional transmission
(Since IC engine not prime mover)
Requires conventional transmission
(IC engine and motor are prime movers)
Operational suitability
charging
Suitable for Small/Mid-range application (urban
environment)Suitable for Long Range applications (highways)

BATTERY TECHNOLOGY
Battery System (Complete without
charger) 2012 2015 2020
Li-ion (includes sophisticated BMS
and cooling) 600-750 400-500 250-300
NiMH (includes imple BMS & cooling
for HEV only) 500-700 400-500 350-400
NiCd (includes simple controller) 400-600 350-450 300-350
Lead-Acid/SLA (includes simple
controller) 220-250 200-220 180-200
Desirable features of an electrical battery pack are:
• Powerful • Durable • Dense
PHEV: Fast Charging Batteries Two characteristics of a battery make it feasible in an urban bus system:
• Rapid Charging (minimize time spent on charging)
• Long Cycle Life (minimal replacement of battery)
These conditions are satisfactorily fulfilled by a new breed of Li-ion
batteries called the Lithium Titanate Batteries (full name lithium metatitanate; Li4Ti5O12 or LTO). • LTO battery has been tested and proved to be most appropriate choice
for electric vehicles (PHEV in particular)
• Two key manufacturers of the LTO currently are Toshiba and Altair Nanomaterials.
This figure shows common batteries in automotive field. Lithium and Ni-MH batteries main stream for electric (PHEV, HEV, EV) and commercial (IC) vehicles Due to their shown
characteristics, Li-ion batteries are extremely suitable for use in electric vehicles..
5 times energy density
High Initial Cost
Low Discharge Rates
Sustained High Performance
Low Maintenance Cost
Longer Lifespan
Li-ion v/s Sealed Lead Acid (SLA) Batteries (automotive Batteries)
Cost Considerations The high costs are bound to decrease on Y-O-Y basis with tremendous amount of research being conducted in this area. Following table gives a cost projection of different battery types in USD/kWh

GOTHENBURG TRIALS: VOLVO PHEV CASE STUDY
Aspirations Uncertainties
Silent Durability
Fuel and energy efficient Vehicle Range
Low or Zero emissions Cost
Green House Gas reduction Infrastructure Compatibility
Sustainable energy resources
During 2013, Volvo buses undertook field testing of its plug-in hybrid model Electric 7900 in Gothenburg as a part of its Sweden electro-mobility plan. Three PHEV buses have been running on the public transportation system of Gothenburg since the summer of 2013.
ELECTRO-MOBILITY PLAN Step-by-Step Implementation (from Diesel to)
1) Confirmed Hybrid technology 2) a) Plug-in hybrids without charging
b) Plug-in hybrids with charging 3) Full Electric Buses
Phase I Introduction of Hybrid
Buses lowers fuel consumption by 40%
(Complete)
Phase II Introduction of charging
stations enable 75% electric drive with reliability of
diesel
Phase III Electric Buses introduced in city center and PHEV stays
efficient in inter-city operations
2013 2015 2017 2019 2021 2023 2025
Diesel HEV PHEV BEV Figure: Different Phases of Electro-mobility Plan

GOTHENBURG TRIALS: VOLVO PHEV CASE STUDY
Electric Drive Technology PHEV
Charging Methodology Rapid/Fast Charging
Charging Technology Conductive Charging
Charging InfrastructureOverhead Charging (using
rooftop pantographs)
Bus Technology: Volvo Electric 7900
Drivetrain
Components
Small Diesel Engine
Lithium-ion Battery
Electric Motor
`Electric Motor Volvo I-SAM
Output: 150kW
Torque(max): 1200 Nm
Charging
Technology
BusBaar Rapid
Charging
(overhead
pantograph)
Li-ion Battery Voltage: 600V
Total Capacity: 19kWh
Charging Stations Route end stations Diesel Engine Volvo D5F215 EURO
V/EEV with
Charging Time 5-8 minutes Length 12m
All-electric
Distance
8-10kms Height 3280m
Fuel Saving 75% Width 2550m
Energy Reduction 60% Passenger
Capacity
95
CO2 Reduction 75% No. of Seats
(max)
32+1(folded)
Company Specifications

GOTHENBURG TRIALS: VOLVO PHEV CASE STUDY
Field Trial Results
• PHEV fuel consumption is <11 litres per 100km (81% less than conventional diesel) • Total energy consumption – based on electricity and diesel- is 60% lower overall
• Appx 7km of all electric distance (70% of the trial route)
• Charging time ranges from 6-10 minutes • Tailpipe CO2 reductions estimated to be around 75% lower
The Way Ahead • Gothenburg continues in 2014 until completion of 10,000 operating hours • Stockholm has begun a demonstration with 8 Volvo Electric 7900 (PHEV) buses and 2 charging stations • Hamburg and Luxemburg have placed orders for starting demo runs • 7900 Electric Hybrid model has been launched in IAA 2014 • Commercial production by Volvo to commence from 2016

TfL (Travel For London) Electro-mobility Case Study
TfL Hybrid (HEV) Bus Fleet
• London Bus fleet around 8700 buses
• Carries 2.3 billion passengers per year serving over 700 routes with 20,000 stops
• Around 800 are hybrids (HEVs) (including New
Routemasters)
• Deliver minimum 30% reduction in CO2 and 30% better fuel economy
• More being introduced in a rolling program
• Target is 20% (1700) fleet substitution by hybrid buses by
2016 • Projected tailpipe reduction in CO2 emissions upon 20%
substitution is around 20,600 tonnes a year
TfL (Travel For London) Electro-mobility Case Study
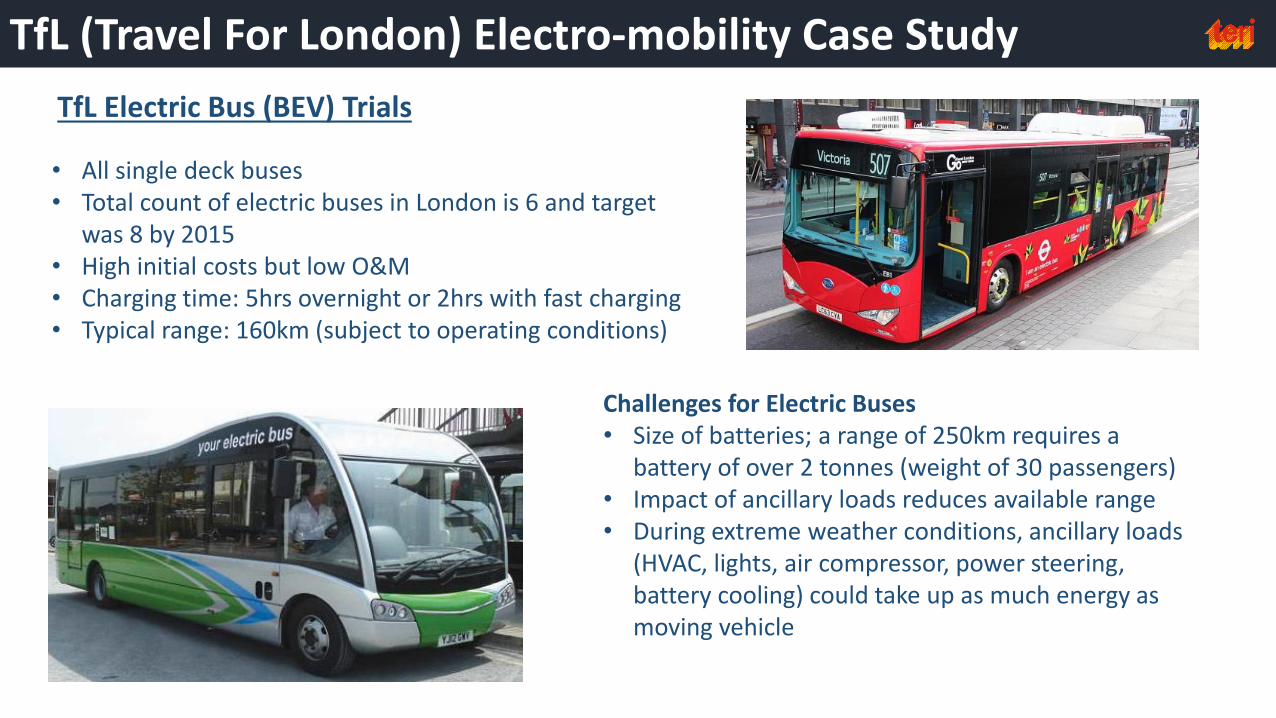
TfL Electric Bus (BEV) Trials
• All single deck buses • Total count of electric buses in London is 6 and target
was 8 by 2015 • High initial costs but low O&M • Charging time: 5hrs overnight or 2hrs with fast charging • Typical range: 160km (subject to operating conditions)
Challenges for Electric Buses • Size of batteries; a range of 250km requires a
battery of over 2 tonnes (weight of 30 passengers) • Impact of ancillary loads reduces available range • During extreme weather conditions, ancillary loads
(HVAC, lights, air compressor, power steering, battery cooling) could take up as much energy as moving vehicle

TfL (Travel For London) Electro-mobility Case Study
TfL Plug-in Hybrid (PHEV) Trials
• Aim to operate vehicles on grid electricity as much as
possible (70% electric distance)
• Buses being provided by Alexander Dennis and charging technology by IPT Technology
• Demo on Route 69 between Canning Town and
Walthamstow bus stations (appx 12km)
• London buses operate in a highly busy environment • Wireless charging is the selected method because of its
convenience to quickly charge buses
• Recharging at end stations (like Gothenburg)
• Alexander Dennis Enviro400H E400 buses (double deck)

PHEV CASE STUDY FOR AHMEDABAD MTS
PARAMETER VALUE SOURCE
Total Fleet 942 AMTS Data
Fleet Utilization 84.80% Metropolitan fleet Data
Rapid Charging Time (8C) (minutes) 10 Volvo Gotheburg Test Results
Nominal Cost of Diesel (Rs/L) 66 mypetrolprice.com
Y-O-Y increase in Diesel Price 7% Historic Trends rom mypetrolprice.com
LTO battery Cost ('000 Rs/kWh) 30 Roland Berger Strategic Consultant Battery
Projections Report 2012
Y-O-Y decrease in battery cost 9% Roland Berger Strategic Consultant Battery
Projections Report 2012
ICEV Diesel Fuel Efficiency (km/l) 5 AMTS Data
PHEV Diesel Fuel Efficiency (km/l) 8 Proterra and Volvo trials
Electric mileage (kWh/km) 2 Volvo Gotheburg Test Results
Research work on Electric buses Electricity Equivalency (tCO2/kWh) 0.00078 CEA Data for NEWNE Grids
Diesel Equivalency (tCO2/litre) 0.00287 IPCC 2006 Guidelines
Normal Electricity Charges (Rs/unit) 3.9 Torrent Power Ltd-Ahmedabad
Peak Electricity Charges (Rs/unit) 4.6 Torrent Power Ltd-Ahmedabad
Demand Charges (Rs/kW/month) 210 Torrent Power Ltd-Ahmedabad
The following analysis carried out for the Ahmedabad MTS : 1) Charging Infrastructure Analysis 2) Cost Analysis 3) Energy Consumption/Savings Patterns 4) CO2 Emission Patterns
Variables Used: 1) Level of PHEV Fleet Substitution 2) Level of PHEV Electromobility (electric
distance as fraction of total distance)
Assumptions Used
ASSUMPTION VALUE
Life of bus (years) 10 Cost of PHEV (Rs lakh) 300
Vehicle Productivity 250
Operational days per year 300
Battery Technology Toshiba LTO
Battery Size 24kWh (380kg)
Parameters Used

PHEV CASE STUDY FOR AMTS: Charging Infrastructure • PHEV operation in busy urban environment becomes
practical only with intra-day charging
• Intra-day charging causes hindrance to travel time and so practical only with fast/rapid charging infrastructure.
• The charging analysis is based on the assumption that
Rapid Charging Infrastructure has been used.
Two-fold objectives of Charging Infrastructure
1. It allows maximum possible electromobility (electric distance travelled) within constraints of practical operational
2. Minimum time is spent on charging during routine operation
Practical Operation Constraints Inter-City (250km): Alternate Stations (and in-turn successive charging) are at least 40 km apart. Increase in journey time (due to charging) is at most 20% Intra-City (250km per day): Selected routes are such that charging done at end-stations.

PHEV CASE STUDY FOR AMTS: Charging Infrastructure
Charging Parameters PHEV (% electromobility)
100% 80% 60% 40% 30% 20% 10%
Battery Capacity 24kWh 24kWh 24kWh 24kWh 24kWh 24kWh 24kWh
Electric Distance Travelled in single Charge (km)
12 12 12 12 12 12 12
Number of Charging Stations Required on route
20 16 12 8 6 4 2
Distance between charging Stations (km)
12.5 15.6 20.8 31.3 41.7 62.5 125.0
Number of Charging Cycles per day
22 18 14 10 8 6 4
Chargin time per trip (hrs) 3.7 3.0 2.3 1.7 1.3 1.0 0.7
Number of charging cycles per year
6600 5400 4200 3000 2400 1800 1200
Number of Battery Replacements during vehicle lifespan
6 5 4 3 2 1 1
Journey Parameters Conventional
Diesel
PHEV (% electromobility)
100% 80% 60% 40% 30% 20% 10%
Distance Travelled per Day (km)
250 250 250 250 250 250 250 250
Avergae Speed (kmph) 40 40 40 40 40 40 40 40
Fuelling/Charging Time (hrs) 0 3.7 3.0 2.3 1.7 1.3 1.0 0.7
Total Journey Time (hrs) 7.3 11.0 10.3 9.6 9.0 8.6 8.3 8.0
The tables contain estimated values for different Journey Parameters and Charging Parameters. Selection of Appropriate Electromobility Level for long haul and short haul distances depends on these parameters

PHEV CASE STUDY FOR AMTS: Charging Infrastructure
Charging Parameters PHEV (% electromobility)
100% 80% 60% 40% 30% 20% 10%
Battery Capacity 24kWh 24kWh 24kWh 24kWh 24kWh 24kWh 24kWh
Electric Distance Travelled in single Charge (km)
12 12 12 12 12 12 12
Number of Charging Stations Required on route
20 16 12 8 6 4 2
Distance between charging Stations (km)
12.5 15.6 20.8 31.3 41.7 62.5 125.0
Number of Charging Cycles per day
22 18 14 10 8 6 4
Chargin time per trip (hrs) 3.7 3.0 2.3 1.7 1.3 1.0 0.7
Number of charging cycles per year
6600 5400 4200 3000 2400 1800 1200
Number of Battery Replacements during lifespan
6 5 4 3 2 1 1
Journey Parameters Conventional Diesel
PHEV (% electromobility)
100% 80% 60% 40% 30% 20% 10%
Distance Travelled per Day (km)
250 250 250 250 250 250 250 250
Avergae Speed (kmph) 40 40 40 40 40 40 40 40
Fuelling/Charging Time (hrs) 0 3.7 3.0 2.3 1.7 1.3 1.0 0.7
Total Journey Time (hrs) 7.3 11.0 10.3 9.6 9.0 8.6 8.3 8.0 Increase in journey time is 10% - 18% due to added charging time Hence, electromobility levels of 30% and below favorable for Long Haul Journey
Distance between successive stations (and charging) on the route ranges from 41-125 km Hence, electromobility levels of 30% and below favorable for Long Haul Journey
Practicality Considerations for Inter-City Journey (Long Haul)

PHEV CASE STUDY FOR AMTS: Charging Infrastructure
Charging Parameters PHEV (% electromobility)
100% 80% 60% 40% 30% 20% 10%
Battery Capacity 24kWh 24kWh 24kWh 24kWh 24kWh 24kWh 24kWh
Electric Distance Travelled in single Charge (km)
12 12 12 12 12 12 12
Number of Charging Stations Required on route
20 16 12 8 6 4 2
Distance between charging Stations (km)
12.5 15.6 20.8 31.3 41.7 62.5 125.0
Number of Charging Cycles per day
22 18 14 10 8 6 4
Chargin time per trip (hrs) 3.7 3.0 2.3 1.7 1.3 1.0 0.7
Number of charging cycles per year
6600 5400 4200 3000 2400 1800 1200
Number of Battery Replacements during lifespan
6 5 4 3 2 1 1
Journey Parameters Conventional
Diesel
PHEV (% electromobility)
100% 80% 60% 40% 30% 20% 10%
Distance Travelled per Day (km)
250 250 250 250 250 250 250 250
Avergae Speed (kmph) 40 40 40 40 40 40 40 40
Fuelling/Charging Time (hrs) 0 3.7 3.0 2.3 1.7 1.3 1.0 0.7
Total Journey Time (hrs) 7.3 11.0 10.3 9.6 9.0 8.6 8.3 8.0
Practicality Considerations for Intra-City Journey (Short Haul)
Distance between successive stations (and charging) decides the route on which PHEV are deployed So, a route distance of 12 km can have a PHEV running at 100% electromobility Hence, High electromobility is favorable for short intra-city routes
Increase in journey time is translated into reduced number of trips per day and so not significant Hence, High electromobility is favorable for intra-city travel

PHEV CASE STUDY FOR AMTS: Cost Analysis
Cash Flow representation for one PHEV bus operating at 60% electromobiliy (i.e 60% electric distance) • Life of bus is 10 years
• Battery is 24kWh Toshiba Scib
LTO(assumption)
• Involves 3 battery replacements over the lifespan
• With more substitution of fleet with PHEV buses, increase in diesel savings is much more than increase in fuel costs
-3000
-2500
-2000
-1500
-1000
-500
0
500
1000
1500
2000
2500
3000
0 1 2 3 4 5 6 7 8 9 10
(‘0
00
Rs)
Year (life of bus)
Single PHEV Cash Flow: 60% Electromobility
Bus Cost ('0000 Rs) Diesel Savings ('000 Rs) Battery Costs ('000 Rs) Fuel Costs ('000 Rs)(Electricity + Diesel)

(25,000)
(20,000)
(15,000)
(10,000)
(5,000)
-
10% 20% 30% 40% 50% 60% 70% 80% 90% 100%
CA
PEX
: Bu
s an
d C
har
gin
g In
fras
tru
ctu
re C
ost
(m
illio
n R
s)
Axis Title
PHEV Fleet Substitution
60% Electromobility 80% Electromobility 100% Electromobility
(1,400)
(1,200)
(1,000)
(800)
(600)
(400)
(200)
-
10% 20% 30% 40% 50% 60% 70% 80% 90% 100%
Bat
tery
Re
pla
cem
en
t C
ost
s
(mil
lion
Rs)
Axis Title
PHEV Fleet Substitution
60% Electromobility 80% Electromobility 100% Electromobility
(7,000)
(6,000)
(5,000)
(4,000)
(3,000)
(2,000)
(1,000)
-
10% 20% 30% 40% 50% 60% 70% 80% 90% 100%
Fuel
(El
ect
ric+
Die
sel)
Co
sts
(m
illio
n R
s)
Axis Title
PHEV Fleet Substitution
60% Electromobility 80% Electromobility 100% Electromobility
-
10,00,000
20,00,000
30,00,000
40,00,000
50,00,000
60,00,000
70,00,000
10% 20% 30% 40% 50% 60% 70% 80% 90% 100%
Die
sel S
avin
gs (
mill
ion
Rs)
PHEV Fleet Substitution
60% Electromobility 80% Electromobility 100% Electromobility
PHEV CASE STUDY FOR AMTS: Cost Analysis Figure 1: Total capital costs for varying levels of PHEV fleet substitution at different electromobility levels
Figure 2: Battery costs (from replacements) for varying levels of PHEV fleet substitution at different electromobility levels
Figure 4: Total Diesel monetary savings for varying levels of PHEV fleet substitution at different electromobility levels
Figure 3: Total fuel (electric + diesel) costs for varying levels of PHEV fleet substitution at different electromobility levels
**All cash flows shown in figures have been estimated over the lifespan of Bus (10 years)

-
10,00,000
20,00,000
30,00,000
40,00,000
50,00,000
60,00,000
70,00,000
10% 20% 30% 40% 50% 60% 70% 80% 90% 100%
Ne
t P
rese
nt
Val
ue
(ove
r 1
0 y
ear
Lif
e) (
mil
lion
Rs)
PHEV Fleet Substitution
60% Electromobility 80% Electromobility 100% Electromobility
PHEV CASE STUDY FOR AMTS: Cost Analysis
• For a given level of fleet substitution and electromobility, the different cash flows are used to estimate the Net Present Value (NPV) of the bus over its lifetime (10 years) (Discount Rate taken as 5%)
• The graph clearly shows a positive correlation between the NPV and level of substitution
• Highly positive NPV can be attributed to huge savings accrued from reduction in Diesel usage

0
20
40
60
80
100
120
10% 20% 30% 40% 50% 60% 70% 80% 90% 100%
Elec
tric
ity
Co
nsu
mp
tio
n (
MU
s/ye
ar)
PHEV Fleet Substitution
60% Electromobility 80% Electromobility 100% Electromobility
0.00%
0.20%
0.40%
0.60%
0.80%
1.00%
1.20%
10% 20% 30% 40% 50% 60% 70% 80% 90% 100%
Elec
tric
ity
Co
nsu
mp
tio
n a
s %
of
Ah
med
abad
En
ergy
Req
uir
emen
t
0.00%
0.02%
0.04%
0.06%
0.08%
0.10%
0.12%
10% 20% 30% 40% 50% 60% 70% 80% 90% 100%
Elec
tric
ity
Co
nsu
mp
tio
n a
s %
of
Gu
jara
t En
ergy
Req
uir
emen
t
PHEV Fleet Substitution
60% Electromobility 80% Electromobility 100% Electromobility
PHEV CASE STUDY FOR AMTS: Energy Consumption
Figure 1: Annual electricity consumption for varying levels of PHEV fleet substitution at different electromobility levels
Figure 2: Annual electricity consumption as a fraction of Ahmedabad and Gujarat annual energy requirement

0
2000
4000
6000
8000
10000
12000
10% 20% 30% 40% 50% 60% 70% 80% 90% 100%
Die
sel S
avin
gs (
kL/y
ear)
PHEV Fleet Substitution
60% Electromobility 80% Electromobility 100% Electromobility
0
500
1000
1500
2000
2500
3000
10% 20% 30% 40% 50% 60% 70% 80% 90% 100%
Die
sel C
on
sum
pti
on
(kL
/yea
r)
PHEV Fleet Substitution
60% Electromobility 80% Electromobility 100% Electromobility
PHEV CASE STUDY FOR AMTS: Energy Consumption
Figure 3: Annual diesel consumption by PHEV buses for varying levels of fleet substitution at different electromobility levels
Figure 4: Annual diesel savings by shift from conventional bus to PHEV bus for varying levels of fleet substitution at different electromobility levels

0
20
40
60
80
0 1 2 3 4 5 6 7 8 9 10
Me
tric
to
nn
es
of
CO
2
Life of Bus (year)
Single PHEV Net Emission Data 60% Electromobility; 5% Renewable Fraction*
CO2 Emitted (metric tonnes) CO2 Saved (metric tonnes)
PHEV CASE STUDY FOR AMTS: CO2 Emission Pattern
• The emission estimates take into account a. CO2 emitted by coal based grid electricity generation which is in-turn used for charging PHEVs b. Tailpipe emissions
• The saving estimates take into account savings in tailpipe emission • Higher renewable fraction (higher fraction of electricity coming from clean sources) reduces net
emissions by a PHEV *Renewable fraction means fraction of grid electricity generation that comes from renewable (zero-emission) sources
Figure2: Net emissions and savings of CO2 with substitution of one conventional bus with a PHEV bus at the given levels
0
5
10
15
20
25
30
35
0 1 2 3 4 5 6 7 8 9 10
Me
tric
to
nn
es o
f C
O2
Life of Bus (years)
Single PHEV Emission Data Tailpipe Emission; 60% Electromobility
Tailpipe CO2 Emitted (metric tonnes) CO2 Saved (metric tonnes)
Figure1: Tailpipe emissions and savings of CO2 with substitution of one conventional bus with a PHEV bus at the given levels

KEY TAKEAWAYS
Highly positive NPVs have been observed for PHEV fleet substitution over the life of project. There is a positive correlation between NPV and the levels of substitution (due to non-linear increase in accrued diesel savings)
Taking into account practical considerations of charging infrastructure following observations have been made for inter-city and intra-city PHEV bus usage: Inter-City: PHEV20 - PHEV30 are more favorable Intra-City: PHEV60 - PHEV100 are more favorable
Maximum annual electricity consumption (100% electromobility & 100% fleet substitution) is only 1.08% of
annual Ahmedabad energy requirement
PHEV fleet substitution reduces tailpipe CO2 emission with the reduction ranging from 50% (20% Electromobility) to 100% (100% electromobility)
PHEV fleet substitution project becomes a NET SAVER of CO2 emissions only at (or above) 65-70% renewable fraction. Below this fraction the project acts as a NET EMITTER of CO2