Embed Size (px)
Citation preview
Motivation of working women inthe Greek retail sector:an empirical analysis
Stefanos K. Giannikis and Dimitrios M. MihailUniversity of Macedonia, Thessaloniki, Greece
Abstract
Purpose – A significant trend in the retail sector is women’s over-representation in part-time work.Given the feminisation and adverse working conditions of part-time employment, the purpose of thispaper is to enhance understanding of the motivation of female sales employees.
Design/methodology/approach – Initially, a theoretical framework is presented with the aim ofstipulating the research hypotheses. Empirical evidence was obtained from 349 Greek female salesemployees using a structured questionnaire. Analyses of covariance and hierarchical regressionanalyses were conducted with the aim of exploring the research hypotheses.
Findings – It was found that part-time and full-time female employees are similar in designating thejob motivators that they find important in the workplace. However, surprisingly, results indicated thatfemale part-timers are more optimistic about receiving intrinsic rewards. Further analysis providedevidence on how the work status (part-time/full-time) and the individual characteristics of employeeshave an impact on the reported importance of work motivators and on the expectations of receivingthese rewards.
Practical implications – The findings provide retail firms with significant guidelines on how todevelop a flexible motivational plan that fits the needs of their employees. In addition, the results of thepaper provide retail managers with a profile of motivated, full-time and part-time female employees.
Originality/value – Given the dearth of empirical research on employee motivation in Greece, theresults of the paper provide the wider academic community with new empirical evidence on how themotivation of employees is differentiated by work status.
Keywords Motivation (psychology), Part time workers, Retailers, Greece, Women
Paper type Research paper
1. IntroductionOver the last two decades there has been a growing body of literature concerning thedifferences in attitude between full-time and part-time employees. The animus for thisresearch interest resides in the international proliferation of part-time employment.According to official statistics, part-time work represents approximately 18 per cent ofthe total employment in EU countries (Eurostat, 2007) and 19.1 per cent of the USworkforce (Bureau of Labor Statistics, 2007).
What is also notable is that this expansion of part-time work affects womenespecially. Labour statistics clearly reveal the feminisation of part-time employment.Specifically, at the end of 2006 the part-time workforce accounted for 31.3 per cent forwomen but only 7.7 per cent for men in the EU (Eurostat, 2007). In addition, women’s
The current issue and full text archive of this journal is available at
www.emeraldinsight.com/0143-7720.htm
This research was supported by the European Commission (75 per cent) and the GreekSecretariat for Research and Technology (25 per cent), 3rd Community Support Programme –Measure 8.3.
IJM31,1
4
International Journal of ManpowerVol. 31 No. 1, 2010pp. 4-20q Emerald Group Publishing Limited0143-7720DOI 10.1108/01437721011031667
over-representation in part-time employment is more evident if we focus on the retailsector. According to the Labour Force Survey, women accounted for 61 per cent of theworkforce in retail trade across the EU in 2005. In addition, 30 per cent of peopleemployed were working part-time, 75 per cent of whom were women (Urbanski, 2007).Since the early 1990s, Feldman has suggested that research on part-time labour iscritical for at least two reasons other than the increasing numbers of part-timers. First,retail trade relies most heavily on part-time workers, and, second, part-time work is animportant labour opportunity for women.
Not surprisingly, past studies of part-time employment have focused on the retailsector, and the sample units included major retail firms. However, special attentionshould be given to the nature and quality of part-time employment in the retail sector.Previous research has indicated that part-time workers and retail sales workers aremore likely to be concentrated in the “secondary labour market” in low-level jobs (Tilly,1992; Barker, 1993; Freathy, 1993; Dickens, 1996; Jenkins, 2004; Walsh, 2007).Employees in the “secondary labour market” face low compensation, low traininglevels, minimal skill levels, little job security and a low level of demarcation betweenjobs. Nevertheless, there is a scarcity of empirical research focusing on the motivationof part-time, female employees in such a demanding and stressful work environment.
In addition, it is important to shed light on motivation, because of its link with jobperformance (Oldham, 1976; Mitchell, 1982) as well as with job satisfaction (Lam andZhang, 2003; Linz, 2003) and organisational commitment of employees (Mathieu andZajac, 1990; Lam and Zhang, 2003; Linz, 2004).
Furthermore, replicating previous research on employee motivation will allow us todraw comparisons across countries. The results of this survey study contribute to theexisting employee motivation research that utilises data (Silverthorne, 1992; Huddlestonand Good, 1999; Linz, 2002, 2003, 2004) from the US, China, Russia and Poland.
Moreover, to our knowledge, there are no updated studies that examine themotivation of employees by work status for the Greek case. Since the rate of Greekfemale part-time work is more than three times that of the Greek males (10.2 and 2.8 percent, respectively) (Eurostat, 2007), clearly it would be valuable to shed light on thebehaviour of the part-time female employees in the Greek retail sector.
Focusing on women in retail trade, we identify the job rewards part-time employeesfind important in the workplace when compared to those of full-time salespeople. Inaddition we explore their expectations of receiving such rewards. Furthermore, thisarticle enhances researchers’ understanding of motivation by exploring therelationship between individual characteristics of employees and their perceptions ofwhether they receive what they deem as important in the workplace. In particular,apart from the actual working conditions, we enquire whether there are any subjectivefactors that may influence employees’ perceptions with regard to rewards.
2. Research hypothesesPrevious studies have demonstrated how motivational factors may differ acrosscultures, job level (managers compared to workers), age, and gender (Silverthorne,1992; Huddleston and Good, 1999; Linz, 2002, 2003, 2004; Parsons and Broadbridge,2006). Much of this research was based on the expectancy theory developed by Vroom(1964). According to this theory, employee motivation is related to the valence, which isthe intensity of the desire for extrinsic (e.g. pay, promotion, benefits etc.) or intrinsic
Motivation ofworking women
5
(e.g. self-satisfaction, skill development, learning etc.) rewards, and to the expectationof receiving these rewards.
In particular, Huddleston and Good (1999) examined, first, what workcharacteristics motivate employees of Russian and Polish retail firms and, secondly,employees’ expectations of receiving these rewards. Results indicated that for bothRussian and Polish sales employees the most important work motivators were pay, thefriendliness of co-workers, and the opportunity they have to do something importantfor themselves. Nonetheless, this study also presented the finding that in bothcountries sales employees’ expectations about receiving these important rewards werelower than the importance ratings of the rewards.
In another empirical study, Linz (2004) extended the research of Huddlestone andGood by taking into account job level (managers compared to workers), gender, andage differences of employees. Gender comparisons based on mean values showed thatwomen are more likely than men to report that specific motivators (i.e. pay, the chanceto do something that makes them feel good, job security, praise from supervisor,respect and friendliness of co-workers) are more important in the workplace. However,further analysis showed that women consistently reported lower expectations ofreceiving a desired reward despite the quality of their work.
Associating motivation theory and work status (full-time/part-time) of employees isespecially widespread in studies that explore attitudinal differences at work. Inparticular, this association is evident in studies concerning the job satisfaction ofemployees. Job satisfaction is defined as a positive state that depends not only on thequality of the employment but also on the job experience (Locke, 1976). In particular,job satisfaction results from the comparison between the expectations of rewards thatshould be received and perceptions of actual rewards received (Lawler, 1973): thegreater the gap between the two, the greater the level of job dissatisfaction.
Studies that reported part-timers to be more satisfied than their full-timecounterparts hypothesised that this outcome may be an indication that part-timershold different expectations about work and have different motivation than dofull-timers (Logan et al., 1973; Wortuba, 1990; Fenton-O’Creevy, 1995). It washypothesised that part-time employees may give a lower priority to pay andadvancement and a higher priority to the flexibility of working hours than full-timeemployees do. Based on this rationale, it was suggested that when the initialexpectations of part-timers were lower, their reactions to a similar workplace would bemore positive. Thus, not surprisingly, they are more easily satisfied and tend to reportgreater levels of job satisfaction (Wortuba, 1990; Fenton-O’Creevy, 1995).
Nevertheless, empirical research revealed a different picture. Shockey and Mueller(1994) found that female full-time and part-time employees enter the work experiencewith similar orientations, expectations, and perceptions. Hence, the authors suggestthat it is the less rewarding conditions for part-time female employees that influencelater negative responses to work.
In another study, Kalleberg (1995) found that part-time and full-time employees aresimilar in both the work roles and the characteristics they find important in a job.Nevertheless, differences exist in the rewards that these two groups receive.Part-timers receive lower pay and fringe benefits, while male part-timers exercise lowerjob autonomy and have fewer opportunities for advancement than do full-timeworkers.
IJM31,1
6
Similarly, recent studies indicate that part-time employment is associated withadverse working conditions. Part-timers are not satisfied with the variety of tasks oropportunities for occupational mobility (Tomlinson, 2006), are allocated tounfavourable tasks, are treated as inferior and “second class” (Walsh, 2007), andenjoy less job autonomy (Harley and Whitehouse, 2001).
Focusing on the retail sector, the literature supports the contention that part-timeworkers are indeed less involved in organisational functioning, have shorter tenure,and spend fewer hours in the workplace (Wortuba, 1990; Sinclair et al., 1999; Jenkins,2004). More specifically, Jenkins (2004) found that part-timers in the retail sector (i.e.supermarkets) are either “peak” or “ancillary” employees. “Peak” part-timers areemployed to cover surges in demand across the working day and week and undertakea wide diversity of tasks, while “ancillary” part-timers are characterised by theroutinised nature of work (e.g. stock replenishment), which they undertake outsidenormal working hours.
Consequently, based on previous findings, we would expect full-time and part-timefemale sales employees to be similar in the work motivators (rewards) that they findimportant in retail firms. However, taking into account the poor working conditions ofpart-time work in the retail sector, it is suggested that for part-timers the expectationsof receiving the desired rewards are significantly lower:
H1. Part-time and full-time female sales employees are similar in the workmotivators that they find important in the workplace.
H2. In comparison with their full-time female counterparts, part-time female salesemployees hold lower expectations of receiving the desired work motivatorsin the workplace.
Previous research exploring the attitudes of employees also developed indicators of the“fit” of job rewards (Kalleberg, 1995; Lam and Zhang, 2003; Linz, 2003). Theseindicators were constructed by subtracting the expectations for rewards from theimportance (perceptions) that the respondents attached to them. A positive gap impliesthat there is a gap in motivation and that employees do not receive what they perceiveas important.
Kalleberg (1995) indicated that full-timers overall expressed greater gaps withregard to having a job that provides flexible working hours, while full-time menexpressed greater gaps with regard to job security. In another study, Linz (2003)reported that the biggest gap between the “importance” of rewards and the “likelihood”of receiving intrinsic rewards occurred for the opportunity to learn new things, thesense of freedom, and the development of skills. For extrinsic rewards, the greatestgaps appeared for the amount of pay and the chances of receiving a promotion.Likewise, Lam and Zhang (2003) showed that in the fast-food industry there is asignificant difference between expectations and perceptions of rewards among newemployees.
Nevertheless, past research has not elaborated on the factors predicting thedevelopment of these gaps in motivation. Apart from the working conditions and theactual rewards provided by an employer (objective factors), are there any subjectivefactors that affect employees’ perceptions of the importance of work motivators andtheir expectations of receiving rewards?
Motivation ofworking women
7
Previous studies suggest that demographic (gender, age, marital status etc.) andwork-related characteristics of individuals (tenure, experience with unemployment,number of jobs held etc.) should be considered when attempting to explain attitudes andbehaviours of part-time employees. In particular, Feldman (1990, p. 107), argued that:
. . . demographic groups might weight facets of part-time work differently when they assesstheir overall job satisfaction or motivation.
A thorough examination of the demographic heterogeneity of part-time employees hasbeen provided by Sinclair et al. (1999), Maynard et al. (2006) and Martin and Sinclair(2007). These researchers remarked that part-time workers are not a homogenousworkforce, but instead differ not only from full-timers but also from each other. Inparticular, they identified different subgroups of part-timers based on demographicprofiles, on the reasons for taking up part-time work, and on “life-circumstances” (forinstance, “moonlighters”, “supplementers”, “primaries”, “students”, “caretakers”, etc).These studies underline the significant demographic differences of the part-timesubgroups and indicate how these groups differ from each other with regard to jobattitudes and behaviours.
Hence, based on the above findings, one would expect that demographic andwork-related characteristics of part-time employees have a significant impact onemployees’ perceptions of the importance of work motivators as well as theirexpectations of receiving rewards. For instance, part-time employees with the burden ofcare for dependents (“caretakers” based on Maynard et al., 2006, p. 152) may placegreater importance on the motivators of flexibility of work schedule and of having moreleisure time. On the other hand, part-time employees that earn over 50 per cent of theirtotal family income (“primaries” based Sinclair et al., 1999, p. 343; Martin and Sinclair,2007) may place a greater importance on the motivators of pay and job security:
H3. For part-time compared with full-time female sales employees, thedemographic and work-related characteristics of individuals have asignificant impact on the reported importance of work motivators and theexpectations of receiving these rewards.
3. Method3.1 Procedure and participantsData were collected from 349 female sales employees from 15 retail firms in NorthernGreece. The questionnaires were hand-delivered by the researchers to the salesemployees, and, prior to the completion, participants were informed of the purpose ofthe study and the fact that all identities would be kept completely confidential. Thefunction of this preface was to set the participants at ease, so they would express theirunmet job expectations more openly. Completed questionnaires were handed back tothe researchers.
The sample consisted of 186 full-time and 163 part-time employees. Of the 186full-timers, 133 (71.5 per cent) had at least a high school diploma, 94 (50.5 per cent)provided care to a dependant (i.e. childcare, eldercare, dependents with disabilities),and 95 (51.0 per cent) had tenures of one to 24 months. Similarly, of the 163 part-timers,112 (68.7 per cent) had at least a high school diploma, 103 (63.2 per cent) wereresponsible for the care of dependents, and 107 (65.6 per cent) had tenures of no morethan two years. This trend reflects the high turnover of part-timers.
IJM31,1
8
3.2 MeasuresWork motivators were measured with the instrument developed by Huddleston andGood (1999). The specific instrument was developed to measure the importance and thelikelihood of receiving work motivators in retail firms. This methodology has also beenapplied by Linz (2002, 2003, 2004). Specifically, six extrinsic and five intrinsic workmotivators are evaluated. The extrinsic motivators include pay, promotion, jobsecurity, praise from supervisor, friendliness, and respect of co-workers. The intrinsicmotivators include self-satisfaction, skill development, learning, accomplishment, andfreedom.
Initially, participants were asked to rate the importance of each of the total elevenmotivators on a Likert scale of 1 to 5 (1 ¼ not important and 5 ¼ extremely important).For example, “How important is the amount of pay you get?”. After the completion ofthis set of 11 questions concerning their perceptions of what is important, a secondseries of 11 questions was given asking respondents about their expectations ofreceiving these 11 motivators. The design of the questions was as follows: “how likelyis it that you would get a bonus or pay increase if you performed your job extremelywell?” Once again the questions used a five-point Likert scale, with 1 ¼ not at all likelyand 5 ¼ extremely likely.
The “motivation gap” variables used in this analysis were calculated bysubtracting the “likelihood” mean values from the “importance” mean values. Apositive value score for each of the eleven variables implies that unmet expectationsregarding motivation exist. In other words, a positive value implies that even if theyperformed their jobs extremely well, respondents were not likely to receive what theyperceived as important.
Furthermore, a number of demographic variables were considered as controlledvariables. In order to secure a high response rate of female employees, instead of usingan open-ended question to assess age, we provided a closed question based on six agegroups. However, because 21.2 per cent of the respondents were less that 24 years oldand 76.8 per cent were 25 to 54 years old, age was treated as a dummy variable (AGE0 ¼ 18-24 years old, 1 ¼ older than 25 years old). Similarly, previous research hasshown that there is a relatively large proportion of part-timers in the young age group(,25 years old). In addition, we obtained information regarding the educational levelof the participants (EDUC, 0 ¼ at least high school diploma, 1 ¼ Bachelor’s degree orhigher) and whether they provided care to dependent people – childcare, eldercare,dependents with disabilities – (CARE, 0 ¼ No, 1 ¼ Yes).
Finally, information on work-related characteristics was obtained. Tenure in anorganisation was measured in months (TENURE). Data concerning experience withunemployment, number of jobs held at the time of survey, and number of times theyhad changed employers in the last five years were obtained adopting the questionsapplied by Linz (2003). Experience with unemployment was obtained with thefollowing question: “in the last five years, have you been unemployed, that is withoutwork for more than two weeks, when you wanted to be working?” (UNEMPLOY,0 ¼ No, 1 ¼ Yes). Also, respondents were asked to report the number of jobs held atthe time of survey (NJOBS, 0 ¼ Two or more regular jobs for pay, 1 ¼ This is the onlyregular job that I have), as well as to report the number of times they had changedemployers in the last five years (CHJOBS).
Motivation ofworking women
9
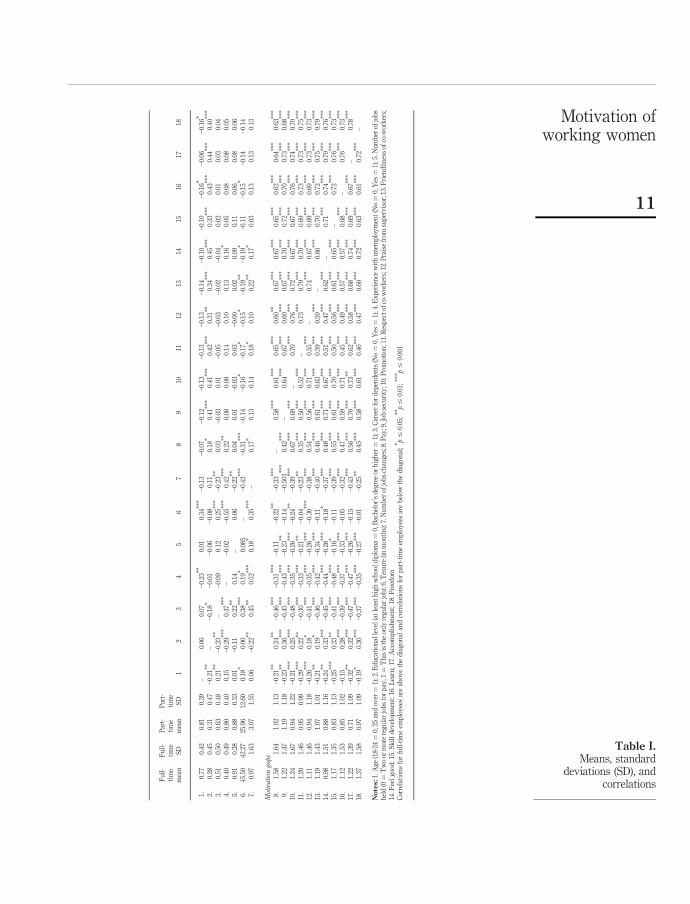
4. Research findingsTable I presents the means, standard deviations, and intercorrelations among thevariables in the study. It shows that no high correlations between the independentvariables exist, thus multicollinearity does not seem to be a problem. To assess morerigorously the relationships between predictors included in the analysis, a moresophisticated collinearity statistic was estimated: the variance inflation factor (VIF).The value of the statistic for each single independent variable was much lower than thecritical value of two (Miles and Shelvin, 2001, pp. 127-132), indicating that thepredictors of the study can be included in regression analyses.
With the aim of ensuring that any reported differences in motivation across groupsare indeed attributed to the work status of employees, it is essential to use covariates. Aseries of analyses of variance of demographic and work-related characteristics by workstatus were conducted. Not surprisingly, according to the theoretical background ofworking women, part-time female employees are more likely to care for dependents(F ¼ 5:717, p # 0.05), to have experienced unemployment (F ¼ 65:944, p # 0.001), tohave shorter job tenure (F ¼ 32:310, p # 0.001), and to have changed more jobs in thelast five years (F ¼ 150:796, p # 0.001). As a result, the coded variables of CARE,UNEMPLOY, TENURE and CHJOBS were retained as control variables in this study.
First, in order to evaluate the effect of work status (full-time/part-time) on theimportance of all of the 11 work motivators (H1), 11 separate analyses of covariancewere conducted. The results are presented in Table II. The independent variable waswork status, and the dependent variables were the reported importance of pay,promotion, job security, praise from supervisor, friendliness of co-workers, respect ofco-workers, self-satisfaction, skill development, learning, accomplishment, andfreedom.
Table II shows that statistically significant differences between full-time andpart-time employees are observed in five of the 11 work motivators. Full-timers exhibita preference for extrinsic motivators while part-timers a preference for intrinsicmotivators. Specifically, full-timers find the extrinsic rewards of respect (F ¼ 6:393,p # 0.05) and friendliness of co-workers (F ¼ 5:747, p # 0.05) most desirable.Conversely, part-time salespeople express a preference for the intrinsic rewards ofopportunities for learning new things (F ¼ 5:560, p # 0.05), of accomplishment ofsomething worthwhile (F ¼ 5:724, p # 0.05), and the development of skills(F ¼ 15:578, p # 0.001). Therefore, the ANCOVAs results indicate that H1 ispartially supported. In more than half of the cases, full-time and part-time female salesemployees are similar in the work motivators that they find important in theworkplace.
In addition, it is noteworthy that the relative ranking of work motivators indicatesthat both part-time and full-time female employees believe that the rewards of pay,friendliness of co-workers, and job security are the three most important motivators inthe workplace.
Next, in order to explore possible differences between full-time and part-time femaleemployees with regard to their expectations of receiving the desired motivators (H2), asecond series of 11 univariate ANCOVAs was conducted. Again, the work status ofemployees was introduced as the independent variable, while the dependent variablesincluded the likelihood of retail employees to receive the 11 extrinsic and intrinsicrewards. Table III presents the findings of the univariate ANCOVAs.
IJM31,1
10
Fu
ll-
tim
em
ean
Fu
ll-
tim
eS
D
Par
t-ti
me
mea
n
Par
t-ti
me
SD
12
34
56
78
910
1112
1314
1516
1718
1.0.
770.
420.
810.
39–
0.06
0.07
20.
23**
0.01
0.34
***
20.
132
0.07
20.
122
0.13
20.
132
0.13
20.
142
0.10
20.
102
0.16
*2
0.06
20.
16*
2.0.
280.
450.
310.
472
0.21
**–
20.
18*
20.
012
0.06
20.
080.
110.
18*
0.41
***
0.41
***
0.42
***
0.31
**0.
34**
*0.
45**
*0.
33**
*0.
43**
*0.
44**
*0.
40**
*
3.0.
510.
500.
630.
480.
21**
20.
23**
–2
0.09
0.12
0.25
***
20.
23**
0.03
20.
030.
012
0.05
20.
032
0.02
20.
040.
020.
010.
030.
044.
0.40
0.49
0.80
0.40
0.15
20.
29**
*0.
47**
*–
20.
022
0.55
***
0.42
***
0.22
**0.
080.
080.
140.
100.
130.
16*
0.05
0.08
0.08
0.05
5.0.
910.
280.
880.
330.
012
0.11
0.22
**0.
14–
0.06
20.
22**
0.04
0.01
20.
030.
032
0.00
0.02
0.09
0.11
0.06
0.08
0.06
6.45
.50
42.2
725
.96
12.6
00.
18*
0.00
0.38
***
0.19
*0.
085
–2
0.42
***
20.
31**
*2
0.14
20.
16*
20.
17*
20.
15*
20.
19**
20.
19*
20.
112
0.15
*2
0.14
20.
147.
0.97
1.63
3.07
1.55
0.06
20.
22**
0.45
**0.
52**
*0.
18*
0.35
***
–0.
17*
0.13
0.14
0.18
*0.
100.
22**
0.17
*0.
030.
130.
130.
13
Motivation
gaps
8.1.
581.
641.
921.
132
0.21
**0.
24**
20.
46**
*2
0.31
***
20.
112
0.22
**2
0.33
***
–0.
58**
*0.
61**
*0.
65**
*0.
60**
0.67
***
0.67
***
0.65
***
0.62
***
0.64
***
0.63
***
9.1.
221.
471.
191.
182
0.23
**0.
36**
*2
0.45
***
20.
43**
*2
0.23
**2
0.14
20.
501**
*0.
42**
*–
0.64
***
0.67
***
0.60
***
0.67
***
0.70
***
0.72
***
0.70
***
0.73
***
0.68
***
10.
1.24
1.67
0.94
1.22
20.
21**
*0.
25**
*2
0.48
***
20.
35**
*2
0.26
***
20.
24**
20.
39**
*0.
67**
*0.
69**
*–
0.70
***
0.76
***
0.72
***
0.67
***
0.67
***
0.76
***
0.74
***
0.70
***
11.
1.20
1.46
0.95
0.99
20.
29**
*0.
22**
20.
30**
*2
0.33
***
20.
21**
20.
042
0.23
**0.
35**
*0.
50**
*0.
52**
*–
0.73
***
0.79
***
0.70
***
0.69
***
0.73
***
0.73
***
0.75
***
12.
1.11
1.46
0.94
1.18
20.
26**
*0.
18*
20.
41**
*2
0.35
***
20.
26**
*2
0.30
***
20.
38**
*0.
54**
*0.
56**
*0.
71**
*0.
55**
*–
0.74
***
0.67
***
0.69
***
0.69
***
0.73
***
0.73
***
13.
1.19
1.43
1.07
1.01
20.
21**
0.19
*2
0.46
***
20.
42**
*2
0.34
***
20.
112
0.40
***
0.46
***
0.61
***
0.63
***
0.59
***
0.59
***
–0.
66**
*0.
70**
*0.
72**
*0.
75**
*0.
79**
*
14.
0.98
1.51
0.88
1.16
20.
24**
0.33
***
20.
45**
*2
0.44
***
20.
28**
*2
0.18
*2
0.37
***
0.48
***
0.71
***
0.67
***
0.51
***
0.47
***
0.62
***
–0.
71**
*0.
74**
*0.
79**
*0.
76**
*
15.
1.17
1.35
0.83
1.13
20.
25**
*0.
23**
20.
41**
*2
0.48
***
20.
16*
20.
112
0.39
***
0.55
***
0.61
***
0.70
***
0.50
***
0.56
***
0.61
***
0.65
***
–0.
72**
*0.
76**
*0.
73**
*
16.
1.12
1.53
0.85
1.02
20.
150.
28**
*2
0.39
***
20.
37**
*2
0.33
***
20.
052
0.32
***
0.47
***
0.59
***
0.71
***
0.45
***
0.49
***
0.57
***
0.57
***
0.68
***
–0.
76**
*0.
73**
*
17.
1.22
1.39
0.71
1.09
20.
32**
0.32
***
20.
47**
*2
0.47
***
20.
26**
*2
0.15
20.
43**
*0.
56**
*0.
70**
*0.
73**
0.62
***
0.58
***
0.68
***
0.74
***
0.69
***
0.67
***
–0.
78**
*
18.
1.37
1.58
0.97
1.09
20.
19*
0.30
***
20.
37**
*2
0.35
***
20.
27**
*2
0.01
20.
25**
0.45
***
0.58
***
0.61
***
0.46
***
0.47
***
0.60
***
0.72
***
0.63
***
0.61
***
0.72
***
–
Notes:
1.A
ge
(18-
24¼
0,25
and
over
¼1)
;2.E
du
cati
onal
lev
el(a
tle
ast
hig
hsc
hoo
ldip
lom
a¼
0,B
ach
elor
’sd
egre
eor
hig
her
¼1)
;3.C
aree
rfo
rd
epen
den
ts(N
o¼
0,Y
es¼
1);4
.Ex
per
ien
cew
ith
un
emp
loy
men
t(N
o¼
0,Y
es¼
1);5
.Nu
mb
erof
job
sh
eld
(0¼
Tw
oor
mor
ere
gu
lar
job
sfo
rp
ay,1
¼T
his
isth
eon
lyre
gu
lar
job
);6.
Ten
ure
(in
mon
ths)
;7.N
um
ber
ofjo
bs
chan
ges
;8.P
ay;9
.Job
secu
rity
;10.
Pro
mot
ion
;11.
Res
pec
tof
co-w
ork
ers;
12.P
rais
efr
omsu
per
vis
or;1
3.F
rien
dli
nes
sof
co-w
ork
ers;
14.
Fee
lg
ood
;15
.S
kil
ld
evel
opm
ent;
16.
Lea
rn;
17.
Acc
omp
lish
men
t;18
.F
reed
omC
orre
lati
ons
for
full
-tim
eem
plo
yee
sar
eab
ove
the
dia
gon
alan
dco
rrel
atio
ns
for
par
t-ti
me
emp
loy
ees
are
bel
owth
ed
iag
onal
;* p
#0.
05;
**p#
0.01
;**
* p#
0.00
1
Table I.Means, standard
deviations (SD), andcorrelations
Motivation ofworking women
11
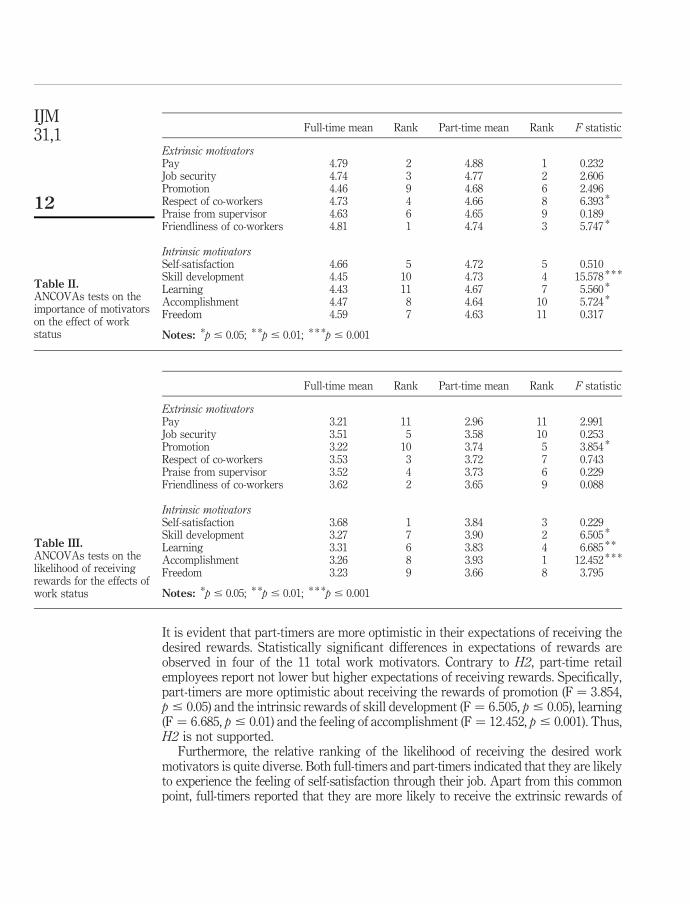
It is evident that part-timers are more optimistic in their expectations of receiving thedesired rewards. Statistically significant differences in expectations of rewards areobserved in four of the 11 total work motivators. Contrary to H2, part-time retailemployees report not lower but higher expectations of receiving rewards. Specifically,part-timers are more optimistic about receiving the rewards of promotion (F ¼ 3:854,p # 0.05) and the intrinsic rewards of skill development (F ¼ 6:505, p # 0.05), learning(F ¼ 6:685, p # 0.01) and the feeling of accomplishment (F ¼ 12:452, p # 0.001). Thus,H2 is not supported.
Furthermore, the relative ranking of the likelihood of receiving the desired workmotivators is quite diverse. Both full-timers and part-timers indicated that they are likelyto experience the feeling of self-satisfaction through their job. Apart from this commonpoint, full-timers reported that they are more likely to receive the extrinsic rewards of
Full-time mean Rank Part-time mean Rank F statistic
Extrinsic motivatorsPay 4.79 2 4.88 1 0.232Job security 4.74 3 4.77 2 2.606Promotion 4.46 9 4.68 6 2.496Respect of co-workers 4.73 4 4.66 8 6.393 *
Praise from supervisor 4.63 6 4.65 9 0.189Friendliness of co-workers 4.81 1 4.74 3 5.747 *
Intrinsic motivatorsSelf-satisfaction 4.66 5 4.72 5 0.510Skill development 4.45 10 4.73 4 15.578 * * *
Learning 4.43 11 4.67 7 5.560 *
Accomplishment 4.47 8 4.64 10 5.724 *
Freedom 4.59 7 4.63 11 0.317
Notes: *p # 0.05; * *p # 0.01; * * *p # 0.001
Table II.ANCOVAs tests on theimportance of motivatorson the effect of workstatus
Full-time mean Rank Part-time mean Rank F statistic
Extrinsic motivatorsPay 3.21 11 2.96 11 2.991Job security 3.51 5 3.58 10 0.253Promotion 3.22 10 3.74 5 3.854 *
Respect of co-workers 3.53 3 3.72 7 0.743Praise from supervisor 3.52 4 3.73 6 0.229Friendliness of co-workers 3.62 2 3.65 9 0.088
Intrinsic motivatorsSelf-satisfaction 3.68 1 3.84 3 0.229Skill development 3.27 7 3.90 2 6.505 *
Learning 3.31 6 3.83 4 6.685 * *
Accomplishment 3.26 8 3.93 1 12.452 * * *
Freedom 3.23 9 3.66 8 3.795
Notes: *p # 0.05; * *p # 0.01; * * *p # 0.001
Table III.ANCOVAs tests on thelikelihood of receivingrewards for the effects ofwork status
IJM31,1
12
friendliness and respect of co-workers as well as praise from the supervisor. On the otherhand, part-timers reported that they are more likely to receive intrinsic rewards and, inparticular, the feeling of accomplishment, skill development, and learning.
Moreover, it is noteworthy that the combined results of Tables II and III reveal thatboth part-time and full-time female employees do not receive the desired rewards inretail firms. Clearly there is a significant discrepancy between what retail employeesdesire and what they expect to receive in the workplace. It is remarkable that whileTable II shows that part-time employees mostly desire the motivators of pay, jobsecurity, and friendliness of co-workers, Table III indicates that for these three workmotivators employees express the lowest expectations of receiving them in theworkplace (11th, 10th and 9th relative rank position, respectively). Similarly, whileTable II shows that full-time employees mostly desire the motivators of pay andpromotional opportunities, Table III indicates that these sales employees least expectto receive these two motivators (11th and 10th relative rank position, respectively).Consequently, for female employees in the retail sector, despite the quality of theirwork, there is a considerable gap between what employees perceive as important andwhat they expect to receive.
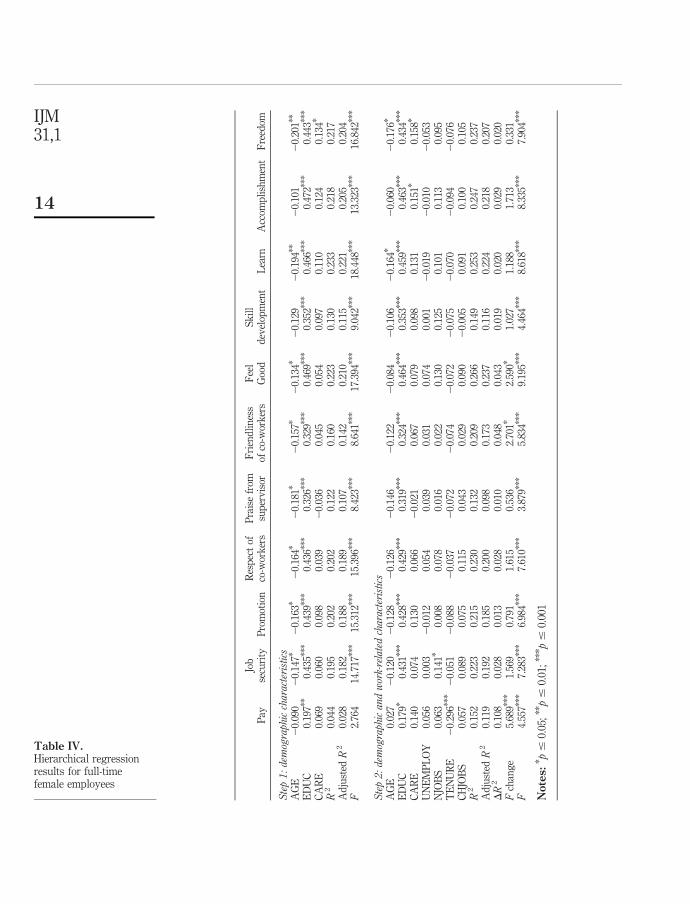
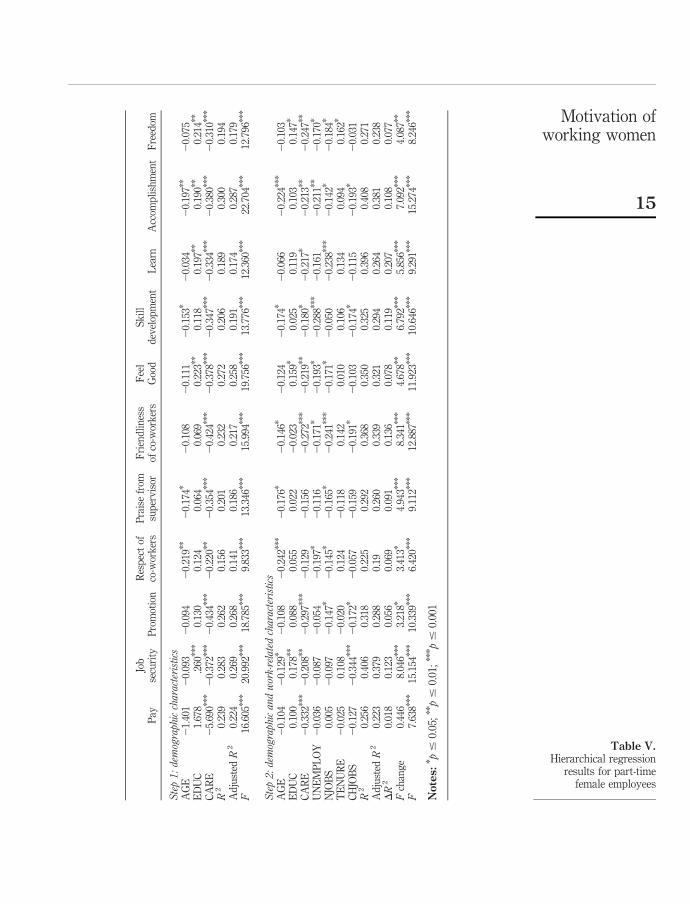
With the purpose of identifying how individual characteristics of employees mayimpact the reported importance of work motivators and the expectations of receivingthese rewards (H3), a series of separate hierarchical regression analyses was conductedby work status (full-time/part-time). Dependent variables included the 11 “motivationgaps”. For each analysis, step 1 is comprising of the demographic variables of age(AGE), education (EDUC), and care for dependents (CARE). Step 2 evaluated theamount of variance explained by work-related characteristics after controlling fordemographics. Work-related variables included experience with unemployment(UNEMPLOY), number of jobs held at the time of the survey (NJOBS), length of tenure(TENURE), and number of job changes in the last five years (CHJOBS). The results ofthese hierarchical regression analyses for full-time and part-time employees aresummarised in Tables IV and V, respectively.
Table IV shows that for full-time employees the initial entry of the demographicvariables is significant for all of the reported gaps at the level of p # 0.001, apart fromthe gap regarding pay (F ¼ 2:764), p . 0.05). Furthermore, demographiccharacteristics jointly explain 12.2 to 23.3 per cent of the variance of motivationgaps. The entry of work-related characteristics (step 2) indicated that for all of theeleven models the variance explained (R 2) is significant at the level of 0.001. However,the change of R 2 is quite low, ranging from 1 to 10.8 per cent, and is statisticallysignificant only for the gap of pay (F change ¼ 5.689, p # 0.001), the gap offriendliness of co-workers (F change ¼ 2.701, p # 0.05), and the sense ofself-satisfaction (feel good) (F change ¼ 2.590, p #0.05). It is worth mentioning thatthe development of gaps in motivation is strongly related to the age (negativerelationship) and particularly to the educational level of employees(positive relationship). In other words, the greater the age of employees, the smallerthe reported gap between expectations of receiving rewards and the importanceattached to them; furthermore, the higher the level of education, the greater the gap inmotivation.
Accordingly, Table V shows that for part-time employees the gap variables in step 1are all significant at the level of p # 0.001. The variance explained (R 2) for the
Motivation ofworking women
13
Pay
Job
secu
rity
Pro
mot
ion
Res
pec
tof
co-w
ork
ers
Pra
ise
from
sup
erv
isor
Fri
end
lin
ess
ofco
-wor
ker
sF
eel
Goo
dS
kil
ld
evel
opm
ent
Lea
rnA
ccom
pli
shm
ent
Fre
edom
Step1:dem
ographiccharacteristics
AG
E2
0.09
02
0.14
7*2
0.16
3*2
0.16
4*2
0.18
1*2
0.15
7*2
0.13
4*2
0.12
92
0.19
4**
20.
101
20.
201*
*
ED
UC
0.19
7**
0.43
5***
0.43
9***
0.43
6***
0.32
6***
0.32
9***
0.46
9***
0.35
2***
0.46
6***
0.47
2***
0.44
3***
CA
RE
0.06
90.
060
0.09
80.
039
20.
036
0.04
50.
054
0.09
70.
110
0.12
40.
134*
R2
0.04
40.
195
0.20
20.
202
0.12
20.
160
0.22
30.
130
0.23
30.
218
0.21
7A
dju
sted
R2
0.02
80.
182
0.18
80.
189
0.10
70.
142
0.21
00.
115
0.22
10.
205
0.20
4F
2.76
414
.717
***
15.3
12**
*15
.396
***
8.42
3***
8.64
1***
17.3
94**
*9.
042*
**18
.448
***
13.3
23**
*16
.842
***
Step2:dem
ographicandwork-relatedcharacteristics
AG
E0.
027
20.
120
20.
128
20.
126
20.
146
20.
122
20.
084
20.
106
20.
164*
20.
060
20.
176*
ED
UC
0.17
9*0.
431*
**0.
428*
**0.
429*
**0.
319*
**0.
324*
**0.
464*
**0.
353*
**0.
459*
**0.
463*
**0.
434*
**
CA
RE
0.14
00.
074
0.13
00.
066
20.
021
0.06
70.
079
0.09
80.
131
0.15
1*0.
158*
UN
EM
PL
OY
0.05
60.
003
20.
012
0.05
40.
039
0.03
10.
074
0.00
12
0.01
92
0.01
02
0.05
3N
JOB
S0.
063
0.14
1*0.
008
0.07
80.
016
0.02
20.
130
0.12
50.
101
0.11
30.
095
TE
NU
RE
20.
296*
**2
0.05
12
0.08
82
0.03
72
0.07
22
0.07
42
0.07
22
0.07
52
0.07
02
0.09
42
0.07
6C
HJO
BS
0.05
70.
089
0.07
50.
115
0.04
30.
029
0.09
02
0.00
50.
091
0.10
00.
105
R2
0.15
20.
223
0.21
50.
230
0.13
20.
209
0.26
60.
149
0.25
30.
247
0.23
7A
dju
sted
R2
0.11
90.
192
0.18
50.
200
0.09
80.
173
0.23
70.
116
0.22
40.
218
0.20
7DR
20.
108
0.02
80.
013
0.02
80.
010
0.04
80.
043
0.01
90.
020
0.02
90.
020
Fch
ang
e5.
689*
**1.
569
0.79
11.
615
0.53
62.
701*
2.59
0*1.
027
1.18
81.
713
0.33
1F
4.55
7***
7.28
3***
6.98
4***
7.61
0***
3.87
9***
5.83
4***
9.19
5***
4.46
4***
8.61
8***
8.33
5***
7.90
4***
Notes:
* p#
0.05
;** p
#0.
01;*
**p#
0.00
1
Table IV.Hierarchical regressionresults for full-timefemale employees
IJM31,1
14
Pay
Job
secu
rity
Pro
mot
ion
Res
pec
tof
co-w
ork
ers
Pra
ise
from
sup
erv
isor
Fri
end
lin
ess
ofco
-wor
ker
sF
eel
Goo
dS
kil
ld
evel
opm
ent
Lea
rnA
ccom
pli
shm
ent
Fre
edom
Step1:dem
ographiccharacteristics
AG
E2
1.40
12
0.09
32
0.09
42
0.21
9**
20.
174*
20.
108
20.
111
20.
153*
20.
034
20.
197*
*2
0.07
5E
DU
C1.
678
.260
***
0.13
00.
124
0.06
40.
069
0.22
3**
0.11
80.
197*
*0.
190*
*0.
214*
*
CA
RE
25.
690*
**2
0.37
2***
20.
434*
**2
0.22
0**
20.
354*
**2
0.42
4***
20.
378*
**2
0.34
7***
20.
334*
**2
0.38
0***
20.
310*
**
R2
0.23
90.
283
0.26
20.
156
0.20
10.
232
0.27
20.
206
0.18
90.
300
0.19
4A
dju
sted
R2
0.22
40.
269
0.26
80.
141
0.18
60.
217
0.25
80.
191
0.17
40.
287
0.17
9F
16.6
05**
*20
.992
***
18.7
85**
*9.
833*
**13
.346
***
15.9
94**
*19
.756
***
13.7
76**
*12
.360
***
22.7
04**
*12
.796
***
Step2:dem
ographicandwork-relatedcharacteristics
AG
E2
0.10
42
0.12
9*2
0.10
82
0.24
2***
20.
176*
20.
146*
20.
124
20.
174*
20.
066
20.
224*
**2
0.10
3E
DU
C0.
100
0.17
8**
0.08
80.
055
0.02
22
0.02
30.
159*
0.02
50.
119
0.10
30.
147*
CA
RE
20.
332*
**2
0.20
8**
20.
297*
**2
0.12
92
0.15
62
0.27
2***
20.
219*
*2
0.18
0*2
0.21
7*2
0.21
3**
20.
247*
*
UN
EM
PL
OY
20.
036
20.
087
20.
054
20.
197*
20.
116
20.
171*
20.
193*
20.
288*
**2
0.16
12
0.21
1**
20.
170*
NJO
BS
0.00
52
0.09
72
0.14
7*2
0.14
5*2
0.16
5*2
0.24
1***
20.
171*
20.
050
20.
238*
**2
0.14
2*2
0.18
4*
TE
NU
RE
20.
025
0.10
82
0.02
00.
124
20.
118
0.14
20.
010
0.10
60.
134
0.09
40.
162*
CH
JOB
S2
0.12
72
0.34
4***
20.
172*
20.
057
20.
159
20.
191*
20.
103
20.
174*
20.
115
20.
193*
20.
031
R2
0.25
60.
406
0.31
80.
225
0.29
20.
368
0.35
00.
325
0.39
60.
408
0.27
1A
dju
sted
R2
0.22
30.
379
0.28
80.
190.
260
0.33
90.
321
0.29
40.
264
0.38
10.
238
DR
20.
018
0.12
30.
056
0.06
90.
091
0.13
60.
078
0.11
90.
207
0.10
80.
077
Fch
ang
e0.
446
8.04
6***
3.21
8*3.
413*
4.94
3***
8.34
1***
4.67
8**
6.79
2***
5.85
6***
7.09
2***
4.08
7**
F7.
638*
**15
.154
***
10.3
39**
*6.
420*
**9.
112*
**12
.887
***
11.9
23**
*10
.646
***
9.29
1***
15.2
74**
*8.
246*
**
Notes:
* p#
0.05
;** p
#0.
01;*
**p#
0.00
1
Table V.Hierarchical regression
results for part-timefemale employees
Motivation ofworking women
15
significant regressions ranged from 15.6 to 30 per cent. The entry of the work-relatedcharacteristics (step 2) improved the R 2 for all of the motivation gaps. Specifically, thechange of R 2 ranged from 1.8 to 20.7 per cent and was statistically significant for all ofthe dependent variables apart from the gap with pay (F change ¼ 0.446, p . 0.05).Therefore, Tables IV and V provide support for H3. For part-time female salesemployees, the demographic and work-related characteristics of individuals have asignificant impact on the reported importance of work motivators and the expectationsof receiving these rewards. Specifically, for part-time employees it is evident that thedevelopment of motivation gaps has a strong and negative relationship with the age ofemployees. The greater the age of employees, the smaller the gap between theperceptions of an important reward and the expectation of receiving this reward.Furthermore, the findings reveal that part-time employees report smaller gaps inmotivation when they care for dependents, have experienced unemployment, havechanged several jobs in the last five years, and currently hold one regular job.
5. DiscussionThe aim of this paper was to compare the motivation of part-time and full-time femaleemployees in the Greek retail sector. Initially, we examined which work motivatorspart-time and full-time employees find important. We sought to answer the question ofwhether these groups of employees value things differently in their work environment.
Findings revealed that both part-timers and full-timers feel that the rewards of pay,friendliness of co-workers, and job security are the three most valuable motivators.These results are in accordance with the previous findings of Huddleston and Good(1999) and Linz (2002, 2004). In particular, these studies showed that both Russian andPolish employees report these motivators to be among the most valuable ones. Inaddition, we found that full-timers were more responsive to extrinsic rewards, whilepart-timers expressed a preference for intrinsic rewards. Specifically, full-timers valuedthe motivators of respect and friendliness of co-workers highest. On the other hand,part-time female salespeople expressed a preference for opportunities to learn newthings, develop skills, and feel a sense of accomplishment.
Furthermore, for both part-time and full-time employees we investigated theirexpectations of receiving the rewards that they find important in the workplace, askingwhether there are any differences in their expectations of rewards even when theyperform their jobs extremely well. Previous studies of motivation provided evidencethat there is a considerable gap between what employees perceive as important andwhat they expect to receive (Kalleberg, 1995; Huddleston and Good, 1999; Lam andZhang, 2003; Linz, 2004). In line with these past findings regarding different countries,we found that for both full-time and part-time Greek female employees there issignificant discrepancy between what employees desire and what they actually expectto receive in the workplace.
Nevertheless, contrary to our hypothesis, results indicated that part-timers are moreoptimistic about receiving intrinsic rewards. Part-timers indicated that they are morelikely to receive promotions, develop skills, learn new things, and feel a sense ofaccomplishment in the workplace. Manifestly, the literature review suggests thatemployers are not in fact likely to act in favour of part-timers. Therefore, we speculatethat female part-timers who are involuntary (could not find a full-time job) orpart-timers who try to balance work with family, education, or other personal
IJM31,1
16
obligations may feel that part-time work at that stage of their life-cycle is just atransient phase. In this phase, part-time employment is a means to develop skills, learnnew things, and perhaps be promoted to a full-time position. Indeed, Greek Law2639/1998 established that part-timers have priority in filling full-time openings thatoccur in their occupational categories. Given this regulation and taking into accountthe continued phenomenon of high unemployment in Greece, we suggest that part-timework may be regarded by some employees as a valuable opportunity to acquiringintrinsic rewards and as a “stepping stone” to better full-time jobs.
On the other hand, permanent full-time salespeople may have developed a morerealistic picture of the adversities of the labour market. Hence, compared withpart-timers, they express lower expectations of accomplishment and promotionalopportunities.
As a practical implication, these results provide retail firms with significantguidelines on how to develop a flexible motivational plan. Retail firms that seek toretain a highly satisfied and motivated workforce should provide incentives plans suchas commissions or bonuses, ensure job security, and foster a friendly climate amongco-workers.
Furthermore, since full-time and part-time workers value rewards differently, it issuggested that employers should provide a variety of rewards that fit the needs of bothfull-time and part-time employees. Because full-timers are more likely to be involved inthe functioning of the organisation, have greater tenure and spend more hours in thework environment (Wortuba, 1990; Sinclair et al., 1999), employers should pursue thedevelopment of a congenial working environment that promotes friendliness andmutual respect among co-workers.
On the other hand, with regard to part-timers, retail firms should make trainingprograms such as seminars and workshops available, with the aim of enhancing skillsand knowledge. The working environment would thereby support the development ofpart-time employees and would provide a “stepping stone” towards better jobpositions.
In addition, this study contributes new empirical evidence regarding how individualcharacteristics of employees may impact the reported importance of work motivatorsand the expectations of receiving these rewards. In other words, we have identifiedsubjective factors that influence whether salespeople perceive that they receive what isdesired and ranked important in the workplace.
For full-time employees, unmet expectations with regard to rewards are more likelyto develop when employees are young and have high educational qualifications. Thefindings may be viewed in light of the high unemployment rate in Greece (8.9 per cent),and in particular the high unemployment rate for females (13.6 per cent) compared tomales (5.6 per cent) in 2006 (National Statistical Service of Greece, 2007). It isspeculated that due to the lack of alternatives, young, female university graduates arecurrently compelled to accept employment in retail sales positions that arecharacterised by less competitive pay, low training, low job security, and a low levelof demarcation between jobs. Nevertheless, not surprisingly, they feel overqualifiedand disappointed about not making the best of their higher educational qualifications.
On the other hand, for part-time workers, the reported gaps in motivation decreasewhen employees experience personal and occupational hardships. In particular, femalepart-timers express limited unmet expectations with regard to rewards when they are
Motivation ofworking women
17
older, have the burden of care for dependants, and have faced an unstable employmentstatus characterised by periods of unemployment and frequent jobs changes. Wesuggest that these “life-stressed” employees have to make compromises and settle onthe employment options of the “secondary labour market”. Therefore, because of thisdisadvantaged position, they are more likely to express the opinion that they receivethe desired rewards through part-time employment in the retail sector. It is proposedthat female employees stressed by factors such as age (older employees), care (e.g.mothers), and poor employment background (i.e. unemployment and/or many changesof jobs) consider that part-time work is a source of learning and of developing skills aswell as of accomplishing something worthwhile. For these groups of employees, it maybe difficult to attend school or seminars or to find a full-time job. Therefore, they aremore likely to indicate that they receive the desired rewards, as these rewards arefulfilled through part-time employment.
The conclusion, that a variety of individual characteristics should be consideredwhen assessing the motivation of employees, can provide retail managers with aprofile of the motivated full-time and part-time female employees. In the context of thedemanding retail sector, this profile can be used in the recruiting process with the aimof identifying candidates that are most suitable for an available full-time or part-timeposition. Female employees with specific personal characteristics appear to balance theimportance of work motivators and their expectations of receiving rewards, while otheremployees develop greater unmet expectations.
In order to gain a more complete understanding of the motivation of retailemployees, future research should investigate the motivation of employees both bywork status and by gender. Comparisons between full-time and part-time and betweenfemale and male employees would provide a holistic picture of motivation in the retailsector. In addition, further qualitative research is needed to explore both employees’and employers’ attitudes and opinions, such as whether employers actually treat andreward full-timers and part-timers differently or whether employees hold differentpoints of view and frames of reference (Thorsteinson, 2003).
References
Barker, K. (1993), “Changing assumptions and contingent solutions: the costs and benefits ofwomen working full- and part-time”, Sex Roles, Vol. 28 Nos 1/2, pp. 47-71.
Bureau of Labor Statistics (2007), Labor Force Statistics from the Current Population Survey,US Department of Labor, Washington, DC.
Dickens, P. (1996), “Human services as service industries”, The Service Industry Journal, Vol. 16No. 1, pp. 82-91.
Eurostat (2007), Labour Force Survey Results, Statistical Office of the European Communities,Luxembourg.
Feldman, D.C. (1990), “Reconceptualizing the nature and consequences of part-time jobs”,The Academy of Management Review, Vol. 15 No. 1, pp. 103-12.
Fenton-O’Creevy, M. (1995), “Moderators of differences in job satisfaction between full-time andpart-time female employees: a research note”, Human Resource Management Journal,Vol. 5 No. 5, pp. 75-82.
Freathy, P. (1993), “Developments in the superstore labour market”, The Service IndustriesJournal, Vol. 13 No. 1, pp. 65-79.
IJM31,1
18
Harley, B. and Whitehouse, G. (2001), “Women in part-time work: a comparative study ofAustralia and the United Kingdom”, Labour and Industry, Vol. 12 No. 2, pp. 33-59.
Huddleston, P. and Good, L.K. (1999), “Job motivators in Russian and Polish retail firms”,International Journal of Retail & Distribution Management, Vol. 27 No. 9, pp. 383-92.
Jenkins, S. (2004), “Restructuring flexibility: case studies of part-time female workers in sixworkplaces”, Gender, Work and Organization, Vol. 11 No. 3, pp. 306-33.
Kalleberg, A.L. (1995), “Part-time work and workers in the United States: correlates and policyissues”, Washighton and Lee Law Review, Vol. 52 No. 3, pp. 771-98.
Lam, T. and Zhang, H.Q. (2003), “Job satisfaction and organizational commitment in the HongKong fast food industry”, International Journal of Contemporary Hospitality, Vol. 15 No. 4,pp. 214-20.
Lawler, E.E. (1973), Motivation in Work Organizations, Brooks Cole, Monterey, CA.
Linz, S.J. (2002), “Motivating Russian workers: analysis of age and gender differences”,William Davidson Institute working paper No. 466.
Linz, S.J. (2003), “Job satisfaction among Russian workers”, International Journal of Manpower,Vol. 24 No. 6, pp. 626-52.
Linz, S.J. (2004), “Motivating Russian workers: analysis of age and gender differences”, Journal ofSocio-Economics, Vol. 33 No. 3, pp. 261-89.
Locke, E.A. (1976), “The nature and causes of job satisfaction”, in Dunnette, M.D. (Ed.),Handbook of Industrial and Organizational Psychology, Rand McNally, Chicago, IL,pp. 1297-349.
Logan, N., O’Reilly, C.A. III and Roberts, K.H. (1973), “Job satisfaction among part-time andfull-time employees”, Journal of Vocational Behavior, Vol. 3 No. 1, pp. 33-41.
Martin, J.E. and Sinclair, R.R. (2007), “A typology of the part-time workforce: differences on jobattitudes and turnover”, Journal of Occupational and Organizational Psychology, Vol. 80No. 2, pp. 301-19.
Mathieu, J.E. and Zajac, D.M. (1990), “A review of the meta-analysis of the antecedents,correlates, and consequences of organizational commitment”, Psychological Bulletin,Vol. 108 No. 2, pp. 171-94.
Maynard, D., Thorsteinson, T.J. and Parfyonova, N.M. (2006), “Reasons for working part-time:subgroup differences in job attitudes and turnover intentions”, Career DevelopmentInternational, Vol. 11 No. 2, pp. 145-62.
Miles, J. and Shelvin, M. (2001), Applying Regression and Correlation, Sage Publications, London.
Mitchell, T.R. (1982), “Motivation: new directions for theory, research, and practice”,The Academy of Management Review, Vol. 7 No. 1, pp. 80-8.
National Statistical Service of Greece (2007), “Labour force survey”, press release (ESYE):Athens (in Greek).
Oldham, G.R. (1976), “Job characteristics and internal motivation: the moderating effect ofinterpersonal and individual variables”, Human Relations, Vol. 29 No. 6, pp. 559-69.
Parsons, E. and Broadbridge, A. (2006), “Job motivation and satisfaction: unpacking the keyfactors for charity shop managers”, Journal of Retailing and Consumer Services, Vol. 13No. 2, pp. 121-31.
Shockey, L.M. and Mueller, W.C. (1994), “At-entry differences in part-time and full-timeemployees”, Journal of Business and Psychology, Vol. 8 No. 3, pp. 355-64.
Motivation ofworking women
19
Silverthorne, C.P. (1992), “Work motivation in the United States, Russia, and the Republic ofChina (Taiwan): a comparison”, Journal of Applied Social Psychology, Vol. 22 No. 20,pp. 1631-9.
Sinclair, R.R., Martin, E.J. and Michel, R.P. (1999), “Full-time and part-time subgroup differencesin job attitudes and demographic characteristics”, Journal of Vocational Behavior, Vol. 55No. 3, pp. 337-57.
Thorsteinson, J.T. (2003), “Job attitudes of part-time vs full-time workers: a meta-analyticreview”, Journal of Occupational and Organizational Psychology, Vol. 76 No. 2, pp. 151-77.
Tilly, C. (1992), “Dualism in part-time employment”, Industrial Relations, Vol. 31 No. 2, pp. 330-47.
Tomlinson, J. (2006), “Part-time occupational mobility in the service industries: regulation, workcommitment and occupational closure”, The Sociological Review, Vol. 54 No. 1, pp. 66-86.
Urbanski, T. (2007), Main Features of the Services Sector, Eurostat, Statistics in Focus.
Vroom, V. (1964), Work and Motivation, John Wiley & Sons, New York, NY.
Walsh, J. (2007), “Experiencing part-time work: temporal tensions, social relations and thework-family interface”, British Journal of Industrial Relations, Vol. 45 No. 1, pp. 155-77.
Wortuba, T.R. (1990), “Full-time vs part-time salespeople: a comparison on job satisfaction,performance, and turnover in direct selling”, International Journal of Research inMarketing, Vol. 7 No. 2, pp. 97-108.
About the authorsStefanos K. Giannikis is a PhD candidate in the Department of Business Administration,University of Macedonia, Thessaloniki, Greece. He received a bachelor’s degree in Economicsfrom Aristotle University, Thessaloniki, Greece. He holds an MSc in Marketing from theUniversity of Birmingham, UK and an MBA in Human Resource Management from theUniversity of Macedonia. His current research interests include flexible work arrangements,part-time work, gender issues and employee attitudes.
Dimitrios M. Mihail is Professor and the Head of the MBA program at the University ofMacedonia, Greece. He holds a PhD in Economics. Department of Economics, The GraduateFaculty, New School for Social Research, New York, USA. His current research focuses on labourmarket flexibility, career development and student and women employment issues. DimitriosMihail is the corresponding author and can be contacted at: [email protected]
IJM31,1
20
To purchase reprints of this article please e-mail: [email protected] visit our web site for further details: www.emeraldinsight.com/reprints