Embed Size (px)
Citation preview

Journal of Travel Research50(6) 669 –684© 2011 SAGE PublicationsReprints and permission: sagepub.com/journalsPermissions.navDOI: 10.1177/0047287510382298http://jtr.sagepub.com
Motivations and Normative Evaluations of Summer Visitors at an Alpine Ski Area
Mark D. Needham1, Rick B. Rollins2, Robyn L. Ceurvorst1, Colin J. B. Wood3, Kerry E. Grimm1, and Philip Dearden3
Abstract
This article examines motivations of people visiting an alpine ski area in the summer season and their norms regarding acceptable and unacceptable trail conditions and densities of use at this area. Data were obtained from on-site surveys of summer visitors (n = 422) at the Whistler Mountain ski area in British Columbia, Canada. Cluster analysis of several reasons for visiting revealed three groups ranging from a group who rated all motivation factors as most important to a group who only considered the alpine scenery as important. Norms were measured using evaluations of photographs depicting increasing trail widths and densities of sightseers/hikers and mountain bikers. Compared to the other two groups, the group who only considered the scenery important had lower normative acceptance of increasing densities of use and wider trails and had more norm crystallization or consensus about acceptable and unacceptable conditions. Research and management implications are discussed.
Keywords
motivations, norms, indicators, standards of quality, ski areas
Introduction
Mountain resorts such as Aspen in Colorado, Park City in Utah, and Whistler in British Columbia are premier destina-tions for tourists who travel to these areas from around the world (Godde, Price, and Zimmermann 2000). Activities and impacts related to this tourism use have received consider-able research attention (e.g., Gill 2000; Gill and Williams 1994; Ormiston, Gilbert, and Manning 1998). Alpine ski areas such as Aspen Highlands in Colorado and Whistler/Blackcomb in British Columbia are focal points at many of these resorts, and activities such as skiing and snowboarding have dominated these ski areas for many years. Research has examined issues such as activity conflict and visitor demo-graphics and motivations associated with this winter use at alpine ski areas (e.g., Alexandris, Kouthouris, and Girgolas 2007; Holden 1999; Hudson and Shephard 1998; Klenosky, Gengler, and Mulvey 1993; Thapa and Graefe 2003; Vaske et al. 2000; Vaske, Dyar, and Timmons 2004; Williams, Dossa, and Fulton 1994). Comparatively little research, however, has focused on tourism at ski areas during the sum-mer season.
Many ski areas have diversified operations by expanding from single-season businesses managed primarily for skiing and snowboarding to multiple-season destinations. The popularity of operating chairlifts in the summer months to
accommodate activities such as hiking and mountain biking is growing. In British Columbia, for example, 12% of the ski areas had chairlifts operating in the summer of 1991. A decade later, summer chairlift operations occurred at 65% of these areas (British Columbia Assets and Land Corporation 2000). Most major ski areas now have at least one chairlift operat-ing in the summer, with mountains such as Mammoth in California, Mt. Bachelor in Oregon, and Whistler in British Columbia receiving up to 250,000 visitors every summer (NSAA-RRC 2009). Studies have examined biophysical or resource impacts such as trail erosion and vegetation tram-pling from summer use at ski areas (Good and Grenier 1994; Wood 1987). Pickering and Buckley (2003) and Saremba and Gill (1991) discussed activities and possible social impacts (e.g., crowding) related to summer use at these areas, but their discussions were not based on empirical data (e.g., sur-veys). Social aspects of summer use at ski areas, therefore, have received little empirical attention.
1Oregon State University, Corvallis2Vancouver Island University, Nanaimo, British Columbia, Canada3University of Victoria, British Columbia, Canada
Corresponding Author:Mark D. Needham, Department of Forest Ecosystems and Society, Oregon State University, Corvallis, OR 97331Email: [email protected]
at COLORADO STATE UNIV LIBRARIES on November 7, 2011jtr.sagepub.comDownloaded from
670 Journal of Travel Research 50(6)
The increasing number of people visiting ski areas in the summer has generated some concerns about the ability of these areas to sustain acceptable levels of social and resource conditions and impacts in the summer (e.g., crowding, trail erosion; Good and Grenier 1994; Pickering and Buckley 2003; Wood 1987). Assessing impacts from visitation is an important line of research that continues to receive consider-able attention in the tourism literature (e.g., Gill 2000; Gill and Williams 1994; Godde, Price, and Zimmermann 2000; Jafari 2003; Ormiston, Gilbert, and Manning 1998). This research has shown that visitors to areas such as destination resorts can differ in their acceptance of conditions based on characteristics such as skill, activity participation, and demo-graphics, and it is likely that motivations for visiting also influence acceptance (Manning 1999; Needham and Rollins 2009). Visitors seeking solitude, for example, may not tol-erate high use levels, and those wanting pristine natural settings may not accept seeing litter or trail erosion. Under-standing motivations of summer visitors at ski areas and identifying their acceptance of conditions at these areas can allow managers to identify market segments of clients and tailor opportunities and setting characteristics that match motivations. This article groups summer visitors at an alpine ski area based on their motivations and examines differences among these groups in their acceptance of conditions and impacts at this area.
Conceptual BackgroundNormative Evaluations
Managers of nature-based tourism settings are often inter-ested in visitor evaluations of social, resource, and manage-rial conditions, and these evaluations can occur before, during, and after on-site experiences (Manning 1999; Needham and Rollins 2009). A predictive evaluation can occur before the experience, such as considering a site to be overcrowded based on use levels encountered during a previous visit. Evaluations also occur during or after an on-site experience, such as considering the amount of litter at a site to be unac-ceptable based on conditions encountered during that visit. The concept of norms has received considerable attention as one approach for measuring evaluations, such as acceptance of conditions (see Manning 1999, 2007; Shelby, Vaske, and Donnelly 1996 for reviews). One line of research defines norms as standards that individuals use for evaluating envi-ronments, activities, conditions, or management strategies as good or bad, better or worse (Donnelly et al. 2000; Shelby, Vaske, and Donnelly 1996). Normative evaluations are typi-cally informed and shaped by on-site experiences (Manning 1999). Norms differ from other evaluative concepts such as perceived crowding by clarifying what people believe condi-tions or behavior should or should not be, whereas crowding is a negative evaluation that the number of encounters with
individuals in an area is already too many (Vaske, Donnelly, and Petruzzi 1996). Understanding perceptions of crowding may not reveal acceptable and unacceptable use levels or how conditions should be managed and monitored. Norms offer a theoretical and applied basis for addressing these issues (Vaske and Whittaker 2004).
Norm theory has provided a basis for measuring indica-tors and formulating standards of quality (Manning 1999, 2007). Indicators (e.g., encounters) are social, resource, or managerial variables defining the quality of settings and experiences (Manning et al. 2002). Indicators are measured to reveal standards of quality (e.g., acceptable to see fewer than 25 people at a time) or thresholds at which indicator conditions become unacceptable (Manning 2007). Indica-tors should be monitored to ensure that standards are main-tained, and management action may be required if standards are violated. Indicators and standards are central to contem-porary planning and management frameworks such as Limits of Acceptable Change (Stankey et al. 1985), Visitor Experience and Resource Protection (Manning 2001), and the Tourism Optimization Management Model (Manidis Roberts Consulting 1997).
A simplified example may help to illustrate. The provi-sion of opportunities for visitor solitude is a management goal in some nature-based tourism settings (Manning 1999; Needham and Rollins 2009). This goal, however, may be too general to guide management since it does not specify what constitutes solitude and how it should be measured. Indica-tors and standards of quality may help to resolve these issues. Surveys or interviews with visitors may show that the num-ber of encounters with other people is an important aspect of solitude, suggesting that it may be one social indicator of solitude. Normative research may reveal that once most visi-tors encounter 10 or more people in a specific area, they feel crowded and do not achieve an acceptable level of solitude. This suggests that encounters with 10 or more people may represent an appropriate standard of quality for managing the area (Ormiston, Gilbert, and Manning 1998).
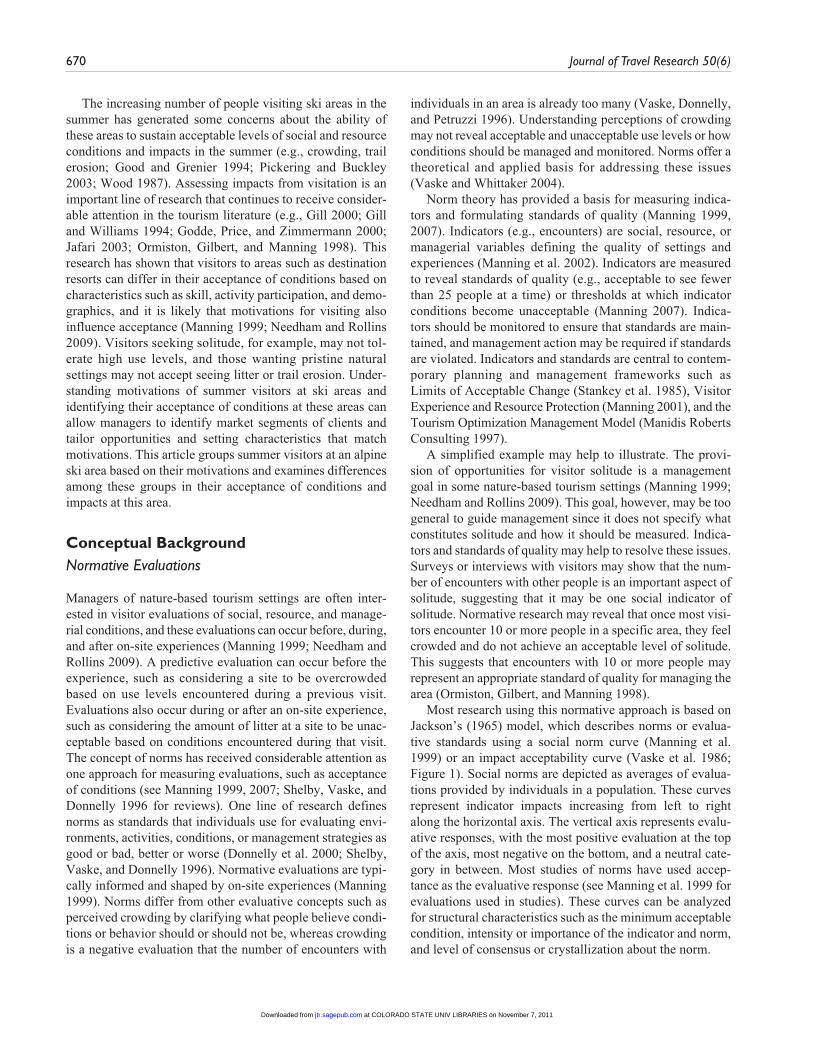
Most research using this normative approach is based on Jackson’s (1965) model, which describes norms or evalua-tive standards using a social norm curve (Manning et al. 1999) or an impact acceptability curve (Vaske et al. 1986; Figure 1). Social norms are depicted as averages of evalua-tions provided by individuals in a population. These curves represent indicator impacts increasing from left to right along the horizontal axis. The vertical axis represents evalu-ative responses, with the most positive evaluation at the top of the axis, most negative on the bottom, and a neutral cate-gory in between. Most studies of norms have used accep-tance as the evaluative response (see Manning et al. 1999 for evaluations used in studies). These curves can be analyzed for structural characteristics such as the minimum acceptable condition, intensity or importance of the indicator and norm, and level of consensus or crystallization about the norm.
at COLORADO STATE UNIV LIBRARIES on November 7, 2011jtr.sagepub.comDownloaded from

Needham et al. 671
The minimum acceptable condition is the point where the norm curve crosses the neutral line and indicator impacts become unacceptable. In many studies, this is considered the standard of quality for the measured indicator (see Manning 2007; Shelby, Vaske, and Donnelly 1996; Vaske, Donnelly, and Shelby 1993 for reviews). Norm intensity or salience is the importance of the indicator to respondents and is the relative distance from the neutral line at each point on the curve, independent of the number and direction of evalua-tions (e.g., acceptable, unacceptable). Intensity is often measured as the sum of these distances across all points on the curve (Vaske et al. 1986). The greater the cumulative distance from the neutral line, the higher the norm intensity and more important the indicator is to respondents. A flat curve close to the neutral line suggests that the indicator is not important and few people will be upset if a standard is vio-lated, whereas a curve that declines sharply and remains negative implies that the indicator is important and more people may be affected (Freimund et al. 2002). Norm crys-tallization measures consensus among respondents for indi-cator impacts. This measure of normative agreement is often presented as the average of the standard deviations for eval-uations of points comprising the curve (i.e., interval around the mean containing the majority or 68% of responses; Ormiston, Gilbert, and Manning 1998). If crystallization is high (i.e., small standard deviations), managers may have more confidence in using normative data to formulate stan-dards of quality (Manning 1999).
The normative approach has been applied widely in tour-ism and related research (see Donnelly et al. 2000; Manning 1999, 2007; Needham and Rollins 2009; Shelby, Vaske, and Donnelly 1996; Vaske et al. 1986; Vaske, Donnelly, and Shelby 1993 for reviews). The approach has been used most often to measure social indicators such as encounter norms or the maximum number of people in a given activity or area that visitors will accept seeing (Manning 2007). Norms have also been used to examine resource or biophysical indicators such as the amount of bare ground and fire rings at campsites (Kim and Shelby 1998; Needham and Rollins 2005; Shelby, Vaske, and Harris 1988), and trail erosion and social or infor-mal trails in wilderness areas (Manning et al. 2002, 2004).
Most studies have been conducted in public parks and related areas in the United States, but some have occurred in Canada (Freimund et al. 2002; Vaske, Donnelly, and Petruzzi 1996) and other countries (Inglis, Johnson, and Ponte 1999; Kim and Shelby 1998). Comparatively few studies, however, have applied the normative approach to examine impacts at commercial tourism and related destination sites, such as alpine ski areas (Ormiston, Gilbert, and Manning 1998). This article addresses this issue by examining norms of summer visitors regarding trail conditions and use densities at a ski area in Canada.
Research has predominantly examined norms of people engaging in different activities (e.g., anglers, kayakers) or at different locations (e.g., backcountry, frontcountry; Manning 2007; Shelby, Vaske, and Donnelly 1996). Fewer studies have examined differences in norms among groups in the same activity (Wellman, Roggenbuck, and Smith 1982; Young, Williams, and Roggenbuck 1991). Efforts to group visitors in the same activity into homogeneous subgroups based on their motivations for visiting an area are common (e.g., Beh and Bruyere 2007; Hvenegaard and Dearden 1998; Manfredo and Larson 1993), but the specific influence of these motivations on normative evaluations has received comparatively little empirical attention. This article addresses this knowledge gap by examining the influence of visitor motivations on normative acceptance of summer conditions and impacts at an alpine ski area.
MotivationsGiven the diversity among participants in an activity or visi-tors to an area, researchers have emphasized the importance of using data collected to differentiate users into meaningful homogeneous subgroups during data analysis (Manfredo and Larson 1993; Vaske et al. 1996). Past research has grouped visitors based on characteristics such as gender, age, residency, and activity skill level (see Manning 1999; Needham and Rollins 2009 for reviews). Visitors have also been grouped based on their motivations for participating in an activity or visiting a location. Tourism and related motivations have been defined as internal or external reasons for visiting an area or participating in an activity at a given time (Dann 1981; Iso-Ahola 1999; Manfredo, Driver, and Tarrant 1996; Mannell and Kleiber 1997; Needham and Rollins 2009).
Approaches for measuring motivations have been mixed (Iso-Ahola 1999). The recreation experience preference (REP) scales, for example, contain more than 300 motivations that have been reduced to 19 domains such as exploration, nature experience, being with similar people, exercise, exhilaration, and escaping physical stressors (Manfredo, Driver, and Tarrant 1996). Similarly, the paragraphs about leisure (PAL) scales include 44 psychological motivations that have been categorized into eight dimensions (e.g., self-expression, soli-tude, companionship; Driver, Tinsley, and Manfredo 1991).
–2
–1
0
1
2
0 2 4 6 8 10 12 14 16 18 20
Number of People Encountered Along Trail Per Day
Minimum Acceptable Condition
Nor
m In
tens
ity
Crystallization (Level of AgreementDefined by Dispersion Around PointsDefining the Norm Curve)
VeryAcceptable
VeryUnacceptable
Figure 1. Hypothetical social norm curveSource: Modified from Manning et al. (1999).
at COLORADO STATE UNIV LIBRARIES on November 7, 2011jtr.sagepub.comDownloaded from

672 Journal of Travel Research 50(6)
Both the REP and PAL scales emphasize outcomes that grat-ify internal motivations. Iso-Ahola (1982, 1999) proposed that participation and visitation are based on both seeking (i.e., approach) and escaping (i.e., avoidance) motivations. Activities or locations provide opportunities for not only escaping daily routines and stress but also to search for per-sonal (e.g., challenge, learning) and interpersonal (e.g., social contacts) benefits. In addition to these internal or “push” motivations, others have noted the importance of external or “pull” factors in that visitors are not only pushed by internal motivations such as stress relief and challenge but are also pulled to a particular activity or destination because of its attributes, such as ease of access, activities offered, reputa-tion, and scenery (e.g., Dann 1981; Driver and Knopf 1977; Klenosky 2002; Mannell and Kleiber 1997; Uysal and Jurowski 1994). Motivations that pull visitors to an area tend to be related to features of the destination, whereas push fac-tors tend to be internal cognitions that can be independent from such features (Dann 1981).
Motivations have been examined relative to many activi-ties and settings (see Iso-Ahola 1980; Jafari 2003; Manning 1999; Needham and Rollins 2009; Pearce 1993 for reviews). Some research has examined motivations of ski area visitors. Studies of skiers and snowboarders, for example, have found that push motivations for visiting these areas in the winter include excitement and thrill seeking, exercise, demon-strating abilities, relaxation, and achievement (Holden 1999; Klenosky, Gengler, and Mulvey 1993; Williams, Dossa, and Fulton 1994). Research has also documented attributes that pull winter visitors to these areas, including terrain, snow con-ditions, number of runs, lift ticket prices, proximity, lodging, and resort services (Alexandris, Kouthouris, and Girgolas 2007; Hudson and Shephard 1998; Klenosky, Gengler, and Mulvey 1993; Mills, Couturier, and Snepenger 1986; Richards 1996; Williams, Dossa, and Fulton 1994). Little is known, however, about what motivates individuals to visit ski areas in the summer season and their normative acceptance of sum-mer conditions and impacts at these areas.
Some research has shown that motivations influence perceptions and experiences. Studies have documented, for example, that visitors motivated to “get away from other peo-ple” or “experience solitude or quietude” have reported higher perceptions of crowding (Absher and Lee 1981; Ditton, Fedler, and Graefe 1983; Shelby 1980). A few studies are also suggestive of relationships between motivations and normative evaluations. Graefe et al. (1981) and Schreyer and Roggenbuck (1978), for example, found that motivations of river users were related to preferences for encounters and campsite development, although relationships were not strong. These studies, however, did not directly measure norms for social or resource indicators. Understanding visitor motiva-tions and their influence on normative acceptance of setting and experiential conditions is important because this can provide a more comprehensive understanding of the types of
visitor subgroups in an area, and can help managers tailor setting characteristics and opportunities that correspond with visitor motivations (Manning 1999, 2007).
Research QuestionsThis article is exploratory in nature and examines motiva-tions of summer visitors and their normative evaluations of social and resource indicator conditions and impacts at the Whistler Mountain ski area in British Columbia, Canada. Three research questions are explored. First, what motivates individuals to visit this ski area in the summer and can visi-tors be statistically grouped according to these motivations? Second, what are visitor norms (i.e., minimum acceptable condition, intensity/salience, crystallization) regarding accept-able trail conditions and densities of sightseers/hikers and mountain bikers at this area? Third, to what extent do these normative evaluations differ based on motivations for visit-ing this ski area in the summer?
MethodStudy Site
Data for this article were drawn from a larger study designed to develop a baseline understanding of summer use at the Whistler Mountain ski area. This area is located 120 km (75 miles) north of Vancouver and is part of the Resort Municipality of Whistler in southwest British Columbia, Canada. This area is most recently known for hosting events in the 2010 Olympic Winter Games. The ski area contains 20 chairlifts, but the Whistler Village Gondola is the main lift used in the summer for shuttling visitors from Whistler Vil-lage (elevation: 652 m, 2140 ft) to the Roundhouse lodge and restaurant area near the top of the mountain (1809 m, 6030 ft). Whistler Mountain is a focal point in one of the premier alpine resorts in the world and is a popular destination, as this ski area attracts more than one million skiers and snowboard-ers from around the world each winter, and summer visitation (July-October) has increased from 183,700 visitors in 2000 to approximately 250,000 visitors in more recent years (Needham and Rollins 2009; NSAA-RRC 2009).
Data CollectionAfter two pilot tests, a 10-page, 37-question survey was con-ducted on-site (i.e., face to face) with visitors on Whistler Mountain from July 1 to September 4, 2000. It was not fea-sible or necessary to survey every visitor, so individuals were selected through a systematic random sampling proce-dure to reduce selection bias (i.e., one random person from every nth group; Vaske 2008). Incentives were not used to recruit participants prior to survey completion. The survey addressed several topics and concepts, including motivations
at COLORADO STATE UNIV LIBRARIES on November 7, 2011jtr.sagepub.comDownloaded from

Needham et al. 673
for visiting, normative evaluations of conditions, attitudes toward management strategies, satisfaction, conflict among groups, frequency of visitation, and activity and sociodemo-graphic characteristics. The two pilot tests were used to elu-cidate potential survey administration and design concerns before main data collection. As a result, a few questions and response items were redesigned or eliminated, but items ana-lyzed in this article did not require changes as a result of these pilot tests. This article focuses on summer sightseers/day hikers visiting the Roundhouse lodge and immediately surrounding areas on the mountain. This was the largest user group at this ski area in the summer of 2000. In total, 477 sightseers/day hikers were contacted and 422 surveys were completed on-site by these visitors. Accounting for all refusals (n = 55), the final response rate was 88.5%.
Analysis VariablesIn this article, visitors’ motivations were the independent variables and their normative evaluations were the depen-dent variables.1 Multiple survey items were used to measure these motivations in the survey, which included a list of
potential push and pull reasons for visiting this alpine ski area in the summer. Motivation items included in the sur-vey were informed by items used in previous research (e.g., Alexandris, Kouthouris, and Girgolas 2007; Klenosky, Gengler, and Mulvey 1993; Williams, Dossa, and Fulton 1994) and meetings with ski area managers and other interest groups (Needham and Rollins 2005). Respondents were asked to rate the importance of each reason in influencing their decision to visit. These motivations are listed in Table 1 and were measured on the same 4-point scales of 1 not at all important to 4 extremely important used in previous studies (e.g., Manfredo, Driver, and Tarrant 1996).
The dependent variables were visitor norms regarding trail conditions and densities of sightseers/hikers and moun-tain bikers. Image capture technology (ICT) was used to measure these indicators. ICT involves using computer software to manipulate and create visuals and has become popular for depicting impacts and conditions for social (e.g., encounters, crowding) and resource (e.g., bare ground at campsites, trail conditions) indicators in tourism and related outdoor settings (see Manning 2007; Manning and Freimund 2004 for reviews). Respondents rate their acceptance of
Table 1. Exploratory Factor Analysis of Tourist Motivations for Visiting Whistler Mountain in the Summer
Factor Loadingsa
Motivation Items
Factor 1: Amenities/Tours
Offered
Factor 2: Experience
Scenery
Factor 3: Advertising/Reputation
Factor 4: Ease of Alpine
Access
To participate in a group nature or activity tour .74To attend a meeting or conference on the mountain .74To visit the alpine tubing or beginner skiing areas .73To participate in a special event (e.g., wedding, birthday) .71To access the helicopter tours .67To view the natural landscape .85To experience the beauty of an alpine area .81To view wildflowers or alpine meadows .78To view wildlife/animals .65Because I was told by someone that this is a nice alpine area
to visit .73
Because of Whistler Mountain’s reputation as a world-renowned destination
.73
Because of Whistler Mountain’s reputation for summer activities offered
.69
Because I saw an advertisement or article about summer on this mountain
.60
Because of the ease of access to the alpine on the gondola/chairlifts
.84
Because of the gondola/chairlift’s close proximity to Whistler Village
.73
To experience a gondola/chairlift ride .68Eigenvalue 2.74 2.40 2.21 2.01Percentage (%) of total variance explained 17.12 15.19 13.81 12.54Cumulative percentage (%) of variance 17.12 32.31 46.12 58.66
a. Principal components factor analysis with Varimax rotation. Only factors with eigenvalues >1 and items with factor loadings >.40 were retained in the final factor structure (Tabachnick and Fidell 1996). Items coded on 4-point scales of 1 = not at all important to 4 = extremely important.
at COLORADO STATE UNIV LIBRARIES on November 7, 2011jtr.sagepub.comDownloaded from

674 Journal of Travel Research 50(6)
several photographs depicting impacts to the indicator of concern (e.g., use density, trail width) varied from low to high. Plotting these normative acceptance evaluations on social norm curves provides a mechanism for devising stan-dards of quality (Manning 1999).
Compared with alternatives where respondents rate their acceptance of written descriptions of indicator conditions, visuals provide a cognitively easier and more realistic assess-ment of impacts because they allow respondents to see what conditions would be like. This is especially important in high-use frontcountry areas such as ski areas where it may be unrealistic to expect respondents to ascertain from a set of written numbers what conditions would look like and if they would be acceptable (e.g., use levels, trail width). There are, however, disadvantages of the visual approach. Evaluating several visuals, for example, can be time con-suming and increase respondent burden. In addition, images depict “snapshots” of conditions at one moment in time, so indicators such as noise or time in sight of others throughout the day may be difficult to measure with visuals (see Freimund et al. 2002; Hall and Roggenbuck 2002; Manning and Freimund 2004; Manning et al. 1999, 2002 for advantages and disadvantages of using visuals).
To measure norms in this study, the density of sightseers/hikers social indicator was measured with five photographs depicting 0 to 16 people per 20 m2 (65 ft2), with the number of people doubling in each image (0, 2, 4, 8, 16 people/20 m2; Figure 2). Density of mountain bikers was portrayed with five photographs of 0 to 8 riders per 15 m × 2 m (50 ft × 6.5 ft) section of trail (SOT), with the number increasing by 2 in each image (0, 2, 4, 6, 8 riders/15 m × 2 m SOT; Figure 3). The trail width resource indicator was measured with three images of typical trails 1, 3, and 7 m in width (3, 10, and 23 ft; Figure 4). For density of sightseers/hikers, the image of 16 people/20 m2 was created first and people were randomly
removed to create four other visuals of use densities. Using Adobe Photoshop, people were randomly positioned, but their age, gender, number walking in different directions, and number in the foreground and background was balanced. In addition, people were placed on trails, not alpine vegetation. The density scale for the visuals was measured in the field at approximately 20 m2. For the density of mountain bikers social indicator, the image of 8 riders was created first and riders were randomly removed to produce four more visuals of use density. Riders were placed on a trail in linear fashion to reflect their movement pattern given the narrow and descending nature of mountain bike trails in the area. The density scale for the trail section on which the riders were placed in the visuals was measured in the field at 15 m long and 2 m wide. Photo-graphs for the trail width resource indicator were created by taking the first image (1-m-wide trail) and then overlaying resized trails from other photographs onto the initial image to portray 3 and 7 m trail widths.
The color photographs were printed in 20 cm × 15 cm (8 in. × 6 in.) size and shown to respondents in cue-card fash-ion one at a time. Unlike approaches where all images are embedded in a survey and visible for all evaluations, the cue-card approach helps to maximize the potential that each pho-tograph is evaluated independently (Needham and Rollins 2005). In the pilot tests, these photographs were presented in random order (e.g., 4, 16, 0, 8, 2 people/20 m2), chronological/increasing in impact (e.g., 0, 2, 4, 8, 16 people/20 m2), and decreasing order (e.g., 16, 8, 4, 2, 0 people/20 m2) to check for starting point bias (i.e., order effects). No significant dif-ferences were found (sightseer/hiker visuals: Kruskal-Wallis H = 0.01 to 0.99, p = .611 to .992; biker visuals: H = 0.62 to 4.10, p = .133 to .741; trail-width visuals: H = 0.12 to 2.32, p = .312 to .869), so visuals were shown in chronological order during data collection. These results are similar to those in other studies (e.g., Manning et al. 2002; Manning 2007),
Figure 2. Sample photographs depicting density of sightseers/hikers indicator
at COLORADO STATE UNIV LIBRARIES on November 7, 2011jtr.sagepub.comDownloaded from

Needham et al. 675
suggesting that starting point bias may not be a major concern when using visuals to measure visitor norms.
Visitors were told to ignore the generic backgrounds, focus on conditions in each visual, and assume that they were consistently occurring at this ski area in the summer. Respondents then rated conditions in each photograph on recoded 5-point scales of –2 very unacceptable to +2 very acceptable. On-site debriefing sessions with respondents during the pilot tests suggested that they had no difficulty following these guidelines and were able to evaluate each photograph independently of the others, and the photographs collectively addressed a range of potential impacts for each indicator. In addition, these visual approaches used in this study to measure visitor norms are virtually identical to those used in numerous other studies that have rigorously tested validity and reliability of visual methods for measuring nor-mative evaluations of indicator conditions (see Basman et al. 1996; Freimund et al. 2002; Hall and Roggenbuck 2002;
Manning 2007; Manning and Freimund 2004; Manning et al. 1999, 2002 for reviews).
ResultsVisitor Profile
Most respondents (65%) were traveling up Whistler Moun-tain for the first time in a summer season. Only 8% of respon-dents were permanent residents of the Whistler, British Columbia area and less than 15% owned property or a time-share in this area. The largest proportions of respondents were tourists visiting the Whistler Mountain ski area from other areas of the province of British Columbia (34%), the United States (30%), European countries (13%), and other Canadian provinces (10%). Taken together, these results show that almost all respondents were tourists traveling at least 120 km (75 miles) to visit Whistler Mountain. In total,
Figure 3. Sample photographs depicting density of mountain bikers indicator
Figure 4. Sample photographs depicting trail width indicator
at COLORADO STATE UNIV LIBRARIES on November 7, 2011jtr.sagepub.comDownloaded from

676 Journal of Travel Research 50(6)
51% of respondents were female and 49% were male, with more than half of these visitors (51%) between 20 and 40 years of age (M = 35 years).
MotivationsA principal components exploratory factor analysis with vari-max rotation was conducted on the motivation variables to reduce them into broader reasons for visiting this ski area in the summer. Membership of individual variables in a factor is based on factor loadings of each variable, and these loadings should generally be greater than or equal to .40 and eigenval-ues should be higher than 1.0 (Tabachnick and Fidell 1996). This analysis grouped the motivation variables into four fac-tors and all loadings exceeded .60 (Table 1). Factor 1 con-tained five variables (e.g., to access helicopter tours on the mountain, to participate in a group nature or activity tour); factor 2 included four variables (e.g., to view the natural land-scape, to experience the beauty of an alpine area); factor 3 consisted of four variables (e.g., because I was told by some-one that this is a nice alpine area to visit, because of Whistler Mountain’s reputation as a world-renowned destination); and factor 4 contained three variables (e.g., because the ease of alpine access on the gondola/chairlift, to experience a gondola/chairlift ride). These motivating factors were labeled “amenities and tours offered” (factor 1), “experiencing scen-ery” (factor 2), “advertising and reputation” (factor 3), and
“ease of alpine access” (factor 4). Taken together, these vari-ables and factors explained 59% of the variance in motiva-tions of summer visitors.
Measurement reliability and internal consistency of these four factors was examined with Cronbach’s alpha reliability coefficients. Reliability refers to the consistency of responses to a set of variables that are designed and intended to mea-sure a given unobserved concept or factor (Vaske 2008). An alpha greater than or equal to .65 indicates that variables are measuring the same factor and justifies combining them into an index (Nunnally and Bernstein 1994; Vaske 2008). Reli-ability coefficients indicated acceptable internal consistency for each factor: .78 for amenities and tours offered, .74 for experiencing scenery, .71 for advertising and reputation, and .72 for ease of alpine access (Table 2). Deletion of any vari-able from its respective factor did not improve reliability. Mean responses to variables in each factor showed that moti-vations related to scenery and landscape (factor 2) were most important in influencing people to visit this ski area in the summer (M = 2.86 to 3.73), whereas those related to ameni-ties and tours (factor 1) were least important (M = 1.08 to 1.17; Table 2). Advertising and reputation (factor 3) and ease of alpine access (factor 4) were, on average, slightly to mod-erately important (M = 1.44 to 2.86). Given their high reli-ability, the individual motivation variables were combined and computed into mean composite indices for each of the four factors (Vaske 2008).
Table 2. Reliability Analysis of Factors Motivating Tourists to Visit Whistler Mountain in the Summer
Motivation Factors and Itemsa M SDItem–Total Correlation a If Deleted Cronbach’s a
Factor 1: Amenities/tours offered .78 To participate in a group nature or activity tour 1.17 .53 .59 .73 To attend a meeting or conference on the mountain 1.08 .41 .55 .74 To visit the alpine tubing or beginner skiing areas 1.12 .44 .58 .73 To participate in a special event (e.g., wedding, birthday) 1.14 .46 .52 .75 To access the helicopter tours 1.11 .42 .53 .74Factor 2: Experience scenery .74 To view the natural landscape 3.68 .57 .59 .68 To experience the beauty of an alpine area 3.73 .51 .53 .71 To view wildflowers or alpine meadows 3.15 .93 .65 .62 To view wildlife/animals 2.86 .97 .53 .71Factor 3: Advertising/reputation .71 Because I was told by someone that this is a nice alpine area to visit 2.00 1.09 .44 .69 Because of Whistler Mountain’s reputation as a world-renowned
destination2.14 1.07 .63 .56
Because of Whistler Mountain’s reputation for summer activities offered
2.06 .98 .57 .61
Because I saw an advertisement or article about summer on this mountain
1.44 .80 .39 .71
Factor 4: Ease of alpine access .72 Because of the ease of access to the alpine on the gondola/chairlifts 2.86 1.00 .54 .63 Because of the gondola/chairlift’s close proximity to Whistler Village 2.23 1.03 .59 .57 To experience a gondola/chairlift ride 1.89 1.03 .50 .68
a. Items coded on 4-point scales of 1 = not at all important to 4 = extremely important.
at COLORADO STATE UNIV LIBRARIES on November 7, 2011jtr.sagepub.comDownloaded from

Needham et al. 677
K-means cluster analysis was performed on these computed indices for the four factors to group respondents based on their motivations for visiting this ski area in the summer. Cluster analysis classifies individuals into smaller, more homogeneous groups based on patterns of responses across variables or factors (Hair and Black 2000). In other words, statistical patterns in the data collected are used to group people. A series of two- to six-group cluster analyses showed that the three-group solution provided the best fit for the data. Three different analyses were used to validate and confirm the stability of this solution. First, data were randomly sorted and cluster analysis was conducted after each of four random sorts. These analyses supported the solution identifying three distinct groups of individuals based on their motivations. Second, cluster analysis was performed directly on all of the individual motivation vari-ables; the same cluster pattern was revealed and 93% of respondents were categorized in the same cluster groups. Third, discriminant analysis was conducted to determine how well these individual motivation variables predicted the three cluster groups generated from the four factor indices. All of the variables significantly predicted the cluster groups, Wilks’s lambda U = .451 to .962, F = 7.74 to 241.79, p ≤ .001.
The motivation variables correctly classified 93% of clus-ter 1 visitors, 92% of cluster 2 visitors, and 97% of cluster 3 visitors. Overall, 95% of respondents were correctly clas-sified. Taken together, these analyses of cluster validity demonstrated that the motivation variables were capable of separating the clusters and support the stability of the three-cluster solution.2
These three cluster groups were compared in terms of their responses to the original motivation variables. Cluster 1 was the smallest group (n = 77, 18%) and rated all motiva-tion factors as most important (Table 3). Cluster 2 (n = 148, 35%) rated advertising/reputation and access as relatively important, whereas scenery was least important among clus-ters. Cluster 3 was the largest group (n = 196, 47%) and rated only scenery as highly important and all other factors as relatively unimportant. One-way ANOVA (i.e., F) and Tamhane’s T2 post hoc tests showed that motivations dif-fered among these three groups, F(2, 413 to 418) ≥ 6.81, p ≤ .001. Eta (η) effect sizes ranged from .20 to .74 and using guidelines from Cohen (1988) and Vaske (2008), these sta-tistics suggest that the strength of differences in motivations among the three cluster groups can be described as “medium to large” or “typical to substantial,” respectively.
Table 3. Motivation Items by Tourist Cluster Groups Visiting Whistler Mountain in the Summer
Motivation Factors and Items 1 2 3 F df p
Effect Size
Eta (η)
Factor 1: Amenities/tours offered To participate in a group nature or activity tour 1.42a 1.17b 1.07b 13.13 2, 417 <.001 .24 To attend a meeting or conference on the mountain 1.29a 1.08b 1.01b 13.11 2, 415 <.001 .24 To visit the alpine tubing or beginner skiing areas 1.47a 1.11b 1.03c 25.76 2, 418 <.001 .33 To participate in a special event (e.g., wedding, birthday) 1.38a 1.12b 1.07b 13.65 2, 417 <.001 .25 To access the helicopter tours 1.34a 1.12b 1.02c 16.43 2, 418 <.001 .27Factor 2: Experience scenery To view the natural landscape 3.94a 3.59b 3.65b 10.18 2, 418 <.001 .22 To experience the beauty of an alpine area 3.92a 3.67b 3.70b 6.81 2, 417 .001 .20 To view wildflowers or alpine meadows 3.68a 2.76b 3.22c 29.18 2, 418 <.001 .35 To view wildlife/animals 3.61a 2.64b 2.74b 32.29 2, 418 <.001 .37Factor 3: Advertising/reputation Because I was told by someone that this is a nice alpine area to visit 3.13a 1.89b 1.66b 68.07 2, 417 <.001 .50 Because of Whistler Mountain’s reputation as world-renowned
destination3.42a 2.37b 1.49c 168.34 2, 413 <.001 .67
Because of Whistler Mountain’s reputation for summer activities offered
3.15a 2.22b 1.53c 116.05 2, 414 <.001 .60
Because I saw an advertisement or article about summer on this mountain
2.35a 1.32b 1.19b 85.12 2, 417 <.001 .54
Factor 4: Ease of alpine access Because of the ease of access to the alpine on the gondola/chairlifts 3.42a 3.39a 2.22b 112.49 2, 418 <.001 .59 Because of the gondola/chairlift’s close proximity to Whistler Village 3.21a 2.79b 1.42c 257.19 2, 415 <.001 .74 To experience a gondola/chairlift ride 2.78a 2.24b 1.28c 105.09 2, 415 <.001 .58
a. Cell entries are means. Items coded on 4-point scales of 1 = not at all important to 4 = extremely important. Means with different letter subscripts differ at p < .05 using Tamhane’s T2 post hoc tests. Among clusters, cluster 1 (n = 77, 18%) rated all motivation factors as most important; cluster 2 (n = 148, 35%) rated advertising/reputation and access as relatively important, and scenery was least important; and cluster 3 (n = 196, 47%) rated only scenery as important, and all other factors were relatively unimportant.
Cluster Groupa
at COLORADO STATE UNIV LIBRARIES on November 7, 2011jtr.sagepub.comDownloaded from

678 Journal of Travel Research 50(6)
Cluster 3 visitors (i.e., only scenery important) were slightly more likely to own property in Whistler (21%) and reside in Whistler or nearby cities such as Vancouver (49%); only 10% of clusters 1 and 2 users owned property in Whistler and 57% to 65% lived in countries other than Canada (e.g., USA), c2(2 to 8, N = 421) ≥ 10.13, p = .006 to <.001, V = .16 to .21. All other demographic characteristics (e.g., age, gender) did not differ among these three groups (p > .05).
Normative EvaluationsDifferences in visitor norms based on these motivations are shown in Table 4 and Figures 5 through 7. The minimum acceptable conditions or points where the norm curves crossed the neutral point revealed that compared to cluster 1 and 2 respondents, those in cluster 3 (i.e., only scenery important) had lower normative acceptance of increasing densities of use and wider trails. For the density of sightseers/hikers, cluster 1 and 2 visitors accepted a maximum of 9.54 and 9.49 people/20 m2, respectively, whereas cluster 3 visi-tors accepted only 6.68 people/20 m2 (Table 4, Figure 5). Similarly, cluster 3 visitors accepted a maximum of only 2.68 riders per 15-m × 2-m SOT for density of mountain bik-ers compared to 4.72 riders per 15-m × 2-m SOT for cluster 1 users and 4.24 riders per 15-m × 2-m SOT for cluster 2 visi-tors (Table 4, Figure 6). This pattern also occurred for the trail width indicator where visitors in clusters 1 and 2
accepted maximum trail widths of 4.82 m and 4.80 m, respectively, whereas cluster 3 respondents accepted a maxi-mum width of 3.57 m (Table 4, Figure 7). There were sig-nificant differences in normative standards among the three motivation groups for all three of these indicators, F(2, 418) ≥ 14.45, p < .001. Tamhane’s T2 and Scheffe post hoc tests showed that cluster 1 and 2 respondents were statistically equivalent in their normative standards, but accepted signifi-cantly (p < .001) greater use densities and trail widths than those in cluster 3. In other words, cluster 3 was the largest group of summer visitors and had significantly more restric-tive norms than other visitors. Eta (η) effect sizes were also statistically significant and ranged from .25 to .28, suggest-ing that these differences were not trivial and the strength of differences among groups was medium (Cohen 1988) or typi-cal (Vaske 2008).
Normative agreement or crystallization also differed among motivation groups. For all three indicators, crystallization was highest for cluster 3 visitors (i.e., only scenery impor-tant). This is represented by the lower standard deviations for the norm curves of cluster 3 users (Table 4). There was more consensus, for example, regarding acceptable and unacceptable densities of sightseers/hikers for cluster 3 visi-tors (SD = .83) than cluster 1 (SD = 1.10) and cluster 2 (SD = 0.95) users. Similarly, there was more agreement regarding acceptable and unacceptable trail widths for cluster 3 users (SD = 0.87) compared to cluster 1 (SD = 1.07) and cluster 2 (SD = 1.06) visitors. Levene’s tests for homogeneity revealed
Table 4. Social Norm Curve Characteristics of Each Cluster Group for Each Indicator of Summer Use on Whistler Mountain
Cluster Groupa
Norm Curve Characteristics 1 2 3 Total F df p Effect Size Eta (η)
Density of sightseers/hikers Norm intensity (max. = 10)b 7.73 7.68 7.73 7.71 0.09 2, 418 .915 .02 Minimum acceptable conditionc 9.54a 9.49a 6.68b 7.69 16.83 2, 418 <.001 .28 Norm crystallizationd 1.10 0.95 0.83 0.95 9.60e 2, 418 <.001Density of mountain bikers Norm intensity (max. = 10)b 8.01 7.97 8.28 8.12 2.41 2, 418 .091 .11 Minimum acceptable conditionf 4.72a 4.24a 2.68b 3.67 15.56 2, 418 <.001 .26 Norm crystallizationd 1.26 1.14 0.99 1.13 12.91e 2, 418 <.001Trail width Norm intensity (max. = 6)b 4.81 4.75 4.96 4.86 2.85 2, 418 .059 .12 Minimum acceptable conditiong 4.82a 4.80a 3.57b 4.23 14.45 2, 418 <.001 .25 Norm crystallizationd 1.07 1.06 0.87 1.01 11.14e 2, 418 <.001
a. Means with different letter subscripts differ at p < .05 using Tamhane’s T2 (density of sightseers/hikers) or Scheffe (density of bikers, trail width) post hoc tests. Among clusters, cluster 1 (n = 77, 18%) rated all motivation factors as most important; cluster 2 (n = 148, 35%) rated advertising/reputation and access as relatively important, and scenery was least important; and cluster 3 (n = 196, 47%) rated only scenery as important, and all other factors were relatively unimportant.b. Cell entries are mean distances from neutral line across all points on each norm curve independent of direction of evaluation.c. Cell entries are mean number of sightseers/hikers per 20 m2 at the point where norm curve crosses neutral line.d. Cell entries are average standard deviations across all points on each norm curve.e. F value for the Levene’s test for homogeneity.f. Cell entries are mean number of riders per 15-m × 2-m section of trail at point where norm curve crosses neutral line.g. Cell entries are mean trail width (meters) at point where norm curve crosses neutral line.
at COLORADO STATE UNIV LIBRARIES on November 7, 2011jtr.sagepub.comDownloaded from

Needham et al. 679
–2
–1
0
1
2VeryAcceptable
VeryUnacceptable Photograph 1
(0 People/20m2)
Photograph 2(2 People/
20m2)
Photograph 3(4 People/
20m2)
Photograph 4(8 People/
20m2)
Photograph 5(16 People/
20m2)
Density of sightseers / hikers in each photograph (# people/20m2)
Cluster 1 Cluster 2 Cluster 3Cluster 1 Cluster 2 Cluster 3
Figure 5. Mean social norm curves for density of sightseers/hikers indicator
0
1
2VeryAcceptable
VeryUnacceptable
–2
–1
Photograph 1
(0 Riders/
15m x 2m)
Photograph 2
(2 Riders/
15m x 2m)
Photograph 3
(4 Riders/
15m x 2m)
Photograph 4
(6 Riders/
15m x 2m)
Photograph 5
(8 Riders/
15m x 2m)
Density of mountain bikers in each photograph(# riders/15m x 2m section of trail)
Cluster 1 Cluster 2 Cluster 3
Figure 6. Mean social norm curves for density of mountain bikers indicator
significant differences in norm crystallization or consensus among the three groups for each indicator, F(2, 418) ≥ 9.60, p < .001.
Norm intensity/salience or importance of the indicators to visitors was high and did not differ among motivation groups. Visitors in all groups rated trail width and density of sightseers/hikers and mountain bikers as important indica-tors of summer use at this ski area. Among the three groups, intensities were similar and only ranged from 7.68 to 7.73 (maximum = 10) for density of sightseers/hikers, 7.97 to 8.28 (maximum = 10) for density of mountain bikers, and 4.75 to 4.96 (maximum = 6) for trail width (Table 4). For each indicator, there were no statistical differences in norm intensity/salience among the three motivation groups, F(2, 418) ≤ 2.85, p = .059 to .915, η ≤ .12.
DiscussionThis article examined motivations of people visiting the Whistler Mountain ski area in the summer and their norms regarding acceptable and unacceptable trail conditions and densities of use at this area. Almost all of these people were tourists who were traveling from other areas of British Columbia and Canada, as well as the United States, Europe, and other regions around the world. Motivations related to scenery and landscape were most important in influencing people to visit this destination in the summer, whereas ame-nities and tours were least important. The largest group of visitors only considered viewing the alpine scenery as an important reason for visiting; the smallest group rated all motivation factors as most important. Although trail widths and densities of sightseers/hikers and mountain bikers were important for visitors, those who only considered scenery important had lower normative acceptance of increasing densities of use and wider trails, and had more consensus or
crystallization about acceptable conditions. These findings have implications for management and future research.
Implications for ManagementFrom a management perspective, summer visitors were heterogeneous and exhibited a range of motivations for vis-iting this ski area in the summer. Scenery and landscape were most important in influencing people to visit, adver-tising and access were slightly to moderately important, and amenities and tours were least important. The largest group of visitors rated scenery as important and all other factors as relatively unimportant. This is informative because many ski area managers, including those at Whis-tler Mountain, are adding and advertising various summer amenities and attractions such as helicopter tours, hoping that they will draw more visitors. Since most respondents visited primarily to view the scenery, it may be wise to con-sider marketing the views and setting more than tours, facilities, and other amenities.
Understanding groups who share these similar motivations for visiting and their norms for acceptable and unacceptable conditions can help managers design ski areas for summer use. Basing management decisions on how much and what kinds of uses and impacts are acceptable for visitors with dif-ferent motivations may allow managers to better address the needs of their clientele. The largest group of visitors, for example, only considered scenery important, had lower accep-tance of increasing densities of use and wider trails, and had more consensus regarding acceptable conditions. These visi-tors were seeking a more nature-based alpine experience with less evidence of social and resource impacts. Some other respondents, however, visited for a variety of reasons, includ-ing the facilities and other amenities on the mountain. Clearly, there is no one-size-fits-all solution, so ski area managers
at COLORADO STATE UNIV LIBRARIES on November 7, 2011jtr.sagepub.comDownloaded from

680 Journal of Travel Research 50(6)
could tailor opportunities and setting characteristics to match different motivations and give visitors what they want. One management consideration, therefore, could be to spatially zone ski areas to offer opportunities for unparalleled scenic views, minimal use densities and crowding, and relatively primitive trail conditions in some areas, while providing facil-ities, tours, and other amenities in separate areas. Informing visitors of these zones will allow guests to match opportunities and setting conditions with their motivations for visiting, thereby possibly increasing the likelihood that they will have satisfactory experiences (Manning 1999; Needham and Roll-ins 2009).
The normative approach used in tourism and related fields facilitates understanding of acceptable and unacceptable conditions and provides a basis for formulating standards of quality that can be used to inform management (see Manning 1999, 2007; Shelby, Vaske, and Donnelly 1996; Vaske, Donnelly, and Shelby 1993; Vaske and Whittaker 2004 for reviews). Results from this study, for example, suggest that densities of sightseers/hikers should not exceed 9.54 people/ 20 m2, densities of mountain bikers should not be greater than 4.72 riders per 15 m × 2 m of trail, and trails should not be wider than 4.82 m because all visitor groups considered these conditions to be unacceptable for this ski area. The largest group of summer visitors accepted even more restric-tive conditions and standards (e.g., 6.68 people/20 m2, 3.57-m-wide trails).
Although managing and monitoring standards equal to or better than these minimum acceptable conditions may allevi-ate issues such as crowding, this represents a double-edged sword for managers. On one hand, implementing standards to reduce negative impacts may improve visitor experiences. On the other hand, these standards may necessitate actions such as reservation and quota systems to limit use. These types of direct and restrictive actions are often not supported by many visitors and can be costly to implement and enforce (Manning 1999). In addition, these strategies could result in
some visitors being restricted or displaced from an area. Most ski areas, such as Whistler Mountain, are privately owned and operated where the primary management goal is to maximize visitation, ticket sales, and profits. Restricting use, therefore, is not desirable for most ski area managers (Needham and Rollins 2005). Managers should consider alternative strategies that provide opportunities for visitor solitude and quietude in more natural settings without actu-ally reducing visitation. Options such as spatial and temporal zoning, informing visitors of these alternative opportunities and settings, directional trails, and increasing the number of trails to disperse use may be more appropriate than limiting use (Manning 1999).
Measures of norm intensity/salience showed that visitors considered trail widths and densities of sightseers/hikers and bikers to be important indicators of summer use at this ski area. This is understandable because annual summer use has reached approximately 250,000 people at this ski area (Needham and Rollins 2009; NSAA-RRC 2009). In addi-tion, wide trails and gravel service roads are common at this ski area and visible in the summer once the snow has melted. These wide trails and service roads are used for staff access and on-mountain maintenance, but also serve as hiking trails in the summer. Given the importance of trail width and use levels to summer visitors, managers should consider increasing opportunities for low-density experiences and providing more primitive trails (i.e., 1 to 3 m wide) at this ski area. Use densities and trail widths should be moni-tored to ensure that conditions and visitor experiences do not deteriorate to the point where they are violating norma-tive standards of quality.
Implications for ResearchFrom a research perspective, this article focuses on visitor motivations and their norms regarding indicator conditions and impacts at an alpine destination area. Motivations and impacts are important issues that have received substantial attention in tourism, travel, and related fields. A few studies have been suggestive of relationships between norms and motivations (Graefe et al. 1981; Schreyer and Roggenbuck 1978), but relationships were not strong and most studies did not directly measure norms for specific social or resource indicators. Findings presented here, however, showed sig-nificant differences in normative evaluations of conditions based on motivations for visiting a ski area in the summer. To increase the generalizability of these findings, the follow-ing research considerations are offered. First, the visuals measuring the two social indicators (densities of sightseers/hikers and mountain bikers) and one resource indicator (trail width) represent a subset of all possible indicators of sum-mer use at ski areas. Although measures of norm intensity/salience showed that these were important indicators for the area, future research should consider other potential indicators
0
1
2
Photograph 1(1m Wide Trail)
Photograph 2(3m Wide Trail)
Photograph 3(7m Wide Trail)
VeryAcceptable
VeryUnacceptable
–2
–1
Trail width in each photograph (meters)
Cluster 1 Cluster 2 Cluster 3
Figure 7. Mean social norm curves for trail width indicator
at COLORADO STATE UNIV LIBRARIES on November 7, 2011jtr.sagepub.comDownloaded from

Needham et al. 681
of summer use such as noise, litter, helicopter tour over-flights, and discourteous visitor behavior. Indicators associ-ated with winter sports infrastructure that is visible during the summer months (e.g., chairlifts, clear-cut ski runs, snow-making reservoirs, access roads) may also influence norms of summer visitors and their motivations associated with the scenery and environment.
Second, similar to past research (Basman et al. 1996; Freimund et al. 2002), visuals for the indicators showed hik-ers and bikers per unit area and trail widths that were uniform (20 m2, 15 m × 2 m of trail), and visitors were told to assume that conditions were consistently occurring at the ski area. Given that people rarely space themselves evenly across an area, it should not be assumed that a setting’s capacity can be accurately estimated by dividing its total area by the cor-responding unit standard. Research is required to explore the extent that this approach can be extrapolated to a landscape level. The photographs also depicted static representations of indicator conditions. Research using video techniques and other multimedia and graphic devices may depict indicator conditions more realistically (Freimund et al. 2002; Kim and Shelby 2009).
Third, consistent with most normative research (see Manning 1999, 2007 for reviews), this study assessed visitor acceptance of indicator conditions. Some studies, however, have shown that evaluations such as visitor preferences and absolute maximum tolerances of indicator conditions can differ from acceptance (Manning et al. 1999, 2002). Future research should continue exploring possible differences among evaluative response categories.
Fourth, minimum acceptable conditions (i.e., standards of quality) were represented in this study as indicator condi-tions where norm curves crossed the neutral line. This is con-sistent with past research (see Manning 1999, 2007; Shelby, Vaske, and Donnelly 1996 for reviews). An issue of debate, however, is whether standards should be based on alternative points along the curves. Should standards be based, for example, on conditions most acceptable to all visitors (i.e., highest point on the curve such as 0 people/20 m2 in this study) or should they be based on conditions acceptable to less than the majority of respondents? Basing standards on the most acceptable conditions is often impractical (Manning 2007). In this study, for example, this would result in almost all sightseers/day hikers being prohibited from the mountain. Conversely, if standards of quality are based on impacts that are acceptable to only a small proportion of visitors, condi-tions may deteriorate to a point where most visitors are dis-placed to other settings and may not return. It remains an issue for managers and researchers to determine standards of quality that provide logistically and politically feasible options for managing specific settings.
Fifth, studies have measured normative acceptance of increasing impacts for resource indicators such as trail con-ditions and amount of bare ground at campsites (e.g., Kim
and Shelby 1998; Manning et al. 2002, 2004; Shelby, Vaske, and Harris 1988). This study examined trail widths. What remains unclear, however, is whether visitors base their eval-uations on the utility of impacts (e.g., wide trails are accept-able because space is needed for people to pass each other) or potential biophysical impacts (e.g., wide trails are unac-ceptable because they necessitate removal of vegetation). In addition, normative evaluations of resource indicators may or may not measure biodiversity or ecological integrity, as they are based primarily on visual and perceptual evaluations (Needham and Rollins 2005). Empirical research is required to examine these issues.
Sixth, visitors in frontcountry settings often have consid-erable variability in normative standards and crystallization (e.g., Donnelly et al. 2000; Vaske, Donnelly, and Petruzzi 1996). Specifying minimum acceptable conditions in high-use areas is more difficult, and the importance of use levels and resource impacts often decreases in areas where visitors expect many people to be present (Donnelly et al. 2000). This study showed that grouping visitors into more meaning-ful homogeneous subgroups based on their motivations can explain some variability in normative standards and agree-ment, especially in frontcountry settings such as alpine ski areas. This study measured a number of push and pull rea-sons for visiting a ski area in the summer, and these explained 59% of the variance in these motivations. More research is needed, however, using measures such as the recreation experience preference (REP) scales to examine additional motivations for visiting ski areas in the summer (Manfredo, Driver, and Tarrant 1996).
Seventh, this article considered visitor motivations as inde-pendent variables and normative evaluations as dependent variables. Given that evaluations of conditions can occur before, during, and after on-site experiences, however, the opposite may be possible where norms may influence motivations. An individual who has previously visited a site, for example, may hold a norm that use levels at the site are unacceptable and this may influence decisions to visit again in the future. This article treated motivations as independent variables and norms as dependent variables because (a) most respondents were first-time summer visitors and arguably did not have well-defined or well-informed norms prior to their visit; (b) ancil-lary analysis showed no patterns or substantial differences in normative evaluations between first-time and repeat summer visitors; and (c) it is generally accepted that motivations tend to precede and initiate visitation and participation, whereas norms are typically shaped during and after experiences (Manning 1999, 2007; Needham and Rollins 2009). Regard-less, this study surveyed visitors on-site and did not include previous summer visitors who chose not to visit again in response to evaluations of conditions encountered during past experiences at this mountain. The hypothesis that norms may possibly influence motivations, therefore, deserves empirical research attention.
at COLORADO STATE UNIV LIBRARIES on November 7, 2011jtr.sagepub.comDownloaded from

682 Journal of Travel Research 50(6)
Finally, data for this study were collected in the summer of 2000 when the largest summer user group at Whistler Moun-tain was sightseers/day hikers. Research is needed to examine if summer activity groups and motivations of these groups have changed at this alpine ski area since this time, and whether visitor motivations still influence normative evaluations of social and resource indicator conditions associated with sum-mer use at this area. Findings are also limited to one alpine ski area and may not generalize to all ski areas where chairlifts operate in the summer season and other alpine destination areas that attract large numbers of travelers. Given the lack of research applying the concepts of motivations and norms to summer use at ski areas, however, the ability to compare results presented here with other similar situations is limited. The applicability of these findings to other ski areas and com-mercial destinations and tourism settings, therefore, remains a topic for further empirical investigation.
Notes
1. Motivations were independent variables and norms were de-pendent variables because (a) most respondents were first-time summer visitors (65%) and arguably did not have well defined or informed norms prior to their visit; (b) ancillary analysis showed no patterns or substantial differences in normative evaluations between first time and repeat summer visitors; and (c) it is generally accepted that motivations tend to precede and initiate visitation and participation, whereas norms are typi-cally informed and shaped during and after on-site experiences (Manning 1999; Needham and Rollins 2009; Shelby, Vaske, and Donnelly 1996).
2. Given that the cross-tabulation of cluster solutions based on the four factor indices versus all 16 motivation variables showed almost identical respondent classification, the cluster solution based on the four factors was retained for analyses. Any dif-ferences in normative evaluations between clusters generated using the four factors versus all motivation variables are within statistical probabilities of occurring by chance (Hair and Black 2000; Vaske 2008).
Acknowledgment
The authors thank the Intrawest Corporation at Whistler/Blackcomb and the British Columbia Ministry of Environment for helping to facilitate this study. The Department of Geography at the Univer-sity of Victoria, Canada, provided additional support. The three anonymous reviewers and the editor are thanked for helpful com-ments on earlier versions of this article.
Declaration of Conflicting Interests
The authors declared no conflicts of interests with respect to the authorship and/or publication of this article.
Funding
The authors received no financial support for the research and/or authorship of this article.
References
Absher, J., and R. Lee. (1981). “Density as an Incomplete Cause of Crowding in Backcountry Settings.” Leisure Sciences, 4: 231-47.
Alexandris, K., C. Kouthouris, and G. Girgolas. (2007). “Investi-gating the Relationships among Motivation, Negotiation, and Alpine Skiing Participation.” Journal of Leisure Research, 39: 648-67.
Basman, C. M., M. J. Manfredo, S. C. Barro, J. J. Vaske, and A. Watson. (1996). “Norm Accessibility: An Exploratory Study of Backcountry and Frontcountry Recreational Norms.” Leisure Sciences, 18: 177-91.
Beh, A., and B. L. Bruyere. (2007). “Segmentation by Visitor Moti-vation in Three Kenyan National Reserves.” Tourism Manage-ment, 28: 1464-71.
British Columbia Assets and Land Corporation. (2000). 1998/99 Ski Season Review. Victoria, Canada: BC Assets and Land Corporation.
Cohen, J. (1988). Statistical Power Analysis for the Behavioral Sci-ences. Hillsdale, NJ: Lawrence Erlbaum.
Dann, G. (1981). “Tourist Motivation: An Appraisal.” Annals of Tourism Research, 8: 187-219.
Ditton, R., A. Fedler, and A. Graefe. (1983). “Factors Contributing to Perceptions of Recreational Crowding.” Leisure Sciences, 5: 273-88.
Donnelly, M. P., J. J. Vaske, D. Whittaker, and B. Shelby. (2000). “Toward an Understanding of Norm Prevalence: A Compara-tive Analysis of 20 Years of Research.” Environmental Man-agement, 25: 403-14.
Driver, B. L., and R. C. Knopf. (1977). “Personality, Outdoor Rec-reation, and Expected Consequences.” Environment and Behav-ior, 9: 169-93.
Driver, B. L., H. E. A. Tinsley, and M. J. Manfredo. (1991). “The Paragraphs about Leisure and Recreation Experience Preference Scales: Results from Two Inventories Designed to Access the Breadth of the Perceived Psychological Benefits of Leisure.” In Benefits of Leisure, edited by B. L. Driver, G. L. Peterson, and P. J. Brown. State College, PA: Venture, pp. 263-86.
Freimund, W. A., J. J. Vaske, M. P. Donnelly, and T. Miller. (2002). “Using Video Surveys to Access Dispersed Backcountry Visi-tors’ Norms.” Leisure Sciences, 24: 349-62.
Gill, A. (2000). “From Growth Machine to Growth Management: The Dynamics of Resort Development in Whistler, British Columbia.” Environment and Planning A, 32: 1083-1103.
Gill, A., and P. W. Williams. (1994). “Managing Growth in Moun-tain Tourism Communities.” Tourism Management, 15: 212-20.
Godde, P. M., M. F. Price, and F. M. Zimmermann. (2000). Tour-ism and Development in Mountain Regions. New York: CABI.
Good, R., and P. Grenier. (1994). “Some Environmental Impacts of Recreation in the Australian Alps.” Australian Parks and Rec-reation, 30: 20-26.
Graefe, A. R., R. Ditton, J. Roggenbuck, and R. Schreyer. (1981). “Notes on the Stability of the Factor Structure of Leisure Mean-ings.” Leisure Sciences, 4: 51-65.
at COLORADO STATE UNIV LIBRARIES on November 7, 2011jtr.sagepub.comDownloaded from

Needham et al. 683
Hair, J. F., and W. C. Black. (2000). “Cluster Analysis.” In Read-ing and Understanding More Multivariate Statistics, edited by L. G. Grimm and P. R. Yarnold. Washington, DC: American Psychological Association, pp. 147-206.
Hall, T. E., and J. W. Roggenbuck. (2002). “Response Format Effects in Questions about Norms: Implications for the Reliability and Valid-ity of the Normative Approach.” Leisure Sciences, 24: 325-38.
Holden, A. (1999). “Understanding Skiers’ Motivation Using Pearce’s ‘Travel Career’ Construct.” Annals of Tourism Research, 26: 435-38.
Hudson, S., and G. Shephard. (1998). “Measuring Service Quality at Tourist Destinations: An Application of Importance-Performance Analysis to an Alpine Ski Resort.” Journal of Travel and Tour-ism Marketing, 7: 61-77.
Hvenegaard, G., and P. Dearden. (1998). “Ecotourism versus Tour-ism in a Thai National Park.” Annals of Tourism Research, 25: 700-20.
Inglis, G., V. Johnson, and F. Ponte. (1999). “Crowding Norms in Marine Settings: A Case Study of Snorkeling on the Great Barrier Reef.” Environmental Management, 24: 369-81.
Iso-Ahola, S. E. (1980). The Social Psychology of Leisure and Rec-reation. Dubuque, IA: Brown.
Iso-Ahola, S. E. (1982). “Toward a Social Psychological Theory of Tourism Motivation: A Rejoinder.” Annals of Tourism Research, 9: 256-62.
Iso-Ahola, S. E. (1999). “Motivational Foundations of Leisure.” In Leisure Studies: Prospects for the Twenty-First Century, edited by E. L. Jackson and T. L. Burton. State College, PA: Venture, pp. 35-51.
Jackson, J. M. (1965). “Structural Characteristics of Norms.” In Current Studies in Social Psychology, edited by I. D. Steiner and M. F. Fishbein. New York: Holt, Rinehart, Winston, pp. 301-9.
Jafari, J. (2003). Encyclopedia of Tourism. New York: Routledge.Kim, S., and B. Shelby. (1998). “Norms for Behavior and Condi-
tions in Two National Park Campgrounds in Korea.” Environ-mental Management, 22: 277-85.
Kim, S., and B. Shelby. (2009). “Effects of Movement When Using Visual Media to Determine Encounter Standards.” Korean Jour-nal of Environmental Ecology, 23: 309-16.
Klenosky, D. (2002). “The ‘Pull’ of Tourism Destinations: A Means-End Investigation.” Journal of Travel Research, 40: 385-95.
Klenosky, D. B., C. E. Gengler, and M. S. Mulvey. (1993). “Under-standing the Factors Influencing Ski Destination Choice: A Means–Ends Analytic Approach.” Journal of Leisure Research, 25: 362-79.
Manfredo, M. J., B. L. Driver, and M. A. Tarrant. (1996). “Mea-suring Leisure Motivation: A Meta-analysis of the Recreation Experience Preference Scales.” Journal of Leisure Research, 28: 188-213.
Manfredo, M. J., and R. A. Larson. (1993). “Managing for Wildlife Viewing Recreation Experiences: An Application in Colorado.” Wildlife Society Bulletin, 21: 226-36.
Manidis Roberts Consulting. (1997). Developing a tourism opti-mization management model (TOMM): A model to monitor and
manage tourism on Kangaroo Island. Adelaide, Australia: South Australian Tourism Commission.
Mannell, R. C., and D. A. Kleiber. (1997). A Social Psychology of Leisure. State College, PA: Venture.
Manning, R. E. (1999). Studies in Outdoor Recreation: Search and Research for Satisfaction. Corvallis, OR: Oregon State Univer-sity Press.
Manning, R. E. (2001). “Visitor Experience and Resource Pro-tection: A Framework for Managing the Carrying Capacity of National Parks.” Journal of Park and Recreation Administra-tion, 19: 93-108.
Manning, R. E. (2007). Parks and Carrying Capacity: Commons without Tragedy. Washington, DC: Island Press.
Manning, R. E., and W. A. Freimund. (2004). “Use of Visual Research Methods to Measure Standards of Quality for Parks and Outdoor Recreation.” Journal of Leisure Research, 36: 557-79.
Manning, R., S. Lawson, P. Newman, M. Budruk, W. Valliere, D. Laven, and J. Bacon. (2004). “Visitor Perceptions of Recreation-Related Resource Impacts.” In Environmental Impacts of Ecotourism, edited by R. Buckley. Cambridge, MA: CABI, pp. 259-72.
Manning, R. E., S. R. Lawson, P. Newman, D. Laven, and W. Valliere. (2002). “Methodological Issues in Measuring Crowding-Related Norms in Outdoor Recreation.” Leisure Sci-ences, 24: 339-48.
Manning, R. E., W. A. Valliere, B. Wang, and C. Jacobi. (1999). “Crowding Norms: Alternative Measurement Approaches.” Leisure Sciences, 21: 97-115.
Mills, A. S., H. Couturier, and D. J. Snepenger. (1986). “Segment-ing Texas Snow Skiers.” Journal of Travel Research, 25 (2): 19-23.
National Ski Areas Association and RRC Associates (NSAA-RRC). (2009). National Ski Areas Association National Demographic Survey. Lakewood, CO: National Ski Areas Association.
Needham, M. D., and R. B. Rollins. (2005). “Interest Group Stan-dards for Recreation and Tourism Impacts at Ski Areas in the Summer.” Tourism Management, 26: 1-13.
Needham, M. D., and R. Rollins. (2009). “Social Science, Con-servation, and Protected Areas Theory. In Parks and Pro-tected Areas in Canada: Planning and Management, edited by P. Dearden and R. Rollins. Don Mills, Canada: Oxford Univer-sity Press, pp. 135-68.
Nunnally, J. C., and I. H. Bernstein. (1994). Psychometric Theory. New York: McGraw-Hill.
Ormiston, D., A. Gilbert, and R. E. Manning. (1998). “Indicators and Standards of Quality for Ski Resort Management.” Journal of Travel Research, 36: 35-41.
Pearce, P. L. (1993). “Fundamentals of Tourist Motivation.” In Tour-ism Research: Critiques and Challenges, edited by D. G. Pearce and R. W. Butler. New York: Routledge, pp. 113-34.
Pickering, C. M., and R. C. Buckley. (2003). “Swarming to the Sum-mit: Managing Tourists at Mt. Kosciuszko, Australia.” Mountain Research and Development, 23: 230-33.
at COLORADO STATE UNIV LIBRARIES on November 7, 2011jtr.sagepub.comDownloaded from

684 Journal of Travel Research 50(6)
Richards, G. (1996). “Skilled Consumption and UK Ski Holidays.” Tourism Management, 17: 25-34.
Saremba, J., and A. Gill. (1991). “Value Conflicts in Mountain Park Settings.” Annals of Tourism Research, 18: 455-72.
Schreyer, R. M., and J. Roggenbuck. (1978). “The Influence of Experience Expectations on Crowding Perceptions and Social Psychological Carrying Capacities.” Leisure Sciences, 1: 373-94.
Shelby, B. (1980). “Crowding Models for Backcountry Recre-ation.” Land Economics, 56: 43-55.
Shelby, B., J. J. Vaske, and M. P. Donnelly. (1996). “Norms, Stan-dards, and Natural Resources.” Leisure Sciences, 18: 103-23.
Shelby, B., J. J. Vaske, and R. Harris. (1988). “User Standards for Ecological Impacts at Wilderness Campsites.” Journal of Lei-sure Research, 20: 245-56.
Stankey, G. H., D. N. Cole, R. C. Lucas, M. E. Peterson, S. Frissell, and R. F. Washburne. (1985). The Limits of Acceptable Change (LAC) System for Wilderness Planning (USDA Forest Service General Technical Report INT-176). Logan, UT: Intermountain Forest and Range Station.
Tabachnick, B., and G. Fidell. (1996). Using Multivariate Statis-tics. New York: Harper Collins.
Thapa, B., and A. R. Graefe. (2003). “Level of Skill and Its Rela-tionship to Recreation Conflict and Tolerance among Adult Ski-ers and Snowboarders.” World Leisure, 45: 13-25.
Uysal, M., and C. Jurowski. (1994). “Testing the Push and Pull Fac-tors.” Annals of Tourism Research, 21: 844-46.
Vaske, J. J. (2008). Survey Research and Analysis: Applications in Parks, Recreation and Human Dimensions. State College, PA: Venture.
Vaske, J. J., J. Beaman, R. Stanley, and M. Grenier. (1996). “Importance Performance and Segmentation: Where Do We Go from Here?” Journal of Travel and Tourism Marketing, 5: 225-40.
Vaske, J. J., P. Carothers, M. P. Donnelly, and B. Baird. (2000). “Recreation Conflict among Skiers and Snowboarders.” Leisure Sciences, 22: 297-313.
Vaske, J. J., M. P. Donnelly, and J. P. Petruzzi. (1996). “Country of Origin, Encounter Norms, and Crowding in a Frontcountry Setting.” Leisure Sciences, 18: 161-76.
Vaske, J. J., M. P. Donnelly, and B. Shelby. (1993). “Establishing Management Standards: Selected Examples of the Normative Approach.” Environmental Management, 17: 629-43.
Vaske, J. J., R. Dyar, and N. Timmons. (2004). “Skill Level and Recreation Conflict among Skiers and Snowboarders.” Leisure Sciences, 26: 215-25.
Vaske, J. J., B. Shelby, A. R. Graefe, and T. A. Heberlein. (1986). “Backcountry Encounter Norms: Theory, Method, and Empiri-cal Evidence.” Journal of Leisure Research, 18: 137-53.
Vaske, J. J., and D. Whittaker. (2004). “Normative Approaches to Natu-ral Resources.” In Society and Natural Resources: A Summary of Knowledge, edited by M. J. Manfredo, J. J. Vaske, B. L. Bruyere, D. R. Field, and P. Brown. Jefferson, MO: Modern Litho, pp. 283-94.
Wellman, J. D., J. W. Roggenbuckand, and A. C. Smith. (1982). “Recreation Specialization and the Norms of Depreciative Behavior among Canoeists.” Journal of Leisure Research, 14: 323-40.
Williams, P., K. Dossa, and A. Fulton. (1994). “Tension on the Slopes: Managing Conflict between Skiers and Snowboarders.” Journal of Applied Recreation Research, 19: 191-213.
Wood, T. F. (1987). “The Analysis of Environmental Impacts Resulting from Summer Recreation in the Cairngorm Ski Area, Scotland.” Journal of Environmental Management, 25: 271-84.
Young, J. M., D. R. Williams, and J. W. Roggenbuck. (1991). “The Role of Involvement in Identifying Users’ Preferences for Social Standards in the Cohutta Wilderness.” In Proceedings of the 1990 Southeastern Recreation Research Conference, edited by D. Hope. Athens, GA: USDA Southeastern Forest Experi-ment Station, pp. 173-83.
Bios
Mark D. Needham, PhD, is an assistant professor in the depart-ment of forest ecosystems and society at Oregon State University. He is also an adjunct and affiliate associate professor in the depart-ment of geography at the University of Hawai’i. His research focuses on human dimensions of recreation, tourism, and wildlife; survey methodology; and quantitative analysis.
Rick B. Rollins, PhD, is a university-college professor in the department of recreation and tourism management at Vancouver Island University. His research focuses on environmental issues and conservation, outdoor recreation, ecotourism, national parks, marine protected areas, and international development.
Robyn L. Ceurvorst is a PhD candidate in the department of forest ecosystems and society at Oregon State University. Her research interests include outdoor recreation and tourism, coastal and marine resource management, parks and protected areas, and environmen-tal education.
Colin J. B. Wood, PhD, is a professor emeritus in the department of geography at the University of Victoria, Canada. His research inter-ests include human and economic geography, natural resource man-agement, simulation gaming, and recreation and tourism.
Kerry E. Grimm, PhD, is a postdoctoral research associate in the department of forest ecosystems and society at Oregon State Univer-sity. Her research interests include human–environment relationships, communication, rhetorical theory, political ecology, and tourism.
Philip Dearden, PhD, is a professor and chair of the department of geography at the University of Victoria, Canada. His research focuses on parks and protected area systems, marine resource man-agement, conservation, community-based management, and envi-ronmental change.
at COLORADO STATE UNIV LIBRARIES on November 7, 2011jtr.sagepub.comDownloaded from