Embed Size (px)
Citation preview
ORIGINAL ARTICLE
J Wood Sci (2006) 52:69–74 © The Japan Wood Research Society 2006DOI 10.1007/s10086-005-0729-4
M. Yasumura (*)Faculty of Agriculture, Shizuoka University, 836 Ohya, Shizuoka422-8529, JapanTel. +81-54-237-1111; Fax +81-54-237-3028e-mail: [email protected]
T. KamadaNODA Corporation, Shizuoka 424-0906, Japan
Y. Imura · M. UesugiMiyazaki Prefecture Wood Utilization Technical Center,Miyazaki 885-0037, Japan
L. DaudevilleLaboratoire 3S, Université Joseph Fourrier, Grenoble 38041, France
Part of this article was presented at the 53rd Annual Meeting of theJapan Wood Research Society, Fukuoka, March 2003, the 2003 AnnualMeeting of Architectural Institute of Japan, Nagoya, September 2003,and meeting thirty-six of CIB-W18, Colorado, August 2003
Motoi Yasumura · Takahisa Kamada · Yutaka ImuraMotoi Uesugi · Laurent Daudeville
Pseudodynamic tests and earthquake response analysis of timber structuresII: two-level conventional wooden structures with plywood sheathedshear walls
Received: April 20, 2004 / Accepted: March 22, 2005 / Published online: February 1, 2006
Abstract Pseudodynamic (PSD) tests were conducted ontwo-level timber structures with plywood-sheathed shearwalls, which each had an opening of different configuration,to study the effects of the mechanical properties of thefirst and second levels on the earthquake response of thestructure. The specimens had two-level conventional postand beam frames that were 3m wide, 3m deep, and 6m highwith plywood sheathings nailed on one face of the structure.The first and second levels had different openingconfigurations of window, door, or slit. Lateral forces wereapplied at the top of the first and second levels, calculatingstep by step the next displacement based on the North-South (NS) components of the 1940 El Centro earthquake.The test results were compared with those of the time–history earthquake response analysis using the lumped massmodel and hysteresis model presented in the companionarticle (part I). The experimental and simulated resultsshowed that the simulation by means of the lumped masstime–history earthquake response analysis predicted quitewell the response of the first level, but tended to underesti-mate the response of the second level, and that the PSDtests of an individual wall system with the mass supportedby that particular wall generally show a conservative esti-mate of the response.
Key words Computer on-line control · Lumped massmodel · Dynamic analysis · Two-level structures · Plywoodsheathing
Introduction
Pseudodynamic (PSD) testing is a useful method forunderstanding and estimating the seismic performance oftimber structures.1 To conduct the PSD tests of lateral-resisting elements such as shear walls, we need to determinethe mass that is the most sensitive to the earthquake re-sponse. In general, we consider the lateral-resisting elementof the first level of a structure and apply the mass supportedby that particular element. However, the effects of themechanical properties of the upper level may not be negli-gible on the response of the first level. Most PSD teststhat have been conducted on conventional wooden struc-tures and light-frame wooden structures2–5 are related tosimple shear walls or single level wall systems withopenings. Therefore, we conducted PSD tests on two-leveltimber structures with plywood-sheathed shear walls,which each had an opening of different configuration, tostudy the effects of the lateral stiffness and strength ofthe first and second levels on the response of the entirestructure.
Time–history earthquake response analysis is anothereffective method to evaluate the seismic performance oftimber structures. A good model for the hysteresis of lat-eral-resisting elements is required to predict the response.A hysteresis model used in part I of this study5 showed goodpredictions of the response of wall systems. In this study,the same methods and hysteresis parameters were used forthe analysis of two-level structures with plywood-sheathedshear walls. The simulation predicted quite well the re-sponse of the first level, but tended to underestimate theresponse of the second level. The local deformation, such asthat of the connections between the first and the secondlevels, might be considered to predict the response of theentire structure.
70
Method and materials
Specimens
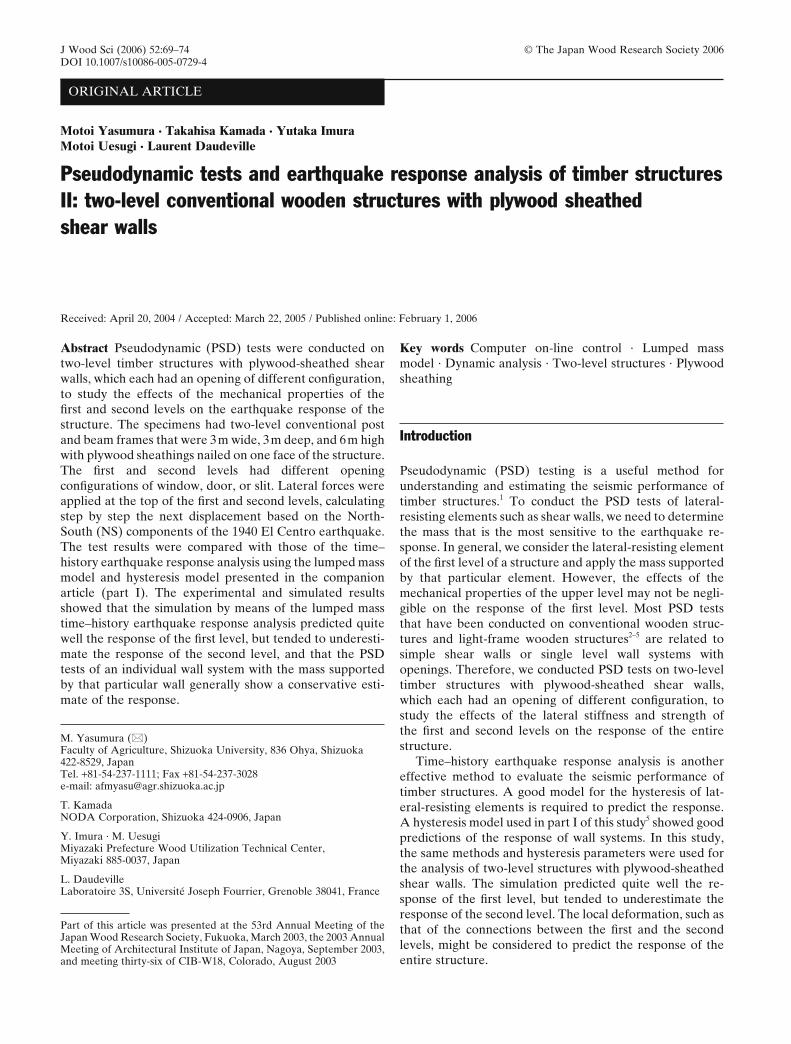
Figure 1 gives a general representation of the specimen andthe test setup. Specimens had two-level conventional postand beam frames that were 3m wide, 3m deep, and 6mhigh. Plywood sheathings were nailed on only one face ofthe structure.
The specimens consisted of 105 ¥ 105mm posts and sillsand 105 ¥ 210mm beams of spruce (Picea spp.) glued lami-nated timber. Posts placed every 1000mm were connectedto the sill and the beam with a steel pipe of 26.5mm diam-eter and hold-down connections (HD-B15).6 Two hold-down connections were attached at the foot of the first-levelposts and one at the top connected to another hold-downconnection at the foot of the second-level posts. Sills wereattached tightly to a steel base frame with 16-mm-diameterbolts. Lauan plywood (7.5mm thick, JAS Grade I) wasnailed on one side of the frame with N50 common nails atintervals of 150mm. Steel braces of 16mm diameter wereattached in vertical and horizontal frames perpendicular tothe loading direction. No lateral-resisting elements wereattached in the vertical frame opposite the frame sheathedwith plywood. The wall panels had an opening, which wasone of three different configurations, at the center of thewall. Wall system W had an opening that was 1000mm wideand 1000mm high, wall system D an opening with dimen-sions of 1000mm wide and 2000mm high, and wall system(S) had an opening that was 1000mm wide and continuedfrom the sill to the top beam.
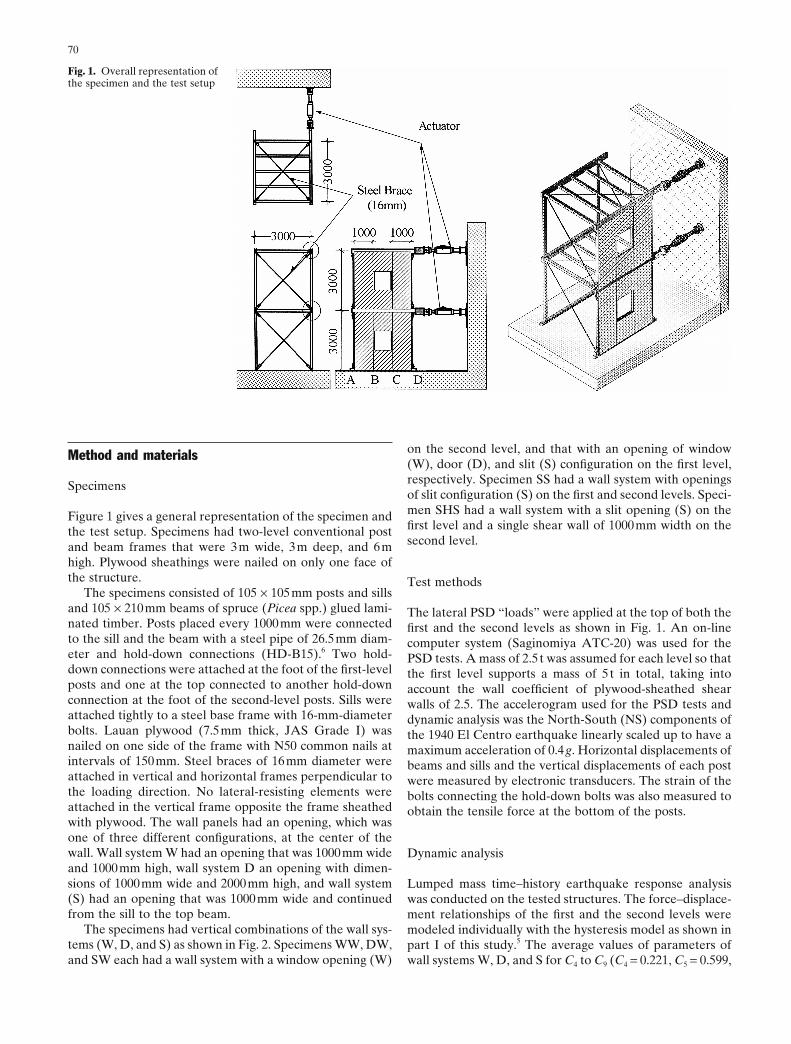
The specimens had vertical combinations of the wall sys-tems (W, D, and S) as shown in Fig. 2. Specimens WW, DW,and SW each had a wall system with a window opening (W)
on the second level, and that with an opening of window(W), door (D), and slit (S) configuration on the first level,respectively. Specimen SS had a wall system with openingsof slit configuration (S) on the first and second levels. Speci-men SHS had a wall system with a slit opening (S) on thefirst level and a single shear wall of 1000mm width on thesecond level.
Test methods
The lateral PSD “loads” were applied at the top of both thefirst and the second levels as shown in Fig. 1. An on-linecomputer system (Saginomiya ATC-20) was used for thePSD tests. A mass of 2.5 t was assumed for each level so thatthe first level supports a mass of 5 t in total, taking intoaccount the wall coefficient of plywood-sheathed shearwalls of 2.5. The accelerogram used for the PSD tests anddynamic analysis was the North-South (NS) components ofthe 1940 El Centro earthquake linearly scaled up to have amaximum acceleration of 0.4g. Horizontal displacements ofbeams and sills and the vertical displacements of each postwere measured by electronic transducers. The strain of thebolts connecting the hold-down bolts was also measured toobtain the tensile force at the bottom of the posts.
Dynamic analysis
Lumped mass time–history earthquake response analysiswas conducted on the tested structures. The force–displace-ment relationships of the first and the second levels weremodeled individually with the hysteresis model as shown inpart I of this study.5 The average values of parameters ofwall systems W, D, and S for C4 to C9 (C4 = 0.221, C5 = 0.599,
Fig. 1. Overall representation ofthe specimen and the test setup
71
C6 = 0.123, C7 = 0.319, C8 = 0.0281, C9 = 0.823) were used forall wall systems regardless of the configuration to simplifythe simulation. This procedure simplifies the modeling ofmore complicated structures composed of the same types ofwall systems. For the parameters P0, C1, C2, and C3, the samevalues as the corresponding wall systems were used exceptfor the wall system of the second level of the specimen SHS.The parameters P0, C1, C2, and C3 of the wall system (S)were divided by two for those of the wall system of thesecond level of the specimen SHS, while the other param-eters C4 to C9 were kept the same as those of the other wallsystems.
Results and discussion
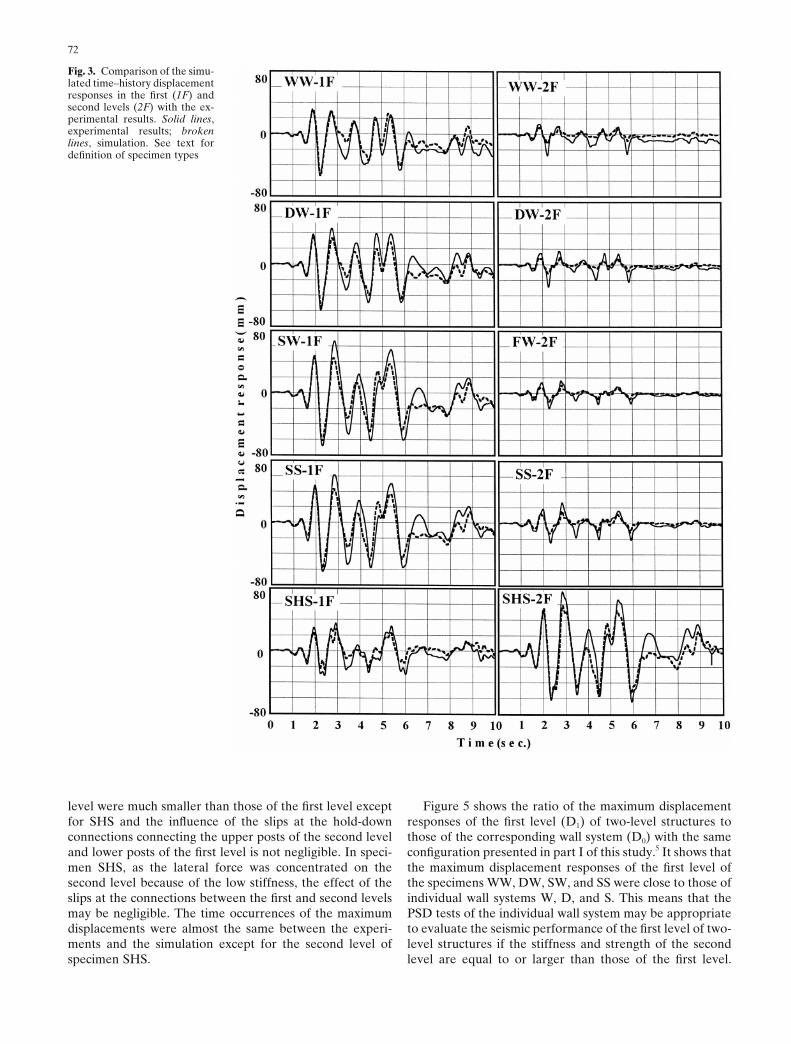
Figure 3 shows the comparison of the simulated time–history displacement response at the top of the first andsecond levels with the experimental results. Figure 4 showsthe comparison of the simulated lateral force–displacementrelationships at the first and second levels with the experi-mental results. The simulated maximum displacement re-sponses are also compared with the experimental results inTable 1. The parenthetic values under the responses in thetable are the time occurrences of the maximum displace-ments in seconds. These results show that the simulateddisplacement responses of the first level agreed quite wellwith the experimental results, while the simulated responsesof the second level were approximately 50% smaller thanthe experimental results except for specimen SHS. This isprobably because the displacement responses of the second
Fig. 2. Configurations ofspecimens
72
Fig. 3. Comparison of the simu-lated time–history displacementresponses in the first (1F) andsecond levels (2F) with the ex-perimental results. Solid lines,experimental results; brokenlines, simulation. See text fordefinition of specimen types
level were much smaller than those of the first level exceptfor SHS and the influence of the slips at the hold-downconnections connecting the upper posts of the second leveland lower posts of the first level is not negligible. In speci-men SHS, as the lateral force was concentrated on thesecond level because of the low stiffness, the effect of theslips at the connections between the first and second levelsmay be negligible. The time occurrences of the maximumdisplacements were almost the same between the experi-ments and the simulation except for the second level ofspecimen SHS.
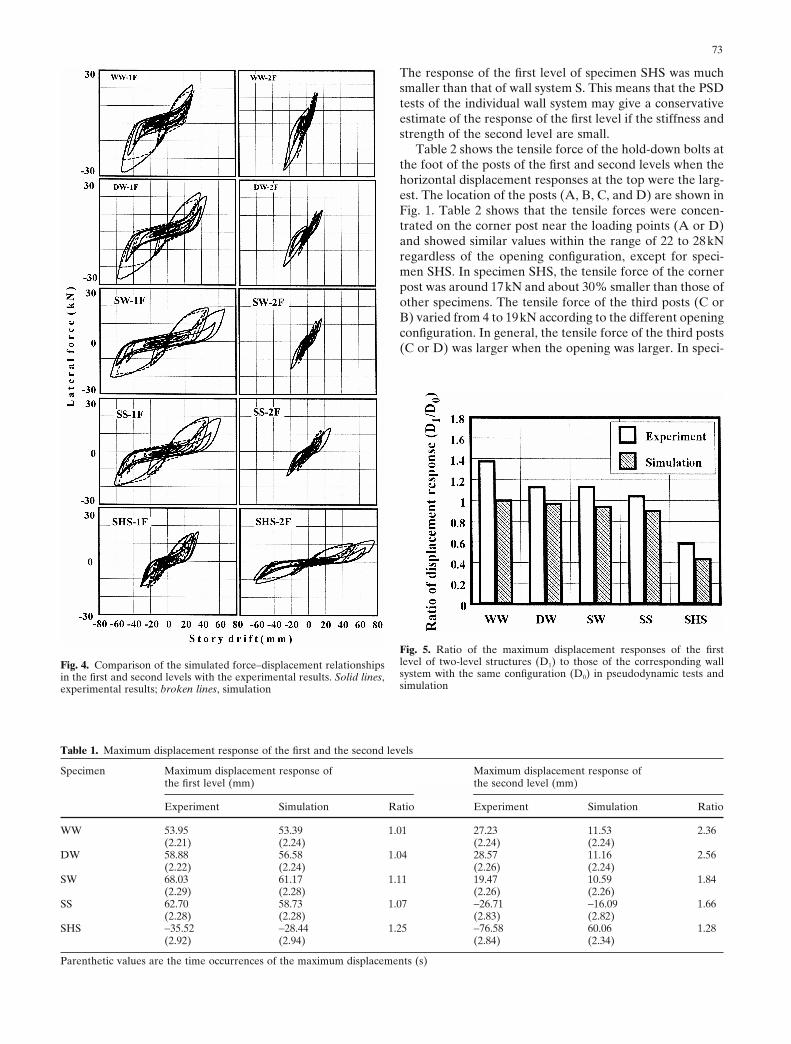
Figure 5 shows the ratio of the maximum displacementresponses of the first level (D1) of two-level structures tothose of the corresponding wall system (D0) with the sameconfiguration presented in part I of this study.5 It shows thatthe maximum displacement responses of the first level ofthe specimens WW, DW, SW, and SS were close to those ofindividual wall systems W, D, and S. This means that thePSD tests of the individual wall system may be appropriateto evaluate the seismic performance of the first level of two-level structures if the stiffness and strength of the secondlevel are equal to or larger than those of the first level.
73
Fig. 4. Comparison of the simulated force–displacement relationshipsin the first and second levels with the experimental results. Solid lines,experimental results; broken lines, simulation
Table 1. Maximum displacement response of the first and the second levels
Specimen Maximum displacement response of Maximum displacement response ofthe first level (mm) the second level (mm)
Experiment Simulation Ratio Experiment Simulation Ratio
WW 53.95 53.39 1.01 27.23 11.53 2.36(2.21) (2.24) (2.24) (2.24)
DW 58.88 56.58 1.04 28.57 11.16 2.56(2.22) (2.24) (2.26) (2.24)
SW 68.03 61.17 1.11 19.47 10.59 1.84(2.29) (2.28) (2.26) (2.26)
SS 62.70 58.73 1.07 -26.71 -16.09 1.66(2.28) (2.28) (2.83) (2.82)
SHS -35.52 -28.44 1.25 -76.58 60.06 1.28(2.92) (2.94) (2.84) (2.34)
Parenthetic values are the time occurrences of the maximum displacements (s)
Fig. 5. Ratio of the maximum displacement responses of the firstlevel of two-level structures (D1) to those of the corresponding wallsystem with the same configuration (D0) in pseudodynamic tests andsimulation
The response of the first level of specimen SHS was muchsmaller than that of wall system S. This means that the PSDtests of the individual wall system may give a conservativeestimate of the response of the first level if the stiffness andstrength of the second level are small.
Table 2 shows the tensile force of the hold-down bolts atthe foot of the posts of the first and second levels when thehorizontal displacement responses at the top were the larg-est. The location of the posts (A, B, C, and D) are shown inFig. 1. Table 2 shows that the tensile forces were concen-trated on the corner post near the loading points (A or D)and showed similar values within the range of 22 to 28kNregardless of the opening configuration, except for speci-men SHS. In specimen SHS, the tensile force of the cornerpost was around 17kN and about 30% smaller than those ofother specimens. The tensile force of the third posts (C orB) varied from 4 to 19kN according to the different openingconfiguration. In general, the tensile force of the third posts(C or D) was larger when the opening was larger. In speci-
74
men SHS, the tensile force of post B was somehow verysmall in the positive loading direction (D to A) and that ofpost C was very large (107% of post A) in the negativeloading direction (A to D). This is because the tensile forceof the post of the second level was transmitted to the post ofthe first level with the hold-down connections connectingthe foot of the posts of the second level to the top of thoseon the first level.
Conclusions
The following conclusions were made from the experimen-tal and analytical studies:
1. PSD tests of an individual wall system with the masssupported by that particular wall generally show conser-vative estimates of the response. It is supposed that thismethod is appropriate to evaluate the seismic perfor-mance of the shear walls of the first level, which is themost critical during the earthquake.
2. The simulation by lumped mass time–history earthquakeresponse analysis using the hysteresis model and the pa-rameters shown in part I of this study5 predicted quitewell the response of the first level, but tended to under-estimate the response of the second level. Further stud-ies may be necessary to predict the seismic response ofentire structures, considering such local deformation asthe connection between the first and the second levels.7
3. The tensile forces were concentrated on the corner postnear the loading points and showed similar values withinthe range of 22 to 28kN regardless of the openingconfiguration, except for specimen SHS. The tensile
force of the third posts (C or B) varied from 4 to 19kNaccording to the different opening configuration.Because the effects of reducing the tensile force of thejoints at the foot of inner posts are negligible, theyshould be considered in the design of joints connectingthe posts to the sill.8
Acknowledgments The research was supported by Grants-in-Aid forScientific Research “Category C” of Monbu Kagakusho and JapanSociety for the Promotion of Science (JSPS).
References
1. Shing PB, Nakashima M, Bursi OS (1996) Application ofpseudodynamic test method to structural research. EarthquakeSpectra 12:29–56
2. Kamiya F, Sugimoto K, Mii N (1996) Pseudo dynamic test ofsheathed wood walls. In: Proceedings of the 1996 IWEC, NewOrleans, USA, Omnipress, Madison, vol 2, pp 2.187–2.194
3. Kawai N (1998) Pseudo-dynamic test on shear walls. In: Proceedingsof the 1998 WCTE, Montreux, Switzerland, Press Polytechniques etUniversitaires Romandes, pp 412–419
4. Yasumura M (2001) Evaluation of damping capacity of timberstructures for seismic design. In: Proceedings of the 34th CIB-W18,Venice, Italy, paper 34-15-3, pp 1–9
5. Yasumura M, Yasui S (2006) Pseudodynamic tests and earthquakeresponse analysis of timber structures I: plywood-sheathed conven-tional wooden walls with opening. J Wood Sci DOI 10.1007/s10086-005-0728-5
6. HOWTEC (2003) Standard for mechanical joints (Z-mark connec-tors) (in Japanese), Housing and Wood Technical Center of Japan,Tokyo
7. Richard N, Yasumura M, Davenne L (2003) Prediction of seismicbehavior of wood-framed shear walls with openings by pseudo-dynamic test and FE model. J Wood Sci 49:145–151
8. Andreason S, Yasumura M, Daudeville L (2002) Sensitivity study ofthe finite element model for wood-framed shear walls. J Wood Sci48:171–178
Table 2. Tensile force of the hold-down connections at the foot of the posts of the first level for the maximum horizontal displacement at the topof the specimens
Specimen Loading Lateral force (kN) Tensile force of hold down (kN) at the first floor Ratiodirection
First level Second level A B C DB/D or C/A
WW D to A -7.31 -17.52 — 4.28 — 26.56 0.16A to D 10.28 11.00 22.04 — 6.73 — 0.31
DW D to A -4.08 -18.84 — 13.02 — 27.66 0.47A to D 6.98 13.08 21.78 — 14.94 — 0.69
SW D to A -5.79 -14.47 — 12.19 — 24.78 0.49A to D 7.98 10.59 21.63 — 18.77 — 0.87
SS D to A -3.24 -13.62 — 9.69 — 22.33 0.43A to D 4.21 13.42 25.02 — 19.48 — 0.78
SHS D to A 3.12 -11.42 — 0.44 — 17.90 0.02A to D 7.48 8.47 16.89 — 18.01 — 1.07
Location of the posts (A, B, C, and D) are shown in Fig. 1


![Identifi steel concrete moment-resisting frame structure subject … · steel–concrete moment-resisting frame structure subject to pseudodynamic tests ... et al. [8] analysed a](https://img.pdfslide.net/doc/110x75/5e51c5a0ede02257ee0a1f1f/identii-steel-concrete-moment-resisting-frame-structure-subject-steelaconcrete.jpg)