Embed Size (px)
Citation preview
entropy
Article
Causal Shannon–Fisher Characterization ofMotor/Imagery Movements in EEG
Román Baravalle 1,2, Osvaldo A. Rosso 3,4,5 and Fernando Montani 1,2,*1 IFLYSIB, CONICET & Universidad Nacional de La Plata, La Plata 1900, Argentina;
[email protected] Departamento de Física, Facultad de Ciencias Exactas, UNLP Calle 49 y 115. C.C. 67,
La Plata 1900, Argentina3 Departamento de Informática en Salud, Hospital Italiano de Buenos Aires & CONICET,
Ciudad Autónoma de Buenos Aires C1199ABB, Argentina; [email protected] Instituto de Física, Universidade Federal de Alagoas (UFAL), Maceió 57072-900, Brazil5 Complex Systems Group, Facultad de Ingeniería y Ciencias Aplicadas, Universidad de los Andes,
Santiago 12455, Chile* Correspondence: [email protected]
Received: 24 July 2018; Accepted: 30 August 2018; Published: 2 September 2018
Abstract: The electroencephalogram (EEG) is an electrophysiological monitoring method that allowsus to glimpse the electrical activity of the brain. Neural oscillations patterns are perhaps the bestsalient feature of EEG as they are rhythmic activities of the brain that can be generated by interactionsacross neurons. Large-scale oscillations can be measured by EEG as the different oscillation patternsreflected within the different frequency bands, and can provide us with new insights into brainfunctions. In order to understand how information about the rhythmic activity of the brain duringvisuomotor/imagined cognitive tasks is encoded in the brain we precisely quantify the differentfeatures of the oscillatory patterns considering the Shannon–Fisher plane H × F. This allows us todistinguish the dynamics of rhythmic activities of the brain showing that the Beta band facilitateinformation transmission during visuomotor/imagined tasks.
Keywords: EEG signals; brain oscillation patterns; bandt and pompe methodology; Fisherinformation and Shannon entropy
PACS: 02.50.-r; 05.45.Tp; 87.19.La
1. Introduction
The problem of finding a thesaurus for brain activity is a central issue in cognitive sciences.This involves the coding and decoding of the brain activity, and, in some way, the search for the intrinsic“language” of the brain. This issue is important not only at the theoretical level, but also for its potentialsapplications. For instance, there exists communication systems named brain–computer interfaces (BCI)that allows a direct communication pathway between an enhanced or wired brain and an externaldevice [1–12]. This kind of technology systems generates a new communication channel between thebrain and a computer. For two reasons, the way of BCI communication cannot be completely arbitrary.First, the BCI use allows the user to dispatch specific directives to computers through brain signalsalone [11]. Second, the brain signals are measured taking advantage of electroencephalography (EEG),and thereafter they are handled by the BCI [11].
A useful tool for detecting and understanding brain communication is EEG. EEG signals depict theelectrical activity that takes place at the cortex, and provide an important instrument for understandinga variety of cognitive processes [13]. The EEG are the product of synchronized activity of the brain
Entropy 2018, 20, 660; doi:10.3390/e20090660 www.mdpi.com/journal/entropy
Entropy 2018, 20, 660 2 of 18
and variations in EEG oscillations patterns reflect the underlying changes in neuronal synchrony.Different brain activity patterns are related to attention. Measures of the relative contribution of EEGoscillations are particularly useful to investigate the emergent properties of the rhythmic activities of thebrain [13]. The electrical activity of the brain can be considered chaotic and ruled by a nonlineardynamics, therefore extracting information from this can be a difficult issue. Hence, we need to usemeasures that could account for the intrinsic dynamics of chaotic and highly nonlinear systems [13–16].
Let us emphasize that there is no theoretical basis for selecting which signal feature is themost useful for BCI communication [1–7,12,14]. In this sense, gaining further understanding ofhow information is encoded in the brain is very important. For instance, studies have shown thatparticular imagined tasks, for example hand movements, have measurable consequences on criticalbrain signals. This quality can be used for communicate intentions simply using imagery movements.Importantly, human subjects exhibit considerable oscillations in the Alpha1 ∈ [8, 10) Hz andAlpha2 ∈ [10, 13) Hz bands of the EEG recorded over sensorimotor areas when they are not doingany motor action, in sensory processing, or in imaginations of these actions or processing. Duringseveral years, these rhythms (called mu rhythms) remained undetected in many human subjects,but computer-based analyses made possible to find out their presence in most of the subjects. The murhythm is also associated also with the Beta rhythms (Beta1 ∈ [13, 18) Hz and Beta 2 ∈ [13, 31) Hz).While some of these beta rhythms are harmonics of mu rhythms, some are separable by topographyand/or timing from mu rhythms, so they are independent EEG features. Other useful tool for detectingimportant features of brain signals, and that also can be used for BCI, is the electrocorticography (ECoG),which is less noisy and has more bandwidth than EEG. It has been found through these techniquesthat the mu/beta rhythms also decreases with motor or imagery motor tasks [1–7]. Furthermore,the activity in the gamma range (Gamma 1 ∈ [31, 41) Hz and Gamma 2 ∈ [41, 50) Hz) has been foundto increase during this experimental conditions [1–7]. With some exceptions, task-related changes inthese band are difficult to be detected in the EEG signals, mainly because these higher frequencies arenoisier and more affected by muscular artifacts than the other bands.
Movement or preparation for movement, and also motor imagery, changes the mu and betarhythms. These tasks produces a decrease of these rhythms. Because the human subjects can changethese rhythms without engaging in actual movements, these rhythms could serve as the basis fora BCI [8–11]. They have an easy implementation, the lowest cost and ubiquity among health professionals,and therefore the EEG is a preferred tool to measure brain activity. And in this paradigm, the study of thebrain rhythms are fundamental, mainly because these rhythms are, in some sense, the “language” wecan detect with this technique. In this paper, thus, we use subtle measures coming from InformationTheory to quantify the intrinsic dynamics of these rhythms. We focus on the Fisher Informationmeasures, F, that are of central importance for an assessment of the accuracy of the relevant signalfeatures (or parameters) being estimated. Importantly, the use of this Fisher permutation measure incombination with the permutation entropy, H, allows us to define the H × F causality informationplane [17–21] a very useful tool to determine the more relevant rhythms, and negligible ones, for theparticular experimental setup being analyzed in this paper.
2. Methodology
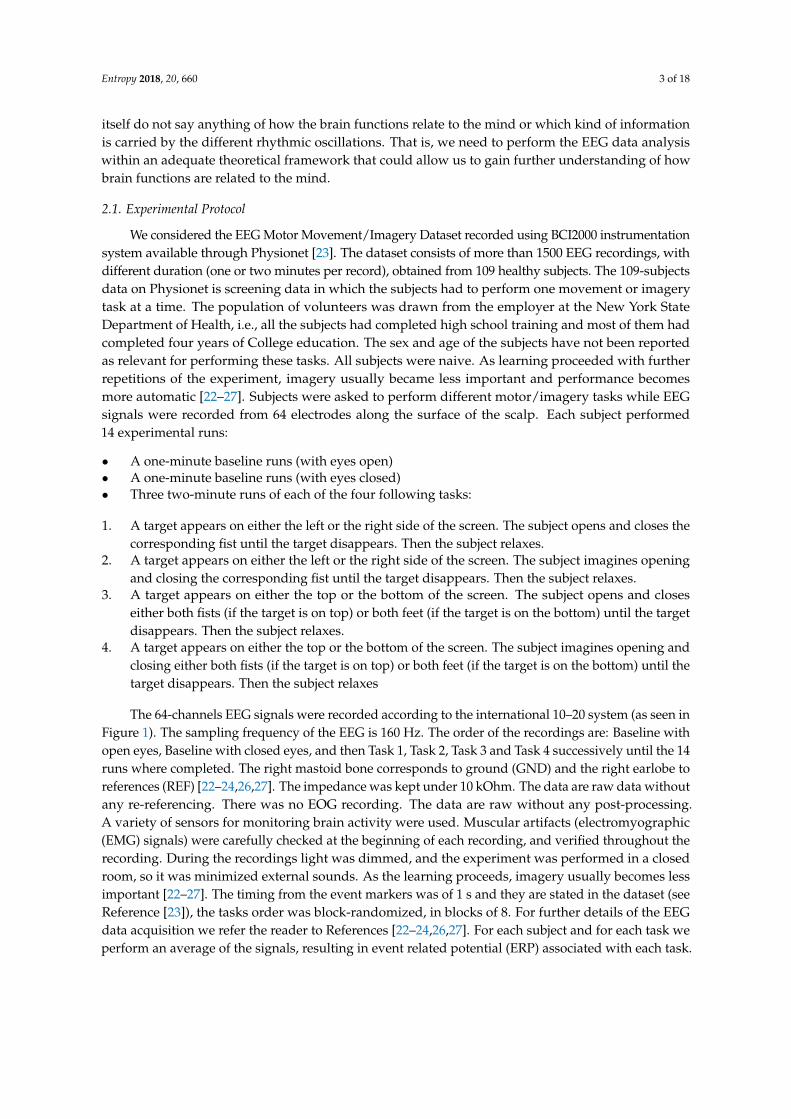
The experimental setup of the BCI2000 system [11,22] is shown in Figure 1 that includes anarrangement of 64 electrodes used to record the electrical activity of the brain recorded through theEEG signals while the subjects perform different tasks, of visuomotor or imagery characteristics.
The electrical signals from the brain are picked up by small electrodes that are placed on thesubject’s head. The electrodes only record the electrical activity of the brain and importantly they donot inject electrical current into the brain. The electrodes record the electrical activity from small areasof the brain.
The EEG bands allows us to gain further insights about the brain function, and look for thepresence or absence of specific brain signals in specific areas of the brain. However, EEG raw signals by
Entropy 2018, 20, 660 3 of 18
itself do not say anything of how the brain functions relate to the mind or which kind of informationis carried by the different rhythmic oscillations. That is, we need to perform the EEG data analysiswithin an adequate theoretical framework that could allow us to gain further understanding of howbrain functions are related to the mind.
2.1. Experimental Protocol
We considered the EEG Motor Movement/Imagery Dataset recorded using BCI2000 instrumentationsystem available through Physionet [23]. The dataset consists of more than 1500 EEG recordings, withdifferent duration (one or two minutes per record), obtained from 109 healthy subjects. The 109-subjectsdata on Physionet is screening data in which the subjects had to perform one movement or imagerytask at a time. The population of volunteers was drawn from the employer at the New York StateDepartment of Health, i.e., all the subjects had completed high school training and most of them hadcompleted four years of College education. The sex and age of the subjects have not been reportedas relevant for performing these tasks. All subjects were naive. As learning proceeded with furtherrepetitions of the experiment, imagery usually became less important and performance becomesmore automatic [22–27]. Subjects were asked to perform different motor/imagery tasks while EEGsignals were recorded from 64 electrodes along the surface of the scalp. Each subject performed14 experimental runs:
• A one-minute baseline runs (with eyes open)• A one-minute baseline runs (with eyes closed)• Three two-minute runs of each of the four following tasks:
1. A target appears on either the left or the right side of the screen. The subject opens and closes thecorresponding fist until the target disappears. Then the subject relaxes.
2. A target appears on either the left or the right side of the screen. The subject imagines openingand closing the corresponding fist until the target disappears. Then the subject relaxes.
3. A target appears on either the top or the bottom of the screen. The subject opens and closeseither both fists (if the target is on top) or both feet (if the target is on the bottom) until the targetdisappears. Then the subject relaxes.
4. A target appears on either the top or the bottom of the screen. The subject imagines opening andclosing either both fists (if the target is on top) or both feet (if the target is on the bottom) until thetarget disappears. Then the subject relaxes
The 64-channels EEG signals were recorded according to the international 10–20 system (as seen inFigure 1). The sampling frequency of the EEG is 160 Hz. The order of the recordings are: Baseline withopen eyes, Baseline with closed eyes, and then Task 1, Task 2, Task 3 and Task 4 successively until the 14runs where completed. The right mastoid bone corresponds to ground (GND) and the right earlobe toreferences (REF) [22–24,26,27]. The impedance was kept under 10 kOhm. The data are raw data withoutany re-referencing. There was no EOG recording. The data are raw without any post-processing.A variety of sensors for monitoring brain activity were used. Muscular artifacts (electromyographic(EMG) signals) were carefully checked at the beginning of each recording, and verified throughout therecording. During the recordings light was dimmed, and the experiment was performed in a closedroom, so it was minimized external sounds. As the learning proceeds, imagery usually becomes lessimportant [22–27]. The timing from the event markers was of 1 s and they are stated in the dataset (seeReference [23]), the tasks order was block-randomized, in blocks of 8. For further details of the EEGdata acquisition we refer the reader to References [22–24,26,27]. For each subject and for each task weperform an average of the signals, resulting in event related potential (ERP) associated with each task.
Entropy 2018, 20, 660 4 of 18
Figure 1. 64 electrodes used to record the electrical activity of the brain recorded through the EEGsignals (as in [11]).
The sampling frequency of the EEG are 160 Hz. But because of the high frequency artifactsthat blurred the EEG, and to remove fluctuations at DC level and increase the signal resolution,the records where filtered first between 1–50 Hz using a filter based on the Kaiser window developedby Belitski et al., [28], with sharp transition bandwidth (0.1 Hz), small passband ripple (0.05 dB),and high stopband attenuation (60 dB).
After this filtering, a bandpass filtering were made. The bands in consideration are statedin Table 1.
Table 1. Frequency bands analysed.
Band Frequency Interval (Hz)
Delta [1, 4)Theta [4, 8)
Alpha 1 [8, 10)Alpha 2 [10, 13)Beta 1 [13, 18)Beta 2 [18, 31)
Gamma 1 [31, 41)Gamma 2 [41, 50)
Each signal has 20,000 points, thus this large number of points guarantees a good statistics for theBandt and Pompe estimations considering an embedding dimension D = 6 (see Section 2.3).
2.2. Shannon Entropy and Fisher Information Measure
Sequences of measurements (or observations) constitute the basic elements for the study of naturalphenomena. In particular, from these sequences, commonly called time series, one should judiciouslyextract information on the underlying dynamical systems under study. We can define an InformationTheory quantifier as a measure that is able to characterize some property of the probability distributionfunction (PDF) associated with these time series of a given row signal (i.e., EEG). Entropy, regarded asa measure of uncertainty, is the most paradigmatic example of these quantifiers.
Given a time series X (t) ≡ {xt; t = 1, · · · , M}, a set of M measures of the observable X and theassociated PDF, given by P ≡ {pj; j = 1, · · · , N} with ∑N
j=1 pj = 1 and N the number of possible states
Entropy 2018, 20, 660 5 of 18
of the system under study, the Shannon’s logarithmic information measure (Shannon entropy) [29] isdefined by
S[P] = −N
∑j=1
pj ln(pj) . (1)
This functional is equal to zero when we are able to predict with full certainty which of thepossible outcomes j, whose probabilities are given by pj, will actually take place. Our knowledge of theunderlying process, described by the probability distribution, is maximal in this instance. In contrast,this knowledge is commonly minimal for a uniform distribution Pe = {pj = 1/N, ∀j = 1, · · · , N}.
The Shannon entropy S is a measure of “global character” that is not too sensitive to strongchanges in the PDF taking place in small region. This is not the case with the Fisher informationmeasure [30,31]
F[ f ] =∫ |~∇ f (x)|2
f (x)dx , (2)
which constitutes a measure of the gradient content of the distribution f (continuous PDF), thus beingquite sensitive even to tiny localized perturbations.
The Fisher information measure can be variously interpreted as a measure of the ability to estimatea parameter, as the amount of information that can be extracted from a set of measurements, and alsoas a measure of the state of disorder of a system or phenomenon [31,32], its most important propertybeing the so-called Cramer-Rao bound. It is important to remark that the gradient operator significantlyinfluences the contribution of minute local f -variations to the Fisher information value, so that thequantifier is called a “local” one. Note that Shannon entropy decreases with skewed distribution, whileFisher information increases in such a case. Local sensitivity is useful in scenarios whose descriptionnecessitates an appeal to a notion of “order” [33–35]. The concomitant problem of loss of informationdue to the discretization has been thoroughly studied (see, for instance, [36–38] and references therein)and, in particular, it entails the loss of Fisher’s shift-invariance, which is of no importance for ourpresent purposes. For Fisher information measure computation (discrete PDF) we follow the proposalof Dehesa and coworkers [39] based on amplitude of probability f (x) = ψ(x)2 then
F[ψ] = 4∫ {
dψ
dx
}2dx . (3)
Its discrete normalized version (0 ≤ F ≤ 1) is now
F[P] = F0
N−1
∑i=1
(√
pi+1 −√
pi)2 . (4)
Here the normalization constant F0 reads
F0 =
{1 if pi∗ = 1 for i∗ = 1 or i∗ = N and pi = 0 ∀i 6= i∗
1/2 otherwise. (5)
If our system lies in a very ordered state, we can think it describe by a PDF given byP0 = {pk
∼= 1; pi∼= 0 ∀ i 6= k; i = 1, · · · , N} (with N, the number of states of the system) in
consequence we have a Shannon entropy S[P0] ∼= 0 and a normalized Fisher’s information measureF[P0] ∼= Fmax = 1. On the other hand, when the system under study is represented by a verydisordered state, one can think this particular state is described by a PDF given by the uniformdistribution Pe = {pi = 1/N ∀ i = 1, · · · , N} we obtain S[Pe] ∼= Smax while F[Pe] ∼= 0. One canstate that the general behavior of the Fisher information measure is opposite to that of the Shannonentropy [40].
Entropy 2018, 20, 660 6 of 18
2.3. The Bandt–Pompe Approach to the PDF Determination
The study and characterization of time series X (t) by recourse to Information Theory toolsassume that the underlying PDF is given a priori. In contrast, part of the concomitant analysisinvolves extracting the PDF from the data and there is no univocal procedure with which everyoneagrees. Almost ten years ago Bandt and Pompe (BP) introduced a successful methodology for theevaluation of the PDF associated with scalar time series data using a symbolization technique [41].For a didactic description of the approach, as well as, its main biomedical and econophysicsapplications, see Reference [42].
The pertinent symbolic data are (i) created by ranking the values of the series and (ii) defined byreordering the embedded data in ascending order, which is tantamount to a phase space reconstructionwith embedding dimension (pattern length) D and time lag τ. In this way it is possible to quantify thediversity of the ordering symbols (patterns) derived from a scalar time series.
Note that the appropriate symbol sequence arises naturally from the time series and nomodel-based assumptions are needed. In fact, the necessary “partitions” are devised by comparing theorder of neighboring relative values rather than by apportioning amplitudes according to differentlevels. This technique, as opposed to most of those in current practice, takes into account the temporalstructure of the time series generated by the physical process under study. This feature allows us touncover important details concerning the ordinal structure of the time series [35,43,44] and can alsoyield information about temporal correlation [17,18].
It is clear that this type of analysis of time series entails losing some details of the original series’amplitude information. Nevertheless, by just referring to the series’ intrinsic structure, a meaningfuldifficulty reduction has indeed been achieved by Bandt and Pompe with regard to the descriptionof complex systems. The symbolic representation of time series by recourse to a comparison ofconsecutive (τ = 1) or nonconsecutive (τ > 1) values allows for an accurate empirical reconstructionof the underlying phase-space, even in the presence of weak (observational and dynamic) noise [41].Furthermore, the ordinal patterns associated with the PDF is invariant with respect to nonlinearmonotonous transformations. Accordingly, nonlinear drifts or scaling artificially introduced bya measurement device will not modify the estimation of quantifiers, a nice property if one deals withexperimental data (see, e.g., [45]). These advantages make the Bandt and Pompe methodology moreconvenient than conventional methods based on range partitioning (i.e., PDF based on histograms).
Additional advantages of the method reside in (i) its simplicity, we need few parameters: thepattern length/embedding dimension D and the embedding delay τ, and (ii) the extremely fast natureof the pertinent calculation process [46]. The BP methodology can be applied not only to time seriesrepresentative of low dimensional dynamical systems, but also to any type of time series (regular,chaotic, noisy, or reality based). In fact, the existence of an attractor in the D-dimensional phase spaceis not assumed. The only condition for the applicability of the Bandt–Pompe methodology is a veryweak stationary assumption (that is, for k ≤ D, the probability for xt < xt+k should not dependon t [41]).
To use the Bandt and Pompe [41] methodology for evaluating the PDF, P, associated with thetime series (dynamical system) under study, one starts by considering partitions of the pertinentD-dimensional space that will hopefully “reveal” relevant details of the ordinal structure of a givenone-dimensional time series X (t) = {xt; t = 1, · · · , M} with embedding dimension D > 1 (D ∈ N)and embedding time delay τ (τ ∈ N). We are interested in “ordinal patterns” of order (length)D generated by (s) 7→
(xs−(D−1)τ , xs−(D−2)τ , · · · , xs−τ , xs
), which assigns to each time s the
D-dimensional vector of values at times s, s− τ, · · · , s− (D− 1)τ. Clearly, the greater the D-value,is the more information on the past is incorporated into our vectors. By “ordinal pattern” relatedto the time (s) we mean the permutation π = (r0, r1, · · · , rD−1) of [0, 1, · · · , D − 1] defined byxs−rD−1τ ≤ xs−rD−2τ ≤ · · · ≤ xs−r1τ ≤ xs−r0τ . In order to get a unique result we set ri < ri−1 ifxs−ri = xs−ri−1 . This is justified if the values of xt have a continuous distribution so that equal valuesare very unusual. Thus, for all the D! possible permutations π of order D, their associated relative
Entropy 2018, 20, 660 7 of 18
frequencies can be naturally computed by the number of times this particular order sequence is foundin the time series divided by the total number of sequences.
Consequently, it is possible to quantify the diversity of the ordering symbols (patterns of length D)derived from a scalar time series, by evaluating the so-called permutation entropy, the permutationstatistical complexity and Fisher permutation information measure. Of course, the embeddingdimension D plays an important role in the evaluation of the appropriate probability distributionbecause D determines the number of accessible states D! and also conditions the minimum acceptablelength M� D! of the time series that one needs in order to work with reliable statistics [43].
Regarding to the selection of the parameters, Bandt and Pompe suggested working with 4 ≤ D ≤ 6and specifically considered an embedding delay τ = 1 in their cornerstone paper [41]. Nevertheless,it is clear that other values of τ could provide additional information. It has been recently shownthat this parameter is strongly related, if it is relevant, to the intrinsic time scales of the system underanalysis [47–49].
The Bandt and Pompe proposal for associating probability distributions to time series(of an underlying symbolic nature), constitutes a significant advance in the study of non lineardynamical systems [41]. The method provides univocal prescription for ordinary, global entropicquantifiers of the Shannon-kind. However, as was shown by Rosso and coworkers [34,35], ambiguitiesarise in applying the Bandt and Pompe technique with reference to the permutation of ordinalpatterns. This happens if one wishes to employ the BP-probability density to construct local entropicquantifiers, like Fisher information measure, that would characterize time series generated by nonlineardynamical systems.
The local sensitivity of Fisher information measure for discrete-PDFs is reflected in the fact thatthe specific “i-ordering” of the discrete values pi must be seriously taken into account in evaluatingthe sum in Equation (4). The pertinent numerator can be regarded as a kind of “distance” betweentwo contiguous probabilities. Thus, a different ordering of the pertinent summands would lead toa different Fisher information value. In fact, if we have a discrete PDF given by P = {pi, i = 1, · · · , N}we will have N! possibilities for the i-ordering.
The question is, which is the arrangement that one could regard as the “proper” ordering?The answer is straightforward in some cases, histogram-based PDF constituting a conspicuous example.For such a procedure one first divides the interval [a, b] (with a and b the minimum and maximumamplitude values in the time series) into a finite number on nonoverlapping sub-intervals (bins). Thus,the division procedure of the interval [a, b] provides the natural order-sequence for the evaluation ofthe PDF gradient involved in Fisher information measure. In our current paper, we chosen for theBandt–Pompe PDF the lexicographic ordering given by the algorithm of Lehmer [50], amongst otherpossibilities, due to it provide the better distinction of different dynamics in the Fisher vs Shannonplane (see [34,35]).
3. Results
Numerous studies have shown that EEGs allow subjects to use motor images to modulatethe rhythmic activity of different bands and thus control a BCI system (we refer the reader toReference [11]). That is the BCI systems use some especial characteristics of the brain signals tosummarize them into actions that will control a given output (i.e., a robotic arm). Rhythmic neuralactivity within Beta frequency band is modulated when healthy subjects performs different assignmentsthat involves realized or imagined movements. However, there are a many different rhythms of theneuronal activity that are dependent on the variety of sensory motor stimuli [13]. Cracking this neuralcode means inferring the feedback circuits of the neurons that contribute to cortical rhythmic activities,and understanding language and the communication among the neurons, how they synchronizes andtransmit information through the neuronal network [51–55]. Changes in these rhythms can provideus important feedback of how information is transmitted across neuronal populations. Here weuse EEG signals in combination with an information theoretical approach to investigate changes in
Entropy 2018, 20, 660 8 of 18
oscillatory power while healthy human participants performed different tasks, of motor or imagerycharacteristics that were recorded using the BCI2000 system [11,22–24,26,27]. We use a versatile methodto quantify the Causal Shannon Fisher information of the different oscillation bands of the EEG signals,taking advantage of a Bandt–Pompe symbolization that captures temporal causality features of thesignal [17–21]. More specifically, we consider measures accounting for the causal structure of the EEGsignals: the Shannon permutation entropy (H) and the Fisher information (F).
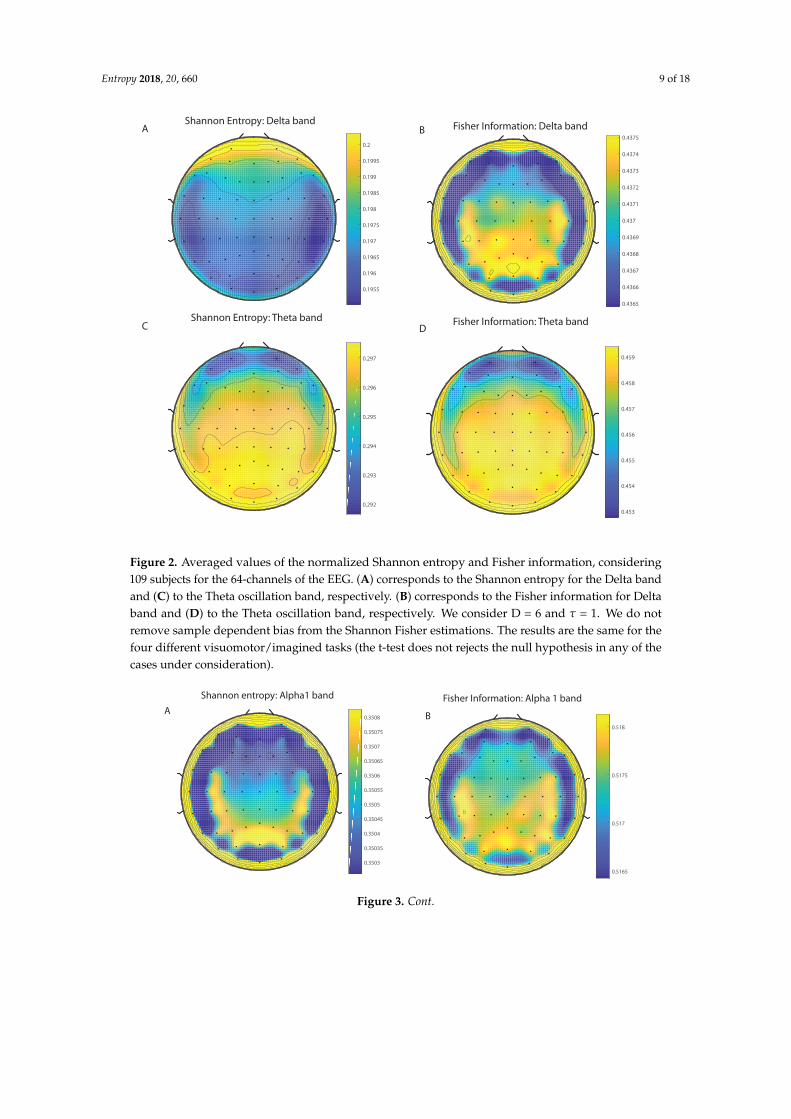
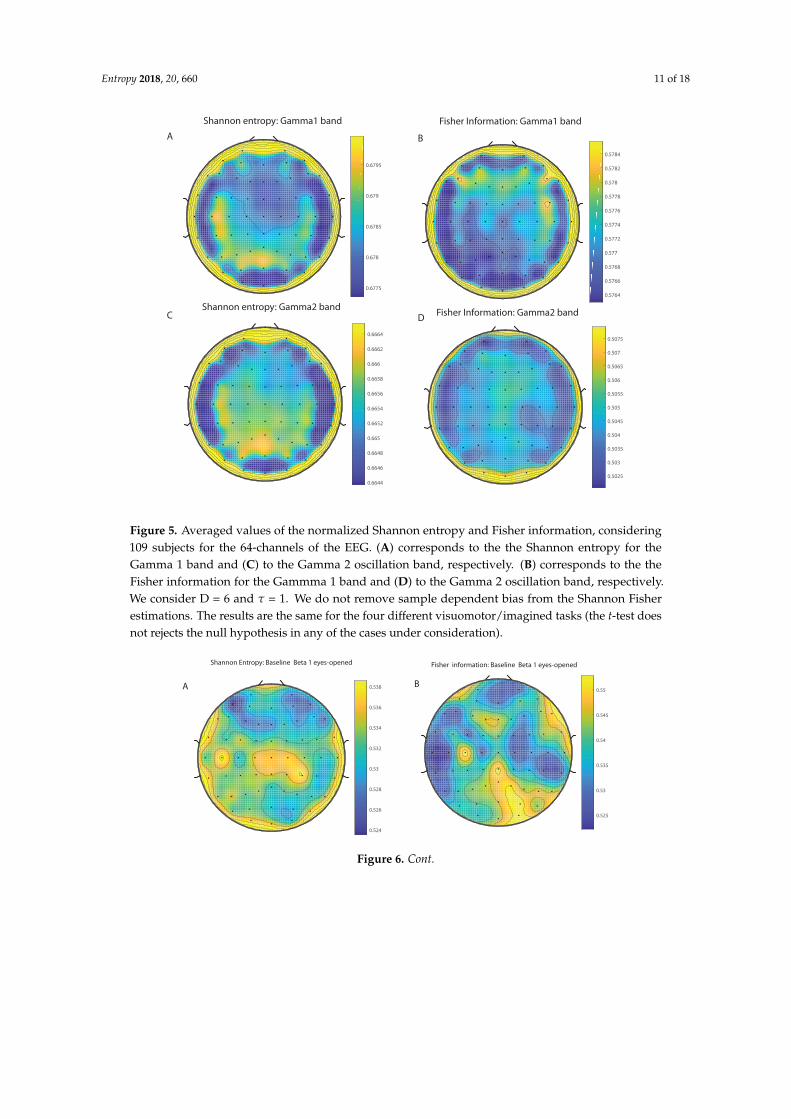
We take advantage of the wICA methodology to remove all the muscular and technical artifactsof the EEG as it has been previously performed in References [56–58]. We use thereafter a filterbased on the Kaiser window developed by Belitski et al., [28], to split the signal in the Delta, Theta,Alpha 1, Alpha 2, Beta 1, Beta 2, Gamma 1 and Gamma 2 oscillation bands (see Methodology forfurther details). In order to perform analyses within the BP formalism, we need to consider a largenumber of points of EEG responses (M� D!). We have 20000 data points for each case that is enoughsignal to get a trustable estimation of Shannon Fisher information. In this case, we do not use theNSB methodology (see Reference [59]) to remove sample size dependent bias from H × F estimationsdue to the large amount of data available, and the intricacy of the methodology when performing theFisher information estimations. We use the Bandt and Pompe [41] methodology for evaluating thePDF, P, associated with the time series, considering an embedding dimension D = 6 and time lagτ = 1. This embedding dimension (pattern length) is enough to efficiently capture the informationcausality of the ordinal structure of the time series [41]. Confidence error intervals cannot be providedwithin BP methodology. As we mentioned previously, the selection of the embedding dimension, D,is relevant for obtaining an appropriate probability distribution because D determines not only thenumber of accessible states (equal to D!) but also the length of the time series, M, needed to havea reliable statistics and therefore the requirement is that the condition M � D! must be satisfied.Let us remark that as this condition is well satisfied the results presented in this section has beenderived therefore without using a methodology to remove bias deviations from the entropy andFisher information estimations. Figures 2A,C and 3A,C show the averaged values of the normalizedShannon entropy considering 109 subjects for the 64-channels EEG considering the different oscillationbands Delta, Theta, Alpha 1 and Alpha 2, respectively. Figures 4A,C and 5A,C depict the normalizedShannon entropy for the same conditions but taking the Beta 1, Beta 2, Gamma 1 and Gamma 2bands, respectively. Shannon Entropy reach the maximum values within the Gamma 1 frequency bandand the minimum values for the Delta oscillation band, respectively. In order to understand how isencoded the rhythmic activity of the brain during visuomotor tasks we estimate the Fisher informationmeasure [17,18]. Figures 2B,D and 3B,D show the averaged estimations of the Fisher information underthe same conditions mentioned above for the Delta, Theta, Alpha 1 and Alpha 2 bands, respectively.Figures 4B,D and 5B,D depict the Fisher information when considering the Beta 1, Beta 2, Gamma1 and Gamma 2 bands, respectively. Notice that the Fisher information of the Beta 1 and Beta 2oscillation bands is prevalent, while the Fisher information of the Delta band is significantly curtailed.Our results are the same for the four different visuomotor / imagined tasks. Let us remark that theAlpha 1 and Alpha 2 bands depict a significantly much lower amount of Fisher information than theBeta bands. The baselines for the Beta bands with open/closed eyes are presented in Figures 6 and 7.Figures 6A,C and 7A,C depict the Shannon entropy of the baselines when considering the Beta 1 andBeta 2 bands, respectively. Figures 6B,D and 7B,D depict the Fisher information of the baselines whenconsidering the Beta 1 and Beta 2 bands, respectively. Notice that the baselines present lower Fisherinformation values than the realized movements.
Entropy 2018, 20, 660 9 of 18
0.1955
0.196
0.1965
0.197
0.1975
0.198
0.1985
0.199
0.1995
0.2
0.4365
0.4366
0.4367
0.4368
0.4369
0.437
0.4371
0.4372
0.4373
0.4374
0.4375
0.292
0.293
0.294
0.295
0.296
0.297
0.453
0.454
0.455
0.456
0.457
0.458
0.459
Shannon Entropy: Delta bandFisher Information: Delta band
Shannon Entropy: Theta band Fisher Information: Theta band
A B
C D
Figure 2. Averaged values of the normalized Shannon entropy and Fisher information, considering109 subjects for the 64-channels of the EEG. (A) corresponds to the Shannon entropy for the Delta bandand (C) to the Theta oscillation band, respectively. (B) corresponds to the Fisher information for Deltaband and (D) to the Theta oscillation band, respectively. We consider D = 6 and τ = 1. We do notremove sample dependent bias from the Shannon Fisher estimations. The results are the same for thefour different visuomotor/imagined tasks (the t-test does not rejects the null hypothesis in any of thecases under consideration).
0.3503
0.35035
0.3504
0.35045
0.3505
0.35055
0.3506
0.35065
0.3507
0.35075
0.3508
0.5165
0.517
0.5175
0.518
0.3979
0.398
0.3981
0.3982
0.3983
0.3984
0.3985
0.5578
0.558
0.5582
0.5584
0.5586
0.5588
0.559
0.5592
0.5594
0.5596
0.5598
Shannon entropy: Alpha1 band Fisher Information: Alpha 1 band
Shannon entropy: Alpha2 bandFisher Information: Alpha 2 band
AB
C DFigure 3. Cont.
Entropy 2018, 20, 660 10 of 180.3503
0.35035
0.3504
0.35045
0.3505
0.35055
0.3506
0.35065
0.3507
0.35075
0.3508
0.5165
0.517
0.5175
0.518
0.3979
0.398
0.3981
0.3982
0.3983
0.3984
0.3985
0.5578
0.558
0.5582
0.5584
0.5586
0.5588
0.559
0.5592
0.5594
0.5596
0.5598
Shannon entropy: Alpha1 band Fisher Information: Alpha 1 band
Shannon entropy: Alpha2 bandFisher Information: Alpha 2 band
AB
C D
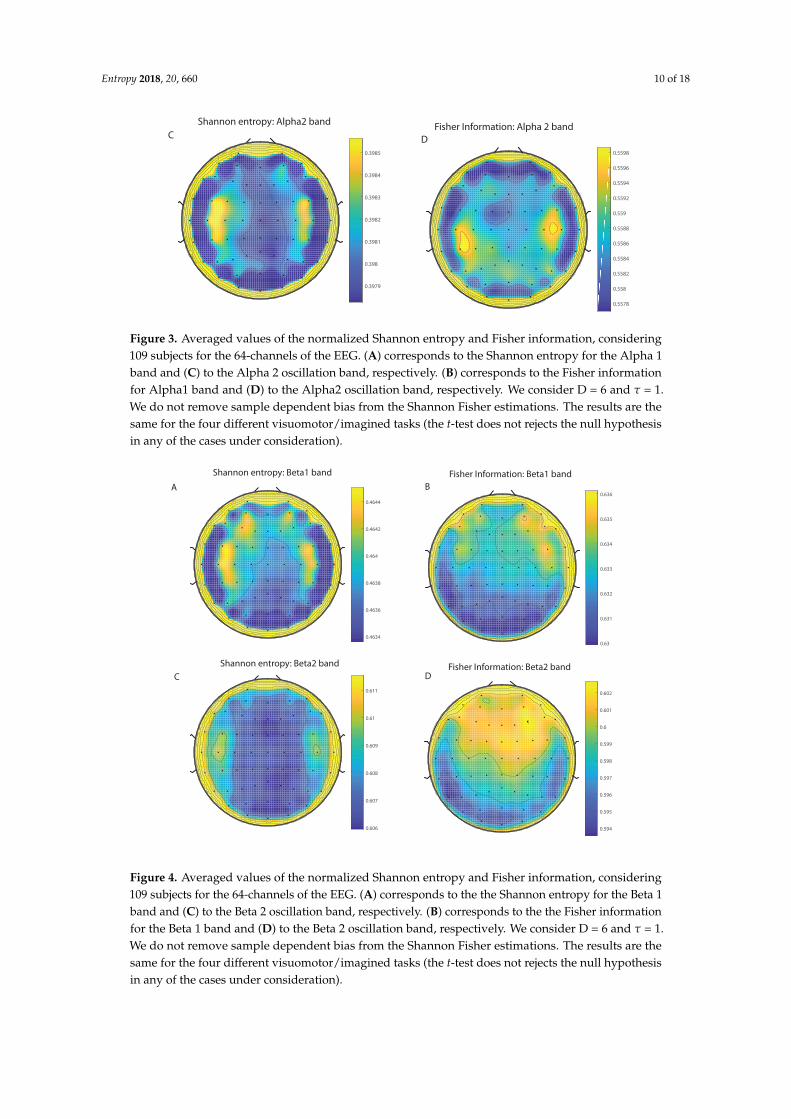
Figure 3. Averaged values of the normalized Shannon entropy and Fisher information, considering109 subjects for the 64-channels of the EEG. (A) corresponds to the Shannon entropy for the Alpha 1band and (C) to the Alpha 2 oscillation band, respectively. (B) corresponds to the Fisher informationfor Alpha1 band and (D) to the Alpha2 oscillation band, respectively. We consider D = 6 and τ = 1.We do not remove sample dependent bias from the Shannon Fisher estimations. The results are thesame for the four different visuomotor/imagined tasks (the t-test does not rejects the null hypothesisin any of the cases under consideration).
0.4634
0.4636
0.4638
0.464
0.4642
0.4644
0.63
0.631
0.632
0.633
0.634
0.635
0.636
0.606
0.607
0.608
0.609
0.61
0.611
0.594
0.595
0.596
0.597
0.598
0.599
0.6
0.601
0.602
Shannon entropy: Beta1 band Fisher Information: Beta1 band
Shannon entropy: Beta2 band Fisher Information: Beta2 band
A B
C D
Figure 4. Averaged values of the normalized Shannon entropy and Fisher information, considering109 subjects for the 64-channels of the EEG. (A) corresponds to the the Shannon entropy for the Beta 1band and (C) to the Beta 2 oscillation band, respectively. (B) corresponds to the the Fisher informationfor the Beta 1 band and (D) to the Beta 2 oscillation band, respectively. We consider D = 6 and τ = 1.We do not remove sample dependent bias from the Shannon Fisher estimations. The results are thesame for the four different visuomotor/imagined tasks (the t-test does not rejects the null hypothesisin any of the cases under consideration).
Entropy 2018, 20, 660 11 of 18
0.6775
0.678
0.6785
0.679
0.6795
0.5764
0.5766
0.5768
0.577
0.5772
0.5774
0.5776
0.5778
0.578
0.5782
0.5784
0.6644
0.6646
0.6648
0.665
0.6652
0.6654
0.6656
0.6658
0.666
0.6662
0.6664
0.5025
0.503
0.5035
0.504
0.5045
0.505
0.5055
0.506
0.5065
0.507
0.5075
Shannon entropy: Gamma1 band Fisher Information: Gamma1 band
Shannon entropy: Gamma2 bandFisher Information: Gamma2 band
A B
C D
Figure 5. Averaged values of the normalized Shannon entropy and Fisher information, considering109 subjects for the 64-channels of the EEG. (A) corresponds to the the Shannon entropy for theGamma 1 band and (C) to the Gamma 2 oscillation band, respectively. (B) corresponds to the theFisher information for the Gammma 1 band and (D) to the Gamma 2 oscillation band, respectively.We consider D = 6 and τ = 1. We do not remove sample dependent bias from the Shannon Fisherestimations. The results are the same for the four different visuomotor/imagined tasks (the t-test doesnot rejects the null hypothesis in any of the cases under consideration).
0.53
0.532
0.534
0.536
0.538
0.54
0.53
0.535
0.54
0.545
0.55
0.555
0.525
0.53
0.535
0.54
0.545
0.55
Fisher information: Baseline Beta 1 eyes-opened
Fisher Information: Baseline Beta 1 eyes-closed
0.524
0.526
0.528
0.53
0.532
0.534
0.536
0.538
Shannon Entropy: Baseline Beta 1 eyes-opened
Shannon Entropy: Baseline Beta 1 eyes-closed
A B
C DFigure 6. Cont.
Entropy 2018, 20, 660 12 of 18
0.53
0.532
0.534
0.536
0.538
0.54
0.53
0.535
0.54
0.545
0.55
0.555
0.525
0.53
0.535
0.54
0.545
0.55
Fisher information: Baseline Beta 1 eyes-opened
Fisher Information: Baseline Beta 1 eyes-closed
0.524
0.526
0.528
0.53
0.532
0.534
0.536
0.538
Shannon Entropy: Baseline Beta 1 eyes-opened
Shannon Entropy: Baseline Beta 1 eyes-closed
A B
C D
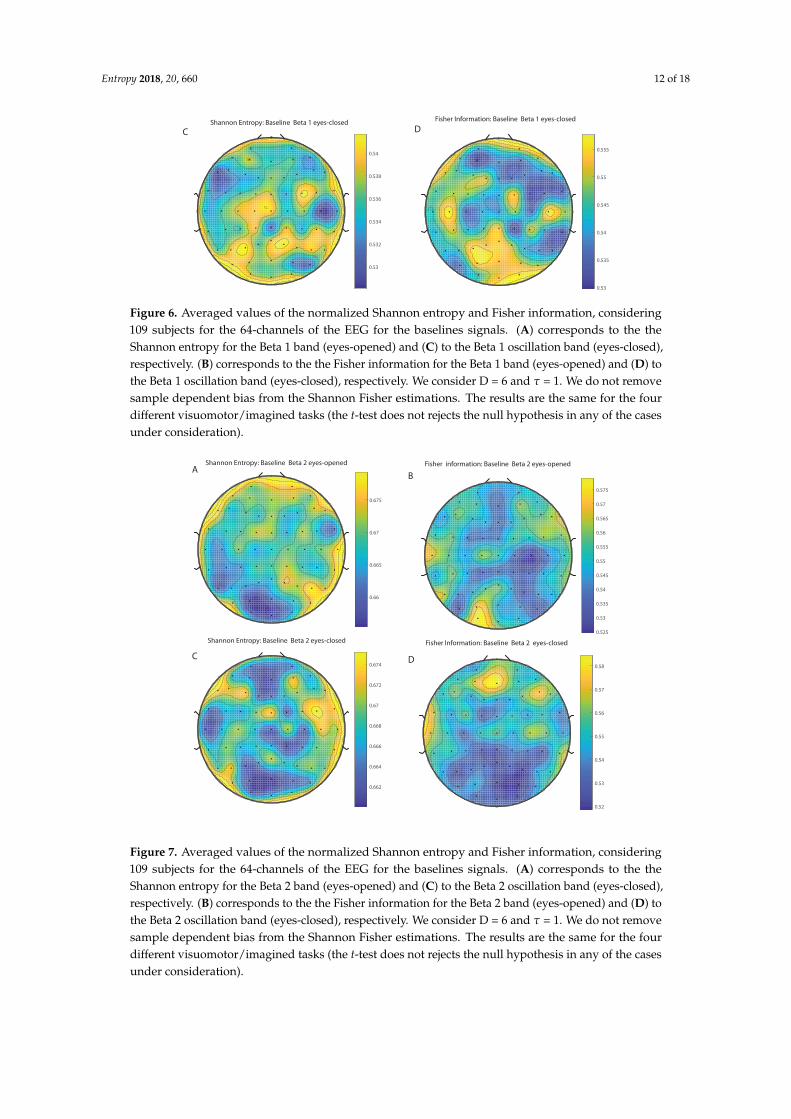
Figure 6. Averaged values of the normalized Shannon entropy and Fisher information, considering109 subjects for the 64-channels of the EEG for the baselines signals. (A) corresponds to the theShannon entropy for the Beta 1 band (eyes-opened) and (C) to the Beta 1 oscillation band (eyes-closed),respectively. (B) corresponds to the the Fisher information for the Beta 1 band (eyes-opened) and (D) tothe Beta 1 oscillation band (eyes-closed), respectively. We consider D = 6 and τ = 1. We do not removesample dependent bias from the Shannon Fisher estimations. The results are the same for the fourdifferent visuomotor/imagined tasks (the t-test does not rejects the null hypothesis in any of the casesunder consideration).
0.662
0.664
0.666
0.668
0.67
0.672
0.674
0.66
0.665
0.67
0.675
0.525
0.53
0.535
0.54
0.545
0.55
0.555
0.56
0.565
0.57
0.575
0.52
0.53
0.54
0.55
0.56
0.57
0.58
Shannon Entropy: Baseline Beta 2 eyes-opened
DC
B
Fisher information: Baseline Beta 2 eyes-opened
Shannon Entropy: Baseline Beta 2 eyes-closed Fisher Information: Baseline Beta 2 eyes-closed
A
Figure 7. Averaged values of the normalized Shannon entropy and Fisher information, considering109 subjects for the 64-channels of the EEG for the baselines signals. (A) corresponds to the theShannon entropy for the Beta 2 band (eyes-opened) and (C) to the Beta 2 oscillation band (eyes-closed),respectively. (B) corresponds to the the Fisher information for the Beta 2 band (eyes-opened) and (D) tothe Beta 2 oscillation band (eyes-closed), respectively. We consider D = 6 and τ = 1. We do not removesample dependent bias from the Shannon Fisher estimations. The results are the same for the fourdifferent visuomotor/imagined tasks (the t-test does not rejects the null hypothesis in any of the casesunder consideration).
Entropy 2018, 20, 660 13 of 18
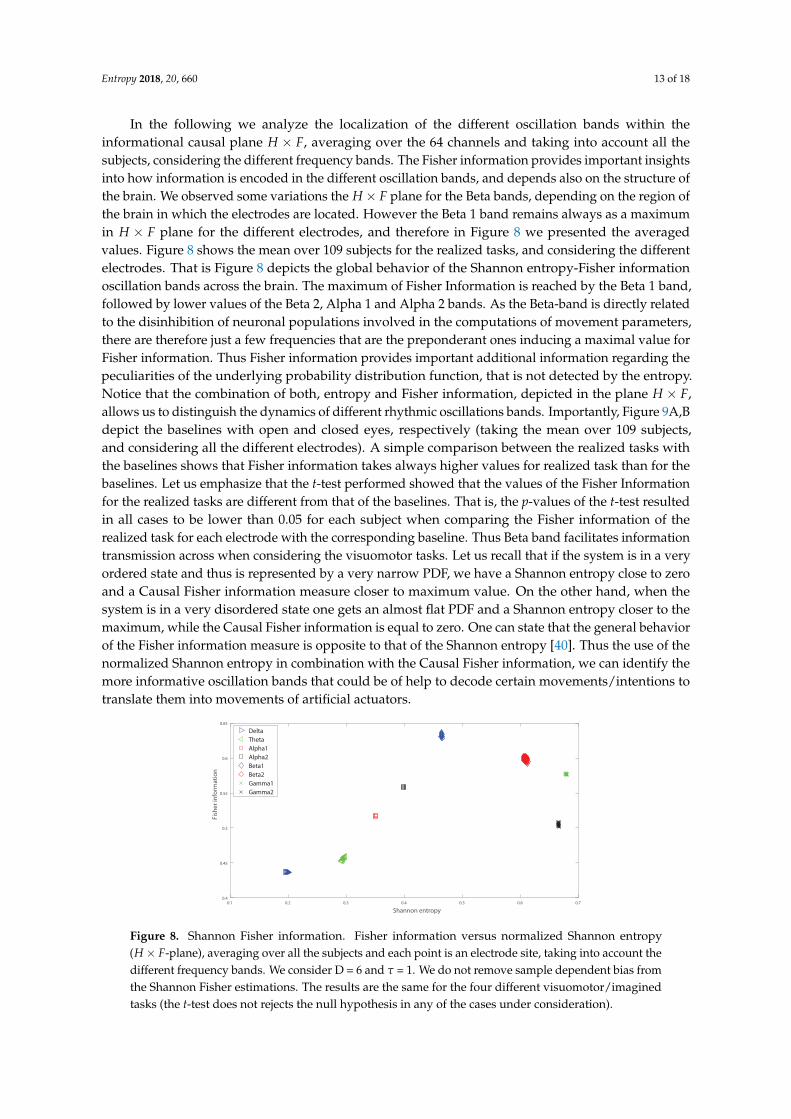
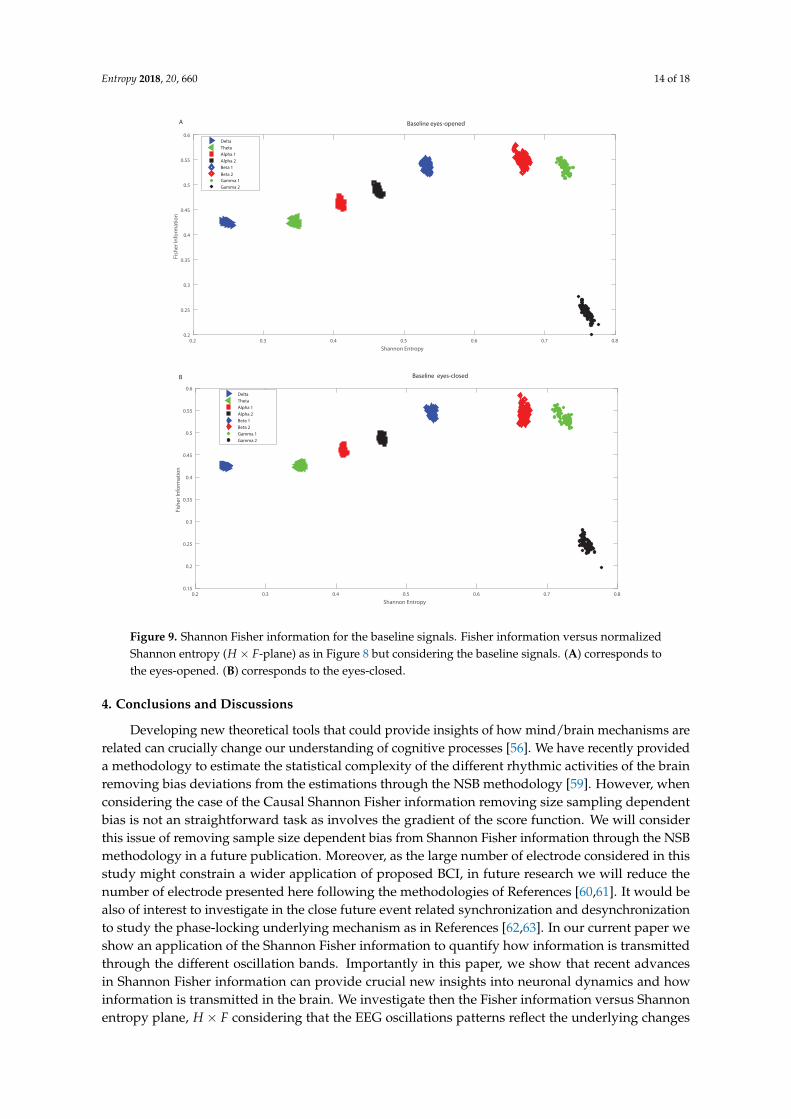
In the following we analyze the localization of the different oscillation bands within theinformational causal plane H × F, averaging over the 64 channels and taking into account all thesubjects, considering the different frequency bands. The Fisher information provides important insightsinto how information is encoded in the different oscillation bands, and depends also on the structure ofthe brain. We observed some variations the H× F plane for the Beta bands, depending on the region ofthe brain in which the electrodes are located. However the Beta 1 band remains always as a maximumin H × F plane for the different electrodes, and therefore in Figure 8 we presented the averagedvalues. Figure 8 shows the mean over 109 subjects for the realized tasks, and considering the differentelectrodes. That is Figure 8 depicts the global behavior of the Shannon entropy-Fisher informationoscillation bands across the brain. The maximum of Fisher Information is reached by the Beta 1 band,followed by lower values of the Beta 2, Alpha 1 and Alpha 2 bands. As the Beta-band is directly relatedto the disinhibition of neuronal populations involved in the computations of movement parameters,there are therefore just a few frequencies that are the preponderant ones inducing a maximal value forFisher information. Thus Fisher information provides important additional information regarding thepeculiarities of the underlying probability distribution function, that is not detected by the entropy.Notice that the combination of both, entropy and Fisher information, depicted in the plane H × F,allows us to distinguish the dynamics of different rhythmic oscillations bands. Importantly, Figure 9A,Bdepict the baselines with open and closed eyes, respectively (taking the mean over 109 subjects,and considering all the different electrodes). A simple comparison between the realized tasks withthe baselines shows that Fisher information takes always higher values for realized task than for thebaselines. Let us emphasize that the t-test performed showed that the values of the Fisher Informationfor the realized tasks are different from that of the baselines. That is, the p-values of the t-test resultedin all cases to be lower than 0.05 for each subject when comparing the Fisher information of therealized task for each electrode with the corresponding baseline. Thus Beta band facilitates informationtransmission across when considering the visuomotor tasks. Let us recall that if the system is in a veryordered state and thus is represented by a very narrow PDF, we have a Shannon entropy close to zeroand a Causal Fisher information measure closer to maximum value. On the other hand, when thesystem is in a very disordered state one gets an almost flat PDF and a Shannon entropy closer to themaximum, while the Causal Fisher information is equal to zero. One can state that the general behaviorof the Fisher information measure is opposite to that of the Shannon entropy [40]. Thus the use of thenormalized Shannon entropy in combination with the Causal Fisher information, we can identify themore informative oscillation bands that could be of help to decode certain movements/intentions totranslate them into movements of artificial actuators.
0.1 0.2 0.3 0.4 0.5 0.6 0.7
Shannon entropy
0.4
0.45
0.5
0.55
0.6
0.65
Fis
he
r in
form
ati
on
Delta
Theta
Alpha1
Alpha2
Beta1
Beta2
Gamma1
Gamma2
Figure 8. Shannon Fisher information. Fisher information versus normalized Shannon entropy(H× F-plane), averaging over all the subjects and each point is an electrode site, taking into account thedifferent frequency bands. We consider D = 6 and τ = 1. We do not remove sample dependent bias fromthe Shannon Fisher estimations. The results are the same for the four different visuomotor/imaginedtasks (the t-test does not rejects the null hypothesis in any of the cases under consideration).
Entropy 2018, 20, 660 14 of 18
0.2 0.3 0.4 0.5 0.6 0.7 0.8
Shannon Entropy
0.2
0.25
0.3
0.35
0.4
0.45
0.5
0.55
0.6
Fis
he
r In
form
ati
on
Delta
Theta
Alpha 1
Alpha 2
Beta 1
Beta 2
Gamma 1
Gamma 2
0.2 0.3 0.4 0.5 0.6 0.7 0.8
Shannon Entropy
0.15
0.2
0.25
0.3
0.35
0.4
0.45
0.5
0.55
0.6
Fis
he
r In
form
ati
on
Delta
Theta
Alpha 1
Alpha 2
Beta 1
Beta 2
Gamma 1
Gamma 2
A Baseline eyes-opened
Baseline eyes-closedB
Figure 9. Shannon Fisher information for the baseline signals. Fisher information versus normalizedShannon entropy (H × F-plane) as in Figure 8 but considering the baseline signals. (A) corresponds tothe eyes-opened. (B) corresponds to the eyes-closed.
4. Conclusions and Discussions
Developing new theoretical tools that could provide insights of how mind/brain mechanisms arerelated can crucially change our understanding of cognitive processes [56]. We have recently provideda methodology to estimate the statistical complexity of the different rhythmic activities of the brainremoving bias deviations from the estimations through the NSB methodology [59]. However, whenconsidering the case of the Causal Shannon Fisher information removing size sampling dependentbias is not an straightforward task as involves the gradient of the score function. We will considerthis issue of removing sample size dependent bias from Shannon Fisher information through the NSBmethodology in a future publication. Moreover, as the large number of electrode considered in thisstudy might constrain a wider application of proposed BCI, in future research we will reduce thenumber of electrode presented here following the methodologies of References [60,61]. It would bealso of interest to investigate in the close future event related synchronization and desynchronizationto study the phase-locking underlying mechanism as in References [62,63]. In our current paper weshow an application of the Shannon Fisher information to quantify how information is transmittedthrough the different oscillation bands. Importantly in this paper, we show that recent advancesin Shannon Fisher information can provide crucial new insights into neuronal dynamics and howinformation is transmitted in the brain. We investigate then the Fisher information versus Shannonentropy plane, H × F considering that the EEG oscillations patterns reflect the underlying changes
Entropy 2018, 20, 660 15 of 18
in neuronal synchrony as subjects performs a visuomotor or imagined cognitive tasks. We providea causal mapping, H× F, of the dynamical rhythmic activities of the brain that might provide a measureof attentional investment. Importantly, the causal mapping H× F allows us to characterize the internaldynamics patterns of the brain, providing important insights how much information is encoded withinthe different brain oscillation bands.
We show that the maximum of the Fisher information is reached within the Beta oscillationband. However, notice that while Fisher information about the Beta oscillation band remains maximal,the Alpha bands reaches a much lower information values. This is consistent with recent findingsshowing that during visuomotor tasks there is an increase in the oscillatory power of the Alpha bandwith a correspondent decrease in oscillatory power occurred in the Beta band [64]. This attenuationin the oscillatory power leads to an attenuation in the strength of the signal or at least within theprevailing frequencies leading to maximal amount of Fisher information within the Beta oscillationband. Interestingly, the Beta and Alpha bands form part of the so called sensory motor/mu rhythm,which experiment a change when the subject do or imagine a movement, an thus in a way it expressesintention to move [64].
Alpha and Beta band oscillations are implicated in sensory anticipation and motor preparation.On one hand, the Beta-band is directly related to the disinhibition of neuronal populations involved inthe computations of movement parameters and translated in a consequent reduction of the oscillatorypower within this band, leading to a higher Fisher information. On the other hand, the Alpha bandis an important piece for cognitive processes, it has been proved that it is involved in long rangesynchronizations between brain areas, and related to cognitive processes of visuospatial attention [65].Importantly, the oscillatory power in the Alpha- and Beta-bands are highly “desynchronizated” [66,67].There is indeed intriguing evidence that these rhythms serve distinct functions and support mentalsimulation of actions with different functional mechanisms [64]. Alpha- and Beta-band rhythmsare functionally dissociated. An increase in the power of the Alpha band, it comes combined witha decrease of the Beta-band power.
Alpha and Beta band power modulations are usually manifested throughout an increasedexcitability of the Alpha band with a consequent suppression in Beta band [68]. Moreover, Alpha andBeta band desynchronization has been related to kinematic regularities [68]. The power attenuation ofdifferent rhythms is commonly used in brain machine interface research, i.e., to decode fine movementproperties using noninvasive techniques. In this paper we use the plane Shannon entropy versusFisher information, H× F, that allows us to distinguish the dynamics of different rhythmic oscillationsbands during visoumotor tasks. That is the Fisher Information can be used as a biomarker of whichbands varies more during a given task, making it a valuable tool for a BCI system. After the analysis inthe H × F plane, one could concentrate more in the bands that are more informative in the particularexperiment. In this sense, the causal Fisher Information is a valuable tool, because it provides insightin the system, and also is very easy to estimate. The causality Shannon entropy-Fisher informationplane H × F could serve as the basis for a successful BCI, a technology that can help people whoare severely disabled connected to a noninvasive EEG device. Humans can use motor imagery tomodulate activity in the Beta or Alpha bands, and to thereby control a brain computer interface (BCI)system. The possibility of inferring motion kinematics based on noninvasive neural signals may be ofgreat importance for developing and improving existing brain machine interface technologies to beused for motor rehabilitation [12,69]. This is to say that by revealing different characteristics of therhythmic oscillations patterns within the Causal Shannon–Fisher information plane, H× F, one wouldtell which specific signal sequence would be of mean for certain functions that could be decoded to theartificial actuators like a robotic arm.
Author Contributions: R.B., O.A.R. and F.M. contributed equally in the design of this research as well as in thewriting of this paper. All authors have read and approved the final manuscript.
Entropy 2018, 20, 660 16 of 18
Funding: This research was funded by PIP 11220130100327CO (2014/2016) CONICET, Argentina (F.M.) andUniversidad Nacional de La Plata, Argentina (project 11/X812).
Conflicts of Interest: The authors declare no conflict of interest.
References
1. Kostov, A.; Polak, M. Parallel man-machine training in development of EEG-based cursor control. IEEE Trans.Rehabil. Eng. 2000, 8, 203–205. [CrossRef]
2. Wolpaw, J.R.; McFarland, D.J.; Neat, G.W.; Forneris, C.A. An EEG-based brain-computer interface for cursorcontrol. Electroencephalogr. Clin. Neurophysiol. 1991, 78, 252–259. [CrossRef]
3. Wolpaw, J.R.; McFarland, D.J. Multichannel EEG-based brain-computer communication. Electroencephalogr.Clin. Neurophysiol. 1994, 90, 444–449. [CrossRef]
4. Wolpaw, J.R.; McFarland, D.J. Control of a two-dimensional movement signal by a noninvasive brain-computerinterface in humans. Proc. Natl. Acad. Sci. USA 2004, 101, 17849–17854. [CrossRef] [PubMed]
5. McFarland, D.J.; Neat, G.W.; Read, R.F.; Wolpaw, J.R. An EEG-based method for graded cursor control.Psychobiology 1993, 21, 77–81.
6. Millán, J.; Renkens, F.; Mourino, J.; Gerstner, W. Noninvasive brain-actuated control of a mobile robot byhuman EEG. IEEE Trans. Biomed. Eng. 2004, 51, 1026–1033. [CrossRef] [PubMed]
7. Pfurtscheller, G.; Flotzinger, D.; Kalcher, J. Brain-computer interface: A new communication device forhandicapped persons. J. Microcomput. Appl. 1993, 16, 293–299. [CrossRef]
8. Leuthard, E.; Schalk, G.; Ojemann, J.W.; Moran, D. A brain-computer interface using electrocorticographicsignals in humans. J. Neural Eng. 2004, 1, 63–71. [CrossRef] [PubMed]
9. Wilson, J.; Felton, E.; Garell, P.; Schalk, G.; Williams, J. ECoG factors underlying multimodal control ofa brain-computer interface. IEEE Trans. Neural Syst. Rehabil. Eng. 2006, 14, 246–250. [CrossRef] [PubMed]
10. Luu, T.P.; Nakagome, S.; He, Y.; Contreras-Vidal, J.L. Real-time EEG-based brain-computer interface toa virtual avatar enhances cortical involvement in human treadmill walking. Sci. Rep. 2017, 7, 8895. [CrossRef][PubMed]
11. Schalk, G.; Mellinger, J. A Practical Guide to Brain–Computer Interfacing with BCI2000: General-Purpose Softwarefor Brain-Computer Interface research, Data Acquisition, Stimulus Presentation, and Brain Monitoring; Springer:New York, NY, USA, 2010; ISBN 978-1-84996-091-5.
12. Montani, F.; Oliynyk, A.; Fadiga, L. Superlinear Summation of Information in Premotor Neurons Pairs. Int. J.Neural Syst. 2017, 27. [CrossRef] [PubMed]
13. Buzsáki, G. Rhythms of the Brain; Oxford University Press: New York, NY, USA, 2006; ISBN 13-978-0-19-530106-9.14. Montani, F.; Rosso, O.A. Entropy-Complexity Characterization of Brain Development in Chickens. Entropy
2014, 16, 4677–4692. [CrossRef]15. Yang, Y.; Solis-Escalante, T.; van der Helm, F.C.T.; Schouten, A.C. A Generalized Coherence Framework for
Detecting and Characterizing Nonlinear Interactions in the Nervous System. IEEE Trans. Bio-Med. Eng. 2016,63, 2629–2637. [CrossRef] [PubMed]
16. Yang, Y.; Solis-Escalant, T.; Yao, J.; van der Helm, F.C.; Dewald, J.P.; Schouten, A.C. Nonlinear Connectivity inthe Human Stretch Reflex Assessed by Cross-Frequency Phase Coupling. Int. J. Neural Syst. 2016, 26, 1650043.[CrossRef] [PubMed]
17. Rosso, O.A.; Masoller, C. Detecting and quantifying stochastic and coherence resonances via information-theory complexity measurements. Phys. Rev. E 2009, 79. [CrossRef] [PubMed]
18. Rosso, O.A.; Masoller, C. Detecting and quantifying temporal correlations in stochastic resonance viainformation theory measures. Eur. Phys. J. B 2009, 69, 37–43. [CrossRef]
19. Montani, F.; Deleglise, E.B.; Rosso, O.A. Efficiency characterization of a large neuronal network: A causalinformation approach. Physica A 2004, 401, 58–70. [CrossRef]
20. Montani, F.; Rosso, O.A.; Matias, F.; Bressler, S.L.; Mirasso, C.R. A symbolic information approach to determineanticipated and delayed synchronization in neuronal circuit models. Philos. Trans. R. Soc. Lond. Ser. A2015, 373. [CrossRef] [PubMed]
21. Montani, F.; Baravalle, R.; Montangie, L.; Rosso, O.A. Causal information quantification of prominentdynamical features of biological neurons. Philos. Trans. R. Soc. Lond. Ser. A 2015, 373. [CrossRef] [PubMed]
Entropy 2018, 20, 660 17 of 18
22. Schalk, G.; McFarland, D.J.; Hinterberger, T.; Birbaumer, N.; Wolpaw, J.R. BCI2000: A general-purposebrain-computer interface (BCI) system. IEEE Trans. Biomed. Eng. 2004, 51, 1034–1043. [CrossRef] [PubMed]
23. EEG Motor Movement/Imagery Dataset. Available online: https://www.physionet.org/pn4/eegmmidb/(accessed on 30 August 2018).
24. Goldberger, A.L.; Amaral, L.A.N.; Glass, L.; Hausdorff, J.M.; Ivanov, P.C.; Mark, R.G.; Mietus, J.E.; Moody, G.B.;Peng, C.K.; Stanley, H.E. PhysioBank, PhysioToolkit, and PhysioNet: Components of a new research resourcefor complex physiologic signals. Circulation 2000, 101, 215–220. [CrossRef]
25. Wolpaw, J.R.; McFarland, D.J.; Vaughan, T.M.; Schalk, G. The Wadsworth Center brain-computer interface(BCI) research and development program. IEEE Trans. Neural Syst. Rehabil. Eng. 2003, 11, 1–4.
26. Huong, N.T.M.; Linh, H.Q.; Khai, L.Q. Classification of Left/Right Hand Movement EEG Signals Using EventRelated Potentials and Advanced Features. In 6th IFMBE Proceedings; Springer: Singapore, 2018; pp. 209–2015.
27. Zebende, G.F.; Oliveira Filho, F.M.; Leyva Cruz, J.A. Auto-correlation in the motor/imaginary human EEGsignals: A vision about the FDFA fluctuations. PLoS ONE 2017, 12, e0183121. [CrossRef] [PubMed]
28. Belitski, A.; Gretton, A.; Magri, C.; Murayama, Y.; Montemurro, M.; Logothetis, N.; Panzeri, S. Low-frequencylocal field potentials and spikes in primary visual cortex convey independent visual information. J. Neurosci.2008, 28, 5696–5709. [CrossRef] [PubMed]
29. Shannon, C.; Weaver, W. The Mathematical Theory of Communication; University of Illinois Press: Champaign,IL, USA, 1949.
30. Fisher, R.A. On the mathematical foundations of theoretical statistics. Philos. Trans. R. Soc. Lond. Ser. A 1922,222, 309–368. [CrossRef]
31. Frieden, B.R. Science from Fisher Information: A Unification; Cambridge University Press: Cambridge, UK, 2004;ISBN 0-521-81079-5.
32. Mayer, A.L.; Pawlowski, C.W.; Cabezas, H. Fisher Information and dinamic regime changes in ecologicalsystems. Ecol. Model. 2006, 195, 72–82. [CrossRef]
33. Rosso, O.A.; De Micco, K.; Plastino, A.; Larrondo, H. Info-quantifiers’ map-characterization revisited.Physica A 2010, 389, 249–262. [CrossRef]
34. Olivares, F.; Plastino, A.; Rosso, O.A. Ambiguities in the Bandt–Pompe’s methodology for local entropicquantifiers. Physica A 2012, 391, 2518–2526. [CrossRef]
35. Olivares, F.; Plastino, A.; Rosso, O.A. Contrasting chaos with noise via local versus global informationquantifiers. Phys. Lett A 2012, 376, 1577–1583. [CrossRef]
36. Zografos, K.; Ferentinos, K.; Papaioannou, T. Discrete approximations to the Csiszár, Renyi, and Fishermeasures of information. Can. J. Stat. 1986, 14, 355–366. [CrossRef]
37. Pardo, L.; Morales, D.; Ferentinos, K.; Zografos, K. Discretization problems on generalized entropies andR-divergences. Kybernetika 1994, 30, 445–460.
38. Madiman, M.; Johnson, O.; Kontoyiannis, I. Fisher Information, compound Poisson approximation, and thePoisson channel. In Proceedings of the 2007 IEEE International Symposium on Information Theory, Nice,France, 24–29 June 2007; IEEE: Piscataway, NJ, USA, 2007.
39. Sanchez-Moreno, P.; Dehesa, J.S.; Yanez, R.J. Discrete Densities and Fisher Information. In Proceedings ofthe 14th International Conference on Difference Equations and Applications, Ugur-Bahçesehir UniversityPublishing Company, Istanbul, Turkey, 2009; pp. 291–298.
40. Pennini, F.; Plastino, A. Reciprocity relations between ordinary temperature and the Frieden-Soffer Fishertemperature. Phys. Rev. E 2005, 71. [CrossRef] [PubMed]
41. Bandt, C.; Pompe, B. Permutation entropy: A natural complexity measure for time series. Phys. Rev. Lett.2002, 88. [CrossRef] [PubMed]
42. Zanin, M.; Zunino, L.; Rosso, O.A.; Papo, D. Permutation Entropy and Its Main Biomedical and EconophysicsApplications: A Review. Entropy 2012, 14, 1553–1577. [CrossRef]
43. Rosso, O.A.; Larrondo, H.A.; Martín, M.T.; Plastino, A.; Fuentes, M.A. Distinguishing noise from chaos.Phys. Rev. Lett. 2007, 99. [CrossRef] [PubMed]
44. Rosso, O.A.; Olivares, F.; Zunino, L.; De Micco, L.; Aquino, A.L.L.; Plastino, A.; Larrondo, H.A. Characterizationof chaotic maps using the permutation Bandt–Pompe probability distribution. Eur. Phys. J. B 2012, 86, 116–129.[CrossRef]
45. Saco, P.M.; Carpi, L.C.; Figliola, A.; Serrano, E.; Rosso, O.A. Entropy analysis of the dynamics of ElNiño/Southern Oscillation during the Holocene. Physica A 2010, 389, 5022–5027. [CrossRef]
Entropy 2018, 20, 660 18 of 18
46. Keller, K.; Sinn, M. Ordinal Analysis of Time Series. Physica A 2005, 356, 114–120. [CrossRef]47. Zunino, L.; Soriano, M.C.; Fischer, I.; Rosso, O.A.; Mirasso, C.R. Permutation-information-theory approach to
unveil delay dynamics from time-series analysis. Phys. Rev. E 2010, 82. [CrossRef]48. Soriano, M.C.; Zunino, L.; Rosso, O.A.; Fischer, I.; Mirasso, C.R. Time Scales of a Chaotic Semiconductor Laser
With Optical Feedback Under the Lens of a Permutation Information Analysis. IEEE J. Quantum Electron.2001, 47, 252–261. [CrossRef]
49. Zunino, L.; Soriano, M.C.; Rosso, O.A. Distinguishing chaotic and stochastic dynamics from time series byusing a multiscale symbolic approach. Phys. Rev. E 2012, 86. [CrossRef] [PubMed]
50. Available online: http://www.keithschwarz.com/interesting/code/factoradicpermutation (accessed on30 August 2018).
51. Montani, F.; Phoka, E.; Portesi, M.; Schultz, S.R. Statistical modelling of higher-order correlations in pools ofneural activity. Physica A 2013, 392, 3066–3086. [CrossRef]
52. Montangie, L.; Montani, F. Quantifying higher-order correlations in a neuronal pool. Physica A 2015, 421,388–400. [CrossRef]
53. Montangie, L.; Montani, F. Higher-order correlations in common input shapes the output spiking activity ofa neural population. Physica A 2017, 471, 845–861. [CrossRef]
54. Montangie, L.; Montani, F. Effect of interacting second- and third-order stimulus-dependent correlations onpopulation-coding asymmetries. Phys. Rev. E 2016, 94. [CrossRef] [PubMed]
55. Montangie, L.; Montani, F. Common inputs in subthreshold membrane potential: The role of quiescent statesin neuronal activity. Phys. Rev. E 2018, 97. [CrossRef] [PubMed]
56. Baravalle, R.; Rosso, O.A.; Montani, F. Discriminating imagined and non-imagined tasks in the motor cortexarea: Entropy-complexity plane with a wavelet decomposition. Physica A 2018, 511, 27–39. [CrossRef]
57. Rena, X.; Yan, Z.; Wang, Z.; Hu, X. Noise reduction based on ICA decomposition and wavelet transform forthe extraction of motor unit action potentials. J. Neurosci. Methods 2006, 158, 313–322. [CrossRef] [PubMed]
58. Castellanos, P.N.; Makarov, V.A. Recovering EEG brain signals: Artifact suppression with wavelet enhancedindependent component analysis. J. Neurosci. Methods 2006, 158, 300–312. [CrossRef] [PubMed]
59. Baravalle, R.; Rosso, O.A.; Montani, F. Rhythmic activities of the brain: Quantifying the high complexity ofbeta and gamma oscillations during visuomotor tasks. Chaos 2018, 28. [CrossRef] [PubMed]
60. Yang, Y.; Bloch, I.; Chevallier, S.; Wiart, J. Subject-Specific Channel Selection Using Time Information forMotor Imagery Brain–Computer Interfaces. Cogn. Comput. 2016, 8, 505–518. [CrossRef]
61. Yang, Y.; Chevallier, S.; Wiart, J.; Bloch, I. Subject-specific time-frequency selection for multi-class motor imagery-based BCIs using few Laplacian EEG channels. Biomed. Signal Process. Control 2017, 38, 302–311. [CrossRef]
62. Cebolla, A.M.; Petieau, M.; Dan, B.; Balazs, L.; McIntyre, J.; Cheron, G. Cerebellar contribution tovisuo-attentional alpha rhythm: insights from weightlessness. Sci. Rep. 2016, 6, 37824. [CrossRef] [PubMed]
63. Cebolla, A.M.; Palmero-Soler, E.; Leroy, A.; Cheron, G. EEG Spectral Generators Involved in Motor Imagery:A swLORETA Study. Front Psychol. 2017, 8. [CrossRef] [PubMed]
64. Brinkman, L.; Stolk, A.; Dijkerman, H.C.; de Lange, F.P.; Toni, I. Distinct roles for alpha- and beta-band oscillationsduring mental simulation of goal-directed actions. J. Neurosci. 2014, 44, 14783–14792. [CrossRef] [PubMed]
65. Lobier, M.; Palva, J.M.; Palva, S. High-alpha band synchronization across frontal, parietal and visual cortex mediatesbehavioral and neuronal effects of visuospatial attention. Neuroimage 2018, 165, 222–237. [CrossRef] [PubMed]
66. Carlqvist, H.; Nikulin, V.V.; Stromberg, J.O.; Brismar, T. Amplitude and phase relationship between alpha and betaoscillations in the human electroencephalogram. Med. Biol. Eng. Comput. 2005, 43, 599–607. [CrossRef] [PubMed]
67. de Lange, F.P.; Jensen, O.; Bauer, M.; Toni, I. Interactions between posterior gamma and frontal alpha/betaoscillations during imagined actions. Front. Hum. Neurosci. 2008, 2. [CrossRef]
68. Buchholz, V.N.; Jensen, O.; Medendorp, W.P. Different roles of alpha and beta band oscillations in anticipatorysensorimotor gating. Front Hum. Neurosci. 2014, 8. [CrossRef] [PubMed]
69. Jerbi, K.; Vidal, J.R.; Mattout, J.; Maby, E.; Lecaignard, F.; Ossandon, T.; Hamame, C.M.; Dalal, S.S.; Bouet, R.;Lachaux, J.P.; et al. Inferring hand movement kinematics from MEG, EEG and intracranial EEG: Frombrain-machine interfaces to motor rehabilitation. IRBM 2011, 32, 8–18. [CrossRef]
c© 2018 by the authors. Licensee MDPI, Basel, Switzerland. This article is an open accessarticle distributed under the terms and conditions of the Creative Commons Attribution(CC BY) license (http://creativecommons.org/licenses/by/4.0/).


![Move An Artificial Arm by Motor Imagery Data...single trial EEG during an imagined hand movement was presented [12]. It was discussed that EEG signals and an enhanced resource-allocating](https://img.pdfslide.net/doc/110x75/5f09c8277e708231d428783a/move-an-artificial-arm-by-motor-imagery-data-single-trial-eeg-during-an-imagined.jpg)