Embed Size (px)
Citation preview

Atmos. Chem. Phys., 4, 1149–1165, 2004www.atmos-chem-phys.org/acp/4/1149/SRef-ID: 1680-7324/acp/2004-4-1149
AtmosphericChemistry
and Physics
Mountain wave PSC dynamics and microphysics from ground-basedlidar measurements and meteorological modeling
J. Reichardt1, 2, *, A. Dornbrack3, S. Reichardt1, 2, P. Yang4, and T. J. McGee2
1Joint Center for Earth Systems Technology, University of Maryland Baltimore County, Baltimore, Maryland, USA2Atmospheric Chemistry and Dynamics Branch, NASA Goddard Space Flight Center, Greenbelt, Maryland, USA3Institut fur Physik der Atmosphare, Deutsches Zentrum fur Luft- und Raumfahrt (DLR) Oberpfaffenhofen, Weßling,Germany4Department of Atmospheric Sciences, Texas A&M University, College Station, Texas, USA* now at: Meteorologisches Observatorium Lindenberg, Deutscher Wetterdienst, Tauche, Germany
Received: 20 August 2003 – Published in Atmos. Chem. Phys. Discuss.: 18 November 2003Revised: 22 April 2004 – Accepted: 23 July 2004 – Published: 30 July 2004
Abstract. The day-long observation of a polar stratosphericcloud (PSC) by two co-located ground-based lidars at theSwedish research facility Esrange (67.9◦ N, 21.1◦ E) on 16January 1997 is analyzed in terms of PSC dynamics andmicrophysics. Mesoscale modeling is utilized to simulatethe meteorological setting of the lidar measurements. Mi-crophysical properties of the PSC particles are retrieved bycomparing the measured particle depolarization ratio and thePSC-averaged lidar ratio with theoretical optical data derivedfor different particle shapes. In the morning, nitric acid tri-hydrate (NAT) particles and then increasingly coexisting liq-uid ternary aerosol (LTA) were detected as outflow from amountain wave-induced ice PSC upwind Esrange. The NATPSC is in good agreement with simulations for irregular-shaped particles with length-to-diameter ratios between 0.75and 1.25, maximum dimensions from 0.7 to 0.9µm, and anumber density from 8 to 12 cm−3 and the coexisting LTAdroplets had diameters from 0.7 to 0.9µm, a refractive in-dex of 1.39 and a number density from 7 to 11 cm−3. Thetotal amount of condensed HNO3 was in the range of 8–12 ppbv. The data provide further observational evidence thatNAT forms via deposition nucleation on ice particles as anumber of recently published papers suggest. By early after-noon the mountain-wave ice PSC expanded above the lidarsite. Its optical data indicate a decrease in minimum particlesize from 3 to 1.9µm with time. Later on, following theweakening of the mountain wave, wave-induced LTA wasobserved only. Our study demonstrates that ground-basedlidar measurements of PSCs can be comprehensively inter-preted if combined with mesoscale meteorological data.
Correspondence to:J. Reichardt([email protected])
1 Introduction
Mountain wave-induced PSCs constitute an ideal natural lab-oratory to investigate the formation and dissipation of cloudparticles. Under quasi-stationary meteorological conditionsthese mesoscale clouds do not strongly vary their spatial po-sition relative to the ground, and in the air flowing throughthem particles nucleate, grow, and evaporate continuouslyover a period of hours. Previously, particle evolution in wavePSCs was successfully studied based on quasi-Lagrangianobservations acquired with airborne lidars (Carslaw et al.,1998; Tsias et al., 1999; Wirth et al., 1999; Dornbrack et al.,2002; Hu et al., 2002; Fueglistaler et al., 2003). A similarstudy that rests upon data obtained with ground-based lidarshas not been published so far, probably mainly due to the factthat they lack the additional dimension that is offered by air-craft observations. This limitation makes ground measure-ments particularly difficult to interpret because one cannotdistinguish between microphysical and dynamical processeswithout auxiliary information. In this contribution, such astudy is presented for the first time using mesoscale modelsimulations to resolve the ambiguity of the ground-based li-dar observations.
In winter 1996/1997 the lidars of the GKSS Research Cen-ter (GKSS Raman lidar; Reichardt et al., 1996) and of theUniversity of Bonn (U. Bonn lidar; Muller et al., 1997) wereoperated at Esrange as part of an international campaigndedicated to investigations of dynamically induced regional-scale PSCs in the lee of the Scandinavian mountains (Fricke,1997). In the morning of 16 January 1997, increasingnorthwesterly tropospheric wind flow over the Scandinavianmountain ridge excited gravity waves propagating into thestratosphere and generating temperature minima eventually
© European Geosciences Union 2004

1150 J. Reichardt et al.: Mountain wave PSC over Esrange, Sweden
low enough for nucleation of solid particles. This moun-tain wave PSC event, possibly the strongest that winter(Dornbrack et al., 2001), lasted the whole day until waveactivity ceased in the evening. Because of favorable tro-pospheric weather conditions the two Esrange lidars couldmonitor the PSC system without interruption. This uniquedata set is presented here, and an analysis in terms of PSCdynamics and microphysics is given.
The article is organized as follows. Section 2 is a descrip-tion of the lidar instruments and of the measurement tech-niques used for the determination of the PSC optical proper-ties. In Sect. 3, the meteorological situation on 16 January1997 is discussed, and the results of the mesoscale modelare presented. In Sect. 4, a macrophysical interpretation ofthe lidar observations is given that is based on the mesoscalenumerical simulation and on the PSC optical characteristics.Section 5 focuses on the microphysical analysis of selectedtime periods during the PSC development. For the first time,microphysical properties of crystalline PSC particles are re-trieved assuming polyhedral particle shapes. Section 6 is asummary.
2 Instrumentation and data analysis
2.1 GKSS Raman lidar
The GKSS Raman lidar is a polarization Raman DIAL fornighttime measurements of clouds, water vapor (troposphereonly), and ozone (Reichardt et al., 1996). In January 1997this mobile system was operated at Esrange, the emitted laserwavelengths were 308 and 355 nm. PSC optical properties(including depolarization ratio) are determined at 355 nm.No effort was made to retrieve PSC properties at the shorterwavelength because absorption by ozone molecules poses aproblem for the data analysis of thin PSCs here. In what fol-lows a description of the analysis techniques that pertain tothe GKSS Raman lidar data is given.
2.1.1 Backscatter ratio
Backscatter ratioR (ratio of total to molecular backscat-tering) is determined by forming the ratio of an elastic-backscatter lidar signal to the corresponding vibrational-rotational Raman signal (molecular nitrogen), and calibratingit at heights with negligible particle scattering. Backscatterratio is a useful parameter for studies of PSC dynamics, how-ever, it is less helpful in the retrieval of particle shapes andsizes because it depends on the particle number density (Rei-chardt et al., 2002c). This is not the case of the extinction-to-backscatter (lidar) ratio and the particle depolarization ratio.
2.1.2 Particle depolarization ratio
Particle depolarization ratios (δpar, subscript ‘par’ denotes‘particle’) are determined by use of the conventional two-
signal technique of Schotland et al. (1971). Depolarizationmeasurements with this technique have to be calibrated. Inour case, this was done by fitting the depolarization-ratio pro-file obtained for the 16 January 1997 ice PSC between 16:55and 17:55 UT to the one determined for the same time pe-riod with a new three-signal method for depolarization mea-surements (Reichardt et al., 2003). This approach to cali-bration is accurate because it is largely insensitive to exper-imental errors, and no critical assumptions about the atmo-spheric depolarization ratio at some reference height have tobe made. Finally, to obtainδpar, the calibrated polarizationdata are corrected for the influence of molecular scatteringwhich depresses the measured depolarization ratio in opti-cally thin PSCs and at cloud boundaries below the value oflight scattered by the PSC particles alone. For a discussion ofstatistical and systematic errors see Reichardt et al. (2002a).
2.1.3 PSC-averaged lidar ratio
Lidar-ratio (Spar) data have proven valuable in microphysicalstudies of tropospheric clouds (Reichardt et al., 2002b), andshow great potential in PSC investigations (Reichardt et al.,2002c). In order to haveSpar information available for thePSC under investigation, we calculate the PSC-layer meanvalue ofSpar, Spar, as PSC optical depthτ divided by inte-grated PSC backscatter coefficient (lidar-ratio profiles cannotbe determined because of insufficient Raman signal strengthabove∼20 km). The (integrated) backscatter coefficient isobtained with the Raman-lidar technique (Ansmann et al.,1992). The optical depth of the PSC can be calculated ac-cording to
τ = ln[N(zb)/N(zt)]/2, (1)
whereN(zb) andN(zt) is the elastic lidar signal at heightsbelow and above the PSC, respectively. Beforeτ is calcu-lated,N is corrected for background, range, and for backscat-tering and extinction by molecules. Radiosonde data of themeasurement night are used to determine the atmosphericdensity profile required for the correction of molecular scat-tering. The residual, absolute systematic errors inSpar thatresult from this Rayleigh correction are the larger the smallerthe PSC optical depth. However, since the latter is oftenanticorrelated with lidar ratio (optically thin mountain wavePSCs consist of small particles with highSpar), theSpar un-certainty can be estimated to be∼20% for all PSC measure-ments considered here. Obviously,Spar is the more mean-ingful the smaller the altitude variations in particle opticalproperties are. In our analysis we have used the other par-ticle optical property measured,δpar, as an indicator of PSCvariability.
2.1.4 Polarization-sensitive backscatter ratios
Recent analyses of lidar measurements suggest that scatter-ing by both solid and liquid particles may contribute signif-icantly to the optical properties of low-backscatter (type-I,
Atmos. Chem. Phys., 4, 1149–1165, 2004 www.atmos-chem-phys.org/acp/4/1149/

J. Reichardt et al.: Mountain wave PSC over Esrange, Sweden 1151
according to the classification of Browell et al., 1990) PSCs(e.g. Gobbi et al., 1998; Stein et al., 1999; Toon et al., 2000;Biele et al., 2001). In this case, the interpretation of the PSCdata in terms of the two coexisting particle classes can beimproved if backscatter coefficients (or backscatter ratios)are studied separately for both states of polarization, sincedroplet scattering adds to the parallel-polarized lidar signalalone (single scattering assumed) whereas the light backscat-tered from nonspherical solid particles has both parallel- andperpendicular-polarized components. Our discussion of thetype-I PSCs on 16 January 1997 includes an analysis that issimilar to these previous studies, but in order to avoid calibra-tion problems we look at the two quantitiesB‖ andB⊥, theratios of, respectively, parallel-polarized and perpendicular-polarized particle backscatter coefficients to the backscattercoefficient of molecular scattering.B‖ andB⊥ are calculatedfrom theR andδpar measurements according to
B‖= (R − 1)/(1 + δpar), (2)
B⊥= δpar(R − 1)/(1 + δpar). (3)
Obviously,B‖ andB⊥ contain the same information asRandδpar but some aspects of PSC scattering are easier dis-cerned if one or the other pair of variables is used.
2.2 U. Bonn lidar
The U. Bonn lidar at Esrange is a polarization Raman li-dar, operating at a wavelength of 532 nm at the time of themeasurements discussed here. Daylight capabilities existedfor the parallel-polarized elastic return signal (Muller et al.,1997). These data are used in this study to visualize the de-velopment of the macrophysical PSC properties during day-time.
2.3 On the effect of multiple scattering
On 16 January 1997, optically thin tropospheric ice cloudswere present above the lidar site, sporadically before andcontinuously after∼20:00 UT, respectively (Fricke et al.,1999). For that reason, the effect of multiple scattering incirrus clouds on the PSC observations is briefly addressedin the following, since it might be seen as a possible sourceof error in the determination of PSC optical properties, par-ticularly δpar. We show that the multiple-scattering effect isnegligible. We employed the multiple-scattering model de-scribed by Reichardt et al. (2000a) and Reichardt (2000) tosimulate the multiple-scattering contributions to the elasticlidar return signals from the stratosphere. The cirrus extinc-tion profile measured around 22:26 UT with the GKSS Ra-man lidar, and lidar parameters of this instrument were cho-sen for the simulations. Model results are shown in Fig. 1.Second-order scattering is the dominant multiple-scatteringeffect, it contributes<∼4% to the total lidar signal above20 km. Since doubly scattered light experienced a single (di-rect) forward-scattering process in the cirrus cloud that does
5
10
15
20
25
0.0 0.1 0.2
9mol
9par
Extinction coef. (km-1)
Hei
gh
t (k
m)
10-5
10-4
10-3
10-2
10-1
100
N(i)/N
(1)
N(4)
N(1)
N(1)
N(3)
N(2)
N(1)
Fig. 1. Cirrus extinction profile (αpar; observed over Esrange on16 January 1997 between 22:06 and 22:46 UT), and molecular ex-tinction (αmol; 16 January 1997 radiosonde data) (left), and mod-eled ratios of multiply to singly scattered light (right). For themultiple-scattering calculations the cirrus cloud is assumed to con-sist of columnar crystals with maximum dimensions between 20and 700µm; the laser wavelength is 355 nm; and the lidar field ofview is 0.6 mrad.
not change the state of polarization, this signal augmenta-tion does not affect the depolarization measurement in PSCs.Only backscattered light of higher scattering orders (two ormore scattering processes in the cirrus clouds) might inter-fere with theδpar determination, however, they are irrelevantin our case (scattering orders>2 amount to less than 0.2%above 20 km). Finally, we want to point out that multiplescattering in cirrus clouds does not play a role in measure-ments of PSC backscatter and lidar ratios either, because,respectively, the multiple-scattering contributions to elasticand Raman return signals cancel out (Wandinger, 1998), andthe ratios of multiply to singly scattered light depend onlyweakly on height in the stratosphere.
3 Meteorological setting
Results of a mesoscale model simulation illustrate the mete-orological setting. The mesoscale fields are calculated withthe non-hydrostatic weather prediction model MM5-version3.4 (Dudhia, 1993; Dudhia et al., 2001). The outer modeldomain is centered at (65◦ N, 20◦ E) with an extension of2457 km×2457 km. In this domain a horizontal grid size of1x=27 km is used. A local grid refinement scheme (nesteddomains of 9 and 3 km horizontal resolution, respectively) isapplied to resolve most of the horizontal wavenumber spec-trum of vertically propagating gravity waves excited by theorography.
The mesoscale simulation presented in this paper wasperformed with 128 vertical levels up to the model top at10 hPa (∼30 km) which results in a high spatial resolution
www.atmos-chem-phys.org/acp/4/1149/ Atmos. Chem. Phys., 4, 1149–1165, 2004
1152 J. Reichardt et al.: Mountain wave PSC over Esrange, Sweden
0000UT
0800UT
1600UT
Fig. 2. TemperatureT ≤192 K (color shaded; K) at the 550-K isentropic surface (right) and along the vertical section as indicated by the redline (left) on 16 January 1997. Additional fields on the right: horizontal wind vectors (barbs; long: 10 ms−1, short: 5 ms−1) andT ≤184 K(white lines;1T =2 K ). On the left: potential temperature2 (solid black lines;12=10 K, 550-K isentrope bold) and temperature (solidblue lines;1T =2 K); here again, white lines mark regions withT ≤184 K. The position of the lidar site at Esrange is marked (red dot in thehorizontal and thick green line in the vertical section). The profile of the model orography is plotted below each vertical section. Numericalresults are from the innermost domain of the mesoscale model (1x=3 km).
Atmos. Chem. Phys., 4, 1149–1165, 2004 www.atmos-chem-phys.org/acp/4/1149/

J. Reichardt et al.: Mountain wave PSC over Esrange, Sweden 1153
0000UT
0800UT
1600UT
Fig. 3. Potential vorticity (color shaded; PVU, where 1 PVU=10−6 K m2 kg−1 s−1) on the 308-K isentropic surface (left) and along thevertical section as indicated by the black line (right) on 16 January 1997. Additional fields on the left: horizontal wind vectors (barbs; long:10 ms−1, short: 5 ms−1) and horizontal wind speed>40 ms−1 (black solid lines; 5 ms−1 increment). On the right: potential temperature2 (thin black solid lines;12=4 K, 308-K isentrope bold), horizontal wind speed>40 ms−1 (thick solid lines; 5 ms−1 increment), andstratospheric temperatureT ≤192 K (color shaded as in Fig. 2 for heights>20 km; K). The position of the lidar site at Esrange is marked(black dot in the horizontal and thick green line in the vertical section). Numerical results are from the coarse grid domain of the mesoscalemodel (1x=27 km).
www.atmos-chem-phys.org/acp/4/1149/ Atmos. Chem. Phys., 4, 1149–1165, 2004
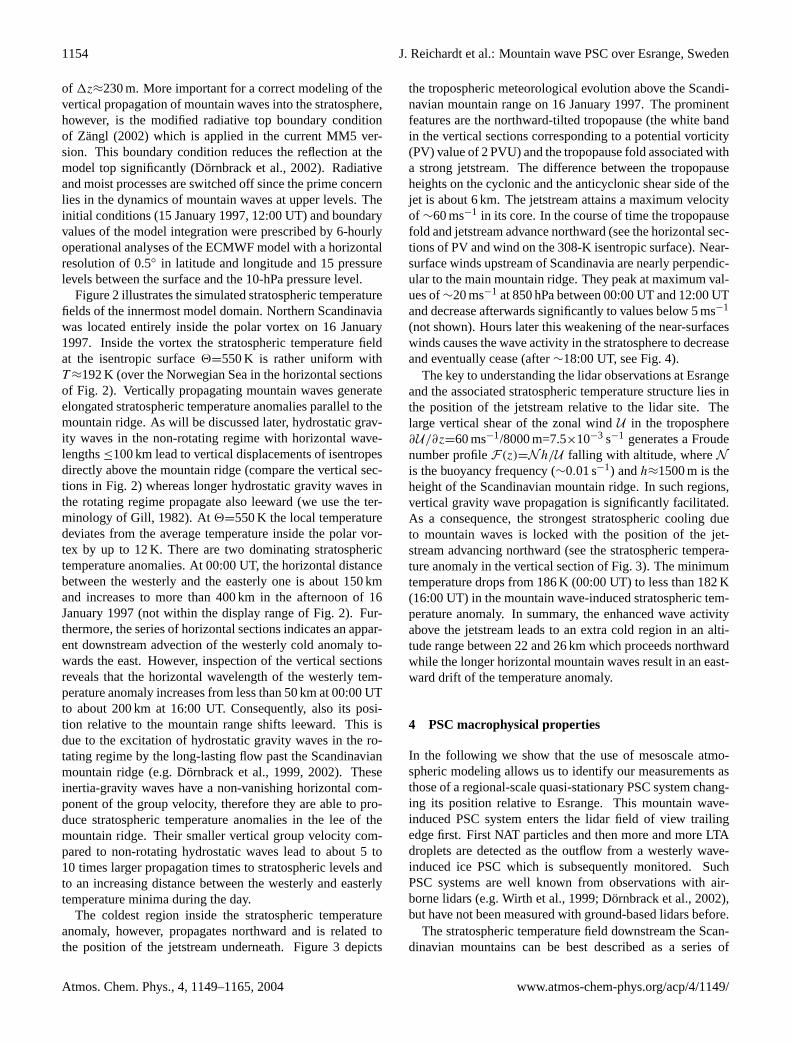
1154 J. Reichardt et al.: Mountain wave PSC over Esrange, Sweden
of 1z≈230 m. More important for a correct modeling of thevertical propagation of mountain waves into the stratosphere,however, is the modified radiative top boundary conditionof Zangl (2002) which is applied in the current MM5 ver-sion. This boundary condition reduces the reflection at themodel top significantly (Dornbrack et al., 2002). Radiativeand moist processes are switched off since the prime concernlies in the dynamics of mountain waves at upper levels. Theinitial conditions (15 January 1997, 12:00 UT) and boundaryvalues of the model integration were prescribed by 6-hourlyoperational analyses of the ECMWF model with a horizontalresolution of 0.5◦ in latitude and longitude and 15 pressurelevels between the surface and the 10-hPa pressure level.
Figure 2 illustrates the simulated stratospheric temperaturefields of the innermost model domain. Northern Scandinaviawas located entirely inside the polar vortex on 16 January1997. Inside the vortex the stratospheric temperature fieldat the isentropic surface2=550 K is rather uniform withT ≈192 K (over the Norwegian Sea in the horizontal sectionsof Fig. 2). Vertically propagating mountain waves generateelongated stratospheric temperature anomalies parallel to themountain ridge. As will be discussed later, hydrostatic grav-ity waves in the non-rotating regime with horizontal wave-lengths≤100 km lead to vertical displacements of isentropesdirectly above the mountain ridge (compare the vertical sec-tions in Fig. 2) whereas longer hydrostatic gravity waves inthe rotating regime propagate also leeward (we use the ter-minology of Gill, 1982). At2=550 K the local temperaturedeviates from the average temperature inside the polar vor-tex by up to 12 K. There are two dominating stratospherictemperature anomalies. At 00:00 UT, the horizontal distancebetween the westerly and the easterly one is about 150 kmand increases to more than 400 km in the afternoon of 16January 1997 (not within the display range of Fig. 2). Fur-thermore, the series of horizontal sections indicates an appar-ent downstream advection of the westerly cold anomaly to-wards the east. However, inspection of the vertical sectionsreveals that the horizontal wavelength of the westerly tem-perature anomaly increases from less than 50 km at 00:00 UTto about 200 km at 16:00 UT. Consequently, also its posi-tion relative to the mountain range shifts leeward. This isdue to the excitation of hydrostatic gravity waves in the ro-tating regime by the long-lasting flow past the Scandinavianmountain ridge (e.g. Dornbrack et al., 1999, 2002). Theseinertia-gravity waves have a non-vanishing horizontal com-ponent of the group velocity, therefore they are able to pro-duce stratospheric temperature anomalies in the lee of themountain ridge. Their smaller vertical group velocity com-pared to non-rotating hydrostatic waves lead to about 5 to10 times larger propagation times to stratospheric levels andto an increasing distance between the westerly and easterlytemperature minima during the day.
The coldest region inside the stratospheric temperatureanomaly, however, propagates northward and is related tothe position of the jetstream underneath. Figure 3 depicts
the tropospheric meteorological evolution above the Scandi-navian mountain range on 16 January 1997. The prominentfeatures are the northward-tilted tropopause (the white bandin the vertical sections corresponding to a potential vorticity(PV) value of 2 PVU) and the tropopause fold associated witha strong jetstream. The difference between the tropopauseheights on the cyclonic and the anticyclonic shear side of thejet is about 6 km. The jetstream attains a maximum velocityof ∼60 ms−1 in its core. In the course of time the tropopausefold and jetstream advance northward (see the horizontal sec-tions of PV and wind on the 308-K isentropic surface). Near-surface winds upstream of Scandinavia are nearly perpendic-ular to the main mountain ridge. They peak at maximum val-ues of∼20 ms−1 at 850 hPa between 00:00 UT and 12:00 UTand decrease afterwards significantly to values below 5 ms−1
(not shown). Hours later this weakening of the near-surfaceswinds causes the wave activity in the stratosphere to decreaseand eventually cease (after∼18:00 UT, see Fig. 4).
The key to understanding the lidar observations at Esrangeand the associated stratospheric temperature structure lies inthe position of the jetstream relative to the lidar site. Thelarge vertical shear of the zonal windU in the troposphere∂U/∂z=60 ms−1/8000 m=7.5×10⁻³ s−1 generates a Froudenumber profileF(z)=Nh/U falling with altitude, whereNis the buoyancy frequency (∼0.01 s−1) andh≈1500 m is theheight of the Scandinavian mountain ridge. In such regions,vertical gravity wave propagation is significantly facilitated.As a consequence, the strongest stratospheric cooling dueto mountain waves is locked with the position of the jet-stream advancing northward (see the stratospheric tempera-ture anomaly in the vertical section of Fig. 3). The minimumtemperature drops from 186 K (00:00 UT) to less than 182 K(16:00 UT) in the mountain wave-induced stratospheric tem-perature anomaly. In summary, the enhanced wave activityabove the jetstream leads to an extra cold region in an alti-tude range between 22 and 26 km which proceeds northwardwhile the longer horizontal mountain waves result in an east-ward drift of the temperature anomaly.
4 PSC macrophysical properties
In the following we show that the use of mesoscale atmo-spheric modeling allows us to identify our measurements asthose of a regional-scale quasi-stationary PSC system chang-ing its position relative to Esrange. This mountain wave-induced PSC system enters the lidar field of view trailingedge first. First NAT particles and then more and more LTAdroplets are detected as the outflow from a westerly wave-induced ice PSC which is subsequently monitored. SuchPSC systems are well known from observations with air-borne lidars (e.g. Wirth et al., 1999; Dornbrack et al., 2002),but have not been measured with ground-based lidars before.
The stratospheric temperature field downstream the Scan-dinavian mountains can be best described as a series of
Atmos. Chem. Phys., 4, 1149–1165, 2004 www.atmos-chem-phys.org/acp/4/1149/

J. Reichardt et al.: Mountain wave PSC over Esrange, Sweden 1155
R (355 nm)
δpar (355 nm)
M1 M2 M3
M4M5 M6
Fig. 4. Temporal evolution of 355-nm backscatter ratioR and of 355-nm particle depolarization ratioδpar on 16 January 1997 over Esrange.Superimposed is the temperature (solid lines; K) from the innermost domain of the mesoscale numerical simulation (1x=3 km). Measure-ment intervals M1–M6 are marked. Backscatter-ratio data between 09:30 and 17:00 UT were taken from Baumgarten (1997). The originalmeasurements at a wavelength of 532 nm (parallel polarization only) were converted to 355-nmR values assuming wavelength-independentparticle scattering. In view of the coarse gradation of the 532-nm data available, no effort was made to account for their polarizationsensitivity.
temperature minima parallel to the ridge (Fig. 2). As the re-sult of the combined synoptic and mesoscale dynamics, thetemperature profile above Esrange changes substantially overtime (Fig. 4). In the morning of 16 January 1997, strato-spheric conditions at the lidar site are governed by the east-erly temperature anomaly leading to temperatures warmerand colder than 192 K at heights below and above∼23 km,respectively. Due to the long-lasting flow past the moun-tain ridge and the associated dilatation of the horizontalwavelength this pattern reverses gradually. At∼07:00 UT,the stratosphere between 21 and 27 km is nearly isother-mal. Later on, the intensifying westerly temperature anomaly
dominates the temperature field over Esrange with temper-atures colder below, and warmer above, the sloping 192-Kisotherm.
The main PSC event is related to the development of thewesterly stratospheric temperature anomaly. It starts around04:00 UT when first particle backscattering is measured at23.5–24 km. Over the next two hours the PSC cloud baselowers to minimum heights around 20.5 km. This corre-lates with a decrease in temperature at altitudes<23 km.Afterwards, PSC base and top move steadily upwards by∼170 m/h until 19:30 UT with the geometrical thickness ofthe PSC remaining nearly constant at∼3 km. The simulated
www.atmos-chem-phys.org/acp/4/1149/ Atmos. Chem. Phys., 4, 1149–1165, 2004

1156 J. Reichardt et al.: Mountain wave PSC over Esrange, Sweden
stratospheric temperature anomaly also shows this upwardpropagation.
PSC optical data before 07:40 UT reveal an increaseof R and a reduction ofδpar with decreasing temperature.The change is particularly pronounced at sunrise around06:40 UT. This transition in PSC optical signature, whichis discussed in greater detail in Sect. 5.1, suggests that scat-tering by LTA droplets increasingly dominates scattering bysolid particles, most likely consisting of NAT (the edge ofthe PSC follows quite well the NAT equilibrium temperatureTNAT).
After sunrise and until∼17:00 UT,R values continue toincrease while the ambient air masses are cooling. Backscat-ter spikes at 24 km between 09:00 UT and 11:30 UT areprobably caused by PSC patches consisting predominantly ofice particles (type-II PSC) rather than by LTA droplets (type-Ib PSC) or crystalline NAT particles (type-Ia PSC) becauseR values clearly exceed those expected for type-I PSCs. Be-tween 13:00 UT and∼18:00 UT the cold core of the west-erly temperature anomaly resides directly above Esrange.The mesoscale simulation indicates minimum temperaturesof 181 K at 24 km which is about 3 K below the frost point.Therefore one can conclude that the extreme backscatter ra-tios (>25 at 355 nm,>150 at 532 nm) and particle depolar-ization ratios (>0.5) measured by the two lidars are the op-tical signature of a PSC II where the ice particles nucleatednot far upstream of the observation site.
After 18:00 UT wave activity weakens leading to an up-stream shift of the attenuating temperature minimum. TheEsrange lidars monitor the outflow of the westerly temper-ature anomaly again. Around 19:00 UT the PSC collapsesto a 0.5-km wide layer. Associated with the change in geo-metrical properties is a drastic transition in PSC backscatterand particle depolarization ratios. The slowly subsiding thinPSC clearly exhibits the optical characteristics of a PSC Ib,except for short-lived patches around 20:00 UT with elevatedδpar. Apparently, the windward temperature minimum shal-lowed to such an extent that nucleation of solid particles issignificantly reduced. Wave-processing foremost results ingrowth and evaporation of the liquid aerosol. This cloudcould have extended to the western side of the Scandinavianmountain ridge where a PSC with similar properties was ob-served at the same time (Fricke et al., 1999). The transitionfrom PSC II to PSC Ib as observed between 17:00 UT and20:00 UT over Esrange will be discussed in more detail inSect. 5.2.
5 PSC microphysical properties
In this Section we present the results of our microphysicalstudies that helped us derive the general interpretation of ourlidar measurements on 16 January 1997 given before. Wefocus on the two major events that were captured with theGKSS Raman lidar, specifically, these are the transitions in
the PSC optical characteristics from PSC Ia (with enhancedR) to PSC Ib (04:00–09:00 UT), and from PSC II to PSC Ib(17:00–20:00 UT).
5.1 PSC observations in the morning of 16 January 1997
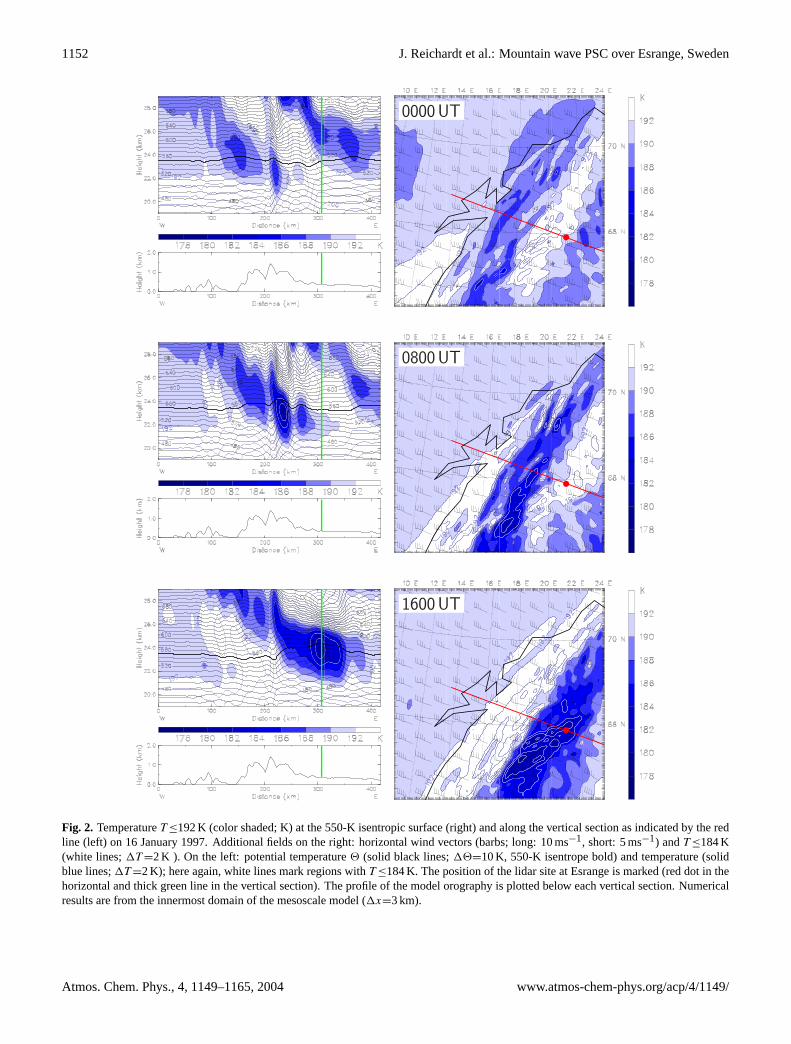
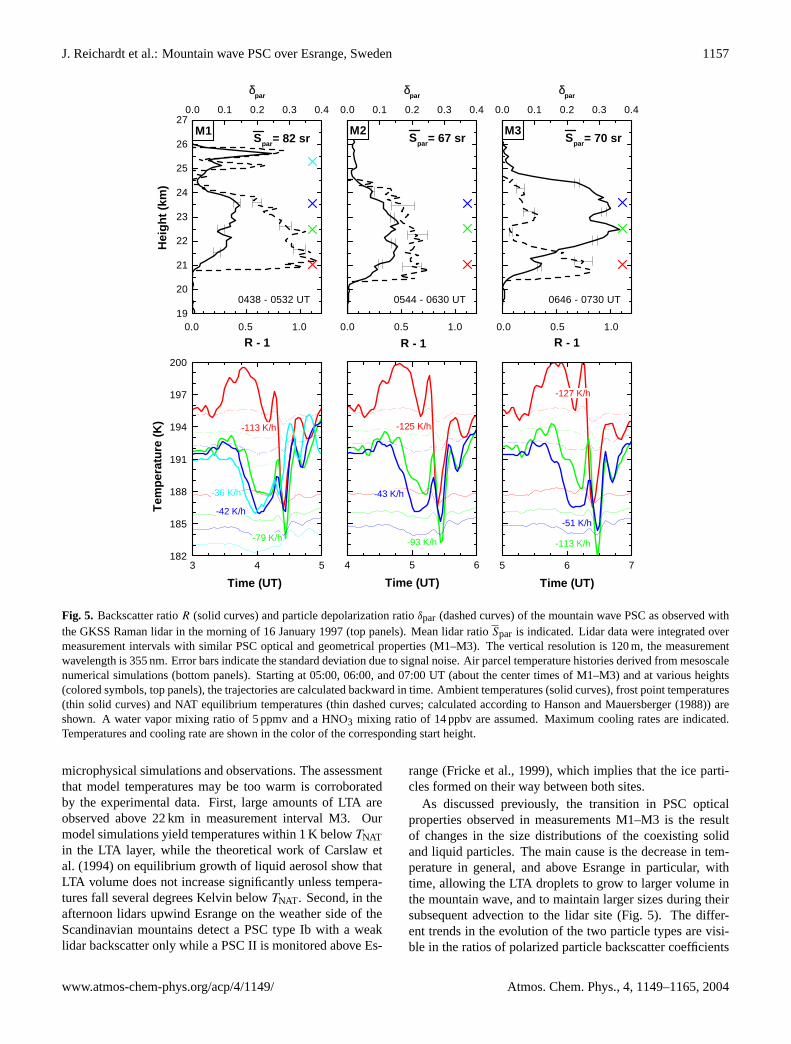
Figure 5 displays the evolution of the PSC backscatter-ratioand depolarization-ratio profiles in the morning of 16 January1997. To increase the precision of theSpar determination,lidar data are summed over three consecutive measurementintervals M1–M3 with relatively little variation in PSC op-tical and geometrical properties (cf. Fig. 4). Generally,δpar
andSpar decrease, andR increases, with time although someexceptions exists. For example, cloud-baseδpar values mea-sured during interval M3 are similar to those observed duringinterval M2. Apparently, LTA droplets that depressδpar at thePSC altitudes above are smaller in number, small in size, orcompletely absent here. Interestingly,Spar values of intervalsM2 and M3 are comparable despite the significant change inthe fractional contributions of crystalline and liquid particlesto PSC light scattering (see Fig. 6). As we will discuss later,decomposition of the PSC optical signature into particle-typespecific optical properties as well as microphysical consider-ations suggest that the solid and liquid particles indeed havesimilar lidar ratios that change little over time.
To facilitate interpretation of the lidar measurements,backward trajectories based on mesoscale simulation fieldswere calculated. Air parcel temperature histories are pre-sented in Fig. 5 for selected PSC heights. The last two hoursprior to the lidar observations are shown. The mountain waveinduced several cycles of cooling and heating of which, in thecase of the main PSC layer between 20 and 25 km, the mostpronounced occurred 30 min before the observations. In thistemperature anomaly of rather short duration, the air massesare cooled by several degrees Kelvin to minimum tempera-tures with high cooling rates (particularly during measure-ments M2 and M3 at heights<23 km), but reach only in onecase (22.5 km, measurement M3) temperatures 3–4 K belowthe frost point (assuming 5 ppmv H2O) which is generally re-garded as the threshold temperature range for ice-particle nu-cleation (Tabazadeh et al., 1997; Carslaw et al., 1998). How-ever, considering the accuracy of the mesoscale numericalsimulations, and in view of observational evidence we con-sider it very likely that mountain wave temperatures actu-ally fell below this nucleation threshold in all cases, and thatsolid particles subsequently formed. Previous studies showthat the discrepancies between simulated and measured tem-peratures can be several degrees Kelvin, with the mesoscalemodel temperatures consistently being warmer (Larsen etal., 2002; Fueglistaler et al., 2003). In our case, a temper-ature correction of−1 to−3 K (depending on height) wouldbe required to trigger ice nucleation both in the morning(Fig. 5) and the afternoon (Fig. 7) of 16 January (all otherparameters unchanged), which is in the range of tempera-ture corrections Larsen et al. (2002) had to apply to match
Atmos. Chem. Phys., 4, 1149–1165, 2004 www.atmos-chem-phys.org/acp/4/1149/
J. Reichardt et al.: Mountain wave PSC over Esrange, Sweden 1157
3 4 5182
185
188
191
194
197
200
-42 K/h
-36 K/h
-79 K/h
-113 K/h
Tem
per
atu
re (
K)
Time (UT)
4 5 6
-43 K/h
-93 K/h
-125 K/h
Time (UT)
5 6 7
-51 K/h
-113 K/h
-127 K/h
Time (UT)
0.0 0.1 0.2 0.3 0.4
Spar= 82 sr
0438 - 0532 UT
δpar
0.0 0.1 0.2 0.3 0.4
0544 - 0630 UT
δpar
Spar= 67 sr
0.0 0.1 0.2 0.3 0.4
0646 - 0730 UT
δpar
Spar= 70 sr
19
20
21
22
23
24
25
26
27
0.0 0.5 1.0
M1
R - 1
Hei
gh
t (k
m)
0.0 0.5 1.0
M2
R - 10.0 0.5 1.0
M3
R - 1
Fig. 5. Backscatter ratioR (solid curves) and particle depolarization ratioδpar (dashed curves) of the mountain wave PSC as observed withthe GKSS Raman lidar in the morning of 16 January 1997 (top panels). Mean lidar ratioSpar is indicated. Lidar data were integrated overmeasurement intervals with similar PSC optical and geometrical properties (M1–M3). The vertical resolution is 120 m, the measurementwavelength is 355 nm. Error bars indicate the standard deviation due to signal noise. Air parcel temperature histories derived from mesoscalenumerical simulations (bottom panels). Starting at 05:00, 06:00, and 07:00 UT (about the center times of M1–M3) and at various heights(colored symbols, top panels), the trajectories are calculated backward in time. Ambient temperatures (solid curves), frost point temperatures(thin solid curves) and NAT equilibrium temperatures (thin dashed curves; calculated according to Hanson and Mauersberger (1988)) areshown. A water vapor mixing ratio of 5 ppmv and a HNO3 mixing ratio of 14 ppbv are assumed. Maximum cooling rates are indicated.Temperatures and cooling rate are shown in the color of the corresponding start height.
microphysical simulations and observations. The assessmentthat model temperatures may be too warm is corroboratedby the experimental data. First, large amounts of LTA areobserved above 22 km in measurement interval M3. Ourmodel simulations yield temperatures within 1 K belowTNATin the LTA layer, while the theoretical work of Carslaw etal. (1994) on equilibrium growth of liquid aerosol show thatLTA volume does not increase significantly unless tempera-tures fall several degrees Kelvin belowTNAT . Second, in theafternoon lidars upwind Esrange on the weather side of theScandinavian mountains detect a PSC type Ib with a weaklidar backscatter only while a PSC II is monitored above Es-
range (Fricke et al., 1999), which implies that the ice parti-cles formed on their way between both sites.
As discussed previously, the transition in PSC opticalproperties observed in measurements M1–M3 is the resultof changes in the size distributions of the coexisting solidand liquid particles. The main cause is the decrease in tem-perature in general, and above Esrange in particular, withtime, allowing the LTA droplets to grow to larger volume inthe mountain wave, and to maintain larger sizes during theirsubsequent advection to the lidar site (Fig. 5). The differ-ent trends in the evolution of the two particle types are visi-ble in the ratios of polarized particle backscatter coefficients
www.atmos-chem-phys.org/acp/4/1149/ Atmos. Chem. Phys., 4, 1149–1165, 2004

1158 J. Reichardt et al.: Mountain wave PSC over Esrange, Sweden
20
21
22
23
24
25
0.0 0.5 1.0
solidδpar = 0.3
Hei
gh
t (k
m)
(R-1)solid
0.0 0.5 1.0
(R-1)liquid
20
21
22
23
24
25
0.0 0.5 1.0
x10
B
Hei
gh
t (k
m)
0.0 0.5 1.0
M1 M2 M3
B
Fig. 6. Coexistence of solid and liquid PSC particles observed inthe morning of 16 January 1997. Ratio of perpendicular-polarizedparticle backscatter coefficient to molecular backscatter coefficient(B⊥), ratio of parallel-polarized particle backscatter coefficient tomolecular backscatter coefficient (B‖), and scattering contributionsof solid [(R − 1)solid] and liquid [(R−1)liquid] particles to the PSCbackscatter ratio for measurement intervals M1–M3.(R−1)solidand(R−1)liquid are retrieved under the assumption that solid par-ticles at all PSC heights have depolarization ratios similar to thosemeasured below 22.5 km during time period M1 (δsolid
par ≈0.3). Error
bars reflect uncertainties inδsolidpar of ±0.05.
to molecular backscatter coefficient (Fig. 6).B‖ indicatesthe significant temperature-related increase in droplet vol-ume while, in contrast,B⊥ exhibits little variability. Fromthe spatial and temporal homogeneity ofB⊥ the importantconclusion can be drawn that the optical and microphysicalproperties of the crystalline particles are similar throughoutthe vertical extent of the PSC and remain unchanged dur-ing measurement intervals M1–M3. Consequently, the mostaccurate measurement of the depolarization ratio of scat-tering by these solid particles,δsolid
par , is obtained at heightsand times where temperatures are too warm for liquid par-ticles to exist in significant amounts. This condition should
be approximately met in measurement M1, and we obtainδsolid
par =0.3±0.05. With this estimate we are able to calcu-late the contributions of solid and liquid particles to the PSCbackscatter ratio. Using the defining equations ofB⊥, B‖,andδsolid
par (δliquidpar =0), we obtain
(R − 1)solid = B⊥(1 + 1/δsolidpar ), (4)
(R − 1)liquid = B‖− B⊥/δsolid
par , (5)
with R−1=(R−1)solid+(R−1)liquid. The results of the com-putations are shown in Fig. 6. Solid-particle scattering domi-nates measurements M1 and M2; the low(R−1)liquid valuesmay either indicate scattering by few or small coexisting LTAdroplets, or be the residual of our computations ifδsolid
par wasoverestimated. In contrast,(R−1)liquid�(R−1)solid is foundin measurement M3 for heights>22 km.
We mentioned before thatSpar values of measurementsM2 and M3 are similar. Since our trend analysis of Fig. 6suggests that the optical properties of the solid particlesremain the same, this must also be the case for the LTAdroplets. For this reason, we will assumeSpar=(70±14) sr(20% systematic error, see Section 2) for both crystallinePSC particles (δsolid
par =0.25–0.35, measurements M1–M3)
and liquid PSC particles (δliquidpar =0, measurement M3) in our
retrieval of microphysical properties. The elevatedSpar valuemeasured during time period M1 is not considered represen-tative of the solid particles, since the appearance of an iso-lated and short-lived PSC patch around 25.5 km (Figs. 4 and5) might affect the accuracy of theSpar measurement for themain PSC layer. Furthermore, we will assume that the solidparticles consisted of NAT as was observed in situ by Voigt etal. (2000) under conditions similar to ours (particles sampledabout 2 h downwind a mountain wave-induced PSC II).
5.2 PSC observations in the afternoon of 16 January 1997
Figure 7 shows our PSC measurements during and shortlyafter the core of the mountain wave-induced temperatureanomaly resided over Esrange. PSC optical signatures areremarkably different from those observed earlier (Fig. 5).During measurements M4 and M5,R andδpar reach maxi-mum values of, respectively, 10–20 and 0.5–0.65, whileSpardecreases to 20–35 sr. These optical characteristics, whichare similar to those of cirrus clouds (Reichardt et al., 2002a),leave no doubt that the PSC consisted of large water-ice parti-cles (PSC type II). The temperature histories confirm coolingof the advected air masses of up to 15 K with minimum tem-peratures being reached only minutes before lidar detectionat Esrange. Thus the lidars were monitoring newly nucleatedice particles during time periods M4 and M5 in the main PSClayer. Below 24.2 km during measurement M5, however, themeteorological conditions must have been different sinceR
andδpar are significantly smaller. Theδpar values of 0.05–0.1 could be explained by scattering by predominant LTAdroplets in coexistence with a small number of crystalline
Atmos. Chem. Phys., 4, 1149–1165, 2004 www.atmos-chem-phys.org/acp/4/1149/

J. Reichardt et al.: Mountain wave PSC over Esrange, Sweden 1159
16 17180
183
186
189
192
195
198
-42 K/h
-42 K/h
Tem
per
atu
re (
K)
Time (UT)
16 17 18
-44 K/h
-40 K/h
Time (UT)
18 19
-29 K/h
-53 K/h
Time (UT)
0.0 0.2 0.4 0.6
Spar= 20 sr
1701 - 1743 UT
δpar
0.0 0.2 0.4 0.6
Spar= 35 sr
1743 - 1818 UT
δpar
0.0 0.2 0.4 0.6
Spar= 113 sr
10
1908 - 1950 UT
δpar
19
20
21
22
23
24
25
26
27
0 5 10 15 20
M4
R - 1
Hei
gh
t (k
m)
0 5 10 15 20
M5
R - 10 5 10 15 20
M6
x
R - 1
Fig. 7. Same as in Fig. 5, but for the afternoon of 16 January 1997 (measurements M4–M6). Backscatter ratio of measurement M6 wasmultiplied by a factor of ten.
particles. The same may be the case for the main PSC layeraround 25 km in measurement M6, but the precision of theexperimental data is not sufficient to test this hypothesis.
Since in measurements M4–M6 scattering by either solidor liquid particles dominates, analysis ofB⊥ andB‖ doesnot yield any additional information and is, therefore, notshown. Finally, we would like to point out that in all themeasurements M1–M6 cooling was rapid (�10 K/h). Ac-cording to the study of Luo et al. (2003) we can thus expectthe ice particle number density to be limited by the numberdensity of the background aerosol only. Furthermore, NATparticles should be significant in number if NAT formed viadeposition nucleation on ice particles.
5.3 Microphysical retrieval
In the following, PSC microphysical properties retrievedfrom the lidar measurements are discussed. Solid particles
are assumed to consist of NAT, or ice. For NAT a refractiveindex of 1.53 as observed by Deshler et al. (2000) is chosen,for ice the data of Warren (1984) are used (refractive indexof 1.32 at 355 nm). Phase matrices of hexagons and irreg-ular particles are calculated with the finite-difference time-domain method described by Yang et al. (2000). Scatter-ing properties of spheroids with aspect ratios (defined as theratio of length to diameter of the particle) smaller or largerthan one are calculated according to the T-matrix technique.The computer code used is available at http://www.giss.nasa.gov/∼crmim/t matrix.html (Mishchenko, 1991). Mie theoryis applied to determine the phase functions of spheres (vande Hulst, 1981). For a discussion of the optical constants se-lected, and for more details about the computations see Rei-chardt et al. (2002c).
It is assumed that the size distribution of the optically rel-evant PSC particles is narrow. In the case of mountain wavePSCs this approximation is justified as in situ measurements
www.atmos-chem-phys.org/acp/4/1149/ Atmos. Chem. Phys., 4, 1149–1165, 2004

1160 J. Reichardt et al.: Mountain wave PSC over Esrange, Sweden
(Voigt et al., 2000), microphysical modeling (Tsias et al.,1999; Larsen et al., 2002), and size-spectrum-resolved re-trievals from lidar data (Tsias et al., 1999; Wirth et al., 1999;Toon et al., 2000; Hu et al., 2002) confirm. The analysis firstfocuses on solid particles, specifically those observed duringmeasurement intervals M1–M3, M4 and M5.
5.3.1 Solid particles
Estimates of particle shapes, sizes, and number concentra-tions are obtained by comparing measurements and theoret-ical optical data. For the first time lidar ratio is used in theretrieval next to particle depolarization ratio.Spar and δparare two optical properties that ideally complement one an-other because they contain different information about thescattering matrix of the PSC particle ensemble. Both are in-dependent of the particle number concentration and thus canbe directly used to infer particle microphysical characteris-tics.
Different principal particle shapes are investigated. Stud-ies by Liu and Mishchenko (2001) and Reichardt et al.(2002c) demonstrate that retrieval results depend stronglyon the assumed shapes of the particles, but to our knowl-edge PSC observations with lidar were analyzed by use of aspheroidal particle model only (Carslaw et al., 1998; Tsias etal., 1999; Wirth et al., 1999; Flentje et al., 2002; Hu et al.,2002; Fueglistaler et al., 2003). In this study we compare thelidar data to the optical properties of spheroids, hexagons,and, for the first time, particles without any symmetry (irreg-ular particles).
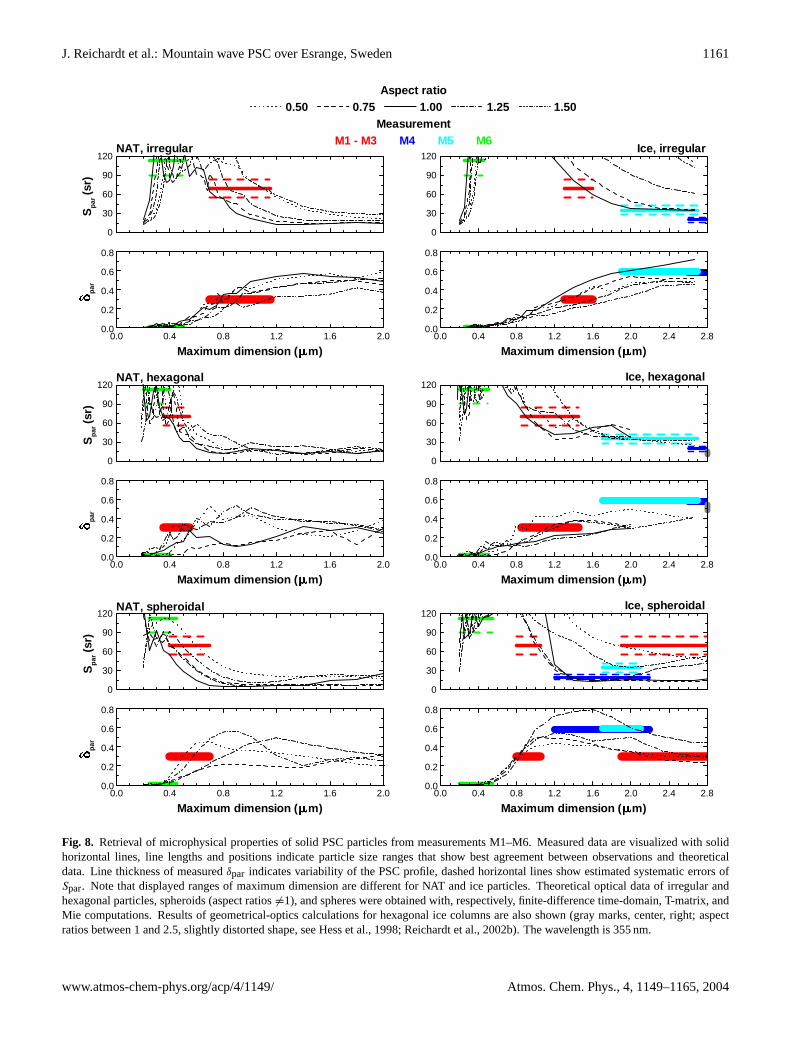
Figure 8 compares measured and theoretical optical prop-erties of solid PSC particles. Theoretical lidar ratio and par-ticle depolarization ratio are plotted versus the maximum di-mension of the particles. Measurements are visualized withsolid horizontal lines. Lengths and positions indicate particlesize ranges with best-possible agreement between observa-tions and theoretical data. The size ranges are relatively welldefined in most cases, despite the fact that only two opticalproperties are available to constrain the retrieval. The reasonfor the stability of the solutions is the opposite dependenceof δpar andSpar on particle maximum dimension. Only if theparticles are much larger than the observation wavelength, asit is the case in measurements M4 and possibly in M5,Sparandδpar are not sensitive to changes in particle size any more,and the retrieval results become unstable.
For the solid particles observed during measurement in-tervals M1–M3, good agreement between measured and the-oretical optical data for a broad range of sizes is found forirregular NAT and hexagonal ice particles. Nevertheless wecan exclude the ice particles from our analysis if we take intoaccount that in the morning of 16 January ambient temper-atures were significantly warmer thanTice, and that a welldeveloped hexagonal symmetry is rather unlikely for smallice particles with 0.8–1.4µm maximum dimension anyway.Examining the optical data of irregular NAT particles closer,
we find that the particles most likely had maximum dimen-sions between 0.7 and 0.9µm and aspect ratios between 0.75and 1.25 or sizes of about 1.1µm with either small (0.5) orlarge (1.5) aspect ratios.
From(R−1)solid≈0.3 it then follows that the particle num-ber density wasnNAT=8–12 cm−3, and that condensation ofgas-phase HNO3 was equivalent to 4.5–7.6 ppbv (generally,retrieval results are such that small maximum dimensionscorrespond to high number densities and small amounts ofcondensed HNO3, and vice versa). A summary of all mea-sured optical and retrieved microphysical properties is givenin Table 1.
Our retrieval results are consistent with those of previousstudies of NAT PSCs with highnNAT (�1 cm−3) downwindmountain waves with rapid cooling (�10 K/h) (Tsias et al.,1999; Wirth et al., 1999; Toon et al., 2000). Furthermore,our data are in good agreement with the theoretical relation-ship betweennNAT and cooling rate as derived by Luo et al.(2003) assuming NAT forming via deposition nucleation onice particles, and thus can be considered as additional obser-vational evidence of this hypothesis.
M4 and M5 observations are compared to theoretical op-tical data of ice crystals only, since the elevated backscatterratios are too high for PSCs consisting of NAT particles, evenfor those generated by mountain waves (Tsias et al., 1999;Reichardt et al., 2000b). M4 depolarization ratios agree wellwith δpar values of irregular ice particles>1.9µm, but mea-sured lidar ratios are smaller than the theoretical data, evenfor a particle maximum dimension of 2.7µm. If a hexago-nal particle shape is assumed, M4 measurements do not fitthe computational results for particle sizes<2.7µm, but areclose to the theoretical values obtained in the geometrical-optics approximation for columnar hexagons with aspect ra-tios between 1 and 2.5. This similarity implies that the par-ticles observed during measurement interval M4 were large,probably�3µm.
In the case of measurement M5, observation and theoryare in excellent agreement for isometric and slightly oblateirregular ice particles (aspect ratios of 0.75 and 1) with sizes>1.9µm. TheoreticalSpar values of hexagons indicate sim-ilar particle maximum dimensions, yet measured and calcu-lated δpar disagree. Again, the upper boundary of the par-ticle size range cannot be retrieved because our observa-tion at 355 nm is lacking sensitivity to size for large par-ticles. For a more accurate size estimate, observations atlonger wavelengths would be needed. The lower limit of theparticle maximum dimension (>1.9µm) confines the par-ticle number density tonice<27 cm−3. This upper bound-ary is probably too high sincenice should not be larger thanthe number concentration of the background aerosol (Luo etal., 2003), but maximumnCN values measured in (mountainwave) PSCs are, to our knowledge, about 20 cm−3 (Larsen etal., 2002).
Assuming spheroidal particle shapes, we retrieve a mix-ture of slightly oblate and prolate particles (aspect ratios of
Atmos. Chem. Phys., 4, 1149–1165, 2004 www.atmos-chem-phys.org/acp/4/1149/
J. Reichardt et al.: Mountain wave PSC over Esrange, Sweden 1161
0
30
60
90
120NAT, irregular
Aspect ratio 0.50 0.75 1.00 1.25 1.50
MeasurementM1 - M3 M4 M5 M6
Sp
ar (
sr)
0.0 0.4 0.8 1.2 1.6 2.00.0
0.2
0.4
0.6
0.8
< <p
ar
Maximum dimension (EEm)
0
30
60
90
120Ice, irregular
0.0 0.4 0.8 1.2 1.6 2.0 2.4 2.80.0
0.2
0.4
0.6
0.8
Maximum dimension (EEm)
0
30
60
90
120NAT, spheroidal
Sp
ar (
sr)
0.0 0.4 0.8 1.2 1.6 2.00.0
0.2
0.4
0.6
0.8
< <p
ar
Maximum dimension (EEm)
0
30
60
90
120Ice, spheroidal
0.0 0.4 0.8 1.2 1.6 2.0 2.4 2.80.0
0.2
0.4
0.6
0.8
Maximum dimension (EEm)
0
30
60
90
120NAT, hexagonal
Sp
ar (
sr)
0.0 0.4 0.8 1.2 1.6 2.00.0
0.2
0.4
0.6
0.8
< <p
ar
Maximum dimension (EEm)
0
30
60
90
120
Ice, hexagonal
0.0 0.4 0.8 1.2 1.6 2.0 2.4 2.80.0
0.2
0.4
0.6
0.8
Maximum dimension (EEm)
Fig. 8. Retrieval of microphysical properties of solid PSC particles from measurements M1–M6. Measured data are visualized with solidhorizontal lines, line lengths and positions indicate particle size ranges that show best agreement between observations and theoreticaldata. Line thickness of measuredδpar indicates variability of the PSC profile, dashed horizontal lines show estimated systematic errors ofSpar. Note that displayed ranges of maximum dimension are different for NAT and ice particles. Theoretical optical data of irregular andhexagonal particles, spheroids (aspect ratios6=1), and spheres were obtained with, respectively, finite-difference time-domain, T-matrix, andMie computations. Results of geometrical-optics calculations for hexagonal ice columns are also shown (gray marks, center, right; aspectratios between 1 and 2.5, slightly distorted shape, see Hess et al., 1998; Reichardt et al., 2002b). The wavelength is 355 nm.
www.atmos-chem-phys.org/acp/4/1149/ Atmos. Chem. Phys., 4, 1149–1165, 2004

1162 J. Reichardt et al.: Mountain wave PSC over Esrange, Sweden
Table 1. PSC Optical (355 nm) and Retrieved Microphysical Properties. COMP, RI, AR, and MD Denote Composition, Refractive Index,Aspect Ratio, and Maximum Dimension, respectively.
Measurement δpar Spar R−1 COMP RI Shape AR MD n HNO3 cond.sr µm cm−3 ppbv
M1–M3 0.25–0.35 70±14 0.3 NAT 1.53 irregular 0.75–1.25; 0.5, 1.5 0.7–0.9; 1.1 8–12 4.5–7.6M3 0 70±14 0.6 LTA 1.39 spherical 1 0.7–0.9 7–11 3.7–4.8M4 0.52–0.64 20±4 15–20 ice 1.32 irr., hex. >3 0M5 0.55–0.65 35±7 10 ice 1.32 irregular 0.75–1 >1.9 <27 0M6 0 113±22 0.7 LTA 1.37 spherical 1 0.8–0.9 9–10 3.4–6.5
0.3 0.4 0.5 0.6 0.7 0.8 0.9 1.00
40
80
120
160
1.531.45
1.411.39
1.37
1.32
M3
M6
Sp
ar (
sr)
Maximum dimension (EEm)
Fig. 9. Retrieval of microphysical properties of liquid PSC particlesfrom measurements M3 and M6. MeasuredSpar data are indicatedwith white horizontal lines, shaded areas visualize estimated sys-tematic errors. Mie theory was applied to calculate the optical prop-erties of LTA droplets, assuming different chemical compositions(refractive indices are indicated). Computational results obtainedfor pure water ice and NAT are shown for comparison (refractiveindex of 1.32 and 1.53, respectively). The wavelength is 355 nm.
0.75 and 1.25) for the PSC observed during measurementM4. In the case of observation M5, agreement between the-oretical and observed data is confined to a very narrow rangeof size for particles with aspect ratio between 1.25 and 1.5.In contrast to the results obtained for irregularly shaped crys-tals and hexagons, the spheroidal particle model yields bothlower and upper bounds of particle size for measurementsM4 and M5, and the particles are considerably smaller. Thisexample illustrates how the retrieval of microphysical prop-erties from lidar data depends on the assumptions made aboutparticle shape. Thus one has to be careful with microphysi-cal data that were obtained using only one particular particlemodel.
Finally, we analyze measurement M6 because, in theory,the optical signature of this PSC (δpar<5%, Spar=113 sr)could stem from scattering by solid particles alone. Indepen-dently of particle composition and shape, observed and cal-
culated optical properties agree well for particle maximumdimensions between 0.2 and 0.5µm. However, to explainthe backscatter ratio of 1.7 with these small particles, onewould have to assume number concentrations that are not re-alistic (nice>150 cm−3, nNAT>65 cm−3). Thus we concludethat during measurement interval M6 solid and liquid PSCparticles coexisted, and that LTA droplets dominated lightscattering.
5.3.2 Liquid particles
Figure 9 compares M3 and M6 lidar-ratio measurements ofliquid PSC particles with 355-nm theoretical data. Differentchemical compositions of the LTA droplets were assumed inthe Mie computations. In the stratosphere, an increase intemperature is related to a decrease in the water contents ofthe ternary solution and, thus, to an increase in LTA refrac-tive index. In the UV it varies between 1.37 (88 wt% H2O,T ≈Tice−4 K) and 1.45 (55 wt% H2O, T ≈Tice+3 K) (Luo etal., 1996; Krieger et al., 2000).
It is important to note that refractive indices between 1.39and 1.53 correspond to diameters between 0.85 and 0.35µm,respectively, for an assumed lidar ratio of 70 sr. Therefore itseems possible that the lidar ratio of a population of LTAdroplets evaporating due to warming temperatures remainsrelatively unchanged, as we assumed to explain the almostidenticalSpar values of measurement intervals M2 and M3.
The optical data also show that the refractive index of theLTA droplets was smaller in measurement M6 than duringthe earlier observation M3, which is in accordance with themesoscale numerical simulation of colder PSC temperaturesfor the afternoon. The relatively high backscatter ratios of1.6–1.7 in both cases require the droplets sizes to be largesince otherwise droplet concentrations would be too high.Considering temperature andR values, we infer an LTA re-fractive index of 1.39, droplet diameters of 0.7–0.9µm, andparticle concentrations of 7–11 cm−3 for measurement M3.These values correspond with condensation of 3.7–4.8 ppbvHNO3 out of the gas phase.
Combining the results of our microphysical retrieval forLTA and NAT particles, we obtain a total particle numberdensity of 15–23 cm−3. Given the high stratospheric cooling
Atmos. Chem. Phys., 4, 1149–1165, 2004 www.atmos-chem-phys.org/acp/4/1149/

J. Reichardt et al.: Mountain wave PSC over Esrange, Sweden 1163
rates in the morning of 16 January 1997, it appears likelythat about all of the supercooled droplets nucleated ice par-ticles in the mountain wave upwind Esrange (Luo et al.,2003), which would mean that on∼53% of these particlesice-mediated nucleation of NAT occurred. Wirth et al. (1999)report a similar fraction for a mountain wave PSC with com-parable cooling rates. The total amount of condensed HNO3sums up to 8.2 to 12.4 ppbv. This compares well with themicrophysical model results obtained for the mountain wavePSC studied by Larsen et al. (2002). According to Larsen etal. (2002), depletion of the HNO3 gas reservoir can reach100% (or 14 ppbv in that particular case) in the ice PSC,and decreases downwind. About 1 hour after the air parcelswarmed up to temperatures>Tice, depletion between 40%and 90% is found, depending on altitude.
For measurement M6, best agreement between PSC ob-servation and theoretical data is found for water-rich LTAdroplets (refractive index of 1.37) with diameters between0.8 and 0.9µm and a number density of 9–10 cm−3. Theamount of condensed HNO3 (3.4–6.5 ppbv) is similar to thevalue retrieved for the LTA droplets of measurement M3.However, total reduction of gas-phase HNO3 is less pro-nounced than in the latter case, since solid NAT particlesdo not contribute significantly. This is probably due to theshort time span between particle nucleation and lidar obser-vation that does not permit the NAT particles to grow to op-tically relevant sizes (compare Figs. 5 and 7). Finally, wenote that retrieved LTA number densities of measurementsM3 and M6 agree well with those reported previously (Voigtet al., 2000; Biele et al., 2001; Hu et al., 2002), while dropletdiameters appear to be slightly larger (Voigt et al., 2000; Huet al., 2002).
6 Summary
The clarification of the mechanisms that lead to the formationand dissipation of mountain wave-induced PSCs and the as-sessment of their microphysical properties will help to betterunderstand stratospheric ozone chemistry. Our study demon-strates that ground-based lidar measurements can contributeto this endeavor if mesoscale modeling is employed to de-scribe the meteorological setting of the observations. Onlyby combining the two data sets we were able to identify the16 January 1997 mountain wave PSC event as observationalevidence of NAT formation via deposition nucleation on iceparticles. PSC microphysical properties were retrieved bycomparison of the measured particle depolarization ratio andPSC-averaged lidar ratio to theoretical optical data obtainedfor different particle shapes. It is found that for relativelysmall particles retrieval results are stable because lidar ratioand depolarization ratio exhibit an opposite dependence onparticle maximum dimension. However, this is not so withparticles much larger than our observation wavelength of355 nm and thus only a lower limit to the size of the PSC par-
ticles can be derived in this case. The microphysical retrievalof the large PSC particles would have been improved con-siderably, if additionally depolarization and lidar ratios hadbeen available at a longer wavelength, preferably at 1064 nm.
Acknowledgements.This work was funded by grants from NASA’sAtmospheric Chemistry Modeling and Analysis Program, theEuropean Commission, and the German Bundesministerium furBildung, Wissenschaft und Technologie. J. Reichardt wouldlike to thank the other members of the former GKSS lidar team,R. Baumgart and A. Behrendt, and the Esrange staff for theirtechnical support. The meteorological analysis data were availablethrough the ECMWF special project “Effect of non-hydrostaticgravity waves on the stratosphere above Scandinavia” of one of theauthors (A. Dornbrack). The MM5 computations were performedat the German High Performance Computing Center for Climateand Earth System Research in Hamburg, Germany.
Edited by: H. Wernli
References
Ansmann, A., Wandinger, U., Riebesell, M., Weitkamp, C., andMichaelis, W.: Independent measurement of extinction andbackscatter profiles in cirrus clouds by using a combined Ramanelastic-backscatter lidar, Appl. Opt., 31, 7113–7131, 1992.
Baumgarten, G.: Erste Messungen des BonnerRayleigh/Mie/Raman-Lidar auf Esrange, Schweden,zur Untersuchung von dynamisch induzierten polarenStratospharenwolken im Januar 1997, Diplomarbeit (Uni-versitat Bonn, Bonn, Germany), BONN-IB-97-26, 1997.
Biele, J., Tsias, A., Luo, B. P., Carslaw, K. S., Neuber, R., Beyerle,G., and Peter, T.: Nonequilibrium coexistence of solid and liquidparticles in Arctic stratospheric clouds, J. Geophys. Res., 106,22 991–23 007, 2001.
Browell, E. V., Butler, C. F., Ismail, S., Robinette, P. A., Carter,A. F., Higdon, N. S., Toon, O. B., Schoeberl, M. R., and Tuck,A. F.: Airborne lidar observations in the wintertime Arctic strato-sphere: polar stratospheric clouds, Geophys. Res. Lett., 17, 385–388, 1990.
Carslaw, K. S., Luo, B. P., Clegg, S. L., Peter, Th., Brimblecombe,P., and Crutzen, P. J.: Stratospheric aerosol growth and HNO3gas phase depletion from coupled HNO3 and water uptake byliquid particles, Geophys. Res. Lett., 21, 2479–2482, 1994.
Carslaw, K. S., Wirth, M., Tsias, A., Luo, B. P., Dornbrack, A.,Leutbecher, M., Volkert, H., Renger, W., Bacmeister, J. T., andPeter, T.: Particle microphysics and chemistry in remotely ob-served mountain polar stratospheric clouds, J. Geophys. Res.,103, 5785–5796, 1998.
Deshler, T., Nardi, B., Adriani, A., Cairo, F., Hansen, G., Fierli,F., Hauchecorne, A., and Pulvirenti, L.: Determining the indexof refraction of polar stratospheric clouds above Andoya (69◦ N)by combining size-resolved concentration and optical scatteringmeasurements, J. Geophys. Res., 105, 3943–3953, 2000.
Dornbrack, A., Leutbecher, M., Kivi, R., and Kyro, E.: Mountainwave induced record low stratospheric temperatures above north-ern Scandinavia, Tellus, 51A, 951–963, 1999.
Dornbrack, A., Leutbecher, M., Reichardt, J., Behrendt, A., Muller,K.-P., and Baumgarten, G.: Relevance of mountain wave cooling
www.atmos-chem-phys.org/acp/4/1149/ Atmos. Chem. Phys., 4, 1149–1165, 2004

1164 J. Reichardt et al.: Mountain wave PSC over Esrange, Sweden
for the formation of polar stratospheric clouds over Scandinavia:mesoscale dynamics and observations for January 1997, J. Geo-phys. Res., 106, 1569–1581, 2001.
Dornbrack, A., Birner, T., Fix, A., Flentje, H., Meister, A.,Schmid, H., Browell, E. V., and Mahoney, M. J.: Evi-dence for inertia gravity waves forming polar stratosphericclouds over Scandinavia, J. Geophys. Res., 107, D20, 8287,doi:10.1029/2001JD000452, 2002.
Dudhia, J.: A non-hydrostatic version of the Penn State-NCARMesoscale Model: validation tests and simulation of an Atlanticcyclone and cold front, Mon. Weather Rev., 121, 1493–1513,1993.
Dudhia, J., Gill, D., Guo, Y.-R., Manning, K., and Wang, W.:PSU/NCAR Mesoscale Modeling System Tutorial Class Notesand User Guide: MM5 Modeling System Version 3, 2001; alsoat www.mmm.ucar.edu/mm5/doc.html.
Flentje, H., Dornbrack, A., Fix, A., Meister, A., Schmid, H.,Fuglistaler, S., Luo, B., and Peter, T.: Denitrification inside thestratospheric vortex in the winter of 1999–2000 by sedimentationof large nitric acid trihydrate particles, J. Geophys. Res., 107,D16, doi:10.1029/2001JD001015, 2002.
Fricke, K. H.: Lee wave modification of polar stratospheric cloudsat the Scandinavian mountain ridge (LWPSC), European Strato-spheric Ozone Research 1996–1997, edited by Amanatidis, G. T.and Harris, N., Vol. 59, Air pollution research report, EUR16987, 71–74, 1997.
Fricke, K. H., Muller, K. P., Serwazi, M., Reichardt, J., Kirkwood,S., Steen,A., Hoffmann, P., Mehrtens, H., Hauchecorne, A.,Fierli, F., Hoppe, U. P., and Hansen, G.: Observations of dynam-ically induced polar stratospheric clouds in the lee of the Scandi-navian mountain ridge, Mesoscale processes in the stratosphere,Proceedings of the European workshop, edited by Carslaw, K. S.and Amanatidis, G. T., Vol. 69, Air pollution research report,EUR 18912 EN, 81–86, 1999.
Fueglistaler, S., Buss, S., Luo, B. P., Wernli, H., Flentje, H.,Hostetler, C. A., Poole, L. R., Carslaw, K. S., and Peter, Th.:Detailed modeling of mountain PSCs, Atmos. Chem. Phys., 3,697–712, 2003.
Gill, A. E: Atmosphere-Ocean Dynamics, Academic Press, NewYork, 1982.
Gobbi, G. P., Di Donfrancesco, G., and Adriani, A.: Physical prop-erties of stratospheric clouds during the Antarctic winter of 1995,J. Geophys. Res., 103, 10 859–10 873, 1998.
Hanson, D. and Mauersberger, K.: Laboratory studies of the ni-tric acid trihydrate: implications for the south polar stratosphere,Geophys. Res. Lett., 15, 855–858, 1988.
Hess, M., Koelemeijer, R. B. A., and Stammes, P.: Scattering ma-trices of imperfect hexagonal ice crystals, J. Quant. Spectrosc.Radiat. Transfer, 60, 301–308, 1998.
Hu, R.-M., Carslaw, K. S., Hostetler, C., Poole, L. R., Luo, B.,Peter, T., Fueglistaler, S., McGee, T. J., and Burris, J. F.: Micro-physical properties of wave polar stratospheric clouds retrievedfrom lidar measurements during SOLVE/THESEO 2000, J. Geo-phys. Res., 107, D20, 8294, doi:10.1029/2001JD001125, 2002.
Krieger, U. K., Mossinger, J. C., Luo, B., Weers, U., and Peter,T.: Measurement of the refractive indices of H2SO4-HNO3-H2Osolutions to stratospheric temperatures, Appl. Opt., 39, 3691–3703, 2000.
Larsen, N., Høyer Svendsen, S., Knudsen, B. M., Voigt, C., Weisser,
C., Kohlmann, A., Schreiner, J., Mauersberger, K., Deshler, T.,Kroger, C., Rosen, J. M., Kjome, N. T., Adriani, A., Cairo, F., DiDonfrancesco, G., Ovarlez, J., Ovarlez, H., Dornbrack, A., andBirner, T.: Microphysical mesoscale simulations of polar strato-spheric cloud formation constrained by in situ measurements ofchemical and optical cloud properties, J. Geophys. Res., 107,D20, 8301, doi:10.1029/2001JD000999, 2002.
Liu, L. and Mishchenko, M. I.: Constraints of PSC particle micro-physics derived from lidar observations, J. Quant. Spectrosc. Ra-diat. Transfer, 70, 817–831, 2001.
Luo, B., Krieger, U. K., and Peter, T.: Densities and refractive in-dices of H2SO4/HNO3/H2O solutions to stratospheric tempera-tures, Geophys. Res. Lett., 23, 3707–3710, 1996.
Luo, B. P., Voigt, C., Fueglistaler, S., and Peter, T.: Ex-treme NAT supersaturations in mountain wave ice PSCs: aclue to NAT formation, J. Geophys. Res., 108, D15, 4441,doi:10.1029/2002JD003104, 2003.
Mishchenko, M. I.: Light scattering by randomly oriented axiallysymmetric particles, J. Opt. Soc. Am. A, 8, 871–882, 1991.
Muller, K.-P., Baumgarten, G., Siebert, J., and Fricke, K. H.: Thenew lidar facility at Esrange, Kiruna, Proceedings, 13th ESASymposium on European Rocket and Balloon Programmes andRelated Research,Oland, Sweden, 26–29 May 1997, ESA SP-397, 129–134, 1997.
Reichardt, J.: Error analysis of Raman differential absorption lidarozone measurements in ice clouds, Appl. Opt., 39, 6058–6071,2000.
Reichardt, J., Wandinger, U., Serwazi, M., and Weitkamp, C.: Com-bined Raman lidar for aerosol, ozone, and moisture measure-ments, Opt. Eng., 35, 1457–1465, 1996.
Reichardt, J., Hess, M., and Macke, A.: Lidar inelastic multiple-scattering parameters of cirrus particle ensembles determinedwith geometrical-optics crystal phase functions, Appl. Opt., 39,1895–1910, 2000a.
Reichardt, J., Tsias, A., and Behrendt, A.: Optical properties of PSCIa-enhanced at UV and visible wavelengths: model and observa-tions, Geophys. Res. Lett., 27, 201–204, 2000b.
Reichardt, J., Reichardt, S., Behrendt, A., and McGee, T. J.: Cor-relations among the optical properties of cirrus-cloud particles:implications for spaceborne remote sensing, Geophys. Res. Lett.,29, doi:10.1029/2002GL014836, 2002a.
Reichardt, J., Reichardt, S., Hess, M., and McGee, T. J.: Cor-relations among the optical properties of cirrus-cloud particles:microphysical interpretation, J. Geophys. Res., 107, D21, 4562,doi:10.1029/2002JD002589, 2002b.
Reichardt, J., Reichardt, S., Yang, P., and McGee, T. J.: Retrievalof polar stratospheric cloud microphysical properties from li-dar measurements: dependence on particle shape assumptions,J. Geophys. Res., 107, D20, 8282, doi:10.1029/2001JD001021,2002c.
Reichardt, J., Baumgart, R., and McGee, T. J.: Three-signal methodfor accurate measurements of depolarization ratio with lidar,Appl. Opt., 42, 4909–4913, 2003.
Schotland, R. M., Sassen, K., and Stone, R.: Observations by lidarof linear depolarization ratios for hydrometeors, J. Appl. Meteo-rol., 10, 1011–1017, 1971.
Stein, B., Wedekind, C., Wille, H., Immler, F., Muller, M., Woste,L., del Guasta, M., Morandi, M., Stefanutti, L., Antonelli, A.,Agostini, P., Rizi, V., Readelli, G., Mitev, V., Matthey, R.,
Atmos. Chem. Phys., 4, 1149–1165, 2004 www.atmos-chem-phys.org/acp/4/1149/
J. Reichardt et al.: Mountain wave PSC over Esrange, Sweden 1165
Kivi, R., and Kyro, E.: Optical classification, existence tem-peratures, and coexistence of different polar stratospheric cloudtypes, J. Geophys. Res., 104, 23 983–23 993, 1999.
Tabazadeh, A., Toon, O. B., and Jensen, E. J.: Formation andimplications of ice particle nucleation in the stratosphere, Geo-phys. Res. Lett., 24, 2007–2010, 1997.
Tsias, A., Wirth, M., Carslaw, K. S., Biele, J., Mehrtens, H., Rei-chardt, J., Wedekind, C., Weiß, V., Renger, W., Neuber, R., vonZahn, U., Stein, B., Santacesaria, V., Stefanutti, L., Fierli, F.,Bacmeister, J., and Peter, T.: Aircraft lidar observations of an en-hanced type Ia polar stratospheric cloud during APE-POLECAT,J. Geophys. Res., 104, 23 961–23 969, 1999.
Toon, O. B., Tabazadeh, A., Browell, E. V., and Jordan, J.: Analysisof lidar observations of Arctic polar stratospheric clouds duringJanuary 1989, J. Geophys. Res., 105, 20 589–20 615, 2000.
van de Hulst, H. C.: Light Scattering by Small Particles, Dover,New York, 1981.
Voigt, C., Schreiner, J., Kohlmann, A., Zink, P., Mauersberger, K.,Larsen, N., Deshler, T., Kroger, C., Rosen, J., Adriani, A., Cairo,
F., Di Donfrancesco, G., Viterbini, M., Ovarlez, J., Ovarlez, H.,David, C., and Dornbrack, A.: Nitric acid trihydrate (NAT) inpolar stratospheric clouds, Science, 290, 1756–1758, 2000.
Wandinger, U.: Multiple-scattering influence on extinction- andbackscatter-coefficient measurements with Raman and high-spectral-resolution lidars, Appl. Opt., 37, 417–427, 1998.
Warren, S. G.: Optical constants of ice from the ultraviolet to themicrowave, Appl. Opt., 23, 1206–1225, 1984.
Wirth, M., Tsias, A., Dornbrack, A., Weiß, V., Carslaw, K. S., Leut-becher, M., Renger, W., Volkert, H., and Peter, T.: Model-guidedLagrangian observation and simulation of mountain polar strato-spheric clouds, J. Geophys. Res., 104, 23 971–23 981, 1999.
Yang, P., Liou, K. N., Mishchenko, M. I., and Gao, B.-C.: Efficientfinite-difference time-domain scheme for light scattering by di-electric particles: application to aerosols, Appl. Opt., 39, 3727–3737, 2000.
Zangl, G.: Stratified flow over a mountain with a gap: linear theoryand numerical simulations, Q. J. R. Meteorol. Soc., 128, 927–949, 2002.
www.atmos-chem-phys.org/acp/4/1149/ Atmos. Chem. Phys., 4, 1149–1165, 2004