Embed Size (px)
Citation preview
TRANSPORTATION RESEARCH RECORD 1233
Movable Concrete Median Barrier Risk Analysis
JAMES E. BRYDEN AND NICHOLAS J. BRUNO
A movable concrete safety-shape barrier was proposed for use in a reversible-lane configuration on the Tappan Zee Bridge of the New York State Thruway. Previous tests had indicated that this barrier provides performance comparable to that of standard rigidconcrete safety-shape barrier, except for deflecting laterally on impact. Because of the narrow median width on this structure, concern arose that an impact on this barrier might cause it to deflect into opposing traffic, causing interference with another vehicle. This paper describes a model developed to assess the risk of interference collisions. Traffic and geometric conditions on the structure and the barrier's deflection characteristics were used to calculate the probability that a primary impact on the barrier would result in interference with opposing traffic. The model was programmed on a microcomputer spreadsheet to. ~acilitate e~amination of various input parameters. For the conditions exammed, the risk of interference impacts with opposing traffic is low, even though the barrier deflects into the adjacent lane for some impacts. This low risk can be weighed against the benefits anticipated from use of the movable barrier to determine whether its introduction is justified.
Based on concepts developed in Australia, a movable segmented concrete safety-shape barrier and transfer machine are now commercially available in the United States. A limited number of installations have been completed in this country (1) and in Europe. Consisting of free-standing, hingeconnected, 3 .3-ft segments of reinforced-concrete barrier, this system can be installed in any total length required and quickly repositioned laterally using the transfer machine. With the exception of lifting notches incorporated near the top, this barrier's cross section is essentially equivalent to standard concrete safety-shape median barrier (CMB), including its height of 32 in and base width of 24 in.
Because it can be quickly and easily repositioned laterally, this barrier has been suggested for use where the lane configuration must be adjusted periodically, such as in construction zones and reversible traffic lanes. Recently, it was considered for a reversible-lane configuration on the Tappan Zee Bridge of the New York State Thruway.
This 3-mi bridge provides the only Hudson River crossing in a 30-mi section immediately north of New York City. It connects Rockland and Westchester counties, both densely populated suburban areas, and provides the major commuter route into the New York metropolitan area for residents on the river's west side. Constructed in the 1950s, the bridge has since been rehabilitated to keep pace with increasing traffic demand (2). The available deck width of 84 ft from curb to curb is currently configured as seven lanes-four eastbound and three westbound. A CMB conforming to the standard
New York State Department of Transportation, Albany, N.Y. 12232 .
MB-5 configuration was installed to replace the previous steel median barrier when the structure was reconfigured from six to seven lanes in 1986.
The morning eastbound traffic peak is more compressed, having higher hourly volumes than the evening westbound peak, so four lanes were provided to accommodate morning peak volumes. The three westbound lanes currently handle evening peak traffic at an acceptable level of service. However, anticipated traffic growth is expected to reduce this level of service during the evening peak. One proposal to accommodate this westbound increase is a reversible lane on the bridge. The number of lanes open to traffic in opposing directions would be adjusted, using the movable CMB (MCMB) to meet traffic demand. Although this scheme would normally result in a four-three lane configuration during peak hours, consideration could also be given to accommodating a fivetwo configuration for special events generating abnormally high directional peaks.
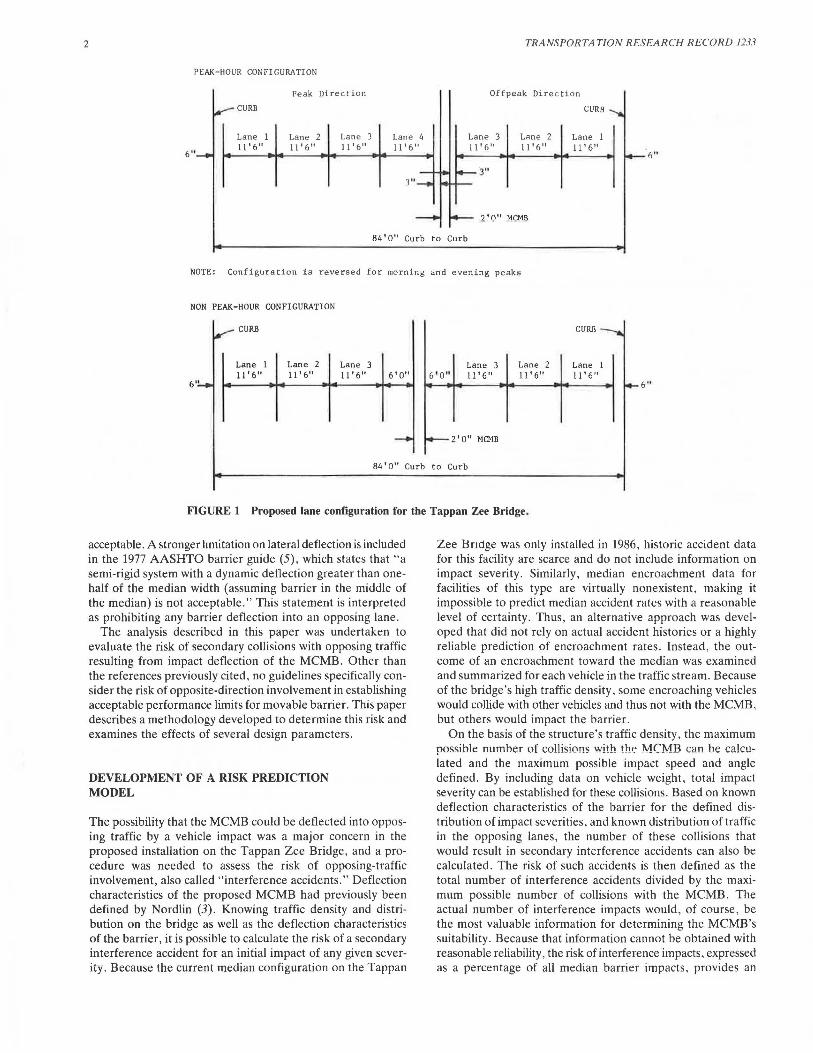
Safety considerations dictate use of a positive traffic barrier-a median barrier-to separate opposing traffic flow on the bridge, and that requirement would continue to apply if a reversible-lane operation were adopted . Because the MCMB can quickly be shifted laterally to reverse the lane configuration, with only minimal disruption to traffic, it offers an attractive solution to this problem. Based on tests completed by the manufacturer (3) and by the California Department of Transportation, this barrier is expected to meet NCHRP Report 230 ( 4) criteria for structural adequacy, occupant risk, and vehicle trajectory. However, unlike most permanent CMB, which is essentially rigid, the new barrier deflects laterally on impact. Depending on the exact joint configuration used, deflections of several feet have been observed for passenger car impacts listed in the recommended test matrix in NCHRP 230. For the Tappan Zee Bridge, both the existing and proposed configurations include lane widths of about 11 ft 6 in, with traffic immediately adjacent to the barrier on each side (see Figure 1). Thus, any substantial lateral deflection resulting from an impact on one side of the MCMB may involve vehicles on the opposing side. Considering the heavy traffic volumes, this could have severe consequences in terms of a chain-reaction collision and resulting traffic congestion during peak-flow periods.
Evaluation factors presented in NCH RP 230 do not include specific provisions for evaluating movable or temporary barriers. Test vehicles must be contained on the impact side of any barrier tested, but controlled lateral deflection is considered acceptable. Although the report does not specifically preclude deflection into the opposing lane, it is clear that interference with opposing traffic would not be considered
2
PEAK-HO UR CONF IGURATION
6"
CURB
Lane 1 11'6"
Peak Direction
Lane 2 11'6"
Lane 3 l l 16 11
Lane I,
11 '6"
) "
TRANSPORTATION RESEARCH RECORD 1233
Offpeak Direction
Lane 3 11 1 6 11
3"
Lane 2 11 '6"
2 'O" MCMJl
CURB
Lane I 11' 6"
6"
84'0" Curb to Curb
NOTE: Configuration is reversed for mor ning and evening peaks
NON PEAK-HOUR CONFIGURATION
6"
CURB
Lane I 11 '6"
Lane 2 11' 6"
Lane 3 11 '6" 6 '0 11
Lane 3 6'0" l l 16 11
Lane 2 11 '6"
CURB
Lane 1 11 '6"
6"
- -2'0" MCMB
84' O" Curb to Curb
FIGURE 1 Proposed lane configuration for the Tappan Zee Bridge.
acceptable. A stronger hmitation on lateral deflection is included in the 1977 AASHTO barrier guide (5), which states that "a semi-rigid system with a dynamic deflection greater than onehalf of the median width (assuming barrier in the middle of the median) is not acceptable." This statement is interpreted as prohibiting any barrier deflection into an opposing lane .
The analysis described in this paper was undertaken to evaluate the risk of secondary collisions with opposing traffic resulting from impact deflection of the MCMB. Other than the references previously cited , no guidelines specifically consider the risk of opposite-direction involvement in establishing acceptable performance limits for movable barrier. This paper describes a methodology developed to determine this risk and examines the effects of several design parameters.
DEVELOPMENT OF A RISK PREDICTION MODEL
The possibility that the MCMB could be deflected into opposing traffic by a vehicle impact was a major concern in the proposed installation on the Tappan Zee Bridge, and a procedure was needed to assess the risk of opposing-traffic involvement, also called "interference accidents." Deflection characteristics of the proposed MCMB had previously been defined by Nordlin (3). Knowing traffic density and distribution on the bridge as well as the deflection characteristics of the barrier, it is possible to calculate the risk of a secondary interference accident for an initial impact of any given severity. Because the current median configuration on the Tappan
Zee Bndge was only installed in 1986, historic accident data for this facility are scarce and do not include information on impact severity. Similarly, median encroachment data for facilities of this type are virtually nonexistent, making it impossible to predict median accident rates with a reasonable level of certainty. Thus, an alternative approach was developed that did not rely on actual accident histories or a highly reliable prediction of encroachment rates. Instead, the outcome of an encroachment toward the median was examined and summarized for each vehicle in the traffic stream. Because of the bridge's high traffic density, some encroaching vehicles would collide with other vehicles and thus not with the MCMB, but others would impact the barrier.
On the basis of the structure's traffic density, the maximum possihle numher of collisions with the MCMB can be calculated and the maximum possible impact speed and angle defined. By including data on vehicle weight , total impact severity can be established for these collisions. Based on known deflection characteristics of the barrier for the defined distribution of impact severities, and known distribution of traffic in the opposing lanes , the number of these collisions that would result in secondary interference accidents can also be calculated. The risk of such accidents is then defined as the total number of interference accidents divided by the maximum possible number of collisions with the MCMB. The actual number of interference impacts would, of course, be the most valuable information for determining the MCMB's suitability. Because that information cannot be obtained with reasonable reliability, the risk of interference impacts, expressed as a percentage of all median barrier impacts. provides an
Bryden and Bruno
alternative approach. The procedure developed gives the upper limit of this risk so potential costs and benefits associated with the proposed design can be compared .
Based on traffic patterns on this structure, it became apparent that the reversible-lane configuration was required for only 3 hr during the morning peak and 4 hr during the evening peak. During these periods, four lanes would be required in the peak direction and three in the offpeak , with the MCMB separating opposing traffic. ("Offpeak" refers to lanes carrying traffic opposed to the peak lanes; "nonpeak" refers to hours when less traffic is carried than in peak periods.) For the remaining 17 hr, with only three lanes required in each direction, the MCMB would be positioned in the middle of the center lane. This configuration would provide a median shoulder about 6 ft wide, essentially eliminating any risk of barrier deflection into opposing traffic during those hours.
During the seven peak hours, traffic volumes (and density) varied considerably by hour and direction. Traffic density controlled both the probability of an encroaching vehicle impacting the barrier and that of a secondary interference impact with an opposing vehicle. The probability of a secondary collision is also related to barrier deflection, which is a function of impact severity. Impact severity is in turn a function of impact angle, which varies according to the lane where encroachment originates and the vehicle's speed and weight. Thus, to determine the total possible number of barrier impacts and interference impacts, it was necessary to conduct the analysis for each hour, each lane and direction, and each vehicle weight class. Because of the large number of categories (seven lanes x 7 hr x five vehicle classes = 245), this problem was well suited to solution on a microcomputer spreadsheet . A model was developed and programmed on Supercalc 4 software operated on an IBM XT computer. This program calculated possible barrier impacts and interference impacts for the 245 classes and provided the total for each. Although this particular model was developed for the lane configuration and 7-hr peak period on this structure with five specific vehicle weight classes, the spreadsheet can be easily modified for alternative situations.
Risk of an interference impact is defined by the following simple equation:
R = NifNT X 100 (1)
where
R = risk of interference impact (percent), N, = maximum possible interference impacts per day, and N r = maximum possible barrier impacts per day.
Nr and N1 are calculated by the spreadsheet program and are defined by the following equations:
(2)
where
V = hourly directional traffic volume, N = number of lanes in the direction considered, and
P 81 = probability of the encroaching vehicle impacting the barrier.
and
(3)
3
where
PLAT = probability that an opposing vehide is within the lateral deflection zone of the impacted barrier, and
PLoNo = probability that an opposing vehicle is within the longitudinal interference zone of the impacted barrier.
The summations include encroachments from each travel lane and direction, each of the seven peak hours, and each vehicle weight category. Each of these parameters are functions of several other factors, including roadway geometry, pavement friction, traffic speeds, barrier deflection characteristics , and driver reaction times. The relationships describing each of these primary parameters, as well as the secondary factors, are discussed below.
Vehicle Speed, Impact Angle, and Weight
Vehicle speed affects impact severity and also controls the maximum impact angle the encroaching vehicle can achieve. For this facility, traffic speeds rarely exceed 45 mph in the peak direction; thus, that speed was selected for the peak side in this analysis. In the offpeak direction , speeds up to 60 mph are encountered, so this higher speed was used on the offpeak side. The speeds selected represent upper limits above which few vehicles operate. They are conservative in that many more vehicles operate below these speeds than above; impact severity based on them is rarely exceeded but is often not reached.
The maximum impact angle a vehicle can achieve is related to its speed, the roadway friction, and the width of roadway available according to the following relationship:
cos e = 1 - gy/V2 (u + <I>) (4)
where
e = impact angle (radians), g = gravitation constant (32.17 ft/sec2
),
y = offset from vehicle center of gravity to the barrier (ft), u = pavement friction coefficient, <I> = pavement sideslope, and V = vehicle velocity (ft/sec).
This relationship defined the impact angle used for New York's early crash test evaluations of traffic barriers (6). For this analysis , a pavement friction value of 0. 70 was combined with a pavement sideslope of 0.04 to obtain a total lateral resistance factor of 0.74. Maximum impact angles were calculated for each lane and design speed, using this lateral resistance value and rounded to the nearest 5° as follows:
Lane
Lateral Offset (ft)
Peak side (45 mph)
Impact Angle (degrees)
1 40.50 35 2 29.00 35 3 17.50 25 4 6.00 15
Offpeak side (60 mph) 1 29.00 25 2 17.50 20 3 6.00 10
4
The maximum possible angle from the extreme right lane (lane 1) was limited to 35° for this analysis. Even though the calculated value slightly exceeded this figure, actual collisions rarely exceed an impact angle of 35° at this speed, and most are less severe. Thus, using this value is still conservative in terms of all encroachments originating from this lane. As with impact speed, this analysis is made conservative by using the maximum achievable angle to define all collisions, because many collisions involve less severe impact angles. Roadway alignment-horizontal and vertical curvature-may also affect impact angle. However, curvature on this structure is slight, and the effects tend to be self-canceling when traffic in both directions is considered. Roadway alignment thus was not considered in this analysis.
During peak hours, large trucks and buses constitute a small proportion of all traffic on the bridge. Further, experience has shown that collisions involving trucks and buses, which are unable to achieve high impact angles, rarely exceed the impact severity of the most severe passenger car impacts. It was considered acceptable to assume that all traffic on the bridge consisted of passenger vehicles, for the following reasons:
• Maximum possible impact severity for passenger cars was included in the analysis.
• Flatter angles were typically involved in truck or hus impacts.
• The proportion of truck and bus traffic during peak hours was low.
• The level of protection for large vehicle impacts provided by current standards is less than for passenger cars.
Although some proportion of vehicles are also light trucks and vans, which are somewhat heavier than the heaviest passenger cars, achievable impact angles for these vehicles are also less severe, and overall severity probably does not exceed the most severe passenger car impacts.
A previous study of traffic barrier performance in New York State (7) categorized passenger car weights into classes, based on a sample of barrier accidents in 1982 and 1983. The weight distribution was as follows:
Weight Range (lb)
Percent of Passenger Cars
<2000 10 2,000-2,500 23 2.501-3.250 31 3,251-4,000 26 4,001-5,000 10
By using the upper bound of each weight range in the analysis, the results were retained on the conservative side. Further, passenger cars have become smaller since 1982, making this weight distribution even more conservative. This conservatism helped offset any reduction in severity caused by not considering heavier vehicles.
The spreadsheet format used to perform this analysis permits direct input of alternative speed, pavement friction, and maximum impact angles. By modifying the spreadsheet format, a different distribution of vehicle weight can also be considered, although this last step requires some adjustment of the spreadsheet.
TRANSPORTA TJON RESEARCH RECORD 1233
Probability of Barrier Impact
If a vehicle encroaches toward a median barrier, it may impact the barrier or it may impact another vehicle. In the latter case, it may not strike the median barrier at all, or it may impact the barrier at a reduced speed and angle. The probability of an encroaching vehicle impacting the median barrier depends both on its encroachment path and the traffic density. For this analysis, it was assumed that any contact with another vehicle prevented barrier contact. Encroachments were assumed to be at the most severe turn rate possible, using the impact angle relationship discussed previously. Higher angle encroachments result in a higher probability of barrier impact and are thus conservative for this analysis. Vehicle size must also be considered; a small size was used for this part of the analysis to obtain the highest probability of barrier impact.
A spreadsheet format was developed to consider departures from each lane and traversal of each adjacent lane individually. Input included lane width for this structure, vehicle dimensions, speed, and pavement friction values. Geometric equations were developed and coded onto the spreadsheet to calculate the distance during traversal of each lane in which that vehicle could interfere with another already in the lane. In addition, the entrance and departure angles were computed for each lane crossed. The longitudinal interference lengths calculated by this spreadsheet were then input onto the main spreadsheet.
The probability of impacting a vehicle in an adjacent lane is denoted as follows:
(5)
where
Pvt.xv = probability that an encroaching vehicle originating from lane X will impact another vehicle in lane Y;
LT.xY = longitudinal interference length for a vehicle originating from lane X and crossing lane Y; and
Gy = average gap length in lane Y, determined from lane volume, speed, and vehicle size.
The probability of crossing a lane without impacting another vehicle is then expressed as
Pc.xY = 1 - Pvt.XY (6)
The probability that a vehicle will impact the barrier is simply the product of the probabilities for each individual lane that must be crossed to reach the barrier. For the threelane side of the bridge, this expression is written
PBl.1 = Pc.1-2 x Pc.1-3 (7)
where P a1.1 is the probability that a vehicle originating from lane 1 (the extreme right lane) will cross lanes 2 and 3 and impact the barrier without impacting another vehicle. A similar expression can be written for lane 2. For lane 3, the probability becomes 1.0. Similar expressions can also be developed for the four-lane peak direction.
Bryden and Bruno
Barrier Deflection
The lateral barrier deflection resulting from a given impact determines the probability of involving a vehicle in the opposing lane-the larger the deflection, the greater the probability. The main spreadsheet was used to sum interference impacts for each lane and each hour that the reversible-lane configuration was in operation. Because vehicle weight affects deflection, the summation considered each of the five weight classes individually.
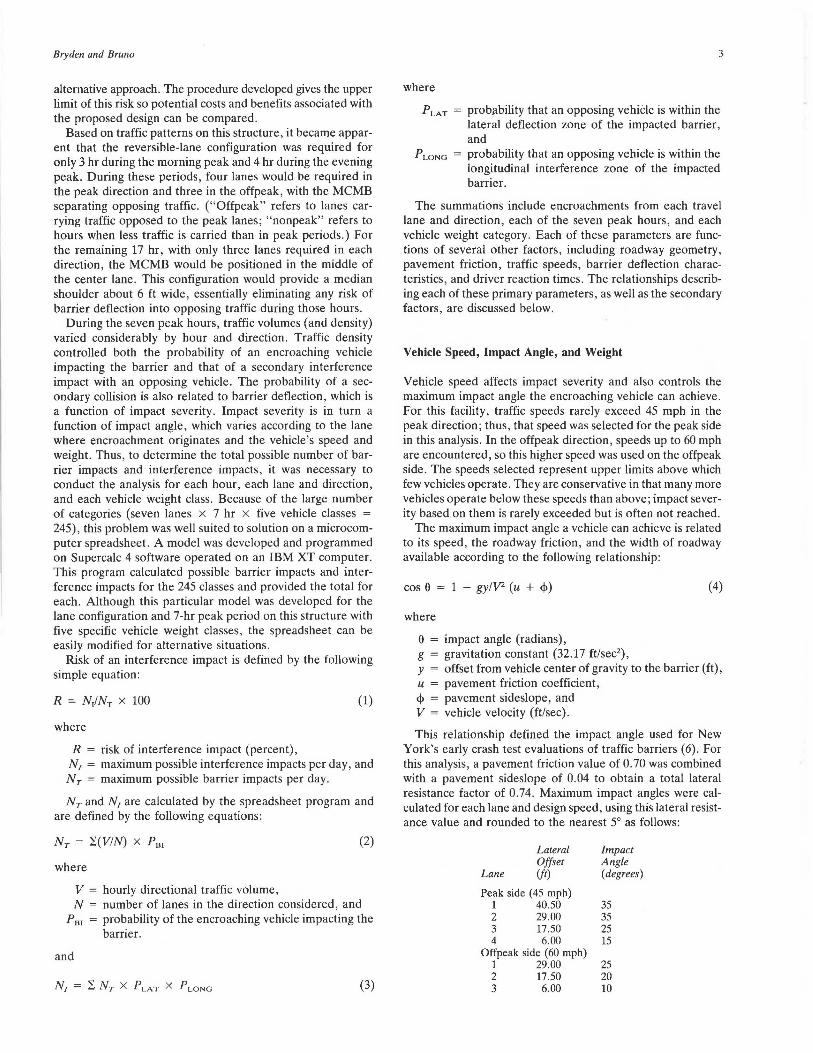
Lateral barrier deflection was reported for 12 crash tests by Nordlin (3) . Examination of those data revealed a close relationship (R2 = 0.92) between the lateral impact momentum of the vehicle and barrier deflection, as shown in Figure 2 and defined by the following equation:
DL = 29.1 x In ML - 190
where
ML = S1 x (88/60) x (Wig) sin A 1,
ML = lateral impact momentum (lb-sec) , DL = lateral deflection (in), S, = impact speed (mph), W = vehicle weight (lb), and A1 = impact angle (degrees).
(8)
(9)
Table 1 compares observed deflections for the 12 tests with the deflections predicted by this equation. For all except the least severe case, the predicted value is within a few inches
•
0 lO 20 30
s
of the observed value and is generally on the conservative, or high, side.
Subsequent to these tests, a series of full-scale tests was initiated in 1987 by the California Department of Transportation. Their purpose was to evaluate barrier design revisions intended to reduce barrier deflections from those reported in Table 1. Although those results have not been published, preliminary indications are that deflection can be reduced, and a similar expression still relates lateral momentum and deflection. To accommodate revised barrier designs having reduced deflection, Equation 6 was revised as follows:
DL = F0 (29.1 X In ML - 190) (10)
where F 0 is a deflection factor relating the magnitude of deflection for the revised design to that reported for the original design. As shown in Figure 2, it is assumed that the deflection-momentum relationship remains unchanged except for the slope of the curve. By including the deflection factor in the spreadsheet program, the effects of barrier design revisions are easily examined.
Lateral Probability of Opposing Traffic Interference
Using the relationship between impact severity and lateral deflection just outlined, the spreadsheet calculates maximum possible deflection for each vehicle class-for each lane and each hour. It then becomes necessary to determine the prob-
40 50 60 70
Lateral Barrier Deflection, Jn.
FIGURE 2 Lateral traffic barrier deflection related to lateral impact momentum.
6
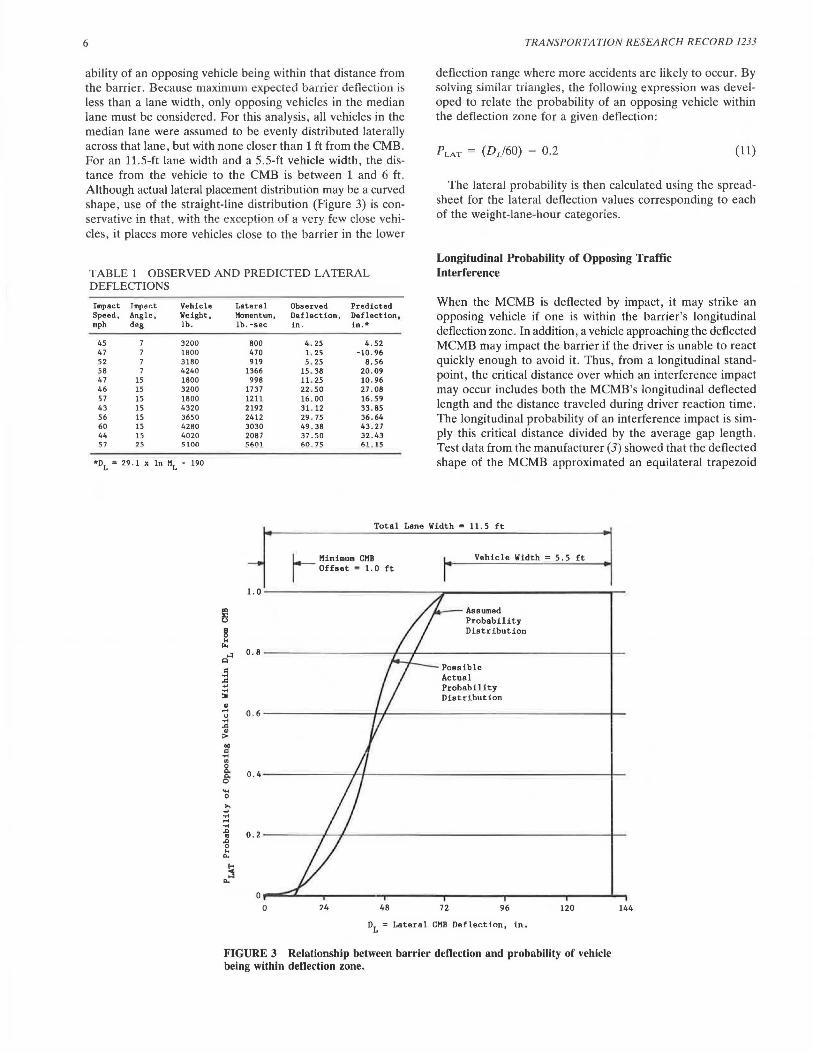
ability of an opposing vehicle being within that distance from the barrier. Because maximum expected barrier deflection is less than a lane width, only opposing vehicles in the median lane must be considered. For this analysis, all vehicles in the median lane were assumed to be evenly distributed laterally across that lane, but with none closer than 1 ft from the CMB. For an 11.5-ft lane width and a 5.5-ft vehicle width, the distance from the vehicle to the CMB is between 1 and 6 ft . Although actual lateral placement distribution may be a curved shape, use of the straight-line distribution (Figure 3) is conservative in that, with the exception of a very few close vehicles, it places more vehicles close to the barrier in the lower
TABLE 1 OBSERVED AND PREDICTED LATERAL DEFLECTIONS
Impact Impact Vehicle Lateral Observed Predicted Speed, Angle, Weight, Momentum, Deflection, Deflection, mph deg lb. lb. -sec in. in.*
45 3200 800 4 . 25 4.52 47 1800 470 1. 25 -10. 96 52 3180 919 5. 25 8.56 58 4240 1366 15. 38 20.09 47 15 1800 996 11. 25 10. 96 46 15 3200 1737 22 . 50 27. 08 57 15 1800 1211 16 . 00 16 . 59 43 15 4320 2192 31. 12 33.85 56 15 3650 2412 29 . 75 36.64 60 15 4280 3030 49. 38 43 . 27 44 15 4020 2087 37. 50 32.43 57 25 5100 560 1 #j,0 . 75 61 . !5
*DL = 29.1 x ln ML - 190
TRANSPORTATION RESEARCH RECORD 1233
deflection range where more accidents are likely to occur. By solving similar triangles, the following expression was developed to relate the probability of an opposing vehicle within the deflection zone for a given deflection:
(11)
The lateral probability is then calculated using the spreadsheet for the lateral deflection values corresponding to each of the weight-lane-hour categories.
Longitudinal Probability of Opposing Traffic Interference
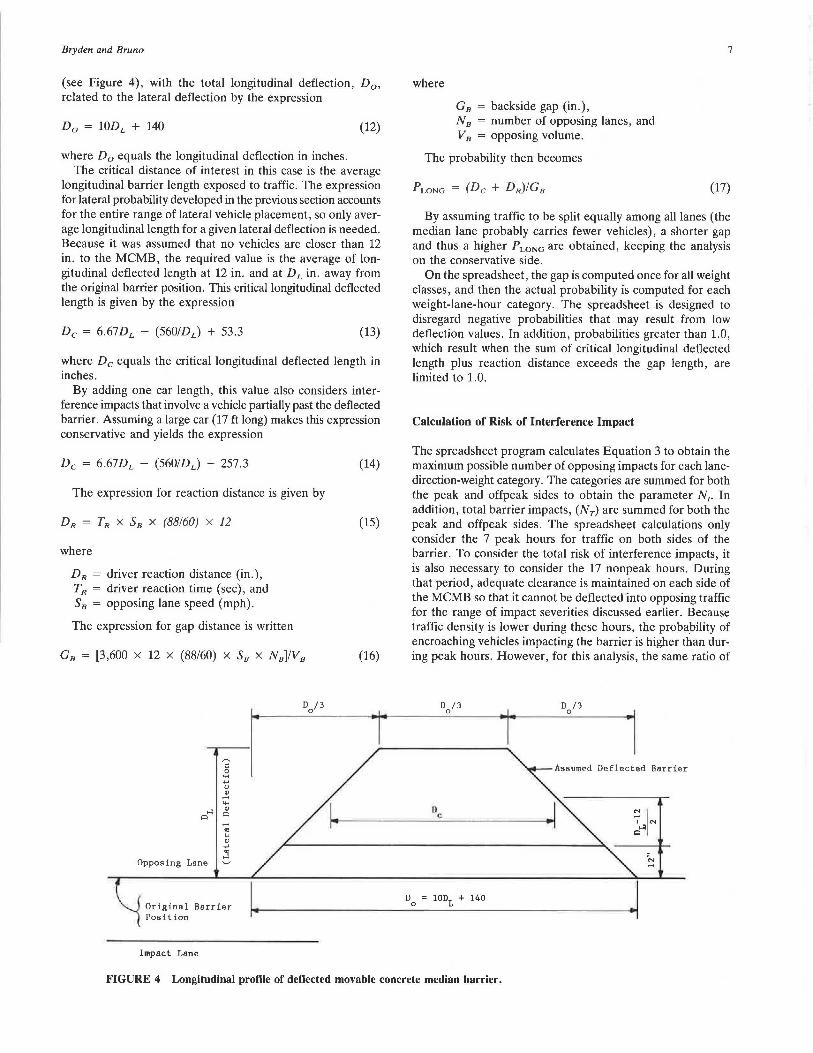
When the MCMB is deflected by impact, it may strike an opposing vehicle if one is within the barrier's longitudinal deflection zone. In addition, a vehicle approaching the deflected MCMB may impact the barrier if the driver is unable to react quickly enough to avoid it. Thus, from a longitudinal standpoint, the critical distance over which an interference impact may occur includes both the MCMB's longitudinal deflected length and the distance traveled during driver reaction time . The longitudinal probability of an interference impact is simply this critical distance divided by the average gap length. Test data from the manufacturer (3) showed that the deflected shape of the MCMB approximated an equilateral trapezoid
Total Lane Width= 11.5 ft
... 0
» ... " .... "
I---- Minimum CHB I Offset = 1. 0 ft
Vehicle Width= 5.5 ft
Assumed Probability Distribution
Possible Actual Probability Distribution
~ 0.2~~~~-1~1-~~~~~~~~~~~~~~~~~~~~+--.o 0 .. ... ~ ...
0 24 48 72 96 120
DL =Lateral CMB Deflection, in.
FIGURE 3 Relationship between barrier deflection and probability of vehicle being within deflection zone.
144
Bryden and Bruno
(see Figure 4), with the total longitudinal deflection, D 0 ,
related to the lateral deflection by the expression
D0 = lODL + 140 (12)
where D 0 equals the longitudinal deflection in inches. The critical distance of interest in this case is the average
longitudinal barrier length exposed to traffic. The expression for lateral probability developed in the previous section accounts for the entire range of lateral vehicle placement, so only average longitudinal length for a given lateral deflection is needed. Because it was assumed that no vehicles are closer than 12 in. to the MCMB, the required value is the average of longitudinal deflected length at 12 in. and at DL in. away from the original barrier position. This critical longitudinal deflected length is given by the expression
(13)
where De equals the critical longitudinal deflected length in inches.
By adding one car length, this value also considers interference impacts that involve a vehicle partially past the deflected barrier. Assuming a large car (17 ft long) makes this expression conservative and yields the expression
De = 6.67DL - (560/DL) + 257.3
The expression for reaction distance is given by
DR = TR x SB x (88160) x 12
where
DR driver reaction distance (in.), TR driver reaction time (sec), and Sa opposing lane speed (mph).
The expression for gap distance is written
GB = [3,600 X 12 X (88/60) X Sa X Na]IVa
Opposing Lane
Original Barrier Position
Impact Lane
(14)
(15)
(16)
where
Ga = backside gap (in.), Na = number of opposing lanes, and VB = opposing volume.
The probability then becomes
7
(17)
By assuming traffic to be split equally among all lanes (the median lane probably carries fewer vehicles), a shorter gap and thus a higher P LONG are obtained, keeping the analysis on the conservative side.
On the spreadsheet, the gap is computed once for all weight classes, and then the actual probability is computed for each weight-lane-hour category. The spreadsheet is designed to disregard negative probabilities that may result from low deflection values. In addition, probabilities greater than 1.0, which result when the sum of critical longitudinal deflected length plus reaction distance exceeds the gap length, are limited to 1.0.
Calculation of Risk of Interference Impact
The spreadsheet program calculates Equation 3 to obtain the maximum possible number of opposing impacts for each lanedirection-weight category. The categories are summed for both the peak and offpeak sides to obtain the parameter N,. In addition, total barrier impacts, (NT) are summed for both the peak and offpeak sides. The spreadsheet calculations only consider the 7 peak hours for traffic on both sides of the barrier. To consider the total risk of interference impacts, it is also necessary to consider the 17 nonpeak hours. During that period, adequate clearance is maintained on each side of the MCMB so that it cannot be deflected into opposing traffic for the range of impact severities discussed earlier. Because traffic density is lower during these hours, the proba_bility of encroaching vehicles impacting the barrier is higher than during peak hours. However, for this analysis, the same ratio of
D c
Assumed Deflected Barrier
FIGURE 4 Longitudinal profile of deOected movable concrete median barrier.
8
MCMB impacts to total traffic was assumed during the nonpeak hours as was calculated from the spreadsheet program output for the peak hours. Because no interference impacts occur during these 17 hours, the low estimate of total MCMB impacts during nonpeak hours results in a high (conservative) estimate of the total risk of secondary impacts. This approach is thus consistent with the conservative assumptions made throughout this analysis. The total traffic and maximum total MCMB impacts were calculated as follows for the conditions assumed in this analysis:
Maximum Total
Total MCMB Hours-Lanes Traffic Impacts
Peak hours-offpeak side (3 lanes) 19,600 17,737
Peak hours-peak side (4 lanes) 31,900 25,219
Subtotal 51,500 42,956 Nonpeak hours-
both sides (6 lanes total) 51,100 x ( 42 ,956/51,500) 42 ,622
Total 102,600 85,578
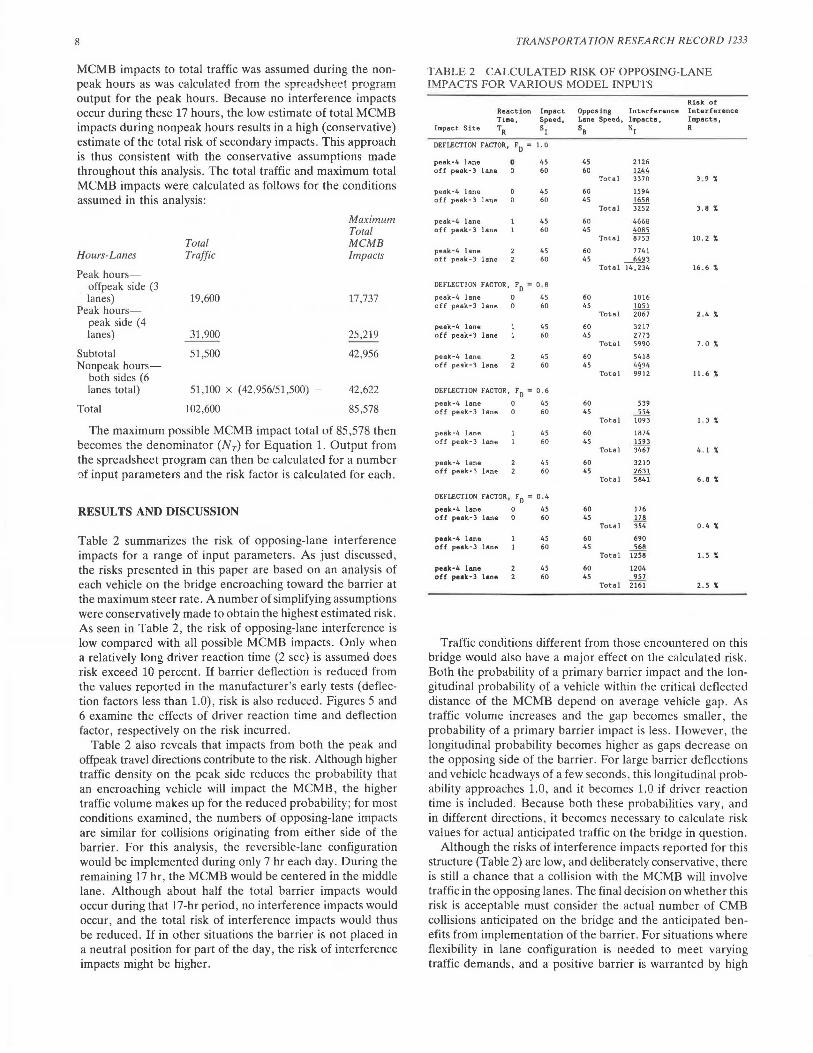
The maximum possible MCMB impact total of 85,578 then becomes the denominator (N r) for Equation 1. Output from the spreadsheet program can then be calculated for a number C)f input parameters and the risk factor is calculated for each.
RESULTS AND DISCUSSION
Table 2 summarizes the risk of opposing-lane interference impacts for a range of input parameters. As just discussed, the risks presented in this paper are based on an analysis of each vehicle on the bridge encroaching toward the barrier at the maximum steer rate. A number of simplifying assumptions were conservatively made to obtain the highest estimated risk. As seen in Table 2, the risk of opposing-lane interference is low compared with all possible MCMB impacts. Only when a relatively long driver reaction time (2 sec) is assumed does risk exceed 10 percent. If barrier deflection is reduced from the values reported in the manufacturer's early tests (deflection factors less than 1.0), risk is also reduced. Figures 5 and 6 examine the effects of driver reaction time and deflection factor, respectively on the risk incurred.
Table 2 also reveals that impacts from both the peak and offpeak travel directions contribute to the risk. Although higher traffic density on the peak side reduces the probability that an encroaching vehicle will impact the MCMB, the higher traffic volume makes up for the reduced probability; for most conditions examined, the numbers of opposing-lane impacts are similar for collisions originating from either side of the barrier. For this analysis, the reversible-lane configuration would be implemented during only 7 hr each day. During the remaining 17 hr, the MCMB would be centered in the middle lane. Although about half the total barrier impacts would occur during that 17-hr period, no interference impacts would occur, and the total risk of interference impacts would thus be reduced. If in other situations the barrier is not placed in a neutral position for part of the day, the risk of interference impacts might be higher.
TRANSPORTATION RESEARCH RECORD 1233
TABLE2 CALCULATED RISK OF OPPOSING-LANE IMPACTS FOR VARIOUS MODEL INPUTS
Risk of Reaction Impact Opposing Interference Interference Time, Speed, Lane Speed, Impacts, Impacts,
Impact Site TR SI SB NI R
DEFLECTION FACTOR, FD = I. 0
peak-4 lane 0 45 45 2126 off peak-3 lane 60 60 1244
Total 3370 3 . 9 l
pu.k ·4 1 ane 45 60 1594 off peak-3 lane 60 45 1658
Total 3252 3.8 l
peak - 4 lane 45 60 4662 off peak-3 lane 60 45 4085
Total 8753 10. 2 'JI;
peak-4 lane 45 60 7741 off peak-3 lane 60 45 6493
Total 14,234 16 . 6 'JI;
DEFLECTION FACTOR, FD : 0 , 8
peak-4 lane 0 45 60 1016 off peak-3 lane 0 60 45 1051
Total 2067 2 . 4 'JI;
peak-4 lane 45 60 3217 off peak-3 lane 60 45 2773
Total 5990 7 . 0 l
peak-4 lane 45 60 5418 off peek-3 lane 60 45 4494
Total 9912 11.6 l
DEFLECTION FACTOR, r0
.. 0.6
peak-4 lane 0 45 60 539 off peak-3 lane 0 60 45 ~
Total 1093 I. 3 l
peak-4 lane 45 60 1874 off peak-3 lane 60 45 1593
Total 3467 4.1 'JI;
peak-4 lane 45 60 3210 off peak-3 lane 60 45 2631
Total 5841 6. 8 'JI;
DEFLECTION FACTOR, FD = 0 , 4
peak-4 lane 45 60 176 off peak-3 lane 60 45 178
Total 354 0. 4 'JI;
pe•k-4 lane 45 60 690 off peak-3 lane 60 45 568
Total Ti5e' I. 5 'JI;
pe•k-4 lane 45 60 1204 off peak-3 lane 60 45 957
Total 2i6l 2.5 'II:
Traffic conditions different from those encountered on this bridge would also have a major effect on the calculated risk. Both the probability of a primary barrier impact and the longitudinal probability of a vehicle within the critical deflected distance of the MCMB depend on average vehicle gap. As traffic volume increases and the gap becomes smaller, the probability of a primary barrier impact is less. However, the longitudinal probability becomes higher as gaps decrease on the opposing side of the barrier. For large barrier deflections and vehicle headways of a few seconds, this longitudinal probability approaches 1.0, and it becomes 1.0 if driver reaction time is included. Because both these probabilities vary, and in different directions, it becomes necessary to calculate risk values for actual anticipated traffic on the bridge in question.
Although the risks of interference impacts reported for this structure (Table 2) are low, and deliberately conservative, there is still a chance that a collision with the MCMB will involve traffic in the opposing lanes. The final decision on whether this risk is acceptable must consider the actual number of CMB collisions anticipated on the bridge and the anticipated benefits from implementation of the barrier. For situations where flexibility in lane configuration is needed to meet varying traffic demands, and a positive barrier is warranted by high

... 0 .. " .. I"<
" Cl) Ill
Peakside Traffic Speed = 45 mph
Offpeakside Traffic Speed = 60 mph
DF = Deflect .ion Factor
0 __ .... ~ ................... ~~-41~~~~~--~~~~--~~~~...-~~~~--~~~~--~~~~...-~~~---
o 2 4 6 8 10 12 14 16 18
Risk of Opposing Lane Interference Impact, %
FIGURE 5 Effect of driver reaction time on risk of interference impact .
.§ 0.6 ~~~-111--~~~~~--,~~~~~~~,,...F-~~~~~~~~~~~~~~~~~~~~~~~~~~~~~~ .. " Cl) ..... .... " ~ .... ..
Peaks.ide Traffic Speed = 45 mph
OffpeAkside Traffic Speed = 60 mph
TR = Driver Reaction Time, sec
~ o.4~..-~-j1F-~_,.,.1F-~~~~~~~~~~~~~~~~~~~~~~~~~~~~~~~~~~~~~~~~~~ .. .. "" IZl :c '-'
0 2 4 6 8 10 12
Risk of Opposing Lane Interference Impact, %
FIGURE 6 Effect of lateral deflection factor on risk of interference impact.
14 16 18
10
traffic volume and speed, the small risk of interference impacts may be more than offset by improved traffic flo\v and reduc-tion of other accidents. For such situations, the MCMB may be justified, even though its deflection exceeds the available median width for some impact conditions.
SUMMARY
An MCMB was examined for use on the Tappan Zee Bridge of the New York State Thruway. Because the MCMB deflects laterally on impact, concern arose that opposing traffic could become involved in secondary collisions if the barrier deflected into the opposing median lane. This paper examined the risk of interference impacts, based on geometric and traffic conditions on the bridge and on the barrier's deflection characteristics. A model was developed and programmed on a microcomputer spreadsheet to calculate the risk of interference impacts. Input parameters can be varied to examine the effects of changing traffic and geometric conditions, as well as different barrier deflection characteristics. For the conditions examined, the risk of interference with opposing traffic appears to be low, occurring in only a small percentage of all impacts with the MCMB. Use of this barrier may be justified in situations where maximum anticipated barrier deflection
TRANSPORTATION RESEARCH RECORD 1233
exceeds total median width, if the low risk of interference impacts is offset by other benefits associated \Vith its use.
REFERENCES
1. Oklahoma's "TIV" Moves Barrier Wall in One Pass. Roads and Bridges, Sept. 1988, pp. 72- 73.
2. T. F. Garner. Rehabilitation and Roadway Improvement on the Tappan Zee Bridge. Public Works, Jan. 1988, pp. 58-59.
3. E. F. Nordlin. Crash Test Evaluation of a Movable Concrete Construction Barrier. Presented at 66th Annual Meeting of the Transportation Research Board, Washington, D.C., 1987.
4. J. D. Michie. NCHRP Report 230: Recommended Procedures for the Safety Performance Evaluation of Highway Appurtenances. TRB, National Research Council, Washington, D.C., 1981.
5. Guide lo Selecting, Locating, and Designing Traffic Barriers. American Association of State Highway and Transportation Officials, Washington, D.C., 1977.
6. Development of an Analytical Approach to Highway Barrier Design and Evaluation. Research Report 63-2. Bureau of Physical Research, New York State Department of Public Works, 1963.
7. J.E. Bryden and J. S. Fortuniewicz. Traffic Barrier Performance Related to Vehicle Size and Type. In Transportation Research Record 1065, TRB, National Research Council, Washington, D.C., 1986, pp. 69-78.
Publication of this paper sponsored by Committee on Roadside Safety Features.
![Single-Slope Concrete Median Barrieronlinepubs.trb.org/Onlinepubs/trr/1991/1302/1302-002.pdf · Single-Slope Concrete Median Barrier W. LYNN BEASON, H. E. Ross, ]R., H. S. PERERA,](https://img.pdfslide.net/doc/110x75/5eacdcb6d150f16c8a49281d/single-slope-concrete-median-single-slope-concrete-median-barrier-w-lynn-beason.jpg)