Embed Size (px)
Citation preview
Movement patterns, habitat utilization, and spawning habitat of Lake Sturgeon (Acipenser fulvenscens) in the Pic River, a northeastern Lake Superior tributary in
Ontario, Canada
A Thesis Submitted to the Committee in Graduate Studies in Partial Fulfillment of the Requirements for the Degree of Master of Science in the Faculty of Arts and Sciences.
TRENT UNIVERSITY
Peterborough, Ontario, Canada
© Copyright by Andrew Ecclestone 2011
Environmental & Life Sciences M.Sc. Graduate Program
January, 2012

ii
ABSTRACT
Movement patterns, habitat utilization, and spawning habitat of Lake Sturgeon (Acipenser fulvenscens) in the Pic River, a northeastern Lake Superior tributary in
Ontario, Canada
Andrew Ecclestone
Lake Sturgeon (Acipenser fulvenscens) have undergone significant declines in abundance
and distribution throughout their native range in the Laurentian Great Lakes and are listed
as threatened under the Endangered Species Act of Ontario and by the Committee on the
Status of Endangered Wildlife in Canada (COSEWIC). In response to this, there has been
a push to identify for protection the critical Lake Sturgeon habitat within spawning
tributaries in the Great Lakes, especially those tributaries where no data currently exists.
The Pic River is one of twelve tributaries in Lake Superior that continues to support Lake
Sturgeon spawning, but very little is known about the movements, habitat utilization, or
spawning habitat of this population. To address these knowledge gaps, a radio telemetry
and spawning assessment study was undertaken from 2007 to 2010 to monitor movement
patterns as they related to abiotic conditions and to identify and assess critical habitat in
the Pic River. Three unique migration patterns were observed, two of which related to
foraging individuals and one relating to spawning individuals. Spawning individuals
entered the river earlier and rapidly ascended the river to one of two uppermost barriers
(Manitou and Kagiano Falls), whereas foraging individuals either remained at the mouth
of the river or migrated 20 km to 30 km upriver to deep pools throughout the lower
rapids. An unusually warm spring and early melt in 2010 resulted in Lake Sturgeon
entering, reaching their uppermost point, and exiting the river roughly 55 days earlier
compared to the previous two years. The onset of their migrations were highly correlated
iii
with ice conditions and when the river became ice free (R2=0.88), although water
temperature and discharge were not accurate predictors for migration timing. Critical
habitat features were identified and potential spawning sites were evaluated using a Lake
Sturgeon habitat suitability model (HSM). By comparing spawning assessment results
with model predictions, this study found that the HSM could not accurately predict where
spawning would occur between different spawning sites, but did reasonably well within a
spawning site for predicting the timing and location of spawning. It is advocated that the
HSM incorporate the presence or absence of a barrier to migration to increase the validity
of its prediction. This study not only contributes to the expanding knowledge base and
conservation efforts that exist for Lake Sturgeon in the Great Lakes, but will also
contribute to the decision making and planning process for proposed local hydroelectric
developments.
Keywords: movement patterns, habitat suitability, Lake Sturgeon, Pic River

iv
Acknowledgements
I would like to foremost thank my supervisors for their help and support
throughout my time as a graduate student at Trent University. I’d specifically like to
thank Dr. Tom Whillans for his knowledge of community-based research and the
A/OFRC, Dr. Chris Wilson for genetic and lab support, and Dr. Thomas Pratt for his
advice and knowledge of Lake Sturgeon and Lake Superior. Although not a supervisor,
Tim Haxton from the Ontario Ministry of Natural Resources was also a source for help
and advice, especially when it came to the habitat suitability modeling. Beyond their
specific contributions that I have just mentioned, each of these individuals contributed to
my development as a scientist and inspired me to explore new frontiers and questions that
relate to fisheries ecology.
This project could not have been possible without the financial, field, and
administrative support of the Anishinabek/Ontario Fisheries Resource Centre (A/OFRC).
Since 2006, several technicians and biologists from the A/OFRC have contributed
countless hours to this project. In particular, I would like to thank Ed Desson and Cynthia
Roy for administrative and technical support, Nikki Commanda for training and teaching
me about the project, Dan Couchie for field support and collecting traditional knowledge,
Caroline Deary and Kim Tremblay for developing and reporting on various components
of the project, Perry McLeod-Shabogesic and Marureen Peltier for communication and
resource materials, and every technician that helped throughout the spring and summer
(Jenna McLaurin, Sarah Couchie, Sarah Ashley Couchie, Maureen Peltier, Tammy
Desbien).

v
Fisheries and Oceans Canada, through the Great Lakes Laboratory for Fisheries
and Aquatic Sciences in Sault Ste. Marie, also contributed to this project in various
capacities from 2001 to 2010. Without their field work at Manitou and Kagiano Falls,
purchasing of radio tags, lending of equipment (drift nets and DIDSON camera), and
accommodations, this project would have been resource limited and restricted to the
lower 30 km of the river. Bill Gardner’s support, interest, and inquisitive nature led to
several new research methods being explored on the Pic River and promoted my
development as a researcher. I am very grateful for his contributions and for making the
trip to Montana with me to present at the annual conference of the North American
Chapter of the World Sturgeon Conservation Society. Further financial support for
Fisheries and Oceans Canada's component of the project came from SARCEP (Species-
at-Risk Coordination des Espece en Peril) funding.
Pukaskwa National Park and Parks Canada have provided on-site support and
storage for this project. I’d especially like to thank Martha Allen, Chantal Vis, and
Christine Vance for their help with the Pic River project and for their ongoing support for
the development and operation of the White River Lake Sturgeon Project that will
commence in 2011. Wawa District staff from the Ontario Ministry of Natural Resources
also deserves recognition of their strong support, especially Virginia Thompson of the
Manitouwadge Area office. Finally, Byron Leclair from Pic River Hydro and Larry King
from Hatch Limited deserve a special thank you for their partnership and work at
Manitou Falls in 2010.

vi
Table of Contents Abstract …………………………………………………………… ii Acknowledgements …………………………………………………………… iv Table of Contents …………………………………………………………… vi List of Figures …………………………………………………………… viii List of Tables …………………………………………………………… xii List of Appendices …………………………………………………………… xiii Chapter 1: General Introduction …………………………………………… 1 Chapter 2: Patterns, Timing, and Environmental Cues to Lake Sturgeon Migration
2.1 Introduction ………………………………………………………........ 12 2.2 Methods …………………………………………………………… 16 2.2.1 Study Area …………………………………………… 16 2.2.2 Gill Netting …………………………………………… 20 2.2.3 Radio Telemetry …………………………………………… 21 2.2.4 Abiotic Conditions …………………………………………… 27 2.2.5 Data Analysis …………………………………………… 28 2.3 Results …………………………………………………………… 29 2.3.1 Migration Patterns …………………………………………… 32 2.3.2 Abiotic Conditions …………………………………………… 39 2.3.3 Timing of Migration …………………………………………… 46 2.3.4 Environmental Cues …………………………………………… 51 2.4 Discussion …………………………………………………………… 57
2.4.1: Migration Patterns …………………………………… 58 2.4.2: Environmental Cues & Timing …………………………………… 62 2.4.3: General Conclusions ………............…………………. 67
Chapter 3: Validation of a Lake Sturgeon Habitat Suitability Model for Spawning
3.1 Introduction …………………………………………………………… 69 3.2 Methods …………………………………………………………… 73 3.2.1 Habitat Variables …………………………………… 73 3.2.2 Habitat Suitability Model …………………………………… 78 3.2.3 Spawning Assessments …………………………………… 84

vii
3.3 Results …………………………………………………………… 86 3.3.1 Overall Spawning Habitat Suitability …………………………… 86 3.3.2 Daily Spawning Habitat Suitability …………………………… 104 3.3.3 Spawning Assessments …………………………… 108 3.4 Discussion …………………………………………………………… 113 3.4.1 Predictive Ability Between Sites ………………………….... 114 3.4.2 Predictive Ability Within Sites …………………………… 119
Chapter 4: General Discussion …………………………………………… 121
4.1 Significant Habitat, Movement Patterns, and Environmental Cues ...... 121 4.2 Suitability Modeling of Lake Sturgeon Spawning Habitat ...... 124 4.3 Implications and Future Directions ...... 129
Appendix …………………………………………………………… 135
Appendix 1 …………………………………………………………… 135 Appendix 2 …………………………………………………………… 157
Literature Cited …………………………………………………………… 160
Sources …………………………………………………... 160 Personal Communications…………………………………………………… 173

viii
List of Figures
In Chapter 2: Patterns, Timing, and Environmental Cues to Lake Sturgeon Migration Figure 2.1: The location of the Pic River watershed relative to the Lake Superior
catchment (A) and an enlarged map of the Pic River watershed (B). The labeled points in part B of this figure indicate key locations for Lake Sturgeon research in the Pic River.
…………………………………………………………………… 18 Figure 2.2: The lower (A) and upper (B) portions of the Pic River, which were
identified in previous studies as habitat that was frequently utilized by Lake Sturgeon.
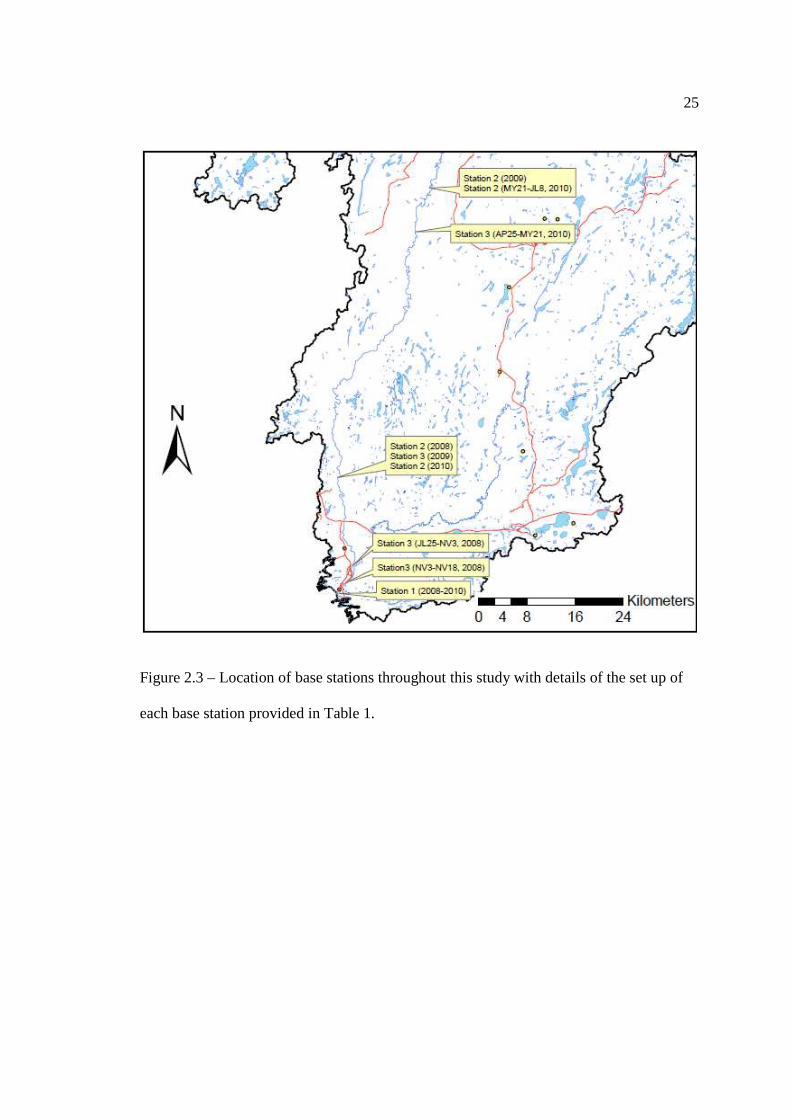
…………………………………………………………………… 19 Figure 2.3: Location of base stations throughout this study with details of the set up of
each base station provided in Table 1. Numbers indicate the upstream distances in kilometers from Lake Superior.
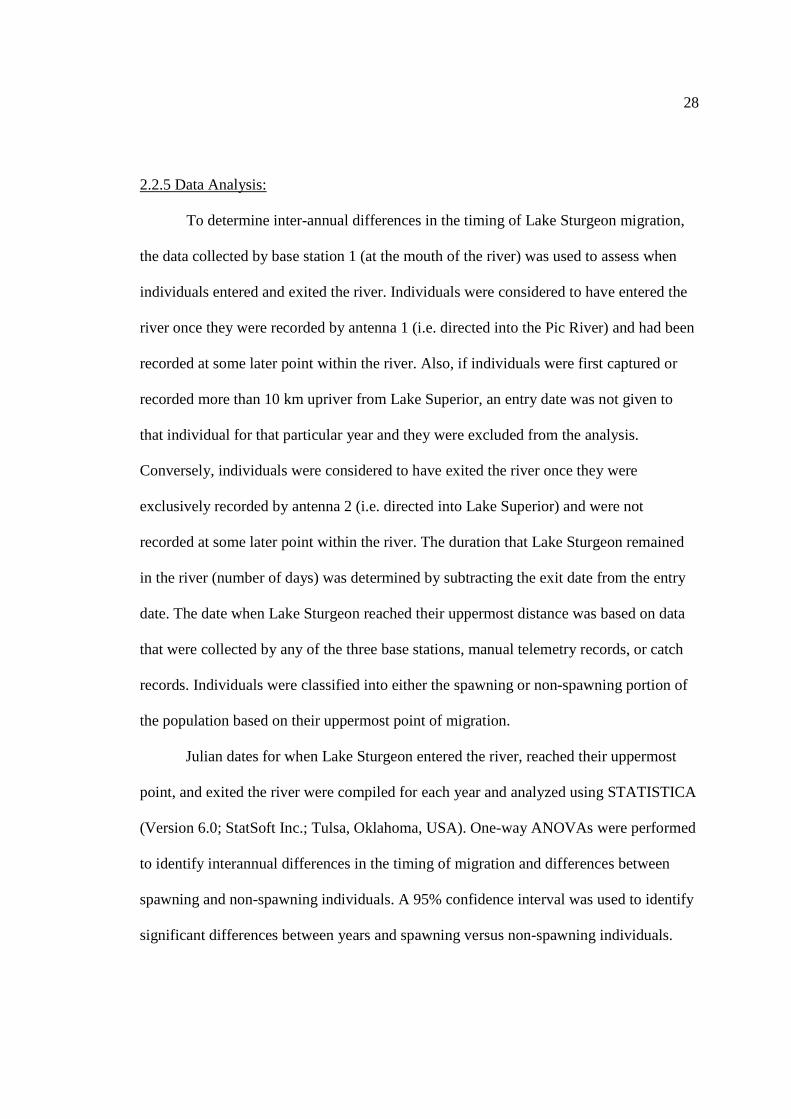
…………………………………………………………………… 25 Figure 2.4: Size class frequency distributions of all Lake Sturgeon that were captured
during this study (A) and of Lake Sturgeon that were radio tagged during this study (B).
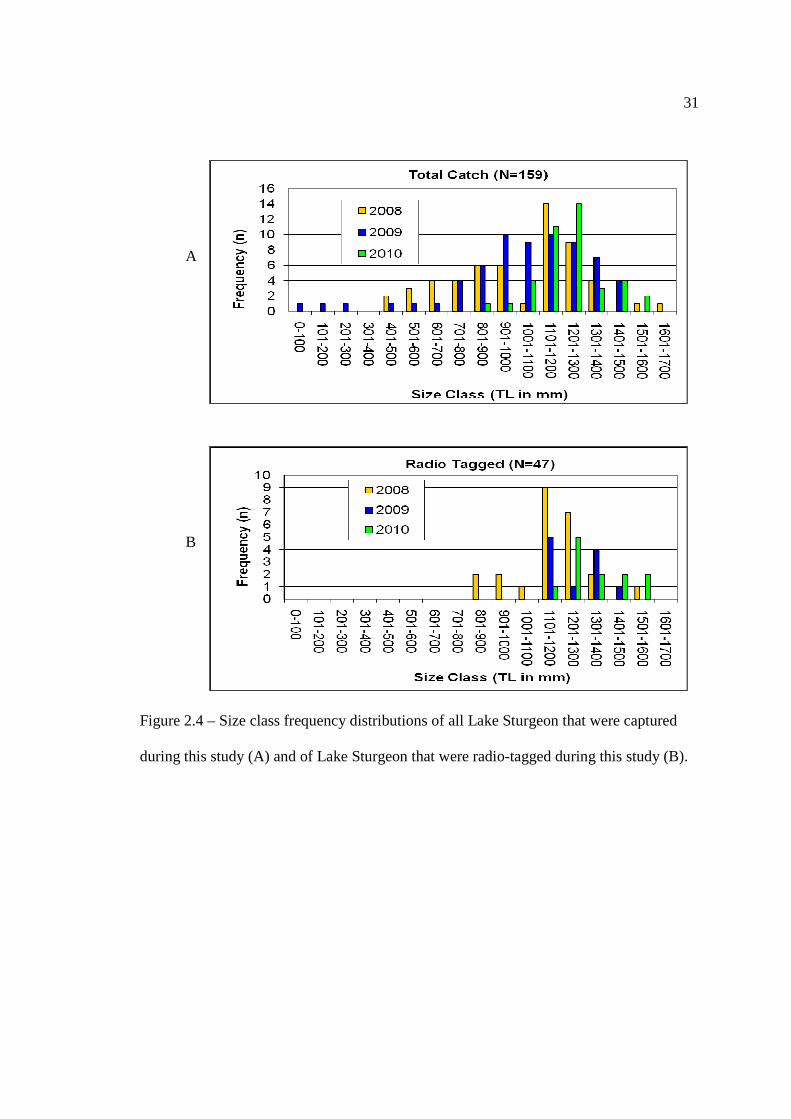
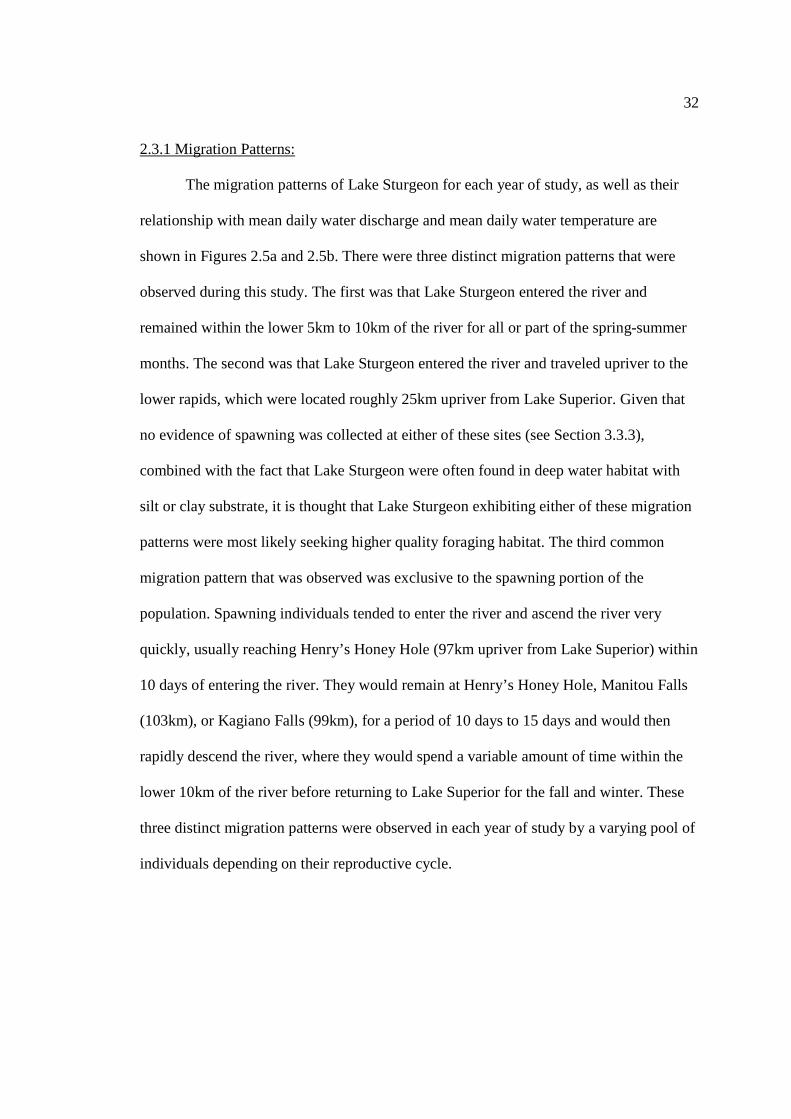
…………………………………………………………………… 31 Figure 2.5a: Migration patterns for individual sturgeon in relation to mean daily water
temperature (black line) in each year of the study. Green lines correspond to migration pattern one, red lines correspond with migration pattern two, and yellow lines correspond with migration pattern three.
…………………………………………………………………… 33 Figure 2.5b: Migration patterns for individual sturgeon in relation to mean daily water
flow (black line) in each year of the study. Green lines correspond to migration pattern one, red lines correspond with migration pattern two, and yellow lines correspond with migration pattern three.
…………………………………………………………………… 34 Figure 2.6: Percentage of detections in each 5 km interval of the Pic River, starting
from the mouth of the river (0 km) to Manitou Falls (103 km). …………………………………………………………………… 37 Figure 2.7: Location of pools within the lower rapids that were most frequently used
by migrating Lake Sturgeon within the Pic River. …………………………………………………………………… 38
ix
Figure 2.8: Mean monthly water discharge (A) and mean daily water temperature (B) of the Pic River during the study period, whereby drought-like conditions were experienced in 2010.
…………………………………………………………………… 41 Figure 2.9: Temperature (A) and DO (B) depth profiles within the Black River, at the
mouth of the Pic River, and at the lower rapids based on the mean of four depth profile readings.
…………………………………………………………………… 43 Figure 2.10: The percentage of Lake Sturgeon that entered the Pic River in each year of
study and the percentage of Lake Sturgeon that entered the Pic River and remained within the Pic River for a duration exceeding 2 days.
…………………………………………………………………… 45 Figure 2.11: Inter-annual annual differences in the timing of entry, exit, and uppermost
point in Julian days (left axis) and the duration spent in the river each year (right axis).
…………………………………………………………………… 47 Figure 2.12: Differences in the timing of migration between spawning and non-
spawning Lake Sturgeon indicated no significant differences between these two groups.
…………………………………………………………………… 51 Figure 2.13: Mean water temperature and discharge when Lake Sturgeon entered,
reached their uppermost point of migration, and exited the river. Boxes are equal to the mean, plus or minus one standard error unit, while the whiskers represent the 95% C.I.
…………………………………………………………………… 52 Figure 2.14: Trends in mean daily discharge (m3/second) (A) and mean daily water
temperature (˚C) (B) as they related to the immigration and emigration of Lake Sturgeon in 2008, 2009, and 2010.
…………………………………………………………………… 54 Figure 2.15: Bivariate correlation between the mean entry date of Lake Sturgeon in
each year and the ice free date of that respective year. …………………………………………………………………… 56 Figure 2.16: Correlation between mean entry date and ice-out date for the Rainy River,
Ontario, from a study conducted from 1988 to 1990 (Rusak & Mosindy, 1997). The purple, yellow and orange points represent the Pic River data from 2008, 2009, and 2010, respectively. The blue, red and green points represent the Rainy River data from 1988, 1989, and 1990, respectively.
…………………………………………………………………… 64

x
In Chapter 3: Validation of a Lake Sturgeon Habitat Suitability Model for Spawning Figure 3.22: Substrate suitability of the Lower Rapids based on the suitability index
values (Table 3.2). …………………………………………………………………… 88 Figure 3.23: Substrate suitability of Manitou Falls based on the suitability index values
(Table 3.2). …………………………………………………………………… 89 Figure 3.24: Substrate suitability of Kagiano Falls based on the suitability index values
(Table 3.2). …………………………………………………………………… 90 Figure 3.25: The proportion of cells with a substrate suitability index value that is
representative of very poor (0.0), poor (>0.0 to <0.2), fair (0.2 to < 0.5), good (0.5 to <0.8), and excellent (0.8 to <1.0) spawning substrate.
…………………………………………………………………… 91 Figure 3.26: Bathymetric maps of potential spawning sites in the Pic River. Data was
collected from July to August in 2009 and in June 2010. …………………………………………………………………… 93 Figure 3.27: Overall suitability of the Lower Rapids based on the depth and substrate
suitability index values (Table 3.2 and Table 3.3, respectively). …………………………………………………………………… 95 Figure 3.28: Overall suitability of Manitou Falls based on the depth and substrate
suitability index values (Table 3.2 and Table 3.3, respectively). …………………………………………………………………… 96 Figure 3.29: Overall suitability of Kagiano Falls based on the depth and substrate
suitability index values (Table 3.2 and Table 3.3, respectively). …………………………………………………………………… 97 Figure 3.30: The proportion of cells at each potential spawning site with a suitability
index value that is representative of very poor (0.0), poor (>0.0 to <0.2), fair (0.2 to < 0.5), good (0.5 to <0.8), and excellent (0.8 to <1.0) spawning suitability based on substrate and depth.
…………………………………………………………………… 98 Figure 3.31: Aerial photograph of Manitou Falls with circles indicating where the
patches of highly suitable Lake Sturgeon spawning habitat was located. …………………………………………………………………… 101

xi
Figure 3.32: Aerial photograph of Kagiano Falls with circles indicating where the
patches of highly suitable Lake Sturgeon spawning habitat was located. …………………………………………………………………… 102 Figure 3.33: Areas of Kagiano (left) and Manitou Falls (right) that could not be
sampled because of accessibility and/or water flow issues. Both areas are immediately above the uppermost navigable points of the river.
…………………………………………………………………… 103 Figure 3.34: Daily suitability of Lake Sturgeon spawning habitat at the lower rapids
based on substrate, depth, and temperature. …………………………………………………………………… 105 Figure 33.5: Daily suitability of Lake Sturgeon spawning habitat at Manitou Falls
based on substrate, depth, and temperature. …………………………………………………………………… 106 Figure 3.36: Daily suitability of Lake Sturgeon spawning habitat at Kagiano Falls
based on substrate, depth, and temperature. …………………………………………………………………… 107 Figure 3.37: CPUE (fish per day) of ripe adults captured within 500m of the Lower
Rapids, Kagiano Falls, or Manitou Falls in 2008 and 2009. …………………………………………………………………… 109 Figure 3.38: CPUE (catches per day) of Lake Sturgeon eggs and larvae at the Lower
Rapids, Kagiano Falls, and Manitou Falls in 2010. …………………………………………………………………… 111 Figure 3.39: Daily suitability at Manitou Falls on May 24th, 2010, when lake sturgeon
eggs were collected. …………………………………………………………………… 112 In Chapter 4: General Discussion Figure 4.1: The proposed hydroelectric development at Manitou Falls (black) and
flow patterns (grey arrows) relative to the spawning habitat suitability for Lake Sturgeon at Manitou Falls.
…………………………………………………………………… 131 Figure 4.2: Current and potential or proposed hydroelectric generating stations in
Ontario. …………………………………………………………………… 133

xii
List of Tables In Chapter 1: General Introduction Table 1.1: River systems and their associated watersheds where Lake Sturgeon
movement or migration studies have already been or continue to be undertaken.
…………………………………………………………………… 8 In Chapter 2: Patterns, Timing, and Environmental Cues to Lake Sturgeon Migration Table 2.1: Date, location, and orientation of antennas for each base station that was
operable over the course of this study. * = Julian calendar date was 1 day behind until it was corrected for on July 6th, 2008.
…………………………………………………………………… 24 Table 2.2: Annual comparison of spring abiotic conditions within the Pic River. …………………………………………………………………… 40 Table 2.3: Tukey Post-hoc summaries to test for significant inter-annual differences
in the timing of Lake Sturgeon entry (A), exit (B), and uppermost point (C), as well as the duration (D) that Lake Sturgeon spent within the Pic River.
…………………………………………………………………… 48 In Chapter 3: Validation of a Lake Sturgeon Habitat Suitability Model for Spawning Table 3.1: Substrate particle size statistics as measured by Threader et al. (1998). …………………………………………………………………… 75 Table 3.2: Suitability index values for each substrate type. …………………………………………………………………… 79 Table 3.3: Suitability index values for each depth interval. …………………………………………………………………… 80 Table 3.4: Suitability index values for each temperature interval. …………………………………………………………………… 81

xiii
List of Appendices
Appendix 1: Proportion of each substrate type at the lower rapids, Manitou Falls, and Kagiano Falls. This appendix includes Figure 3.1 to Figure 3.21 and relates to Section 3.3.1.
…………………………………………………………………… 135
Figure 3.1: Proportion of other as substrate type at the Lower Rapids. …………………………………………………………………… 136
Figure 3.2: Proportion of clay as substrate type at the Lower Rapids.
…………………………………………………………………… 137
Figure 3.3: Proportion of silt as substrate type at the Lower Rapids. …………………………………………………………………… 138
Figure 3.4: Proportion of sand as substrate type at the Lower Rapids. …………………………………………………………………… 139
Figure 3.5: Proportion of bedrock as substrate type at the Lower Rapids. …………………………………………………………………… 140
Figure 3.6: Proportion of gravel as substrate type at the Lower Rapids. …………………………………………………………………… 141
Figure 3.7: Proportion of cobble as substrate type at the Lower Rapids.
…………………………………………………………………… 142
Figure 3.8: Proportion of boulder as substrate type at the Lower Rapids. …………………………………………………………………… 143
Figure 3.9: Proportion of other as substrate type at Manitou Falls. …………………………………………………………………… 144
Figure 3.10: Proportion of clay as substrate type at Manitou Falls.
…………………………………………………………………… 145
Figure 3.11: Proportion of sand as substrate type at Manitou Falls. …………………………………………………………………… 146
Figure 3.12: Proportion of bedrock as substrate type at Manitou Falls. …………………………………………………………………… 147
Figure 3.13: Proportion of gravel as substrate type at Manitou Falls.
…………………………………………………………………… 148

xiv
Figure 3.14: Proportion of cobble as substrate type at Manitou Falls. …………………………………………………………………… 149
Figure 3.15: Proportion of boulder as substrate type at Manitou Falls.
…………………………………………………………………… 150 Figure 3.16: Proportion of other as substrate type at Kagiano Falls.
…………………………………………………………………… 151 Figure 3.17: Proportion of clay as substrate type at Kagiano Falls.
…………………………………………………………………… 152 Figure 3.18: Proportion of sand as substrate type at Kagiano Falls.
…………………………………………………………………… 153 Figure 3.19: Proportion of gravel as substrate type at Kagiano Falls.
…………………………………………………………………… 154 Figure 3.20: Proportion of cobble as substrate type at Kagiano Falls.
…………………………………………………………………… 155 Figure 3.21: Proportion of boulder as substrate type at Kagiano Falls.
…………………………………………………………………… 156 Appendix 2: Mean daily temperature above Manitou Falls (Easting: 566904, Northing:
5450977), Kagiano Falls (Easting: 565486, Northing: 5449117), and below the Lower Rapids (Easting: 552000, Northing: 5400155).
…………………………………………………………………… 157

1
Chapter 1: General Introduction
Lake Sturgeon (Acipenser fulvescens) are one of the world’s largest and longest
lived freshwater fish species, and the only species of sturgeon species that is native to the
Laurentian Great Lakes (Scott & Crossman, 1998). These potamodromous bottom-
feeders have a primitive appearance and a downward facing snout that enables them to
detect prey in soft bottom sediment using sensory pits and barbels (Harkness & Dymond,
1961; Peterson et al., 2007; Stelzer et al., 2008). Juveniles allocate a disproportionate
amount of energy towards somatic growth (Beamish et al., 1996), and therefore sexual
maturity is not reached until approximately 12-15 years for males and 18-27 years for
females (Kempinger, 1988; Bruch & Binkowski, 2002; Peterson et al., 2007; Barth et al.,
2009). These extreme life history characteristics of the Lake Sturgeon make it a difficult
species to manage and research given the resource and time constraints of most fisheries
projects.
Each spring, when water temperatures are between 11ºC to 21ºC, a proportion of
each adult population migrate upriver to reproduce at their natal spawning grounds that
contain cobble-boulder-gravel substrates and fast flowing water (Harkness & Dymond,
1961; McKinley et al., 1998; Bruch & Binkowski, 2002; Peterson et al., 2007). Bruch &
Binkowski (2002) found that spawning sites in the Winnebago system were close to deep
overwintering pools (<2 km), had an extensive amount of spawning substrate (>700 m2)
that was comprised of clean rock, limestone, or granite with clean interstitial spaces, and
high flows for cleaning rocks and aerating eggs. Several other studies report Lake
Sturgeon spawning at depths of 0.1 m to 2.0 m over gravel or cobble substrate, and at
water velocities that range from 15 cm/s to 70 cm/s (Priegel and Wirth, 1974; LaHaye et

2
al., 1992; McKinley et al., 1998; Auer & Baker, 2002). Spawning temperatures can also
vary quite substantially. A long-term study in the Wolf River found evidence of spawning
at temperatures between 8.3ºC and 23.3ºC (Kempinger, 1988) and up to 21.5ºC in the
L’Assomption River (LaHaye et al., 1992). Most spawning, however, is observed
between 13ºC to 18ºC (Scott & Crossman, 1973; Bruch & Binkowski, 2002; Peterson et
al., 2007). Lake Sturgeon have a polyandrous mating system, whereby two to five males
will fertilize eggs that are broadcasted by a spawning female while traversing the length
of the spawning habitat (Harkness, 1988; Auer & Baker, 2002; Bruch & Binkowski,
2002; Hodgeson et al., 2006; Peterson et al., 2007). Since females only spawn every 3-5
years, and males every 1-3 years, inter and intra population variation in movement
patterns and habitat utilization are often observed throughout the spring (Kempinger,
1988; Fortin et al., 1996; Rusak & Mosindy, 1997; Peterson et al., 2007). By late-
summer, and throughout the fall and winter, populations typically reduce their home
range size and show strong site fidelity for deep-water pools, which are typically located
in the lower sections of rivers, or a connected lake (Hay-Chmielewski, 1987; Lyons &
Kempinger, 1992; Fortin et al., 1993; Rusak & Mosindy, 1997; McKinley et al., 1998;
Auer, 1999; Knight et al., 2002; Haxton, 2003b; Lallaman et al., 2008). Spawning
females are highly fecund (Harkness & Dymond, 1961; Scott & Crossman, 1998;
Peterson et al., 2007) and can potentially lay more than 10,000 eggs per kilogram of fish
(Bruch et al., 2006), but natural mortality and a lack of parental care can result in less
than 0.1% of those eggs reaching age-0 (Carofino et al., 2010, 2011).Lake Sturgeon was
once considered one of the Great Lake’s most abundant and widely distributed endemic
fish species (Hay-Chmielewski & Whelan, 1997; Auer, 1999; Peterson, 2007). In the

3
early-1800s Lake Sturgeon were so abundant and widely distributed that they were
considered a nuisance species by most commercial fisheries (Stone & Vincent, 1900;
Harkness, 1988; Hay-Chmielewski & Whelan, 1997). They were an essential bartering
commodity during the fur trade era and have always been traditionally important to
aboriginal peoples for subsistence and cultural purposes, especially in northern Ontario
(Hannibal-Paci, 1998; Holzkamm & Waisberg, 2005; Ontario Ministry of Natural
Resources, 2009; Kline et al., 2010). At the Rainy River, the 1868 spawning run attracted
roughly 1,000 Ojibwa people from as far east as Winnipeg and as far west as Lake
Superior (Holzkamm et al., 1988). While the purpose of these trips was to harvest the
meat and medicinal benefits (Hopper & Power, 1991), the spawning runs also served as
social gatherings where political discussions, religious ceremonies, or traditional
teachings would occur (Holzkamm et al., 1988). Historical accounts report Lake Sturgeon
being brought into the Detroit fish markets by the wagon load and piled like cord-wood
where they would be sold for as low as 50 cents apiece and used for fertilizer or fuel
(Stone & Vincent, 1900).
Beginning in the mid-1800s, a valuable and targeted commercial fishery for Lake
Sturgeon developed, which was driven by the demand for fertilizer, isinglass, biofuel, and
towards the start of the 20th century, caviar (Stone & Vincent, 1900; Harkness, 1988;
Hay-Chmielewski & Whelan, 1997; Williamson, 2003). As catches exceeded the
maximum sustainable yield in the late 1800s, Lake Sturgeon stocks rapidly collapsed
throughout the Great Lakes Region (Baldwin et al., 1979; Hay-Chmielewski & Whelan,
1997; Auer, 1999; Baker & Borgeson, 1999). This led to heavy regulations in the 1920s
followed by the closure of most American commercial fisheries by 1980 (Baldwin et al.,

4
1979; Auer, 2003; Peterson et al., 2007) and the recent closure of the recreational fishery
in Ontario and bordering states (Ontario Ministry of Natural Resources, 2009). Despite
these mitigation measures, however, the majority of sturgeon populations have still not
rebounded in the Great Lakes.
In more recent decades, the most prominent anthropogenic threat that is inhibiting
the recovery of populations is habitat degradation and fragmentation (Hay-Chmielewski
& Whelan, 1997; Auer, 1999; Peterson et al., 2007). Estimates suggest that Lake
Sturgeon require 250 km to 300 km of unimpeded river-lake habitat as a minimum home
range size to complete their life cycle (Auer, 1996). If Lake Sturgeon do not have access
to this large river-lake habitat, then populations may become vulnerable to immediate
extirpation when habitat is severely impacted or unreachable (Harkness & Dymond,
1961; Baker & Borgeson, 1999). Even if the effects of habitat fragmentation are not
immediately felt, over time populations residing in unimpeded stretches of river have
greater abundances and faster growth rates compared to populations occupying
impounded sections of river (Haxton, 2002, 2003a; Haxton & Findlay, 2008). Natural
barriers, such as fast flowing rapids or small waterfalls, may not fragment habitat or
population connectivity (Welsh & McLeod, 2010). However artificial developments,
such as hydroelectric developments or water diversions, have resulted in severely
fragmented habitats, isolated populations, and altered spawning behaviour (Haxton, 2002;
Daugherty et al., 2008a, 2008b; Paragamian et al., 2001). Furthermore, the altered flow
regimes that often accompany such developments can also hinder the spawning ability
and behavior of Lake Sturgeon, thus having an equally negative impact on the spawning
success (Haxton, 2002; Paragamian et al., 2001). Beyond overfishing and habitat

5
fragmentation, several other threats continue to inhibit the recovery of Lake Sturgeon,
including invasive species and their control measures (Boogard et al., 2003), pollution
and poaching (Auer, 1999), and the potential erosion of locally adapted genes (Welsh et
al., 2008; Welsh et al., 2010).
Currently, the abundance of Lake Sturgeon in the Great Lakes is estimated to be
less then 1 % of its historical level and 27 populations have become extirpated from
historically active tributaries in the Great Lakes (Scott & Crossman, 1973; Hay-
Chmielewski & Whelan, 1997; Auer, 1999; Ontario Ministry of Natural Resources,
2009). In response to this weakened state, Lake Sturgeon populations have been grouped
into eight designatable conservation units throughout their native Canadian range by
COSEWIC based on their genetic and biogeographical differences (Ferguson &
Duckworth, 1997; COSEWIC, 2006; Welsh et al., 2008; Kjartanson, 2008; Hutchings &
Festa-Bianchet, 2009). Designatable unit 8 (DU8) contains the Upper Great Lakes and
the St. Lawrence River system, which has been further broken down into three
designatable subunits (Lake Erie-Lake Huron (DU8a); Northern Lake Superior (DU8b);
and St. Lawrence River (DU8c)) (Velez-Espino & Koops, 2009) and six genetically
significant units (Welsh et al., 2010). These designatable subunits and genetically
significant units have been developed in light of new evidence that focuses on population
trends, biogeography, genetic differences, and life history characteristics within each area
(Velez-Espino & Koops, 2009; Welsh et al., 2010). Furthermore, they have been listed as
threatened or endangered by all states and provinces surrounding the Laurentian Great
Lakes, which has led to an increasing amount of conservation and research efforts (Auer,
2003; Peterson et al., 2007; Ontario Ministry of Natural Resources, 2009).

6
Habitat restoration and stocking efforts to rehabilitate populations have been
introduced with mixed success (Auer, 2003; Peterson et al., 2007; Ontario Ministry of
Natural Resources, 2009). Habitat restoration projects have been largely spawning
focused, including spawning habitat enhancement and improving accessibility to
potential spawning grounds (Daugherty et al., 2008a, 2008b; Trested, 2010). At the Des
Prairies River in Quebec, catch per unit of effort (CPUE) of eggs and larvae increased by
three to five fold in years following the enhancement of a spawning shoal at the base of a
hydroelectric facility (Dumont et al., 2011). Spawning was also documented in the St.
Lawrence River following a spawning habitat enhancement project, although comparable
baseline assessments were not performed to evaluate success (Johnson et al., 2006).
Barriers to migration have also been removed to provide access to historical spawning
sites in the Grasse River, New York (Trested, 2010), and potential spawning sites have
been evaluated to prioritize future dam removals in the Green Bay basin of Lake
Michigan (Daugherty et al., 2006). Reintroduction and supplemental stocking efforts
have been ongoing for 20 years, with considerable effort occurring in Michigan and
Wisconsin (Smith, 2009). Many of these programs continue with an unknown amount of
success, and several issues remain, such as finding suitable donor populations (Drauch et
al., 2008; Welsh et al., 2010) and assessing the survival and adaptability of stocked
individuals (Drauch & Rhodes, 2007; Smith, 2009). As these rehabilitation projects are
costly and unpredictable, research that aims to identify and protect significant Lake
Sturgeon habitat before it becomes depleted is both proactive for conservation and more
cost-effective.

7
To date, the movement patterns and habitat utilization of Lake Sturgeon have
been identified in several rivers throughout North America (Table 1.1). Through a
combination of netting, radio telemetry, and acoustic telemetry, these studies were able to
successfully identify critical habitat, the timing of migration, and the environmental or
seasonal cues that stimulate these movements. Habitat suitability modeling has also been
performed on the Fox, Oconto, Menominee, and Peshtigo Rivers of Green Bay in Lake
Michigan to assess critical habitat that could become accessible pending the removal of
an artificial obstruction (Gunderman & Elliot, 2004; Daugherty, 2006). Results from
these studies become even more powerful when movement patterns are associated with
the quantitative assessment of physical habitat features, such as depth and substrate
suitability; however few studies such as this exist. Despite the demand and usefulness of
results that are generated from the analysis of movement patterns and habitat utilization,
such analyses have only been performed in a fraction of Lake Sturgeon systems.

8
Table 1.1 – River systems and their associated watersheds where Lake Sturgeon movement or migration studies have already been or
continue to be undertaken.
River System Watershed, Province/State, Country Reference Rainy River Lake of the Woods Watershed, Ontario/Minnesota, Canada/United States of
America (respectively) Rusak & Mosindy, 1997
Mattagami River Hudson Bay Watershed, Ontario, Canada McKinley et al., 1998
Ottawa River Ottawa River Watershed, Ontario/Quebec, Canada Haxton, 2003b
Menominee River Lake Michigan Watershed, Michigan/Wisconsin, United States of America Thuemler, 1985
Sturgeon River Lake Superior Watershed, Michigan, United States of America Auer, 1999
Black Sturgeon River Lake Superior Watershed, Ontario, Canada Friday, 2005a
Kaministiquia River Lake Superior Watershed, Ontario, Canada Friday, 2005b St. Lawrence River St. Lawrence Watershed, Ontario/Quebec, Canada Fortin et al., 1993
Namakan River Lake of the Woods Watershed, Ontario/Minnesota, Canada/United States of America (respectively)
Welsh & McLeod, 2010
Manistee River Lake Michigan Watershed, Michigan, United States of America Lallaman et al., 2008
Grasse River St. Lawrence River Watershed, New York, United States of America Trested, 2010
Kettle River Mississippi River Watershed, Minnesota, United States of America Borkholder et al., 2002
Mississippi River Mississippi River Watershed, Minnesota/Wisconsin, United States of America Knights et al., 2003
Peshtigo River Lake Michigan Watershed, Michigan/Wisconsin, United States of America Benson et al., 2005
Detroit River Lake Erie Watershed, Ontario/Michigan, Canada/United States of America (respectively)
Caswell et al., 2004
Lake Winnebago Lake Michigan Watershed, Wisconsin, United States of America Lyons & Kempinger, 1992
Black Lake Lake Huron Watershed, Michigan, United States of America Smith & King, 2005
Portage Lake Lake Superior Watershed, Michigan, United States of America Holtgren & Auer, 2004

9
The Pic River in Ontario, a tributary that drains into north eastern Lake Superior,
is a system where little is known about Lake Sturgeon population demographics,
movement patterns, and/or habitat utilization. Studies of these subjects would inevitably
help guide decision making and land use planning for the Pic River watershed for the
enhancement and protection of critical Lake Sturgeon habitat. Furthermore, with no
artificial obstructions and limited development within the watershed, the Pic River Lake
Sturgeon population may be one of the least disturbed populations in the Great Lakes,
thus making it a good reference population to collect baseline conditions. In response to
this knowledge gap, the Anishinabek/Ontario Fisheries Resource Centre (A/OFRC), the
Department of Fisheries and Oceans Canada (DFO), Pic River First Nation, the Ontario
Ministry of Natural Resources (OMNR), and the United States Fish and Wildlife Service
(USFWS) have been conducting research on Lake Sturgeon in the Pic River with various
methodologies since 2002. The overall objective of this research has been to identify
critical Lake Sturgeon habitat, monitor seasonal movement patterns, and assess baseline
conditions of the population. This thesis is the culmination of these efforts and is broken
into two main chapters that relate to Lake Sturgeon movement patterns and spawning
habitat, respectively.
The second chapter of this thesis reports Lake Sturgeon movement patterns that
were monitored for three years using radio telemetry to identify environmental cues for
migration, to assess commonly used habitat and associated physical features, and to
describe general movement patterns as they related to spawning and non-spawning
individuals. First, it was hypothesized that inter-annual differences in the timing of Lake
Sturgeon migration should coincide with abiotic conditions that deviate from average
10
flow, thermal, or ice conditions in the Pic River. Second, it was hypothesized that Lake
Sturgeon moving from lakes to rivers, or vice versa, should be stimulated to do so by a
narrow range of thermal and flow conditions that vary seasonally and annually. Finally,
since spawning and non-spawning Lake Sturgeon utilize the river for different purposes,
it was hypothesized that their timing of migration and movement patterns should also
vary.
The third chapter of this thesis reports on Lake Sturgeon spawning habitat that
was mapped at three potential spawning sites to quantitatively assess the habitat
suitability using a model that was developed for northern Ontario rivers (Threader et al.,
1998). Spawning assessments were also performed to confirm the location and timing of
spawning and to evaluate the predictive ability of the habitat suitability model (HSM) by
comparing the modeled results with empirical observations of spawning activity. Since
the HSM evaluates the overall spawning suitability based on depth and substrate, and the
daily suitability by factoring in thermal and flow conditions, two hypotheses were
formulated to test the overall and daily predictions that were generated by the HSM. The
first hypothesis for this chapter was that Lake Sturgeon should reproduce at spawning
sites, and locations within those sites, that have the greatest proportion and amount of
highly suitable habitat relative to poorly suited habitat. The second hypothesis of this
chapter is that Lake Sturgeon should spawn when optimal thermal conditions of 12˚C to
16˚C are reached at each respective spawning site (Threader et al., 1998). Identifying and
protecting critical Lake Sturgeon habitat has been identified as a priority research
objective for the recovery of Lake Sturgeon in Lake Superior and throughout the Great
Lakes (Auer, 2003; Hay-Chmielewski & Whelan, 1997; OMNR, 2009). This study will

11
contribute to these research efforts by monitoring movement patterns, identifying critical
habitat, and quantitatively assessing spawning suitability at three potential spawning sites
within a tributary where very little information previously existed.

12
Chapter 2: Patterns, Timing, and Environmental Cues to Lake Sturgeon Migration
2.1 INTRODUCTION
Throughout the world, fish species undertake long and perilous migrations with
the intention that their overall fitness and well-being will be optimized in the habitat
conditions of their destination. Scombridae (Tuna) undertake long migrations in search of
highly suitable spawning and foraging habitat (Block et al., 2005), Gadidae (Cod)
undertake migrations to reduce interspecific and intraspecific competition (Laurel et al.,
2004), and Gasterosteidae (Sticklebacks) undertake migrations to avoid inbreeding with
closely related individuals (Frommen & Bakker, 2006; Cano et al., 2008). Although it is
important to understand why species and individuals migrate, it is equally important to
determine the timing of these migrations and the environmental cues that are responsible
for stimulating migration patterns.
Numerous studies have examined the timing and environmental cues of
commercially valuable migrating fish stocks, particularly for salmonid fishes (Svendsen
et al., 2004; Anderson & Beer, 2009; Mathes et al., 2010). Many salmonid species
undertake these migrations in search of their natal spawning habitat, and fishing
regulations within these spawning tributaries are often aligned with the timing and
environmental cues of these migrations (Bardonnet & Bagliniere, 2000). In the Columbia
River system, for example, harvest regulations for Chinook Salmon (Onchorhynchus
tshawytscha) are related to the timing of their migrations, which are predicted by models
based on oceanic environmental variables (Keefer et al., 2008; Jepson et al., 2010). In
Norwegian rivers, Brown Trout (Salmo trutta) coordinate their migrations with peaks in
water discharge in order to ascend barriers or obstacles on route to their natal spawning

13
grounds (Rustadbakken et al., 2004). In regulated waterways in Europe, dam operators
must establish minimum river flows to facilitate the up and downriver migration of
Atlantic Salmon (Salmo salar) (Lundqvist et al., 2008). Although the timing and
environmental cues to salmonid migrations, and other commercially valuable fish stocks,
are well studied, less is known about the migrations of Lake Sturgeon.
Lake Sturgeon undertake annual migrations from lakes to rivers in search of
quality foraging and spawning habitat (Bemis & Kynard, 1997; Peterson et al., 2007).
Although not all Lake Sturgeon populations use both lake and river habitats (Borkholder
et al., 2002; Friday, 2004), estimates suggest that most Lake Sturgeon require 250 km to
300 km of unimpeded river-lake habitat as a minimum home range size (Auer, 1996). If
Lake Sturgeon do not have access to this large non-degraded riverine habitat, then
populations are susceptible to extirpation, as they were throughout the 1900s in response
to overfishing and impoundments (Harkness & Dymond, 1961; Baker & Borgeson,
1999). Furthermore, Lake Sturgeon populations residing in unimpeded stretches of river
had greater relative abundances and faster growth rates compared to populations
occupying impounded sections of the river (Haxton, 2002; Haxton & Findlay, 2008).
Therefore, it is well understood amongst Lake Sturgeon biologists that long and
unimpounded rivers, which facilitate long distance migrations, are essential in the
recovery and long term conservation of this species (Hay-Chmielewski & Whelan, 1997;
Auer, 2003). However, despite this acknowledgement, there has been relatively little
research focused on the migration patterns of Lake Sturgeon in natural unimpeded river
systems.
14
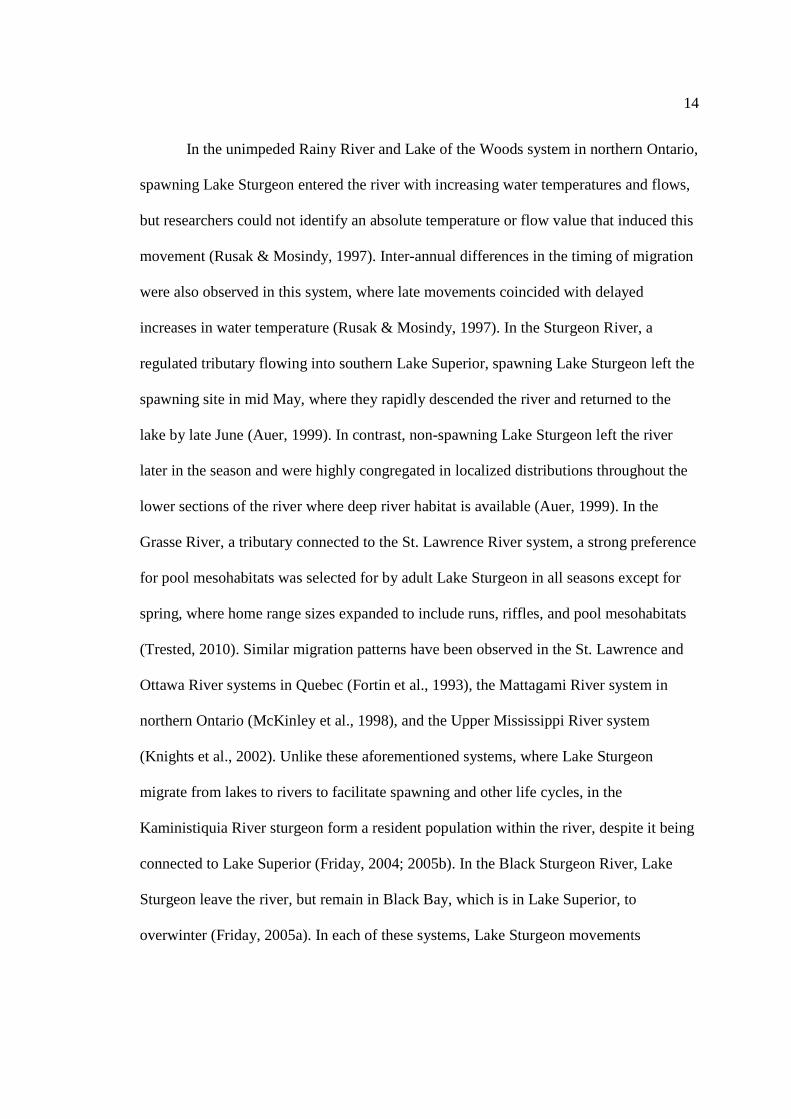
In the unimpeded Rainy River and Lake of the Woods system in northern Ontario,
spawning Lake Sturgeon entered the river with increasing water temperatures and flows,
but researchers could not identify an absolute temperature or flow value that induced this
movement (Rusak & Mosindy, 1997). Inter-annual differences in the timing of migration
were also observed in this system, where late movements coincided with delayed
increases in water temperature (Rusak & Mosindy, 1997). In the Sturgeon River, a
regulated tributary flowing into southern Lake Superior, spawning Lake Sturgeon left the
spawning site in mid May, where they rapidly descended the river and returned to the
lake by late June (Auer, 1999). In contrast, non-spawning Lake Sturgeon left the river
later in the season and were highly congregated in localized distributions throughout the
lower sections of the river where deep river habitat is available (Auer, 1999). In the
Grasse River, a tributary connected to the St. Lawrence River system, a strong preference
for pool mesohabitats was selected for by adult Lake Sturgeon in all seasons except for
spring, where home range sizes expanded to include runs, riffles, and pool mesohabitats
(Trested, 2010). Similar migration patterns have been observed in the St. Lawrence and
Ottawa River systems in Quebec (Fortin et al., 1993), the Mattagami River system in
northern Ontario (McKinley et al., 1998), and the Upper Mississippi River system
(Knights et al., 2002). Unlike these aforementioned systems, where Lake Sturgeon
migrate from lakes to rivers to facilitate spawning and other life cycles, in the
Kaministiquia River sturgeon form a resident population within the river, despite it being
connected to Lake Superior (Friday, 2004; 2005b). In the Black Sturgeon River, Lake
Sturgeon leave the river, but remain in Black Bay, which is in Lake Superior, to
overwinter (Friday, 2005a). In each of these systems, Lake Sturgeon movements
15
coincided with increases in water temperature and flow, however, the timing of migration
varied from system to system and from year to year depending on thermal and flow
regimes. Cumulatively, these studies have revealed that there is sufficient ambiguity in
the movements of Lake Sturgeon between different systems, between spawning and non-
spawning individuals, and in the timing of migration, which coincides with
environmental variables.
The objectives of this chapter are to investigate inter-annual differences in the
timing of migration, to identify differences in the migration patterns between spawning
and non-spawning individuals, and to identify environmental variables that can be used to
accurately predict the timing of Lake Sturgeon migration. Furthermore, this study aimed
to summarize the migration patterns of Lake Sturgeon and to identify commonly used
habitat within the Pic River, a relatively pristine northern Ontario tributary that is
connected to Lake Superior. First, it is hypothesized that inter-annual differences in the
timing of Lake Sturgeon migration should coincide with abiotic conditions that deviate
from average flow, thermal, or ice conditions in the Pic River. It is therefore
hypothesized that delayed warming, spring freshets, or ice free conditions should
coincide with later migrations, and conversely, early warming, spring freshets, or ice free
conditions should coincide with earlier migrations. Secondly, it is hypothesized that Lake
Sturgeon moving from lakes to rivers, or vice versa, should be stimulated to do so by
abiotic conditions, commonly referred to as environmental cues to migration. It is
predicted that Lake Sturgeon will enter the Pic River during the high flows of the spring
freshet and leave once flows have decreased in the late summer. As well, individuals
should enter the Pic River as temperatures warm and shortly after ice out, and return to

16
the lake once higher temperatures are reached in the late summer. Finally, since spawning
and non-spawning Lake Sturgeon utilize the river for different purposes; the timing of
their migrations should likewise vary. It is predicted that spawning Lake Sturgeon should
enter the river, reach their uppermost point (e.g. the spawning grounds), and descend to
deep-water pools near the mouth of the river significantly earlier compared to their non-
spawning counterparts.
2.2 METHODS
2.2.1 Study Area:
The Pic River drains into north-eastern Lake Superior at the community of Pic
River First Nation and Pukaskwa National Park, Ontario, Canada (UTM: 551435W,
5393249N). The river begins at McKay Lake Dam (UTM: 550822W, 5497725N) near
the community of Caramat, Ontario, and has a gross drainage area of 4270 km2; making
it a medium-sized river within Ontario (Water Survey of Canada, 2010). Within the Pic
River watershed there are very few developments, and the rugged terrain surrounding the
river makes it difficult to access large portions of it. Navigation can also be difficult due
to high turbidity and large amounts of floating or sunken debris within the river (mainly
logs).
This study was conducted in the lower 103 km of the Pic River from the mouth
north eastwards to the uppermost navigable point of Manitou Falls (UTM: 566912W,
5450909N) near the community of Manitouwadge, Ontario (Figure 2.1). Within this
segment, there are two major tributaries that flow into the Pic River, the Black River and
the Kagiano River which confluence with the Pic River at 4 km and 98 km from Lake

17
Superior, respectively. The uppermost navigable point in the Black River is a
hydroelectric facility located 10.2 km from Lake Superior (UTM: 556601W, 5389998N),
whereas the uppermost navigable point in the Kagiano River is a natural barrier located
99.8 km from Lake Superior (UTM: 565457W, 5449256N).
Preliminary studies, both scientific and traditional ecological knowledge,
indicated that the most heavily utilized Lake Sturgeon habitat within the Pic River was
contained in the upper and lower 25 km of the river, in locations hereby referred to as; the
mouth (foraging; 0 river km), the Lower Rapids (foraging; 25 river km), Henry’s Honey
Hole (staging and foraging; 97 river km), Kagiano Falls (spawning; 98 river km), and
Manitou Falls (spawning; 103 river km) (Quinlan, 2002; Couchie, 2008; Deary, 2008;
Bill Gardner, personal communication; Nikki Commanda, personal communication).
Accordingly, crews of two to three people captured Lake Sturgeon and monitored their
migration patterns in the lower (Figure 2.2A) and upper (Figure 2.2B) 25 km of the river.
Fisheries and Oceans Canada, along with Pic River Hydro and Hatch Energy in 2010,
focused their efforts in the upper 25 km of the river, while the Anishinabek/Ontario
Fisheries Resource Centre, on behalf of Pic River First Nation, and Trent University
focused their efforts in the lower 25 km of the river. Crews were present at each portion
of the river in 2008, 2009, and 2010, from early spring to late summer. The spring arrival
of crews varied from year-to-year and so did their availability, therefore sampling times
were limited by the availability of crews and a compromised routine.
18
A
B
B
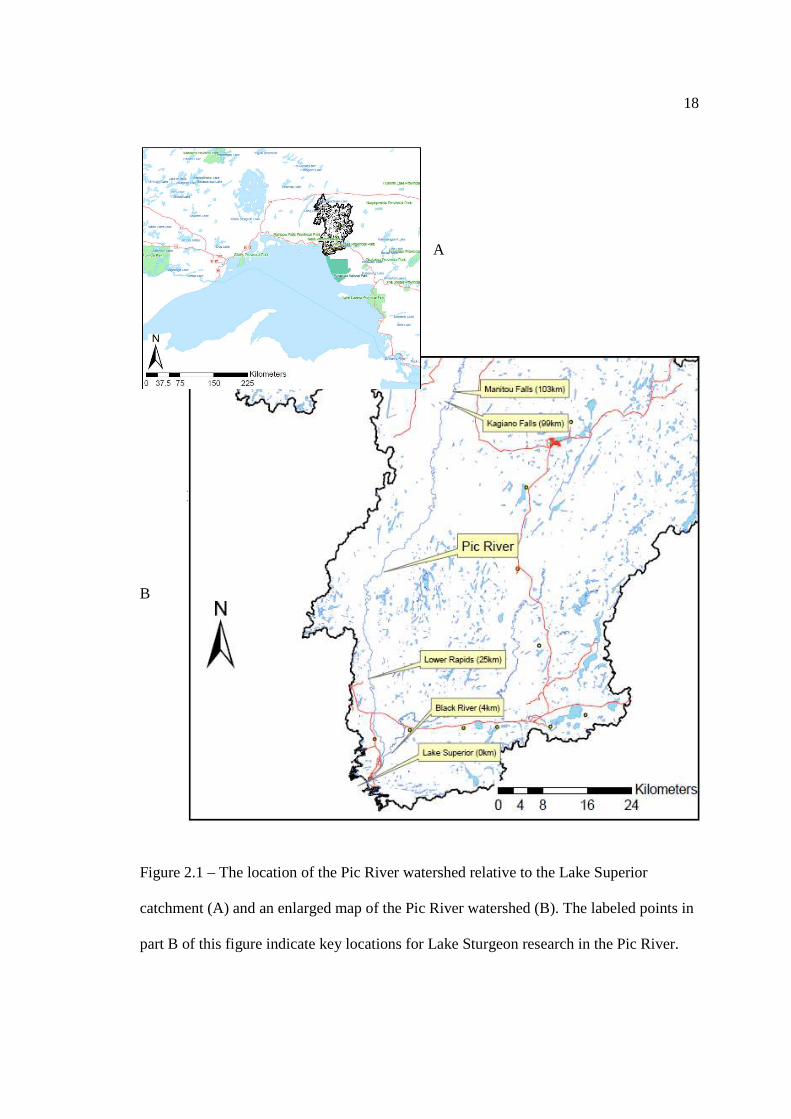
Figure 2.1 – The location of the Pic River watershed relative to the Lake Superior
catchment (A) and an enlarged map of the Pic River watershed (B). The labeled points in
part B of this figure indicate key locations for Lake Sturgeon research in the Pic River.

19
A
B Figure 2.2 – The lower (A) and upper (B) portions of the Pic River, which were identified
in previous studies as habitat that was frequently utilized by Lake Sturgeon. Numbers
indicate the upstream distances in kilometers from Lake Superior.
20
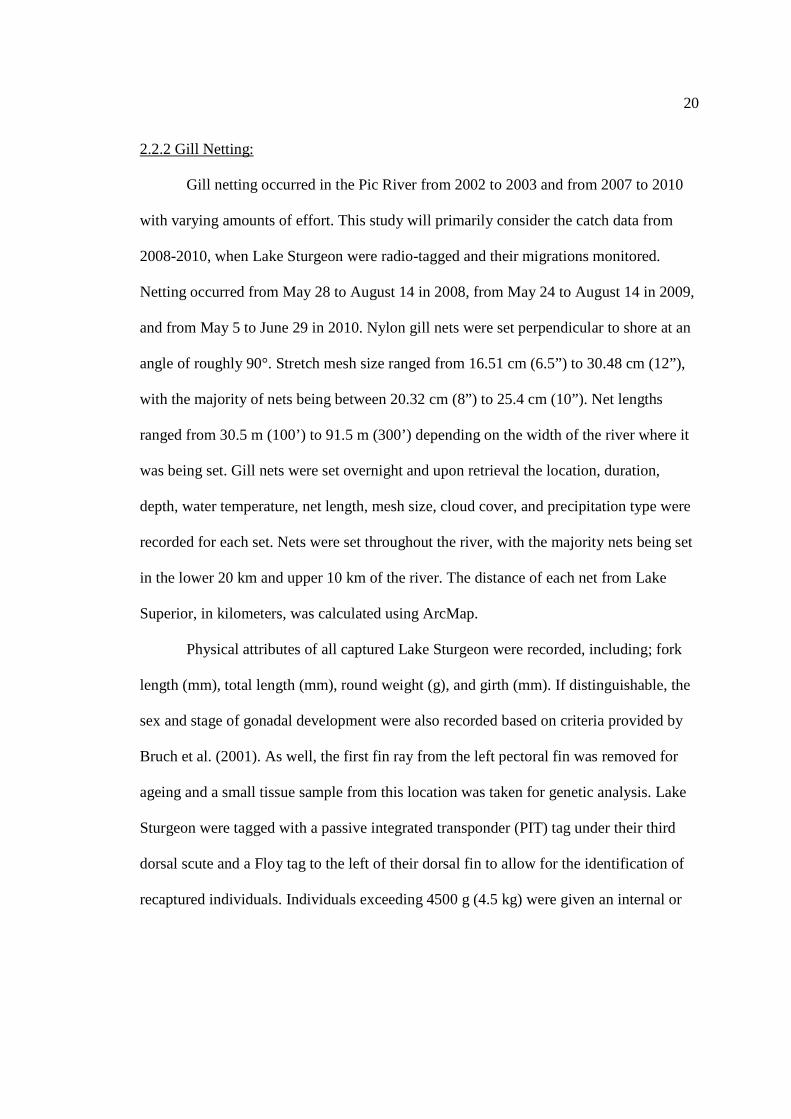
2.2.2 Gill Netting:
Gill netting occurred in the Pic River from 2002 to 2003 and from 2007 to 2010
with varying amounts of effort. This study will primarily consider the catch data from
2008-2010, when Lake Sturgeon were radio-tagged and their migrations monitored.
Netting occurred from May 28 to August 14 in 2008, from May 24 to August 14 in 2009,
and from May 5 to June 29 in 2010. Nylon gill nets were set perpendicular to shore at an
angle of roughly 90°. Stretch mesh size ranged from 16.51 cm (6.5”) to 30.48 cm (12”),
with the majority of nets being between 20.32 cm (8”) to 25.4 cm (10”). Net lengths
ranged from 30.5 m (100’) to 91.5 m (300’) depending on the width of the river where it
was being set. Gill nets were set overnight and upon retrieval the location, duration,
depth, water temperature, net length, mesh size, cloud cover, and precipitation type were
recorded for each set. Nets were set throughout the river, with the majority nets being set
in the lower 20 km and upper 10 km of the river. The distance of each net from Lake
Superior, in kilometers, was calculated using ArcMap.
Physical attributes of all captured Lake Sturgeon were recorded, including; fork
length (mm), total length (mm), round weight (g), and girth (mm). If distinguishable, the
sex and stage of gonadal development were also recorded based on criteria provided by
Bruch et al. (2001). As well, the first fin ray from the left pectoral fin was removed for
ageing and a small tissue sample from this location was taken for genetic analysis. Lake
Sturgeon were tagged with a passive integrated transponder (PIT) tag under their third
dorsal scute and a Floy tag to the left of their dorsal fin to allow for the identification of
recaptured individuals. Individuals exceeding 4500 g (4.5 kg) were given an internal or
21
external radio tag, if one was available, to monitor their future movement patterns within
the Pic River.
2.2.3 Radio Telemetry:
For this study, five external radio tags (model number: F2090) and forty five
internal radio tags (model number: F1855B) were used(Advanced Telemetry Systems
Inc., Isanti, Minnesota). Each radio tag had a pulse rate of 55 pulses per minute (ppm), a
pulse width of 20 milliseconds, and a unique radio frequency ranging from 150.011 kHz
to 151.485 kHz. The weight and battery life varied between the two types of radio tags,
with internal radio tags weighing 87 g and having a battery life of 1185 days and external
radio tags weighing 47 g and having a battery life of 1086 days. Fewer external radio tags
were applied due to concerns that external tags would become detached and tag retention
would be low, which the results verified to be a valid concern. External radio tags were
attached to Lake Sturgeon exceeding 4500 g (4.5 kg) by embedding the posterior and
anterior attachments of the radio tag through the base of the dorsal fin.
Surgical procedures were undertaken to implant internal radio tags into the body
cavity of Lake Sturgeon exceeding 9000 g (9 kg). 9000 g Lake Sturgeon were selected in
order to minimize any harm or unnatural behaviour that may result from the application
of the tag and in accordance with the “two percent rule” (Adams et al., 1998; Brown et
al., 1999; Jepsen et al., 2003). The surgical procedure used to implant radio tags into the
body cavity of Lake Sturgeon was similar to that described by Friday (2005a; 2005b) and
followed guidelines outlined by the Canadian Council on Animal Care (Ackerman et al.,
2000). Lake Sturgeon were sampled and then put into a large tub (Rubbermaid
Commercial 4244-Bla 70 Gallon Stock Tank Black) with 60 L of river water, to which 32
22
mL of a clove oil and ethanol solution (1.2 mL clove oil to 10.8 mL of ethanol) was
added as an anesthetizing agent. Fish remained in the anesthetizing tub until they could
no longer control their orientation in the water, lacked locomotory skills, and their
stomachs appeared to have a concave indent. Once fish showed these symptoms of the
anesthetic (Ackerman et al., 2000), they were removed from the tub and placed in a
canvas surgery sling that provided adequate water circulation around the gills and
drainage. All surgical tools were thoroughly cleaned and decontaminated before
commencing the surgical procedure using isopropyl alcohol. A 4 cm to 6 cm incision was
then made along the mid-ventral line of the fish, using a size 10 scalpel, to expose the
Lake Sturgeon’s body cavity. Another small incision, using a 14 gauge needle tip, was
then made posterior to the initial incision to feed the antenna tail of the radio tag outside
of the body cavity. The radio tag was then activated, the frequency recorded, and
carefully inserted into the body cavity. The 4 cm to 6 cm incision was then sutured
together with four to five stitches (Ethicon Monocryl Plus, CT-1 36 mm ½ Circle, Violet
Monofilament) and strengthened using tissue adhesive (3M™ Vetbond™). The Lake
Sturgeon were immediately immersed in fresh river water and constantly monitored until
they showed symptoms of recovery from the anesthetizing agent (Ackerman et al., 2000).
The entire procedure took roughly 30 minutes and upon completion the Lake Sturgeon
was then released in the river, away from any nets or debris.
Base stations (model number: R4500S) (Advanced Telemetry Inc., Insanti,
Minnesota) were powered by a deep cycle marine battery that was charged by a solar
panel and were comprised of two antennas, one pointing directly upriver and the other
pointing directly downriver. Based on field tests at the base stations, it was estimated that

23
each antenna could detect a radio signal approximately 500-1000 m away in the direction
of the antenna (depending on the topography of the river). The base stations could collect
and store up to 80,000 bytes of information before overwriting previously recorded data,
therefore downloading times were coordinated to avoid losing any data (roughly every
week during the spring/summer and twice during the fall/winter). Radio frequencies were
inputted into the receivers once they were surgically implanted into Lake Sturgeon. Base
stations were setup as close to the shoreline as possible and in locations that could be
easily accessed by boat or vehicle (Figure 2.3). Some of the stations were moved
throughout the year to coordinate with the migration patterns being observed. Upon
setup, the location of each base station (UTM), the direction of each antenna (upriver or
downriver), and the distance of the base station from Lake Superior were recorded (Table
2.1).

24
Table 2.1 – Date, location, and orientation of antennas for each base station that was operable over the course of this study. * =
Julian calendar date was one day behind until it was corrected or on July 6th, 2008.
Year Station
# Installation
Date Decommissioning
Date
Distance from Lake
(km) Easting Northing Antenna 1 Antenna 2
2008* 1 June 17 November 3 0.085 551527 5383215 Upriver Downriver
2008 2 June 18 October 26 24.750 551645 5402597 Downriver Upriver
2008 3 July 25 November 3 4.432 554237 5386437 Downriver Upriver
2008 3 November
3 November 18 1.441 552316 5384144 Upriver Downriver
2009 1 May 21 December 31 0.085 551527 5383215 Upriver Downriver
2009 3 June 3 October 26 24.750 551645 5402597 Upriver Downriver
2010 1 January 1 December 31 0.085 551527 5383215 Upriver Downriver
2010 2 April 7 July 10 24.750 551645 5402597 Upriver Downriver
2010 3 April 25 May 21 90.456 564500 5443592 Upriver Downriver
2010 3 May 21 July 12 103.000 567183 5450923 Upriver Downriver
25
Figure 2.3 – Location of base stations throughout this study with details of the set up of
each base station provided in Table 1.

26
The base stations often collected interference or ‘noise’ while operating on the Pic
River (especially base station #3). Therefore, a method was developed to classify valid
and invalid information that was collected from each base station. For a base station
recording to be considered valid, the radio frequency in question had to first be picked up
by antenna 0 (the default control antenna) and then by antenna 1 and/or 2. As well, the
radio frequency had to be recorded at least twice per hour by either antenna 1 and/or 2.
The classification method also factored in the ratio of pulses to matches, whereby the
number of pulses should vary between 10 and 16 and the number of matches should be
between 75% and 100% of this value. This classification variable is based on the setup of
each base station, whereby each base station scans each radio frequency for 15 seconds
per antenna at a pulse rate of 1 pulse per second and each radio tag has a pulse rate of 55
pulses per minute (Mike Friday, personal communication; Sound Metrics Inc., personal
communication). Cumulatively, these three steps were able to accurately decipher and
classify valid and invalid data that were collected by the base stations.
Where possible and as time permitted, manual telemetry sweeps of the river were
performed throughout the study period. These were performed by travelling in the boat at
a speed of approximately 10-15 km/h while scanning each radio frequency that had
already been activated (2-3 s per frequency). Once detected from afar, the precise
location of the individual (±1.5 m) would be found by reducing the boat speed and the
amount of gain on the manual receiver (i.e. its search radius). In the lower section of the
river an Advanced Telemetry System Inc. receiver was used (model number: R410) and
at the upper section of the river a Lotek receiver was used (model number: SRX 600).
When radio tagged Lake Sturgeon were found, the location (Garmin eTrex), date, time,
27
depth, and temperature were recorded at that location. Whenever a Lake Sturgeon was
recorded, either manually or by base station, the distance of that Lake Sturgeon from
Lake Superior was determined using ArcMap.
2.2.4 Abiotic Conditions:
Part of this study aimed to identify the environmental cues that may be
responsible for stimulating and terminating Lake Sturgeon migration. Therefore,
monitoring of water temperature and discharge occurred at the mouth of the Pic River to
represent the abiotic conditions that would be experienced by migrating Lake Sturgeon at
that time. Water temperature was recorded once every half hour using a temperature data
logger (model number: HOBO Water Temp Pro v2 Data Logger) which was located
approximately 500 m from Lake Superior (UTM: 551578W, 5383243N). Mean daily
temperature was based on the 48 daily readings from this temperature logger. Mean daily
water discharge was provided by Environment Canada’s Water Surveying Station (station
name: PIC RIVER NEAR MARATHON; station ID: 02BB003) (Water Survey of
Canada, 2010). This autonomous surveying station records water level and calculates
water discharge based on a rating curve that has been established between water level and
discharge for the Pic River. This station also monitors ice conditions on the Pic River and
records the day when the river becomes ice free. Issues with the instrumentation occurred
from June 2 to June 7, 2009 and from June 18 to August 12, 2009, resulting in estimates
of water discharge during these dates. These estimates were calculated by Environment
Canada based on water discharge levels at other gauging stations within close proximity
and weather conditions.
28
2.2.5 Data Analysis:
To determine inter-annual differences in the timing of Lake Sturgeon migration,
the data collected by base station 1 (at the mouth of the river) was used to assess when
individuals entered and exited the river. Individuals were considered to have entered the
river once they were recorded by antenna 1 (i.e. directed into the Pic River) and had been
recorded at some later point within the river. Also, if individuals were first captured or
recorded more than 10 km upriver from Lake Superior, an entry date was not given to
that individual for that particular year and they were excluded from the analysis.
Conversely, individuals were considered to have exited the river once they were
exclusively recorded by antenna 2 (i.e. directed into Lake Superior) and were not
recorded at some later point within the river. The duration that Lake Sturgeon remained
in the river (number of days) was determined by subtracting the exit date from the entry
date. The date when Lake Sturgeon reached their uppermost distance was based on data
that were collected by any of the three base stations, manual telemetry records, or catch
records. Individuals were classified into either the spawning or non-spawning portion of
the population based on their uppermost point of migration.
Julian dates for when Lake Sturgeon entered the river, reached their uppermost
point, and exited the river were compiled for each year and analyzed using STATISTICA
(Version 6.0; StatSoft Inc.; Tulsa, Oklahoma, USA). One-way ANOVAs were performed
to identify interannual differences in the timing of migration and differences between
spawning and non-spawning individuals. A 95% confidence interval was used to identify
significant differences between years and spawning versus non-spawning individuals.

29
Year and spawning status were used as categorical variables for this analysis, while
Julian date at entry, uppermost point, and exit served as dependent variables for this
analysis. Tukey post-hoc tests were then performed to identify which years of study were
significantly different.
Once Lake Sturgeon entered the river (location = 0), reached their uppermost
point (location = 0.5), and exited the river (location = 1), the mean daily water discharge
and mean daily temperature for that day was recorded. Backward stepwise multiple
regression analysis was then performed with the dependent variable of location (entry,
uppermost, and exit) and the independent variables of mean daily water discharge and
mean daily water temperature. This analysis determined whether temperature or water
discharge was a better environmental cue for predicting the timing of Lake Sturgeon
migration. Box plots, with 95% confidence intervals, were then created to show the
nature of the relationship between environmental cues and the location of migrating Lake
Sturgeon. Finally, to determine if Lake Sturgeon migration was stimulated by ice
conditions, a bivariate correlation between the mean annual date of entry and the day of
ice disappearance was performed.
2.3 RESULTS
Throughout the course of this study, a total of 159 Lake Sturgeon were captured
and 30 individuals were recaptured. Of these 159 Lake Sturgeon, 47 of them were fitted
with either an internal (N=43) or external (N=4) radio tag. The mean total length for
radio tagged individuals was 1236.6 mm (1.2 m), while the mean round weight of these
individuals was 13686.0 g (13.7 kg), size class frequency distributions are shown in

30
Figure 2.4. Tag retention was high for the internal radio tags (100%) and low for the
external radio tags (50%). The loss of two external radio tags (frequencies: 150.571 kHz
and 150.612 kHz), meant that only 45 Lake Sturgeon were radio tagged for the duration
of this study.
31
A
B
Figure 2.4 – Size class frequency distributions of all Lake Sturgeon that were captured
during this study (A) and of Lake Sturgeon that were radio-tagged during this study (B).
32
2.3.1 Migration Patterns:
The migration patterns of Lake Sturgeon for each year of study, as well as their
relationship with mean daily water discharge and mean daily water temperature are
shown in Figures 2.5a and 2.5b. There were three distinct migration patterns that were
observed during this study. The first was that Lake Sturgeon entered the river and
remained within the lower 5km to 10km of the river for all or part of the spring-summer
months. The second was that Lake Sturgeon entered the river and traveled upriver to the
lower rapids, which were located roughly 25km upriver from Lake Superior. Given that
no evidence of spawning was collected at either of these sites (see Section 3.3.3),
combined with the fact that Lake Sturgeon were often found in deep water habitat with
silt or clay substrate, it is thought that Lake Sturgeon exhibiting either of these migration
patterns were most likely seeking higher quality foraging habitat. The third common
migration pattern that was observed was exclusive to the spawning portion of the
population. Spawning individuals tended to enter the river and ascend the river very
quickly, usually reaching Henry’s Honey Hole (97km upriver from Lake Superior) within
10 days of entering the river. They would remain at Henry’s Honey Hole, Manitou Falls
(103km), or Kagiano Falls (99km), for a period of 10 days to 15 days and would then
rapidly descend the river, where they would spend a variable amount of time within the
lower 10km of the river before returning to Lake Superior for the fall and winter. These
three distinct migration patterns were observed in each year of study by a varying pool of
individuals depending on their reproductive cycle.
33
Figure 2.5a - Migration patterns for individual sturgeon in relation to mean daily water
discharge (black line) in each year of the study (2008 top; 2009 middle; 2010 bottom).
Yellow lines correspond to migration pattern one, red lines correspond with migration
pattern two, and green lines correspond with migration pattern three (see text above for
description of patterns).
W A T E R D I S C H A R G E (m3
persec)
D I S T A N C E F R O M L A K E S U P E R I O R (KM) March May July Sept. Nov.

34
Figure 2.5b - Migration patterns for individual sturgeon in relation to mean daily water
temperature (black line) in each year of the study (2008 top; 2009 middle; 2010 bottom).
Yellow lines correspond to migration pattern one, red lines correspond with migration
pattern two, and green lines correspond with migration pattern three (see text above for
description of patterns).
March May July Sept. Nov.
W A T E R T E M P E R A T U R E ˚C
D I S T A N C E F R O M L A K E S U P E R I O R (KM)

35
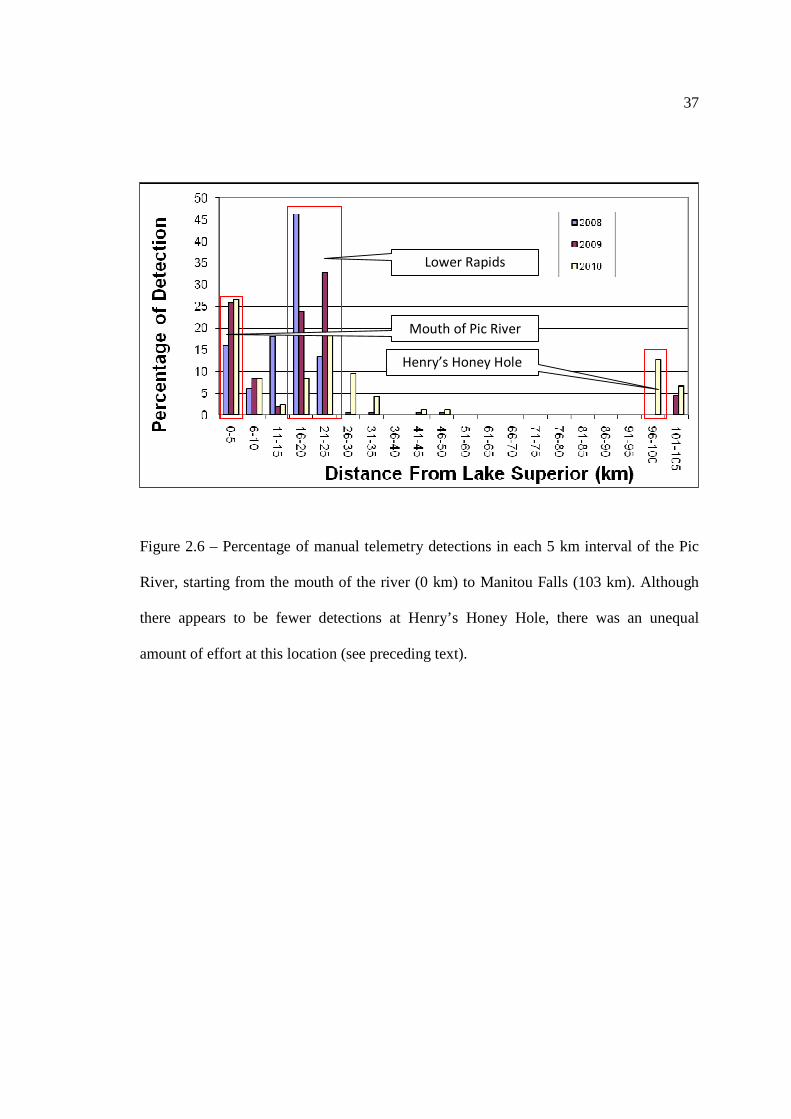
Results from the manual tracking also indicated that Lake Sturgeon tended to
congregate in distinct locations within the Pic River, most noticeably within the mouth of
the Pic River (0 km to 5 km), the lower rapids (16 km to 25 km), and Henry’s Honey
Hole (96 km to 100 km) (Figure 2.6). Of all the detections from the manual telemetry
sweeps in 2008, 2009, and 2010, a total of 75.8 %, 85.6 %, and 66.1 % were detected
within these three locations, respectively (N2008=149; N2009=155; N2010=165). Although it
may appear from Figure 2.6 that there were few manual telemetry detections within
Henry’s Honey Hole, given the relatively low amount of effort at the upper Pic, it appears
that this location is the most frequently utilized location within the upper portion of the
Pic River and therefore was considered a frequently used location. Portions of the river
outside of these three destinations tended to be used exclusively by transient individuals,
whereby Lake Sturgeon would use it as a corridor or for spawning purposes. At the
mouth of the river Lake Sturgeon distribution was relatively uniform, with a slightly
aggregated distribution along the bedrock wall that makes up the southern shoreline of
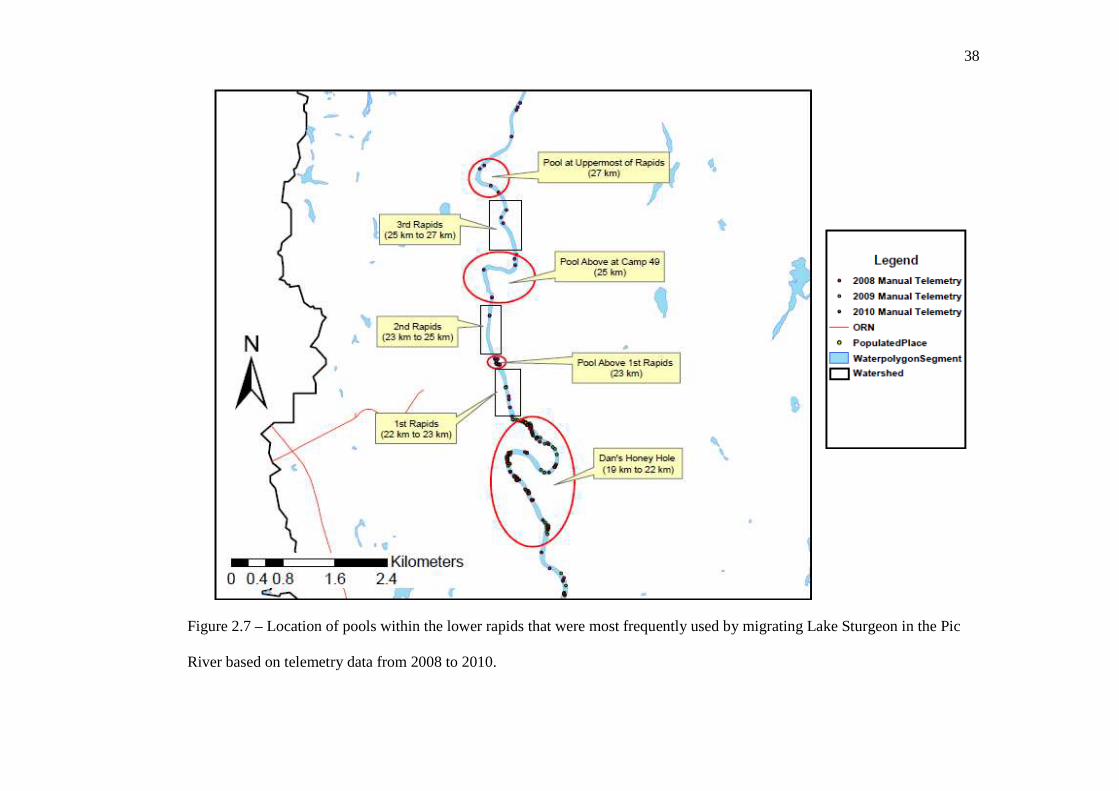
the river’s mouth (i.e. 0 km to 0.5 km within the Pic River). At the lower rapids, Lake
Sturgeon distribution was extremely aggregated within deep pools that were below the
start of the rapids, immediately above the rapids, or in pools that occurred intermittently
between sets of rapids (Figure 2.7). Maximum depth within these pools exceeded 6 m
throughout the spring and summer months and Lake Sturgeon were often found within
close proximity of the shoreline that had the greatest slope or that had a bedrock wall. At
Henry’s Honey Hole, the inner bend drops off very steeply and the river bottom gradually
ascends towards the eastern shoreline. Like at the lower rapids, Lake Sturgeon at Henry’s
Honey Hole were most frequently found within close proximity of the inner bend, where

36
a steep shoreline slope occurs. Although Lake Sturgeon will inevitably depend on
transient corridors and fast-flowing spawning habitat at some point within their
migrations and life cycles, these results indicate that deep slow-flowing pools are much
more frequently utilized by Lake Sturgeon within rivers during the spring and summer
months.
37
Figure 2.6 – Percentage of manual telemetry detections in each 5 km interval of the Pic
River, starting from the mouth of the river (0 km) to Manitou Falls (103 km). Although
there appears to be fewer detections at Henry’s Honey Hole, there was an unequal
amount of effort at this location (see preceding text).
Mouth of Pic River
Lower Rapids
Henry’s Honey Hole
38
Figure 2.7 – Location of pools within the lower rapids that were most frequently used by migrating Lake Sturgeon in the Pic
River based on telemetry data from 2008 to 2010.

39
2.3.2 Abiotic Conditions:
Spring abiotic conditions were substantially different in 2010 compared to 2008
and 2009 (Table 2.2), whereby environmental conditions typically observed in August
were experienced in May of 2010. Water temperatures reached 20°C 47 days earlier and
the river was ice free 39 days earlier in 2010 compared to 2008 and 2009 (Figure 2.8).
Furthermore, the river was ice-covered for approximately 49 days longer in 2008 and
2009 compared to 2010, which coincided with the earlier timing of migration in 2010 by
roughly 50 days (see Section 2.3.3). Not only was the temperature regime very different
in 2010, the flow regime was also different, whereby the mean monthly discharge (m3/s)
in 2010 was roughly 22%, 21%, and 17% of the mean monthly discharge for April, May,
and June in 2008 and 2009, respectively. Furthermore, due to a limited amount snow
cover during the winter of 2009/2010, there was virtually no spring freshet in 2010.
According to the Environment Canada water gauging station, mean monthly discharge in
April, May, and June of 2010 were the lowest mean monthly discharge rates since the
station’s existence in 1970. These warm and dry abiotic conditions provided a unique
opportunity to study potential changes in the movements of Lake Sturgeon in a natural
setting.

40
Table 2.2 – Annual comparison of spring abiotic conditions within the Pic River.
Date when
20°C was reached
Date when
river was ice free
Number of days with ice cover
April mean monthly discharge
(m3/s)
May mean monthly discharge
(m3/s)
June mean monthly discharge
(m3/s)
2008 August 5 April 21 149 days (Nov 24
to Apr 21) 131.00 128.00 138.00
2009 August 16 April 25 157 days (Nov 19
to Apr 25) 76.20 128.00 39.90
2010 May 26 Mar 15 104 days (Dec 3 to Mar 15)
22.82 26.47 15.02

41
A
B
Figure 2.8 – Mean monthly water discharge (A) and mean daily water temperature (B) of
the Pic River during the study period.
42
The unusually warm and dry abiotic conditions observed in the spring of 2010
resulted in some Lake Sturgeon modifying their regular movement patterns and habitat
utilization within the Pic River. Manual telemetry within the Black River in 2008 and
2009 indicated that there was limited activity within this tributary, with all manual
telemetry detections occurring exclusively within the first 500 m of the Black River.
However in 2010, four Lake Sturgeon inhabited the Black River throughout late June and
early July for a period of two to four weeks as water temperatures peaked within the Pic
River. They occupied a deep hole that was roughly 750 m downriver from the mouth of
the Little Black River and had maximum depth of 16.2 m – a depth that exceeds the
maximum depth within the Pic River by two-fold. Four temperature and dissolved
oxygen (DO) depth profiles were taken at this deep hole within the Black River and
compared with the mean temperature and DO depth profiles taken from the four random
locations at the mouth of the Pic River and at the pools within the lower rapids. Results
from the lower rapids and the mouth of the Pic River indicated that there was no thermal
stratification at either of these locations, whereas within the Black River, the deeper pool
did establish thermal stratification (Figure 2.9).
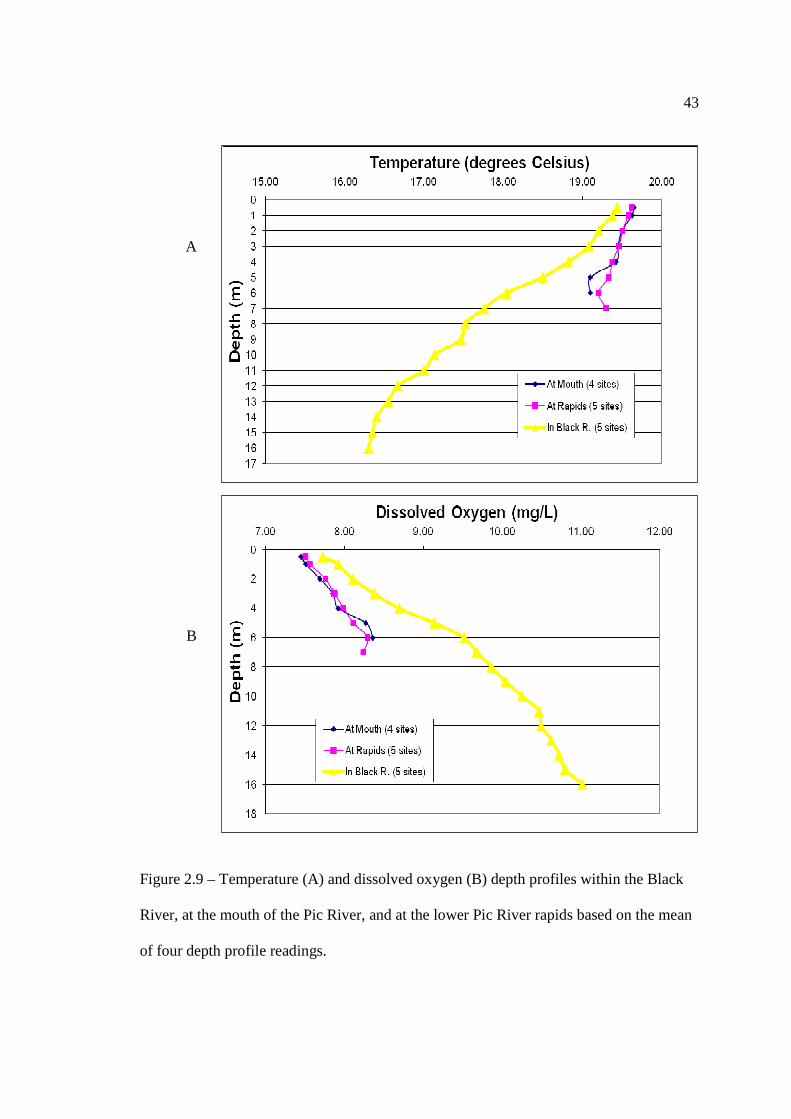
43
A
B
Figure 2.9 – Temperature (A) and dissolved oxygen (B) depth profiles within the Black
River, at the mouth of the Pic River, and at the lower Pic River rapids based on the mean
of four depth profile readings.
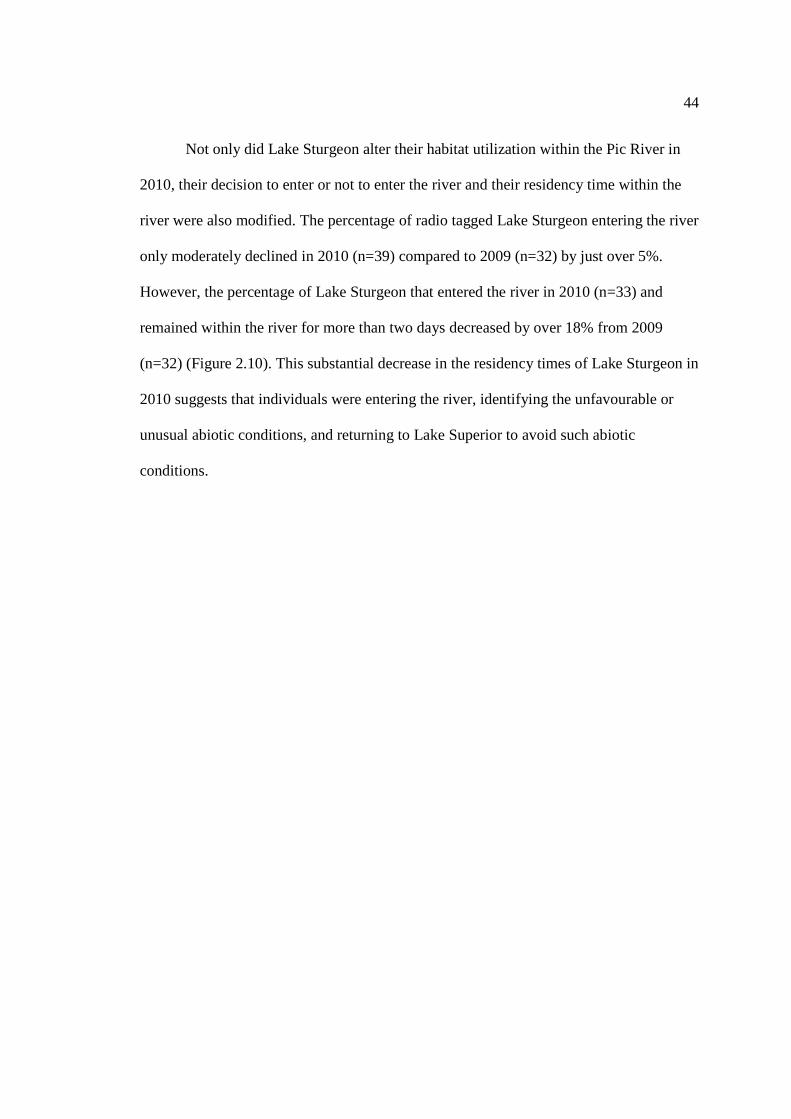
44
Not only did Lake Sturgeon alter their habitat utilization within the Pic River in
2010, their decision to enter or not to enter the river and their residency time within the
river were also modified. The percentage of radio tagged Lake Sturgeon entering the river
only moderately declined in 2010 (n=39) compared to 2009 (n=32) by just over 5%.
However, the percentage of Lake Sturgeon that entered the river in 2010 (n=33) and
remained within the river for more than two days decreased by over 18% from 2009
(n=32) (Figure 2.10). This substantial decrease in the residency times of Lake Sturgeon in
2010 suggests that individuals were entering the river, identifying the unfavourable or
unusual abiotic conditions, and returning to Lake Superior to avoid such abiotic
conditions.
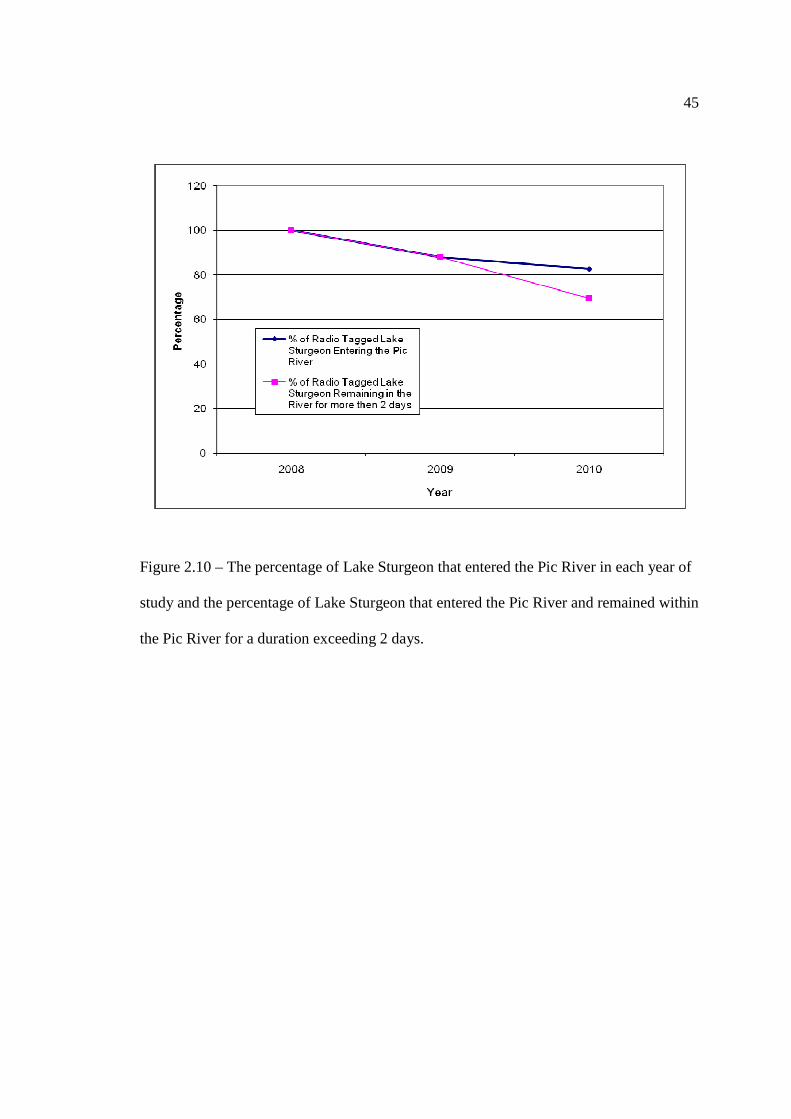
45
Figure 2.10 – The percentage of Lake Sturgeon that entered the Pic River in each year of
study and the percentage of Lake Sturgeon that entered the Pic River and remained within
the Pic River for a duration exceeding 2 days.

46
2.3.3 Timing of Migration:
Tagged Lake Sturgeon showed inter-annual differences in the timing of migration
(Figure 2.11). A one-way ANOVA found significant differences between each year of
study (2008, 2009, 2010) and the timing of Lake Sturgeon migration (entry, uppermost,
exit) (F(8, 148)=12.891, p<0.01). An earlier onset to spring in 2010 (see Section 2.3.2)
resulted in a much earlier entry into the river (117.4 Julian days or April 27th ±4.6 days),
an earlier uppermost distance (140.9 Julian days or May 20th ±5.09 days), and an earlier
exit from the river (203.1 Julian days or July 22nd ±7.83 days). On average, Lake
Sturgeon migration occurred roughly 50 days earlier in 2010 compared to the mean entry
date (168.5 Julian days or June 17th ±4.9 days), uppermost date (187.5 Julian days or July
6th ±6.0 days), and the exit date (275.6 Julian days or Oct 2nd ±6.4 days) of 2008 and
2009. Tukey post-hoc tests indicated that the timing of exit was significantly different
between each year of study, with the earliest times occurring in 2010 (Table 2.3C). As
well, Tukey post-hoc tests found that Lake Sturgeon entered the river and reached their
uppermost distance significantly earlier in 2010 compared to 2008 and 2009; however
there was no significant difference between 2008 and 2009 (Table 2.3A and Table 2.3B).
Finally, there was no significant inter-annual difference in the duration of time that Lake
Sturgeon were in the river (Table 2.3D); indicating that Lake Sturgeon shifted their
timing of migration, as opposed to their total amount of time spent within the river.
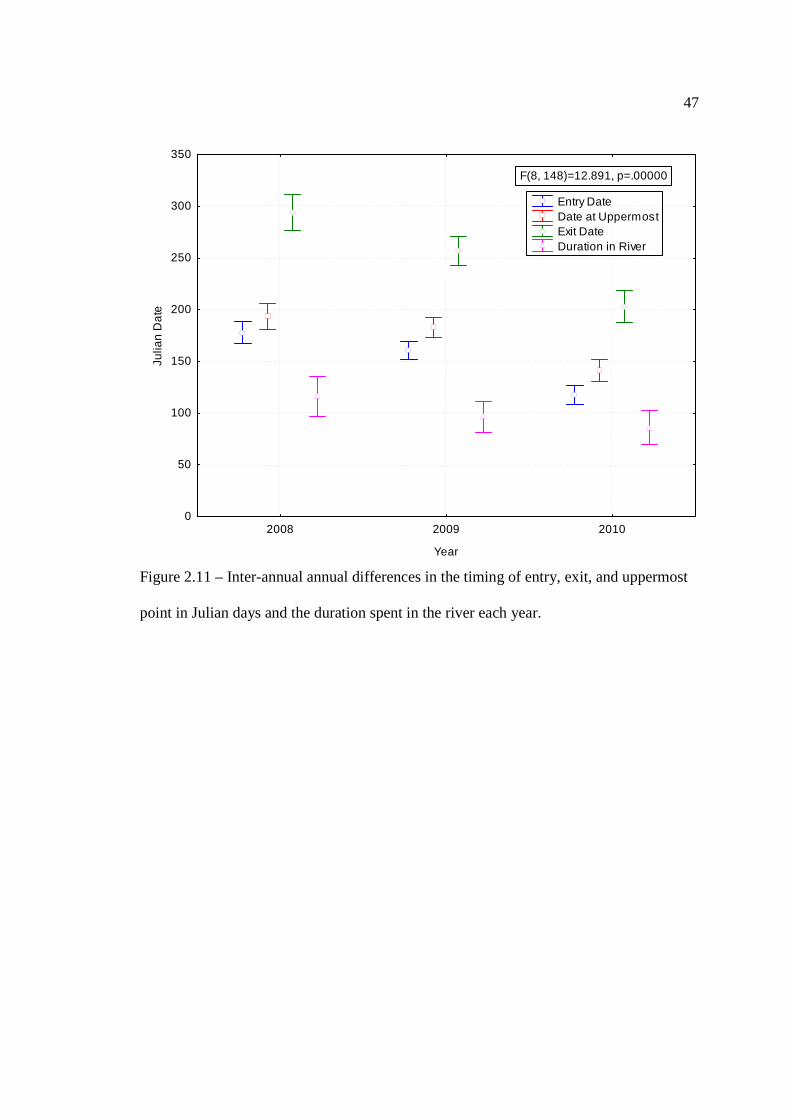
47
2008 2009 2010
Year
0
50
100
150
200
250
300
350Ju
lian
Da
te
F(8, 148)=12.891, p=.00000
Entry Date Date at Uppermost Exit Date Duration in River
Figure 2.11 – Inter-annual annual differences in the timing of entry, exit, and uppermost
point in Julian days and the duration spent in the river each year.
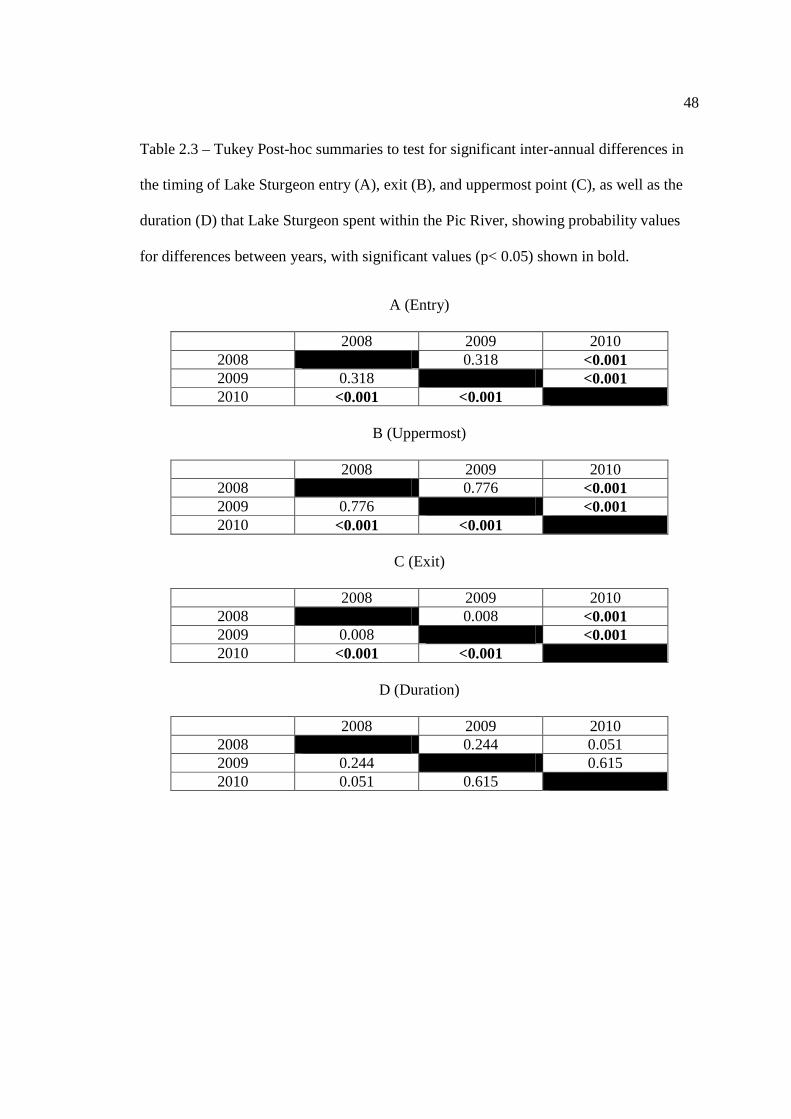
48
Table 2.3 – Tukey Post-hoc summaries to test for significant inter-annual differences in
the timing of Lake Sturgeon entry (A), exit (B), and uppermost point (C), as well as the
duration (D) that Lake Sturgeon spent within the Pic River, showing probability values
for differences between years, with significant values (p< 0.05) shown in bold.
A (Entry)
2008 2009 2010 2008 0.318 <0.001 2009 0.318 <0.001 2010 <0.001 <0.001
B (Uppermost)
2008 2009 2010
2008 0.776 <0.001 2009 0.776 <0.001 2010 <0.001 <0.001
C (Exit)
2008 2009 2010
2008 0.008 <0.001 2009 0.008 <0.001 2010 <0.001 <0.001
D (Duration)
2008 2009 2010
2008 0.244 0.051 2009 0.244 0.615 2010 0.051 0.615

49
A one-way ANOVA found no significant differences in the timing of migration
between spawning and non-spawning individuals (F(4,75)=1.86, p=0.126) (Figure 2.12).
However, these results were based on a low sample size of spawning individuals in each
year of study (2008 N=3; 2009 N=8; 2010 N=15). Despite there being no overall
differences in the movement patterns of spawning and non-spawning individuals,
spawning Lake Sturgeon did enter the river (122.3 Julian days or May 1 ±7.0 days)
significantly earlier compared to their non-spawning counterparts (154.8 Julian days or
June 3 ±2.7 days) (F(2, 77) = 41.20, p<0.001). Therefore it appears that spawning Lake
Sturgeon enter the river earlier, but otherwise, their movements are fairly similar to non-
spawning individuals.
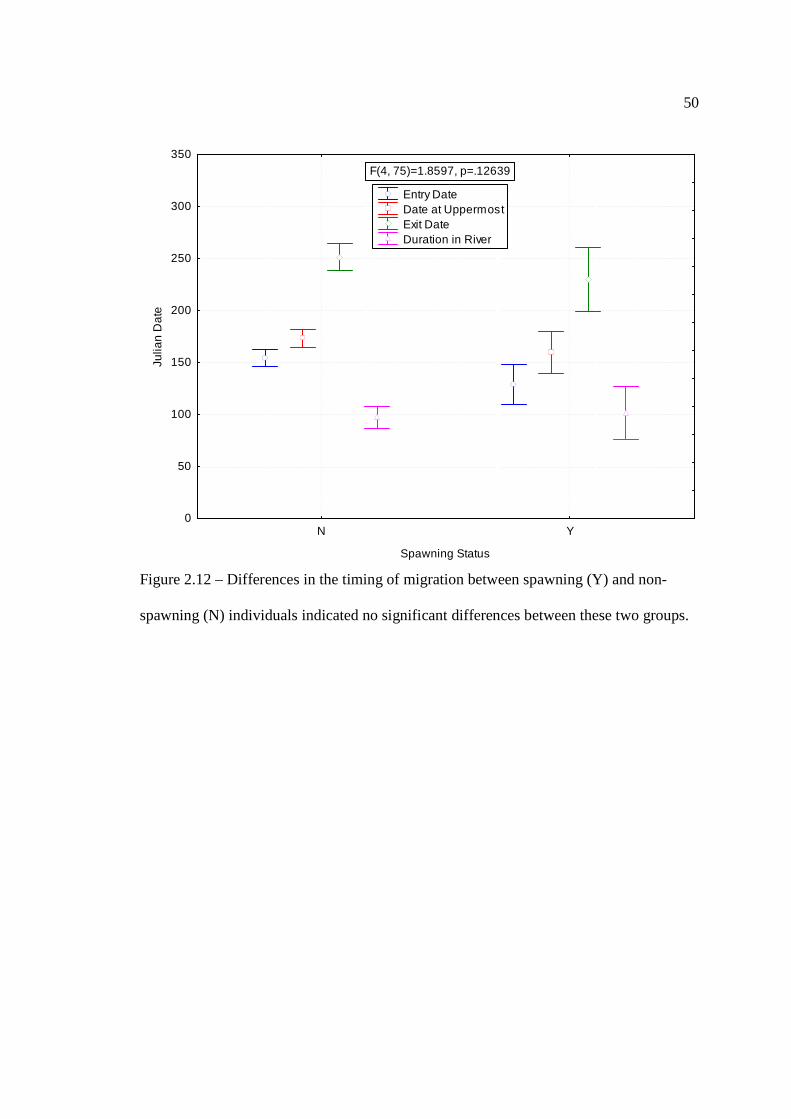
50
N Y
Spawning Status
0
50
100
150
200
250
300
350Ju
lian
Dat
e
Entry Date Date at Uppermost Exit Date Duration in River
F(4, 75)=1.8597, p=.12639
Figure 2.12 – Differences in the timing of migration between spawning (Y) and non-
spawning (N) individuals indicated no significant differences between these two groups.
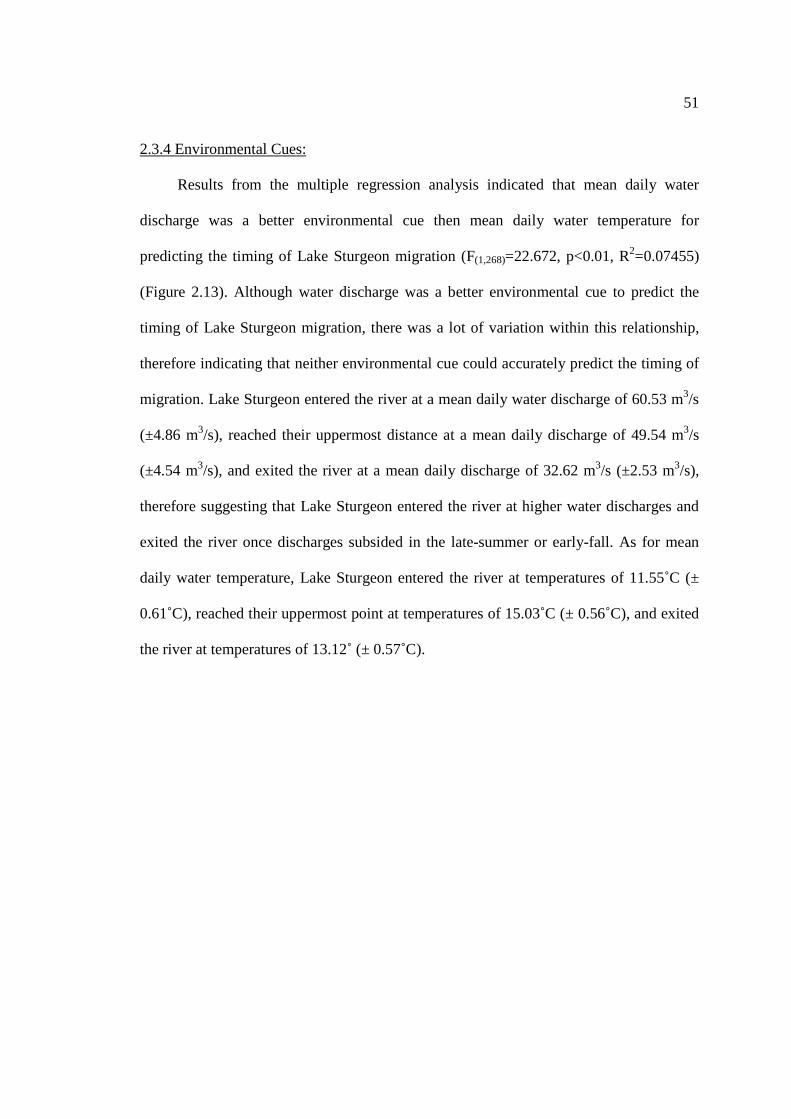
51
2.3.4 Environmental Cues:
Results from the multiple regression analysis indicated that mean daily water
discharge was a better environmental cue then mean daily water temperature for
predicting the timing of Lake Sturgeon migration (F(1,268)=22.672, p<0.01, R2=0.07455)
(Figure 2.13). Although water discharge was a better environmental cue to predict the
timing of Lake Sturgeon migration, there was a lot of variation within this relationship,
therefore indicating that neither environmental cue could accurately predict the timing of
migration. Lake Sturgeon entered the river at a mean daily water discharge of 60.53 m3/s
(±4.86 m3/s), reached their uppermost distance at a mean daily discharge of 49.54 m3/s
(±4.54 m3/s), and exited the river at a mean daily discharge of 32.62 m3/s (±2.53 m3/s),
therefore suggesting that Lake Sturgeon entered the river at higher water discharges and
exited the river once discharges subsided in the late-summer or early-fall. As for mean
daily water temperature, Lake Sturgeon entered the river at temperatures of 11.55˚C (±
0.61˚C), reached their uppermost point at temperatures of 15.03˚C (± 0.56˚C), and exited
the river at temperatures of 13.12˚ (± 0.57˚C).
52
Figure 2.13 – Mean water temperature and discharge when Lake Sturgeon entered,
reached their uppermost point of migration, and exited the river. Boxes are equal to the
mean, plus or minus one standard error unit, while the whiskers represent the 95% C.I.
Entry Uppermost Exit0
5
10
15
20
25
30W
ater
Tem
pera
ture
(de
gree
s C
elci
us)
0
25
50
75
100
125
150
Wat
er D
isch
arge
(m
^3/s
econ
d)
Temperature
Discharge
53
Although results from the multiple regression yielded no definitive environmental
cues to migration, it is still possible to ascertain environmental cues to migration by
plotting temperature and discharge with the immigration and emigration of Lake
Sturgeon (Figure 2.14a and Figure 2.14b). For water discharge, results indicated that
Lake Sturgeon entered the river shortly after flows peaked during the spring freshet. This
was even the case in 2010, when individuals entered following a peak in water discharge,
albeit a relatively small peak due to the dry conditions. Lake Sturgeon emigration from
the Pic River occurred later in the fall once basal flows were reached. Therefore, in
general, Lake Sturgeon entered and began their upriver migration shortly after peak flows
and began their downriver migration and exited the river once basal flows were reached
(Figure 2.14a). For water temperature, results indicated that Lake Sturgeon entered the
river when temperatures were less then 7ºC and began their upriver migration once
temperatures reached 9ºC, therefore suggesting that these temperatures induced upriver
migrations. This was also confirmed by manual telemetry in 2010, when three individuals
promptly retreated downriver when water temperatures decreased from 9.3ºC to 7.8ºC
overnight. In general, Lake Sturgeon entered the river and began their upriver migration
prior to peak thermal condition and began their downriver migration and exited the river
shortly after peak thermal conditions (Figure 2.14b). Therefore, it appears that Lake
Sturgeon are responding to trends in environmental conditions, as opposed to distinct and
narrow ranges of environmental conditions.

54
A
B
Figure 2.14 – Trends in mean daily discharge (m3/second) (A) and mean daily water
temperature (˚C) (B) as they related to the immigration and emigration of Lake Sturgeon
in 2008, 2009, and 2010.

55
Ice cover was the only environmental variable that correlated with the timing of
migration, whereby the ice free date of the river correlated with the mean entry date of
Lake Sturgeon in each year of study (R2=0.8879) (Figure 2.15). According to these
results, Lake Sturgeon entered the river 47 days, 43 days, and 36 days after it became ice
free in 2008, 2009, and 2010, respectively, for a mean entry of 42 days post ice-free
conditions. This relationship is only based on three data points; however the strong
relationship suggests that ice cover, and the disappearance of ice, may be the best
environmental cue to predicting the timing of Lake Sturgeon movements into the Pic
River.
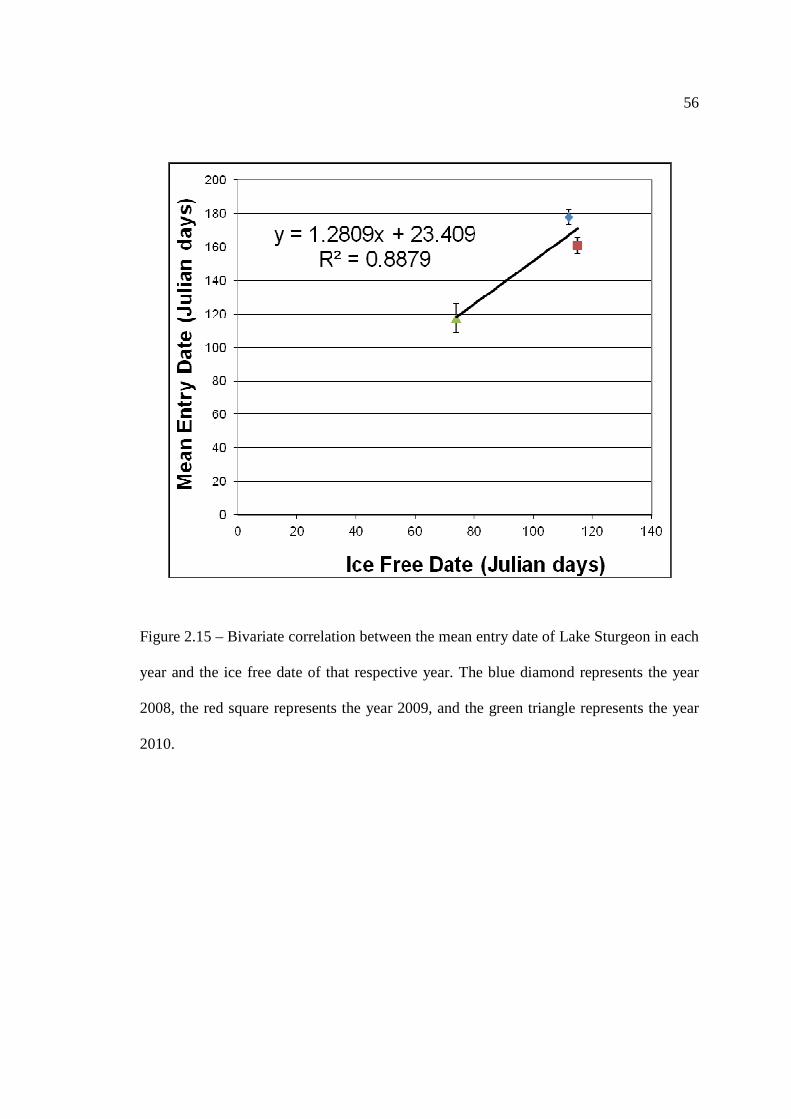
56
Figure 2.15 – Bivariate correlation between the mean entry date of Lake Sturgeon in each
year and the ice free date of that respective year. The blue diamond represents the year
2008, the red square represents the year 2009, and the green triangle represents the year
2010.
57
2.4 DISCUSSION
The objectives of this study were three fold. The first objective was to determine
if inter-annual differences in the patterns or timing of Lake Sturgeon migration existed
when unusual abiotic conditions occurred. These predicted differences were indeed
observed, with individuals entering, reaching their uppermost point, and exiting the river
significantly earlier in 2010 compared to the previous two years (2008 and 2009). The
earlier timing of migration in 2010 coincided with unusually warm and dry abiotic
conditions, which resulted in virtually no spring freshet, earlier disappearance of ice,
fewer ice covered days, and higher rates of temperature increase. To offset these
conditions, Lake Sturgeon utilized novel deep-pool habitat within the Black River and
fewer foraging individuals remained within the river system for an extended period of
time (> 2 days). Therefore it appears that Lake Sturgeon modified their habitat utilization
in 2010 by occupying habitats that would provide them with a cool water refuge from the
elevated water temperatures in the Pic River.
The second objective of this study was to determine if there were differences in
the patterns or timing of migration between spawning and non-spawning individuals.
Consistent with hypothesis two of this study, spawning individuals did enter the river
significantly earlier compare to non-spawning individuals. Furthermore, analysis of the
manual radio telemetry results indicated that spawning individuals migrated further
upriver, had greater daily movement rates during their upriver and downriver migration,
and remained at the mouth of the river for a shorter period of time throughout the
spring/summer before returning to Lake Superior.
58
The third objective of this study was to determine whether environmental cues
such as water temperature, water flow, and ice cover were responsible for stimulating
Lake Sturgeon migration between Lake Superior and the Pic River. Ice cover, and the
disappearance of ice, was the best indicator to determine when Lake Sturgeon would
enter the Pic River from Lake Superior in the spring. This environmental cue to migration
was also identified by elders of Pic River First Nation, who suggested that Lake Sturgeon
entered the river shortly after the disappearance of ice (Couchie, 2009). Water discharge,
and not temperature, was a better environmental variable for predicting the timing of
migration. However less than 10% of the variation was explained in this relationship,
indicating that neither variable accurately predicted the timing of migration. Therefore
Lake Sturgeon movements did not appear to be stimulated by specific abiotic conditions,
but rather by trends in abiotic conditions. Lake Sturgeon were stimulated to enter the
river shortly after the peak of the spring freshet and as temperatures increased to
approximately 9ºC. While their exit from the river occurred once water flows subside to
base levels and temperatures exceeded 20ºC.
2.4.1: Migration Patterns
The migration patterns of Lake Sturgeon varied quite substantially from one
system to another and especially between natural and modified systems. One consistent
finding, regardless of the system, is that Lake Sturgeon express strong site fidelity for
specific pool mesohabitats within riverine systems. In the Grasse River, 60% of all
manual telemetry detections occurred within three areas over a 22-month period (Trested,
2010). In the Mississippi River, 50% of all manual telemetry detections occurred within
one area over an 18-month period (Knight et al., 2002). In a natural reach of the Ottawa

59
River, Lake Sturgeon had a tendency to remain within one basin, and although they may
have left periodically, they always returned to the same basin (Haxton, 2003b). Finally, in
the Kettle River, 80% of all manual telemetry detections occurred within a 1 km portion
of the lower river over a 23-month study period (Borkholder et al., 2002). These locations
have been identified as core areas (Knights et al., 2002) or activity centers (Borkholder et
al., 2002) that Lake Sturgeon depend upon for foraging and/or spawning purposes. In this
study, 46% of all manual telemetry recordings occurred within the 16.1 km to 25 km
portion of the river, and more specifically, within four slow flowing pools in the lower
rapids.
This study also found strong site fidelity for the mouth of the Pic River, with 22%
of manual telemetry detections occurring within the lower 5 km of the river and over
350,000 detections from the respective base station. This finding is consistent with other
findings in unfragmented lake-river systems, including the Rainy River, the Jackfish
River, and the Grasse River systems (Rusak & Mosindy, 1997; Kim Tremblay, personal
communication; Trested, 2010; respectively). In the Grasse River, three Lake Sturgeon
were radio tagged in the lower portion of the river and 72% of all their manual telemetry
detections thereafter came within the same lower section of the river, indicating that Lake
Sturgeon at the mouth of the Grasse River undertook few movements throughout the
summer and fall seasons of the year (Trested, 2010). Within a Lake Superior river
system, Auer et al. (1999) found that post-spawning Lake Sturgeon remained at the
mouth of the Sturgeon River for a period of 3 to 53 days before dispersing into Portage
Lake or Lake Superior in late August.
60
Beyond the mouth of the river and the pools throughout the lower rapids, Lake
Sturgeon also showed fidelity for Henry’s Honey Hole, which is located 98 km upriver
from Lake Superior (King, 2010; Bill Gardner, personal communication). Pre- and post-
spawning Lake Sturgeon would congregate in large numbers within this staging pool,
presumably to synchronize spawning times amongst individuals and to descend the river
post-spawning (Auer, 1996; Bruch & Binkowski, 2002; Daugherty, 2006; Daugherty et
al., 2008a). Unlike some systems, where non-spawning individuals mimic spawning
individuals at these staging locations (Friday, 2004; 2005b; Lallaman et al., 2008; Tim
Haxton, personal communication), this did not seem to be the case in the Pic River.
Beyond the 50 km mark of the river, captured Lake Sturgeon tended to be ripe unless
they were caught prior to the estimated spawning time (see Section 3.3.3). This may be
the case in the Pic River since it is a relatively long tributary with suitable foraging
habitat that is close to Lake Superior. Under such conditions, it appears that non-
spawning Lake Sturgeon tended to exploit near-lake foraging locations that were
energetically profitable (i.e. Lower Rapids instead of Henry’s Honey Hole).
Although not statistically tested, differences in the movement rates also existed
between spawning and non-spawning Lake Sturgeon, with spawning individuals
ascending the entire river within 10 days of entering (~10 km/day) and foraging
individuals meandering with minimal displacement distances. This is quite common
amongst other populations of Lake Sturgeon. In the Grasse River, upriver migration rates
of spawning individuals moved between 4.3 km/day and 16.1 km/day, while their non-
spawning counterparts were between 0.82 km/day and 1.22 km/day (Trested, 2010). In
the Rainy River, foraging and spawning individuals had a two-fold increase in movement

61
rates during the spring and summer compared to the fall and winter (Rusak and Mosindy,
1997). Similar observations can be seen in other sturgeon species, including the Gulf
Sturgeon, whereby spawning individuals entered tributaries earlier and travelled greater
distances in shorter time periods compared to non-spawning Gulf Sturgeon (Fox et al.,
2002). The current study was not able to accurately detect small changes in the daily
movements of Lake Sturgeon given the size and relative inaccessibility of the river.
However, despite these limitations, it was quite apparent that spawning individuals
migrated further and had greater migration rates compared to their non-spawning
counterparts. This finding was particularly true during the late-spring for the Pic River.
This study also found that Pic River Lake Sturgeon are not a resident population,
meaning that they return to Lake Superior in the fall to overwinter. There are examples of
similar and alternate residency strategies in the literature. In the Sturgeon River, Lake
Sturgeon dispersed into Lake Superior in late August and were found up to 280 km away
(Auer et al., 1999). In the Grasse River, non-spawning Lake Sturgeon returned to either
Lake St. Francis or the St. Lawrence River for the spring and summer, whereas spawning
individuals remained within the river for the spring and the previous winter to increase
energy reserves and to reach the spawning site as early as possible (Trested, 2010). This
finding was also reported in the Rainy River system, where spawning Lake Sturgeon
overwintered and spent the spring in the river and non-spawning individuals left the river
during the spring but returned in the fall to overwinter (Rusak & Mosindy, 1997). Friday
(2004) found a non-resident population of Lake Sturgeon within the Black River, but
within a relatively close tributary (i.e. Kaministiquai River), Lake Sturgeon formed a
resident population (Friday 2005b). Resident populations are also very common in
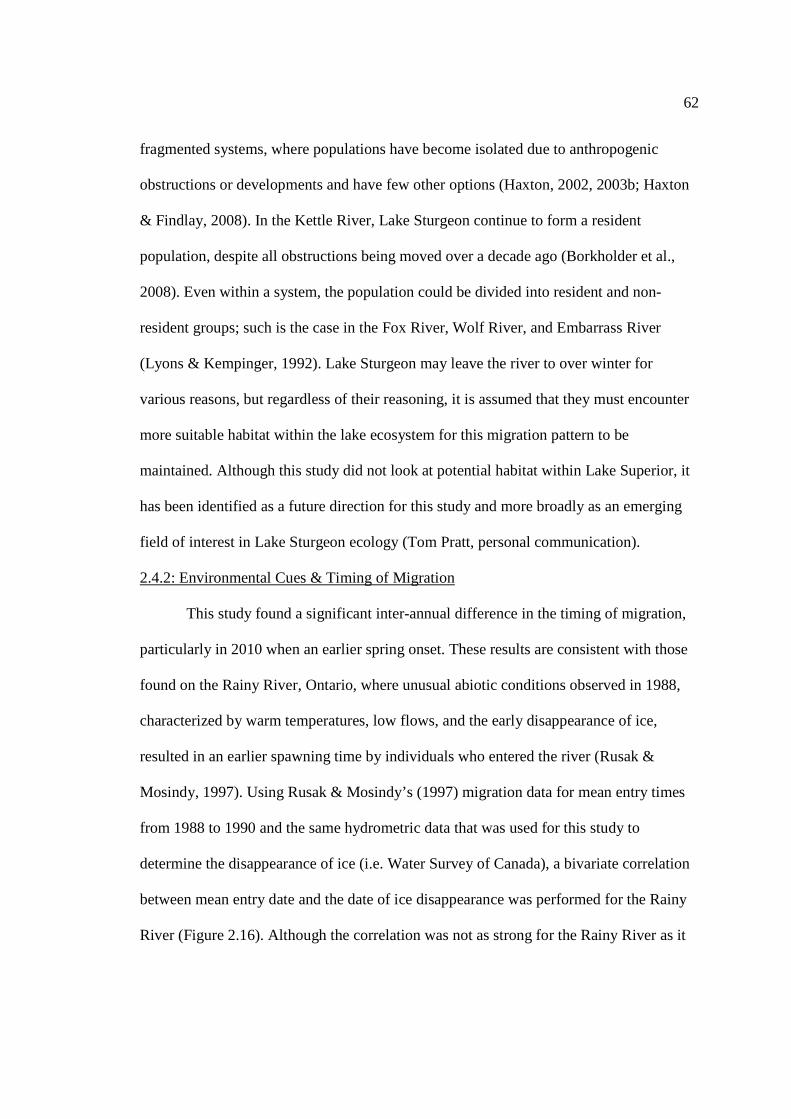
62
fragmented systems, where populations have become isolated due to anthropogenic
obstructions or developments and have few other options (Haxton, 2002, 2003b; Haxton
& Findlay, 2008). In the Kettle River, Lake Sturgeon continue to form a resident
population, despite all obstructions being moved over a decade ago (Borkholder et al.,
2008). Even within a system, the population could be divided into resident and non-
resident groups; such is the case in the Fox River, Wolf River, and Embarrass River
(Lyons & Kempinger, 1992). Lake Sturgeon may leave the river to over winter for
various reasons, but regardless of their reasoning, it is assumed that they must encounter
more suitable habitat within the lake ecosystem for this migration pattern to be
maintained. Although this study did not look at potential habitat within Lake Superior, it
has been identified as a future direction for this study and more broadly as an emerging
field of interest in Lake Sturgeon ecology (Tom Pratt, personal communication).
2.4.2: Environmental Cues & Timing of Migration
This study found a significant inter-annual difference in the timing of migration,
particularly in 2010 when an earlier spring onset. These results are consistent with those
found on the Rainy River, Ontario, where unusual abiotic conditions observed in 1988,
characterized by warm temperatures, low flows, and the early disappearance of ice,
resulted in an earlier spawning time by individuals who entered the river (Rusak &
Mosindy, 1997). Using Rusak & Mosindy’s (1997) migration data for mean entry times
from 1988 to 1990 and the same hydrometric data that was used for this study to
determine the disappearance of ice (i.e. Water Survey of Canada), a bivariate correlation
between mean entry date and the date of ice disappearance was performed for the Rainy
River (Figure 2.16). Although the correlation was not as strong for the Rainy River as it

63
was for the Pic River (R2RAINY = 0.57 versus R2PIC = 0.89), there is still strong evidence
within both systems to support the hypothesis that spring movements are strongly
influenced by ice conditions. Bruch & Binkowski (2002), reiterated this finding through
angling records and electrofishing surveys in the Winnebago system. Annual angling
records show in increase in the accidental by-catch of Lake Sturgeon and a large number
of gravid males and females at the spawning site shortly after ice-out in late-March
(Bruch & Binkowski, 2002). Although the current study did not look at ice out as it
relates to spawning times, it did find strong evidence relating ice-out to entry times,
which could then be used to estimate spawning times given the movement rates of
spawning Lake Sturgeon.
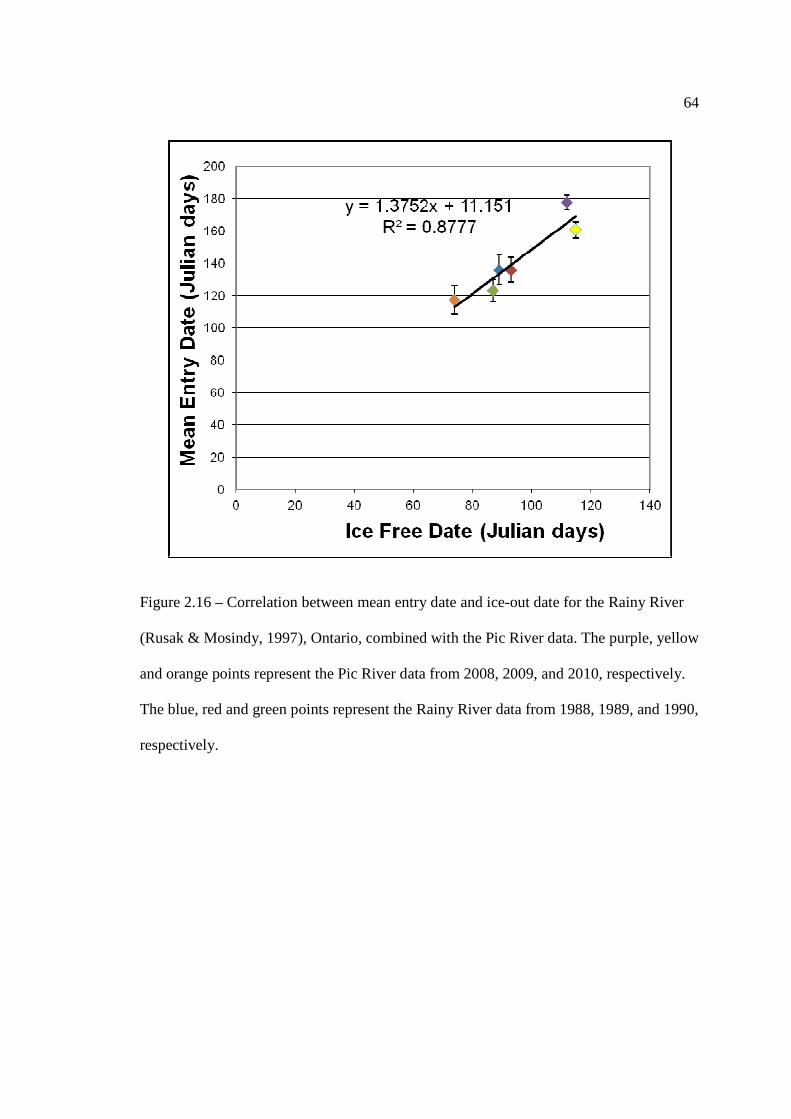
64
Figure 2.16 – Correlation between mean entry date and ice-out date for the Rainy River
(Rusak & Mosindy, 1997), Ontario, combined with the Pic River data. The purple, yellow
and orange points represent the Pic River data from 2008, 2009, and 2010, respectively.
The blue, red and green points represent the Rainy River data from 1988, 1989, and 1990,
respectively.
65
Unlike most studies that have found a significant relationship between either
water temperature or flow and Lake Sturgeon movements, this study did not. In the Kettle
River movements were strongly correlated with water discharge and mildly correlated
with temperature; however, this is a resident Lake Sturgeon population that does not
experience two environmental mediums (i.e. river and lake conditions) (Borkholder et al.,
2002). In the Rainy River, Lake Sturgeon that overwintered in the river were stimulated
to migrate from the river into Lake of the Woods by increases in both temperature and
flow, whereas their return movements from the lake to the river always coincided with
thermal maximas in the Rainy River (Rusak & Mosindy, 1997). In Lake Winnebago,
long-term movement records are correlated with temperature, whereby Lake Sturgeon
moved onto and off of the spawning site at temperatures between 6ºC and 16ºC and at
15ºC to 21.1ºC, respectively (Bruch & Binkowski, 2002). The results of this study
indicated no overall relationship between Lake Sturgeon movements into or out of the
river and temperature or flow. It is possible that no relationship was found because this
study focused on both the spawning and non-spawning portion of the population. Given
that these two groups are utilizing the river for different purposes, it is likely that these
groups are responding to different abiotic cues and therefore no statistical relationship
can be established (Bruch & Binkowski, 2002; Auer, 2003; Peterson et al., 2007). Despite
not being able to find statistical relationships between the movements of Lake Sturgeon
and environmental variables, it was possible to decipher environmental cues from trends
in water temperature and flow relative to the distance of Lake Sturgeon from Lake
Superior. A similar approach and result was found by Friday (2005 and 2006), whereby

66
movement onto the spawning site and spawning itself occurred eight days prior to peaks
in water flow.
Perhaps even more interesting than determining the specific environmental cues
that induce movements, and certainly more conclusive, are the results related to Lake
Sturgeon modifying their habitat utilization and timing of migration in the face of
unusually warm abiotic conditions. Shifts in the timing and patterns of migration have
become an important field of research for migrating species of ichthyo and avian fauna,
especially given the threats of climate change (Quinn & Adams, 1996; Sims et al., 2004;
Hodgson et al., 2006; Ydenberg et al., 2005). In this study, Lake Sturgeon shifted their
migrations by roughly 50 days earlier and utilized novel habitats within the system to
mitigate the extremely warm conditions within the Pic River throughout the summer of
2010. These results are most likely related to the finding by McKinley (1998), which
found that Lake Sturgeon significantly reduce their movements during the thermal
maxima to reduce metabolic stress on the body. The initial perception of these results
may be viewed as positive, since Lake Sturgeon seem to be able to offset drastic
increases in temperature that may be foreseeable under some climate change predictions.
However it is important to understand the implications of this modified behaviour to truly
understand what the long term impacts of these changes may be (Nilo et al., 1997).
Adams (2004) and Adams et al. (2006) found that Lake Sturgeon year class strength and
water levels were positively correlated for Rainy Lake in Minnesota and Ontario. Also,
unlike warm water fish species, Lake Sturgeon body condition and size is negatively
correlated with air temperature (Fortin et al., 1996) and a latitudinal counter gradient in
the thermal opportunity for growth exists, meaning that the potential for growth decreases

67
once temperatures exceed a thermal threshold (Power & McKinley, 1997). Furthermore,
with reduced water levels, parts of the river may become unnavigable or portions of the
spawning habitat may rise above the water level, making them completely unusable for
spawning – such may have been the case at Kagiano Falls in 2010. Therefore, the results
presented here should not be considered as evidence that Lake Sturgeon are resilient to
climate change, but rather that they can offset exceedingly high thermal conditions for
short periods of time, potentially at the cost of their long term fitness.
2.4.3: General Conclusions
Consistent with the findings of other studies on Lake Sturgeon movement patterns
(Lyons & Kempinger, 1992; Auer 1996; Rusak & Mosindy, 1997; Borkholder et al.,
2002; Fox et al., 2002; Knight et al., 2002; Haxton, 2003b; Friday, 2005a, 2005b;
Trested, 2010), adult Lake Sturgeon showed strong site fidelity on an annual basis for
three deep-pool habitats in the Pic River. Lake Sturgeon movements were stimulated by
ice cover and the disappearance of ice in the Pic River, especially movements by non-
spawning individuals. Although the relationship between ice-out and the onset of
migration has not been as defined as the relationship between water temperature or flow
and migration, there is some primary and anecdotal evidence of this relationship
suggesting that it should be investigated further (Stone &Vincent, 1900; Rusak &
Mosindy, 1997; Bruch & Binkowski, 2002; Couchie, 2009).
The identification and protection of critical Lake Sturgeon habitat is, at least
contemporarily, the highest priority for conservation efforts and for the long-term
sustainability of this endemic species (Harkness & Dymond, 1961; Hay-Chmielewski &
Whelan, 1997; Holey et al., 2000; Auer, 2003). This chapter of the study was able to

68
identify critical habitat that was used on a seasonal and annual basis, assess the
environmental cues that stimulated the onset of migration, and monitored the changes in
movement patterns that were induced by drought-like abiotic conditions. Daily
movement rates, home range sizes, and diurnal variations in movement patterns were not
able to be assessed in this study because of the river’s size and relative inaccessibility.
More base stations (1 base station per 10 km of river) and a greater amount of manual
telemetry effort (2 sweeps of the river per day) would have to be considered to accurately
measure the aforementioned variables. Nevertheless, this study should aid fisheries
biologists within this region, and more broadly within Ontario, to develop and implement
policies that not only protect Lake Sturgeon spawning habitat, but also the deep pool
habitats that are frequently utilized on a seasonal and annual basis.

69
Chapter 3: Validation of a Lake Sturgeon Habitat Suitability Model for Spawning
3.1 INTRODUCTION
Habitat suitability models (HSMs) are an important tool in fisheries management
that enable the quantitative assessment of geographical data and have been used for a
wide range of applications (Fisher & Toepfer, 1998; Fisher & Rahel, 2004; Zorn et al.,
2011). HSMs typically incorporate spatially referenced habitat information about
physical features with temporal changes in abiotic or chemical conditions to predict what
habitat will be most suitable for a given species (O’Neil et al., 1988; Rubec et al., 1999;
Valavanis et al., 2008). On the St. Marys River, HSMs have been used to retroactively
assess the impacts of developments on fish stocks over time (Bray, 1996). In contrast, on
the Yangtze River, they have been used to forecast the potential impacts of the Three
Gorges and Gezhouba Dams on Chinese Sturgeon (Acipenser sinensis) and Common
Carp (Cyprinus carpio) (Chen & Wu, 2011; Yi et al., 2010; respectively). Their
applications are not limited to only predicting habitat suitability, as they have also been
used to estimate fish abundance (Toepfer et al., 2000) and to assess the recovery potential
of a species within a river (Daugherty et al., 2006). Although HSMs are widely used and
critical decisions are based upon them, few of these models have ever been validated
(Ortigosa et al., 2000; Morris & Ball, 2006; Vinagre et al., 2006) and therefore their
predictive ability or transferability may be weak and/or unreliable (Burgman et al., 2001;
Olden et al., 2002).
In theory, these models should be able to accurately predict habitat suitability
since they are based on pre-existing studies, but these predictions are frequently

70
contested. A long-standing deficiency of HSMs is their inability to incorporate biological
features such as stream ecology, population dynamics, energetics, predation, and
competition, which influence both population abundance and distribution (Orth, 1987).
Cianfrani et al. (2010) advocated for the use of an iterative HSM for non-equilibrium
species such as species at risk or invasive species, after finding that over 50% of HSMs
for the threatened Eurasian otter (Lutra lutra) provided unreliable recolonization
predictions. Other common criticisms of HSMs are that they lack variability in the input
variables, they use inappropriate spatial scales, and do not sample over long enough
temporal periods (Brooks, 1997; Roloff & Kernohan, 1999). Despite these limitations,
the temptation to use them remains high because they can be easily applied and produce
seemingly powerful results that are spatially referenced and relative to a target species.
For Lake Sturgeon (Acipenser fulvescens), Threader et al. (1998) developed a
HSM to predict the suitability of foraging and spawning habitat based on substrate, depth,
temperature, and flow. The foraging component of this HSM has been independently
validated on the Ottawa River by comparing CPUE of adult and juveniles at locations
with high and low foraging suitability (Haxton et al., 2008). Although the variation in
CPUE was significant between high and low foraging suitability areas, the predictions of
the model was low (Haxton et al., 2008). The spawning component of the HSM has not
been independently validated, despite it being used to influence management decisions
and restoration efforts (Daugherty, 2006; Daugherty, 2007; 2008a; 2008b). This
component of the HSM evaluates the overall suitability of a potential spawning site based
on substrate and depth, and the daily suitability of a potential spawning site by
incorporating temperature and flow into its predictions (Threader et al., 1998). In this

71
study, the spawning component of the HSM will be independently validated by
comparing the model’s predictions with empirical observations of spawning behaviour.
Lake Sturgeon typically spawn at the uppermost impassable barrier immediately
below a water chute or within the rapids of a natural or artificial waterfall (Auer, 1996;
Seylor, 1997a; Threader et al., 1998; Bruch & Binkowski, 2002; Peterson et al., 2007;
Ontario Ministry of Natural Resources, 2009), although spawning can also occur within
the lower portions of rivers or on lake shorelines (Harkness & Dymond, 1961; Carlson,
1995). Bruch & Binkowski (2002) found that spawning sites in the Winnebago system
were close to deep overwintering pools (<2 km), had an extensive amount of spawning
substrate (>700 m2) that was comprised of clean rock, limestone, or granite with clean
interstitial spaces, and high flows for cleaning of rocks and aerating eggs. Several other
studies report Lake Sturgeon spawning at depths of 0.1 m to 2.0 m over gravel or cobble
substrate, and at water velocities that range from 15 cm/s to 70 cm/s (Priegel and Wirth,
1974; LaHaye et al., 1992; McKinley et al., 1998; Auer & Baker, 2002). Spawning
temperatures can also vary quite substantially. A long-term study in the Wolf River found
evidence of spawning at temperatures between 8.3ºC and 23.3ºC (Kempinger, 1988) and
up to 21.5ºC in the L’Assomption River (LaHaye et al., 1992). Most spawning, however,
is observed between 13ºC to 18ºC (Scott & Crossman, 1973; Bruch & Binkowski, 2002;
Peterson et al., 2007). Spawning typically occurs over a very short period, lasting only a
matter of a few hours (Auer & Baker, 2002), and is associated with a polyandrous mating
system, whereby two to five males will swim beside a female and fertilize her eggs as
they are being expelled (Bruch & Binkowski, 2002, Peterson et al., 2007; Ontario
Ministry of Natural Resources, 2009). These characteristics of Lake Sturgeon spawning
72
habitat and behaviour were used to develop the habitat suitability index values for
substrate, depth, temperature, and flow, which are applied to calculate the overall and
daily suitability of potential spawning sites (Threader et al., 1998).
There are three objectives for this chapter and two hypotheses that are derived
from postulates of the HSM (Threader et al., 1998). The first objective is to model the
overall suitability of spawning habitat based on substrate composition and depth at three
potential spawning sites (i.e. the Lower Rapids, Manitou Falls, and Kagiano Falls). The
second objective will build onto this model by predicting the spawning times of Lake
Sturgeon based on mean daily water temperature. Finally the model’s predictions will be
compared with empirical observations of spawning to ground truth its results and
evaluate its predictive ability. The first hypothesis of the HSM is that Lake Sturgeon
should spawn at locations that increase their likelihood of success and therefore have
higher suitability indices (Threader et al., 1998). If this is the case, then there should be a
higher CPUE of ripe adults, eggs, and larvae at locations with greater proportions of
highly suited habitat relative to poorly suited habitat. The HSM also hypothesizes that
peak spawning times should occur when water temperatures are optimal, between 12ºC
and 16ºC because this is when temperature suitability is at its highest level (Threader et
al., 1998). If the HSM’s daily predictions for optimal spawning times are valid, then
empirical evidence of spawning, such as eggs, larvae, and the movement of ripe adults
onto the spawning habitat, should coincide with peaks in the spawning suitability of that
respective site.

73
3.2 METHODS
3.2.1 Habitat Variables:
Substrate Composition
Substrate composition analysis was performed between the days of May 26th,
2010 and May 30th, 2010 using a Dual-frequency Identification Sonar (DIDSON)
(DIDSON 300m, Sound Metrics, Chesapeake, VA., USA). The DIDSON was operated
from an anchored boat at a known UTM coordinate and was held over the side of the boat
at a downward angle of 1° to 7° depending on water depth. Once in the water, the
DIDSON began recording as it was slowly rotated 360° to digitally record the substrate
in the 30 m diameter circle surrounding the boat. The DIDSON’s built in compass
simultaneously recorded the direction of the DIDSON footage in degrees.
Using the DIDSON™ Software (V.5) (Sound Metrics, Chesapeake, VA., USA), a
grid with 1 m intervals was overlaid onto the footage to determine the distance of the
substrate relative to the boat. Substrate type, by proportion, was classified at the intersect
of every 8° interval (starting at 4°) (i.e. 4°, 12°, 20° … 340°, 348°, 356°) and every 2.5 m
away from the boat (starting at 5m) (i.e. 5 m, 7.5 m, 10 m, 12.5 m, 15 m). Therefore, for
each site that the boat was anchored at, a total of 225 habitat points were classified and a
total area of 706 m2 was observed. At each point, the proportion of clay, silt, sand, gravel,
cobble, boulder, bedrock, or other (i.e. woody debris) was estimated. Clay, silt, and sand
substrates were classified based on their coloration, reflectivity, and amount of
backscatter (bright white and no shadows = clay; darker shades and grainy shadows =
sand). Whereas gravel, cobble, boulder, bedrock, and other materials were classified

74
using the measuring tool within the DIDSON software and by criteria in Threader et al.
(1998) (Table 3.1).
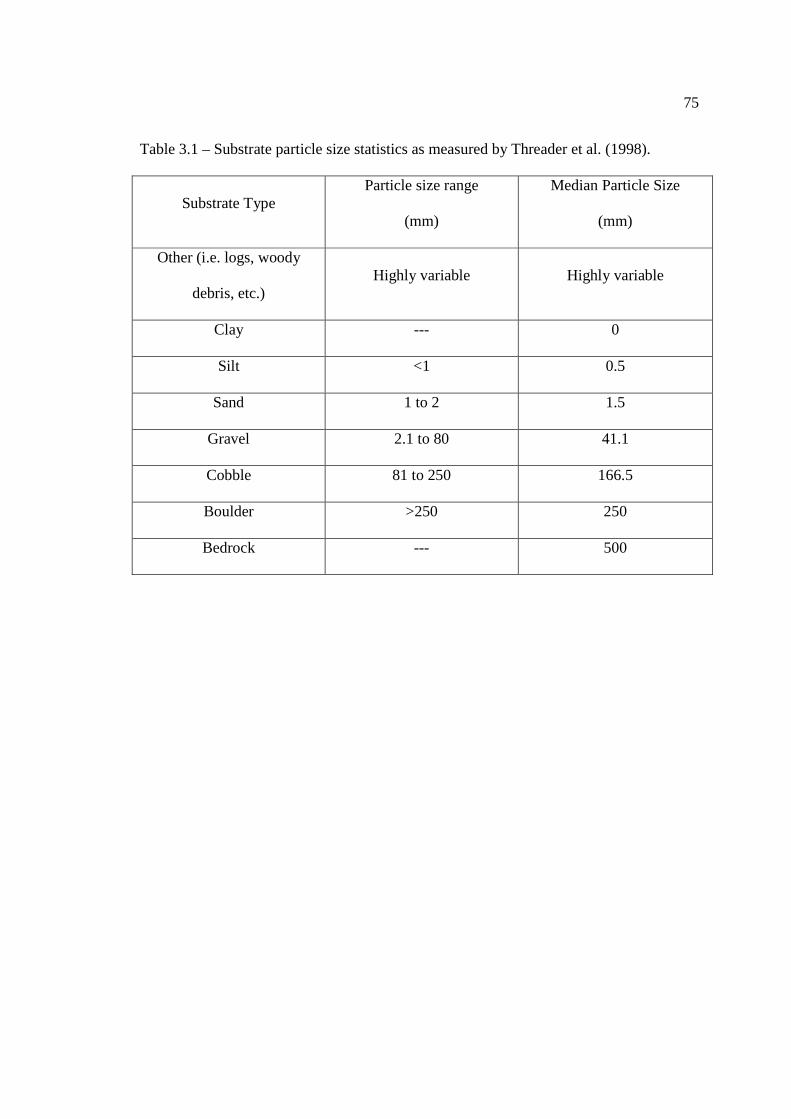
75
Table 3.1 – Substrate particle size statistics as measured by Threader et al. (1998).
Substrate Type Particle size range
(mm)
Median Particle Size
(mm)
Other (i.e. logs, woody
debris, etc.) Highly variable Highly variable
Clay --- 0
Silt <1 0.5
Sand 1 to 2 1.5
Gravel 2.1 to 80 41.1
Cobble 81 to 250 166.5
Boulder >250 250
Bedrock --- 500
76
The UTM coordinates of each habitat point were calculated using the cosine
(Easting) and sine (Northing) of the footage direction (º), multiplied by the distance (m)
of the habitat point from the boat. This value was then added to the known UTM
coordinate of the boat to produce new coordinates that georeferenced each habitat point.
A total of 55 boat sites, 12,375 habitat points, and 38830 m2 was observed along the three
potential spawning sites, including; the Lower Rapids (n= 23 boat sites; n= 5,175 habitat
points, A= 16,238 m2), Manitou Falls (n= 22 boat sites; n= 4,950 habitat points, A=
15,532 m2), and the lower Kagiano River (n= 10 boat sites; n= 2,250 habitat points, A=
7,060 m2).
Georeferenced substrate point data were then downloaded to ArcMap 9.1 (ESRI
(Environmental Systems Research Institute), Redlands, California) to create a point shape
file for each substrate type, whereby each point represented the proportion of that
particular substrate. Point data were then interpolated using inverse distance weighting
(Bolstad, 2002) with a variable search radius to the nearest four points, a power of 0.5,
and a cell size of 25 m2. The rasters were then masked to remove portions of the raster
that existed outside of the river polygon boundary (Tools; Spatial Analyst; Extraction;
Extract by Mask). Therefore at each potential spawning site, there was a substrate raster
for each substrate type with a value ranging from 0 to 1.
Depth
Bathymetry maps were created for the Lower Rapids, Manitou Falls, and the
lower Kagiano River using a bathymetric automated surveying system (BASS) and a
Garmin 421s sonar unit. Data from each location were collected from July to August
2009 and in June of 2010. Georeferenced depth data were added to ArcMap 9.1 [(ESRI
77
(Environmental Systems Research Institute), Redlands, California)] to generate a point
shape file. Depth data were then interpolated using Topogrid to generate a bathymetry
raster for Manitou Falls, Kagiano Falls, and the Lower Rapids. The bathymetry raster was
then masked to remove portions of the raster that existed outside of the river polygon
boundary.
Temperature
At Manitou Falls, temperature was recorded every 2 hours from April 29th, 2010
to July 30th, 2010 using a temperature data logger (TidbiT v2) located directly above
Manitou Falls (Easting: 566904, Northing: 5450977). Mean daily temperature at this
location was based on 12 readings per day over the course of this period (Appendix 2). At
Kagiano Falls, temperature was recorded every 2 hours from April 29th, 2010 to July 30th,
2010 using a temperature data logger (TidbiT v2) located immediately below the rapids
of Kagiano Falls (Easting: 565486, Northing: 5449117). Mean daily temperature at this
location was based on 6 readings per day over the course of this period (Appendix 2). At
the Lower Rapids, temperature was recorded four times daily from April 29th, 2010 to
July 30th, 2010 using a temperature data logger (TidbiT v2) located immediately below
the rapids (Easting: 552000, Northing: 5400155). Mean daily temperature at this location
was based on 4 readings per day over the course of this period (Appendix 2).
3.2.2 Habitat Suitability Model:
According to Threader et al. (1998), the suitability of Lake Sturgeon spawning
habitat is dependent on substrate, depth, temperature, and flow. For this study, detailed
measurements and monitoring of flow were not available and therefore only substrate,
depth, and temperature were considered for suitability analysis. The HSM was developed
78
based on habitat preferences of spawning Lake Sturgeon in northern Ontario rivers
(Groundhog River & Moose River; Seylor et al. 1997a & Seylor, 1997b; respectively).
The model provides suitability index values for each substrate type, depth interval, and
temperature interval (Table 3.2, Table 3.3, and Table 3.4, respectively). Two
modifications to Threader et al.’s (1998) original suitability indices were made. First,
sand was given a suitability index of 0.0 instead of 0.1 because of evidence that Lake
Sturgeon spawn near sand bars or beaches, but not on sandy substrates (Daugherty et al.,
2008a; Daugherty et al., 2008b). Secondly, this study further refined the depth and
temperature intervals so that small scale changes in the overall suitability of spawning
habitat could be observed, these revised values are presented below.

79
Table 3.2 – Suitability index values for each substrate type based on Threader et al.
(1998).
Substrate Type Suitability Index Value
Other (i.e. logs, woody debris, etc) 0.0
Clay 0.0
Silt 0.0
Sand 0.0
Bedrock 0.3
Gravel 0.5
Cobble 1.0
Boulder 1.0

80
Table 3.3 – Suitability index values for each depth interval based on Threader et al
(1998).
Depth Interval (m) Suitability Index Value
<0.3 0.0
3 to <5 1.0
5 to<8 0.75
8 to <11 0.5
11 to <14 0.2
14 to <18 0.1
≥18 0.0
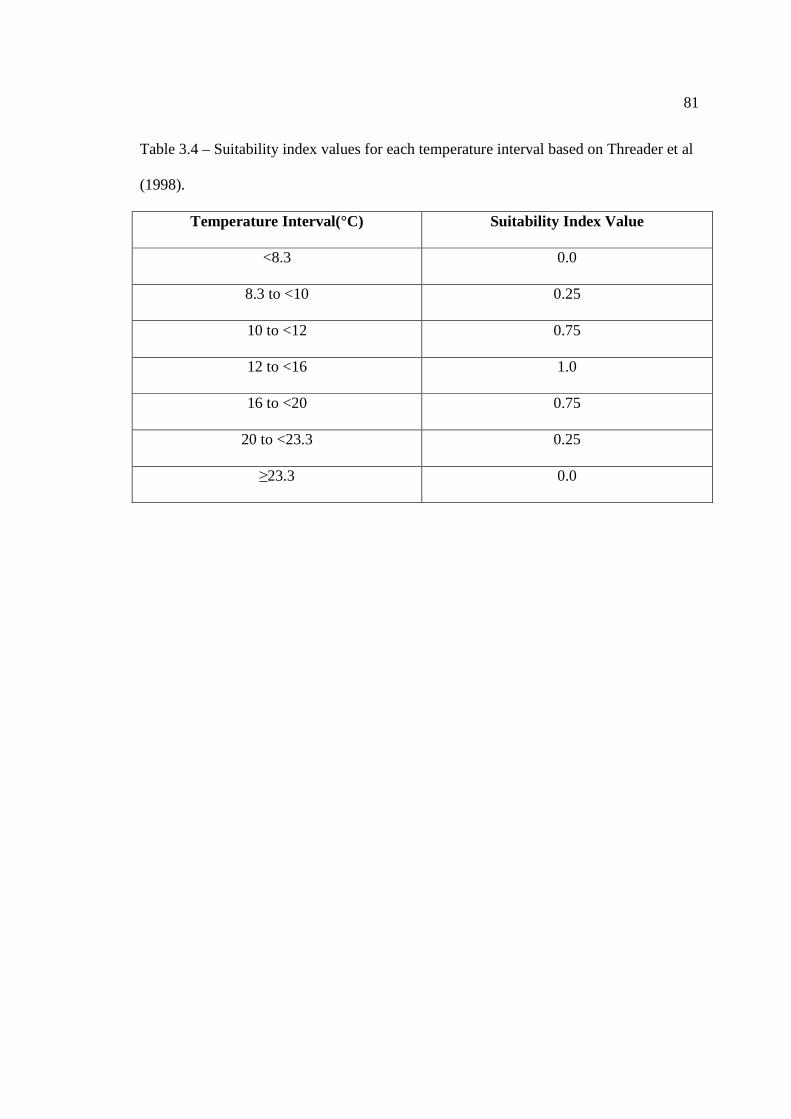
81
Table 3.4 – Suitability index values for each temperature interval based on Threader et al
(1998).
Temperature Interval(°C) Suitability Index Value
<8.3 0.0
8.3 to <10 0.25
10 to <12 0.75
12 to <16 1.0
16 to <20 0.75
20 to <23.3 0.25
≥23.3 0.0

82
To determine the suitability of substrate at each potential spawning site, the raster
calculator was used in ArcMap 9.1 (Tools; Spatial Analyst). The overall substrate
suitability was equal to the sum of the proportion of each substrate type (i.e. the substrate
rasters) multiplied by its respective suitability index value. Therefore, the substrate
rasters representing the proportion of “other”, “clay, “silt”, “sand”, “bedrock”, “gravel”,
“cobble”, and “boulder” were multiplied by 0.0, 0.0., 0.0, 0.0, 0.3, 0.5, 1.0, and 1.0,
respectively, to determine the substrate suitability for spawning. The new raster layer
produced from this calculation had 25 m2 cells with a value ranging from 0 to 1; 0 being
very unsuitable substrate for spawning and 1 being highly suitable substrate for
spawning. The depth rasters were then reclassified (Tool; Spatial Analyst; Reclass;
Reclassify) to convert negative depth values into positive depth suitability index values
based on Table 3.3. The reclassification resulted in a depth raster with each 25 m2 cell
having a value ranging from 0 to 1; 0 being a highly unsuitable depth for spawning and 1
being a highly suitable depth for spawning.
Upon generating depth and substrate suitability rasters, the raster calculator was
once again used to calculate the geometric mean of each cell within the depth and
substrate suitability rasters. The raster that was produced from this calculation
represented the overall suitability of each potential spawning site based solely on depth
and substrate type. The final variable for the HSM is mean daily water temperature. Since
this variable changes daily, so do the model’s predictions of daily suitability. To
accommodate this, a suitability map representing the overall suitability of each potential
spawning location had to be created for each day from April 29th, 2010 to July 30th, 2010.
To do this, mean daily water temperature was converted into a suitability value based on
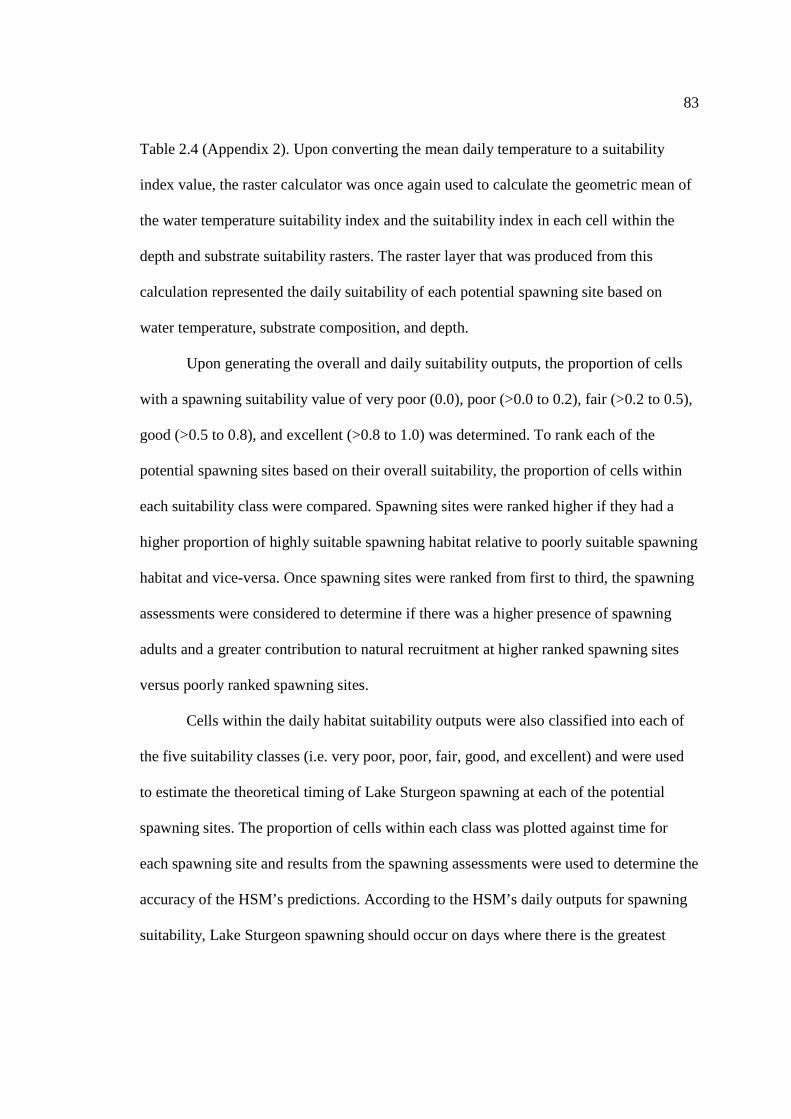
83
Table 2.4 (Appendix 2). Upon converting the mean daily temperature to a suitability
index value, the raster calculator was once again used to calculate the geometric mean of
the water temperature suitability index and the suitability index in each cell within the
depth and substrate suitability rasters. The raster layer that was produced from this
calculation represented the daily suitability of each potential spawning site based on
water temperature, substrate composition, and depth.
Upon generating the overall and daily suitability outputs, the proportion of cells
with a spawning suitability value of very poor (0.0), poor (>0.0 to 0.2), fair (>0.2 to 0.5),
good (>0.5 to 0.8), and excellent (>0.8 to 1.0) was determined. To rank each of the
potential spawning sites based on their overall suitability, the proportion of cells within
each suitability class were compared. Spawning sites were ranked higher if they had a
higher proportion of highly suitable spawning habitat relative to poorly suitable spawning
habitat and vice-versa. Once spawning sites were ranked from first to third, the spawning
assessments were considered to determine if there was a higher presence of spawning
adults and a greater contribution to natural recruitment at higher ranked spawning sites
versus poorly ranked spawning sites.
Cells within the daily habitat suitability outputs were also classified into each of
the five suitability classes (i.e. very poor, poor, fair, good, and excellent) and were used
to estimate the theoretical timing of Lake Sturgeon spawning at each of the potential
spawning sites. The proportion of cells within each class was plotted against time for
each spawning site and results from the spawning assessments were used to determine the
accuracy of the HSM’s predictions. According to the HSM’s daily outputs for spawning
suitability, Lake Sturgeon spawning should occur on days where there is the greatest

84
proportion of highly suitable spawning habitat relative to poorly suited spawning habitat.
Therefore the HSM’s prediction for the timing of spawning was compared with empirical
evidence for the timing of spawning to test the accuracy of the model’s predictions.
3.3.3 Spawning Assessments:
To determine the validity of the HSM’s predictions for spawning suitability
(described in Section 3.3.2), spring spawning assessments were performed at all three
potential spawning sites within the Pic River. A range of methodological approaches was
applied throughout the study to determine if spawning was occurring at particular
locations, and if so, the relative importance of the spawning site to natural recruitment.
To address these questions, the methodological approaches to assess spawning included;
visual observations, gill netting, larval drift netting, and deploying egg mats in prime
spawning locations.
Visual Observations
Visual observations of spawning were extremely limited within the Pic River due
to high levels of turbidity. In 2010, lower flows and fewer heavy rain events enabled
some visual observations to be made at Manitou Falls. Apart from these observations, no
other evidence of spawning was collected through this method.
Gill Netting
For this portion of the study, only gill netting data collected in 2008 and 2009
were considered, as these were the only two years when gill netting was performed at all
three potential spawning sites. Netting occurred from May 28 to August 14 in 2008 and
from May 24 to August 14 in 2009. Nylon gill nets were set perpendicular to shore at an
angle of roughly 90° with stretch mesh sizes ranging from 20.32 cm (8”) to 25.4 cm

85
(10”). Gill nets were set overnight and upon retrieval the location, duration, depth, water
temperature, net length, mesh size, cloud cover, and precipitation type were recorded for
each set. Since this portion of the study was focused on spawning individuals at each of
the potential spawning sites, only data that were collected from ripe individuals within
500m of a potential spawning site were used to determine catch per unit of effort (CPUE)
(# ripe adults/day). CPUE of ripe adults at each spawning site was used as a surrogate
measure of abundance to rank the relative importance of each potential spawning site
within the Pic River.
Larval Drift Netting
Larval drift netting occurred in 2010 at the lower rapids, Manitou Falls, and
Kagiano Falls, from May 22nd to June 20th, from May 24th to July 5th, and from May 28th
to June 16th, respectively. Larval drift nets with a mesh size of 1600 µm were anchored in
the river channel overnight at various depths and locations within 1 km of potential
spawning sites. Larval drift nets that were set below the confluence of the Pic and
Kagiano Rivers were not included in this analysis since it could not be determined
whether their natal site was Manitou or Kagiano Falls. All contents collected in the larval
drift nets were preserved in 95% Ethanol Alcohol (ETOH) and identified through a
dissecting microscope. In cases where larvae could not be identified through a
microscope, DNA sequencing was used to identify the species. Using methods outlined in
the NRDPFC Laboratory Manual, the mitochondrial cytochrome b gene was amplified
and sequenced, and the nucleotide sequence was inputted into BLAST (Basic Local
Alignment Search Tool) to determine the species. The total number of Lake Sturgeon

86
larvae captured at each spawning site was divided by the total amount of effort at that
respective site to assess the relative recruitment rate based on CPUE of larvae.
Egg Mats
Egg mats were deployed in 2010 at the lower rapids, Manitou Falls, and Kagiano
Falls, from May 25th to June 2nd, from May 18th to June 5th, and from May 22nd to June
7th, respectively. Egg mats were deployed overnight within 50 m of Manitou and Kagiano
Falls and in fast flowing waters that were along the lower rapids. Egg mats were
thoroughly checked each day and all eggs were collected from the mats, regardless of
their appearance. All eggs that were collected were preserved in 95% ETOH and
identified as Lake Sturgeon, if they were a dark olive-brown colouration. To confirm that
visual observations were sufficient, a subsample of 100 transparent eggs that were
collected at the lower rapids and Manitou Falls were genetically sequenced for the
mitochondrial cytochrome b gene. This confirmed that they were not sturgeon. All olive-
black coloured eggs were then identified as Lake Sturgeon based solely on visual
observation. The total number of Lake Sturgeon eggs collected per spawning site was
divided by the total amount of effort at that respective site to assess the relative
recruitment based on CPUE of eggs.
3.3 RESULTS
3.3.1 Overall Spawning Habitat Suitability:
At each potential spawning location, a substrate raster was generated that
represented the proportion of that particular substrate type at that location (8 substrate
types total x 3 potential spawning sites) (Figure 3.1 to Figure 3.21 in Appendix 1). The

87
resultant suitability index values were then used to convert the proportion of substrate
type to a composite substrate suitability index value for the Lower Rapids, Manitou Falls,
and Kagiano Falls (Figure 3.22; Figure 3.23; Figure 3.24; respectively). Cells with an
area of 25 m2 were then classified into 5 different groups depending on their substrate
suitability index value, defined as: 0.0 (very poor), >0.0 to <0.2 (poor), 0.2 to <0.5 (fair),
0.5 to < 0.8 (good), and 0.8 to 1.0 (excellent). Results indicated that the lower rapids had
the largest proportion of highly suitable substrate, with nearly a threefold higher
proportion of highly suitable substrate relative to Manitou and Kagiano Falls (Figure
3.25). Furthermore, the lower rapids were nearly a fourfold lower in the proportion of
very poor, poor, and fair substrate suitability for spawning. According to these results, the
substrate suitability for spawning Lake Sturgeon is predicted to be substantially better at
the lower rapids compared to Manitou and Kagiano Falls, whereas the proportions of
high and low substrate suitability were roughly equal at these two latter locations.
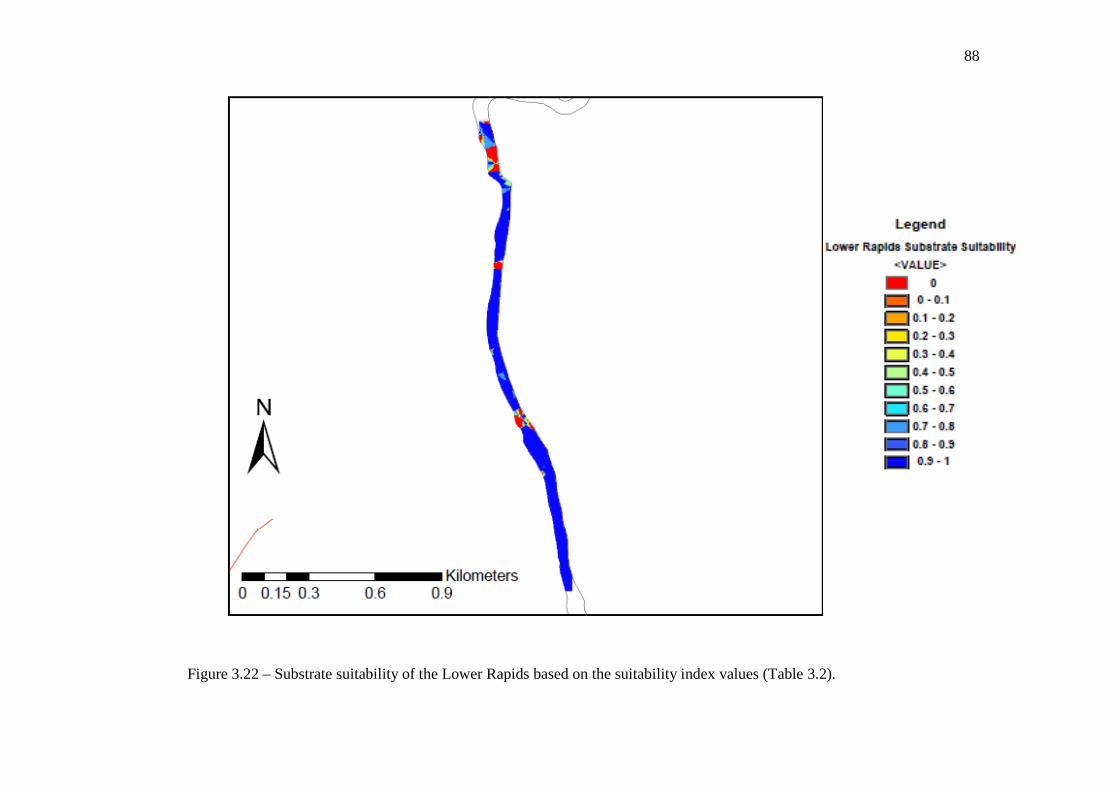
88
Figure 3.22 – Substrate suitability of the Lower Rapids based on the suitability index values (Table 3.2).
89
Figure 3.23 – Substrate suitability of Manitou Falls based on the suitability index values (Table 3.2).
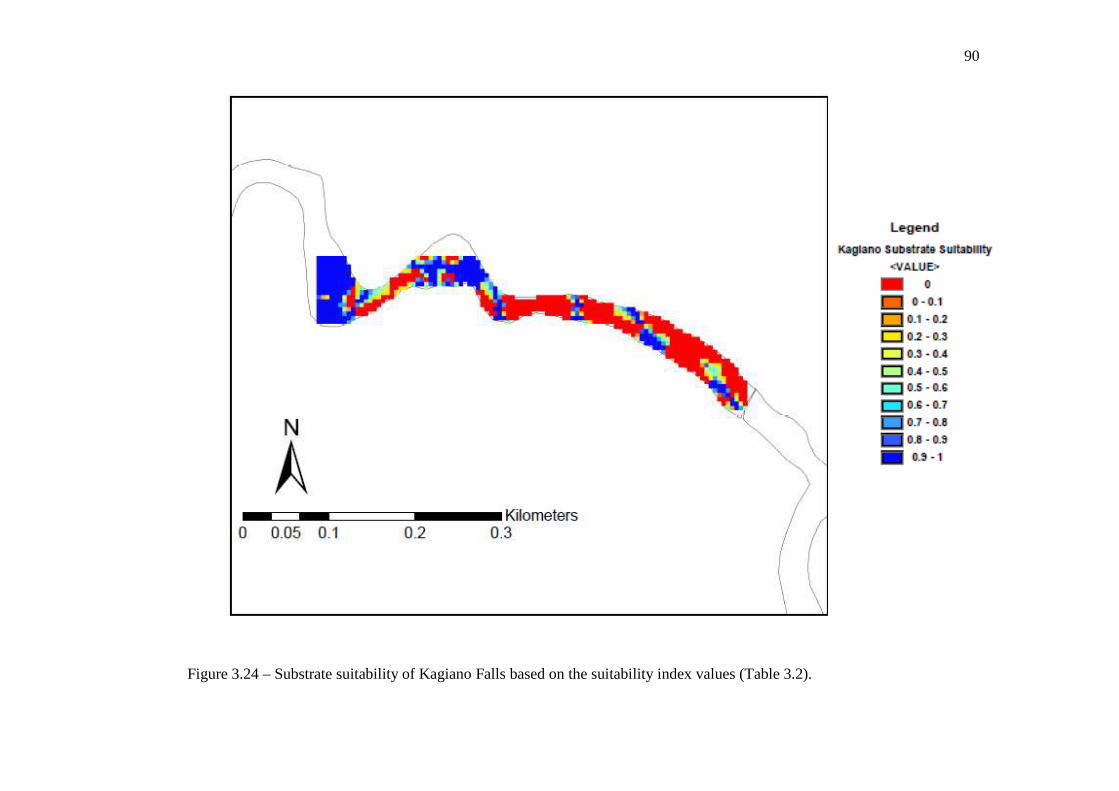
90
Figure 3.24 – Substrate suitability of Kagiano Falls based on the suitability index values (Table 3.2).
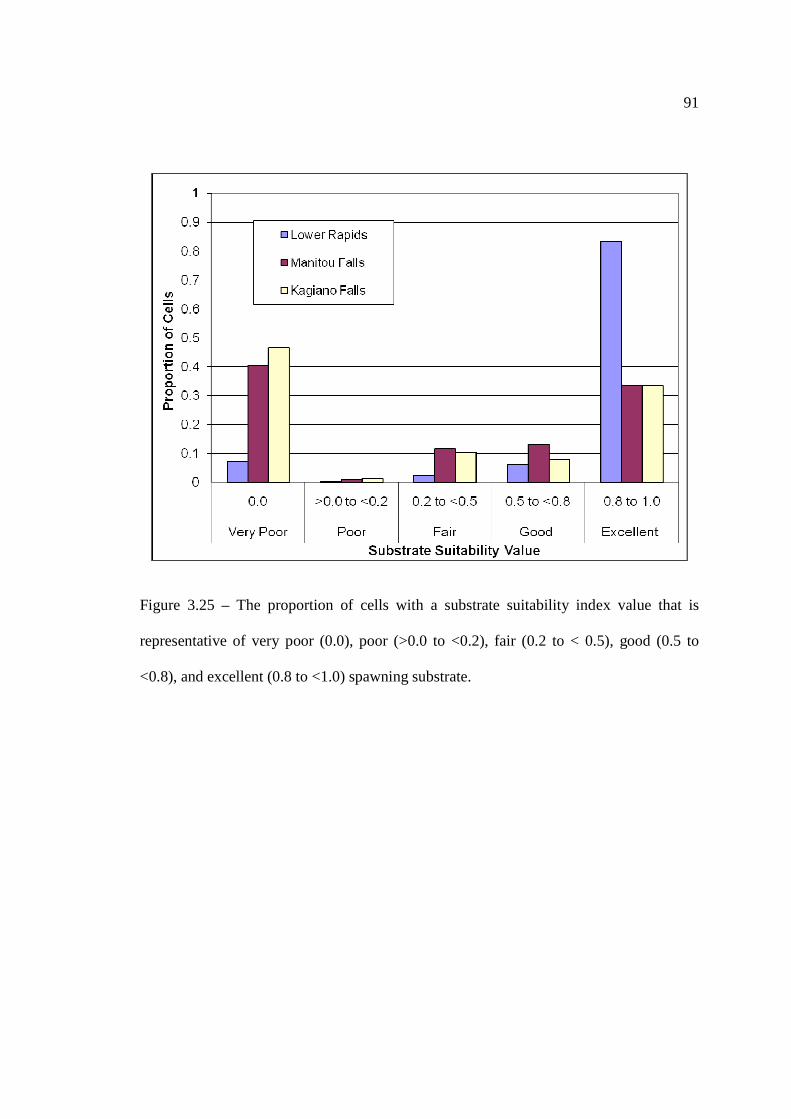
91
Figure 3.25 – The proportion of cells with a substrate suitability index value that is
representative of very poor (0.0), poor (>0.0 to <0.2), fair (0.2 to < 0.5), good (0.5 to
<0.8), and excellent (0.8 to <1.0) spawning substrate.

92
At each potential spawning site, a bathymetry raster was generated and each 25
m2 cell was converted from a depth value to a depth suitability index value based on
Table 3.3. Since Lake Sturgeon have a broad depth tolerance for spawning, 90% and 97%
of the habitat at the lower rapids and at both Kagiano and Manitou Falls (respectively)
was classified as excellent depth for spawning (i.e. depth suitability index value greater
than or equal to 0.8). The depth suitability results factored out the deep foraging and/or
staging habitat at the lower rapids, Kagiano Falls, and Manitou Falls, including plunge
pools immediately below both falls and deep pools that occur intermittently throughout
the lower rapids.
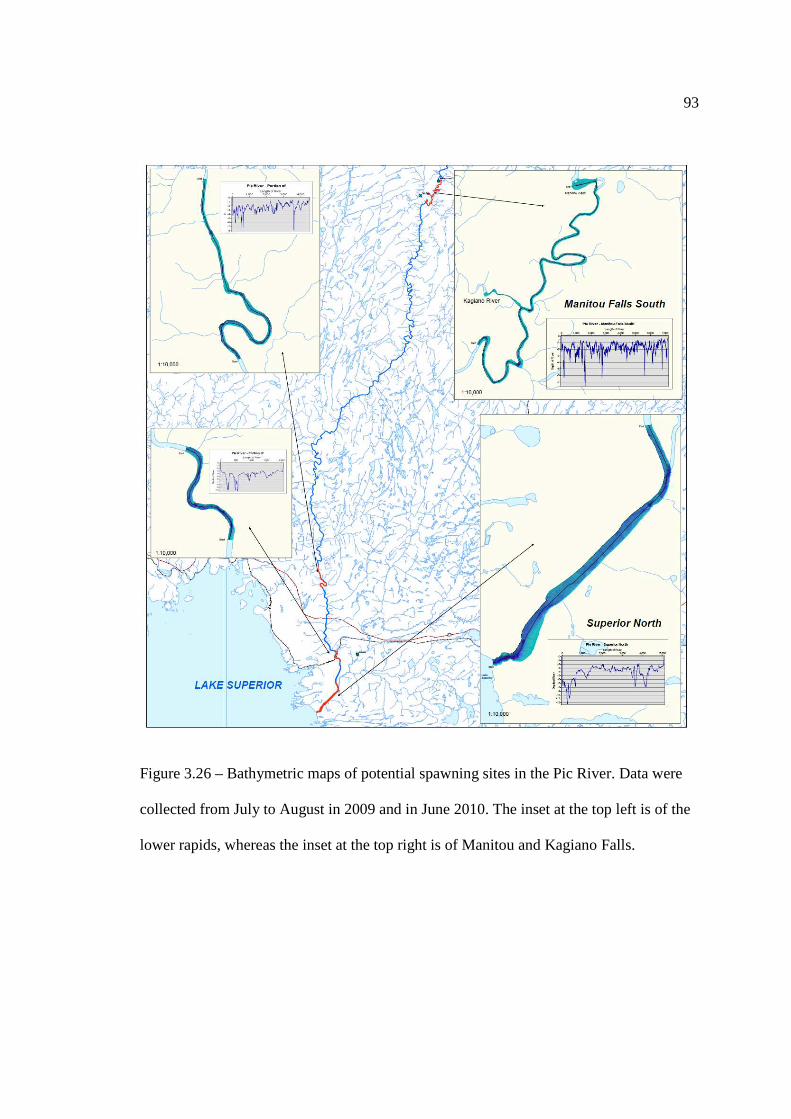
93
Figure 3.26 – Bathymetric maps of potential spawning sites in the Pic River. Data were
collected from July to August in 2009 and in June 2010. The inset at the top left is of the
lower rapids, whereas the inset at the top right is of Manitou and Kagiano Falls.
94
Upon generating substrate and depth suitability rasters, the geometric means of
these two layers were calculated to generate a compound model estimate of the overall
spawning suitability of the Lower Rapids, Manitou Falls, and Kagiano Falls (Figure 3.27;
Figure 3.28; Figure 3.29; respectively). As was the case when only substrate was
considered, the lower rapids had nearly a threefold increase in the proportion of highly
suitable habitat when both substrate and depth were considered (Figure 3.30). With the
exception of a 1700m2 patch at the top of the site and a 5500m2 patch in the middle of the
site, all of the habitat at the lower rapids ranged from fairly to highly suitable for Lake
Sturgeon spawning (Figure 3.27). Additionally, Manitou and Kagiano Falls had a greater
proportion of spawning habitat that was very poorly suited compared to excellently suited
habitat for Lake Sturgeon spawning. Of the entire area that was modeled at the lower
rapids (78,475 m2), Manitou Falls (23,775 m2), and Kagiano Falls (13,100 m2), a total
area of 69,575 m2, 8,925 m2, 4,200 m2 (respectively) was considered excellently suited
for Lake Sturgeon spawning based on the compound model for overall suitability.

95
Figure 3.27 – Overall suitability of the lower rapids based on the depth and substrate suitability index values (Table 3.2 & 3.3).

96
Figure 3.28 – Overall suitability of Manitou Falls based on the depth and substrate suitability index values (Table 3.2 & 3.3).
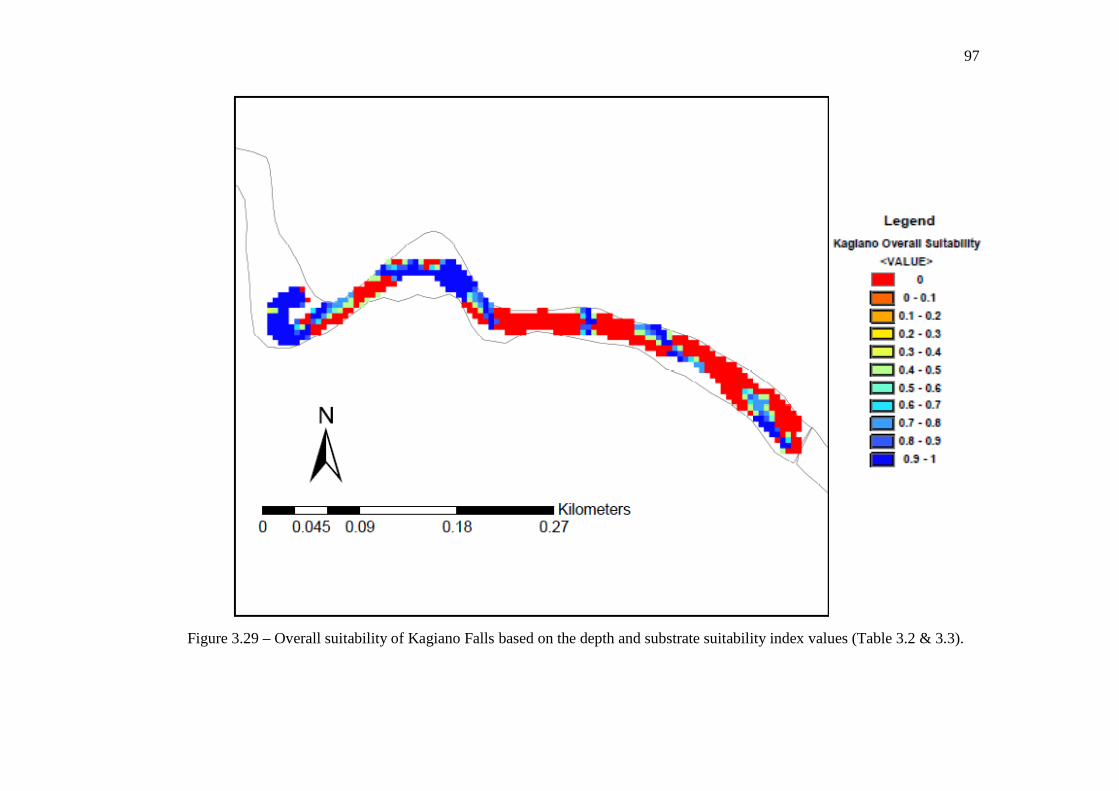
97
Figure 3.29 – Overall suitability of Kagiano Falls based on the depth and substrate suitability index values (Table 3.2 & 3.3).

98
Figure 3.30 – The proportion of cells at each potential spawning site with a suitability
index value that is representative of very poor (0.0), poor (>0.0 to <0.2), fair (0.2 to <
0.5), good (0.5 to <0.8), and excellent (0.8 to <1.0) spawning suitability based on
substrate and depth.

99
Although Manitou and Kagiano Falls had less highly suitable spawning habitat,
there was nonetheless some highly suitable spawning habitat that warrants attention. At
Manitou Falls there was a large patch (1,700 m2) of highly suitable spawning habitat that
is immediately to the left of the base of the falls (Figure 3.28 and Figure 3.31). As well,
there are four large patches (600 m2 to 900 m2) of highly suitable spawning habitat
located where the river first begins to narrow below Manitou Falls. There was an
additional six smaller habitat patches (300 m2 to 700 m2) that were located immediately
below the first bend that is located below Manitou Falls. At Kagiano Falls, there were
two large patches (roughly 1,300 m2) of highly suitable Lake Sturgeon spawning habitat,
one occurring immediately below the uppermost navigable point and another occurring at
the second bend below the uppermost navigable point (Figure 3.29 and Figure 3.32).
There were a few more intermittent patches of suitable spawning habitat near the mouth
of the Kagiano River; however, given the low patch size and moderate suitability, these
are unlikely spawning locations. It is also important to note that for both of these
locations, sampling methods were not feasible immediately below the water chute of the
falls because of boat accessibility and water flow issues (Figure 3.33). Although not
navigable by boat or feasible to assess using the DIDSON camera, fish could still
navigate these areas with relative ease. Therefore, is it is possible that both Manitou and
Kagiano Falls had a greater proportion of highly suitable spawning habitat within these
unsampled portions, especially given that these areas were mostly comprised of boulder
and cobble substrate. The limiting factor to the suitability of both of these locations is
depth, since ephemeral conditions exist within these portions. It is likely that these two

100
unsampled locations could add up to 6,000 m2 and 9,000 m2 of highly suitable spawning
habitat to both Kagiano and Manitou Falls, respectively.

101
Figure 3.31 – Aerial photograph of Manitou Falls on the Pic River with circles indicating
the locations of highly suitable Lake Sturgeon spawning habitat patches.

102
Figure 3.32 – Aerial photograph of Kagiano Falls on the Kagiano River with circles
indicating the locations of highly suitable Lake Sturgeon spawning habitat patches.
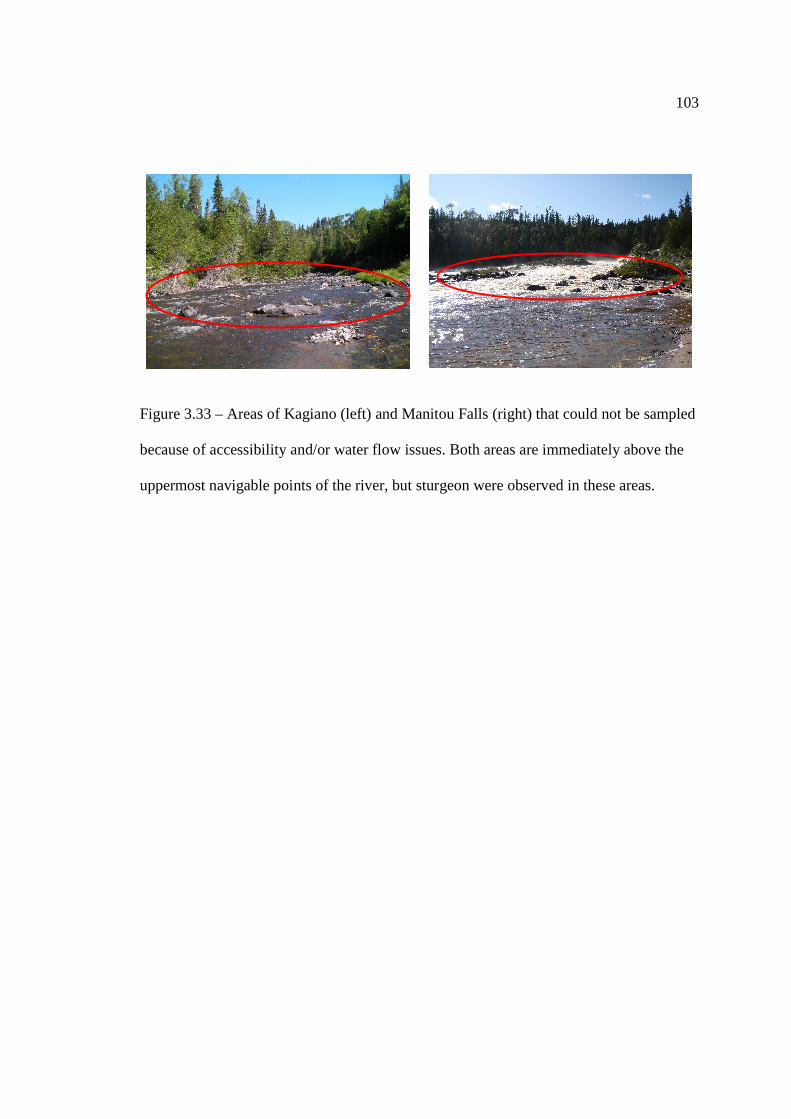
103
Figure 3.33 – Areas of Kagiano (left) and Manitou Falls (right) that could not be sampled
because of accessibility and/or water flow issues. Both areas are immediately above the
uppermost navigable points of the river, but sturgeon were observed in these areas.

104
3.3.2 Daily Spawning Habitat Suitability:
To produce daily habitat suitability values for Lake Sturgeon spawning habitat,
the geometric mean of each cell was calculated based on the substrate, depth, and
temperature suitability index value. The proportions of very poor (0), poor (>0.0-0.2), fair
(>0.2-0.5), good (>0.5-0.8), and excellent (>0.8-1.0) habitat were plotted against time
(days) to determine when optimal spawning times at each spawning site occurred.
According to the HSM, spawning should occur when a spawning site reaches its optimal
spawning temperature or when there is a very high proportion of highly suitable
spawning habitat. Results indicated that optimal spawning conditions were reached at
roughly the same time at each of the potential spawning sites. According to the modeled
results, optimal spawning conditions were reached at the lower rapids on May 18th, 2010
to May 22nd, 2010, and again on June 7th, 2010 (Figure 3.34). Modeled results were very
similar at both Manitou and Kagiano Falls, whereby the HSM predicted that spawning
was most likely to occur between May 2nd, 2010 and May 4th, 2010, between May 17th,
2010 and May 18th, 2010, or on June 10th, 2010 (Figure 3.35 and Figure 3.36,
respectively). It is also important to note that in the 2 to 3 days preceding and proceeding
the aforementioned optimal spawning windows, the overall suitability was at its second
highest level at all three potential spawning sites (i.e. overall suitability < 0.8). The model
therefore suggests, albeit with less confidence, that Lake Sturgeon could spawn in the 2
to 3 days before and after these windows as well.
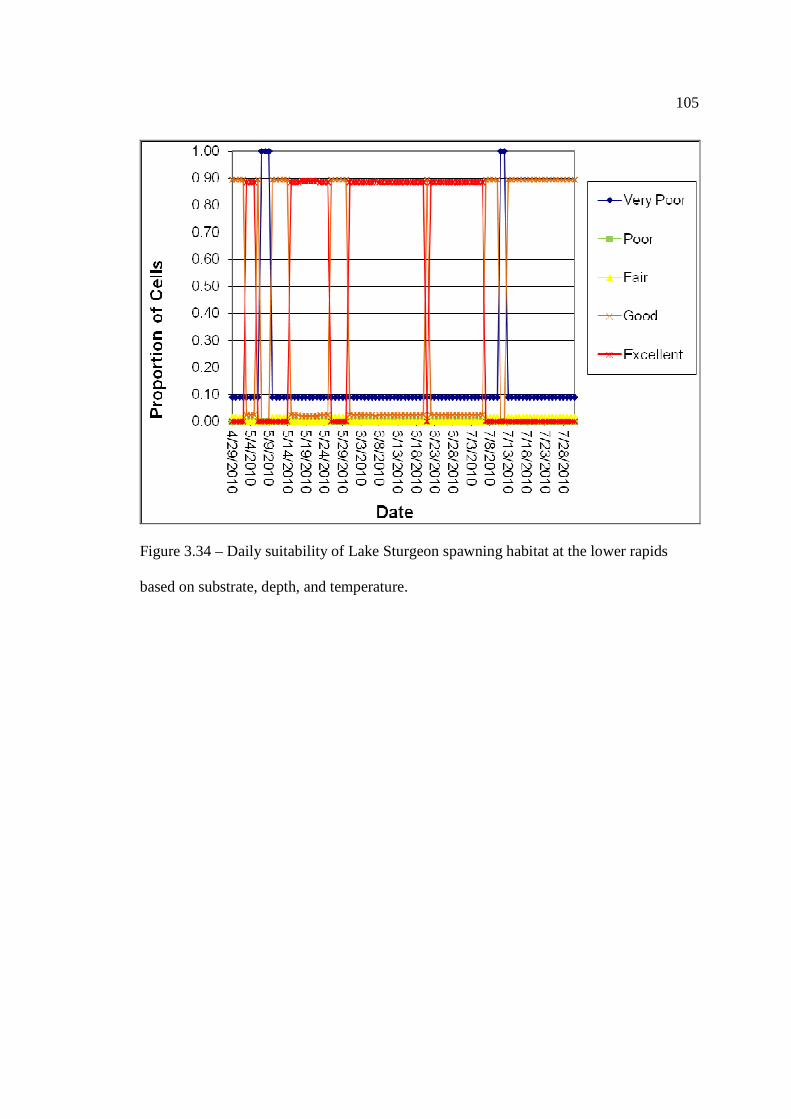
105
Figure 3.34 – Daily suitability of Lake Sturgeon spawning habitat at the lower rapids
based on substrate, depth, and temperature.
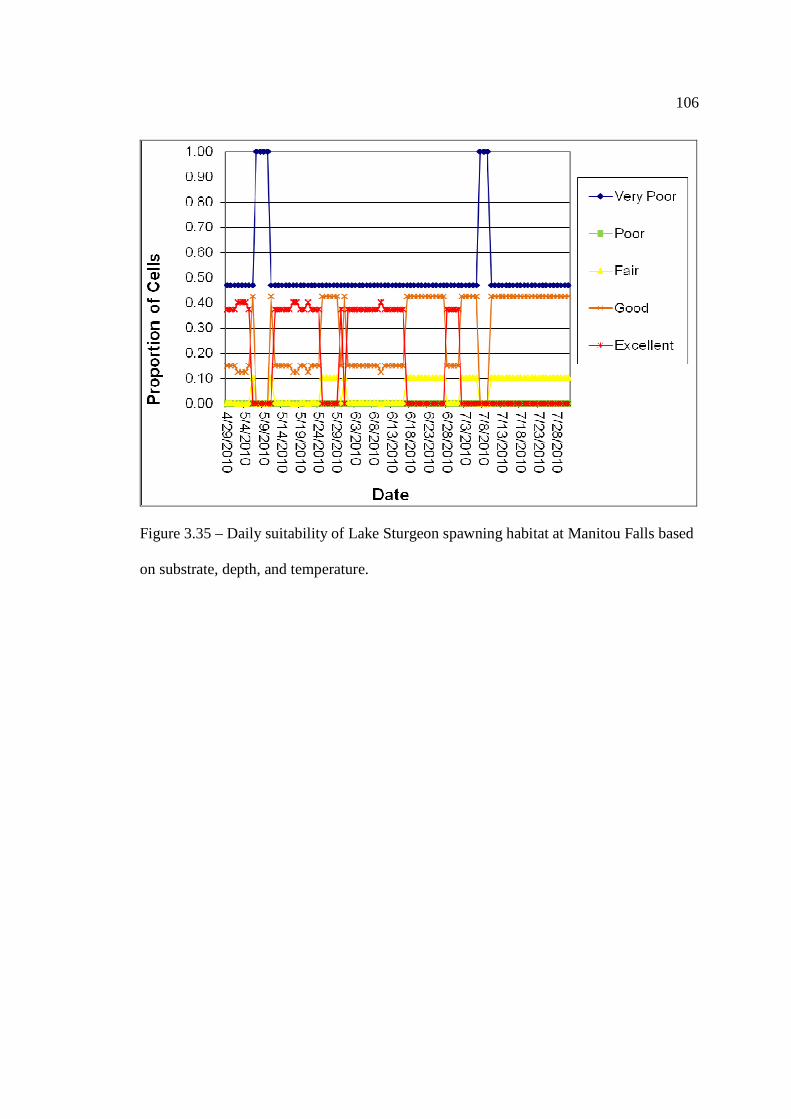
106
Figure 3.35 – Daily suitability of Lake Sturgeon spawning habitat at Manitou Falls based
on substrate, depth, and temperature.
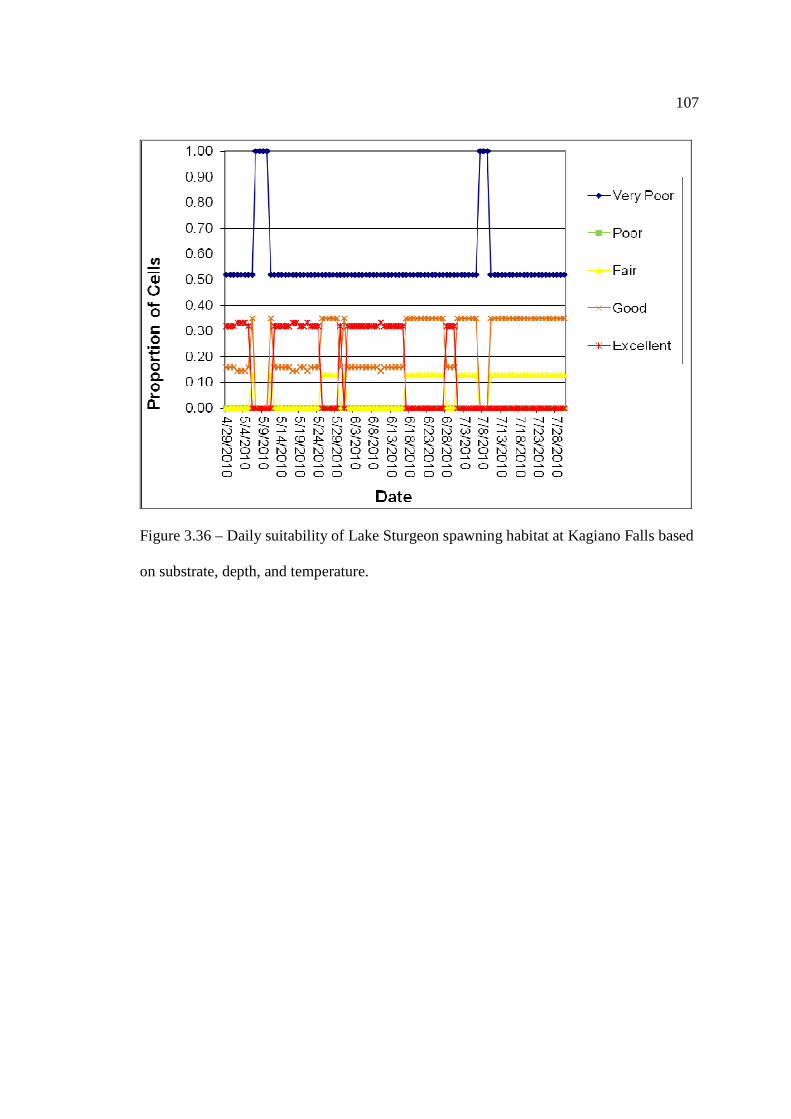
107
Figure 3.36 – Daily suitability of Lake Sturgeon spawning habitat at Kagiano Falls based
on substrate, depth, and temperature.

108
3.3.3 Spawning Assessments:
To compare habitat utilization by spawning adult Lake Sturgeon at each of the
potential spawning sites, three different methods were used to estimate the relative
importance and rate of recruitment at each site. The first such measure was CPUE of ripe
adults in 2008 and 2009 that were caught within 500 m of each potential spawning site
(Figure 3.37). Results indicated that Manitou Falls had the greatest CPUE of ripe adults
in 2009 compared to any other site in any given year (0.67 ripe adults captured per day).
In 2008, no ripe adult Lake Sturgeon were captured at Manitou Falls, however, this is
likely because the sampling period was inconsistent with the timing of migration at this
location. In 2008 and 2009, CPUE of ripe adults at Kagiano Falls was relatively constant,
with 0.37 ripe adults captured per day and 0.41 ripe adults captured per day, respectively.
At the lower rapids, only two ripe adults were captured in 2008, resulting in a CPUE of
0.04 ripe adults captured per day in 2008 and 0.0 ripe adults captured per day in 2009.
Given the date that these two individuals were captured (i.e. pre-spawning), it is likely
that these two individuals were not spawning at the lower rapids, but instead migrating
through the lower rapids to either Manitou or Kagiano Falls. These results suggest that
based on CPUE of ripe adults, spawning Lake Sturgeon most frequently utilized Manitou
Falls followed closely by Kagiano Falls. Furthermore these results show very limited
evidence of spawning activity or habitat utilization by ripe spawning adults at the lower
rapids.
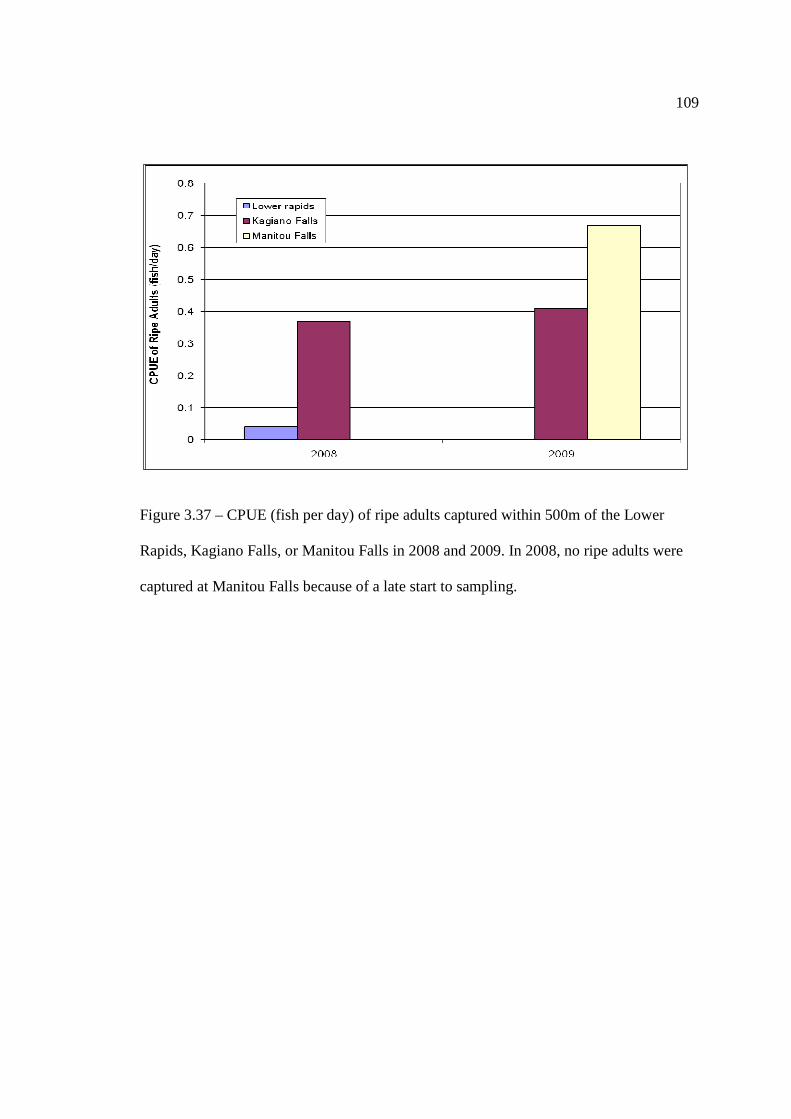
109
Figure 3.37 – CPUE (fish per day) of ripe adults captured within 500m of the Lower
Rapids, Kagiano Falls, or Manitou Falls in 2008 and 2009. In 2008, no ripe adults were
captured at Manitou Falls because of a late start to sampling.

110
The second and third measures that were used to estimate the importance of each
site were egg and larvae collections (Figure 3.38). No eggs or larvae were captured at the
lower rapids in 2010, despite logging over 4,300 hours of egg mat sampling and over
8,600 hours of larval drift net sampling. No eggs were captured at Kagiano Falls in 2010,
possibly because of reduced effort (just over 1600 hours) or because sampling times did
not coordinate with spawning times. Of the three potential spawning sites, Manitou Falls
was the only location where Lake Sturgeon eggs were captured in 2010. A total of 9 Lake
Sturgeon eggs were captured on May 24th, 2010 at Manitou Falls, for a CPUE of 0.02
eggs per day. All of these eggs were captured at the same location, which was
immediately above the waterfall break, in the rapids that are located to the left of the
waterfall fan (Easting: 566936, Northing: 5450850) (Figure 3.39). A total of 2 and 5 Lake
Sturgeon larvae were captured a Kagiano and Manitou Falls in 2010, respectively,
resulting in a CPUE 0.03 larvae per day at Kagiano Falls and 0.06 larvae per day at
Manitou Falls. As was the case for CPUE of ripe adults at each spawning site, these
results indicate that Manitou Falls is the most frequently utilized and most important
spawning site to natural recruitment within the Pic River. Evidence of spawning also
suggests that Kagiano Falls is an important spawning site for recruitment within the Pic
River, while the lack of spawning evidence collected at the lower rapids suggests that
Lake Sturgeon may not spawn at this location.
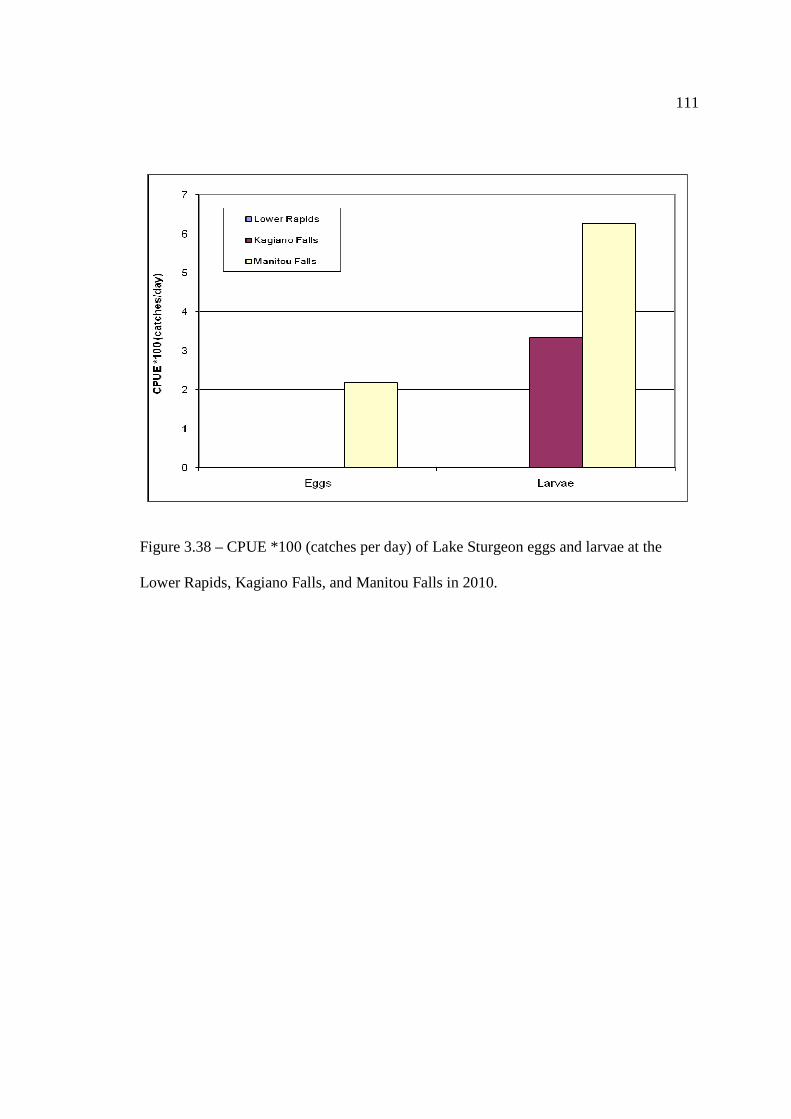
111
Figure 3.38 – CPUE *100 (catches per day) of Lake Sturgeon eggs and larvae at the
Lower Rapids, Kagiano Falls, and Manitou Falls in 2010.

112
Figure 3.39 – Daily suitability at Manitou Falls on May 24th, 2011, when Lake Sturgeon eggs were collected.
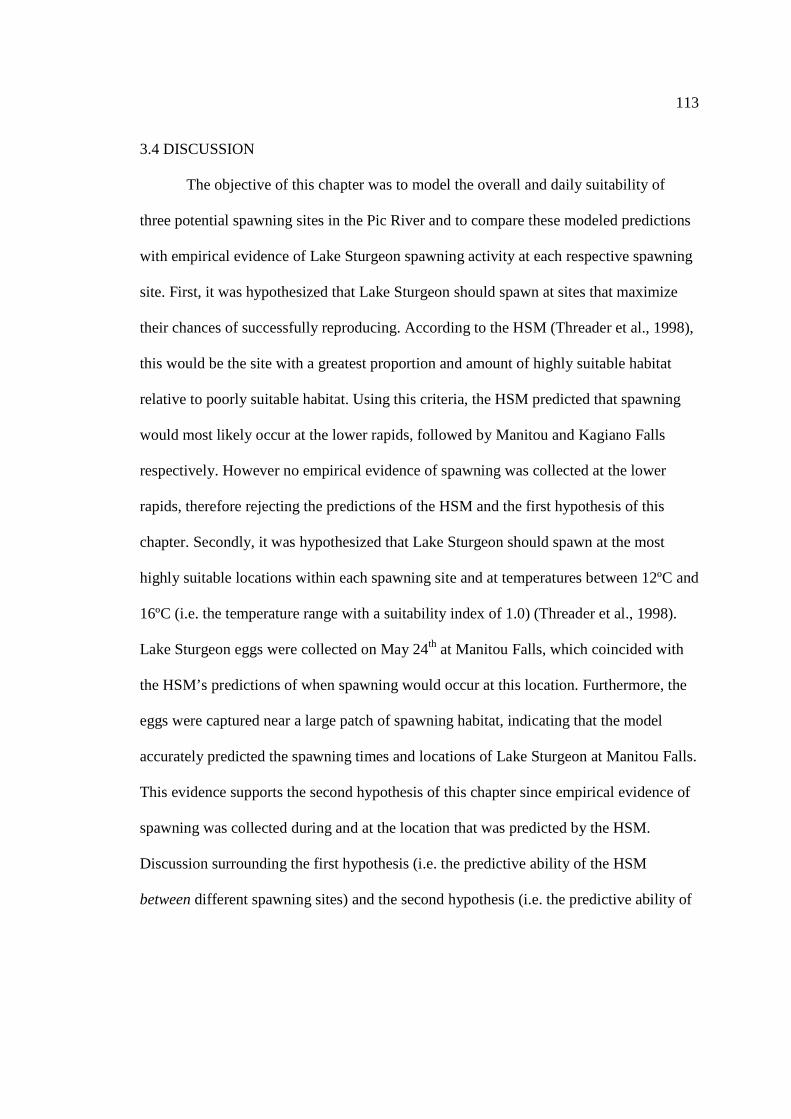
113
3.4 DISCUSSION
The objective of this chapter was to model the overall and daily suitability of
three potential spawning sites in the Pic River and to compare these modeled predictions
with empirical evidence of Lake Sturgeon spawning activity at each respective spawning
site. First, it was hypothesized that Lake Sturgeon should spawn at sites that maximize
their chances of successfully reproducing. According to the HSM (Threader et al., 1998),
this would be the site with a greatest proportion and amount of highly suitable habitat
relative to poorly suitable habitat. Using this criteria, the HSM predicted that spawning
would most likely occur at the lower rapids, followed by Manitou and Kagiano Falls
respectively. However no empirical evidence of spawning was collected at the lower
rapids, therefore rejecting the predictions of the HSM and the first hypothesis of this
chapter. Secondly, it was hypothesized that Lake Sturgeon should spawn at the most
highly suitable locations within each spawning site and at temperatures between 12ºC and
16ºC (i.e. the temperature range with a suitability index of 1.0) (Threader et al., 1998).
Lake Sturgeon eggs were collected on May 24th at Manitou Falls, which coincided with
the HSM’s predictions of when spawning would occur at this location. Furthermore, the
eggs were captured near a large patch of spawning habitat, indicating that the model
accurately predicted the spawning times and locations of Lake Sturgeon at Manitou Falls.
This evidence supports the second hypothesis of this chapter since empirical evidence of
spawning was collected during and at the location that was predicted by the HSM.
Discussion surrounding the first hypothesis (i.e. the predictive ability of the HSM
between different spawning sites) and the second hypothesis (i.e. the predictive ability of

114
the HSM within a spawning site) is respectively outlined in the following two
subsections.
3.4.1 Predictive Ability Between Sites:
According to the results of the spawning assessments, it appears that the lower
rapids is the least utilized and contributes the least to natural recruitment within the Pic
River. However, results from the habitat suitability modeling indicated that this site had
the greatest proportion and the greatest quantity of highly suitable spawning habitat. This
inconsistency between the modeled and empirical data suggests that the HSM may not
accurately reflect the likelihood of Lake Sturgeon spawning at a potential spawning sites
(i.e. between different sites). If the HSM for spawning Lake Sturgeon were accurate, then
the lower rapids would have contributed more to Lake Sturgeon recruitment within the
Pic River and would have been more frequently utilized by spawning Lake Sturgeon
relative to Manitou and Kagiano Falls. The HSM was able to accurately discriminate
between Manitou and Kagiano Falls, whereby it predicted that there was a greater
proportion and quantity of highly suitable spawning habitat at Manitou Falls and this
location was more frequently used by and spawned at by adult Lake Sturgeon.
Conversely, Kagiano Falls was ranked below Manitou Falls and appeared to have slightly
less spawning adults per season and contributed slightly less to natural recruitment.
Therefore between Manitou and Kagiano Falls, the HSM was able to accurately predict
which site would be more significant to natural recruitment. Despite this, the lower
rapids, where no evidence of spawning was collected, ranked higher than both Manitou
and Kagiano Falls, suggesting that the overall predictive value of the HSM between
spawning sites is relatively poor.

115
When assessing differences between the three potential spawning sites, the
biggest fault of the Lake Sturgeon HSM was that it predicted the lower rapids to be the
most highly suitable spawning site despite no evidence of spawning at this location
(Threader et al., 1998). This may be because the substrate and interstitial spaces at the
lower rapids were covered by a fine layer of clay and silt (Figure 3.2 and Figure 3.3,
respectively). In the Wolf River, Wisconsin, Lake Sturgeon were less likely to spawn on
substrates that were covered by a thin layer of clay, silt, detritus, or heavy algal growth
(Floz & Myers, 1985; Kempinger, 1988). Spawning assessments in the St. Lawrence, St.
Clair, and Detroit River systems also found that eggs were deposited on substrates that
were dominated by cobble or boulders and contained a small mixture of medium to
coarse gravel (LeHaye et al., 1992; Manny & Kennedy, 2002; Nichols et al., 2003;
Caswell et al., 2004). In the lower rapids there was a very limited amount of medium to
coarse gravel substrate (Figure 3.6), whereas at Manitou and Kagiano Falls there was a
large proportion of substrate that had a mixture of cobble and/or boulders with coarse
sand or gravel (see Section 3.3.1). When clay or silt covers suitable spawning substrate,
Lake Sturgeon eggs lose their adhesive ability and therefore cannot develop properly
(LeHaye et al., 1992). As well, eggs may become covered with silt or clay, preventing
them from being oxygenated and developing (Threader et al., 1998; Peterson et al.,
2007). The covering of suitable spawning substrate and eggs by fine particulate sediment
may prevent or discourage Lake Sturgeon from spawning at the lower rapids. At both
Manitou and Kagiano Falls, this is currently not an issue; however with a proposed dam
at Manitou Falls, sedimentation at this spawning site could become an issue in the future
(Ligon et al., 1995; Hay-Chmielewski & Whelan, 1997; Auer, 2003).
116
It is also possible that Lake Sturgeon do not spawn at the lower rapids because of
its topography. Although the lower rapids have fast, boiling, white water like Manitou
and Kagiano Falls, it does not present any barrier to migration and it does not have a
waterfall. A waterfall and fan, that presents either a complete or partial barrier to
migration, is a key topographical feature that is present at nearly all Lake Sturgeon
spawning sites (Priegel and Wirth, 1974; LaHaye et al., 1992; Nilo et al., 1997; Rusak &
Mosindy, 1997; Seylor 1997a; Seylor 1997b; McKinley et al., 1998; Auer & Baker,
2002; Peterson et al., 2007; Chiotti et al., 2008). In rare cases, Lake Sturgeon will spawn
along bedrock formations at the mouth of a tributary or along lake shorelines (Harkness
& Dymond, 1961; Carlson, 1995). However there is no evidence of Lake Sturgeon
spawning in the middle portions of any tributary that is connected to a lake, such as the
lower rapids are in the Pic River. Sturgeon spawning areas may be associated with
waterfalls because they offer hydraulic complexity and a diversity of substrate and flow
conditions (Le Haye et al., 1992; Perrin et al., 2003; Sulak & Clugston, 1998). In the Big
Manistee River, Lake Sturgeon spawning occurred at the base of barchans that were
produced by waterfalls, as they provided turbulent and irregular water flows (Chiotti et
al., 2008).
Finally, the relatively short distance between the lower rapids and Lake Superior
may also influence Lake Sturgeon to not spawn there, given the necessary development
time for eggs and larvae. The relationship between migration distance and egg
development has been well studied and most literature indicates that there is a positive
correlation between these two variables (Kinnison et al., 2001). This positive correlation
between gonadal somatic index (GSI) and migration distance was observed in White

117
Sturgeon in the Lower Columbia River and Atlantic Sturgeon in the Hudson River
(Devore et al., 1995; Van Eenennaam et al., 1996). This relationship has not been well
established for Lake Sturgeon, although Auer (1996) suggests that gonad development
occurs during the migration of all Sturgeon species. Not only do eggs require
development time during their upriver migrations, but Lake Sturgeon larvae also require
development time during their downriver migrations before being swept into the
connected lake environment. Lake Sturgeon larval dispersion occurs 5 to 11 days after
spawning and at temperatures of approximately 16ºC (Smith & King, 2005b). Upon
hatching, the larvae depend exclusively on their yolk sacs for nutrition and lack the most
basic anatomical features for survival and locomotion (Peterson et al., 2007). Their
phototactic lifestyle consists of rising to the surface during the night and drifting for a
period of several hours downstream until finding a new hiding spot or refuge (Peterson et
al., 2007). This process continues until Lake Sturgeon reach roughly 400 mm (Peterson et
al., 2007), at which point they become juveniles and spend upwards of a year at their
nursery habitat, which is typically at the mouth of the river (Auer & Baker, 2002; Nichols
et al., 2003; Smith & King, 2005). In the Sturgeon River, after 61 km of drift in the river,
larvae were still only 24.4 mm, just barely capable of swimming and controlling
locomotion (Auer & Baker, 2002). The small size and slow development time for larval
Lake Sturgeon may require them to be within a river habitat for a period of one year
before entering a lake habitat. Therefore Lake Sturgeon may not spawn at the lower
rapids because it does not give larvae adequate development time prior to entering the
lake environment.
118
Despite not finding any physical evidence of spawning at the lower rapids (i.e.
eggs or larvae), Lake Sturgeon movements near the lower rapids were consistent with
spawning movements reported in the literature and observed at Manitou and Kagiano
Falls, whereby individuals would reside in deep pools for long periods of time (2-3 days)
and partake on short range movements through the rapids during optimal spawning
conditions (Rusak & Mosindy, 1992; Auer & Baker, 2002; Peterson et al., 2007;
Lallaman et al., 2008). It is probable that Lake Sturgeon exhibiting this movement pattern
were foraging at the lower rapids and their distributions were congruent with the density
of foraging biomass (Harkness & Dymond, 1961; Hay-Chmielewski, 1987; Peterson et
al., 2007). Stelzer et al. (2008) performed gut and stable isotope analysis and found that
Lake Sturgeon were not only feeding on benthic invertebrates (primarily chironomous
larvae), but also dead age-0 Gizzard Shad (Dorosoma cepedianum) in the soft sediments
of the profundal zone in Lake Winnebago, Wisconsin. At the lower rapids,
macroinvertebrates could have higher abundances in the soft bottomed pools that are
adjacent to riffles (Brown & Brusak, 1991). Furthermore, with the spawning of several
fish species at the lower rapids (Walleye, Sander vitreus; Trout-Perch, Percopsis
omiscomaycus; and Emerald Shiner, Notropis atherinoides), it is suggested that foraging
Lake Sturgeon were utilizing the lower rapids to take advantage of high food availability.
Therefore movement patterns at the lower rapids should not be confused with spawning
behaviour since no physical evidence of spawning was collected; rather, these individuals
may have been seeking optimal foraging habitat at the lower rapids. Future work should
try and relate the distribution of Lake Sturgeon at the lower rapids with the available

119
foraging biomass at that respective location to determine if this explains the movements
surrounding the lower rapids.
To improve the predictive ability of the HSM for assessing differences between
spawning sites, three modifications are suggested based on this research. The first
suggestion is that the model factors in the relative distance of the potential spawning site
from the mouth of the river. Given the development times for both eggs and larvae, it is
suggested that Lake Sturgeon will always spawn at the uppermost navigable barrier to
increase the chances of larvae survival. Secondly, it is suggested that the HSM for Lake
Sturgeon spawning habitat should factor in waterfalls or contour gradients within its
predictions. At Manitou and Kagiano Falls, topographic maps show a contour gradient
that transects the water polygon layer (i.e. a waterfall). At the lower rapids this feature
does not exist, therefore the lower rapids could be easily factored out if the HSM
considered contour gradients as well. These two modifications to the HSM would have
factored out the lower rapids as a potential spawning site, therefore leaving Manitou and
Kagiano Falls as the highest-suited spawning habitats in the Pic River, respectively. Had
this been the prediction of the HSM, then the modeled results would have been consistent
with empirical observations, therefore validating the predictive ability of the HSM.
3.4.2 Predictive Ability Within Sites:
Although the model could not accurately determine which spawning site would be
most frequently utilized by spawning adult Lake Sturgeon, it did provide relatively good
estimates for spawning timing and locations within sites. A total of 9 Lake Sturgeon eggs
were captured on May 24th, 2010 at the base of Manitou Falls (Easting: 566936,
Northing: 5450850), indicating that Lake Sturgeon spawned on the night of May 23rd,

120
2010. These eggs were collected at a location that was characterized by a 4:1 boulder to
bedrock ratio, a depth of 1.2 m, and a mean daily water temperature of 17ºC (King,
2010). Given these values, the daily suitability value at that specific location was 0.74.
Although these eggs were not collected at a location with a daily suitability index value
of 1.0, they were located within 20 m of location that had an abundance of excellent
spawning habitat (1600 m2 with a spawning suitability index of 1.0). Lake Sturgeon have
a polyandrous mating system, whereby the broadcast spawning females will fertilize their
eggs by two to five males while she traverses the length of the spawning habitat
(Harkness, 1988; Auer & Baker, 2002; Bruch & Binkowski, 2002; Hodgeson et al., 2006;
Peterson et al., 2007). Given this spawning behaviour, it is not surprising that eggs were
not collected at a location that was in close proximity to a large upstream patch of highly
suitable spawning habitat. Visual observations also spotted two spawning females on
May 18, 2010, and a third spawning female on the following day (King, 2010). An
additional 20 Lake Sturgeon were observed immediately below Manitou Falls between
May 18th and May 21st, 2011 (King, 2011). All of these visual observations were made
within spawning habitat that had an overall suitability index value that ranged from 0.69
to 1.00.

121
Chapter 4: General Discussion
Significant Lake Sturgeon habitat includes portions of the river or lake that are
suitable for spawning, nursing, rearing, foraging, and migration (Auer, 2003). In Ontario,
the most prevalent threats to these habitats are dams and hydroelectric facilities, pollution
and contamination, siltation and sedimentation, and dredging and channelization (Kerr et
al., 2011). Ultimately, the successful recovery and conservation of Lake Sturgeon will
depend on our collective ability to identify, evaluate, and protect significant habitat in
spawning tributaries throughout the Great Lakes (Hay-Chmielewsky & Whelan, 1997;
Auer, 2003; Daugherty et al., 2008a; Kerr et al., 2011).
4.1 Significant Habitat, Movement Patterns, and Environmental Cues:
Lake Sturgeon movement patterns in the Pic River were consistent with
observations in other Great Lakes tributaries, whereby spawning and non-spawning
individuals exhibited different patterns throughout the spring, but aggregated in distinct
locations throughout the summer and fall before overwintering in Lake Superior. Despite
long spawning migrations that are undertaken by Lake Sturgeon (Auer, 1996), research
from the Rainy River (Rusak & Mosindy, 1997), Grasse River (Trested, 2010),
Mississippi River (Knight et al., 2002), Ottawa River (Haxton, 2003b), Manistee River
(Lallaman et al., 2008), Sturgeon River (Auer, 1999), and Kettle River (Borkholder et al.,
2002) have all indicated that Lake Sturgeon show a strong annual and seasonal site
fidelity for deep water habitat that exists within spawning tributaries. Strong site fidelity
is not only expressed by Lake Sturgeon, but is a common behaviour amongst all living
sturgeon species (Bemis & Kynard, 1997). It is believed that the strong homing abilities

122
are responsible for this site fidelity, whereby population-specific adaptations have
evolved that reinforce the selection of such habitats within specific tributaries (Legget,
1977; Lyons & Kempinger, 1992; Auer, 1996). In the past, it has been difficult to assess
the site fidelity and homing capacities of Lake Sturgeon, but with the advancement of
novel molecular techniques, research in this field of study has become much more
feasible (Welsh et al., 2008; 2010; Welsh & McLeod, 2010).
Environmental cues to Lake Sturgeon migration were partially identified through
this study, but further research and revised methods are required to accurately distinguish
abiotic conditions that stimulate migration. In the Kettle River, movements were strongly
correlated with water discharge and mildly correlated with temperature (Borkholder et
al., 2002). In Lake Winnebago, long-term movement records were correlated with
temperature, whereby Lake Sturgeon moved onto and off of the spawning site at
temperatures between 6ºC and 16ºC and at 15ºC to 21.1ºC, respectively (Bruch &
Binkowski, 2002). These same movements were more strongly related to water flow in
the Kaministiquai River, where movements onto the spawning grounds were strongly
correlated with water discharges that ranged from 14 m3/s to 23 m3/s (Friday 2004;
Friday 2005b). For foraging Lake Sturgeon, optimal water temperatures and flows are
estimated to range from 11˚C to 18˚C and from 3 cm/s to 25 cm/s; however, both of these
ranges can experience substantial spatial and temporal variation (Scott and Crossman,
1973; Peterson et al., 2007; Ontario Ministry of Natural Resources, 2009; Kerr et al.,
2011). Several studies have also related the distribution of juvenile Lake Sturgeon to prey
availability (Chiasson et al., 1997; Nilo et al., 2006).

123
In Lake Winnebago, adult Lake Sturgeon distributions and movements have been
compared with detailed substrate and benthic invertebrate mapping to determine that
Lake Sturgeon distributions were influenced by prey availability (Probst & Cooper, 1955;
Stelzer et al., 2009). Furthermore, several studies have suggested that locations associated
with high site fidelity are also associated with higher benthic invertebrates, but this has
not been substantiated through the collection of scientific evidence (Rusak & Mosindy,
1997; McKinley et al., 1998; Auer, 1999; Peterson et al., 2007). This study found no
significant relationship between environmental cues and the timing of Lake Sturgeon
entering, reaching their uppermost point, and exiting the Pic River. It is possible that no
significant relationship was found because the majority of Lake Sturgeon that entered the
Pic River in each year of study were there to partake in foraging and not spawning
activities. Therefore, it appears that environmental cues to migration are only applicable
to spawning individuals within a population, whereas the distribution and movements of
foraging individuals are much more strongly influenced by substrate type, depth, and
prey availability. Not only does this rationale provide an explanation for why no
significant environmental cues to migration were identified, but it also explains the
distribution of Lake Sturgeon at the lower rapids of the Pic River.
This study also determined that Lake Sturgeon left the Pic River to overwinter out
of the river, presumably in Lake Superior. Although it is not entirely clear where Lake
Sturgeon went upon leaving the Pic River, four radio tagged Lake Sturgeon were tracked
in the White River on July 12th, 2010, and one other individual was found at Oisseau Bay,
approximately 40 km south of the Pic River. As well, two Lake Sturgeon were captured
in the Pic River in 2008 that had originally been tagged in the Black Sturgeon River,
124
approximately 200 km west of the Pic River near the city of Thunder Bay, Ontario
(Dreary, 2008). Although it has been acknowledged both here and within the literature
that site fidelity and homing capabilities appear to be strong for Lake Sturgeon, these
results suggest that straying is somewhat common amongst Lake Sturgeon populations.
In light of this evidence, it is advocated that the concept of a metapopulation be given
greater consideration for Lake Sturgeon. Metapopulation dynamics have been suggested
for Lake Sturgeon in the St. Marys River (Bauman et al., 2011), for populations in the
Lower Niagara and Detroit/St. Clair Rivers (Welsh & McClain, 2001), and for White
Sturgeon in the highly fragmented Columbia River system (Jager et al., 2001; Coutant,
2004). This possibility will be investigated further in 2011 by studying Lake Sturgeon in
the White River and assessing rates of immigration and emigration. Also, a proposed
study by Fisheries and Oceans Canada and the U.S. Fish and Wildlife Service could
apply novel molecular techniques to identify to possibility of metapopulation dynamics
throughout each basin in the Laurentian Great Lakes (Tom Pratt, personal
communication).
4.2 Suitability Modeling of Lake Sturgeon Spawning Habitat:
Lake Sturgeon spawning habitat is typically associated with gravel-cobble-
boulder substrate and depths of 0.3 m to 10 m (Threader et al., 1998; Bruch &
Binkowsky, 2002; Peterson et al., 2007; Kerr et al., 2011). Using these variables, the
overall suitability of three potential spawning sites in the Pic River was assessed using a
HSM that was developed for Lake Sturgeon spawning habitat (Threader et al., 1998).
Temperature was also included in the suitability model to estimate the spawning times of
Lake Sturgeon in 2010. Empirical evidence of spawning (i.e. CPUE of eggs, larvae, and

125
ripe adults) was then compared with modeled results to determine if the HSM could
accurately predict the amount of spawning activity between each site and where
spawning activity would occur within a site. The HSM could not accurately predict which
spawning site would be most frequently used by spawning individuals, since it predicted
that the lower rapids had the greatest proportion and amount of high quality habitat, but
no evidence of spawning was collected there. Conversely, spawning evidence was
collected and both Manitou and Kagiano Falls, but the proportion and amount of high
quality habitat was far outweighed by low quality habitat at both of these sites. Despite
the HSM’s ability to predict which spawning site would be most frequently utilized by
spawning individuals, its ability to predict the timing and location of spawning within a
site was reasonably good. Lake Sturgeon eggs from Manitou Falls were collected within
close proximity of the largest patch of highly suitable spawning habitat and during the
optimal spawning times as predicted by temperature. Therefore, although the HSM for
Lake Sturgeon spawning habitat did relatively well at predicting spawning locations and
times within a site, clearly some modifications need to be made for the model to
accurately predict the relative amount of spawning activity between different spawning
sites.
To improve the predictive ability of the HSM between spawning sites, is it
recommended that the model include the relative distance of the potential spawning site
from the uppermost barrier and the presence and absence of a waterfall or comparative
hydrological feature. Topographical features, such as waterfalls that generate
hydrological complexities or underwater barchans, can be a good indicator of a potential
Lake sturgeon spawning site (Le Haye et al., 1992; Bruch & Binkowski, 2002; Perrin et

126
al., 2003; Chiotti et al., 2008). Given that most of these features pose a barrier to further
migration, the relative distance of a spawning site from the uppermost barrier should also
be considered, especially in lake-river systems such as the Pic River. Lake Sturgeon may
also spawn at the uppermost barrier to maximize gonadal and larval development times,
to increase the oxygen supply eggs for eggs, or to minimize egg predation (Auer, 1996;
Kinnison et al., 2001; Auer & Baker, 2002; Smith & King, 2005; Peterson et al., 2007;
Kerr et al., 2011). On rare occasions, spawning may occur at a location that does not
represent the uppermost barrier to migration (Harkness & Dymond, 1961; Carlson, 1995),
however the likelihood of this occurring is minimal and therefore the HSM should also
consider this variable. The embeddedness of gravel, cobble, and boulder substrates at the
lower rapids could have also reduced the likelihood of spawning occurring here; however
this is also not reflected in the HSM’s predictions. Lake Sturgeon spawning has not only
been associated with gravel-cobble-boulder substrates, but it has also been negatively
associated with habitat that lacks clean interstitial spaces or contains a thin layer of silt
(Floz & Myers, 1985; Kempinger, 1988; LeHaye et al., 1992; Manny & Kennedy, 2002;
Nichols et al., 2003; Caswell et al., 2004). New methods of measuring embeddedness
should be applied and integrated into the HSM to further improve its predictive ability
between potential spawning sites (McHugh & Budy, 2005; Senatt et al., 2007).
Daugherty et al. (2006, 2008a, 2008b) used the Lake Sturgeon HSM with depth,
substrate, and flow potential as habitat parameters, to prioritize and evaluate the cost-
benefit ratio of removing or modifying artificial impediments to migration in five
tributaries that drain into Green Bay, Lake Michigan. In this study, Daugherty et al.
(2006; 2008a; 2008b) suggest that new Lake Sturgeon habitat can be generated by

127
removing barriers and assume that individuals will automatically spawn and/or stage at
the existing habitat and at the newly accessible habitat. Using this assumption, Daugherty
et al. (2006; 2008a; 2008b) propose that dam removals on Green Bay tributaries will
result in an increase of highly suitable spawning and staging habitat 94% to 99% and
59% to 83% (respectively). I would argue against these claims of habitat generation by
barrier removal, however, since spawning Lake Sturgeon in the Pic River bypassed
suitable spawning habitat at the lower rapids in exchange for spawning habitat that was at
the uppermost barrier to migration. I believe that Lake Sturgeon in these Green Bay
tributaries would do the same and bypass the existing habitat in exchange for the habitat
at the new uppermost barrier to migration. Therefore it is plausible that Daugherty et al.
(2006; 2008a; 2008b) vastly overestimated the potential spawning and staging habitat
that could be generated by the removal of artificial impediments because they assumed
that spawning and staging would occur at both the existing and newly accessible habitat.
My argument is also supported by evidence from the Kettle River, whereby Lake
Sturgeon movements and habitat utilization did not change despite the removal
Sandstone Dam (Borkholder et al., 2002). While dam removal has increasingly been
advocated as a tool for habitat rehabilitation (Shuman, 1995; Hay-Chmielewski &
Whelan, 1997; Furlong et al., 2006; Daugherty et al, 2006), and in some cases for good
reasons, these projects should take a more holistic approach to river ecology and consider
how the entire river ecosystem will respond to the removal of artificial barriers (Roni et
al., 2008).
The obvious habitat parameter that was missing from the HSM in this study was
measurements of water flow and spatial variation in flow that exists from topographical

128
and bathymetric features. Inclusion of these data would have refined and improved the
accuracy of the HSM predictions for daily spawning suitability and estimates of the
spawning time. Although spawning has been observed at flows that range from 50 cm/s
to 200 cm/s (Threader et al., 1998; Bruch & Binkowski, 2002; Peterson et al., 2007),
however spawning has been observed at flows as low as 10 cm/s in the Lake Winnebago
system (Kempinger, 1988) and as high as 550 cm/sec in the Namakan Reservoir system
(Shaw, 2010). The collection of spatially explicit and time lapsing hydrological flow data
requires a fair amount of resources and expertise, which were unfortunately not available
to this study. Given difficulties involved in accurately measure water flow, an alternative
method has been developed that measures the flow potential of a location based on a
single point measurement (Chaudhry, 1993). This technique was used by Daugherty et al.
(2006; 2008a; 2008b) and therefore already has suitability index values associated with
respective intervals of stream flow potential. Aside from this limitation, this study did
provide a novel method for assessing substrate composition using the DIDSON camera in
turbid, remote, and difficult to access river. To date, the DIDSON camera has been used
to estimate fish abundance and sizes in various river systems (Boswell et al., 2008;
Maxwell & Gove, 2007), identify Chinook Salmon redds in the Columbia River (Tiffen
et al., 2004), and to assess underwater fish structure (Moursaud et al., 2003). However
this is the first Lake Sturgeon study to use the DIDSON camera and the first study to
apply the hand-held overboard approach to capturing footage of substrate composition.
4.3 Implications and Future Directions:
Amongst the threats that continue to impact Lake Sturgeon, hydroelectric
developments have been identified as the number one issue that continues to inhibit their

129
recovery and compromise their long-term sustainability (Auer, 1996; Rosenberg et al.,
1997; Auer, 1999; Peterson et al., 2007; Ontario Ministry of Natural Resources, 2009;
Kerr et al., 2011). More specifically, hydroelectric developments have been associated
with harming Lake Sturgeon by reducing or altering spring freshets (Zhong & Power,
1996; Haxton, 2002), reducing spawning success and recruitment through altered water
flows (Carrofino et al., 2010; Ferguson and Duckworth, 1997), altering thermal regimes
(Zhong & Power, 1996; Horne, 2004; Paragamian et al., 2001; Kappenman et al., 2009),
entrainment (Seylor, 1997a; Seylor, 1997b), reduced water quality (Zhong & Power,
1999), and impediments or barriers to access upstream spawning or foraging sites
(Ferguson & Duckworth, 1997; McLeod et al., 1999; Haxton, 2002; Knights et al., 2002;
Friday, 2005b; Daugherty et al., 2008b). These factors, or a combination of them, may
have occurred with the development of the Black River hydroelectric facility, since
several elders from Pic River First Nation reported historical spawning at this location
prior to the construction of this facility (Couchie, 2009). Hydroelectric facilities can also
influence the movements and behaviours of spawning individuals. In the Mattagami
River for example, manipulated water flows resulted in spawning at subprime locations
and compromised the likelihood of successfully reproducing (McKinley et al., 1998).
Some of these impacts can be mitigated; run-of-river facilities can reduce their impact by
establishing minimum water flows and mimicking natural hydrological cycles (Auer,
1996b and Poff et al., 1997; respectively).
Despite the concerns and impacts that are associated with hydroelectric
developments, especially when considering Lake Sturgeon, recently passed legislation in
Ontario has created socio-economic incentives for producers of renewable energy, which

130
has led to the proposal and development of many new hydroelectric facilities (Green
Energy Act, 2009) (Figure 4.2). On April 28th, 2009, Pic River First Nation procured the
hydroelectric rights to Manitou Falls and has proposed to construct a 2.8MW run-of-river
generating station at this location (Figure 4.1). The results of this study have indicated
that Manitou Falls is the most likely spawning site that contributes to the natural
recruitment of Lake Sturgeon on an annual basis (Chapter 3). As well, the location of the
proposed dam will inevitably influence water flow and thermal regimes at the location
where definitive evidence of spawning (eggs and visual observations) was collected
(King, 2010).
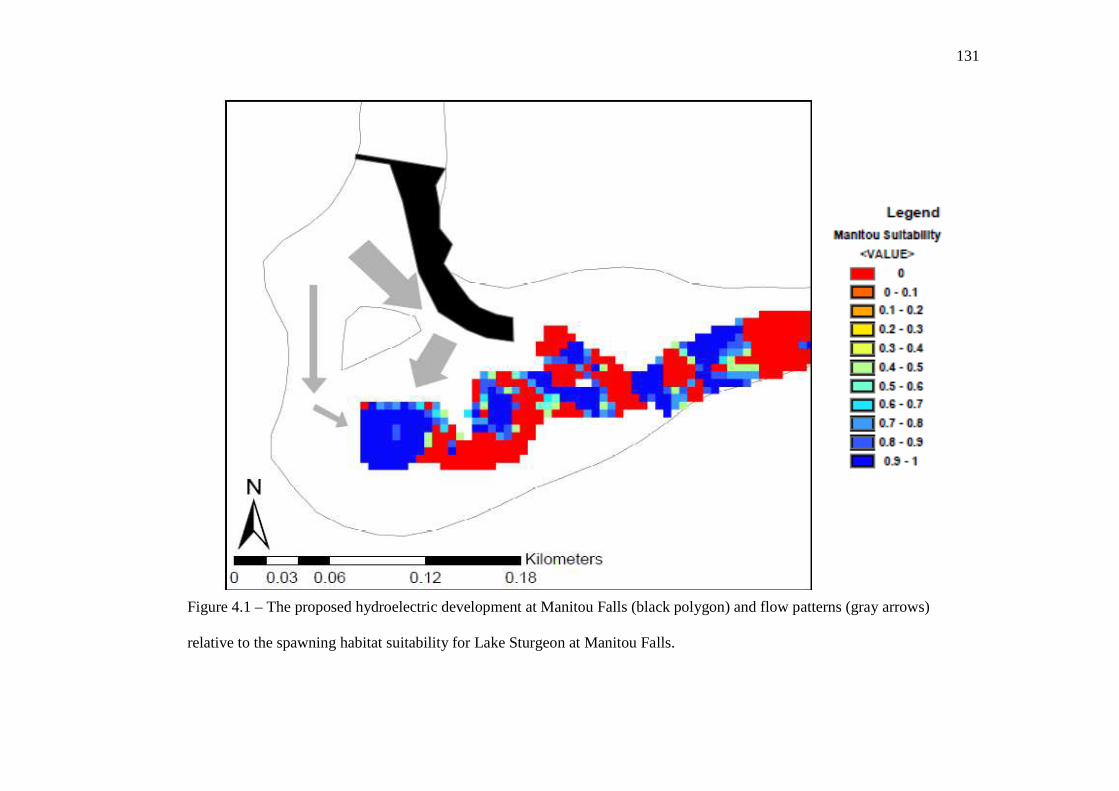
131
Figure 4.1 – The proposed hydroelectric development at Manitou Falls (black polygon) and flow patterns (gray arrows)
relative to the spawning habitat suitability for Lake Sturgeon at Manitou Falls.
132
Despite the relatively minimal amount of impact that run-of-river generating
stations have, they do still alter Lake Sturgeon spawning behaviour and can negatively
impact recruitment (Auer, 1999). The Endangered Species Act of Ontario, makes it
illegal to kill, harm, harass, or capture a threatened species, a classification that Lake
Sturgeon were given in September of 2009 (Endangered Species Act, 2007; Ontario
Ministry of Natural Resources, 2009). Based on results from the spawning assessments,
habitat suitability modeling, and movement patterns, it seems likely that Lake Sturgeon
will be harassed and/or harmed during the construction and subsequent operation of the
Manitou Falls generating station. It is strongly recommended that the evidence provided
within this report be considered in the approvals and planning of the Manitou Falls
generating station and more broadly throughout all proposed hydroelectric developments
in Ontario (Figure 4.2).
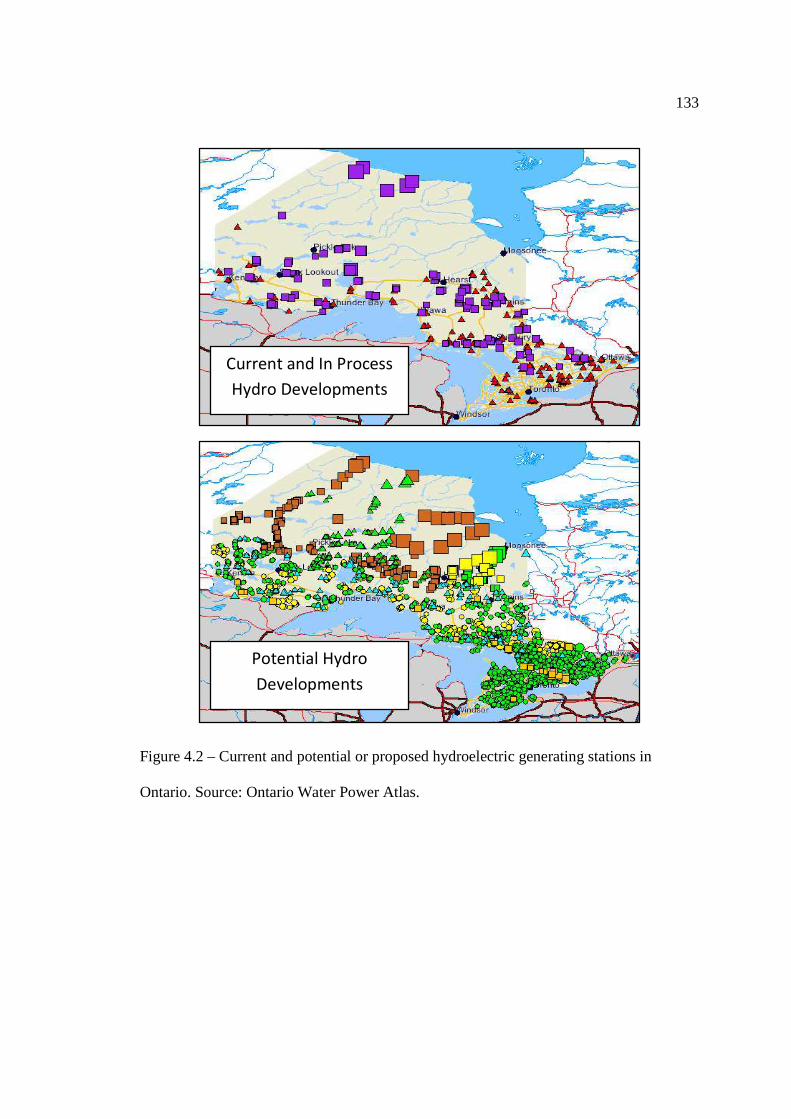
133
Figure 4.2 – Current and potential or proposed hydroelectric generating stations in
Ontario. Source: Ontario Water Power Atlas.
Current and In Process
Hydro Developments
Potential Hydro
Developments

134
This thesis successfully identified critical habitat and movement patterns in the
Pic River, related the timing of movements to abiotic conditions, and evaluated the
predictive ability for a Lake Sturgeon HSM that enables the quantitative assessment of
spawning habitat suitability. Beyond the tributary specific implications of this research
that were discussed above, this research provides a significant contribution towards
identified research needs for Lake Sturgeon in Lake Superior and throughout the Great
Lakes basin, especially because it is the first academic report that focuses specifically on
the Pic River tributary. A spatially explicit HSM for spawning habitat was also evaluated,
which could be used as a management tool for Lake Sturgeon biologists to predict and
prioritize spawning locations based on habitat parameters alone (Daugherty et al., 2008a;
Daugherty et al., 2008b). Based on the results and discussion from this research, it is
suggested that future studies should further investigate the relationship between Lake
Sturgeon and their prey biomass, the possibility of metapopulation dynamics between
populations, the predictive ability of the HSM with spatially variable flow data and a
greater collection of eggs, and most importantly, continue to monitor Lake Sturgeon
movements upon the construction of Manitou Falls generating station to determine if
movements are negatively influenced by its operation.

135
APPENDIX
Appendix 1: Proportion of each substrate type at the lower rapids, Manitou Falls, and
Kagiano Falls. Appendix includes Figure 3.1 to Figure 3.21 and relates to
Section 3.3.1.
.

136
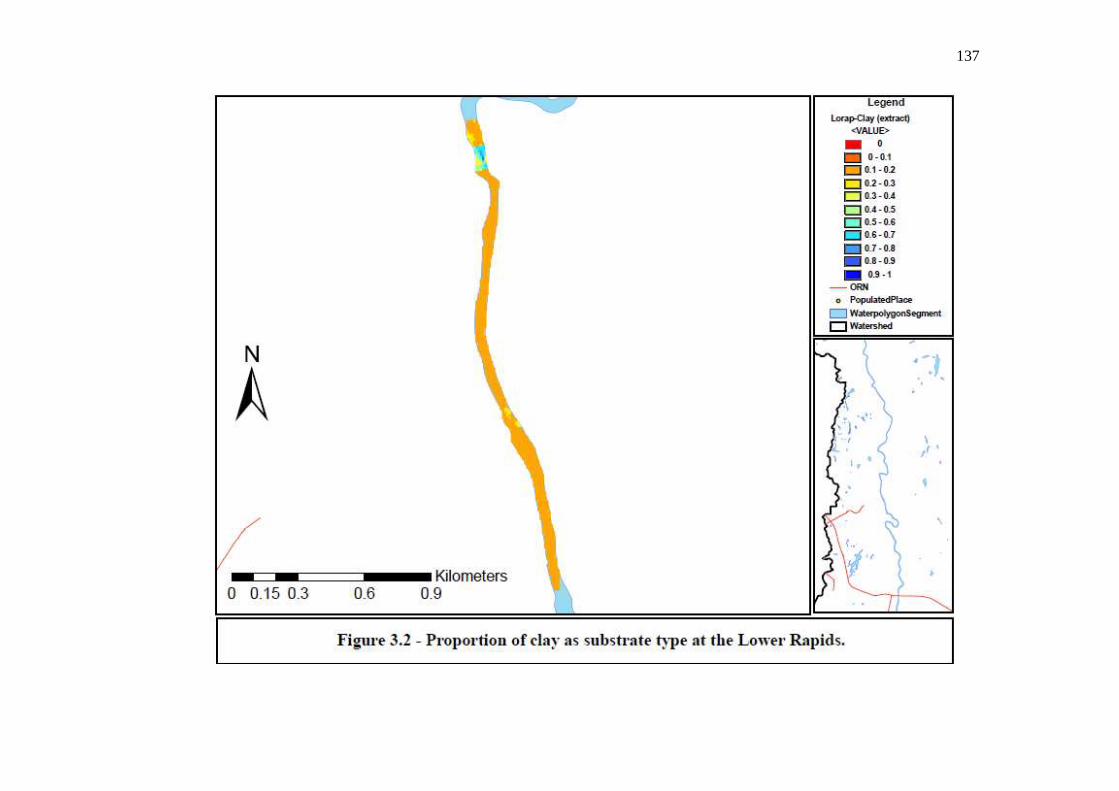
137
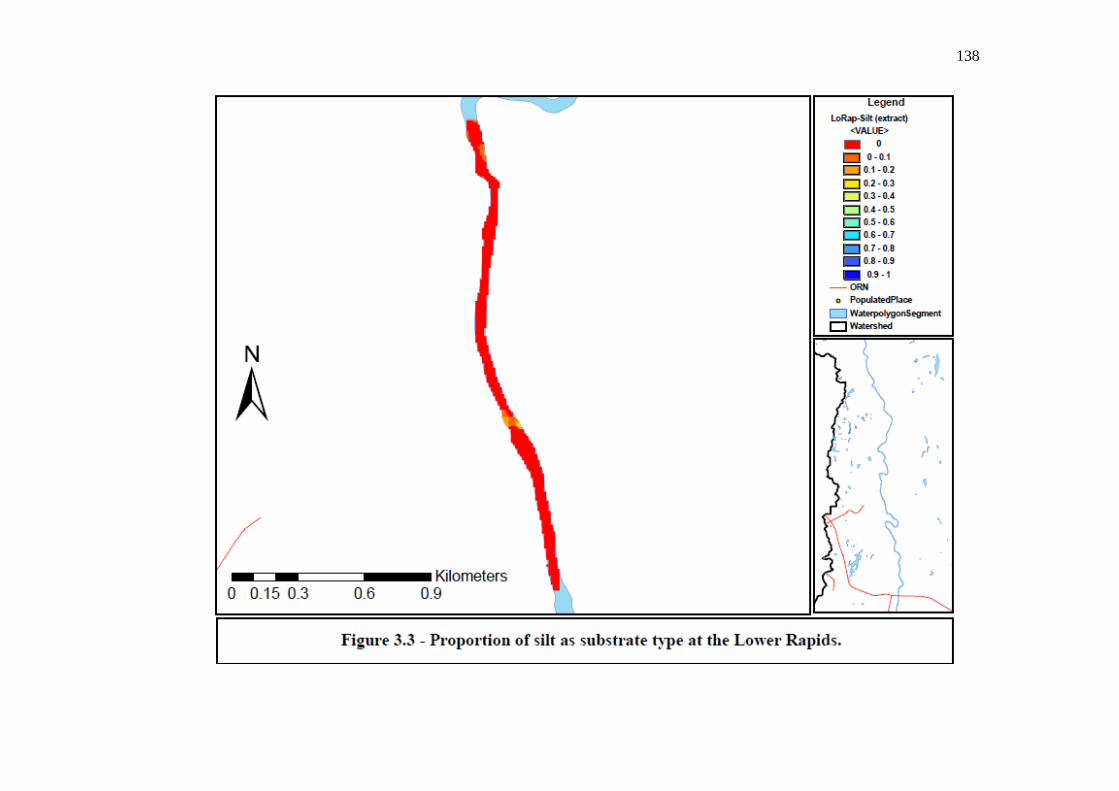
138

139
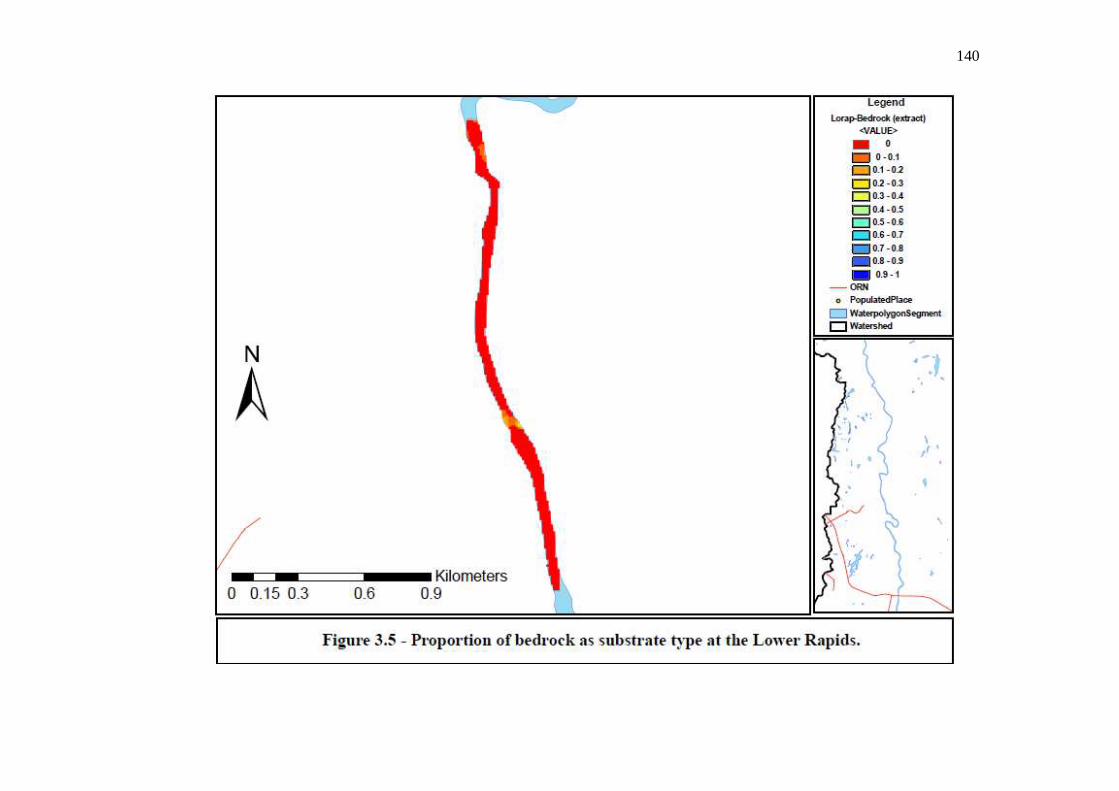
140
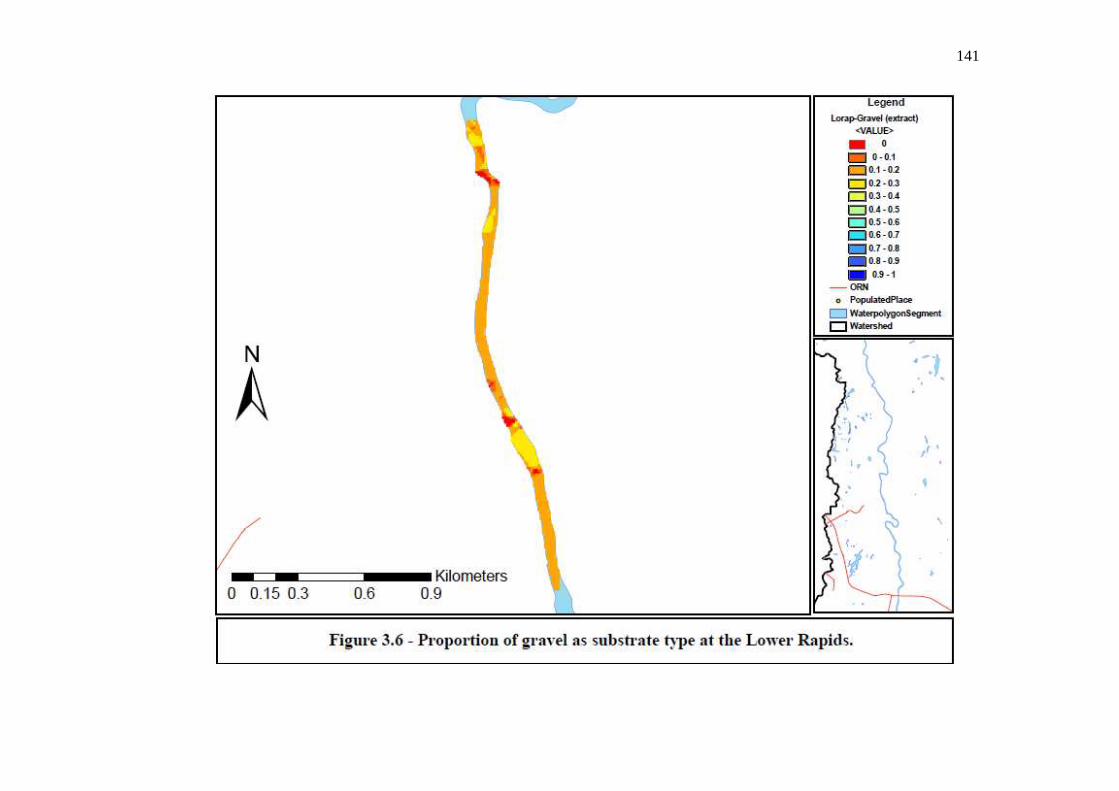
141
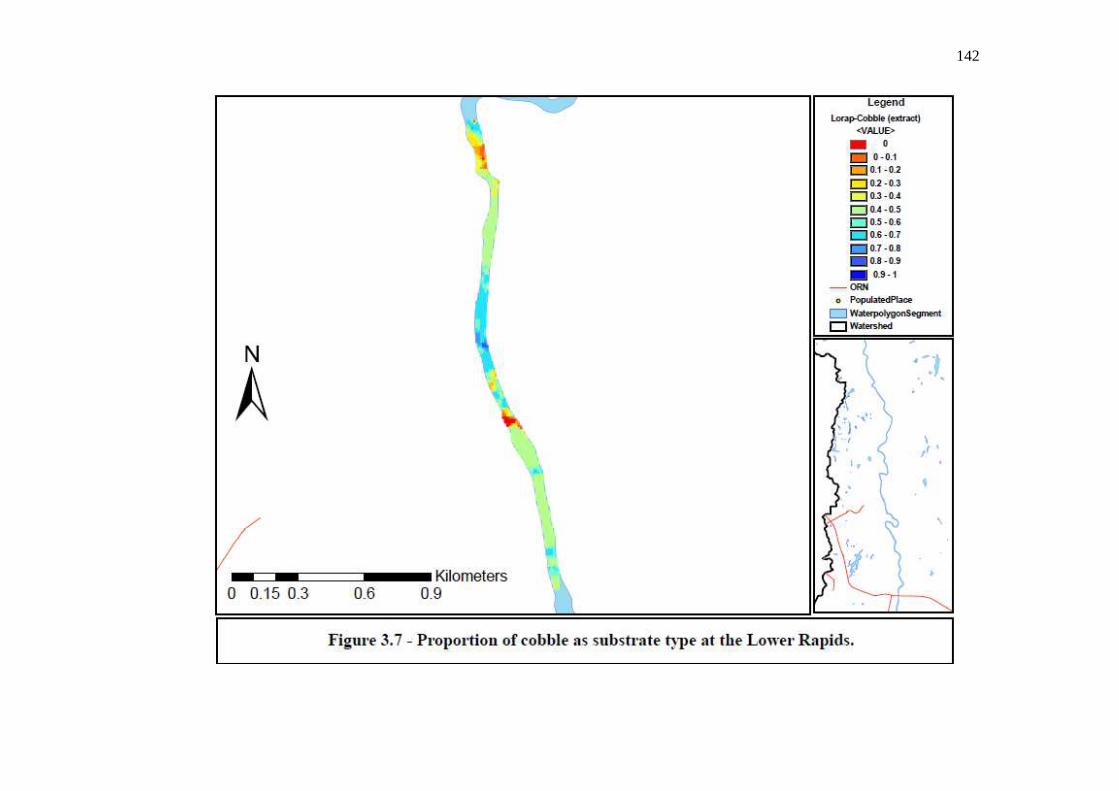
142
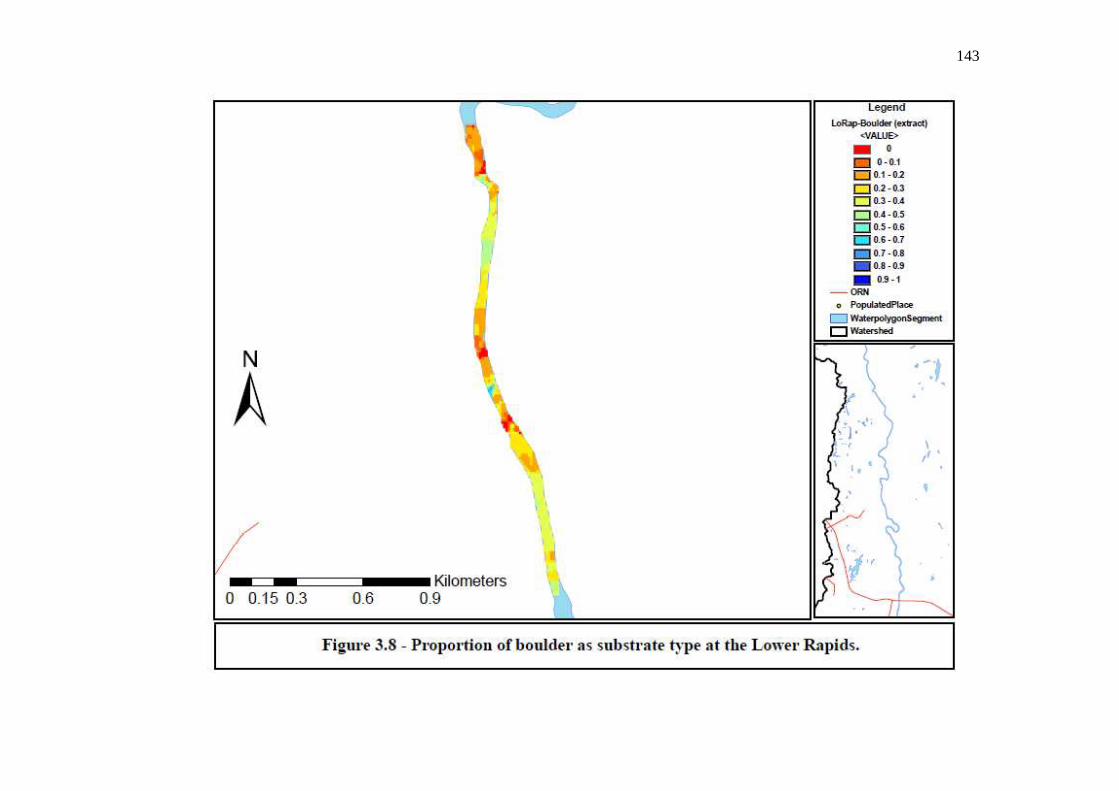
143
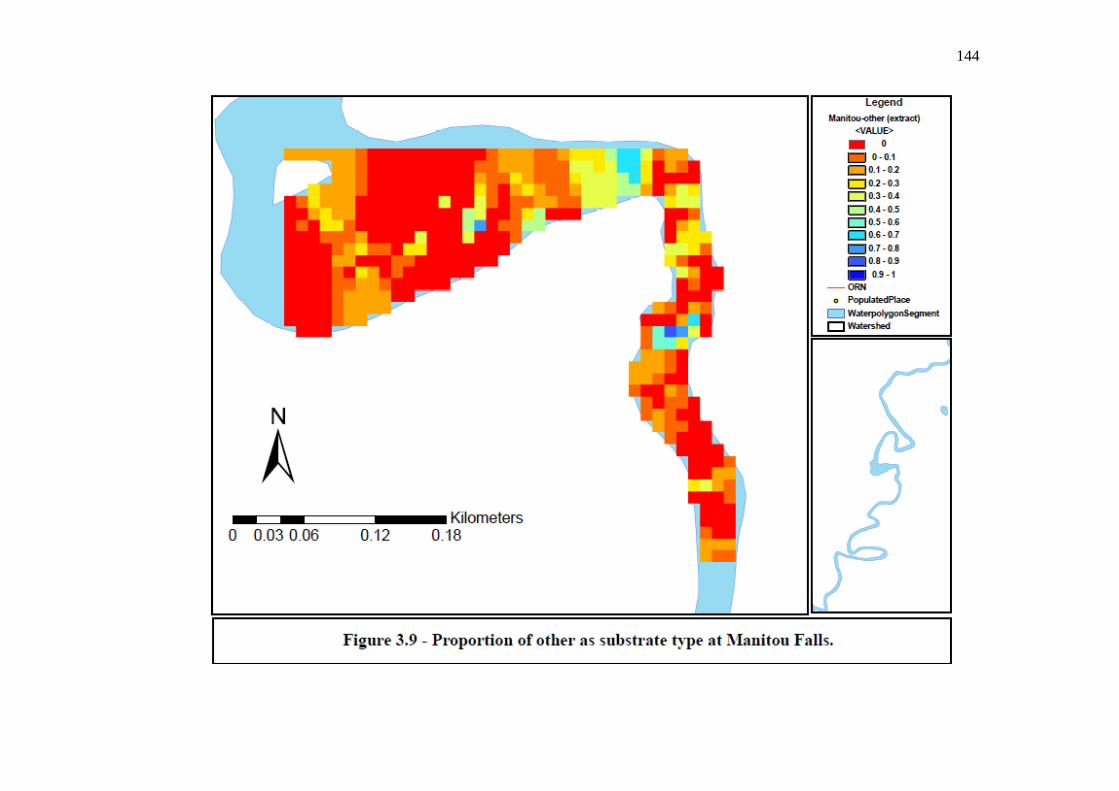
144
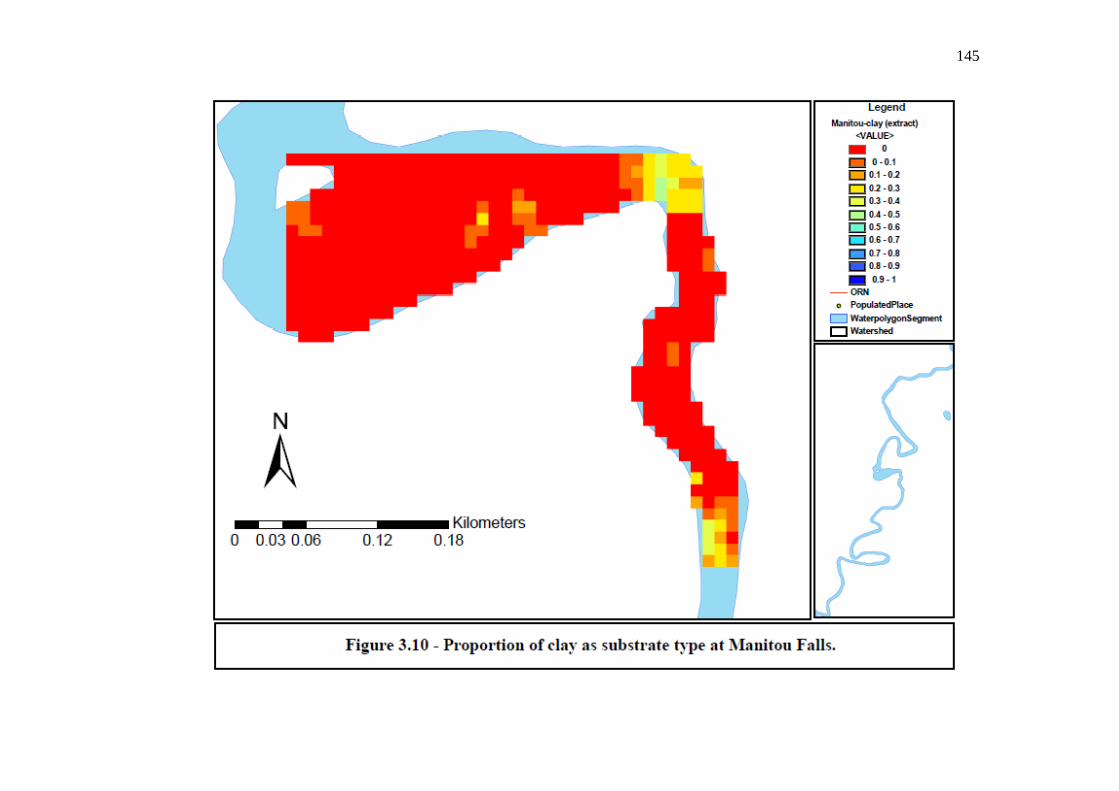
145
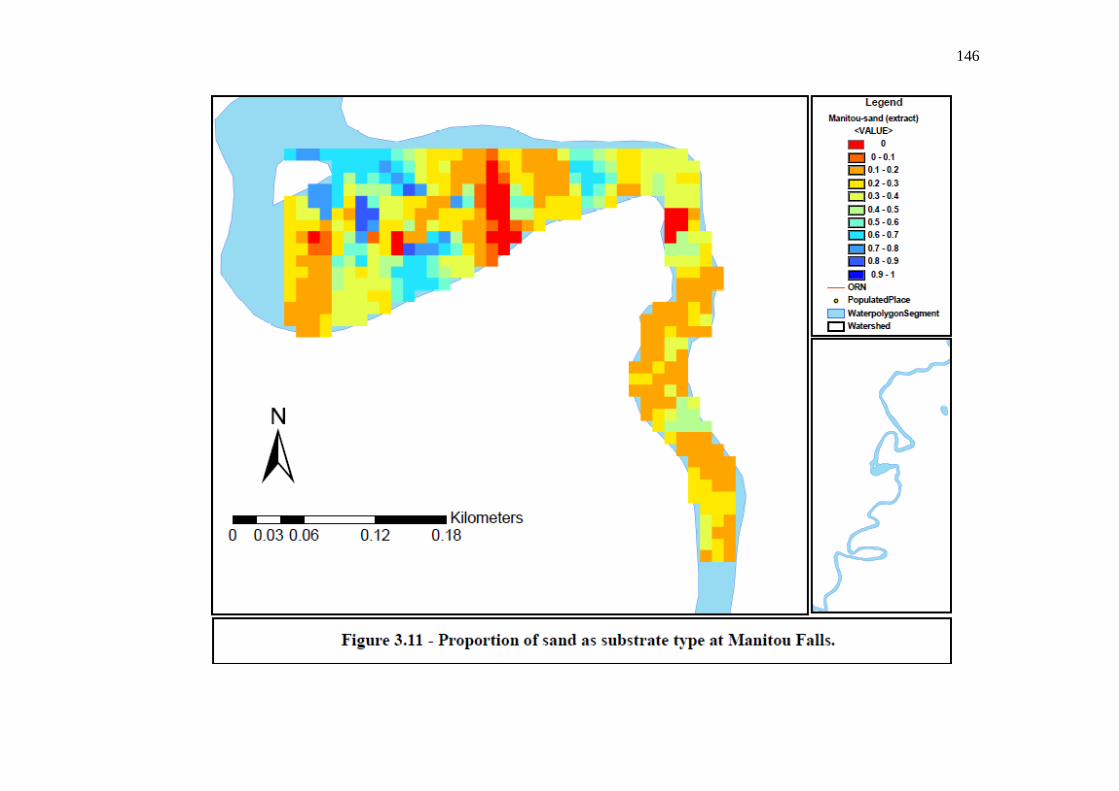
146

147
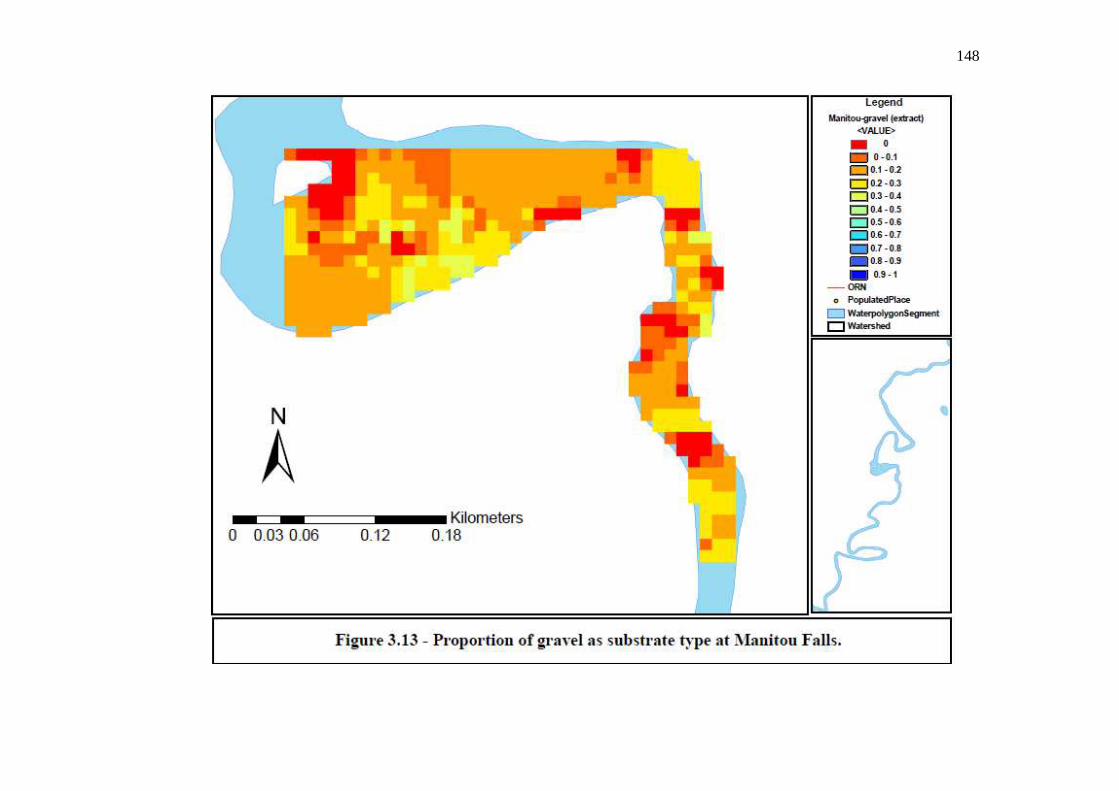
148
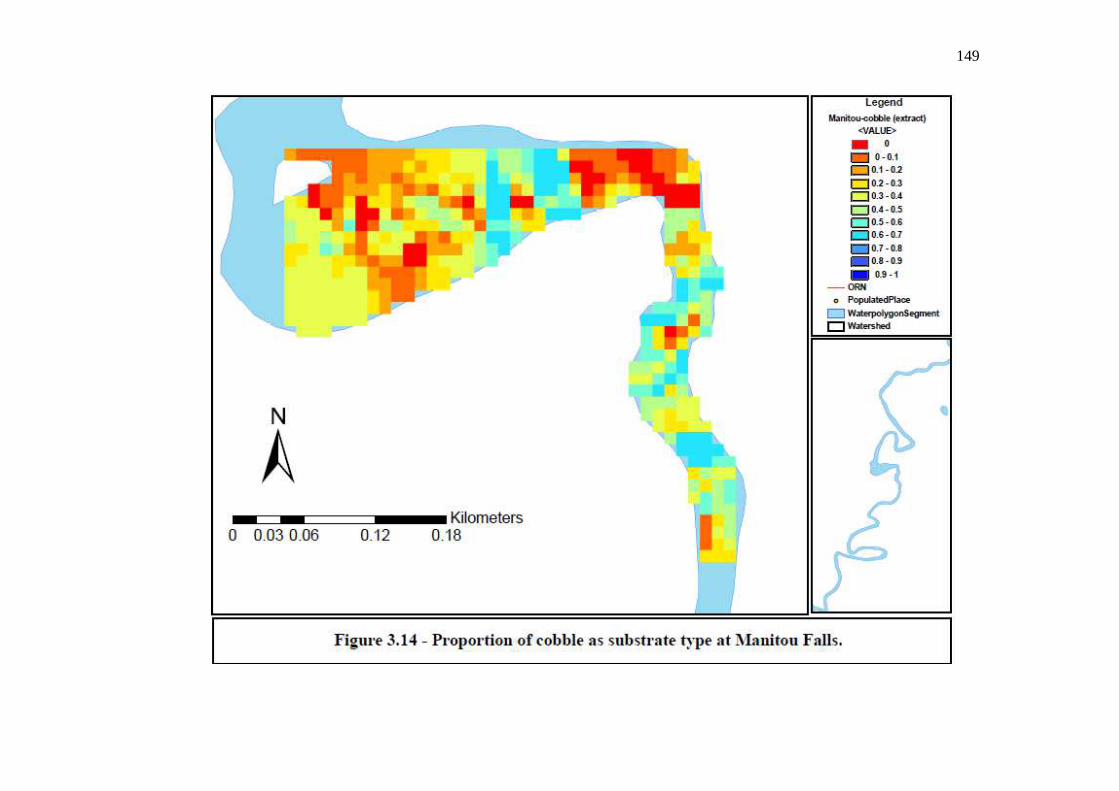
149
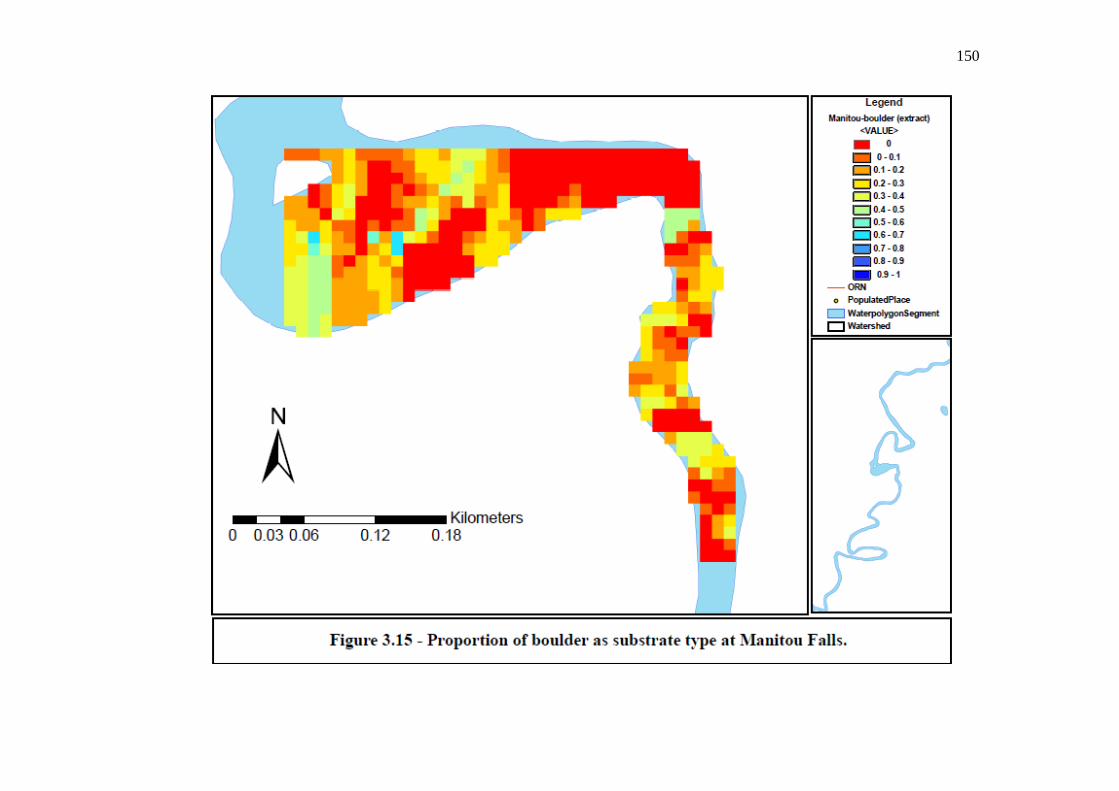
150

151
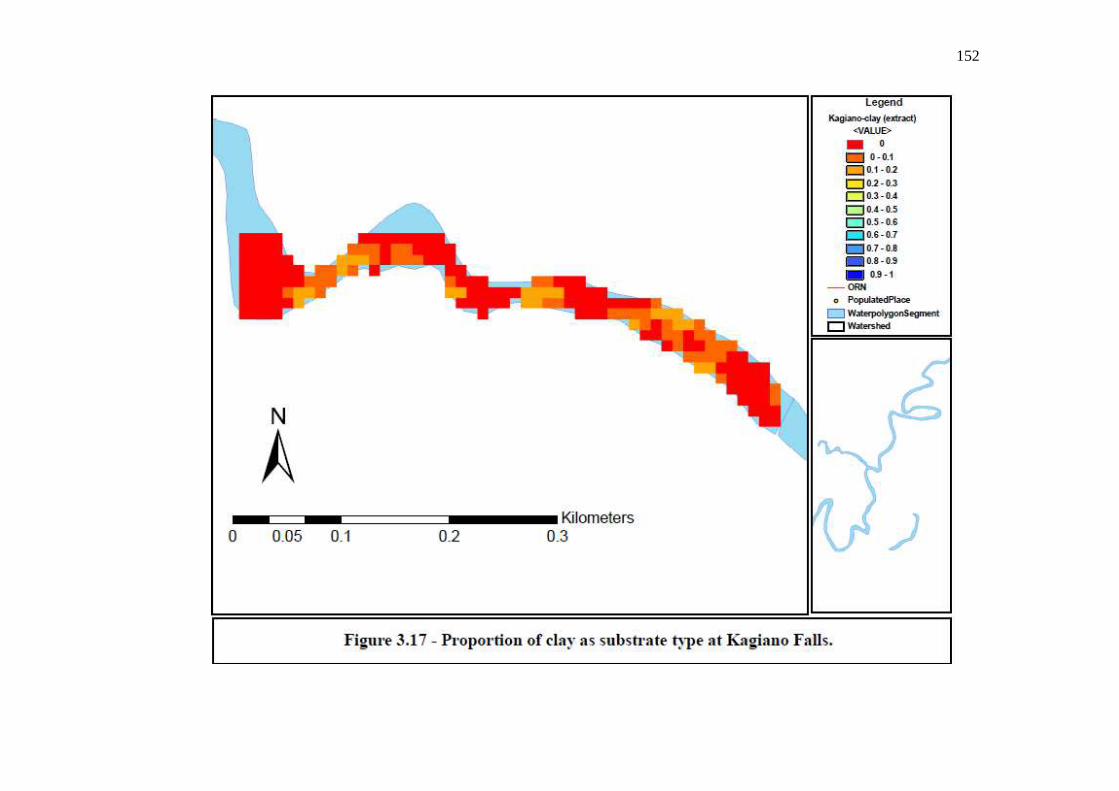
152

153

154

155
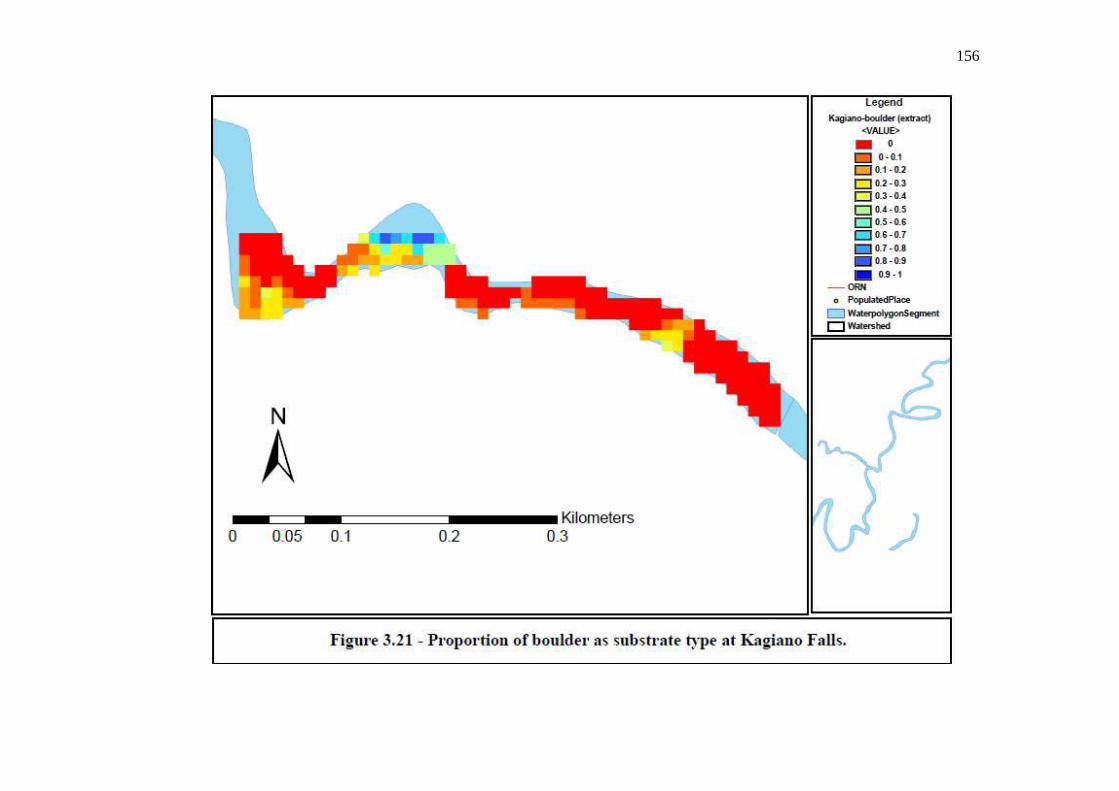
156
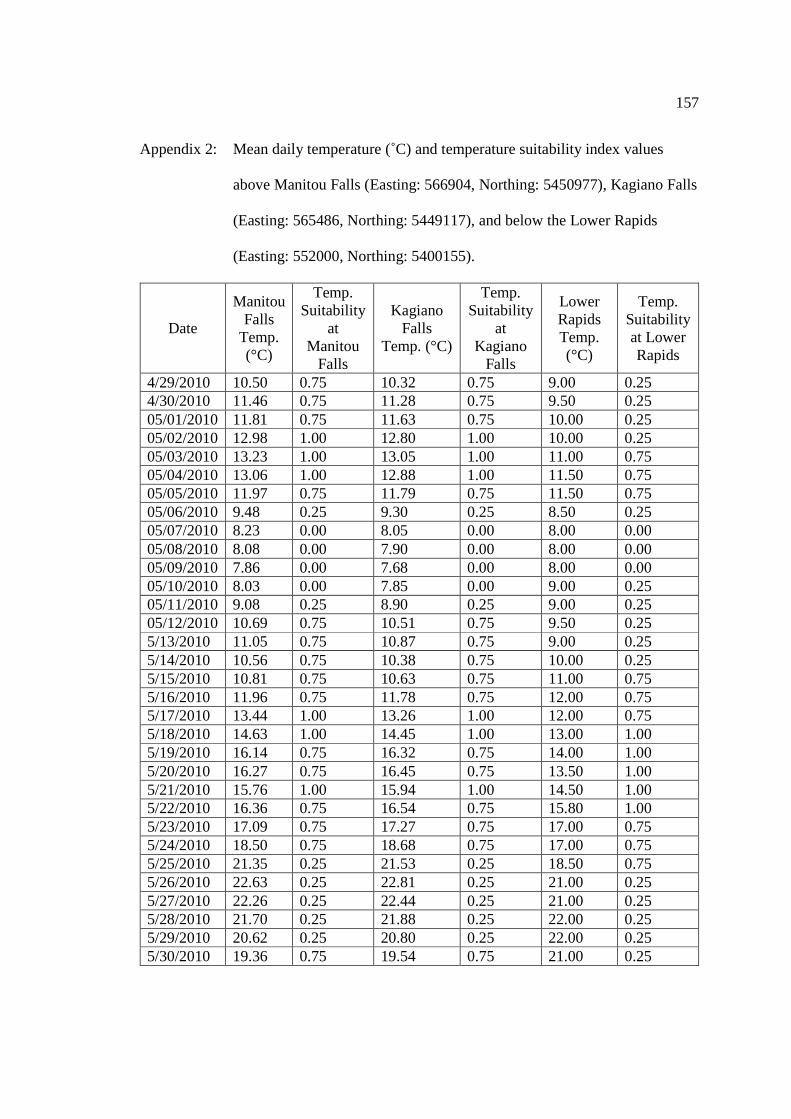
157
Appendix 2: Mean daily temperature (˚C) and temperature suitability index values
above Manitou Falls (Easting: 566904, Northing: 5450977), Kagiano Falls
(Easting: 565486, Northing: 5449117), and below the Lower Rapids
(Easting: 552000, Northing: 5400155).
Date
Manitou Falls
Temp. (°C)
Temp. Suitability
at Manitou
Falls
Kagiano Falls
Temp. (°C)
Temp. Suitability
at Kagiano
Falls
Lower Rapids Temp. (°C)
Temp. Suitability at Lower Rapids
4/29/2010 10.50 0.75 10.32 0.75 9.00 0.25 4/30/2010 11.46 0.75 11.28 0.75 9.50 0.25 05/01/2010 11.81 0.75 11.63 0.75 10.00 0.25 05/02/2010 12.98 1.00 12.80 1.00 10.00 0.25 05/03/2010 13.23 1.00 13.05 1.00 11.00 0.75 05/04/2010 13.06 1.00 12.88 1.00 11.50 0.75 05/05/2010 11.97 0.75 11.79 0.75 11.50 0.75 05/06/2010 9.48 0.25 9.30 0.25 8.50 0.25 05/07/2010 8.23 0.00 8.05 0.00 8.00 0.00 05/08/2010 8.08 0.00 7.90 0.00 8.00 0.00 05/09/2010 7.86 0.00 7.68 0.00 8.00 0.00 05/10/2010 8.03 0.00 7.85 0.00 9.00 0.25 05/11/2010 9.08 0.25 8.90 0.25 9.00 0.25 05/12/2010 10.69 0.75 10.51 0.75 9.50 0.25 5/13/2010 11.05 0.75 10.87 0.75 9.00 0.25 5/14/2010 10.56 0.75 10.38 0.75 10.00 0.25 5/15/2010 10.81 0.75 10.63 0.75 11.00 0.75 5/16/2010 11.96 0.75 11.78 0.75 12.00 0.75 5/17/2010 13.44 1.00 13.26 1.00 12.00 0.75 5/18/2010 14.63 1.00 14.45 1.00 13.00 1.00 5/19/2010 16.14 0.75 16.32 0.75 14.00 1.00 5/20/2010 16.27 0.75 16.45 0.75 13.50 1.00 5/21/2010 15.76 1.00 15.94 1.00 14.50 1.00 5/22/2010 16.36 0.75 16.54 0.75 15.80 1.00 5/23/2010 17.09 0.75 17.27 0.75 17.00 0.75 5/24/2010 18.50 0.75 18.68 0.75 17.00 0.75 5/25/2010 21.35 0.25 21.53 0.25 18.50 0.75 5/26/2010 22.63 0.25 22.81 0.25 21.00 0.25 5/27/2010 22.26 0.25 22.44 0.25 21.00 0.25 5/28/2010 21.70 0.25 21.88 0.25 22.00 0.25 5/29/2010 20.62 0.25 20.80 0.25 22.00 0.25 5/30/2010 19.36 0.75 19.54 0.75 21.00 0.25

158
5/31/2010 20.01 0.25 20.19 0.25 20.00 0.75 06/01/2010 19.39 0.75 19.57 0.75 19.00 0.75 06/02/2010 17.61 0.75 17.79 0.75 20.00 0.75 06/03/2010 17.61 0.75 17.79 0.75 19.50 0.75 06/04/2010 17.65 0.75 17.83 0.75 19.00 0.75 06/05/2010 17.10 0.75 17.28 0.75 18.00 0.75 06/06/2010 16.40 0.75 16.22 0.75 18.00 0.75 06/07/2010 16.34 0.75 16.16 0.75 16.00 1.00 06/08/2010 16.96 0.75 16.70 0.75 17.00 0.75 06/09/2010 17.19 0.75 16.93 0.75 17.00 0.75 06/10/2010 15.98 1.00 15.72 1.00 17.00 0.75 06/11/2010 16.51 0.75 16.25 0.75 17.50 0.75 06/12/2010 16.44 0.75 16.18 0.75 17.50 0.75 6/13/2010 17.16 0.75 16.90 0.75 17.50 0.75 6/14/2010 17.34 0.75 17.08 0.75 18.00 0.75 6/15/2010 18.47 0.75 18.21 0.75 18.00 0.75 6/16/2010 19.09 0.75 18.83 0.75 18.50 0.75 6/17/2010 20.29 0.25 20.03 0.25 19.00 0.75 6/18/2010 21.50 0.25 21.24 0.25 19.00 0.75 6/19/2010 21.56 0.25 21.01 0.25 19.00 0.75 6/20/2010 20.14 0.25 19.59 0.25 20.00 0.75 6/21/2010 20.36 0.25 19.81 0.25 20.50 0.25 6/22/2010 20.56 0.25 20.01 0.25 20.00 0.75 6/23/2010 20.09 0.25 19.54 0.25 19.00 0.75 6/24/2010 20.29 0.25 19.74 0.25 18.00 0.75 6/25/2010 20.08 0.25 19.53 0.25 20.00 0.75 6/26/2010 20.18 0.25 19.63 0.25 19.40 0.75 6/27/2010 20.28 0.25 19.73 0.25 19.00 0.75 6/28/2010 18.34 0.75 17.79 0.75 19.00 0.75 6/29/2010 17.23 0.75 16.68 0.75 19.20 0.75 6/30/2010 17.48 0.75 16.93 0.75 19.00 0.75 07/01/2010 18.56 0.75 18.01 0.75 19.00 0.75 07/02/2010 20.28 0.25 19.73 0.25 19.50 0.75 07/03/2010 21.31 0.25 20.76 0.25 19.00 0.75 07/04/2010 20.18 0.25 19.63 0.25 20.00 0.75 07/05/2010 20.93 0.25 20.38 0.25 19.50 0.75 07/06/2010 22.81 0.25 22.93 0.25 20.00 0.75 07/07/2010 23.83 0.00 23.95 0.00 21.00 0.25 07/08/2010 24.30 0.00 24.42 0.00 21.80 0.25 07/09/2010 23.67 0.00 23.79 0.00 22.50 0.25 07/10/2010 23.28 0.25 23.40 0.25 23.00 0.25 07/11/2010 22.86 0.25 22.98 0.25 24.00 0.00 07/12/2010 21.63 0.25 21.75 0.25 24.00 0.00 7/13/2010 22.18 0.25 22.30 0.25 23.00 0.25 7/14/2010 22.59 0.25 22.71 0.25 23.00 0.25

159
7/15/2010 22.99 0.25 23.11 0.25 22.00 0.25 7/16/2010 23.00 0.25 23.12 0.25 22.00 0.25 7/17/2010 21.89 0.25 22.01 0.25 23.00 0.25 7/18/2010 21.28 0.25 21.40 0.25 21.89 0.25 7/19/2010 21.25 0.25 21.37 0.25 21.28 0.25 7/20/2010 21.95 0.25 22.07 0.25 21.25 0.25 7/21/2010 21.58 0.25 21.70 0.25 21.95 0.25 7/22/2010 21.45 0.25 21.42 0.25 21.58 0.25 7/23/2010 22.28 0.25 22.25 0.25 21.45 0.25 7/24/2010 21.25 0.25 21.22 0.25 22.28 0.25 7/25/2010 21.16 0.25 21.13 0.25 21.25 0.25 7/26/2010 22.23 0.25 22.20 0.25 21.16 0.25 7/27/2010 22.71 0.25 22.68 0.25 22.23 0.25 7/28/2010 22.33 0.25 22.30 0.25 22.71 0.25 7/29/2010 21.31 0.25 21.28 0.25 22.33 0.25 7/30/2010 20.54 0.25 20.51 0.25 21.31 0.25
160
REFERENCES: Primary Sources Ackerman, P.A., J.D. Morgan, and G.K. Iwama. 2000. Fish Anesthetics. Unpublsihed.
Canadian Council for Animal Care. Technical Report. (pp22). Adams, N.S., D.W. Rondorf, S.D. Evans, J.E. Kelly, and R.W. Perry. 1998. Effects of
surgically and gastrically implanted radio transmitters on swimming performance and predator avoidance of juvenile Chinook salmon (Oncorhynchus tshawytschai). Canadian Journal of Fisheries and Aquatic Sciences, 55: 781-787.
Adams, W.E. 2004. Lake Sturgeon biology in Rainy Lake, Minnesota and Ontario. South
Dakota State University, Ann Arbor, Michigan. (pp106). Adams, W.E., L.W. Kallemeyn, and D.W. Wallis. 2006. Lake Sturgeon population
characteristics in Rainy Lake, Minnesota and Ontario. Journal of Applied Ichthyology, 22: 97-102.
Anderson, J.J., and W.N. Beer. 2009. Oceanic, riverine, and genetic influences on spring
Chinook salmon migration timing. Ecological Applications, 19: 1989-2003. Auer, N.A. 1996. Response of spawning Lake Sturgeon to change in hydroelectric
facility operation. Transactions of the American Fisheries Society, 125: 66-77. Auer, N.A. 1996. Importance of habitat and migration to sturgeons with emphasis on lake
sturgeon. Canadian Journal of Fisheries and Aquatic Sciences, 53: 152-160. Auer, N.A. 1999. Population characteristics and movements of Lake Sturgeon in the
Sturgeon River and Lake Superior. Journal of Great Lakes Research, 25: 282-293. Auer, N.A., and E.A. Baker. 2002. Duration and drift of larval lake sturgeon in the
Sturgeon River. Michigan Journal of Applied Ichthyology, 18: 557-564. Auer, N.A. 2003. A lake sturgeon rehabilitation plan for Lake Superior. Department of
Biological Sciences. Michigan Technology University. Houghton, Michigan. (pp28).
Baker, E.A., and D.J. Borgeson. 1999. Lake sturgeon abundance and harvest in Black
Lake, Michigan, 1975-1999. North American Journal of Fisheries Management, 19: 1080-1088.
Baldwin, N.S., R.W. Saalfeld, M.A. Ross, and J.J. Buettner. 1979. Commercial fish
production in the Great Lakes 1867-1977. Great Lakes Fisheries Commission. Ann Arbor, Michigan. Technical Report #3. (pp53).

161
Bardonnet, A. and J.L. Bagliniere. 2000. Freshwater habitat of Atlantic salmon (Salmo salar). Canadian Journal of Fisheries and Aquatic Sciences, 57: 497-506.
Barth, C.C., S.J. Peake, P.J. Allen, and W.G. Anderson. 2009. Habitat utilization of
juvenile lake sturgeon, Acipenser fulvescens, in a large Canadian river. Journal of Applied Ichtyology, 25: 18-26.
Bauman, J.M., A. Moerke, R. Greil, B. Gerig, E. Baker, and J Chiotti. 2011. Population
demographics of lake sturgeon (Acipenser fulvescens) in the St. Marys River, from 2000 to 2007. Journal of Great Lakes Research, in press.
Beasmish, F.W.H., J.A. Jebbink, A. Rossiter, and D.L.G. Noakes. 1996. Growth strategy
of juvenile lake sturgeon (Acipenser fulvescens) in a northern river. Canadian Journal of Fisheries and Aquatic Sciences, 53: 481-489.
Bemis, W.E., and B. Kynard. 1997. Sturgeon rivers: an introduction to acipenseriform
biogeography and life history. Environmental Biology of Fishes, 48: 167-183. Benson, A.C., T.M. Sutton, R.F. Elliot, and T.G. Meronek. 2005. Seasonal movement
patterns and habitat preferences of Age-0 Lake Sturgeon in the Lower Peshtigo River, Wisconsin. Transactions of the North American Fisheries Society, 134: 1400-1409.
Block, B.A., S.L.H. Teo, A. Walli, A. Boustany, M.J.W. Stokesbury, C.J. Farwell, K.C.
Weng, H. Dewar, and T.D. Williams. 2005. Electronic tagging and population structure of Atlantic bluefin tuna. Nature, 434: 1121-1127.
Bolstad, R.M. 2002. GIS fundamentals: a first text on geographic information systems.
Eider Press: White Bear Lake, MN. (pp102). Boogard, M.A., T.D. Bills, and D.A. Johnson. 2003. Acute toxicity of TFM and a
TFM/niclosamide mixture to selected species of fish, including lake sturgeon (Acipenser fulvescens) and mudpuppies (Necturus maculosus), in laboratory and field exposures. Journal of Great Lakes Research, 29: 529-541.
Borkholder, B.D., S.D. Morse, H.T. Weaver, R.A. Hugill, A.T. Linder, L.M.
Schwarzkopf, T.E. Perrault, M.J. Zacher, and J.A. Frank. 2002. Evidence of a year-round resident population of Lake Sturgeon in the Kettle River, Minnesota, based on radiotelemetry and tagging. North American Journal of Fisheries Management, 22: 888-894.
Boswell, K.M., M.P. Wilson, and J.H. Cowan Jr.. 2008. A semiautomated approach to
estimating fish size, abundance, and behaviour from dual-frequency identification sonar (DIDSON) data. North American Journal of Fisheries Management, 28: 799-807.

162
Bray, K.E. 1996. Habitat models as tools for evaluating historic change in the St. Marys River. Canadian Journal of Fisheries and Aquatic Sciences, 53 88-98.
Brooks, R.P. 1997. Improving habitat suitability index models. Wildlife Society Bulletin,
125: 163-167. Brown, R.S., S.J. Cooke, W.G. Anderson, and R.S. McKinley. 1999. Evidence to
challenge the “2% rule” for biotelemetry. North American Journal of Fisheries Management, 19: 867-871.
Bruch, R.M., T.A. Dick, and A. Choudhury. 2001. A field guide to the identification of
stages of gonad development in lake sturgeon (Acipenser fulvescens: Rafinesque): with notes on lake sturgeon reproduction biology and management implications. Unpublished. Sturgeon for Tomorrow and Wisconsin Department of Natural Resources. (pp38).
Bruch, R.M., and F.P. Binkowski. 2002. Spawning behaviour of Lake Sturgeon
(Acipenser fulvescens). Journal of Applied Ichtyology, 18: 570-579. Bruch, R.M., G. Miller, M.J. Hansen. 2006. Fecundity of Lake Sturgeon (Acipenser
fulvescens, Rafinesque) in Lake Winnebago, Wisconsin, USA. Journal of Applied Ichtyology, 22: 116-118.
Burgman, M.A., D.R. Breininger, B.W. Duncan, and S. Ferson. 2001. Setting reliability
bounds on habitat suitability indices. Ecological Applications, 11: 70-78. Cano, J.M., H.S. Makinen, and J. Merila. 2008. Genetic evidence for male-biased
dispersal in the three-spined stickleback (Gasterosteus aculaetus). Molecular Ecology, 17: 3234-3242.
Carlson, D.M. 1995. Lake Sturgeon waters and fisheries in New York State. Journal of
Great Lakes Research, 21: 35-41. Caroffino, D.C., T.M. Sutton, R.F. Elliot, and M.C. Donofrio. 2010. Predation on early
life stages of Lake Sturgeon in the Peshtigo River, Wisconsin. Transactions of the American Fisheries Society, 139: 1846-1856.
Caswell, N.M., D.L. Peterson, B.A. Manny, and G.W. Kennedy. 2004. Spawning by lake
sturgeon (Acipenser fulvescens) in the Detroit River. Journal of Applied Ichthyology, 20: 1-6.
Chaudry, M.H. 1993. Open-channel flow. Prentice Hall Inc. Upper Saddle River, New
Jersey. (pp283).
163
Chiotti, J.A., J.M. Holtgren, N.A. Auer, and S.A. Ogren. 2008. Lake Sturgeon spawning habitat in the Big Manistee River, Michigan. North American Journal of Fisheries Management, 28, 1009-1019.
Chen, Y-B., and B-F Wu. 2011. Impact analysis of the Three-Gorges project on the
spawning of Chinese Sturgeon, Acipenser sinensis. Journal of Applied Ichthyology, 27: 383-386.
Choudhury, A., R. Bruch, and T.A. Dick. 1996. Helminths and food habitats of Lake
Sturgeon Acipenser Fulvescens from the Lake Winnebago System, Wisconsin. American Midland Naturalist, 135: 274-282.
Cianfrani, C., G. Le Lay, A.H. Hirzel, and A. Loy. 2010. Do habitat suitability models
reliably predict the recovery areas of threatened species? Journal of Applied Ecology, 47: 421-430.
COSEWIC 2006. COSEWIC assessment and update status report on the lake sturgeon
Acipenser fulvescens in Canada. Committee on the Status of Endangered Wildlife in Canada. Ottawa, Ontario. (pp107).
Couchie, D. 2009. Traditional Ecological Knowledge Survey with Pic River First Nation
Elders on Lake Sturgeon in the Pic River. Unpublished. Anishinabek/Ontario Fisheries Resource Centre; Technical Report. (pp5).
Coutant, C.C. 2004. A riparian habitat hypothesis for successful reproduction of White
Sturgeon. Review in Fisheries Sciences, 12: 23-73. Daugherty, D.J. 2006. Development and implementation of habitat availability models to
determine Lake Sturgeon restoration strategies in northern Lake Michigan tributaries. Purdue University, West Virginia. (pp226).
Daugherty, D.J., T.M. Sutton, and R.F. Elliot. 2008a. Potential for reintroduction of lake
sturgeon in five northern Lake Michigan tributaries: a habitat suitability perspective. Aquatic Conservation: Marine and Freshwater Ecosystems, 18: 692-702.
Daugherty, D.J., T.M. Sutton, and R.F. Elliot. 2008b. Suitability modeling of Lake
Sturgeon habitat in hive northern Lake Michigan tributaries: implications for population rehabilitation. Restoration Ecology, 17: 245-257.
Deary, C. 2008. Lake Sturgeon (Acipenser fulvescens) Migration Patterns in the Pic
River, ON, 2008. Unpublished. Anishinabek/Ontario Fisheries Resource Centre; Technical Report. (pp13).

164
Devore, J.D., B.W. James, C.A. Tracy, and D.A. Hale. 1995. Dynamics and potential production of White Sturgeon in the unimpounded Lower Columbia River. Transactions of the American Fisheries Society, 124: 845-856.
Drauch, A.M., and O.E. Rhodes Jr.. 2007. Genetic evaluation of the Lake Sturgeon
reintroduction program in the Mississippi and Missouri Rivers. North American Journal of Fisheries Management, 27: 434-442.
Drauch, A.M., B.R. Fisher, E.K. Latch, J.A. Fike, O.E. Rhodes Jr.. 2008. Evaluation of a
remnant lake sturgeon population’s utility as a source for reintroductions in the Ohio River system. Conservation Genetics, 9: 1195-1209.
Dumont, P., J. D’Amours, S. Thibodeau, N. Dubuc, R. Verdon, S. Garceau, P. Bilodeau,
Y. Mailhiot, and R. Fortin. 2011. Effects of the development of a newly created spawning ground in the Des Prairies River (Quebec, Canada) on the reproductive success of lake sturgeon (Acipenser fulvescens). Journal of Applied Ichthyology, 27: 394-404.
Ferguson, M.M., and G.A. Duckworth. 1997. The status and distribution of Lake
Sturgeon, Acipenser fulvescens, in the Canadian provinces of Manitoba, Ontario, and Quebec: a genetic perspective. Environmental Biology of Fishes, 48: 299-309.
Fisher, W.L., and C.S. Toepfer. 1998. Recent trends in geographic information systems
education and fisheries research applications at U.S. Universities. Fisheries, 23: 10-13.
Fisher, W.L, and F.J. Rahel. 2004. Geographic information systems applications in
stream and river fisheries. Geographic Information Systems in Fisheries. American Fisheries Society. Bethesda, Maryland. (pp84).
Folz, D. J.; Meyers, L. S., 1985: Management of the Lake sturgeon, Acipenser
fulvescens, population in the Lake Winnebago system,Wisconsin. In: North American Sturgeons. F. Binkowski and S. I. Doroshov (Eds). Dr W. Junk, Dordrecht, The Netherlands, pp.135–146.
Frommen, J.G. and T.C.M. Bakker. 2006. Inbreeding avoidance through non-random
mating in sticklebacks. Biology Letters, 2: 232-235. Fortin, R., J-R. Mongeau, G. DesJardins, P. Dumont. 1993. Movements and biological
statistics of the lake sturgeon (Acipenser fulvescens) populations from the St. Lawrence and Ottawa River system, Quebec. Canadian Journal of Zoology, 71: 638-650.
Fox, D.A., J.E. Hightower, and F.M. Parauka. 2000. Gulf Sturgeon spawning migration
and habitat in the Choctawhatchee River system, Alabama-Florida. Transactions of the American Fisheries Society, 129: 811-826.

165
Friday, M.J. 2004. The migratory and reproductive response of spawning Lake
sturgeon to controlled flows over Kakabeka Falls on the Kaministiquia River, 2004. Upper Great Lakes Management Unit. Ontario Ministry of Natural Resources. Technical Report # 06.01. (pp27).
Friday, M. 2005a. Lake Sturgeon Radio Telemetry Study. Unpublished. Ontario Ministry
of Natural resources; Technical Report. (pp3). Friday, M. 2005b. The migratory and reproductive response of spawning lake sturgeon to
controlled flows over Kakabeka Falls on the Kaministiquia River, Ontario, 2005. Unpublished. Upper Great Lakes Management Unit, Ontario Ministry of Natural Resources; Technical Report (05-01). (pp23).
Furlong, P., R.F. Foster, P.J. Colby, and M. Friday. 2006. Black Sturgeon River Dam: a
barrier to the rehabilitation of Black Bay Walleye. Upper Great Lakes Management Unit, Lake Superior. Thunder Bay, Ontario. Technical Report Number 06-03. (pp27).
Hannibal-Paci, C. 1998. Historical representations of Lake Sturgeon by native and non-
native artists. The Canadian Journal of Native Studies, 2: 203-232. Harkness, W.J.K., and J.R. Dymond. 1961. The lake sturgeon: the history of its fishery
and problems of conservation. Fish and Wildlife Branch. Ontario Department of Lands and Forests. Toronto, Ontario. (pp121).
Haxton, T.J. 2003a. An assessment of lake sturgeon (Acipenser fulvescens) in various
reaches of the Ottawa River. Journal of Applied Ichtyology, 18: 449-454. Haxton, T.J. 2003b. Movement of Lake Sturgeon, Acipenser fulvescens, in a natural reach
of the Ottawa River. Canadian Field-Naturalist, 117: 541-545. Haxton, T.J., C.S. Findlay, and R.W. Threader. 2008. Predictive value of a Lake Sturgeon
habitat suitability model. North American Journal of Fisheries Management, 28: 1373-1383.
Haxton, T.J., and C.S. Findlay. 2008. Variation in lake sturgeon (Acipenser fulvescens)
abundance and growth among river reaches in a large regulated river. Canadian Journal of Fisheries and Aquatic Sciences, 65: 645-657.
Hay-Chmielewski, E.M. 1987. Habitat preferences and movement patterns of the Lake
Sturgeon (Acipenser fulvescens) in Black Lake, Michigan. Michigan Department of Natural Resources. Lasing, Michigan. (pp48).

166
Hay-Chmielewski, E.M., and G.E. Whelan. 1997. Lake Sturgeon Rehabilitation Strategy. Fisheries Division. Michigan Department of Natural Resources. Lansing, Michigan. (pp51)
Hodgeson, S., T.P. Quinn, R. Hilborn, R.C. Francis, and D.E. Rogers. 2006. Marine and
freshwater climatic factors affecting interannual variation in the timing of return migration to fresh water of sockeye salmon. Fisheries Oceanography, 15: 1-24.
Holey, M.E., E.A. Baker, T.F. Thuemler, and R.F. Elliot. 2000. Research and assessment
needs to restore lake sturgeon in the Great Lakes. Great Lakes Fisheries Workshop, Muskagon, Michigan. (pp16).
Holzkamm, T.E., V.P. Lytwyn, and L.G. Waisberg. 1988. Rainy River Sturgeon: an
Ojibway resource in the fur trade economy. The Canadian Geographer, 32: 194-205.
Holzkamm, T.E., and L.G. Waisberg. 2005. Native American Utilization of Sturgeon.
Fish and Fisheries, 27: 22-39. Hopper, M., and G. Power. 1991. The fisheries of an Ojibwa Community in Northern
Ontario. Arctic, 44: 267-274. Horne, B.D., E.S. Rutherford, and K.E. Wehrly. 2004. Simulating effects of hydro dam
alteration on thermal regime and wild steelhead recruitment in a stable flow Lake Michigan tributary. River Research and Application, 20: 185-203.
Hutchings, J.A., and M. Festa-Bianchet. 2009. Canadian species at risk (2006-2008), with
particular emphasis on fishes. Environmental Reviews, 17: 53-65. Jager, H.I., J.A. Chandler, K.B. Lepla, and W. Van Winkle. 2001. A theoretical study of
river fragmentation by dams and its effects on white sturgeon populations. Environmental Biology of Fishes, 60: 347-361.
Jepsen, N., C. Schreck, S. Clements, and E.B. Thorstad. 2003. A brief discussion on the
2% tag/bodymass rule of thumb. Aquatic Telemetry: Advances and Applications. Proceedings of the Fifth Conference on Fish Telemetry Held in Europe. Ustica, Italy, June 9-13, pp. 255-259.
Jepson, M.A., M.L. Keefer, G.P. Naughton, C.A. Peery, and B.J. Burke. 2010. Population
composition, migration timing, and harvest of Columbia River Chinook Salmon in late summer and fall. North American Journal of Fisheries Management, 30: 72-88.
Johnson, J.H., S.R. LaPan, R.M. Klindt, and A. Schiavone. 2006. Lake Sturgeon
spawning on artificial habitat in the St Lawrence River. Journal of Applied Ichthyology, 22: 465-470.

167
Kappenman, K.M., W.C. Fraser, M. Toner, J. Dean, M.A.H. Webb. 2009. Effect of temperature on growth, condition and survival of juvenile shovelnose sturgeon. Transactions of the North American Fisheries Society, 138: 927-937.
Keefer, M.L., C.A. Perry, and C.C. Caudill. 2008. Migration timing of Columbia River
spring Chinook Salmon: effects of Temperature, River Discharge, and Ocean Environment. Transactions of the American Fisheries Society, 137: 1120-1133.
Kempinger, J.J. 1988. Spawning and early life history of lake sturgeon in the Lake
Winnebago system, Wisconsin. American Fisheries Society Symposium, 5: 110-122.
Kerr, S.J., M.J. Davidson, E. Funnell. 2011. A review of Lake Sturgeon habitat
requirements and strategies to protect and enhance sturgeon habitat. Fisheries Policy Section, Biodiversity Branch. Ontario Ministry of Natural Resources. Peterborough, Ontario. (pp58).
King, L. 2010. Lake Sturgeon investigations at Manitou and High Falls hydroelectric
project. Hatch Ltd., Niagara Falls, Ontario. (pp63). Kinnison, M.T., M.J. Unwin, A.P. Hendry, and T.P. Quinn. 2001. Migratory costs and
the evolution of egg size and number in introduced and indigenous salmon populations. Evolution, 55: 1656-1667.
Kjartanson, S. L. 2008. Population structure and genetic diversity of lake sturgeon
(Acipenser fulvescens) in Canada: evaluation of designable units for conservation. University of Toronto. Toronto, Ontario. (pp123).
Kline, K.S., R.M. Bruch, F.P. Binkowski. 2010. People of the Sturgeon: Wisconsin’s
love affair with an ancient fish. Wisconsin Historical Society Press. Madison, Wisconsin. (pp304).
Knight, B.C., J.M. Vallazza, S.J. Zigler, and M.R. Dewey. 2002. Habitat and movement
of Lake Sturgeon in the Upper Mississippi River System, USA. Transactions of the American Fisheries Society, 131: 507-522.
Lallaman, J.J., R.A. Damstra, and T.L. Galarowicz. 2008. Population assessment and
movement patterns of lake sturgeon (Acipenser fulvescens) in the Manistee River, Michigan, USA. Journal of Applied Ichtyology, 24: 1-6.
Laurel, B.J., R.S. Gregory, J.A. Brown, J.K. Hancock, and D.C. Schneider. 2004.
Behavioural consequences of density-dependent habitat use in juvenile cod Gadus morhua and G. ogac: the role of movement and aggregations. Marine Ecology Progress Series, 727: 257-270.

168
Le Haye, M., A. Branchaud, M. Gendron, R. Verdon, and R. Fortin. 1992. Reproduction, early life history, and characteristics of the spawning grounds of the lake sturgeon (Acipenser fulvescens) in Des Prairies and L’Assomption rivers, near Montreal, Quebec. Canadian Journal of Zoology, 70: 1681-1689.
Ligon, F.K., W.E. Dietrich, and W.J. Trush. 1995. Downstream ecological effects of
dams. BioSciences, 45: 183-192. Stone, L, and C. Vincent. 1900. The spawning habits of the Lake Sturgeon (Acipenser
rubicundus). Transactions of the American Fisheries Society, 29: 118-128. Lundqvist, H., P. Rivinoja, K. Leonardsson, and S. McKinnell. 2008. Upstream passage
problems for wild Atlantic salmon (Salmo salar L.) in a regulated river and its effects on the population. Hydrobiologia, 602: 111-127.
Lyons, J., and J.J. Kempinger. 1992. Movements of adults lake sturgeon in the Lake
Winnebago system. Wisconsin Department of Natural Resources Madison, Wisconsin. (pp86).
Matheus, M.T., S.G. Hinch, S.J. Cooke, G.T. Crossin, D.A. Patterson, A.G. Lotto, and
A.P. Farrell. 2010. Effect of water temperature, timing, physiological condition, and lake thermal refugia on migrating adult Weaver Creek sockeye salmon (Onchorhynchus nerka). Canadian Journal of Fisheries and Aquatic Sciences, 67: 70-84.
Manny, B.A, and G.W. Kennedy. 2002. Known lake sturgeon (Acipenser fulvescens)
spawning habitat in the channel between lakes Huron and Erie in the Laurentian Great Lakes. Journal of Applied Ichthyology, 18: 486-490.
McHugh, P., and P. Budy. 2005. A comparison of visual and measurement-based
techniques for quantifying cobble embeddedness and fine-sediment levels in Salmonid-bearing streams. North American Journal of Fisheries Management, 25: 1208-1214.
McKinley, S., G. Van Der Kraak, and G. Power. 1998. Seasonal migrations and
reproductive patterns in the lake sturgeon, Acipenser fulvescens, in the vicinity of hydroelectric stations in northern Ontario. Environmental Biology of Fishes, 51: 245-256.
Morris, L., and D. Ball. 2006. Habitat suitability modeling of economically important fish
species with commercial fisheries data. ICES Journal of Marine Sciences, 63: 1590-1603.
Moursaud, R.A., T.J. Carlson, and R.D. Peters. 2003. A fisheries application of a dual-
frequency identification sonar acoustic camera. ICES Journal of Marine Science, 60: 678-683.

169
Nichols, S.J., G. Kennedy, E. Crawford, J. Allen, J. French III, G. Black, M. Blowin, J.
Hickey, S. Chernyak, R. Haas, M. Thomas. 2003. Assessment of lake sturgeon (Acipenser fulvescens) spawning efforts in the lower St. Clair River, Michigan. Journal of Great Lakes Research, 29: 383-391.
Nilo, P., S. Tremblay, A. Bolon, J. Dodson, P. Dumont, and R. Fortin. 2006. Feeding
ecology of juvenile lake sturgeon in the St. Lawrence River system. Transaction of the American Fisheries Society, 135: 1044-1055.
Nilo, P., P. Dumont, and R. Fortin. 1997. Climatic and hydrological determinants of year-
class strength of St. Lawrence River Lake Sturgeon (Acipenser fulvescens). Canadian Journal of Fisheries and Aquatic Sciences, 54: 774-780.
Olden, J.D., D.A. Jackson, and P.R. Peres-Neto. 2002. Predictive models of fish species
distributions: a note on proper validation and chance predictions. Transactions of the American Fisheries Society, 131: 329-336.
Ontario Ministry of Natural Resources. 2009. The Lake Sturgeon in Ontario. Fish and
Wildlife Branch. Peterborough, Ontario. (pp48). Orth, D.J. 1987. Ecological considerations in the development and application of
instream flow-habitat models. Regulated Rivers: Research & Management, 1: 171-181.
Ortigosa, G.R., G.A. De Leo, and M. Gatto. 2000. VVF: integrating modeling and GIS in
a software tool for habitat suitability assessment. Environmental Modeling and Software, 15: 1-12.
Paragamian, V.L., G. Kruse, and V. Wakkinen. 2001. Spawning habitat of Kootenai
River White Sturgeon, post-Libby Dam. North American Journal of Fisheries Management, 21: 22-33.
Paragamian, V.L., V.D. Wakkinen, and G. Kruse. 2002. Spawning locations and
movement of Kootenai River white sturgeon. Journal of Applied Ichtyology, 18: 608-616.
Perrin, C.J., L.L. Rempel, and M.L. Rosenau. 2003. White sturgeon spawning habitat in
an unregulated river: Fraser River Canada. Transactions of the American Fisheries Society, 132: 154-165.
Peterson, D.L., P. Vecsei, and C.A. Jennings. 2007. Ecology and biology of the lake
sturgeon: a synthesis of current knowledge of a threatened North American Acipenseridae. Reviews of Fish Biology and Fisheries, 17: 59-76.

170
Poff, N.L., J.D. Allan, M.B. Bain, J.R. Karr, K.L. Prestegaard, B.D. Richter, R.E. Sparks, and J.C. Stromberg. 1997. The natural flow regime: a paradigm for river conservation and restoration. BioScience, 47: 769-784.
Priegel, G.R., and T.L. Wirth. 1974. The Lake Sturgeon: it’s life history, ecology and
management. Wisconsin Department of Natural Resources. Madison, Wisconsin. (pp74).
Quinlan, H. 2002. Summary of 2002 Pic River Lake Sturgeon Assessment. Unpublished.
Wisconsin Department of Natural Resources; Technical Report. (pp3). Quinn, T.P., and D.J. Adams. 1996. Environmental changes affecting the migratory
timing of American Shad and Sockeye Salmon. Ecology, 77: 1151-1162. Roloff, G.J., and B.J. Kernohan. 1999. Evaluating reliability of habitat suitability index
models. Wildlife Society Bulletin, 27: 973-985. Roni, P., K. Hanson, and T. Beechie. 2008. Global review of the physical and biological
effectiveness of stream habitat rehabilitation techniques. North American Journal of Fisheries Management, 28: 856-890.
Rosenberg, D.M., F.B. Berkes, R.A. Bodaly, R.E. Hecky, C.A. Kelly, and J.W.M. Rudd.
1997. Large-scale impacts of hydroelectric developments. Environmental Reviews, 5: 27-54.
Rubec, P.J., J.C.W. Bexley, H. Norris, M.S. Coyne, M.E. Monaco, S.G. Smith, and J.S.
Ault. 1999. Suitability modeling to delineate habitat essential to sustainable fisheries. American Fisheries Society Symposium, 22: 108-133.
Rusak, J.A., and T. Mosindy. 1997. Seasonal movements of lake sturgeon in Lake of the
Woods and the Rainy River, Ontario. Canadian Journal of Zoology, 74: 383-395. Rustadbakken, A., J.H. L’Abee-Lund, J.V. Arnekleiv, and M. Kraabol. 2004.
Reproductive migration of brown trout in a small Norwegian river studied by telemetry. Journal of Fish Biology, 64: 2-15.
Scott, W.B., and E.J. Crossman. 1973. Freshwater fishes of Canada. Fisheries Research
Board of Canada. Ottawa, Ontario. (pp966). Sennatt, K.M., N.L. Salant, C.E. Renshaw, and F.J. Magilligan. 2008. Assessment of
methods for measuring embeddedness: application to sedimentation in flow regulated streams. Journal of the American Water Resources Association, 42: 1671-1682.

171
Seylor, J. 1997a. Adult Lake Sturgeon (Acipenser fulvescens) habitat use, Groundhog River 1996. Ontario Ministry on Natural Resources, Timmins, Ontario. Technical Report TR-035. (pp20).
Seylor, J. 1997b. Biology of selected riverine fish species in the Moose River Basin.
Ontario Ministry of Natural Resources, Timmins, Ontario. Technical Report IR-024. (pp100).
Shaw, S.L. 2010. Lake Sturgeon (Acipenser fulvescens) population attributes,
reproductive structure, and distribution in Namakan Reservoir, Minnesota and Ontario. South Dakota State University. Brookings, South Dakota. (pp110).
Shuman, J.R. 1995. Environmental considerations for assessing dam removal alternatives
for river restoration. Regulated Rivers: Research & Management, 11: 249-261. Sims, D.W., V.J. Wearmouth, M.J. Genner, A.J. Southward, and S.J. Hawkins. 2004.
Low-temperature-driven early spawning migration of a temperate marine fish. Journal of Animal Ecology, 73: 333-341.
Smith, A.L. 2009. Lake Sturgeon (Acipenser fulvescens) stocking in North America. Fish
and Wildlife Branch. Ontario Ministry of Natural Resources. Peterborough, Ontario. (pp17).
Smith, K.M., and D.K. King. 2005a. Movement and habitat use of yearling and juvenile
lake sturgeon in Black Lake, Michigan. Transactions of the American Fisheries Society, 134: 1159-1172.
Smith, K.M., and D.K. King. 2005b. Dynamics and extent of larval lake sturgeon
Acipenser fulvescens drift in the Upper Black River, Michigan. Journal of Applied Ichthyology, 21: 161-168.
Stelzer, R.S., H.G. Drecktrah, M.P. Shupryt, and R.M. Bruch. 2008. Carbon sources for
Lake Sturgeon in Lake Winnebago, Wisconsin. Transactions of the American Fisheries Society, 137: 1018-1028.
Sulak, K.J., and J.P. Clugston. 1998. Early life history of Gulf Sturgeon in the Suwannee
River, Florida. Transactions of the American Fisheries Society, 127: 758-771. Svendsen, J.C., A. Koed, and K. Aarestrup. 2004. Factors influencing the spawning
migration of female anadromous brown trout. Journal of Fish Biology, 64: 528-540. Threader, R.W., R.J. Popem, and P.R.H. Schaap. 1998. Development of a habitat
suitability index model for lake sturgeon. Ontario Hydro Toronto, Ontario. Report H-07015.01-0012. (pp69).

172
Thuemler, T.F. 1985. The lake sturgeon, Acipenser fulvescens, in the Menominee River, Wisconsin-Michigan. Environmental Biology of Fishes, 14: 73-78.
Tiffen, K.F., D.W. Rondorf, and J.J. Skalicky. 2004. Imaging fall Chinook Salmon redds
in the Columbia River with a dual-frequency identification sonar. North American Journal of Fisheries Management, 24: 1421-1426.
Trested, D. 2010. Biology and ecology of Lake Sturgeon (Acipenser fulvescens) in the
Grasse River, New York. Clemson University, Clemson. (pp98). Toepfer, C.S., W.L. Fisher, and W.D. Warde. 2000. A multistage approach to estimate
fish abundance in streams using geographical information systems. North American Journal of Fisheries Management, 20 : 634-645.
Valavanis, V.D., G.J. Pierce, A.F. Zuur, A. Palialexis, A. Saveliev, I. Katara, and J.
Wang. 2008. Modeling of essential fish habitat based on remote sensing, spatial analysis and GIS. Hydrobiologia, 612: 5-20.
Velez-Espino, L.A., and M.A. Koops. 2009. Recovery potential assessment for Lake
Sturgeon in Canadian designatable units. North American Journal of Fisheries Management, 29: 1065-1090.
Van Eenennaam, J.P., S.I. Doroshov, G.P. Moberg, J.G. Watson, D.S. Moore, and J.
Linares. 1996. Reproductive conditions of the Atlantic Sturgeon (Acipenser oxyrinchus) in the Hudson River. Estuaries and Coasts, 19: 769-777.
Vannote, R.L., G.W. Minshall, K.W. Cummins, J.R. Sedell, and C.E. Cushing. 1980. The
river continuum concept. Canadian Journal for Fisheries and Aquatic Sciences, 37: 130-137.
Vinagre, C, C. Fonseca, H. Cabral, and M. Jose Costa. 2006. Habitat suitability models
for the juvenile soles, Solea solea and Solea senegalensis, in the Tagus estuary: defining variables for species management. Fisheries Research, 82: 140-149.
Water Survey of Canada. 2010. Water Level and Stream Flow Statistics. Unpublished.
Environment Canada. Online Report Available: http://www.wsc.ec.gc.ca/staflo/index_e.cfm?cname=HydromatD.cfm. Accessed: December 22, 2010.
Welsh, A., and J.R. McClain. 2001. Development of a management plan for Lake
Sturgeon within the Great Lakes Basin based on population genetics structure. Great Lakes Fisheries Trust. Alpena, Michigan. Project Number 2001.75. (pp20).
Welsh, A.B., T. Hill, H. Quinlan, C. Robinson, and B. May. 2008. Genetic assessment of
Lake Sturgeon in the Laurentian Great Lakes. North American Journal of Fisheries Management, 28: 572-591.
173
Welsh, A.B., and D.T. McLeod. 2010. Detection of natural barriers to movement of lake
sturgeon (Acipenser fulvescens) within the Namakan River, Ontario. Canadian Journal of Zoology, 88: 390-397.
Welsh, A.B., Elliott, R.F., Scribner, K.T., Quinlan, H.R., Baker, E.A., Eggold,
B.T.,Holtgren, J.M., Krueger, C.C., May, B. 2010. Genetic guidelines for the stocking of lake sturgeon (Acipenser fulvescens) in the Great Lakes basin. Great Lakes Fisheries Commission. Ann Arbor, Michigan. Miscellaneous Publication 2010-01. (pp55).
Williamson, D.F. 2003. Caviar and conservation; status, management, and trade of North
American Sturgeon and Paddlefish. World Wildlife Fund. Washington, DC. (pp240).
Ydenberg, R.C., A.C. Niehaus, and D.B. Lank. 2005. Inter-annualannual differences in
the relative timing of southward migration of male and female western sandpipers (Calidris mauri). Naturwissenschaften, 92: 332-335.
Yi, Y., Z. Wang, and Z. Yang. 2010. Impact of the Gezhouba and Three Gorges Dams on
habitat suitability of carps in the Yangtze River. Journal of Hydrology, 387: 283-291.
Zhong, Y., and G. Power. 1996. Some environmental impacts of hydroelectric projects on
fish in Canada. Impact Assessment, 12: 81-98. Zorn, T.G., P.W. Seelbach, and M.J. Wiley. 2011. Developing user-friendly habitat
suitability tools from regional stream fish survey data. North American Journal of Fisheries Management, 31: 41-55.
Personal Communication: Kim Tremblay Address:
Anishinabek/Ontario Fisheries Resource Centre 755 Wallace Rd, Unit 5 North Bay, Ontario P1B 8G4
Phone: (705) 472-7888
Nikki Commanda Address:
Anishinabek/Ontario Fisheries Resource Centre 755 Wallace Rd, Unit 5 North Bay, Ontario P1B 8G4

174
Phone: (705) 472-7888
Bill Gardner Address: Fisheries and Oceans Canada 1219 Queen St. E. Sault Ste. Marie, Ontario P6A 2E5 Phone: (705) 941-2664 Tim Haxton Address: 300 Water St., 4th Floor S.
Peterborough, Ontario K9L 8M5
Phone: (705) 755-3258 Thomas Pratt Address: Fisheries and Oceans Canada 1219 Queen St. E. Sault Ste. Marie, Ontario P6A 2E5 Phone: (705) 941-2664