Embed Size (px)
Citation preview

LINTEC ANNUAL REPORT 2017For the fiscal year ended March 31, 2017
Moving Forward With a Focus on
The Future

This report is meant to help shareholders and other investors
understand the LINTEC Group and its quest to achieve sustainable
growth and contribute to the further development of society as a whole.
Based on the International Integrated Reporting Framework released
by the International Integrated Reporting Council in December 2013, in
addition to performance and financial information, this report also
introduces the technological capabilities, human resources, and other
“intangible assets” accumulated by the LINTEC Group that are of the
variety not listed in the financial statements.
Information that could not be contained within this report is available on
the following websites.
IR Website CSR Website
http://www.lintec-global.com/ir/ http://www.lintec-global.com/csr/
Editorial Policy
REPORTING PERIODThis report covers the period from April 1, 2016 to March 31, 2017. However, some of the information includes content from April 2017 onward.
FORWARD-LOOKING STATEMENTSThis report includes forward-looking statements, such as forecasts of business results, based on information currently held and assumptions that have been judged as reasonable by the Company. The Company cannot guarantee the accuracy of these statements or definitively assure the realization of future numerical targets and policies. Actual business results, etc., may vary due to various factors and circumstances.
Contents
1 To All Our Stakeholders
2 COVER STORY - 2 LINTEC’s History - 4 LINTEC’s Distinct Features - 6 LINTEC’s Business Model
8 Performance Highlights
10 MANAGEMENT STRATEGY - 10 A Message from the President - 14 A Message from the CFO
16 SPECIAL FEATURE The LINTEC Global Network
20 CORPORATE VALUE INITIATIVES - 20 LINTEC’s Value Creation - 22 Sales - 30 Research and Development - 34 Production - 38 Human Resources
40 THE BASE THAT SUPPORTS GROWTH - 40 Corporate Governance - 47 A Message from an Outside Director - 48 Corporate Officers
50 FINANCIAL SECTION - 51 Management’s Discussion and Analysis - 53 Operating Risks - 54 Financial Summary - 56 Consolidated Balance Sheet - 58 Consolidated Statement of Income - 58 Consolidated Statement of
Comprehensive Income - 59 Consolidated Statement of Changes in
Net Assets - 60 Consolidated Statement of Cash Flows - 61 Notes to Consolidated Financial
Statements - 84 Management’s Report on Internal
Control over Financial Reporting - 85 Report of Independent Auditors
87 Investor Information
LINTEC ANNUAL REPORT 2017

To All Our Stakeholders
Company Motto
Mission StatementThe company name LINTEC derives from “linkage” and “technology,” two key components of our business philosophy, which emphasizes the importance of close relations, inside and outside the company, and leading-edge R&D programs. By bringing these together to develop innovative solutions, we have established a reputation in Japan and overseas as a dynamic and reliable company that contributes to the prosperity of our stakeholders, to the growth of our industry, and to a brighter future for society as a whole. And underpinning all of our business activities is an unwavering
emphasis on “Sincerity and Creativity,” the twin values enshrined in our company motto.
For tomorrow we build today
1LINTEC ANNUAL REPORT 2017
LINTEC has a 90-year history of building on original technologies and human resources to deliver a diverse product lineup ranging from adhesive products for labels for food and daily necessities to products for the semiconductor and optical display industries. The name LINTEC reflects our employees’ commitment to linking together people and technology to open up new business domains and play a part on the global stage. Our motto, “Sincerity and Creativity,” expresses our fundamental values as a manufacturer—openness to all our stakeholders and a spirit of innovation as we take on the chal-lenges of new product development. We will continue to strive for sustainable growth driven by the social contribution from value that only LINTEC can create.
Hiroyuki NishioRepresentative DirectorPresident, CEO and COO
Sincerity and Creativity
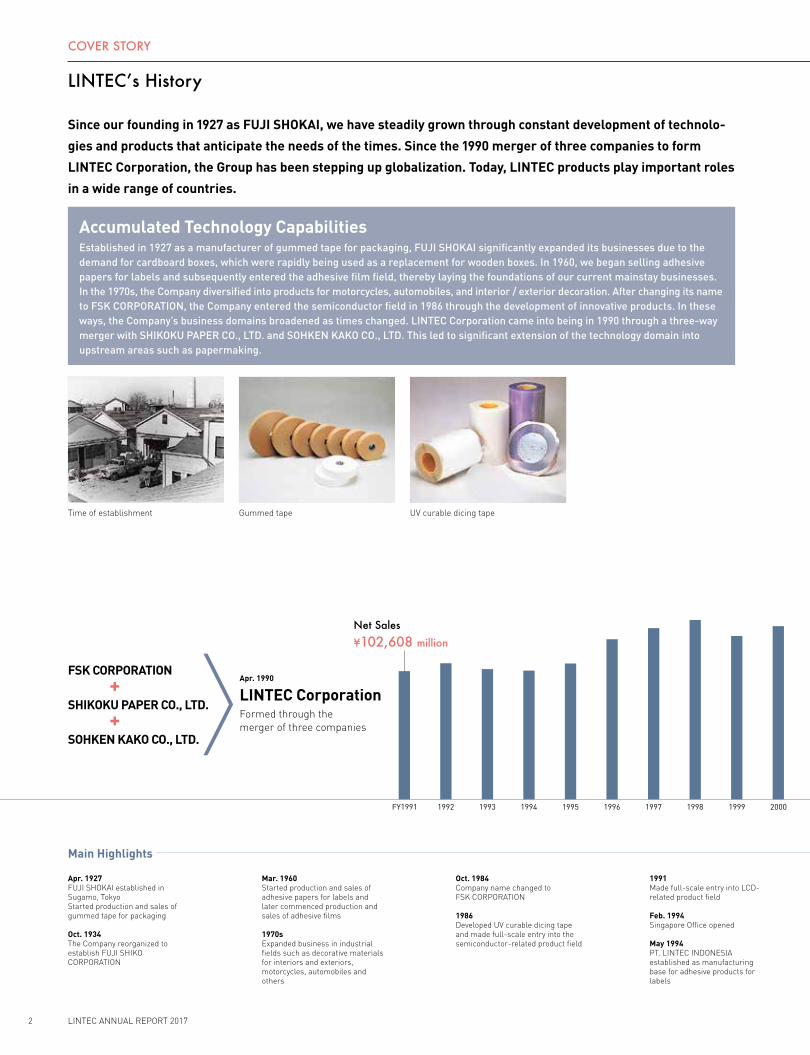
FY1991 1992 1993 1995 1996 1997 1998 1999 2000 20011994
Accumulated Technology CapabilitiesEstablished in 1927 as a manufacturer of gummed tape for packaging, FUJI SHOKAI significantly expanded its businesses due to the demand for cardboard boxes, which were rapidly being used as a replacement for wooden boxes. In 1960, we began selling adhesive papers for labels and subsequently entered the adhesive film field, thereby laying the foundations of our current mainstay businesses. In the 1970s, the Company diversified into products for motorcycles, automobiles, and interior / exterior decoration. After changing its name to FSK CORPORATION, the Company entered the semiconductor field in 1986 through the development of innovative products. In these ways, the Company’s business domains broadened as times changed. LINTEC Corporation came into being in 1990 through a three-way merger with SHIKOKU PAPER CO., LTD. and SOHKEN KAKO CO., LTD. This led to significant extension of the technology domain into upstream areas such as papermaking.
Since our founding in 1927 as FUJI SHOKAI, we have steadily grown through constant development of technolo-
gies and products that anticipate the needs of the times. Since the 1990 merger of three companies to form
LINTEC Corporation, the Group has been stepping up globalization. Today, LINTEC products play important roles
in a wide range of countries.
COVER STORY
LINTEC’s History
Net Sales¥102,608 million
Gummed tapeTime of establishment UV curable dicing tape
2 LINTEC ANNUAL REPORT 2017
1991 Made full-scale entry into LCD-related product field
Feb. 1994 Singapore Office opened
May 1994 PT. LINTEC INDONESIA established as manufacturing base for adhesive products for labels
Main Highlights
Apr. 1927 FUJI SHOKAI established in Sugamo, TokyoStarted production and sales of gummed tape for packaging
Oct. 1934 The Company reorganized to establish FUJI SHIKO CORPORATION
Mar. 1960Started production and sales of adhesive papers for labels and later commenced production and sales of adhesive films
1970s Expanded business in industrial fields such as decorative materials for interiors and exteriors, motorcycles, automobiles and others
Oct. 1984 Company name changed to FSK CORPORATION
1986Developed UV curable dicing tape and made full-scale entry into the semiconductor-related product field
FSK CORPORATION+
SHIKOKU PAPER CO., LTD.+
SOHKEN KAKO CO., LTD.
Apr. 1990
LINTEC CorporationFormed through themerger of three companies
2001 2002 2003 2004 2005 2006 2007 2008 2009 2010 2011 2012 2013 2014 2015 2016 2017 2018(Forecast)
2000 2001 2002 2003 2004 2005 2006 2007 2008 2009 2010 2011 2012 2013 2014 2015 2016 2017 2018(Forecast)
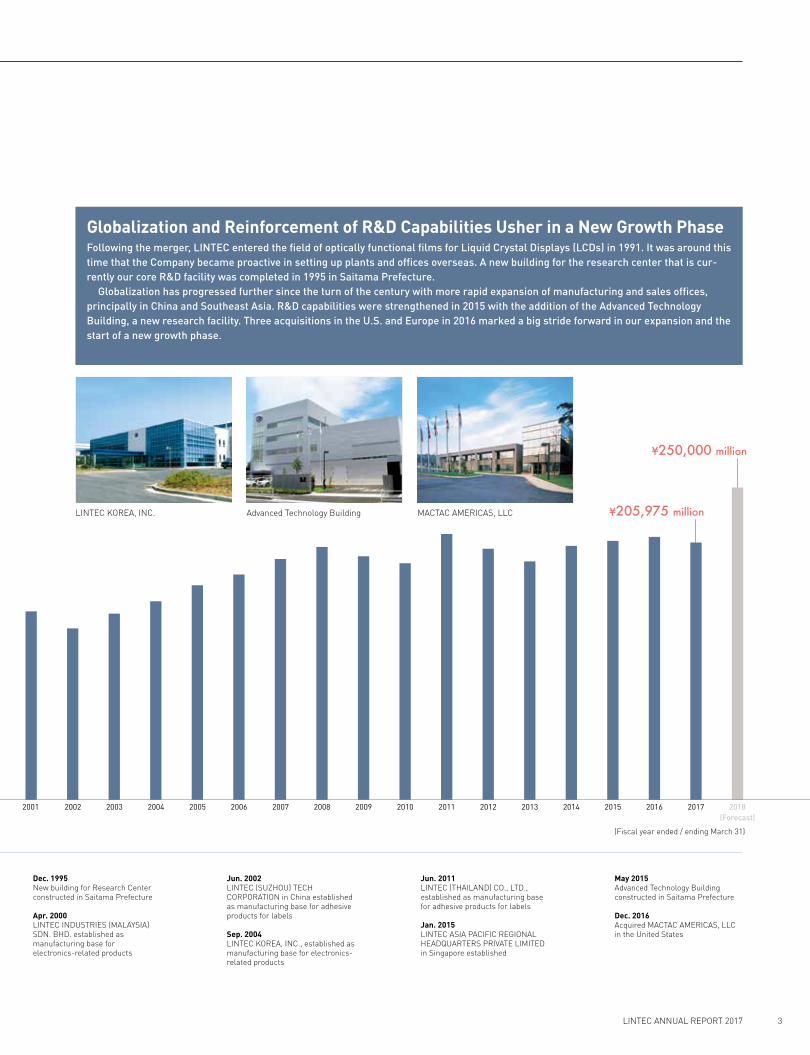
Globalization and Reinforcement of R&D Capabilities Usher in a New Growth PhaseFollowing the merger, LINTEC entered the field of optically functional films for Liquid Crystal Displays (LCDs) in 1991. It was around this time that the Company became proactive in setting up plants and offices overseas. A new building for the research center that is cur-rently our core R&D facility was completed in 1995 in Saitama Prefecture. Globalization has progressed further since the turn of the century with more rapid expansion of manufacturing and sales offices, principally in China and Southeast Asia. R&D capabilities were strengthened in 2015 with the addition of the Advanced Technology Building, a new research facility. Three acquisitions in the U.S. and Europe in 2016 marked a big stride forward in our expansion and the start of a new growth phase.
COVER STORY
¥250,000 million
¥205,975 millionLINTEC KOREA, INC. Advanced Technology Building MACTAC AMERICAS, LLC
3LINTEC ANNUAL REPORT 2017
Dec. 1995 New building for Research Center constructed in Saitama Prefecture
Apr. 2000 LINTEC INDUSTRIES (MALAYSIA) SDN. BHD. established as manufacturing base for electronics-related products
Jun. 2011 LINTEC (THAILAND) CO., LTD., established as manufacturing base for adhesive products for labels
Jan. 2015 LINTEC ASIA PACIFIC REGIONAL HEADQUARTERS PRIVATE LIMITED in Singapore established
May 2015 Advanced Technology Building constructed in Saitama Prefecture
Dec. 2016Acquired MACTAC AMERICAS, LLC in the United States
Jun. 2002LINTEC (SUZHOU) TECH CORPORATION in China established as manufacturing base for adhesive products for labels
Sep. 2004 LINTEC KOREA, INC., established as manufacturing base for electronics-related products
(Fiscal year ended / ending March 31)

COVER STORY
LINTEC’s Distinct Features
4 LINTEC ANNUAL REPORT 2017
We are drawing on the original technological capabilities we have built up over the years to establish a firm position
as a leading company in adhesive products and specialty papers. Based on our philosophy of “customer first” and
innovative new ideas, we will continue to work on developing high-value-added products we can offer to customers
to meet their diverse range of needs.
Cultivated Technologies Realize
Our Strengths
LINTEC’s Competitive Advantages
— Integrated Production System for Adhesive Products and Provision of Comprehensive Solutions
LINTEC’s expertise extends beyond adhesives development and
coating to proprietary technology in the manufacture of base paper
for release papers, the development of release materials and related
coating processes, and facestock improvement coating. The Group
has thus built an integrated production system for adhesive products.
The resulting ability to manufacture and procure release papers and
films for adhesive products in-house gives us advantages in quality,
costs, and delivery lead times. Additionally, by combining different
processing technologies, we are able to create adhesive products for
use in a diverse range of fields. In areas other than adhesive
products, we bring to market large numbers of unique products
designed for use with upstream technologies, such as industrial-use
release papers and films and specialty papers.
We also develop and manufacture equipment that fully leverages
the properties of our adhesive materials. This includes labeling
machines that automatically apply labels to packaging and equipment
used in semiconductor production. Comprehensive solutions incorpo-
rating materials and such equipment are another advantage of the
LINTEC Group.
Integrated Production System for Adhesive Products
Printing and Industrial
Materials Products
Electronic and Optical
Products
Paper and Converted
Products
Base Paper / Film
Papermaking
Base PaperBase Paper / Film
Release Agent
Release Agent Development and Coating
Facestock
Surface Improvement
Surface Improvement ProcessingAdhesive Development and Coating, and Bonding
Adhesive
Related Equipment Development

2011 2012 2016 2017 2018(Forecast)
19921991FY 1993 1994 1995 1996 1997 1998 1999 2000 2001 20032002 2004 2005 2006 2007 2013 2014 201520092008 2010
(Fiscal year ended / ending March 31)
COVER STORY
¥16,595 million
¥4,687 million
¥20,000 million
Consumer electronics
Food
Automobiles
Logistics
Daily necessities
Semiconductors
Printing
Pharmaceuticals
ElectronicComponents
Advertisement
Stationery
LCDs
Architecture / Interior
5LINTEC ANNUAL REPORT 2017
Stable Business Structure That Is Not Susceptible to Market Volatility in Any Single Industry
In recent years, the earnings drivers among LINTEC’s diverse range
of products have been products for the semiconductor, electronic
component, and LCD industries, which have undergone rapid market
growth. Meanwhile, sales and profit fluctuations have been compara-
tively small for mainstay adhesive materials for labels used for food,
daily necessities, pharmaceuticals, stationery, and consumer elec-
tronics, and these products can be seen as foundation business that
provides a firm underpinning for our earnings.
The production of a wide range of products in growth and founda-
tion businesses and sales to a broad range of industries without
reliance on any particular industry are the distinguishing characteris-
tics of our business structure. The resulting steady earnings that are
not susceptible to market volatility in any single industry are one of
our strengths.
27 consecutive years of operating income
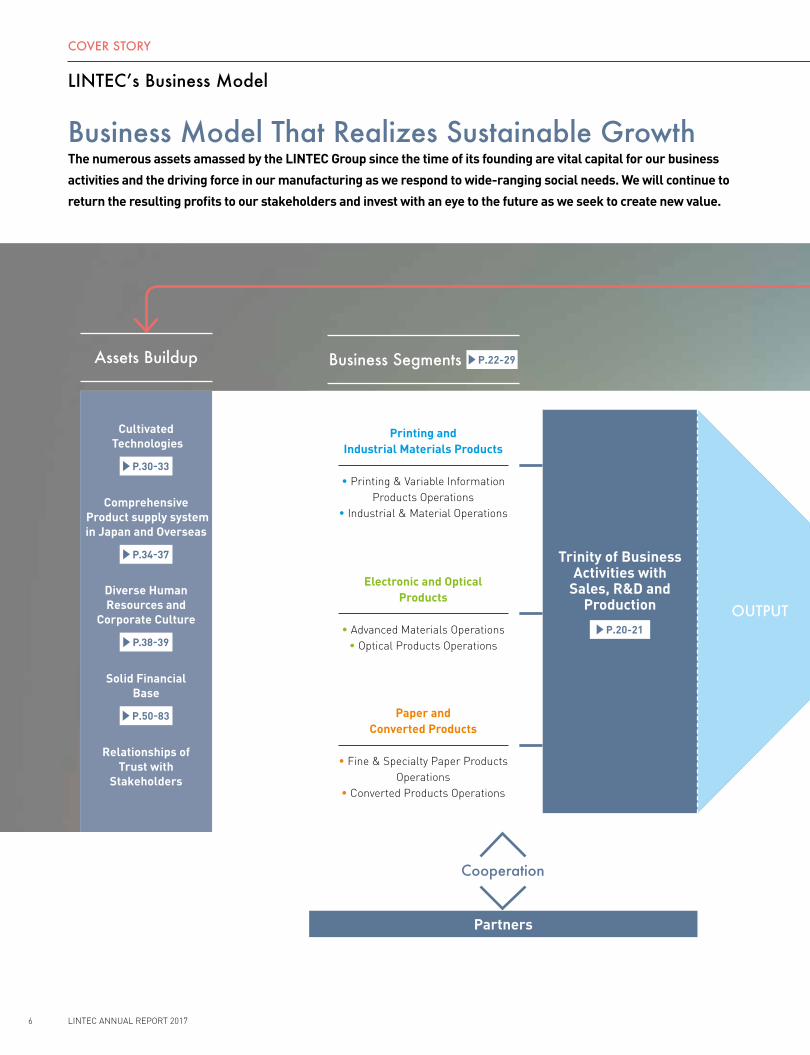
Business Model That Realizes Sustainable Growth The numerous assets amassed by the LINTEC Group since the time of its founding are vital capital for our business
activities and the driving force in our manufacturing as we respond to wide-ranging social needs. We will continue to
return the resulting profits to our stakeholders and invest with an eye to the future as we seek to create new value.
COVER STORY
LINTEC’s Business Model
Cultivated Technologies
P.30-33
Comprehensive Product supply system in Japan and Overseas
P.34-37
Diverse Human Resources and
Corporate Culture
P.38-39
Solid Financial Base
P.50-83
Relationships of Trust with
Stakeholders
Partners
INPUT
Cooperation
Assets Buildup Business Segments P.22-29
6 LINTEC ANNUAL REPORT 2017
Printing and Industrial Materials Products
• Printing & Variable Information
Products Operations• Industrial & Material Operations
Electronic and Optical Products
• Advanced Materials Operations
• Optical Products Operations
Paper and Converted Products
• Fine & Specialty Paper Products
Operations • Converted Products Operations
Trinity of Business Activities with
Sales, R&D and Production
P.20-21
OUTPUT

COVER STORY
Shareholders
Communities
Plants / Equipment
Employees
Accumulation & Advancement
Main Products Providing Value
7LINTEC ANNUAL REPORT 2017
Solves Our Customers’
Issues with Wide Variety of Products
Profit

Net Sales
250
200
150
100
50
02013 2014 2015 2016 2017
206.0
¥ Billion25
20
15
10
5
0
15
12
9
6
3
0
16.6
8.1
2013 2014 2015 2016 2017
Operating Income / Operating Profit Margin
¥ Billion %
Operating Income
Operating Profit Margin (right)
¥206.0 billion ¥16.6 billion
Operating Income
8.1 %
Operating Profit Margin
Total Assets
Net Assets
Total Assets / Net Assets
¥ Billion
0
60
120
180
240
300
2013 2014 2015 2016 2017
178.7
274.2
¥274.2 billion
Total Assets
¥178.7 billion
Net Assets
Net Cash Provided by Operating Activities
Net Cash Used in Investing Activities
Net Cash Provided by (Used in) Financing
Activities
–60
–40
–20
0
20
40
2013 2014 2015 2016 2017
5.3
24.4
(48.4)
Cash Flows
Net Cash Provided by Operating Activities
¥24.4 billion
Net Cash Used in Investing Activities
¥(48.4) billion
Net Cash Provided by Financing Activities
¥5.3 billion
¥ Billion
Profit Attributable to Owners of Parent
ROE (right)
Net Income per Share
Cash Dividends per Share (right)
200
160
120
80
40
0 0
20
40
60
80
100
2013 2014 2015 2016 2017
158.69
66
Net Income per Share / Cash Dividends per Share
¥ ¥
Profit Attributable to Owners of Parent / Return on Equity (ROE)
15
12
9
6
3
0
10
8
6
4
2
0
6.6
11.5
2013 2014 2015 2016 2017
¥ Billion %
¥11.5 billion
Profit Attributable to Owners of Parent ¥158.69
Net Income per Share
¥66Cash Dividends per Share
6.6 %
ROE
Performance HighlightsLINTEC Corporation and its consolidated subsidiariesFiscal years ended March 31
8 LINTEC ANNUAL REPORT 2017

P. 54
Financial SummaryPlease see pages 54–55.
Capital Expenditures
15
12
9
6
3
0
10.8
2013 2014 2015 2016 2017
¥ Billion15
12
9
6
3
0
7.5
2013 2014 2015 2016 2017
Depreciation and Amortization
¥ Billion
¥10.8 billion ¥7.5 billion
Toluene Handling Volume
Toluene Emission Volume
Toluene Handling Volume / Toluene Emission Volume
Tons10,000
8,000
6,000
4,000
2,000
02013 2014 2015 2016 2017
471
7,730
250
200
150
100
50
0
195
2013 2014 2015 2016 2017
CO2 Emissions
195 thousand tons 7,730 tons
Toluene Handling Volume
471 tons
Toluene Emission Volume
Thousand tons
4,760
2013 2014 2015 2016 2017
5,000
4,000
3,000
2,000
1,000
0
Number of EmployeesR&D Expenses
10
8
6
4
2
0
7.6
2013 2014 2015 2016 2017
¥ Billion
¥7.6 billion 4,760
9LINTEC ANNUAL REPORT 2017

MANAGEMENT STRATEGY
A Message from the President
Hiroyuki NishioRepresentative DirectorPresident, CEO and COO
Moving Forward With a Focus on The Future
10 LINTEC ANNUAL REPORT 2017

MANAGEMENT STRATEGY
Review of LIP-2016, our previous medium-term
business plan
We were able to build a platform for future growth even though we fell short of numerical targets.A major achievement of the three years under LIP-2016
was the completion of the Advanced Technology Building,
state-of-the-art research facilities in Japan in May 2015.
Its large-scale pilot coaters, with their close resemblance
to mass-production facilities in our plants, and its cutting-
edge analytical equipment have significantly increased the
speed of the product development process. Overseas, we
fleshed out our production, sales, and delivery network in
Southeast Asia and India, and in January 2015 we estab-
lished a company in Singapore, LINTEC ASIA PACIFIC
REGIONAL HEADQUARTERS PRIVATE LIMITED, to oversee
inclusive overall business strategy planning and imple-
mentation in this region. We were also active in strength-
ening our business base in Europe and North America
with three acquisitions in October–December 2016, buying
MACTAC AMERICAS, LLC and VDI, LLC in the U.S. and
purchasing stock in LINTEC GRAPHIC FILMS LIMITED in
the United Kingdom.
However, there were weak performances from some
overseas subsidiaries. Reorganization made little head-
way at MADICO, INC. in the U.S., and LINTEC (TIANJIN)
INDUSTRY CO., LTD. in China, and PT. LINTEC
INDONESIA suspended operations for a time due to strike
action. We were also affected by an economic slowdown in
China and other emerging countries in Asia. As a result,
we fell far short of the LIP-2016 targets of ¥240 billion in
net sales and ¥20 billion in operating income in the fiscal
year ended March 31, 2017, the plan’s final year.
Overview of LIP-2019
We are building on the previous medium-term business plan’s successes and disappointments as we aim for new goals.The new plan we have drawn up, LIP-2019, reflects our
desire to learn from the successes and disappointments
of LIP-2016 and move on to our next growth stage. Its
basic policy is “Deepening innovation aimed at driving
new growth.” The key numerical targets are consolidated
net sales of ¥270 billion, operating income of ¥25 billion,
and an operating profit margin and ROE of more than 9%.
The plan has four key initiatives, as shown on the next
page.
Period: From April 2017 to March 2020
Basic Policy: Deepening innovation aimed at driving new growth
Quantitative Targets: Major numerical targets in the final year of LIP-2019, the fiscal year ending March 31, 2020 (on a consolidated basis)
Net sales
¥270.0 billion
Operating income
¥25.0 billion
Operating profit margin
More than 9%
ROE
More than 9%
The whole company is working as one to achieve the goals of our new medium-term business plan, LINTEC INNOVATION
PLAN 2019 (LIP-2019), which was introduced in April 2017 and continues through the fiscal year ending March 31, 2020.
We will be approaching our tasks in a spirit of innovation and challenge throughout the plan’s three years.
LINTEC INNOVATION PLAN 2019 (LIP-2019)
11LINTEC ANNUAL REPORT 2017

A Message from the President
MANAGEMENT STRATEGY
Key initiatives1 Strengthening of regional strategy
Regional strategy is to be strengthened in global markets
with a focus on Printing and Industrial Materials Products.
In Japan, where some markets have matured, LINTEC will
work to expand share and create new demand by offering
new products and new applications while aiming for dif-
ferentiation on cost and service in established products.
In Asia, LINTEC ASIA PACIFIC will be given increased
functionality forging stronger links between manufacturing
and sales companies and we will seek to expand business
through such measures as increasing local raw materials
procurement, launching new products tailored to local
demand, and undertaking strategic M&A. Further develop-
ment of our markets in Thailand, Indonesia, and India will
be a particular focus. In Europe and North America, we
will utilize the sales channels and technological strengths
of our three 2016 acquisitions to the full and realize Group
synergies quickly. MACTAC AMERICAS products are
already being offered to customers in Asia and we look
forward to further developments along these lines.
2 Creation of new value
We want to provide original LINTEC value-added products
and services derived from identification and careful
analysis of the various issues facing our customers and
their specific requirements. To this end, it is important
that our sales personnel form a detailed picture of their
customers’ requirements from day-to-day contact and
share the information with others in the Company so that
business operations and the R&D division can study it
together. We will also aim to respond more promptly than
before to customer expectations by making full use of the
Advanced Technology Building’s testing facilities to
smooth the transition from materials development to the
proposal of manufacturing processes. New materials
development centered on electronics, optics, automobiles,
the environment, and energy will be another priority as it
will play a key role in future growth.
3 Bolstering the corporate structure
In March 2017, we announced the liquidation of LINTEC
(TIANJIN) INDUSTRY CO., LTD., which is a label printing
machine manufacturer and marketer, and we are also
working with some urgency to turn around other overseas
Group companies where earnings are weak. In June 2017,
under a radical management rationalization for MADICO,
INC., we announced full withdrawal from PV backsheets,
restructuring of the production system, and downsizing of
the workforce. We will be aiming to further strengthen the
LIP–2019 Key Initiatives 1 Strengthening of regional strategy ( 1 ) Increase in the domestic share and development of new markets and new demands ( 2 ) Strategic investment and business expansion in the Asian region ( 3 ) Expansion of the existing fields in Europe and America and the pursuit of synergies with the acquired subsidiaries
2 Creation of new value ( 1 ) Creation of products for differentiation which exceed customer needs ( 2 ) Development of next-generation products anticipating market changes
3 Bolstering the corporate structure ( 1 ) Ensuring soundness of the Group companies and continual increase in earnings ( 2 ) Promotion of cross-sectional operational reforms ( 3 ) Further promotion of cost structure reforms
4 Activities for realizing a sustainable society ( 1 ) Promotion of business activities conducive to solving social concerns ( 2 ) Promotion of work-style reforms, fostering of diverse human resources and encouragement of their active participation
in the workplace
12 LINTEC ANNUAL REPORT 2017
MANAGEMENT STRATEGY
Group structure with measures including Group company
reorganization in Japan.
At the same time, we want to make effective use of the
information system infrastructure we have built and inte-
grated into our operations to raise levels of efficiency in
our back-office operations, in particular, and optimize our
allocation of human resources. We will also be paying
heed to costs from the stage of product design and devel-
opment onward and undertaking cost restructuring initia-
tives in procurement, production, and distribution. We
expect these measures to produce cost savings of ¥2.1 bil-
lion over three years.
4 Activities for realizing a sustainable society
LINTEC has long been an enthusiastic corporate citizen in
respect of corporate social responsibility (CSR). We will be
looking to further promote business activities with an aware-
ness of the issues brought up in the Sustainable Development
Goals (SDGs), such as environmental and population-related
issues, and we expect this effort to be reflected in LINTEC’s
growth and social development. At the same time, we believe
that a dynamic workplace where a wide variety of people can
work together is essential for sustainable growth, and we will
strive to enhance the working environment with Group initia-
tives in areas such as work-style reform, female participation
in business activities, jobs for persons with disabilities, and
staff training at Group companies overseas.
A message to our shareholders and investors
Having fallen short of our previous medium-term busi-
ness plan’s targets, we are aiming to keep the PDCA
cycle* turning as we pursue the LIP-2019 targets, so that
we identify areas where we deviate from plan, investigate
the causes thoroughly, and respond promptly with correc-
tive action. In line with the plan’s basic policy and with the
objectives of deepening the innovation LINTEC has built
up over the years and generating new growth, we are pro-
moting a radical rethink of individual employees’ mind-set
and business practices.
Increasing our employees’ level of satisfaction is crucial
to enhancing customer satisfaction and hence elevating
our earnings. We will therefore strive to create an even
more rewarding and happier workplace for all our
employees in pursuit of sustained growth.
As we move forward, we would like to ask our share-
holders and investors for their continued support.
August 2017
Hiroyuki Nishio
Representative Director
President, CEO and COO
We are aiming to keep the PDCA cycle turning as we pursue the LIP-2019 targets.
*PDCA cycle: Plan-Do-Check-Act cycle for continuous process improvement through repetition of its four phases
13LINTEC ANNUAL REPORT 2017 13LINTEC ANNUAL REPORT 2017

A Message from the CFO
MANAGEMENT STRATEGY
Through active dialogue with shareholders and investors, we will continue to improve corporate value.
Review of performance in the fiscal year ended March
31, 2017 and performance outlook for the fiscal year
ending March 31, 2018
Business conditions were severe in the fiscal year ended
March 31, 2017, with a strong yen and a slowdown in China
and other Asian emerging countries. Profits were also
squeezed by weak performances at some overseas sub-
sidiaries and one-off costs arising from three acquisitions
in Europe and North America. As a result, consolidated
net sales declined 2.2% year-on-year, to ¥206.0 billion, and
operating income declined 6.2%, to ¥16.6 billion. Profit
attributable to owners of parent increased 5.1% year-on-
year, to ¥11.5 billion, as there were gains on sales of invest-
ment securities and a boost from tax effect accounting.
The three acquisitions involved goodwill of approxi-
mately ¥33.5 billion, which is to be amortized 10 years.
Profits will be heavily impacted during this period and we
are therefore seeking early realization of synergies in
sales channels and technology.
Major negative influences in the fiscal year ended March
31, 2017 should be eliminated in the fiscal year ending
March 31, 2018. The one-off, three-company acquisition
costs and the losses at the Chinese subsidiary currently
undergoing liquidation will not recur, and losses at PT.
LINTEC INDONESIA should narrow following the resolu-
tion of its labor issues. In addition, the three acquisitions
will make a 12-month contribution to consolidated busi-
ness results and our business related to semiconductors
and electronic components is expected to trend strongly.
We therefore project year-on-year growth of 21.4%, to
¥250.0 billion, for net sales; growth of 20.5%, to ¥20.0 bil-
lion, for operating income; and growth of 17.9%, to ¥13.5
billion, for profit attributable to owners of parent.
FY 2017 Business Results and FY 2018 Forecasts (year-on-year)
FY2017 FY2018 Forecasts
Net Sales ¥206.0 billion (-2.2%)
¥250.0 billion (+21.4%)
Operating Income ¥16.6 billion (-6.2%)
¥20.0 billion (+20.5%)
Profit Attributable to Owners of Parent
¥11.5 billion (+5.1%)
¥13.5 billion (+17.9%)
Hitoshi AsaiDirectorVice President Executive Officer and CFO
(Fiscal year ended / ending March 31)
14 LINTEC ANNUAL REPORT 2017

MANAGEMENT STRATEGY
Foreign exchange impact
Yen appreciation is positive for our procurement of pulp
and petrochemical raw materials, but overall it is a disad-
vantage because it reduces the yen translation of over-
seas subsidiaries’ earnings and has a negative impact on
the LINTEC parent’s transactions with overseas subsidiar-
ies. In the fiscal year ended March 31, 2017, the yen appre-
ciation was a negative of approximately ¥6.8 billion for
sales and ¥2.3 billion for operating income. The Group’s
overseas sales ratio was 37.8% and foreign exchange
impact will now increase further following the consolida-
tion of the three acquisitions.
To date, operating income sensitivity to ¥1 movement
against the U.S. dollar has been around ¥100–¥200 million,
but it will increase as a result of the three-company con-
solidation. The Group undertakes many transactions in
Korean won, Chinese yuan, and Taiwan dollars and this
aspect of impact from foreign currency movement also
warrants attention.
Growth investments and shareholder returns
We intend to continue making proactive use of cash for
capital expenditures in growth areas and M&A. Where
necessary, we will finance business expansion with loans.
I believe there are various views on ROE enhancement
and our view is basically that ROE will rise if we increase
profits steadily.
Dividends form the basis of our thinking on returns to
shareholders, which we regard as one of the most impor-
tant management issues. We aim to make stable and con-
tinued returns while maintaining a balance with retained
earnings to support a healthy balance sheet. In the fiscal
year ended March 31, 2017, we paid an annual dividend of
¥66, an increase of ¥12 over the previous year. In the fiscal
year ending March 31, 2018, we plan to pay an annual divi-
dend of ¥66 based on our projection of net income per
share of ¥187.11.
Dialogue with shareholders and investors
We believe a good understanding of LINTEC is the key
prerequisite for constructive dialogue with shareholders
and investors. LINTEC is sometimes difficult to under-
stand due to the wide diversity of its business, and views
differ depending on the observer. It is important for every-
one to have a proper understanding of the true situation,
including LINTEC’s special characteristics, its strengths,
and its weaknesses. To this end, we have to communicate
information at appropriate times and in appropriate ways.
We will seek to maintain diverse forms of active dialogue
with shareholders and investors that will lead to sustained
growth for LINTEC, enhancement of corporate value over
the medium and long term, and appropriate pricing of our
shares.
80
60
40
20
020142013 2015 20172016 2018
(Forecast)(Fiscal years ended / ending March 31)
4234
4854
66 66
Cash Dividends per Share
¥
8
6
4
2
020142013 2015 20172016
(Fiscal years ended March 31)
5.85.6
7.26.4 6.6
ROE
%
15LINTEC ANNUAL REPORT 2017

Overseas Business HistoryIn its endeavors to establish a label market in Japan, the Company sought to obtain information on advanced adhesive label tech-
nologies in Europe and the U.S. from an early stage in its history. “A-100 type” label printing machine the Company developed in
1973 as part of its efforts to expand sales of adhesive products for labels attracted great attention from Europe, the U.S., and Asia.
LINTEC’s first overseas office was an office in Beijing that opened in 1985. In addition to cultivating label markets in China, the
Company commenced development of overseas business in window films for automobiles and buildings with the acquisition of
MADICO, INC. in the U.S. in 1987.
In 1994, LINTEC opened a sales office in Singapore to expand sales of semiconductor-related products. The following year this
office was incorporated as LINTEC SINGAPORE PRIVATE LIMITED and its business was extended to products such as adhesive
products for labels. It subsequently became the strategy center for sales network expansion in Southeast Asia.
On the manufacturing side, the Group’s first Asian adhesive products plant, PT. LINTEC INDONESIA, was also established in
1994. Thereafter the product supply structure was strengthened by building plants in Malaysia, China, South Korea, and Taiwan
based on the concept of local production, which means that we manufacture closer to the customer and thereby provide our cus-
tomers with a stable supply of products.
Following the establishment of a production base in Thailand in 2011, sales offices were set up in quick succession across
Southeast Asia and in India, and in January 2015 LINTEC ASIA PACIFIC was established in Singapore to oversee all sales bases in
the region.
In 2016, LINTEC secured a foothold for full-scale business development in the European and North American markets with
three acquisitions in the U.S. and the U.K.
SPECIAL FEATURE
The LINTEC Global NetworkLINTEC has been very active in globalizing its business in recent years and currently has plants and offices in
19 countries and regions. “Strengthening of regional strategy” is a key initiative in the medium-term
business plan LIP-2019 as LINTEC strives to build up businesses in Japan and overseas. Below we outline the
history of LINTEC’s overseas business expansion and profile the three companies in Europe and North
America that became subsidiaries in 2016.
16 LINTEC ANNUAL REPORT 2017

Manufacturing subsidiary
Sales subsidiary, Office Holding company, Regional headquarters Plants, Branch offices, and R&D offices of subsidiaries
SPECIAL FEATURE
Overseas Sales / Overseas Sales RatioThe Group’s overseas sales in the fiscal year ended March 31, 2017 were ¥77.8 billion, an increase of approximately ¥36 billion
compared with 10 years previously. The overseas sales ratio rose from 21.8% in the fiscal year ended March 31, 2007 to 37.8%.
It is expected to be close to 50% from the fiscal year ending March 31, 2018, as it will include the full-year consolidated contri-
bution of the three companies converted to subsidiaries in the fiscal year ended March 31, 2017.
Overseas sales have increased approximately ¥36 billion over the last 10 years with average annual growth of 6.4%.
Japan
Performance trends
FY2007Net Sales
¥192.7 billionFiscal year ended
March 31
FY2017Net Sales
¥206.0 billionFiscal year ended
March 31
Overseas
¥41.9 billion
Overseas
¥77.8 billion
Approx. 1.9 times
Japan
21.8% 37.8%Ratio of overseas sales to net sales
17LINTEC ANNUAL REPORT 2017

MACTAC AMERICAS, LLCAdhesive materials manufacturer MACTAC has a solid position in
North America, where the market is growing at a steady 2%–3%
annually and accounts for an approximately 30% share of the global
adhesive label materials market. Working with three manufacturing
bases in the U.S. and Mexico, it has good relationships with its more
than 1,000 customers and possesses a long supply record and
strong brand. In addition to adhesive products for labels, MACTAC
handles decorative graphic sheets that can be used as wall hang-
ings and a variety of industrial and medical tapes. Its sales total
approximately ¥35 billion.
MACTAC complements LINTEC’s strengths in adhesive films with a
focus on adhesive papers and excels in hot-melt adhesive formulation
technology that the LINTEC Group did not possess before. It also
brings high-speed coating facilities to the Group for the first time. The
company’s extensive sales network in North America will facilitate the
rollout of LINTEC products in this market, and by engaging in product
development that combines the two companies’ technologies, LINTEC
will seek to grow business in other regions as well.
FocusWe profile the three 2016 acquisitions in the U.S. and the U.K. with comments from company representatives.
SPECIAL FEATURE
Edward LaForge, President
The true strength of MACTAC comprises our employees, technology, and culture. The innovative
spirit and strong R&D team at MACTAC have led to unique technology solutions, including our hot-
melt adhesive formulation. We believe combining LINTEC and MACTAC technologies will strengthen
our market positions, and we are confident that “our products,” including LINTEC’s, will extend their
global reach. What’s more, we hope to fuse our respective corporate cultures, technologies, and
strategies to generate the benefits of positive synergy early on, and contribute to the Group.
MACtac Americas, LLCHead office: Ohio, U.S.A. Established: 1959 Number of employees: 496 (As of December 31, 2016) Net sales: ¥34.2 billionOperating income: ¥3.6 billion (Year ended December 31, 2016) Acquisition price: Approx. $270 million (Debt assumption is not included)
Head office
Columbus Plant
18 LINTEC ANNUAL REPORT 2017

VDI, LLCBased in the U.S. state of Kentucky, VDI is a manufacturer of func-
tional films. The company uses metallizing technology, which forms
thin metal layers on film surfaces, to make metal vapor deposition
films and sputtering* films that it markets itself. As it is a supplier to
MADICO, LINTEC’s window film manufacturing subsidiary in the U.S.,
there is potential for cost savings in materials procurement. The
LINTEC Group has not had metallizing technologies before and will be
using them in product development to roll out business in new fields.
* Sputtering: The ejection of particles by bombarding materials such as metals and oxides at high energies in a vacuum and the deposition of the particles on films and other surfaces.
SPECIAL FEATURE
David Bryant, President
We believe “Quality, Innovation, and Service” are three keys to our success. Producing quality
products generates satisfied customers; innovation allows us to serve many markets across the
globe; and excellent client service generates future business. We believe VDI and LINTEC have
many things in common, as manufacturers. We both are very active in the window film market
and look for new technologies to broaden opportunity. From now on, we at VDI, as a LINTEC family
member, will absorb various things and contribute to the family with better performances.
LINTEC GRAPHIC FILMS LIMITEDLINTEC GRAPHIC FILMS signed a trademark licensing agreement
with LINTEC in 2010, thereby adopting the Company’s name, and is
the U.K. sales company for adhesive products, with a focus on the
Company’s adhesive products for labels, graphic sheets, and
window films. Its name will be changed to LINTEC EUROPE (UK)
LIMITED before the Group exhibits at the world’s largest label event,
Labelexpo Europe 2017, in late September in Belgium. LINTEC will
be aiming to accelerate new customer acquisition in Europe by
making even more effective use than before of the company’s mar-
keting strengths and wide-ranging sales network.
Andrew James Voss, Managing Director
LINTEC’s corporate culture is ethical, creative, and positive. The underlying culture of LINTEC
GRAPHIC FILMS, LINTEC’s business partner, is very similar to that of the LINTEC Group. Having
strengthened our ties with LINTEC EUROPE B.V. through our change of name, we will be aiming
to expand sales in Europe. It’s highly rewarding work. We will continue providing our customers
better products and services to help LINTEC become recognized in Europe as an innovation
leader.
VDI, LLCHead office: Kentucky, U.S.A. Established: 1971 Number of employees: 36 (As of December 31, 2016) Net sales: ¥1,070 million Operating income: ¥20 million (Year ended December 31, 2016)Acquisition price: $26 million (Debt assumption is not included)
Lintec Graphic Films LimitedHead office: Buckinghamshire, U.K. Established: 1993 Number of employees: 18 (As of October 31, 2016) Net sales: ¥850 million Operating income: ¥130 million (Year ended October 31, 2016) Acquisition price: £7.3 million
19LINTEC ANNUAL REPORT 2017

LINTEC’s Value Creation
CORPORATE VALUE INITIATIVES
Three Divisions Working as OneAs a manufacturer, LINTEC conducts its business primarily through the Sales
Division, which interfaces with customers on a day-to-day basis; the
Research & Development Division, which creates new technologies and products;
and the Production Division, which is responsible for the stable supply of high-quality
products. The three divisions work in unison within all processes, from development
to sales, enabling LINTEC to create original value and provide products that make
customers happy. Research personnel accompany sales staff to customers to get a
precise picture of customer requirements, while sales and research staff visit
production sites to consult on solutions for particular issues that arise.
20 LINTEC ANNUAL REPORT 201720 LINTEC ANNUAL REPORT 2017

Customer
CORPORATE VALUE INITIATIVES
SalesLINTEC’s six business operations produce a wide diversity of prod-ucts. Materials and equipment are combined to offer compre-hensive solutions to issues faced by customers.
Human ResourcesOur employees lie at the heart of our concerted business activities.
LINTEC seeks to foster human resources, which it regards as an important asset, and provide them with a congenial working environment.
Research and DevelopmentOriginal technologies developed over many years are fused at sophisticated levels in the development of groundbreaking new prod-ucts. Market-dialogue R&D, where research staff communicate directly with the customer, is one of LINTEC’s strengths.
ProductionState-of-the-art production facilities, original production technology, and rigorous supply chain management are deployed to supply a steady stream of safe and high-quality products to customers.
21LINTEC ANNUAL REPORT 2017

CORPORATE VALUE INITIATIVES
SalesThe Business Administration Division, which is responsible for sales, provides customer coverage throughout Japan
from 11 offices. The Iidabashi office is the largest, with approximately 300 staff in Tokyo, and the network also includes
Osaka and Nagoya. The LINTEC Group has more than 50 production and sales offices in Asia, Europe, and North
America, supplying LINTEC products worldwide.
The Group’s business is divided into six operations, each of which conducts sales activities based on its own strate-
gies. These operations are classified under three segments—Printing and Industrial Materials Products, Electronic
and Optical Products, and Paper and Converted Products—in accordance with product, technology, and market.
Printing and Industrial Materials Products
Printing & Variable Information Products Operations
Industrial & Material Operations
Advanced Materials Operations
Optical Products Operations
Fine & Specialty Paper Products Operations
Converted Products Operations
Electronic and Optical Products
Paper and Converted Products
22 LINTEC ANNUAL REPORT 2017

CORPORATE VALUE INITIATIVES
Share of Net Sales
Printing and Industrial Materials Products
¥ 85.7 billion
41.6 %
Paper and Converted Products
¥ 37.1 billion
18.0 %
Electronic and Optical Products
¥ 83.2 billion
40.4 %
Share of Operating Income
Printing and Industrial Materials Products
¥ 1.7 billion
10.1 %
Paper and Converted Products
¥ 5.8 billion
34.7 %
Electronic and Optical Products
¥ 9.2 billion
55.2 %
Net Sales
¥ 206.0 billionFiscal year ended
March 31, 2017
Operating Income
¥ 16.6 billionFiscal year ended
March 31, 2017
Note: Operating income composition data is based on figures before the elimination of intra-segment transactions.
Makoto Hattori Director, Managing Executive Officer
General Manager, Business Administration Div.
I became General Manager in April 2017 and feel a strong sense of responsibility for achieving the goals of the medium-term business plan LIP-2019. The numerical targets of the plan’s final year were compiled on a bottom-up basis so that if each opera-tion reaches its targets the Group will too. Having failed to reach the targets of the previous medium-term business plan, I intend to put a structure in place for thorough analysis of the causes if our performance deviates from target and rapid remedial action. “Strengthening of regional strategy” is a key LIP-2019 initia-tive. It requires us to think about Japan, Asia, Europe, and North America, for example, as individual markets. This is not a Japan / overseas divide. Although Japan is said to be a mature market, many of our businesses have a domestic emphasis and most
materials, technology, and services originate from Japan. Japan therefore remains an important market that merits continued effort. In Asia, the subsidiaries that have been put in place in Southeast Asia and India in recent years are not yet functioning at full strength, and we will be reorganizing the network in accor-dance with changes in market conditions. In Europe and North America, we will aim to expand sales in Printing and Industrial Materials Products in conjunction with the three companies that became subsidiaries in 2016. In all markets, the most important thing is to understand the true demands of the markets, and to this end we will take steps to strengthen our communication with customers.
A Message from the General Manager
23LINTEC ANNUAL REPORT 2017

Printing and Industrial Materials Products
CORPORATE VALUE INITIATIVES
Printing & Variable Information Products OperationsThese operations manufacture and sell the Group’s mainstay adhesive papers and films for labels. In particular, they have an approxi-
mately 60% share of Japan’s adhesive film market. Overseas, a manufacturing and sales network is being expanded in China and
Southeast Asia, and in 2016 business expansion also included making U.S. company MACTAC AMERICAS, LLC a LINTEC subsidiary.
Business Strategies The Japanese market for adhesive papers and films for labels is maturing, but we will aim for
further growth in share by stepping up sales activities tailored to specific regions. Overseas, in the
fiscal year ended March 31, 2017, our business was impacted heavily by the economic slowdown in
China and strike action at PT. LINTEC INDONESIA. We plan to review our sales strategies for
Southeast Asia, with LINTEC ASIA PACIFIC playing the central role, while also launching new
products that use local materials. In Europe, we will be aiming to expand sales by exhibiting at the
world’s largest label event, Labelexpo Europe 2017, in autumn in Belgium, and drawing on the
marketing strengths of U.K. company LINTEC GRAPHIC FILMS. In the U.S., we will use MACTAC
AMERICAS’ sales channels to market LINTEC products while also rolling out MACTAC products in
Southeast Asia.
Masaaki YoshitakeExecutive OfficerGeneral Manager, Printing & Variable Information Products Operations, Business Administration Div.
Main Products• Adhesive papers and films
for labels
SalesResults of Fiscal Year 2017
55.1
¥ 95.5 billion
FY2017 FY2020 (Forecast)
Goal for Fiscal Year 2020
¥ 55.1 billion
26.7%
Net Sales
¥ 206.0 billionFiscal year ended
March 31, 2017
(Fiscal years ended / ending March 31)
24 LINTEC ANNUAL REPORT 2017

CORPORATE VALUE INITIATIVES
Industrial & Material OperationsThese operations provide an extremely wide range of products, from window films with various functions such as cutting out heat
and ultra-violet light when they are attached to building and automobile windows through to automobile-use adhesive products for
vehicle body decoration and protection, industrial-use adhesive tapes for bonding components in mobile and other devices,
barcode printers used in production lines and distribution, labeling machines for automated labeling, films for outdoor signs and
advertising, and interior finishing mounting sheets.
Main Products• Window films• Automobile-use adhesive products• Industrial-use adhesive tapes• Barcode printers• Labeling machines• Films for outdoor signs
and advertising• Interior finishing mounting sheets
SalesResults of Fiscal Year 2017
¥ 30.6 billion
14.9%
Business Strategies A major topic for Industrial & Material Operations is strengthening our overseas business foundation
centered on window films and motorcycle- and automobile-use adhesive products. We have estab-
lished a good reputation for product quality overseas, and now we need to collaborate with LINTEC
ASIA PACIFIC and the three U.S. and European companies that became subsidiaries in 2016 on flesh-
ing out our sales network and raising brand awareness. Training globally oriented staff and developing
products adapted to local requirements are pressing tasks in this regard. Fundamental business man-
agement rationalization has been announced for MADICO in the U.S., which is still performing weakly,
and we will also work with our manufacturing bases in Thailand and Suzhou, China to build an optimum
production and sales structure for window films and other products.
In Japan we will be focusing on distribution and automotive applications, and we will also step up our
sales promotion activities for signs and graphic sheets in anticipation of growth in demand.
Shuji MorikawaDirector, Executive Officer General Manager, Industrial & Material Operations, Business Administration Div.
Goal for Fiscal Year 2020
30.6¥ 41.5 billion
FY2017
Net Sales
¥ 206.0 billionFiscal year ended
March 31, 2017
(Fiscal years ended / ending March 31)
FY2020 (Forecast)
25LINTEC ANNUAL REPORT 2017

Electronic and Optical Products
CORPORATE VALUE INITIATIVES
Advanced Materials OperationsWe are building a unique position in the electronics industry with products such as specialized adhesive tapes that are essential in
semiconductor chip manufacturing and mounting processes, and we also make equipment that leverages these tapes’ special
features fully. In addition, we produce release films that are crucial in the production of multilayer ceramic capacitors, which are
tiny electronic components. The development of new, next-generation sheet materials is another of our focuses.
Business Strategies The electronics industry is vibrant but products that are selling well now may not do so in the future. We
constantly strives to anticipate needs so that we can supply our customers with products that meet
their requirements just when they need them. Demand for quality in our products continues to rise year
after year as end products increase in sophistication and capacity while becoming thinner. We will be
strengthening our ties with suppliers as we strive for a stable supply of high-quality products.
We think that demand for semiconductors and electronic components will rise significantly going
forward due to the growth of the Internet of Things (IoT) and the introduction of next-generation,
high-speed communications. We will aim to meet our targets by developing next-generation
products, such as optically clear adhesive sheets for automobile panels, as a fourth pillar of opera-
tions to stand alongside our established pillars of semiconductor-related adhesive tapes and equip-
ment and multilayer ceramic capacitor-related tapes.
Takeshi KaiyaExecutive Officer General Manager, Advanced Materials Operations, Business Administration Div.
Main Products• Semiconductor-related adhesive
tapes and equipment• Multilayer ceramic
capacitor-related tapes
Sales Results of Fiscal Year 2017
FY2017
43.0¥ 53.0 billion
Goal for Fiscal Year 2020
¥ 43.0 billion
20.9%Net Sales
¥ 206.0 billionFiscal year ended
March 31, 2017
FY2020 (Forecast)
(Fiscal years ended / ending March 31)
26 LINTEC ANNUAL REPORT 2017

CORPORATE VALUE INITIATIVES
FY2017
40.2 ¥ 40.0 billion
Optical Products OperationsWe deploy our development technologies for special adhesives and surface coating materials and precision coating technology
and use cutting-edge production facilities to provide adhesive processing for optically functional films such as polarizing films and
retardation films that are used in LCDs. We also undertake surface improvement processing for polarizing films, such as antiglare
hard coat processing, which protects films from scratches and reduces reflectivity.
Main Products• Polarizing films and retardation films
(adhesive processing)• Polarizing films
(surface improvement processing)
SalesResults of Fiscal Year 2017
Business Strategies The optical display market is in a period of major change as organic light-emitting diode (OLED)
displays become more widespread and Chinese LCD panel makers emerge. To survive this difficult
period successfully, we believe it is important to listen to our customers and then think and act.
While the market shift from LCDs to OLED displays is gradually progressing, the market size for
these displays is still small, meaning that they do not have a significant impact on our business
at the moment. However, we must pay close attention to the level of quality that will be demanded
in the future and to how volume and cost will change. We will continue to strengthen ties with our
Group customer, an optical functional film manufacturer, as we seek to supply high-quality products
utilizing the cutting-edge facilities that started up in 2016 and build an optimal global production
structure for market change.
Shinji ItoGeneral Manager, Optical Products Operations, Business Administration Div.
Goal for Fiscal Year 2020
¥ 40.2 billion
19.5%Net Sales
¥ 206.0 billionFiscal year ended
March 31, 2017
(Fiscal years ended / ending March 31)
FY2020 (Forecast)
27LINTEC ANNUAL REPORT 2017

Paper and Converted Products
CORPORATE VALUE INITIATIVES
FY2017
16.5 ¥ 18.0 billion
Fine & Specialty Paper Products OperationsWe have the leading share in the Japanese market for color papers for envelopes and colored construction papers. We also manu-
facture and sell specialty papers including oil resistant papers used in food packaging, dust-free papers for use in places such as
clean rooms, high-grade printing papers with special textures, and high-grade papers for paper products used in business cards and
postcards. Our business is currently centered on Japan but we will be undertaking sales activities with an eye on overseas markets.
Business Strategies Our market is shrinking as the paperless trend gains traction, and to secure earnings in this
environment LINTEC’s medium-term business plan LIP-2019 calls for new product launches to
sustain and expand current business in Japan combined with proactive development of new
markets, including overseas markets.
The market environment is harsh for our mainstay color papers for envelopes, but sales of prod-
ucts that prevent the contents from being seen from the outside are growing steadily. Our new water-
repellent products have been well received and we want to continue developing and offering such
high-value-added products. We will work to expand sales of special function papers, which represent
one of our fortes, in overseas markets, where these papers have yet to fully penetrate.
Toshimi Sugaya Executive OfficerGeneral Manager, Fine & Specialty Paper Products Operations, Business Administration Div.
Main Products• Color papers for envelopes• Colored construction papers• Special function papers• High-grade printing papers• High-grade papers for paper products
SalesResults of Fiscal Year 2017 Goal for Fiscal Year 2020
¥ 16.5 billion
8.0%Net Sales
¥ 206.0 billionFiscal year ended
March 31, 2017
FY2020 (Forecast)
(Fiscal years ended / ending March 31)
28 LINTEC ANNUAL REPORT 2017

CORPORATE VALUE INITIATIVES
FY2017
20.6 ¥ 22.0 billion
Converted Products OperationsWe endow papers and films with special functions, such as releasability and resistance to water, heat, and abrasion to create
release papers and films that protect the adhesive surfaces of a variety of adhesive products. We also produce casting papers that
are used as patterning papers for placing designs on synthetic leather and casting papers used in the manufacture of carbon fiber
composite material sheets from fibers.
Main Products• Release papers for general-use• Release films for optical-related
products• Casting papers for synthetic leather• Casting papers for carbon fiber
composite materials
SalesResults of Fiscal Year 2017
¥ 20.6 billion
10.0%
Business Strategies Our business environment is extremely severe due to a variety of factors. These include intensify-
ing price competition due to globalization, the emergence of Chinese manufacturers for casting
papers for synthetic leather, and the temporary decline in demand for passenger planes that use
carbon fiber composite materials brought about by lower crude oil prices.
Amid these conditions, we will strive to increase profits not by engaging in price competition to
respond to the cheap prices of rival companies but rather by offering differentiated quality and services
to our customers. To this end, we need to promote our business at an unrivaled pace in terms of every-
thing from launching new products to improving quality and responding to customer inquiries.
Going forward, we will make concerted efforts in product development and improvement focusing
on various key issues, such as developing casting papers for synthetic leather using a brand-new
embossing method, enhancing the durability of casting papers for carbon fiber composite materials,
and increasing the number of solvent-free release papers to respond to the environment.
Yutaka IwasakiExecutive Officer General Manager, Converted Products Operations, Business Administration Div.
Goal for Fiscal Year 2020
Net Sales
¥ 206.0 billionFiscal year ended
March 31, 2017
(Fiscal years ended / ending March 31)
FY2020 (Forecast)
29LINTEC ANNUAL REPORT 2017

Adhesive applicationsThrough the development of adhe-
sives and substrates and the com-
bination of related technologies, we
are expanding the range of fields in
which the basic functions of adhe-
sive products, primarily adhesion
and release, are utilized.
Surface improvement Through the chemical and physical
processing of the surfaces of paper
and film, we are enhancing their
characteristics and adding new
functionality.
System development Through the systemization of
machinery and equipment and
building high-level systems that
draw on the distinctive characteris-
tics of materials, we are providing
advanced solutions.
Specialty papers and release materials
productionWe use original papermaking
technologies and coating, impreg-
nation, and laminating technolo-
gies to develop special function
papers and high-value-added
materials that transcend traditional
concepts of paper.
CORPORATE VALUE INITIATIVES
Research and DevelopmentAs a technology-centered company, we realize that strengthening R&D capabilities is one of our most impor-
tant management strategies for achieving sustainable growth. Two approaches help us to create both products
that resolve our customers’ technological issues and products that are unprecedented, innovative, and lead the
market: the developing of functional materials and related processing technologies that leverage our propri-
etary technological capabilities and a market-dialogue style of research that emphasizes user needs. Going
forward, we will further strengthen our R&D systems to accelerate the speed of product development and
create new technologies.
Four Core Technologies
Research and Development StructureThe Research & Development Division’s research center has not only state-of-the-art research facilities but also a clean room with the same semiconductor-related equipment that is found in the production environment of our customers. The addition of the Advanced Technology Building, with its large-scale pilot coaters
that closely resemble factory mass production facilities, in 2015, provided a structure for smooth flow from R&D to mass produc-tion. Approximately 200 research personnel are at work in eight laboratories and other departments. In addition, the Nano-Science & Technology Center in the U.S. state of Texas is engaged in research in new fields outside our current technology domain.
30 LINTEC ANNUAL REPORT 2017
CORPORATE VALUE INITIATIVES
R&D AchievementsIn the fiscal year under review, R&D expenses incurred by the Group amounted to ¥7.6 billion. The following is an overview of the principal R&D activities conducted by each operational segment.
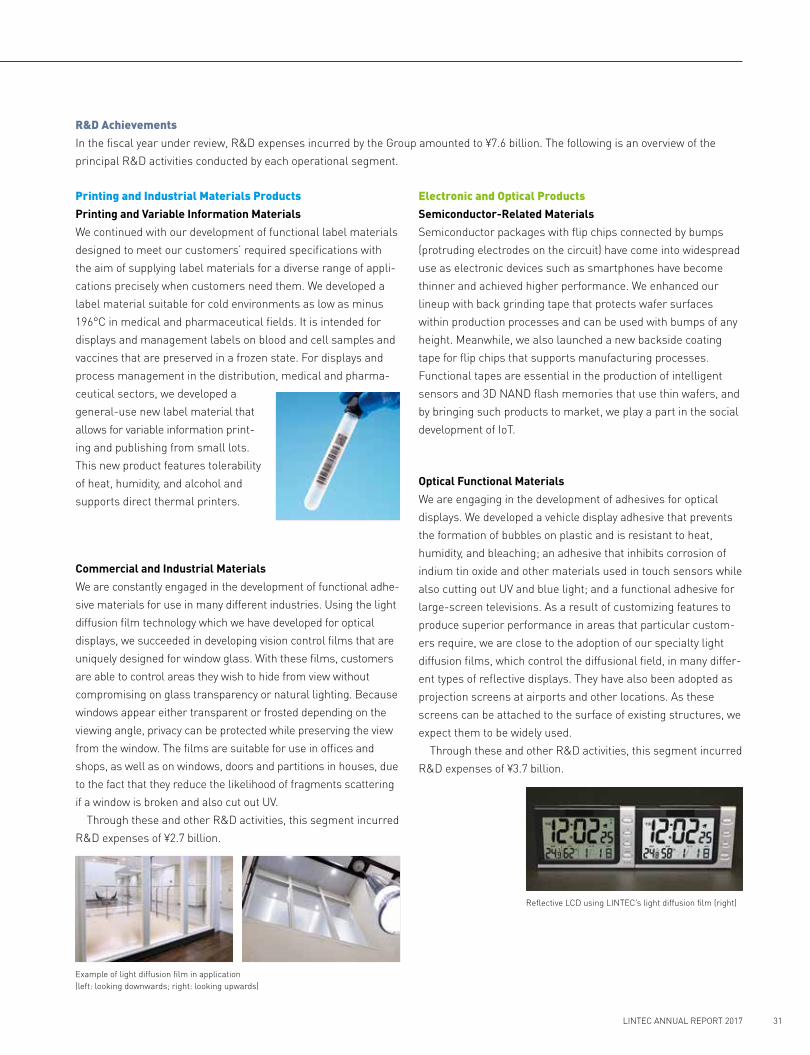
Printing and Industrial Materials ProductsPrinting and Variable Information MaterialsWe continued with our development of functional label materials designed to meet our customers’ required specifications with the aim of supplying label materials for a diverse range of appli-cations precisely when customers need them. We developed a label material suitable for cold environments as low as minus 196°C in medical and pharmaceutical fields. It is intended for displays and management labels on blood and cell samples and vaccines that are preserved in a frozen state. For displays and process management in the distribution, medical and pharma-ceutical sectors, we developed a general-use new label material that allows for variable information print-ing and publishing from small lots. This new product features tolerability of heat, humidity, and alcohol and supports direct thermal printers.
Electronic and Optical ProductsSemiconductor-Related MaterialsSemiconductor packages with flip chips connected by bumps (protruding electrodes on the circuit) have come into widespread use as electronic devices such as smartphones have become thinner and achieved higher performance. We enhanced our lineup with back grinding tape that protects wafer surfaces within production processes and can be used with bumps of any height. Meanwhile, we also launched a new backside coating tape for flip chips that supports manufacturing processes. Functional tapes are essential in the production of intelligent sensors and 3D NAND flash memories that use thin wafers, and by bringing such products to market, we play a part in the social development of IoT.
Optical Functional MaterialsWe are engaging in the development of adhesives for optical displays. We developed a vehicle display adhesive that prevents the formation of bubbles on plastic and is resistant to heat, humidity, and bleaching; an adhesive that inhibits corrosion of indium tin oxide and other materials used in touch sensors while also cutting out UV and blue light; and a functional adhesive for large-screen televisions. As a result of customizing features to produce superior performance in areas that particular custom-ers require, we are close to the adoption of our specialty light diffusion films, which control the diffusional field, in many differ-ent types of reflective displays. They have also been adopted as projection screens at airports and other locations. As these screens can be attached to the surface of existing structures, we expect them to be widely used. Through these and other R&D activities, this segment incurred R&D expenses of ¥3.7 billion.
Example of light diffusion film in application (left: looking downwards; right: looking upwards)
Reflective LCD using LINTEC’s light diffusion film (right)
Commercial and Industrial MaterialsWe are constantly engaged in the development of functional adhe-sive materials for use in many different industries. Using the light diffusion film technology which we have developed for optical displays, we succeeded in developing vision control films that are uniquely designed for window glass. With these films, customers are able to control areas they wish to hide from view without compromising on glass transparency or natural lighting. Because windows appear either transparent or frosted depending on the viewing angle, privacy can be protected while preserving the view from the window. The films are suitable for use in offices and shops, as well as on windows, doors and partitions in houses, due to the fact that they reduce the likelihood of fragments scattering if a window is broken and also cut out UV. Through these and other R&D activities, this segment incurred R&D expenses of ¥2.7 billion.
31LINTEC ANNUAL REPORT 2017

CORPORATE VALUE INITIATIVES
Research and Development
Paper and Converted ProductsWe developed and commenced sales of a new white craft paper that has excellent water-repellent characteristics and is suitable for offset printing and laser printers as a new version of an exist-ing product that was launched in 2015. The new version is also ideal for envelopes because of its concealment feature of more than 99% and the fact that it can protect important information they contain from view. Through these and other R&D activities, this segment incurred R&D expenses of ¥1.3 billion.
LINTEC entered the semiconductor business field in 1986 through the development of UV curable dicing tape that controls adhesion via UV radiation. This groundbreaking tape adheres strongly when thin wafers are being diced into chips to prevent the chips from scattering and reduces adhesion through UV radiation for easy removal when the chips are picked up. It currently has a global market share of around 50%. Surface protective tapes have been gaining market share in recent years. They are used to protect circuits on wafer surfaces when the backside is being ground to make the wafer thinner. LINTEC tapes are winning plaudits for quality and performance as wafers become thinner and circuits become finer and more complex. Our global share in backside coating tape for flip chips is almost 100%. Flip chips have protruding electrodes on their circuit, which are flipped for direct mounting on the substrate. LINTEC was the first mover in developing tapes with a view to reinforc-ing the backside surfaces of flip chips as chips became thinner. We will aim to raise our presence further in the semiconductor industry through the continuous provision and development of innovative new products with consistently high quality.
Column: LINTEC Semiconductor-Related Adhesive Tapes
Semiconductor chip manufacturing back-end processes
TapeChip
Wafer following circuit formation
Lamination of surface protective tape
Back grinding (wafer thinning)
Lamination of dicing tape
Reverse
Removal of surface protective tape
Reverse
Dicing (wafer cutting) UV irradiation of tape Picking up Die bonding Molding
Backside coating tape for flip chips
Dicing tape
BumpAdhesive
SubstrateFlip chip
32 LINTEC ANNUAL REPORT 2017

CORPORATE VALUE INITIATIVES
Intellectual Property ActivitiesThe LINTEC Group aims to increase corporate value by develop-ing original products that fully satisfy customer needs. We there-fore position intellectual property, including patents, trademarks, and design rights, acquired through these development activities as important management resources. While placing the utmost emphasis on respecting the rights of other companies, the Intellectual Property Department of the Research & Development Division promotes Companywide and strategic intellectual prop-erty activities that include identification of new candidates for invention at R&D sites to add to our intellectual property rights, which are the lifeblood of a technology-centered company. Accordingly, while linking activities such as patent portfolio building for our foundation and growth business domains with our business strategy, we aim to improve profitability based on intellectual property.
Japan
Overseas
1,600
2,000
1,200
800
400
02013 20152014 2016 2017
(Fiscal years ended March 31)
1,8481,599
Number of Patents
Tatsuya TsukidaExecutive OfficerGeneral Manager, Research & Development Div.
Under our previous medium-term business plan, LIP-2016, we sowed the seeds for bringing groundbreaking products from our laboratories to market. The Advanced Technology Building com-pleted in 2015, which enabled us to conduct testing on large-scale pilot coaters instead of on facilities in our plants, was extremely effective in improving development speed. As testing in the research center can be done without stopping existing facili-ties, we avoid production losses on lines in our plants and we are also able to obtain more detailed data. We also have coating facilities for use in developing mass production processes for next-generation products, and I think we will achieve striking results in the next three years. Our first step under the new medium-term business plan, LIP-2019, was to bring a planning department under the wing of the research center in April 2017. The aim was to incorporate our
basic tenets of “front-loading design”1 and “one-stop develop-ment”2 fully into the medium- and long-term development process to give concrete shape to the research activities of each lab without delay. Our research staff are instructed to deliver marketable products in the area on which they are working with the aim of creating as many new products as possible to contrib-ute to business. The globalization of LINTEC business has increased the importance of having research staff stationed overseas. Such staff not only provide technological support for overseas customers but are also very effective in obtaining an accurate picture of customer requirements. We therefore intend to second research staff to our subsidiaries overseas.1 “Front-loading design” involves identifying development issues and risks as far as possible
in the initial stages of product development and devising early responses to minimize the necessity for revisions at a later stage.
2 “One-stop development” consists of developing mass production processes in parallel with new materials development.
A Message from the General Manager
33LINTEC ANNUAL REPORT 2017

CORPORATE VALUE INITIATIVES
ProductionThe LINTEC Group utilizes sophisticated clean room facilities, cutting-edge manufacturing facilities, and
original production technologies in making products appropriate for wide-ranging customer requirements.
While establishing good relationships with our suppliers, we are actively making efforts to operate quality,
environmental, and business-continuity management systems. In doing so, we deliver peace of mind and
reliability to our customers.
138
6
4
7
5
1 Agatsuma Plant
2 Kumagaya Plant
3 Chiba Plant
4 Tatsuno Plant
5 Shingu Plant
6 Komatsushima Plant
7 Mishima Plant
8 Ina Technology Center
Production StructureIn Japan, our large and diverse product lineup is manufactured at 10 production plants. Keeping our eye on market needs, we are constantly striving to enhance efficiency in production by introducing the latest facilities to replace older ones and reconstructing plant layouts. Each plant also works on its own reforms and takes steps to increase yield and reduce costs. Overseas, we have more than 10 production plants, which link with their Japan counterparts to form an optimal production network.
2
34 LINTEC ANNUAL REPORT 2017

CORPORATE VALUE INITIATIVES
Zero Accident CultureSafety is the top priority in LINTEC Group plants, which are operated to preempt injuries to personnel. Our practices include risk assessment, which enables us to put safety stan-dards in place, and hazard prediction exercises as we pursue our 5S* program of organizing, clearing up, cleaning, cleanli-ness, and discipline. Safety and hygiene committees hold monthly meetings at all our sites in Japan and overseas to enable us to ascertain progress in our safety activities and share information. In April 2017, a safety conference was held for domestic plant safety officers for the exchange of informa-tion about each plant’s initiatives. We will continue activities on multiple fronts in accordance with our zero accident culture.
* 5S: Seiri (organizing), Seiton (clearing up), Seiso (cleaning), Seiketsu (cleanliness), and Shitsuke (discipline) in Japanese
Thorough Quality ManagementThe LINTEC Group has acquired ISO 9001 certification, the international standard for quality management systems, for 21 sites in Japan and overseas. We are working to further rein-force our quality assurance system by obtaining ISO 9001 for other departments and acquiring integrated certification for related sites. When comparing major quality incidents by year, if the fiscal year ended March 31, 2004, is set as 100 in an index of major quality incidents, the level has been 20 or less for the past five years. We construct and implement management systems that enable us to take swift action if a quality incident should occur, collecting information, analyzing causes, and taking steps to prevent recurrence. This framework is in place in Japan and overseas.
Fair TransactionsLINTEC has a basic policy for fair and transparent transactions based on the principle of free competition among suppliers, and our procurement activities comply with all relevant laws and regulations and social norms. For major suppliers, we require evaluations through self-audit check sheets for assess-ing suppliers based on quality, chemical substance manage-ment, administration and services, and CSR. We periodically review our purchasing processes while maintaining and strengthening partnerships.
Green ProcurementThe LINTEC Group is committed to procurement that aims to reduce environmental impact through rigorous chemical sub-stance management for raw materials, parts, and secondary materials. When procuring a new material or responding to a new regulation, we ask for suppliers’ understanding in con-ducting ingredient examinations to monitor for the presence of regulated substances. In the fiscal year ended March 31, 2017, we carried out such examinations on approximately 5,000 items. In addition, we request that suppliers engage in proac-tive environmental preservation activities and undertake rigor-ous chemical substance management.
Environmental ManagementWe have acquired global integrated certification under interna-tional standard ISO 14001 for a total of 25 sites, including the LINTEC head office and plants, Research Center, Group com-pany TOKYO LINTEC KAKO, INC., and 11 overseas Group com-panies. Following the 2015 revision of ISO 14001, we are working to achieve compliance with the revised standards and will continue to promote the acquisition of global integrated certification by overseas Group companies as we strengthen Companywide engagement in environmental preservation.
80
100
6060
40
20
02004 2013 20152014 2016 2017
(Fiscal years ended March 31)
100
20 18 14 12 13
Ratio of Quality Incidents to the Number Recorded
35LINTEC ANNUAL REPORT 2017

CORPORATE VALUE INITIATIVES
Production
Fiscal Year 2017 Emission and Transfer of Toluene
LINTEC plants
Toluene handled:
7,730 tons
Exhaust processing equipment
Quantity transferred
(Treated as waste):
467 tons
Emission into the air:
471 tons
Quantity eliminated:
6,792 tons(Elimination rate:
93.5%)Manufacturing processes for release papers and adhesive
products
Toluene flow
Note: Elimination rate = eliminated amount / (handled amount – transferred amount) ×100
Label material using recycled PET derived from used PET bottles
Window film that cuts thermal energy from sunlight High-adhesion removable-type label material that gives consideration to reuse and recycling
Reduction of Environmental ImpactThe LINTEC Group is working toward the realization of a sus-tainable society with manufacturing that has low environmental impact. CO2 emissions were reduced to 195,000 tons in the fiscal year ended March 31, 2017, from 200,000 tons in the previous year. Although the amount of waste generated in pro-duction increased, the final landfill ratio was approximately 0.03% and we have achieved zero emissions with rates below 1.0% for 10 years. In papermaking, the amount of water used per unit of production improved by 6.8% over the previous year. We are also constantly seeking to reduce the amount of volatile organic compounds (VOCs) including organic solvents that are released into the atmosphere.
Compliance with Environmental Laws, Directives, and RegulationsThe LINTEC Group seeks to be compliant with environmental laws, directives, and regulations in Japan and overseas and reduce chemical substances that are harmful to the environ-ment. In addition to responding to restricted substances stipu-lated by REACH1 and RoHS,2 we conduct environmental impact examinations of raw materials that we purchase and disclose necessary information to our customers. In the fiscal year ended March 31, 2017, we reported nine substances under the PRTR system.3 The total volume was 7,826 tons, of which 7,730 were toluene. Toluene emitted into the air amounted to 471 tons, an increase of 30 tons over the previous year, while the quantity transferred (treated as waste) was 27 tons less than in the previous year, at 467 tons.
Environmentally Friendly ProductsThe LINTEC Group has embraced the rise in environmental awareness of recent years, and continues to develop products
to meet a wide range of environmental needs. Our environmen-tally friendly product lineup pays heed to reuse, recycling, and energy saving.
1 REACH: EU regulation for the Registration, Evaluation, Authorisation and Restriction of Chemicals
2 RoHS: EU directive on the Restriction of the use of certain Hazardous Substances
3 PRTR system: The Pollutant Release and Transfer Register system that requires companies to estimate the volume of chemical substances they have released and transferred in waste and report the data to the government
36 LINTEC ANNUAL REPORT 2017

CORPORATE VALUE INITIATIVES
Efforts toward Business ContinuationThe Group is building a system that enables business opera-tions to continue or restart quickly if struck by a disaster. All the Company’s locations in Japan, subsidiaries TOKYO LINTEC KAKO, INC., and LINTEC SPECIALITY FILMS (TAIWAN), INC., have obtained certification under ISO 22301:2012, the interna-tional standard for business continuity management system (BCMS). BCMS study meetings and drills are held at all sites so that, in the event of a natural disaster or accident that disrupts
business operations, we can ensure the safety of our employ-ees and then recommence the supply of products promptly, minimizing impact on our customers and other stakeholders. We also evaluate the business continuity capabilities of sup-pliers of raw materials that are critical in securing stable sup-plies of our products. Additionally, we request that these suppliers introduce a business continuity plan (BCP) and estab-lish a system for implementing it on an organization-wide basis.
Gohei KawamuraDirector, Managing Executive OfficerGeneral Manager, Production Div.
In production, our goals revolve around safety, quality, and yield. As production General Manager, I will be pursuing our goals while also emphasizing speed in implementing necessary measures. Under the medium-term business plan LIP-2019, I want to put our plants in Japan on an even more solid footing. Keeping an eye on market trends, I will be giving consideration to invest-ments designed to strengthen our production base for the future. This includes reconstructing plants and renewing facili-ties. Our overseas plants are growing in importance as our overseas sales ratio rises. The Printing and Industrial Materials Products manufacturing bases in China and Southeast Asia are having difficulties, and the Production Division will be giving its full support to these bases to improve earnings. In the U.S., the key will be to realize synergies quickly with the two companies that became subsidiaries in 2016. MACTAC AMERICA’s hot-melt
formulation and VDI’s vapor depositing are attractive technolo-gies, and I want us to create synergies in these areas in the course of LIP-2019. LINTEC has consistently promoted on-site reform initiatives. In April 2017, a conference was held for our plant safety officers in Japan to report on their safety activities and exchange views on safety. This led to the discovery of points for improvement and to the best activities being rolled out in other plants. I will be looking to maintain a rigorous safety approach as we boost our plants’ strengths.
A Message from the General Manager
37LINTEC ANNUAL REPORT 2017

CORPORATE VALUE INITIATIVES
Respect for Diversity and Human RightsThe LINTEC Group avoids discriminatory treatment of employ-ees based on race, creed, gender, education, nationality, reli-gion, or age, thereby respecting the diversity of individuals. In the areas of recruitment and employment, the Group complies strictly with labor laws and regulations, including the prohibi-tion of unfair discrimination, child labor, and harassment, and endeavors to promote an environment where all employees can go about their work in a positive and energized frame of mind. In 2017, we conducted a Groupwide survey of human rights and working conditions that confirmed we are strong on compliance and show respect for basic human rights. We plan to make this a regular annual survey. We have a helpline through which employees can consult with the General Affairs & Human Resources Division or a lawyer if they have any concerns or have witnessed illegal behavior in the workplace. Access was extended to overseas Group companies in 2015 and an English-language helpline is also available.
Employee EducationLINTEC has a Companywide training system based on rank, as human resource education programs tailored to years of continuous service and career. To foster a globally oriented workforce and advance the careers of female employees, we
also run theme-specific group and correspondence courses to promote objectives such as second-language acquisition and encouraging women to take on a more active role in the work-place. At the same time, the Company’s intranet offers e-learn-ing programs to increase all our employees’ understanding of topics such as the environment, product quality, BCMS, and CSR.
Work-Life BalanceLINTEC is active in promoting balance between work and per-sonal life for employees to enable them to carry out their work without stress and exercise their abilities to the full. In addition to careful labor management designed to deter employees from working excessively long hours, and the implementation of a flextime system, LINTEC aims to enable employees to match their work style to their lifestyle by augmenting pro-grams such as planned vacation, which encourages employees to take their paid leave. In the fiscal year ended March 31, 2017, we continued to promote the creation of environments in which employees can work with peace of mind through such mea-sures as extending the length of periods of leave and shorten-ing work hours through the family care program, in addition to expanding the field of eligibility for shorter work hours using the childcare program.
Employment of People with DisabilitiesThe Group’s employment ratio for people with disabilities reached 2.06% in the fiscal year ended March 31, 2017, sur-passing the legally mandated ratio of 2.0%. We will endeavor to increase the ratio further with measures such as improvements to on-site facilities as required.
Human ResourcesThe LINTEC Group employs more than 5,000 people in Japan and overseas including staff at non- consolidated
companies. Diverse human resources are precious Group assets. During its 90-year history, LINTEC has
sought to foster a culture that values harmonious working relationships and also “stand out in the crowd”
individuality. This culture and a deeply rooted Companywide innovation mind-set are key Group strengths.
In its efforts to provide a congenial workplace for all, LINTEC pays constant attention to enhancing its sys-
tems and training employees.
Training seminar
38 LINTEC ANNUAL REPORT 2017

CORPORATE VALUE INITIATIVES
Rehiring SystemsTo expand work-style options for its employees, the Group operates a “job return” program for rehiring people who are still able to fill posts effectively after resigning for personal reasons such as childbirth, nursing care of a family member, or
a spouse’s transfer to a different location. We also have a system that enables employees who wish to continue working beyond the mandatory retirement age of 60 to work on one-year contracts to a maximum age of 65.
Tsunetoshi MochizukiDirector, Managing Executive OfficerGeneral Manager, General Affairs &
Human Resources Div.
To increase labor productivity, it is essential to have diverse human resources with a dynamic and healthy work style. Work-style reform has become a national theme in Japan and at LINTEC we have achieved results with our thorough labor man-agement aimed at deterring employees from working too many hours and our planned vacation system, which has increased employees’ use of paid leave. In regard to diversity, we established a committee to study the promotion of diversity in 2016, and we are seeking to pro-vide support and an appropriate work environment for employ-ees in situations such as caring for family members and bringing up small children. Our promotion of greater female participation includes initiatives to change female employees’ way of thinking, a system for returning to work after having children, and the expansion of the female ratio of hired gradu-ates, managers, and section chiefs.
In fostering human resources I have the image of a moun-tain, with specialty work knowledge at the summit and broader knowledge and understanding of related areas at the foot. The Company as a whole supports career advancement with train-ing courses tailored to the employee’s level and theme-specific courses. I want people to take pride in being a LINTEC employee and family member 10, 20, and 30 years from now and have a smile on their face as they go about their daily life. I also want to main-tain an open corporate culture where people can speak their minds. To these ends, I will be making adjustments to the work environment and improvements to human resources systems.
A Message from the General Manager
39LINTEC ANNUAL REPORT 2017

General Meeting of Shareholders
Board of Directors (Directors)
CSR Management Office• Corporate Ethics Committee• Customer Satisfaction Committee• Social Contribution Committee
Audit & Supervisory Committee
(Directors serving as Audit &
Supervisory Committee members)
Audit Office
Representative Directors
Management decisions
Operational execution
Management Meetings(Executive Officers)
Operational Execution Divisions
• Administrative Division• Marketing Division• Production Division• Technical Division• Domestic and Overseas
Subsidiaries
Appointment / Dismissal
Promotion
Informing / Reporting
Appointment / Dismissal
Appointment / Dismissal
Internal Auditing
Auditing / Supervision
Cooperation
Cooperation Informing
Account Auditing /Internal Control Auditing
Independent Auditor
Basic Philosophy
The Company believes that the fundamentals of corporate governance
are to achieve thorough legal compliance, to increase management
transparency and promote corporate ethics, and to make prompt
decisions and effectively execute operations. By enhancing and
reinforcing corporate governance, we aim to further increase our
corporate value and joint profits with shareholders.
Corporate Governance System
1. Corporate Governance System
The Company has selected the Company with Audit & Supervisory
Committee system described in the Companies Act of Japan for its
organizational structure. The Company has placed directors that are
also Audit & Supervisory Committee members with voting rights on
its Board of Directors in order to strengthen the Board’s supervisory
function, with a view to stepping up corporate governance and to
streamlining management even further. The Company has appointed
16 directors, of whom four are Audit & Supervisory Committee mem-
bers and four are outside directors.
Held once a month to make important decisions with regard to
management, Board of Directors’ meetings are also held on an ad hoc
basis as necessary to strive for rapid decision making. Primarily
comprising executive officers (including directors serving concur-
rently) responsible for the execution of business, management meet-
ings are also held once a month and endeavor to streamline business
operations through the sharing of information among all business
divisions.
The Audit & Supervisory Committee meets once a month and con-
ducts monitoring audits that focus on matters reported from the
Audit Office, which is the Company’s internal control division. In addi-
tion to performing audits covering the appropriateness and legality of
the execution of directors’ duties, each and every Audit & Supervisory
Committee member also plays a role in supervising the execution of
the directors’ duties through the exercise of the voting rights on the
Board of Directors.
• Evaluation of Board of Directors’ effectiveness
In April 2017, the Company conducted an evaluation of the effective-
ness of the Board of Directors. Details are as follows.
Overview
Based on the principles of Japan’s Corporate Governance Code, all 16
directors filled out a survey on matters such as the structure and
operation of the Board of Directors, which included some open-ended
questions. The results of these surveys were analyzed by
Corporate Governance
THE BASE THAT SUPPORTS GROWTH
40 LINTEC ANNUAL REPORT 2017

representative directors, and a final evaluation was received from
outside directors, who are independent officers of the Company. In
this final evaluation, outside directors stated that the survey ques-
tions and method were rational overall and that the measures in the
fiscal year under review (earlier distribution of documents, elimina-
tion of overlaps between the Board of Directors and management
meetings, enhancement of discussion at meetings of the Board of
Directors), which were taken based on the results of the previous
fiscal year’s survey, were producing improvements. However, the final
evaluation included suggestions for further improvements and a
request for consideration of methods of addressing the governance
themes that were set out in the fiscal year under review’s survey.
Based on this feedback, we will take steps to develop an environment
that facilitates improved Board of Directors’ effectiveness.
• Director training policies
(1) New director training
After assuming their position, new directors are provided training
from outside institutions to endow them with the legal, accounting,
and other knowledge necessary to management.
(2) Regular training
Once or twice a year, directors undergo training on contemporary
issues from lawyers or other outside lecturers. These training ses-
sions serve as opportunities to hone the sense of judgment that is
crucial to members of the Board of Directors.
(3) Special training
When necessary, directors participate in seminars at the Company’s
expense to acquire the specialized insight required to perform their
duties.
2. Internal Control System
With regard to an internal control system to ensure that the execution
of directors’ duties is in compliance with laws and regulations as well
as the Articles of Incorporation, and a system to ensure the appropri-
ateness of the execution of other business, the Company decided on
the following matters at the Board of Directors’ meeting held on June
24, 2015.
• System to ensure that the execution of the duties of directors and
employees is in compliance with laws and regulations as well as
the Articles of Incorporation
To ensure that the execution of the duties of directors and employees
is in compliance with laws and regulations as well as the Articles of
Incorporation and that a sense of ethics is maintained, the Company
established its motto of “Sincerity and Creativity,” on which its Code
of Conduct was based. To ensure the effectiveness of the compliance
system with regard to laws and regulations as well as the Articles of
Incorporation, the Audit Office—an organization under the president’s
direct supervision—investigates and verifies, by means of audits
based on the Internal Audit Regulations, whether all of the
Company’s operations are being appropriately and reasonably imple-
mented and pursuant to laws, the Articles of Incorporation, internal
rules and regulations. The results of those audits are regularly
reported to directors.
• System for storing and managing information related to the
execution of directors’ duties
Documents are stored and managed in accordance with rules determined
for each document type, including those documents stipulated by law.
• Regulations and other systems pertaining to management of risks
of loss
By promoting the issue of manuals by division and facilitating their
thorough use, the Company makes preemptive efforts to reduce or
avoid risk. In the case of specific risks, the Company promotes
reviews of and improvements to response measures as risks arise.
For emergency situations, such as the occurrence of a disaster, the
Company has established the Companywide Crisis Management
regulations, in addition to a BCMS, which is based on these regula-
tions. These are separate from risk management initiatives con-
ducted through normal operations, and we strive to ensure that a
crisis management organization can be quickly established in the
event of an emergency.
• System to ensure that the execution of the duties of directors is
efficiently conducted
In addition to setting out the duties for which directors are responsible
for and that correspond to the allocation of roles of each organization,
based on the Regulations on the Division of Duties, the Company
works to separate management from execution and accelerate
decision making by the introduction of an executive officer system.
Moreover, the Company reviews internal organizations as necessary
to be able to respond to environmental changes and works to
maintain efficiency in the execution of the duties of directors by such
means as the setting up of cross-organizational committees on an
as-required basis.
THE BASE THAT SUPPORTS GROWTH
41LINTEC ANNUAL REPORT 2017

• System to ensure the appropriateness of business in the corporate
group comprising the Company and its subsidiaries
Based on the Affiliate Company Operational Regulations, the
Company works to maintain the appropriateness of its operations as
a group entity by having each of its principal business divisions
control the operations of Group companies. Based on the Affiliate
Company Operational Regulations, the Company works to maintain a
system for receiving corporate performance, risk, and other important
reports from each Group company regularly or on an as-required
basis. Providing business management and support from the
appropriate division as necessary, the Company promotes management
efficiency in each company. To ensure that Group companies are in
compliance with laws and regulations as well as the Articles of
Incorporation, audits are conducted by each company’s internal audit
system and by the Company’s Audit Office.
• Matters relating to the employees who are tasked to assist the
duties of the Audit & Supervisory Committee, matters relating to
the independence of said employees from directors, and matters
relating to ensuring the effectiveness of Audit & Supervisory
Committee instructions with respect to said employees
To further raise the effectiveness of Audit & Supervisory Committee
audits and maintain a system to carry out audit duties more smoothly,
the Company has established the Audit & Supervisory Committee
secretariat, which supports and takes on Audit & Supervisory
Committee duties. It is assumed that the Audit & Supervisory
Committee’s consent has to be obtained for transfers of personnel to
the Audit & Supervisory Committee secretariat staff, personnel eval-
uations, and disciplinary action. The instructions and orders given to
Audit & Supervisory Committee secretariat staff are also deemed to
be given by directors serving as Audit & Supervisory Committee
members. With regard to said instructions and orders received from
Audit & Supervisory Committee members, with the exception of those
instructions and orders that are not necessary for the duties of Audit
& Supervisory Committee members, it is assumed that Audit &
Supervisory Committee secretariat staff do not receive instructions
and orders from directors or other employees.
• System relating to the reporting of cases to the Audit & Supervisory
Committee and system for ensuring that the submitting of such
reports is not seen as reason enough for the person who submitted
them to be subjected to disadvantageous treatment
With regard to cases that are likely to significantly damage the
Company or a Group company, such as violations of laws or regula-
tions, all Group directors and employees are to report such cases to
the Company’s Audit & Supervisory Committee. In addition, it is
deemed that the Audit & Supervisory Committee will be able to
directly demand business-related reports for all Group directors and
employees. Under the Company’s Internal Reporting System
Operation Regulations and its Global Internal Reporting System
Regulations, the Company has established a helpline that can be
used by all Group directors and employees and endeavors to maintain
a system to ensure that the submitting of such reports is not seen as
reason enough for the person who submitted said notification or
report to be subjected to disadvantageous treatment. In the event of
an internal notification via the helpline, this will be reported to the
Audit & Supervisory Committee.
• Matters concerning policy relating to the handling of costs or liabil-
ities arising from the execution of duties of Audit & Supervisory
Committee members
When an Audit & Supervisory Committee member invoices the
Company for the prepayment or redemption of expenses incurred for
the execution of their duties, said costs or liabilities will be promptly
handled following discussions in the department responsible, with
the exception of cases in which said costs have been recognized as
being not necessary for the execution of said Audit & Supervisory
Committee member’s duties. In addition, should Audit & Supervisory
Committee members deem that independent outside experts (such
as lawyers, certified public accountants, etc.) are necessary as advis-
ers to the Audit & Supervisory Committee, the Company will bear
those costs, with the exception of cases in which said costs have been
recognized as being not necessary for the execution of said Audit &
Supervisory Committee’s duties.
• Other system for ensuring that the Audit & Supervisory Committee
carries out audits effectively
With a view to ensuring a system so that Company information
reaches the Audit & Supervisory Committee unhindered, the
Company works to maintain an environment in which information is
Corporate Governance
THE BASE THAT SUPPORTS GROWTH
42 LINTEC ANNUAL REPORT 2017

received not only from directors (excluding directors serving as Audit
& Supervisory Committee members) and from employees but also
from independent auditors, corporate lawyers, tax accountants, and
other specialists. The Company has a system in place to ensure regu-
lar meetings with representative directors and venues for important
discussions, such as management and strategy meetings, for Audit &
Supervisory Committee members to attend and state opinions.
3. Basic Policies and Systems for Preventing Relationships with
Antisocial Forces
The Company stands in firm opposition to all antisocial forces and
organizations that threaten to disrupt the order and safety of civil
society while practicing a strict policy of non-association with such
entities. We have made this commitment clearly apparent in the
LINTEC Compliance Guidelines and are taking steps to ensure thor-
ough awareness with this regard among all directors and employees.
We reject any illegitimate requests from antisocial forces and
organizations and maintain close collaborative relationships with the
police, centers for the removal of criminal organizations, lawyers, and
other specialists to combat such requests. Should we be approached
by antisocial forces or organizations, we will closely coordinate with
such institutions, organizations, lawyers, or other specialists to
furnish a quick, organization-wide response.
4. Risk Management System
The Company has established the Companywide Crisis Management
Regulations as well as a risk management system for minimizing the
possible impact and damage to corporate value if a major problem
arises. It has also implemented and oversees the Information
Security Management Rules and the Trade Secret Management
Rules for the preservation and management of information. There
are also Companywide risk assessments centered on the CSR
Management Office.
5. Limited Liability Contracts
In accordance with Article 427, Paragraph 1 of the Companies Act, the
Company has entered into a contract with each of its non-executive
directors—outside directors Kazumori Fukushima, Toru Nozawa,
Satoshi Ohoka, and Kanako Osawa—that limits liability for compen-
sation for damages under Article 423, Paragraph 1 of the Companies
Act. Based on this contract, liability for compensation for damages is
limited to ¥10 million or the minimum liability amount stipulated by
law, whichever is greater.
Internal Audits and Audit & Supervisory Committee Audits
1. Internal Audits
The Audit Office regularly implements internal audits of divisions,
work sites, plants, and affiliated subsidiaries in addition to verifying
that operational execution processes and results comply with the law
and internal regulations. The status of these internal audits is
reported when necessary to the Audit & Supervisory Committee, and
opinions are exchanged on the results of the audits.
2. Audit & Supervisory Committee Audits
The Company’s Audit & Supervisory Committee comprises four direc-
tors serving as Audit & Supervisory Committee members, of whom
three are outside directors. While utilizing the internal control
system, the Audit & Supervisory Committee cooperates with the Audit
Office and the independent auditor, receives the necessary reports,
and conducts audits of the directors’ business execution through
such methods as exchanges of opinions. Each Audit & Supervisory
Committee member attends management and other meetings,
obtains the information needed for the audits, attends Board of
Directors’ meetings as a director, and supervises the directors in the
execution of their duties by stating opinions and participating in reso-
lutions through their voting rights.
Audit & Supervisory Committee members Hiroshi Okada and Toru
Nozawa have considerable knowledge of finance and accounting,
having gained many years of experience in their respective roles at
the Company’s administrative and audit divisions and Nippon Paper
Industries Co., Ltd.’s administrative division.
Outside Directors
The Company has selected Kazumori Fukushima, Toru Nozawa,
Satoshi Ohoka, and Kanako Osawa as its four outside directors. With
the exception of Kazumori Fukushima, the other three are also Audit
& Supervisory Committee members.
1. Human, Financial, and Business Relationships and Other Shared
Interests between the Outside Directors and the Company
There are no particular shared interests between the Company and
Kazumori Fukushima, but Nippon Paper Industries Co., Ltd., where
he serves as an executive officer, is a major trading partner of the
Company, which purchased ¥2,145 million worth of raw materials
from and sold ¥42 million worth of products to Nippon Paper (both
results from the fiscal year ended March 31, 2017). In addition, Nippon
Paper is a major shareholder in the Company; its holding amounted
THE BASE THAT SUPPORTS GROWTH
43LINTEC ANNUAL REPORT 2017

Corporate Governance
THE BASE THAT SUPPORTS GROWTH
to 21,737,792 shares (28.39% of the total number of Company shares
outstanding) on March 31, 2017.
There are no particular shared interests between the Company
and Satoshi Ohoka, who is an independent committee member as
stipulated in the Company’s rules of large-scale purchase to deal
with an act of large-scale purchase.
There are no particular shared interests between the Company
and Toru Nozawa, but Nippon Paper Industries Co., Ltd., where he
serves as a director and an executive officer, is a major trading part-
ner of the Company, which purchased ¥2,145 million worth of raw
materials from and sold ¥42 million worth of products to Nippon
Paper (both results from the fiscal year ended March 31, 2017). In
addition, Nippon Paper is a major shareholder in the Company; its
holding amounted to 21,737,792 shares (28.39% of the total number of
Company shares outstanding) on March 31, 2017.
There are no particular shared interests between the Company
and Kanako Osawa, who is an independent committee member as
stipulated in the Company’s rules of large-scale purchase to deal
with an act of large-scale purchase.
2. Functions Performed and Roles Served by Outside Directors in
the Company’s Corporate Governance
By utilizing knowledge and experience from his directorship experi-
ence at Nippon Paper Industries Co., Ltd., and his many years of
business experience in this company’s production and sales divisions,
Kazumori Fukushima is able to strengthen the Company’s Board of
Directors’ supervisory function. He is thus considered qualified to be
an outside director.
By utilizing knowledge and experience from his directorship expe-
rience at Nippon Paper Industries Co., Ltd., and his many years of
business experience in this company’s administrative divisions, Toru
Nozawa is able to audit and supervise the Company’s Board of
Directors. He is thus considered qualified to be a director serving as
an Audit & Supervisory Committee member.
By utilizing his long years of policy-based finance experience, his
rich international experience, his specialist academic experience, and
his knowledge and experience gained as an outside director in indus-
tries different to that of the Company, Satoshi Ohoka is able to audit
and supervise the Company’s Board of Directors. He is thus consid-
ered qualified to be a director serving as an Audit & Supervisory
Committee member. He is also designated as an independent director
based on the criteria stipulated by Tokyo Stock Exchange, Inc. (TSE).
By utilizing her specialist expertise and extensive knowledge
gained as an attorney, along with the knowledge and experience
gained through her career in corporate legal affairs both at home and
abroad, Kanako Osawa is able to audit and supervise the Company’s
Board of Directors. She is thus considered qualified to be a director
serving as an Audit & Supervisory Committee member. She is also
designated as an independent director based on the criteria stipu-
lated by TSE.
3. The Company’s Basic Way of Thinking with Regard to the
Independence of Outside Directors
The Company does not have its own set standards and policies with
regard to the independence of outside directors and refers instead to
the standards stipulated by TSE. Since appointment is based on a
request from the Company, we recognize that independence from
management is to be ensured.
4. Outside Directors’ Supervision of Directors’ Execution of Duties
and Internal Auditing, Mutual Cooperation with Audit &
Supervisory Committee Audits and Accounting Audits, and
Relationship with the Internal Control Division
In addition to attending Board of Directors’ meetings and making
necessary and effective remarks as appropriate during agenda delib-
erations, outside directors cooperate with the Internal Audit Division
and the independent auditor as well as oversee directors in the exe-
cution of their duties.
Remuneration of Corporate Officers
1. Total Remuneration by Corporate Officer Type
Corporate officer typeTotal
remuneration(Millions of yen)
Total remuneration by type (Millions of yen)
Number of people
receiving remuneration
Basicremuneration
Stockoptions Bonuses
Directors (excluding Audit & Supervisory Committee members and outside directors)
450 353 11 85 11
Directors (Audit & Supervisory Committee members)(excluding outside directors)
19 19 — — 1
Outside officers 16 16 — — 4
44 LINTEC ANNUAL REPORT 2017

THE BASE THAT SUPPORTS GROWTH
2. Policy Regarding Decisions on Amounts of Director Remuneration
(1) Director remuneration (excluding Audit & Supervisory Committee
members)
Remuneration of directors (excluding Audit & Supervisory Committee
members) consists of the following.
Basic remuneration
• Fixed amount determined based on rank as well as contributions to
the director shareholding association
• Long-term incentives provided by enabling directors to periodically
purchase and hold shares of Company stock through the director
shareholding association based on contributions made
Bonuses
• The Company has established short-term incentives (remuneration
linked to business performance) paid in amounts adjusted based on
consolidated business results. However, the total amount paid does
not exceed ¥150 million.
Stock options
• Long-term incentives provided together with the director
shareholding association
The amounts of remuneration are decided by the Board of
Directors in accordance with the Company’s internal rules on director
remuneration and based on the duties and responsibilities of each
director (excluding Audit & Supervisory Committee members), within
totals approved at the General Meeting of Shareholders.
The remuneration assessment advisory meeting has been estab-
lished as an advisory body for the president and CEO on matters
regarding the assessment of and decisions on remuneration for
directors (excluding Audit & Supervisory Committee members) with
the aim of improving objectivity and transparency.
This body, which has members including external specialists, provides
advice and makes suggestions to the president and CEO when necessary.
(2) Director (Audit & Supervisory Committee member) remuneration
Audit & Supervisory Committee member remuneration is dis-
cussed and decided by the Audit & Supervisory Committee in
accordance with the Company’s internal rules on director remu-
neration and based on each member’s duties and responsibilities,
within totals approved at the General Meeting of Shareholders.
Policy on Holdings of Capital Tie-Up Shares
The Company views the establishment and maintenance of stable,
long-term relationships with business partners as a matter of impor-
tance. For this reason, shares of stock are held to form capital tie-
ups when deemed appropriate based on a comprehensive evaluation
of factors such as the Company’s business relationship with the part-
ner in question. We only acquire such holdings when increasing trust
and coordination with the business partner through holdings is
judged as an effective means of mutually raising corporate value, and
these holdings are reviewed based on this perspective when neces-
sary. In exercising voting rights, the Company respects the manage-
ment policies of the investee and votes for or against proposals based
on a careful examination of whether or not the proposal will contrib-
ute to improved corporate value and shareholder returns.
Stockholdings
Stocks held for purposes other than pure investment
Number of issues: 56 issues
Total amounts recorded on balance sheet: ¥2,544 million
Fiscal Year under Review Specific Investment Shares
Top 10 issuesNumber of
shares (Thousands)
Amounts recorded on
balance sheet (Millions of yen)
Purpose of holding
Toray Industries, Inc. 1,160 1,144 To strengthen business relationships
AMANO Corporation 224 499 Same as above
Fujipream Corporation 936 286 Same as above
Mitsubishi UFJ Financial Group, Inc. 159 111 Same as above
KING JIM CO., LTD. 76 66 Same as above
Soken Chemical & Engineering Co., Ltd. 35 55 Same as above
IMURA ENVELOPE CO., INC. 100 48 Same as above
Mizuho Financial Group, Inc. 206 42 Same as above
OZU CORPORATION 15 34 Same as above
ASAHI PRINTING CO., LTD. 12 32 Same as above
45LINTEC ANNUAL REPORT 2017

Introduction of Takeover Defense Measures
The Company has introduced takeover defense measures (rules of
large-scale purchase). These measures remain in effect due to the
submission to and approval by the General Meeting of Shareholders
held on June 24, 2015, of proposal No. 6. For details, please see the
General Meeting of Shareholders section of the Company’s website
(http://www.lintec-global.com/ir/stock/meeting.html). Further, the
effective period of takeover defense measures is three years (until the
end of the General Meeting of Shareholders to be held in June 2018).
Shareholder Interactions
The Company seeks to engage in constructive interactions with
shareholders and other investors that contribute to sustainable
growth and medium- to long-term improvements in corporate value.
The Company has established an investor relations (IR) activity
system and advances proactive initiatives based on the following poli-
cies to facilitate this endeavor.
(1) The officer responsible for IR implements and oversees the
Company’s various IR activities, including individual meetings with
shareholders and investors. In regard to responses to requests for
individual meetings, members of senior management or directors
will meet with shareholders or investors requesting meetings
based, whenever appropriate, on the desires and interests of the
requester. In the fiscal year ended March 31, 2017, we held individ-
ual meetings with more than 180 domestic and overseas institu-
tional investors and analysts.
(2) The Public Relations Office, Finance & Accounting Department,
General Affairs & Legal Department, and Corporate Strategic
Office will play a central role in advancing the Company’s various
IR activities. Relevant divisions pursue close coordination with
these offices and departments, exchanging information on a daily
basis and meeting with members of senior management as
appropriate to share necessary information.
(3) In addition to individual meetings, the Company’s IR activities
include regular briefings on financial results and medium-term
business plans, visits to overseas investors, participation in IR
conferences at which overseas investors gather, business explana-
tory forums, and Company briefings for individual investors. In the
fiscal year ended March 31, 2017, the Company participated in a
total of four IR conferences held in Tokyo. We seek to expand the
range of information provided to domestic and overseas share-
holders and other investors by publishing shareholder newsletters
and annual reports and posting information in the IR section of our
corporate website. At the same time, we collect feedback from a
wide range of shareholders and other investors through surveys
that are attached to shareholder newsletters and made available
on the IR website.
(4) Opinions and concerns of shareholders and other investors solic-
ited through IR activities are relayed to management by the rele-
vant divisions via quarterly business reports at the Board of
Directors’ meetings or reported appropriately to management on
an as-required basis.
(5) In interactions with shareholders and other investors, we practice
stringent management of information in accordance with the
internal Insider Trading Prevention Regulations to ensure that
insider information is not disclosed. In addition, the Company’s
disclosure policy stipulates that we will observe a quiet period that
begins approximately one month prior to the announcement of
quarterly financial results to avoid leaks of financial results and to
maintain fairness. During this period, we will not answer questions
or make comments on our financial results and forecasts.
Corporate Governance
THE BASE THAT SUPPORTS GROWTH
46 LINTEC ANNUAL REPORT 2017

THE BASE THAT SUPPORTS GROWTH
A Message from an Outside Director
Helping to Strengthen Governance from an Outsider’s Perspective
Effectiveness of the Board of Directors
As LINTEC’s Board of Directors moves with the times in corporate
governance, I think it is becoming more of a body that engages in
debate rather than one that simply makes decisions. In addition to
Board of Directors’ meetings, monthly management meetings are
held and attended not only by directors but also executive officers with
responsibility for business execution, and the Board ultimately reflects
the results of the information sharing that takes place between
directors and executive officers. As an outside director, I make every
effort to attend these meetings and deepen my understanding of
LINTEC’s businesses. Board meetings and management meetings
were previously held on the same day but now are held on separate
days, and as a result, I have time to fully digest the management
meeting discussions. Also, I can obtain Board meeting materials
prior to the meeting, so I endeavor to promote thoughtful discussion
with probing questions.
I think there are two types of corporate governance—defensive,
with a system of mutual checks, and offensive, where risk is taken
and consideration is given regarding the direction of management.
LINTEC’s Board strives to achieve a good balance between the two,
in my view.
The Role of an Independent Outside Director Who is a Member of
the Audit & Supervisory Committee
As an attorney at law, I am frequently engaged in corporate law cases
involving manufacturers, but I have little specialist knowledge of
LINTEC’s adhesive product and specialty paper sectors. However, that
means I am able to promote lively discussions at Board of Directors’
meetings by putting candid questions from a non-specialist
standpoint. It also seems that my asking questions makes it easier
for company management to ask each other questions. As a member
of the Audit & Supervisory Committee, I receive a wide variety of
information from the Audit Office, and when there are things I am not
clear about I make a point of asking questions at forums such as
Board meetings.
Management inevitably involves risk, and I think that using my
knowledge of corporate law to appropriately identify hidden risks is
another important part of my role. I aim to help management in
deciding whether risk is tolerable or should be quickly eliminated.
Toward Sustained Growth
Having been an outside director for two years, I realize that LINTEC
has technology that other companies cannot match and a solid
structure where each business division makes a profit. Growth
strategies that embrace the whole company can be difficult to formu-
late due to the wide range of businesses and large number of niche
products, but I think that making three U.S. and European companies
subsidiaries in 2016 sent a clear message to investors and employees
about LINTEC’s global growth intentions. In the run-up to the decision,
I was of course able to ask many questions at Board of Directors’
meetings from an outside director’s point of view and take part in full
discussion of the suitability of taking this step from a risk and
opportunity standpoint. The issue now is the synergies that can be
created, and I hope to provide full support using the knowledge I have
accumulated so far and my outsider’s perspective.
Kanako OsawaOutside Director, Audit & Supervisory Committee Member
47LINTEC ANNUAL REPORT 2017

Mar. 1967 Joined the CompanyApr. 1994 General Manager, Nagoya Branch OfficeJun. 2000 Director, Plant Manager, Tatsuno Plant, Production Div.Jun. 2004 Representative Director, PresidentApr. 2014 Representative Director, Chairman and CEO
(current position)
Representative Director, Chairman and CEO
Akihiko Ouchi (Date of Birth: Jan. 2, 1945)
Apr. 1978 Joined the CompanyJun. 2010 Director, General Manager, Corporate Strategic OfficeApr. 2014 Representative Director, President, CEO and COO
(current position)
Hiroyuki Nishio (Date of Birth: Oct. 18, 1954)
Representative Director, President, CEO and COO
Feb. 1985 Joined the CompanyJun. 2002 Director, Assistant General Manager, Administration
Div. and General Manager, Finance & Accounting Dept.Oct. 2015 Director, Vice President Executive Officer, General
Manager, Administration Div. (current position)
Hitoshi Asai (Date of Birth: Mar. 7, 1948)
Director, Vice President Executive Officer and CFO
Apr. 1978 Joined the CompanyApr. 2013 Executive Officer, Plant Manager, Kumagaya Plant,
Production Div. and General Manager, Fine & Specialty Paper Production Dept.
Jun. 2017 Director, Executive Officer, Assistant General Manager, Production Div. and Plant Manager, Kumagaya Plant (current position)
Junichi Nishikawa (Date of Birth: Sep. 12, 1955)
Mar. 1975 Joined the CompanyJun. 2008 Director, Assistant General Manager, Research &
Development Div., General Manager, Research Center and Intellectual Property Dept.
Apr. 2016 Director, Managing Executive Officer, Assistant General Manager, Business Administration Div. and in charge of Optical Products Operations (current position)
Kazuyoshi Ebe (Date of Birth: Jan. 26, 1953)
Apr. 1980 Joined the CompanyApr. 2014 Executive Officer, General Manager, Advanced
Materials Operations, Business Administration Div.Apr. 2017 Director, Managing Executive Officer, General
Manager, Business Administration Div. (current position)
Makoto Hattori (Date of Birth: Oct. 12, 1957)
Directors, Managing Executive Officers
Apr. 1976 Joined the CompanyJun. 2011 Executive Officer, General Manager, Fine & Specialty
Paper Products Operations, Business Administration Div. and in charge of Converted Products Operations
Apr. 2017 Director, Managing Executive Officer, Assistant General Manager, Business Administration Div. (current position)
Takashi Nakamura (Date of Birth: Dec. 23, 1953)
Apr. 1979 Joined the CompanyJun. 2011 Executive Officer, Chairman and President, LINTEC
(SUZHOU) TECH CORPORATION (seconded)Apr. 2017 Director, Managing Executive Officer, General
Manager, Production Div. and in charge of Quality Assurance & Environmental Protection Div. (current position)
Gohei Kawamura (Date of Birth: Jan. 12, 1956)
Jan. 1983 Joined the CompanyJun. 2011 Executive Officer, General Manager, General Affairs
& Human Resources Div., General Manager, General Affairs & Legal Dept. and Human Resources Dept.
Jun. 2015 Director, Managing Executive Officer, General Manager, General Affairs & Human Resources Div. (current position)
Tsunetoshi Mochizuki (Date of Birth: May 12, 1958)
Apr. 1979 Joined the CompanyApr. 2013 Executive Officer, General Manager, Industrial &
Material Operations, Business Administration Div.Jun. 2015 Director, Executive Officer, General Manager,
Industrial & Material Operations, Business Administration Div. (current position)
Shuji Morikawa (Date of Birth: Dec. 30, 1955)
Directors, Executive Officers
THE BASE THAT SUPPORTS GROWTH
Corporate OfficersAs of June 22, 2017
48 LINTEC ANNUAL REPORT 2017
Apr. 1998 Certified as an Attorney, joined Kajitani Law Offices (to present)
Oct. 2005 Admitted to practice law in the State of New York, U.S.Jun. 2015 Outside Director / Audit & Supervisory Committee
Member of the Company (current position)Jun. 2015 Member of LINTEC Independent Committee
(current position)
Kanako Osawa (Date of Birth: Dec. 22, 1970)
Executive Officers
Apr. 1980 Joined Sanyo-Kokusaku Pulp Co., Ltd.Apr. 2013 Executive Officer, General Manager, Kushiro Mill,
Nippon Paper Industries Co., Ltd.Jun. 2016 Executive Officer, General Manager, Business
Communication & Industrial Paper Sales Div., Nippon Paper Industries Co., Ltd. (current position)
Jun. 2017 Outside Director of the Company (current position)
Kazumori Fukushima (Date of Birth: Feb. 12, 1958)
Outside Director
Apr. 1980 Joined the CompanyApr. 2013 Executive Officer, Plant Manager, Chiba Plant,
Production Div.Jun. 2017 Director, Executive Officer, Assistant General
Manager, Production Div. and Plant Manager, Tatsuno Plant (current position)
Takehiko Wakasa (Date of Birth: Jun. 23, 1956)
Apr. 1979 Joined the CompanyOct. 2012 General Manager, Audit OfficeJun. 2017 Director / Audit & Supervisory Committee Member
(current position)
Hiroshi Okada (Date of Birth: Aug. 25, 1954)
Director / Audit & Supervisory Committee Member
Apr. 1981 Joined Jujo Paper Co., Ltd.Jun. 2014 Outside Audit & Supervisory Board Member of the CompanyJun. 2014 Director, Executive Officer, General Manager,
Corporate Planning Div. and in charge of Subsidiaries and Affiliated Companies, Nippon Paper Industries Co., Ltd. (current position)
Jun. 2015 Outside Director / Audit & Supervisory Committee Member of the Company (current position)
Toru Nozawa (Date of Birth: Mar. 10, 1959)
Outside Directors / Audit & Supervisory Committee Members
Apr. 1975 Joined Japan Development BankApr. 2003 Lecturer, Chuo University, Graduate School of
Commerce (current position)Jun. 2006 Outside Director, Ryobi Limited (current position)Jun. 2007 Member of LINTEC Independent Committee
(current position)Jun. 2012 Outside Director of the Company Jun. 2015 Outside Director / Audit & Supervisory Committee
Member of the Company (current position)
Satoshi Ohoka (Date of Birth: Apr. 24, 1951)
Masahiro OshimaPresident, LINTEC USA HOLDING, INC.
Tatsuya TsukidaGeneral Manager, Research & Development Div. and Research Center
Sumio MorimotoPresident, LINTEC ASIA PACIFIC REGIONAL HEADQUARTERS PRIVATE LIMITED
Yohei HoshikawaGeneral Manager, Corporate Strategic Office
Toru OnishiPlant Manager, Mishima Plant, Production Div. and General Manager, Administration Dept.
Shigeru UematsuGeneral Manager, Public Relations Office
Norio MurataGeneral Manager, Osaka Branch Office, Business Administration Div., in charge of Western Japan and General Manager, Converted Production Sales Dept.
Yutaka IwasakiGeneral Manager, Converted Products Operations, Business Administration Div.
Toshimi SugayaGeneral Manager, Fine & Specialty Paper Products Operations, Business Administration Div. and General Manager, Fine & Specialty Paper Sales Dept.
Takeshi KaiyaGeneral Manager, Advanced Materials Operations, Business Administration Div.
Hiroyuki MatsuoPlant Manager, Agatsuma Plant, Production Div.
Masaaki YoshitakeGeneral Manager, Printing & Variable Information Products Operations, Business Administration Div.
THE BASE THAT SUPPORTS GROWTH
49LINTEC ANNUAL REPORT 2017

FINANCIAL SECTION– 51 Management’s Discussion and Analysis
– 53 Operating Risks
– 54 Financial Summary
– 56 Consolidated Balance Sheet
– 58 Consolidated Statement of Income
– 58 Consolidated Statement of Comprehensive Income
– 59 Consolidated Statement of Changes in Net Assets
– 60 Consolidated Statement of Cash Flows
– 61 Notes to Consolidated Financial Statements
– 84 Management’s Report on Internal Control
over Financial Reporting
– 85 Report of Independent Auditors
50 LINTEC ANNUAL REPORT 201750 LINTEC ANNUAL REPORT 2017

Revenues and Expenses
In the fiscal year under review, consolidated net sales declined 2.2%
year-on-year, to ¥206.0 billion, due mainly to sluggish demand result-
ing from an economic slowdown in China and Southeast Asia and to
foreign currency translation differences involving a strong yen.
Gross profit benefited from a decline in fuel and raw material
prices but decreased 1.4% year-on-year, to ¥52.9 billion, due to factors
such as lower sales. Operating income declined 6.2%, to ¥16.6 billion,
due to costs related to the acquisition of three companies in Europe
and the United States and foreign currency translation differences.
Profit before income taxes decreased 8.3%, to ¥15.4 billion, due to
losses arising from fixed-asset disposal and the liquidation of subsid-
iaries. Profit attributable to owners of parent increased 5.1%, to ¥11.5
billion, owing mainly to a 30.5% decline, to ¥4.2 billion, in income
taxes following the application of tax effect accounting.
Net income per share increased from ¥151.07 in the previous fiscal
year to ¥158.69, and ROE rose from 6.4% to 6.6%.
Performance by Business Segment
Printing and Industrial Materials Products
In Printing & variable information products operations in Japan,
adhesive products for seals and labels were impacted by unseason-
able weather conditions for food-use products but sales of medical-
and distribution-use products were solid. Overseas, sales were
impacted by an economic slowdown, mainly in China.
In Industrial & material operations, equipment for mail-order
business sold well, but sales of motorcycle- and automobile-use
adhesive products and window films were sluggish due to an eco-
nomic slowdown in emerging countries in Asia.
As a result of the above, net sales in Printing and Industrial
Materials Products declined 2.3% year-on-year, to ¥85.7 billion, and
operating income declined 39.9%, to ¥1.7 billion.
Electronic and Optical Products
In Advanced materials operations, sales of semiconductor-related
adhesive tapes and equipment were maintained at the same level as
the previous fiscal year, owing to a recovery in demand for products
for smartphones and other devices from the second quarter.
Multilayer ceramic capacitor-related tapes experienced a recovery in
demand from the autumn but declined year-on-year due to a weak
first half.
In Optical products operations, sales of LCD-related adhesive
products were low due to sluggish demand for products for large
televisions and others.
As a result of the above, net sales in Electronic and Optical
Products were down 2.6% year-on-year, at ¥83.2 billion, and operating
income decreased 13.3%, to ¥9.2 billion.
Paper and Converted Products
In Fine & specialty paper products operations, sales of mainstay
color papers for envelopes were low and there were also declines for
construction material papers and oil resistant papers.
In Converted products operations, sales of casting papers for
carbon fiber composite materials were solid for aircraft use. Sales of
release papers for FPC cover lay films and release films for optical-
related products were also steady.
As a result of the above, net sales in Paper and Converted
Products declined 0.9% year-on-year, to ¥37.1 billion, while operating
income rose 34.0%, to ¥5.8 billion.
Management’s Discussion and Analysis
Net Sales Operating Income
210.5
206.0
2016 2017
Printing and Industrial Materials Products
–2.0
Electronicand
OpticalProducts
–2.2Paper and Converted Products
–0.3
17.7
16.6
2016 2017
Printing and IndustrialMaterials Products
–1.1 Electronic and
Optical Products
–1.4
Paper andConverted Products
+1.5
Adjustment–0.0
¥ Billion ¥ Billion
(Fiscal years ended March 31) (Fiscal years ended March 31)
51LINTEC ANNUAL REPORT 2017
FINANCIAL SECTION

Financial Position
Assets
Total assets as of March 31, 2017, were ¥274.2 billion, an increase of
¥33.5 billion from the end of the previous fiscal year. The main
changes were as follows:· Cash and deposits -¥20.7 billion· Trade notes and accounts receivable +¥4.5 billion· Inventories +¥3.5 billion· Property, plant and equipment +¥9.0 billion· Goodwill +¥34.5 billion
Liabilities
Total liabilities as of March 31, 2017, were ¥95.5 billion, an increase of
¥26.9 billion from the end of the previous fiscal year. The main
changes were as follows:· Trade notes and accounts payable +¥5.4 billion· Short-term loans payable -¥1.1 billion· Current portion of long-term loans payable +¥3.1 billion· Long-term loans payable +¥17.8 billion
Net Assets
Net assets as of March 31, 2017, were ¥178.7 billion, an increase of ¥6.6
billion from the end of the previous fiscal year. The main changes
were as follows:· Retained earnings +¥7.5 billion
Cash Flows
Cash and cash equivalents as of March 31, 2017, amounted to ¥41.3
billion, a decrease of ¥19.0 billion year-on-year.
Cash Flows from Operating Activities
Net cash provided by operating activities increased ¥4.4 billion year-
on-year, to ¥24.4 billion. The principal movements were as follows.· Profit before income taxes -¥1.4 billion· Depreciation and amortization -¥1.3 billion· Trade notes and accounts receivable -¥2.5 billion· Trade notes and accounts payable +¥5.0 billion· Income taxes paid +¥1.7 billion
Cash Flows from Investing Activities
Net cash used in investing activities decreased ¥38.5 billion year-on-
year, to ¥48.4 billion. The principal movements were as follows.· Payments into time deposits -¥1.2 billion· Proceeds from withdrawal of time deposits +¥2.2 billion· Purchase of property, plant and equipment -¥3.2 billion· Purchase of shares and membership interests of subsidiaries
resulting in change in scope of consolidation -¥36.9 billion
Cash Flows from Financing Activities
Net cash provided by financing activities amounted to ¥5.3 billion
compared with net cash used of ¥4.0 billion in the previous fiscal year.
The principal movements were as follows.· Short-term loans payable -¥1.7 billion· Proceeds from long-term loans payable +¥20.9 billion· Repayments of long-term loans payable -¥9.3 billion
Management’s Discussion and Analysis
Net Assets Cash Flows
172.1
178.7
2016 2017
Total shareholders’
equity+7.5
Total accumulated other comprehensive
income–0.7
Non-controllinginterests
–0.3
Sharesubscription
rights+0.0
41.3
60.3
2016 2017
Net cash provided byoperating activities
+24.4
Net cash used ininvesting activities
–48.4
Net cash provided by
financing activities +5.3
Effect of exchange rate
change on cashand cash
equivalents +0.0 Decrease in
cash and cash equivalents resulting from
exclusion of subsidiaries from consolidation
–0.3
¥ Billion ¥ Billion
(Fiscal years ended March 31) (Fiscal years ended March 31)
LINTEC ANNUAL REPORT 201752
FINANCIAL SECTION

Operating Risks
The following is a summary of risks that could affect the LINTEC Group’s
operations. This summary provides specific examples of major risks
that are anticipated, but it does not include all risks.
1. Changes in Economic Conditions
The Group’s operations include development in a wide range of
industries. Therefore, domestic and overseas economic conditions affect
the Group’s operations directly and indirectly. As a result, future trends
in economic conditions could affect the Group’s business results.
Furthermore, global trends in the electronics industry affect the Group’s
electronics-related products business. Future market trends could
affect the Group’s business results.
2. Changes in Selling Prices
Due to intense competition in both the domestic and overseas
markets in which the Group operates, the Group may be unable to
maintain selling prices to preserve sufficient earnings or sales share.
Furthermore, the Group’s business results could be affected by
difficulties related to cost reductions aimed at maintaining profits
and recovering its share by refining customer services.
3. Changes in Raw Material Prices
The Group uses a large quantity of pulp for paper and petrochemical
products as raw materials and fuel. The prices of these materials and
fuels fluctuate in accordance with market conditions, such as inven-
tories and the supply–demand balance. The Group purchases raw
materials in light of careful monitoring of market trends. However,
a dramatic change in raw material prices could affect the Group’s
business results.
4. Changes in Foreign Exchange Rates
The Group conducts foreign currency-denominated procurement and
sales overseas as well as finance transactions between both domestic
and overseas Group companies. Therefore, changes in foreign
exchange rates could affect the Group’s business results.
5. Overseas Operations
The Group conducts manufacturing and business operations in markets
worldwide. In these countries, the following events could affect the
Group’s business results.
(1) Political instability or a deterioration in security due to such factors
as terrorism, a political change, or a coup d’état
(2) Labor disputes, such as those involving strikes or boycotts
(3) Infrastructure failures, such as those related to electric power,
water, or communications
(4) Outbreaks of contagious diseases
(5) Unpredictable changes in laws and regulations, such as those
involving tax systems, foreign exchange, or customs
(6) Problems arising between the Group and its business associates
or in the collection of accounts receivable due to differences in
cultures or business practices
6. New Product Development
The Group pursues R&D activities with a view to realizing comprehensive
technological capabilities that cater to market demand and bringing
to market competitive, high-value-added products. Accordingly, the
Group is stepping up allocations of management resources to increase
its number of researchers and to pursue such initiatives as joint research
with other companies and academic institutions.
However, there is no guarantee that such investment of management
resources in R&D will result in the development of new products or
increase operating income. Due to such factors as extended development
periods, it could become necessary to discontinue development, and
if product development costs cannot be recovered, it could affect the
Group’s business results.
7. Intellectual Property Rights
The Group takes necessary measures to protect intellectual property
rights in Japan and overseas for various original production technologies
that it has developed. However, legal measures alone do not provide
complete protection, possibly preventing the Group from effectively
protecting the rights it has obtained. Furthermore, in the event that
a lawsuit is filed by a third party regarding intellectual property rights
infringement associated with the Group’s products, the Group’s business
results could be affected.
8. Significant Lawsuits
In conducting business in Japan and overseas, the Group may be subject
to lawsuits or other claims related to product liability, environmental,
or intellectual property rights issues. Lawsuits or claims, depending
on their content, could affect the Group’s business results.
9. Legal and Regulatory Systems
In the countries in which it conducts business operations, the Group is
subject to various legal and regulatory systems, and as such is working
to ensure rigorous compliance with these systems. In the event that the
systems are strengthened or changed, the Group’s business activities
could be restricted or the Group’s business results could be affected.
53LINTEC ANNUAL REPORT 2017
FINANCIAL SECTION

Millions of yen, except per share data, number of shares, and number of employees
2017 2016 2015 2014 2013 2012 2011 2010 2009 2008
For the year:Net sales ¥205,975 ¥210,501 ¥207,255 ¥203,242 ¥190,844 ¥200,905 ¥212,733 ¥189,348 ¥194,901 ¥202,297Operating income 16,595 17,692 16,881 13,766 10,564 13,975 20,889 11,576 8,498 14,894
% of net sales 8.1% 8.4% 8.1% 6.8% 5.5% 7.0% 9.8% 6.1% 4.4% 7.4%Profit before income taxes 15,398 16,799 17,555 12,883 10,836 13,382 19,565 11,399 5,215 13,191Profit attributable to owners of parent 11,450 10,899 11,659 8,501 7,681 8,648 13,622 7,284 3,391 9,308
Return on equity 6.6% 6.4% 7.2% 5.8% 5.6% 6.6% 10.9% 6.2% 2.9% 8.0%Return on assets 6.1% 7.4% 7.8% 6.0% 5.2% 6.5% 9.7% 6.1% 3.0% 6.6%
Per share data (yen):Net income ¥ 158.69 ¥ 151.07 ¥ 161.63 ¥ 114.22 ¥ 102.83 ¥ 115.26 ¥ 180.21 ¥ 96.36 ¥ 44.86 ¥ 123.15Net assets 2,465.43 2,370.49 2,363.81 2,100.87 1,909.57 1,766.60 1,715.78 1,596.37 1,497.58 1,598.30Cash dividends 66.00 54.00 48.00 42.00 34.00 40.00 40.00 24.00 20.00 24.00
Depreciation and amortization ¥ 7,466 ¥ 8,800 ¥ 8,713 ¥10,055 ¥ 10,141 ¥ 10,079 ¥10,178 ¥10,537 ¥11,286 ¥ 9,011Purchase of property, plant and equipment (13,049) (9,810) (6,299) (5,508) (13,823) (8,760) (8,237) (7,777) (9,584) (14,700)Net cash provided by operating activities 24,361 19,928 15,485 16,309 19,619 18,910 23,307 22,259 12,979 17,739Net cash used in investing activities (48,378) (9,898) (5,104) (6,952) (13,966) (12,262) (9,926) (9,253) (9,752) (15,071)Net cash provided by (used in) financing activities 5,257 (4,044) (3,135) (8,020) (2,877) (5,099) (2,820) (3,454) (2,300) (769)
At year-end:Current assets ¥151,449 ¥163,647 ¥163,017 ¥149,396 ¥138,505 ¥137,229 ¥132,891 ¥121,451 ¥ 95,937 ¥120,028Current liabilities 64,401 56,389 57,058 54,820 56,911 62,075 60,465 58,654 43,655 67,631Working capital 87,048 107,258 105,958 94,575 81,593 75,153 72,426 62,797 52,282 52,397Cash and cash equivalents 41,284 60,323 56,050 44,992 40,739 36,036 35,188 25,387 15,370 17,315Property, plant and equipment, net 73,871 64,859 61,503 61,456 64,915 62,273 61,888 63,337 67,010 73,711Long-term debt, less current portion 17,795 — — — — — — 54 107 201
% of shareholders’ equity 10.3% — — — — — — 0.0% 0.1% 0.2%Total assets 274,199 240,720 237,444 225,073 216,048 210,203 206,188 195,656 172,854 204,852Net assets 178,690 172,101 171,674 152,610 143,569 132,847 130,576 121,502 113,930 121,635
% of total assets 64.9% 71.1% 71.8% 67.3% 66.0% 62.8% 62.9% 61.7% 65.5% 59.4%
Number of shares outstanding 76,564,240 76,564,240 76,564,240 76,564,240 76,564,240 76,564,240 76,564,240 76,564,240 76,564,240 76,564,240Number of employees 4,760 4,246 4,413 4,223 4,270 4,286 4,198 4,037 3,987 3,802
Segment information:Net sales:
Printing and Industrial Materials Products ¥85,721 ¥88,100 ¥86,826 ¥86,310 ¥82,785 ¥90,143 ¥91,936 — — — Electronic and Optical Products 83,278 85,895 83,281 79,143 72,372 73,925 81,193 — — — Paper and Converted Products 52,632 54,576 54,564 52,781 52,061 53,225 55,317 — — —
Segment income: Printing and Industrial Materials Products 1,672 2,785 2,878 2,290 2,380 5,213 7,990 — — — Electronic and Optical Products 9,155 10,562 10,071 6,846 3,196 3,942 6,732 — — — Paper and Converted Products 5,767 4,303 3,996 4,645 4,980 4,846 6,129 — — —
Financial SummaryLINTEC Corporation and its consolidated subsidiariesYears ended March 31
(Supplementary information)Effective the year ended March 31, 2011, the “Accounting Standard for Disclosure about Segments of an Enterprise and Related Information” (Accounting Standards Board of Japan (ASBJ)Statement No. 17, issued by ASBJ on March 27, 2009) and the “Guidance on Accounting Standard for Disclosures about Segments of an Enterprise and Related Information” (ASBJ GuidanceNo. 20, issued by ASBJ on March 21, 2008) have been applied.Since it is impracticable to restate segment information of the fiscal years of 2010 and before complying revised accounting standards for segment information, only reportable segmentinformation for the year ended March 31, 2011 onward have been presented.
LINTEC ANNUAL REPORT 201754
FINANCIAL SECTION

Millions of yen, except per share data, number of shares, and number of employees
2017 2016 2015 2014 2013 2012 2011 2010 2009 2008
For the year:Net sales ¥205,975 ¥210,501 ¥207,255 ¥203,242 ¥190,844 ¥200,905 ¥212,733 ¥189,348 ¥194,901 ¥202,297Operating income 16,595 17,692 16,881 13,766 10,564 13,975 20,889 11,576 8,498 14,894
% of net sales 8.1% 8.4% 8.1% 6.8% 5.5% 7.0% 9.8% 6.1% 4.4% 7.4%Profit before income taxes 15,398 16,799 17,555 12,883 10,836 13,382 19,565 11,399 5,215 13,191Profit attributable to owners of parent 11,450 10,899 11,659 8,501 7,681 8,648 13,622 7,284 3,391 9,308
Return on equity 6.6% 6.4% 7.2% 5.8% 5.6% 6.6% 10.9% 6.2% 2.9% 8.0%Return on assets 6.1% 7.4% 7.8% 6.0% 5.2% 6.5% 9.7% 6.1% 3.0% 6.6%
Per share data (yen):Net income ¥ 158.69 ¥ 151.07 ¥ 161.63 ¥ 114.22 ¥ 102.83 ¥ 115.26 ¥ 180.21 ¥ 96.36 ¥ 44.86 ¥ 123.15Net assets 2,465.43 2,370.49 2,363.81 2,100.87 1,909.57 1,766.60 1,715.78 1,596.37 1,497.58 1,598.30Cash dividends 66.00 54.00 48.00 42.00 34.00 40.00 40.00 24.00 20.00 24.00
Depreciation and amortization ¥ 7,466 ¥ 8,800 ¥ 8,713 ¥10,055 ¥ 10,141 ¥ 10,079 ¥10,178 ¥10,537 ¥11,286 ¥ 9,011Purchase of property, plant and equipment (13,049) (9,810) (6,299) (5,508) (13,823) (8,760) (8,237) (7,777) (9,584) (14,700)Net cash provided by operating activities 24,361 19,928 15,485 16,309 19,619 18,910 23,307 22,259 12,979 17,739Net cash used in investing activities (48,378) (9,898) (5,104) (6,952) (13,966) (12,262) (9,926) (9,253) (9,752) (15,071)Net cash provided by (used in) financing activities 5,257 (4,044) (3,135) (8,020) (2,877) (5,099) (2,820) (3,454) (2,300) (769)
At year-end:Current assets ¥151,449 ¥163,647 ¥163,017 ¥149,396 ¥138,505 ¥137,229 ¥132,891 ¥121,451 ¥ 95,937 ¥120,028Current liabilities 64,401 56,389 57,058 54,820 56,911 62,075 60,465 58,654 43,655 67,631Working capital 87,048 107,258 105,958 94,575 81,593 75,153 72,426 62,797 52,282 52,397Cash and cash equivalents 41,284 60,323 56,050 44,992 40,739 36,036 35,188 25,387 15,370 17,315Property, plant and equipment, net 73,871 64,859 61,503 61,456 64,915 62,273 61,888 63,337 67,010 73,711Long-term debt, less current portion 17,795 — — — — — — 54 107 201
% of shareholders’ equity 10.3% — — — — — — 0.0% 0.1% 0.2%Total assets 274,199 240,720 237,444 225,073 216,048 210,203 206,188 195,656 172,854 204,852Net assets 178,690 172,101 171,674 152,610 143,569 132,847 130,576 121,502 113,930 121,635
% of total assets 64.9% 71.1% 71.8% 67.3% 66.0% 62.8% 62.9% 61.7% 65.5% 59.4%
Number of shares outstanding 76,564,240 76,564,240 76,564,240 76,564,240 76,564,240 76,564,240 76,564,240 76,564,240 76,564,240 76,564,240Number of employees 4,760 4,246 4,413 4,223 4,270 4,286 4,198 4,037 3,987 3,802
Segment information:Net sales:
Printing and Industrial Materials Products ¥85,721 ¥88,100 ¥86,826 ¥86,310 ¥82,785 ¥90,143 ¥91,936 — — — Electronic and Optical Products 83,278 85,895 83,281 79,143 72,372 73,925 81,193 — — — Paper and Converted Products 52,632 54,576 54,564 52,781 52,061 53,225 55,317 — — —
Segment income: Printing and Industrial Materials Products 1,672 2,785 2,878 2,290 2,380 5,213 7,990 — — — Electronic and Optical Products 9,155 10,562 10,071 6,846 3,196 3,942 6,732 — — — Paper and Converted Products 5,767 4,303 3,996 4,645 4,980 4,846 6,129 — — —
55LINTEC ANNUAL REPORT 2017
FINANCIAL SECTION

Millions of yen
Thousands ofU.S. dollars
(Note 1)
ASSETS 2017 2016 2017
Current assets:
Cash and deposits (Notes 12, 14) ¥ 45,060 ¥ 65,733 $ 401,641
Trade notes and accounts receivable (Note 14) 66,801 62,331 595,431
Inventories (Note 3) 34,584 31,066 308,267
Deferred tax assets (Note 19) 1,614 1,121 14,390
Other (Notes 14, 16) 3,530 3,538 31,225
Allowance for doubtful accounts (114) (143) (1,017)
Total current assets 151,449 163,647 1,349,938
Non-current assets:
Property, plant and equipment (Notes 6, 10, 13):
Buildings and structures 71,545 69,970 637,716
Machinery, equipment and vehicles 124,185 116,352 1,106,920
Land 11,057 10,184 98,564
Construction in progress 2,163 2,864 19,286
Other 12,511 12,070 111,517
221,463 211,442 1,974,005
Accumulated depreciation (147,592) (146,583) (1,315,557)
Property, plant and equipment, net 73,871 64,859 658,447
Intangible assets:
Goodwill 34,558 22 308,039
Other (Note 13) 4,000 2,334 35,660
Total intangible assets 38,559 2,357 343,700
Investments and other assets:
Investment securities (Notes 14, 15) 3,102 3,126 27,657
Deferred tax assets (Note 19) 5,063 4,978 45,137
Other 2,256 1,854 20,116
Allowance for doubtful accounts (105) (103) (937)
Total investments and other assets 10,318 9,855 91,974
Total non-current assets 122,749 77,072 1,094,122
Total assets ¥ 274,199 ¥ 240,720 $ 2,444,061
The accompanying notes are an integral part of the consolidated financial statements.
Consolidated Balance SheetLINTEC Corporation and its consolidated subsidiariesMarch 31, 2017 and 2016
LINTEC ANNUAL REPORT 201756
FINANCIAL SECTION

Millions of yen
Thousands of U.S. dollars
(Note 1)
LIABILITIES AND NET ASSETS 2017 2016 2017
Current liabilities:
Trade notes and accounts payable (Note 14) ¥ 45,057 ¥ 39,683 $ 401,622
Short-term loans payable (Notes 14, 26) 641 1,695 5,720
Current portion of long-term loans payable (Notes 14, 16, 26) 3,051 — 27,202
Accrued income taxes (Notes 14, 19) 3,098 2,272 27,621
Provision for directors’ bonuses 90 93 804
Other (Notes 14, 16, 26) 12,460 12,644 111,065
Total current liabilities 64,401 56,389 574,035
Non-current liabilities:
Long-term loans payable (Notes 14, 16, 26) 17,795 — 158,616
Provision for environmental measures 135 137 1,204
Net defined benefit liability (Notes 7, 8, 17) 12,362 11,476 110,189
Other (Note 26) 814 614 7,261
Total non-current liabilities 31,107 12,228 277,272
Total liabilities 95,508 68,618 851,308
Commitments and contingent liabilities (Note 2)
Net assets:
Shareholders’ equity (Note 25):
Common stock:
Authorized: 300,000,000 shares in 2017 and 2016
Issued: 76,564,240 shares in 2017 and 2016 23,201 23,201 206,803
Capital surplus 26,829 26,829 239,141
Retained earnings 131,247 123,713 1,169,870
Less: treasury stock, at cost:
4,412,515 shares in 2017 and 4,411,475 shares in 2016 (7,714) (7,712) (68,762)
Total shareholders’ equity 173,563 166,032 1,547,052
Accumulated other comprehensive income
Net unrealized holding gain on securities 775 701 6,909
Foreign currency translation adjustments 6,938 7,812 61,844
Remeasurements of defined benefit plans (Notes 7, 8, 17) (3,392) (3,509) (30,240)
Total accumulated other comprehensive income 4,320 5,005 38,514
Share subscription rights (Note 18) 186 169 1,665
Non-controlling interests 619 895 5,520
Total net assets 178,690 172,101 1,592,752
Total liabilities and net assets ¥274,199 ¥240,720 $2,444,061
57LINTEC ANNUAL REPORT 2017
FINANCIAL SECTION

Consolidated Statement of IncomeLINTEC Corporation and its consolidated subsidiariesYears ended March 31, 2017 and 2016
Consolidated Statement of Comprehensive IncomeLINTEC Corporation and its consolidated subsidiariesYears ended March 31, 2017 and 2016
Millions of yen
Thousands of U.S. dollars
(Note 1)
2017 2016 2017Net sales ¥205,975 ¥210,501 $1,835,953 Cost of sales 153,115 156,877 1,364,790 Gross profit 52,859 53,624 471,162 Selling, general and administrative expenses (Notes 4, 5) 36,264 35,932 323,243 Operating income 16,595 17,692 147,919 Non-operating income: Interest income 218 308 1,951 Dividend income 91 59 817 Rent income 43 58 391 Gain on sales of non-current assets 20 7 179 Insurance income 226 42 2,019 Other income 274 276 2,445 Total non-operating income 875 752 7,805 Non-operating expenses: Interest expenses 73 18 654 Loss on retirement of non-current assets 785 357 7,003 Compensation expenses 107 129 957 Foreign exchange losses 473 124 4,221 Other expenses 345 189 3,083 Total non-operating expenses 1,786 820 15,921 Ordinary income 15,684 17,623 139,802 Extraordinary gain: Gain on sales of investment securities (Note 15) 190 — 1,696 Gain on sales of non-current assets (Note 6) 121 11 1,086 Gain on liquidation of subsidiaries 17 — 153 Total extraordinary gain 329 11 2,937 Extraordinary loss: Loss on liquidation of subsidiaries 568 — 5,068 Impairment loss (Note 10) 34 — 304 Loss on sales of investment securities (Note 15) 13 — 116 Special retirement expenses (Note 7) — 438 — Loss on abolishment of retirement benefit plan (Note 8) — 265 — Loss on temporary suspension of production (Note 9) — 131 — Total extraordinary losses 615 835 5,488 Profit before income taxes 15,398 16,799 137,251 Income taxes (Note 19): Current 5,383 5,339 47,985 Deferred (1,191) 689 (10,618) Total income taxes 4,192 6,029 37,367 Profit 11,206 10,769 99,884 Profit (loss) attributable to non-controlling interests (244) (129) (2,175)Profit attributable to owners of parent (Note 25) ¥ 11,450 ¥ 10,899 $ 102,060
Millions of yen
Thousands of U.S. dollars
(Note 1)
2017 2016 2017Profit ¥11,206 ¥10,769 $99,884 Other comprehensive income (Note 11) Net unrealized holding gain on securities 73 (130) 656 Foreign currency translation adjustments (907) (3,443) (8,091) Remeasurements of defined benefit plans (Notes 7, 8, 17) 118 (2,975) 1,052 Total other comprehensive income (716) (6,549) (6,382) Comprehensive income ¥10,489 ¥ 4,220 $93,501 (Comprehensive income attributable to:) Owners of parent 10,765 4,318 95,959 Non-controlling interests (275) (97) (2,458)
The accompanying notes are an integral part of the consolidated financial statements.
LINTEC ANNUAL REPORT 201758
FINANCIAL SECTION

Thousands Millions of yenShareholders’ equity Accumulated other comprehensive income
Number of shares ofcommon
stockCommon
stockCapital
surplusRetainedearnings
Treasurystock
Totalshareholders’
equity
Netunrealized
holding gain on securities
Foreigncurrency
translation adjustments
Remeasure-ments of
defined benefit plans
Total accumulated
other com-prehensive
income
Sharesubscription
rights
Non-controlling
interestsTotal net
assets
Balance as at April 1, 2015 76,564 ¥23,201 ¥26,830 ¥116,638 ¥(7,741) ¥158,928 ¥832 ¥11,256 ¥(503) ¥11,586 ¥166 ¥992 ¥171,674
Changes during the year:
Cash dividends (3,823) (3,823) (3,823)
Profit attributable to owners
of parent 10,899 10,899 10,899
Purchase of treasury stock (2) (2) (2)
Disposal of treasury stock (0) 31 30 30
Change of scope of consolidation — —
Net changes in items other
than shareholders’ equity (130) (3,443) (3,006) (6,580) 2 (97) (6,676)
Total changes during the year — — (0) 7,075 29 7,103 (130) (3,443) (3,006) (6,580) 2 (97) 427
Balance as at March 31, 2016 76,564 ¥23,201 ¥26,829 ¥123,713 ¥(7,712) ¥166,032 ¥701 ¥7,812 ¥(3,509) ¥5,005 ¥169 ¥895 ¥172,101
Changes during the year:
Cash dividends (4,329) (4,329) (4,329)
Profit attributable to owners
of parent 11,450 11,450 11,450
Purchase of treasury stock (2) (2) (2)
Disposal of treasury stock 0 0 0 0
Change of scope of consolidation 413 413 413
Net changes in items other
than shareholders’ equity 73 (874) 116 (684) 17 (275) (942)
Total changes during the year — — 0 7,533 (2) 7,531 73 (874) 116 (684) 17 (275) 6,589
Balance as at March 31, 2017 76,564 ¥23,201 ¥26,829 ¥131,247 ¥(7,714) ¥173,563 ¥775 ¥6,938 ¥(3,392) ¥4,320 ¥186 ¥619 ¥178,690
Thousands Thousands of U.S. dollars (Note 1)Shareholders’ equity Accumulated other comprehensive income
Number of shares ofcommon
stockCommon
stockCapital
surplusRetainedearnings
Treasurystock
Totalshareholders’
equity
Netunrealized
holding gain on securities
Foreigncurrency
translation adjustments
Remeasure-ments of
defined benefit plans
Total accumulated
other com-prehensive
income
Sharesubscription
rights
Non-controlling
interestsTotal net
assets
Balance as at April 1, 2016 76,564 $206,803 $239,141 $1,102,716 $(68,741) $1,479,919 $6,253 $69,640 $(31,279) $44,614 $1,508 $7,978 $1,534,021
Changes during the year:
Cash dividends (38,587) (38,587) (38,587)
Profit attributable to owners
of parent 102,060 102,060 102,060
Purchase of treasury stock (21) (21) (21)
Disposal of treasury stock 0 0 0 0
Change of scope of consolidation 3,681 3,681 3,681
Net changes in items other
than shareholders’ equity 656 (7,795) 1,038 (6,100) 157 (2,458) (8,401)
Total changes during the year — — 0 67,153 (21) 67,132 656 (7,795) 1,038 (6,100) 157 (2,458) 58,731
Balance as at March 31, 2017 76,564 $206,803 $239,141 $1,169,870 $(68,762) $1,547,052 $6,909 $61,844 $(30,240) $38,514 $1,665 $5,520 $1,592,752
The accompanying notes are an integral part of the consolidated financial statements.
Consolidated Statement of Changes in Net AssetsLINTEC Corporation and its consolidated subsidiariesYears ended March 31, 2017 and 2016
59LINTEC ANNUAL REPORT 2017
FINANCIAL SECTION

Consolidated Statement of Cash FlowsLINTEC Corporation and its consolidated subsidiariesYears ended March 31, 2017 and 2016
Millions of yen
Thousands ofU.S. dollars
(Note 1)
2017 2016 2017Cash flows from operating activities:Profit before income taxes ¥ 15,398 ¥16,799 $ 137,251 Depreciation and amortization 7,466 8,800 66,553 Amortization of goodwill 315 71 2,809 Increase (decrease) in net defined benefit liability 947 788 8,445 Increase (decrease) in allowance for doubtful accounts (24) (72) (216)Interest and dividend income (310) (367) (2,769)Interest expenses 73 18 654 Loss (gain) on sales of property, plant and equipment (132) (9) (1,178)Loss on retirement of property, plant and equipment 482 163 4,296 Decrease (increase) in trade notes and accounts receivable (1,565) 966 (13,953)Decrease (increase) in inventories 812 582 7,242 Increase (decrease) in trade notes and accounts payable 3,470 (1,485) 30,930 Loss (gain) on sales of investment securities (177) (0) (1,580)Increase (decrease) in provision for environmental measures (2) (2) (23)Loss (gain) on liquidation of subsidiaries 551 — 4,914 Impairment loss 34 — 304 Special retirement expenses — 438 —Loss on abolishment of retirement benefit plan — 265 —Other, net 1,789 (792) 15,954 Subtotal 29,128 26,166 259,634 Interest and dividend income received 325 382 2,902 Interest expenses paid (16) (18) (150)Income taxes (paid) refund (4,809) (6,534) (42,870)Special retirement expenses paid (265) (66) (2,366) Net cash provided by operating activities 24,361 19,928 217,149 Cash flows from investing activities:Payments into time deposits (10,897) (9,653) (97,138)Proceeds from withdrawal of time deposits 12,164 9,957 108,427 Purchase of property, plant and equipment (13,049) (9,810) (116,312)Proceeds from sales of property, plant and equipment 181 26 1,613 Purchase of intangible assets (199) (455) (1,776)Purchase of investment securities (5) (15) (51)Proceeds from sales of investment securities 361 0 3,226 Proceeds from liquidation of subsidiaries 24 — 222 Payments of loans receivable (2) (5) (17)Collection of loans receivable 4 2 36 Purchase of shares and membership interests of subsidiaries resulting in change in scope of consolidation (Note 12) (36,909) — (328,994)
Other, net (50) 56 (451) Net cash used in investing activities (48,378) (9,898) (431,216)Cash flows from financing activities:Increase (decrease) in short-term loans payable (1,748) — (15,589)Proceeds from long-term loans payable 20,850 — 185,846 Repayments of long-term loans payable (9,253) — (82,484)Cash dividends paid (4,328) (3,824) (38,582)Purchase of treasury stock (2) (2) (21)Repayments of lease obligations (258) (217) (2,302)Other, net 0 0 0 Net cash provided by (used in) financing activities 5,257 (4,044) 46,866 Effect of exchange rate change on cash and cash equivalents 35 (1,712) 313 Net increase (decrease) in cash and cash equivalents (18,723) 4,273 (166,887)Cash and cash equivalents at beginning of year 60,323 56,050 537,693 Increase in cash and cash equivalents from newly consolidated subsidiary — 0 —Decrease in cash and cash equivalents resulting from exclusion of subsidiaries from consolidation (315) — (2,815)Cash and cash equivalents at end of year (Note 12) ¥ 41,284 ¥60,323 $ 367,990
The accompanying notes are an integral part of the consolidated financial statements.
LINTEC ANNUAL REPORT 201760
FINANCIAL SECTION

1. Summary of Significant Accounting Policies(a) Basis of presenting financial statementsLINTEC Corporation (the “Company”) maintains its accounting records and prepares its consolidated financial statements in accordance with accounting principles generally accepted in Japan, which are different in certain respects as to the application and disclosure requirements of International Financial Reporting Standards. The accompanying consoli-dated financial statements have been compiled from the consolidated financial statements prepared by the Company as required by the Financial Instruments and Exchange Act of Japan. In addition, the notes to the consolidated financial statements include information which is not required under accounting principles generally accepted in Japan but is presented herein as additional information. For the convenience of the readers, the accompanying consolidated financial statements have been presented in U.S. dollars by translating all Japanese yen amounts at the rate of ¥112.19=U.S.$1, the prevailing exchange rate as of March 31, 2017. This translation should not be construed as a representation that the Japanese yen amounts could be converted into U.S. dollars at this or any other rate of exchange. As permitted under the Financial Instruments and Exchange Act of Japan, amounts of less than one million yen have been omitted. As a result, the totals shown in the accompanying consolidated financial state-ments do not necessarily agree with the sum of the individual amounts. Certain reclassifications of previously reported amounts have been made to conform to the consolidated financial statements for the year ended March 31, 2017 presentation.(b) ConsolidationThe accompanying consolidated financial statements include the accounts of the Company and its 41 significant subsidiaries as of March 31, 2017, but exclude subsidiaries whose total assets, net sales, profit and retained earnings are not material in relation to the comparable amounts in these statements. All significant intercompany accounts and transactions have been eliminated in consolidation. Goodwill is amortized over periods of the useful lives (mainly 5 years) on a straight-line basis. Investments in subsidiaries and affiliates, which are not consolidated or accounted for by the equity method, are carried at cost. Where there has been a permanent decline in the value of such investments, the Company has written down the investments. Certain subsidiaries are consolidated on the basis of fiscal period ending December 31, which differ from that of the Company. The neces-sary adjustments are made to the financial statements of such subsidiaries to reflect any significant transactions from their respective fiscal year ends to March 31.(c) Foreign currency translationReceivables, payables and securities denominated in foreign currencies are converted into Japanese yen at the exchange rates at fiscal year end. Transactions in foreign currencies are recorded based on the prevailing exchange rates on the transaction dates and the resulting translation gains or losses are included in statement of income. In respect of the financial statement items of overseas subsidiaries, all assets and liabilities accounts are translated into Japanese yen by applying the exchange rates in effect at the fiscal year end. All income and expense accounts are translated into Japanese yen by applying the average exchange rates during the fiscal year. Translation differences after allocating to non-controlling interest for portions attributable to non-controlling interest are reported as foreign currency translation adjustments in a separate component of net assets in the accompanying consolidated balance sheet.(d) Investment securitiesSecurities with market value are stated at fair value, and changes in fair value are recorded as a separate component of net assets at an amount,
net of tax, and the moving average method is used to calculate the original cost. Securities without market value are stated at cost deter-mined by the moving average method.(e) Derivatives Derivatives are stated at fair value.(f) InventoriesInventories mainly apply the cost method based on the weighted-average method, which determines the amount of the inventories shown on the consolidated balance sheet by writing them down based on the decrease in their profitability. Machinery applies the cost method based on the specific identification method, which determines the amount of the inventories shown on the consolidated balance sheet by writing them down based on the decrease in their profitability.(g) Property, plant and equipment (Excluding leased assets)Depreciation is computed by the straight-line method over the useful lives of the respective assets. The significant useful lives are summarized as follows: Buildings and structures 3–50 years Machinery, equipment and vehicles 3–17 years(h) Intangible assets (Excluding leased assets)Capitalized costs of software for internal use are amortized using the straight-line method over useful lives (5 years).(i) Leased assetsLeased assets arising from finance lease transactions which transfer ownership to the lessees are depreciated as the same as the owned property, plant and equipment. Leased assets arising from finance lease transactions which do not transfer ownership to the lessees are depreciated to a residual value of zero by the straight-line method using the contract term as the useful life.(j) Allowance for doubtful accountsThe allowance for doubtful accounts is provided at the amount of estimated uncollectible accounts, based on individual collectability with respect to identified doubtful receivables and past experience of doubtful receivables.(k) Provision for directors’ bonusesBonus to directors is accrued at the year end and to be paid in the following year when such bonuses are attributable.(l) Accounting method for retirement benefits(1) Method of attributing expected retirement benefits to periods In calculating retirement benefit obligations, the benefit formula basis
is used to attribute expected retirement benefits to periods through the end of the fiscal year.
(2) Method of amortizing actuarial gain and loss and prior service cost Actuarial gain and loss are amortized in the year following the year
in which the gain or loss is recognized by the straight-line method principally over 15 years. Prior service cost is being amortized by the straight-line method principally over 15 years.
(m) Provision for environmental measuresThe provision for environmental measures is estimated and recorded to provide for future potential costs, such as costs related to removal and disposal of toxic substances based on related legal requirements.(n) Accounting for consumption taxesTransactions subject to consumption taxes are recorded at amounts exclusive of consumption taxes.(o) Cash and cash equivalentsCash and cash equivalents are composed of cash and time deposits having maturities within three months from acquisition, all of which are low-risk, short-term financial instruments readily convertible into cash.(p) Research and development costsResearch and development costs are charged to income when incurred.(q) Income taxesDeferred tax assets and liabilities are determined based on differences
Notes to Consolidated Financial StatementsLINTEC Corporation and its consolidated subsidiaries March 31, 2017
61LINTEC ANNUAL REPORT 2017
FINANCIAL SECTION

2. Commitments and Contingent LiabilitiesThe Company and its consolidated subsidiaries had unused lines of credit for short-term financing aggregating ¥23,194 million (U.S. $206,743 thousand) and ¥22,208 million at March 31, 2017 and 2016, respectively.
between financial reporting and tax bases of assets and liabilities and are measured using enacted tax rates and laws that will be in effect when the differences are expected to reverse.(r) Shareholders’ equityThe Corporation Law of Japan provides that an amount equal to 10% of the amount to be distributed as distributions of capital surplus (other than the capital reserve) and retained earnings (other than the legal reserve) be transferred to the capital reserve and the legal reserve, respectively, until the sum of the capital reserve and the legal reserve equals 25% of the common stock account. Such distributions can be made at any time by resolution of the shareholders or by the Board of Directors if certain conditions are met, but neither the capital reserve nor the legal reserve is available for distributions.(s) Hedge accounting(1) Hedge accounting method The exceptional accounting treatment (the “Tokurei-shori”) is applied
with respect to interest rate swaps that meet the requirements to hedge the cash flow volatility of certain foreign currency-denominated loans. The Tokurei-shori and the designated hedge accounting (the “Furiate-shori”) are applied with respect to interest rate and currency swaps that meet the requirements to hedge the cash flow volatility caused by foreign exchange rate fluctuations on certain foreign currency-denominated loans.
(2) Hedging instruments and hedged items 1Hedging instruments .....Interest rate swaps Hedging items ................Foreign currency-denominated loans 2Hedging instruments .....Interest rate and currency swaps Hedging items ................Foreign currency-denominated loans(3) Hedging policy In accordance with the internal regulation, risk of fluctuations in
interest rates and foreign exchange is hedged.(4) Method of evaluating the effectiveness of hedges The evaluation of effectiveness is omitted for interest rate swaps
accounted for under the Tokurei-shori and for interest rate and currency swaps accounted for under the Tokurei-shori and Furiate-shori.
(t) Changes in accounting principles(Changes in accounting principles that are difficult to distinguish from changes in accounting estimates)(Change in the depreciation method of property, plant and equipment)The Company and its domestic consolidated subsidiaries had convention-ally used the declining-balance method (straight line method for the buildings (excluding attached facilities) acquired on or after April 1, 1998) as the depreciation method of property, plant and equipment (excluding leased assets), which has been changed to the straight line method from this consolidated fiscal year. Based on its medium-term business plan “LIP-2016”, which was announced in 2014, the LINTEC Group (the “Group”) has been further promoting its global development and actively investing its management resources in growth areas such as innovative new products that will support the next generation. As part of these efforts, the Group has added a new research building and testing and research facilities, and when these new facilities
commenced full operation in 2016, the Group re-examined its depreciation method, which appropriately reflected the condition of the use of the Group’s property, plant and equipment. As a result, the Group determined that comprehensively considering the following changes and altering the depreciation method to the straight-line method would enable more appropriate cost distribution throughout the period of use.(1) The latest, large testing and research facilities were installed during
the addition of the research building in order to improve the Group’s development simulation capability, which resulted in an increase in the percentage of research and development facilities in its property, plant and equipment. Such R&D facilities will include large test coaters associated with factory mass production facilities, advanced analysis equipment, and other devices, which are expected to substantially accelerate the process from the initial stage of research to mass production. The Group plans to engage in development for the estab-lishment of the mass production process, and these R&D facilities will be operated steadily every fiscal year.
(2) High-function products have been increasing as a proportion of the Company’s products in recent years, and improvements and additions to the coaters, which are major facilities in the Company’s property, plant and equipment, have been made in line with this increase. These manufacturing facilities as a whole wear at an average rate every fiscal year due to improvements in manufacturing technology thanks to R&D, etc. and the modification of the production system. In addition, operations are expected to be steady given the Company’s active improvement of facilities to meet rising demand in growth areas.
As a result, the depreciation of this consolidated fiscal year decreased by ¥2,685 million (U.S. $23,933 thousand) from those using the conven-tional method, and operating income, ordinary income, and profit before income taxes have each increased by ¥2,399 million (U.S. $21,390 thousand).(u) Changes in presentation(Consolidated Balance Sheet)“Goodwill,” which was included in “Intangible assets” in the previous consolidated fiscal year, is separately presented in this consolidated fiscal year due to its increased materiality of the amount. To reflect this change in presentation, ¥2,357 million presented as “Intangible assets” in the consolidated balance sheet of the previous fiscal year has been reclassified into ¥22 million of “Goodwill” and ¥2,334 million of “Other.”(Consolidated Statement of Income)“Insurance income,” which was included in “Other income” under “Non-operating income” in the previous consolidated fiscal year, is separately presented in this consolidated fiscal year due to its increased quantitative materiality. To reflect this change in presentation, ¥318 million presented as “Other income” under “Non-operating income” in the consol-idated statement of income of the previous fiscal year has been reclassified into ¥42 million of “Insurance income” and ¥276 million of “Other income.”(v) Additional informationThe Accounting Standards Board of Japan (ASBJ) Guidance No. 26 issued the Implementation Guidance on Recoverability of Deferred Tax Assets on March 28, 2016, and the guidance has been applied from this consolidated fiscal year.
LINTEC ANNUAL REPORT 201762
FINANCIAL SECTION

3. InventoriesMerchandise and finished goods, work in process, and raw materials and supplies as of March 31, 2017 and 2016 were as follows:
Millions of yen
Thousands of U.S. dollars
2017 2016 2017Merchandise and finished goods ¥13,031 ¥10,956 $116,156Work in process 11,951 11,513 106,527Raw materials and supplies 9,601 8,596 85,583 Total ¥34,584 ¥31,066 $308,267
4. Selling, General and Administrative ExpensesMajor items included in selling, general and administrative expenses for the years ended March 31, 2017 and 2016 were as follows:
Millions of yen
Thousands of U.S. dollars
2017 2016 2017Transportation and warehousing expenses ¥ 5,125 ¥ 5,274 $ 45,682 Provision for allowance for doubtful accounts (12) 48 (109)Salaries and allowances 7,743 8,011 69,021Retirement benefit expenses 423 284 3,774Provision for directors’ bonuses 95 93 853Depreciation and amortization 1,092 1,068 9,740Research and development expenses 7,639 7,644 68,094Other 14,156 13,507 126,185 Total ¥36,264 ¥35,932 $323,243
5. Research and Development ExpensesResearch and development expenses, all of which were included in selling, general and administrative expenses, for the years ended March 31, 2017 and 2016 were ¥7,639 million (U.S.$68,094 thousand) and ¥7,644 million, respectively.
6. Gain on Sales of Noncurrent AssetsGain on sales of noncurrent assets was related to sales of land for the year ended March 31, 2017 and sales of buildings and structures for the year ended March 31, 2016.
7. Special Retirement ExpensesThe Company has recognized special retirement expenses for downsizing of consolidated subsidiaries in the U.S. for the year ended March 31, 2016.
8. Loss on Abolishment of Retirement Benefit PlanThe Company has recognized settlement loss for partial settlement of a retirement benefit plan of consolidated subsidiaries in the U.S. for the year ended March 31, 2016.
9. Loss on Temporary Suspension of ProductionThe Company has recognized extraordinary loss for temporary suspension of production at a manufacturing plant operated by a subsidiary in Indonesia due to a labor strike for the year ended March 31, 2016.
10. Impairment Loss on Property, Plant and EquipmentThe Company has recognized impairment loss on the following classes of assets for the year ended March 31, 2017:
Major use Location Category Millions of yenThousands of
U.S. dollars
Pressure-sensitive adhesive related products manufacturing equipment
Massachusetts State, U.S.A. Machinery, equipment and vehicles ¥34 $304
(1) Circumstances leading to the recognition of impairment loss The impairment loss above has been recognized because the asset has decreased in profitability.(2) Method of calculating recoverable amounts The recoverable amounts of the assets above are the net realizable value and based on a third-party appraisal value.
63LINTEC ANNUAL REPORT 2017
FINANCIAL SECTION

11. Comprehensive IncomeReclassification adjustment and tax effect of other comprehensive income for the years ended March 31, 2017 and 2016 were as follows:
Millions of yen Thousands of
U.S. dollars
2017 2016 2017Net unrealized holding gain on securities: Amount incurred during the fiscal year ¥ 340 ¥ (202) $ 3,037 Reclassification adjustment (177) (0) (1,580) Prior to deducting tax effect 163 (202) 1,456 Tax effect (89) 71 (800) Net unrealized holding gain on securities 73 (130) 656Foreign currency translation adjustments: Amount incurred during the fiscal year (453) (3,443) (4,042) Reclassification adjustment (454) ― (4,048) Prior to deducting tax effect (907) (3,443) (8,091) Tax effect ― ― — Foreign currency translation adjustments (907) (3,443) (8,091)Remeasurements of defined benefit plans: Amount incurred during the fiscal year (229) (4,656) (2,049) Reclassification adjustment 397 381 3,546 Prior to deducting tax effect 167 (4,274) 1,497 Tax effect (49) 1,299 (445) Remeasurements of defined benefit plans 118 (2,975) 1,052Total other comprehensive income ¥(716) ¥(6,549) $(6,382)
12. Cash and Cash Equivalents1. Reconciliation between cash and cash equivalents in the consolidated statement of cash flows and cash and deposits in the consolidated balance
sheet as of March 31, 2017 and 2016 were as follows:
Millions of yen Thousands of
U.S. dollars
2017 2016 2017Cash and deposits ¥45,060 ¥65,733 $401,641Time deposits with maturity of more than 3 months (3,775) (5,409) (33,650)Cash and cash equivalents ¥41,284 ¥60,323 $367,990
2. Assets and liabilities of newly acquired consolidated subsidiaries through acquisition of shares or membership interests for the year ended March 31, 2017 was as follows:
(1) Assets and liabilities of VDI, LLC (a newly acquired consolidated subsidiary through acquisition of membership interests) at the inception of its consolidation, the acquisition cost of its membership interest and the related expenditures (net) for the acquisition were as follows:
Millions of yen Thousands of
U.S. dollars
2017Current assets ¥ 473 $ 4,223Non-current assets 1,713 15,272Goodwill 1,839 16,398Current liabilities (222) (1,987)Non-current liabilities (1,102) (9,830)Acquisition cost of membership interests ¥ 2,701 $24,076Cash and cash equivalents (95) (848)Net expenditures for acquisition ¥ 2,605 $23,227
LINTEC ANNUAL REPORT 201764
FINANCIAL SECTION

(2) Assets and liabilities of MACtac Americas, LLC (another newly acquired consolidated subsidiary through acquisition of membership interests) at the inception of its consolidation, the acquisition cost of its membership interest and the related expenditures (net) for the acquisition were as follows:
Millions of yen Thousands of
U.S. dollars
2017Current assets ¥ 9,066 $ 80,817Non-current assets 6,820 60,793Goodwill 30,889 275,330Current liabilities (4,794) (42,738)Non-current liabilities (7,564) (67,427)Acquisition cost of membership interests ¥34,417 $306,776Cash and cash equivalents (775) (6,910)Accrued amount of the acquisition cost of membership interests (301) (2,684)Net expenditures for acquisition ¥33,340 $297,182
(3) Assets and liabilities of Lintec Graphic Films Limited (the other newly acquired consolidated subsidiary through acquisition of shares) at the inception of its consolidation, the acquisition cost of its shares and the related expenditures (net) for the acquisition were as follows:
Millions of yen Thousands of
U.S. dollars
2017Current assets ¥ 378 $ 3,375Non-current assets 144 1,286Goodwill 733 6,539Current liabilities (171) (1,531)Non-current liabilities (59) (534)Acquisition cost of shares ¥1,024 $ 9,136Cash and cash equivalents (61) (551)Net expenditures for acquisition ¥ 963 $ 8,584
There is no disclosure applicable for the year ended March 31, 2016.
3. Assets and liabilities related to finance lease transactions newly recognized for the years ended March 31, 2017 and 2016 were ¥183 million (U.S. $1,639 thousand) and ¥105 million, respectively.
13. Leases(Lessee’s accounting)For finance lease transactions that transfer ownership, leased assets recognized as property, plant and equipment are mainly production facilities for the years ended March 31, 2017 and 2016, and are depreciated in the same way as the owned property, plant and equipment. For finance lease transactions that do not transfer ownership, leased assets recognized as property, plant and equipment are mainly production facili-ties and vehicles, and those recognized as intangible assets are mainly software for the years ended March 31, 2017 and 2016. These leased assets are depreciated to a residual value of zero by the straight-line method using the contract term as the useful life.
The minimum lease payments under noncancellable operating leases as of March 31, 2017 and 2016 were as follows:
Millions of yen Thousands of
U.S. dollars
2017 2016 2017Due within 1 year ¥ 419 ¥312 $3,741Due after 1 year 595 343 5,311 Total ¥1,015 ¥655 $9,052
65LINTEC ANNUAL REPORT 2017
FINANCIAL SECTION

14. Financial Instruments1. Status of financial instruments(1) Policy regarding financial instrumentsThe LINTEC Group (the “Group”) limits the scope of its cash and fund management activities to short-term deposits and has a policy of relying principally on bank loans. The Group makes use of derivatives only to reduce risk of foreign currency exchange fluctuations and has a policy of not engaging in derivative transactions for speculative purposes.(2) Details of financial instruments and associated risk and risk management
systemIn the course of its business activities, the Group is exposed to credit risk arising from trade notes and accounts receivable that are outstanding from its customers. Regarding the risk pursuant to the internal regulations for managing its credit exposure and trade receivables, due dates and balances are managed appropriately for each customer, to mitigate risks of uncollect-ible accounts. Investment securities are stocks being exposed to market price risk, and these are mainly the stocks of companies with which the Group has business relationships and they are periodically confirmed the market value.
All of the trade payables–trade notes and accounts payable–are due within 1 year. The Group has commitment line contracts with financial institutions and the short-term loans payable are raised mainly for business activities and capital investments. The long-term loans payable are raised for corporate acquisitions. Interest rate swaps and interest rate and currency swaps are used to manage exposure to market risks from changes in interest rates and foreign currency exchange rate of the long-term loans payable. The Group is exposed to liquidity risk from its business-related obligations and loans but the Company and its consolidated subsidiaries prepare and implement financing plans to manage the liquidity risk. The Group conducts and manages derivative transactions based on internal rules and regulations. Director of administration division is in charge of managing derivative transactions and related reports are submitted to top management for each case. In addition, the contract amounts of derivative transactions described below in Note 16, “Derivatives,” do not represent the market risk associated with derivative transactions.
2. Estimated fair value and other matters related to financial instrumentsCarrying value on the consolidated balance sheet as of March 31, 2017 and 2016 along with their fair value and the variance were shown in the following table.
Millions of yenThousands of
U.S. dollars
2017
Carrying valueEstimated fair value Variance Carrying value
Estimated fair value Variance
(1) Cash and deposits ¥ 45,060 ¥ 45,060 ¥— $ 401,641 $ 401,641 $ —(2) Trade notes and accounts receivable 66,801 66,801 — 595,431 595,431 —(3) Investment securities Other securities 2,519 2,519 — 22,455 22,455 —(4) Trade notes and accounts payable (45,057) (45,057) — (401,622) (401,622) —(5) Short-term loans payable (641) (641) — (5,720) (5,720) —(6) Accrued income taxes (3,098) (3,098) — (27,621) (27,621) —(7) Long-term loans payable (20,847) (20,888) 41 (185,819) (186,190) 371(8) Derivatives (37) (37) — (331) (331) —
Notes: i. Figures shown in parentheses are liability items. ii. The current portion of long-term loans payable is included in long-term loans payable. iii. The value of assets and liabilities arising from derivatives is shown by net value.
Millions of yen
2016
Carrying valueEstimated fair value Variance
(1) Cash and deposits ¥ 65,733 ¥ 65,733 ¥ —(2) Trade notes and accounts receivable 62,331 62,331 —(3) Investment securities Other securities 2,469 2,469 —(4) Trade notes and accounts payable (39,683) (39,683) —(5) Short-term loans payable (1,695) (1,695) —(6) Accrued income taxes (2,272) (2,272) —(7) Long-term loans payable — — —(8) Derivatives 4 4 —
Notes: i. Figures shown in parentheses are liability items. ii. The value of assets and liabilities arising from derivatives is shown by net value.
LINTEC ANNUAL REPORT 201766
FINANCIAL SECTION

Note 1: Method of computing the estimated fair value of financial instruments, securities and derivatives
(1) Cash and deposits; (2) Trade notes and accounts receivable Since these items are settled in a short period of time and have estimated fair values
that are virtually the same as the carrying value on the ledger, the carrying value has been used.
(3) Investment securities The market value of investment securities is determined by the price of the stock
traded on an exchange market. (4) Trade notes and accounts payable; (5) Short-term loans payable; (6) Accrued
income taxes Since these items are settled in a short period of time and have estimated fair values
that are virtually the same as the carrying value on the ledger, the carrying value has been used.
(7) Long-term loans payable The fair value of long-term loans payable is measured as the net present value of
estimated cash flows by discounting the amount of principal and interest value using the assumed interest rate applied to a new similar loan. The fair value of long-term loans payable with variable interest rates hedged by interest rate swaps subject to the special treatment or interest rate and currency swaps subject to the total treatment are calculated based on the net present value of the total amount of principle and interest, accounted for together with the interest rate swap or interest rate and currency swap transactions, discounted by the interest rate rationally estimated for a similar loan.
(8) Derivatives Please see Note 16, “Derivatives.”
Note 2: Financial instruments for which obtaining an estimated fair value is deemed to be extremely difficult:
Millions of yenThousands of
U.S. dollars
2017 2016 2017Carrying value Carrying value Carrying value
Unlisted stocks ¥583 ¥656 $5,202
The unlisted stocks in the preceding table do not have market values, and as estimating their future cash flows is deemed to be extremely difficult, they are not included in the above table “(3) Investment securities.”
Note 3: Planned redemption amounts after the balance sheet date for held-to-maturity securities and receivables were as follows:
Millions of yenThousands of
U.S. dollars
2017 2016 2017Within 1 year Within 1 year Within 1 year
Cash and deposits ¥ 45,038 ¥ 65,711 $401,444Trade notes and accounts receivable 66,801 62,331 595,431 Total ¥111,839 ¥128,043 $996,876
Note 4: Planned redemption amounts after the balance sheet date for borrowings were as follows:Millions of yen
2017
Within 1 yearOver 1 year
within 2 yearsOver 2 years
within 3 yearsOver 3 years
within 4 yearsOver 4 years
within 5 years Over 5 years
Short-term loans payable ¥ 641 ¥ — ¥ — ¥ — ¥ — ¥ —Current portion of long-term loans payable 3,051 — — — — —Long-term loans payable — 3,058 3,058 9,321 1,234 1,121 Total ¥3,693 ¥3,058 ¥3,058 ¥9,321 ¥1,234 ¥1,121
Thousands of U.S. dollars
2017
Within 1 yearOver 1 year
within 2 yearsOver 2 years
within 3 yearsOver 3 years
within 4 yearsOver 4 years
within 5 years Over 5 years
Short-term loans payable $ 5,720 $ — $ — $ — $ — $ —Current portion of long-term loans payable 27,202 — — — — —Long-term loans payable — 27,263 27,263 83,089 11,000 10,000 Total $32,922 $27,263 $27,263 $83,089 $11,000 $10,000
Millions of yen
2016
Within 1 yearOver 1 year
within 2 yearsOver 2 years
within 3 yearsOver 3 years
within 4 yearsOver 4 years
within 5 years Over 5 years
Short-term loans payable ¥1,695 ¥— ¥— ¥— ¥— ¥—Current portion of long-term loans payable — — — — — —Long-term loans payable — — — — — — Total ¥1,695 ¥— ¥— ¥— ¥— ¥—
67LINTEC ANNUAL REPORT 2017
FINANCIAL SECTION

15. Marketable and Investment Securities1. The carrying value and acquisition cost of other securities as of March 31, 2017 and 2016 were as follows:
Millions of yen Thousands of
U.S. dollars
2017
Description Carrying value Acquisition costUnrealized gain
(loss) Carrying value Acquisition costUnrealized gain
(loss)
Securities whose carrying value exceeds their acquisition cost
Stocks ¥2,180 ¥ 975 ¥1,205 $19,438 $ 8,695 $10,743Bonds — — — — — —Other — — — — — —
Subtotal ¥2,180 ¥ 975 ¥1,205 $19,438 $ 8,695 $10,743Securities whose acquisition cost exceeds their carrying value
Stocks ¥ 338 ¥ 425 ¥ (86) $ 3,016 $ 3,790 $ (773)Bonds — — — — — —Other — — — — — —
Subtotal ¥ 338 ¥ 425 ¥ (86) $ 3,016 $ 3,790 $ (773) Total ¥2,519 ¥1,400 ¥1,118 $22,455 $12,485 $ 9,969
Millions of yen
2016
Description Carrying value Acquisition costUnrealized gain
(loss)
Securities whose carrying value exceeds their acquisition cost
Stocks ¥2,143 ¥1,018 ¥1,124Bonds — — —Other — — —
Subtotal ¥2,143 ¥1,018 ¥1,124Securities whose acquisition cost exceeds their carrying value
Stocks ¥ 325 ¥ 495 ¥ (169)Bonds — — —Other — — —
Subtotal ¥ 325 ¥ 495 ¥ (169) Total ¥2,469 ¥1,514 ¥ 955
2. Other securities sold during the year ended March 31, 2017:
Millions of yen Thousands of
U.S. dollars
2017Description Sales amount Aggregate gains Aggregate losses Sales amount Aggregate gains Aggregate losses
Stocks ¥361 ¥190 ¥13 $3,226 $1,696 $116Bonds — — — — — —Other — — — — — — Total ¥361 ¥190 ¥13 $3,226 $1,696 $116
There is no disclosure applicable for the year ended March 31, 2016.
16. Derivatives1. Derivatives to which the Company did not apply hedge accounting as of March 31, 2017 and 2016 were as follows:(Currency related)
Millions of yen
2017Contract amounts Estimated
Fair valueUnrealized gain
(loss)Nature of transaction Total Over 1 year
Off-market transactions Forward exchange contracts to: Sell: U.S. dollars (buy Japanese yen) ¥ 919 ¥— ¥(14) ¥(14) Buy: Korean won (sell U.S. dollars) 58 — (2) (2) Sell: India rupee (buy Japanese yen) 345 — (19) (19)
Total ¥1,323 ¥— ¥(37) ¥(37)
LINTEC ANNUAL REPORT 201768
FINANCIAL SECTION

Thousands of U.S. dollars
2017Contract amounts Estimated
Fair valueUnrealized gain
(loss)Nature of transaction Total Over 1 year
Off-market transactions Forward exchange contracts to: Sell: U.S. dollars (buy Japanese yen) $ 8,192 $— $(130) $(130) Buy: Korean won (sell U.S. dollars) 523 — (22) (22) Sell: India rupee (buy Japanese yen) 3,081 — (178) (178)
Total $11,797 $— $(331) $(331)
Note: Method of computing the estimated fair value is based on information provided by financial institutions at the end of the fiscal year.
Millions of yen
2016Contract amounts Estimated
Fair valueUnrealized gain
(loss)Nature of transaction Total Over 1 year
Off-market transactions Forward exchange contracts to: Sell: U.S. dollars (buy Japanese yen) ¥422 ¥ — ¥ 5 ¥ 5 Buy: Korean won (sell U.S. dollars) 114 — (1) (1) Buy: Korean won (sell Japanese yen) 30 — (0) (0)
Total ¥567 ¥ — ¥ 4 ¥ 4
Note: Method of computing the estimated fair value is based on information provided by financial institutions at the end of the fiscal year.
2. Derivatives to which the Company applied hedge accounting as of March 31, 2017 were as follows:(Interest rate related)
Millions of yen
2017Contract amounts Estimated
Fair valueHedge accounting method Type of derivatives Major hedged items Total Over 1 year
The Tokurei-shori for interest rate swaps
Interest rate swaps Variable rate receipt / Fixed rate payment
Long-term loans payable ¥2,355 ¥2,131 ¥(Note)
Thousands of U.S. dollars
2017Contract amounts Estimated
Fair valueHedge accounting method Type of derivatives Major hedged items Total Over 1 year
The Tokurei-shori for interest rate swaps
Interest rate swaps Variable rate receipt / Fixed rate payment
Long-term loans payable $21 $19 $(Note)
Note: Interest rate swaps subject to the Tokurei-shori for interest rate swaps are treated together with the hedged long-term loans payable. Accordingly, the fair value of those interest rate swaps is included in the fair value of the long-term loans payable.
There is no disclosure applicable as of March 31, 2016.
(Interest rate and currency related)Millions of yen
2017Contract amounts Estimated
Fair valueHedge accounting method Type of derivatives Major hedged items Total Over 1 year
The Tokurei-shori and Furiate-shori for interest rate and currency swaps
Interest rate and currency swaps Variable rate receipt / Fixed rate payment U.S.$ receipt / Japanese ¥ payment
Long-term loans payable ¥6,581 ¥5,993 ¥(Note)
Thousands of U.S. dollars
2017Contract amounts Estimated
Fair valueHedge accounting method Type of derivatives Major hedged items Total Over 1 year
The Tokurei-shori and Furiate-shori for interest rate and currency swaps
Interest rate and currency swaps Variable rate receipt / Fixed rate payment U.S.$ receipt / Japanese ¥ payment
Long-term loans payable $58 $53 $(Note)
Note: I nterest rate and currency swaps subject to the Tokurei-shori and Furiate-shori for interest rate and currency swaps are treated together with the hedged long-term loans payable. Accordingly, the fair value of those interest rate and currency swaps is included in the fair value of the long-term loans payable.
69LINTEC ANNUAL REPORT 2017
FINANCIAL SECTION

17. Retirement BenefitsThe Company has defined benefit plans of a corporate pension fund plan under the Japanese Defined Benefit Corporate Pension Law and lump-sum payment plan. Domestic consolidated subsidiaries have lump-sum payment plans and certain foreign consolidated subsidiaries have defined contribution plans and lump-sum payment plans. The following summarizes information related to retirement benefits for the years ended March 31, 2017 and 2016.
1. Defined benefit plans(1) Reconciliation statement for the beginning balance and the ending balance of retirement benefit obligations
Millions of yen Thousands of
U.S. dollars
2017 2016 2017Retirement benefit obligations at beginning of year ¥36,549 ¥33,518 $325,786 Service cost 1,754 1,352 15,641 Interest cost 187 426 1,670 Actuarial gains (losses) (4) 3,971 (43) Retirement benefits paid (1,570) (1,390) (13,999) Abolishment of retirement benefit plan ― (1,330) ― Increase (decrease) from foreign currency translation (26) (46) (240) Other 75 48 672Retirement benefit obligations at end of year ¥36,965 ¥36,549 $329,486
Note: For some of the consolidated subsidiaries, the simplified method is used to calculate retirement benefit obligations.
(2) Reconciliation statement for the beginning balance and the ending balance of plan assets
Millions of yen Thousands of
U.S. dollars
2017 2016 2017Plan assets at beginning of year ¥25,073 ¥27,488 $223,489 Expected return on plan assets 726 733 6,479 Actuarial gains (losses) (239) (802) (2,134) Contributions from the employer 521 536 4,649 Retirement benefits paid (1,479) (1,336) (13,186) Abolishment of retirement benefit plan ― (1,361) ― Increase (decrease) from foreign currency translation ― 6 ― Other ― (189) ―Plan assets at end of year ¥24,603 ¥25,073 $219,297
(3) Reconciliation statement for the ending balance of retirement benefit obligations and plan assets and net defined benefit liability or asset recorded in the consolidated financial statements
Millions of yen Thousands of
U.S. dollars
2017 2016 2017Retirement benefit obligations of a funded pension plan ¥ 36,244 ¥ 35,867 $ 323,059Plan assets (24,603) (25,073) (219,297)
11,641 10,793 103,761Retirement benefit obligations of an unfunded pension plan 721 682 6,427Net amount of liabilities and assets recorded in the consolidated balance sheet ¥ 12,362 ¥ 11,476 $ 110,189
Net defined benefit liability ¥ 12,362 ¥ 11,476 $ 110,189Net defined benefit asset ― ― ―Net amount of liabilities and assets recorded in the consolidated balance sheet ¥ 12,362 ¥ 11,476 $ 110,189
LINTEC ANNUAL REPORT 201770
FINANCIAL SECTION

(4) Components of retirement benefit expenses
Millions of yen Thousands of
U.S. dollars
2017 2016 2017Service cost ¥1,754 ¥1,352 $15,641Interest cost 187 426 1,670Expected return on plan assets (726) (733) (6,479)Amortization of actuarial losses (gains) 681 400 6,073Amortization of prior service cost (283) (284) (2,525)Other (25) (7) (228)Retirement benefit expenses for the defined benefit plans ¥1,587 ¥1,155 $14,152Special retirement expenses ¥ ― ¥ 438 $ ―Loss on abolishment of retirement benefit plan ― 265 ―
Notes: i. Retirement benefit expenses of consolidated subsidiaries using the simplified method are included in service cost. ii. Employee’s contributions to the corporate pension fund are not included in the retirement benefit expenses for the defined benefit plans. iii. “Special retirement expenses” and “Loss on abolishment of retirement benefit plan” are recognized in extraordinary loss.
(5) Remeasurements of defined benefit plansBreakdown of items (before tax effect) recorded in other comprehensive income of remeasurements of defined benefit plans are as follows:
Millions of yen Thousands of
U.S. dollars
2017 2016 2017Prior service cost ¥ 283 ¥ 284 $ 2,525Actuarial losses (gains) (451) 3,990 (4,022) Total ¥(167) ¥4,274 $(1,497)
(6) Remeasurements of defined benefit plansBreakdown of items (before tax effect) recorded in accumulated other comprehensive income of remeasurements of defined benefit plans are as follows:
Millions of yen Thousands of
U.S. dollars
2017 2016 2017Unrecognized prior service cost ¥ (545) ¥ (828) $ (4,858)Unrecognized actuarial losses (gains) 5,434 5,886 48,442 Total ¥4,889 ¥5,057 $43,583
(7) Items related to plan assets 1. Breakdown of major items The fair value of plan assets, by major category, as a percentage of total plan assets as of March 31, 2017 and 2016 was as follows:
2017 2016Bonds 52.9% 56.8%Stocks 22.9% 20.0%Alternatives 15.9% 19.4%Cash and deposits 5.1% 1.0%Other 3.2% 2.8% Total 100.0% 100.0%
Note: Alternatives are mainly investments on hedge funds.
2. Method for determining the expected long-term rate of return on plan assets In determining the expected long-term rate of return on plan assets, estimates are considered based on the current and expected allocation of plan
assets and the current and expected long-term rate of return from the various assets comprising the plan assets.
(8) Major actuarial assumptions as of March 31, 2017 and 2016 were as follows:
2017 2016Discount rate Mainly 0.5% Mainly 0.5%Expected long-term rate of return on plan assets Mainly 3.5% Mainly 3.5%Expected rates of pay raises Mainly 2.8% Mainly 2.8%
2. Defined contribution planSome of the consolidated subsidiaries contributed ¥160 million (U.S. $1,426 thousand) and ¥171 million, for the years ended March 31, 2017 and 2016 to the defined contribution plans, respectively.
71LINTEC ANNUAL REPORT 2017
FINANCIAL SECTION

18. Stock Option PlanComponents of stock-based compensation expense for the years ended March 31, 2017 and 2016 were as follows:
Millions of yen
Thousands of U.S. dollars
2017 2016 2017Cost of sales ¥ 2 ¥ 4 $ 21 Selling, general and administrative expenses 15 28 135
The following table summarizes contents of stock options as of March 31, 2017:
The 2006 planName of Company The CompanyDate of approval of the Board of Directors August 10, 2006Position and number of grantees Directors, 17Class and number of stocks Common stock 10,500 sharesDate of grant August 25, 2006Condition and settlement of rights Persons who have received allotment of share subscription rights must hold the position of director
of the Company at the time of grant.Period of providing service for stock options —Exercise period From August 26, 2006 to August 25, 2026
The 2007 planName of Company The CompanyDate of approval of the Board of Directors August 9, 2007Position and number of grantees Directors, 17Class and number of stocks Common stock 9,300 sharesDate of grant August 24, 2007Condition and settlement of rights Persons who have received allotment of share subscription rights must hold the position of director
of the Company at the time of grant.Period of providing service for stock options —Exercise period From August 25, 2007 to August 24, 2027
The 2008 planName of Company The CompanyDate of approval of the Board of Directors August 8, 2008Position and number of grantees Directors, 14Class and number of stocks Common stock 9,800 sharesDate of grant August 25, 2008Condition and settlement of rights Persons who have received allotment of share subscription rights must hold the position of director
of the Company at the time of grant.Period of providing service for stock options —Exercise period From August 26, 2008 to August 25, 2028
The 2009 planName of Company The CompanyDate of approval of the Board of Directors August 7, 2009Position and number of grantees Directors, 14Class and number of stocks Common stock 15,000 sharesDate of grant August 24, 2009Condition and settlement of rights Persons who have received allotment of share subscription rights must hold the position of director
of the Company at the time of grant.Period of providing service for stock options —Exercise period From August 25, 2009 to August 24, 2029
The 2010 planName of Company The CompanyDate of approval of the Board of Directors August 9, 2010Position and number of grantees Directors, 16Class and number of stocks Common stock 14,100 sharesDate of grant August 24, 2010Condition and settlement of rights Persons who have received allotment of share subscription rights must hold the position of director
of the Company at the time of grant.Period of providing service for stock options —Exercise period From August 25, 2010 to August 24, 2030
LINTEC ANNUAL REPORT 201772
FINANCIAL SECTION

The 2011 planName of Company The CompanyDate of approval of the Board of Directors August 9, 2011Position and number of grantees Directors, 8Class and number of stocks Common stock 7,600 sharesDate of grant August 24, 2011Condition and settlement of rights Persons who have received allotment of share subscription rights must hold the position of director
of the Company at the time of grant.Period of providing service for stock options —Exercise period From August 25, 2011 to August 24, 2031
The 2012 planName of Company The CompanyDate of approval of the Board of Directors August 8, 2012Position and number of grantees Directors, 8 and Executive Officers, 12Class and number of stocks Common stock 15,900 sharesDate of grant August 23, 2012Condition and settlement of rights Persons who have received allotment of share subscription rights must hold the position of director
or executive officer of the Company at the time of grant.Period of providing service for stock options —Exercise period From August 24, 2012 to August 23, 2032
The 2013 planName of Company The CompanyDate of approval of the Board of Directors August 7, 2013Position and number of grantees Directors, 10 and Executive Officers, 12Class and number of stocks Common stock 22,000 sharesDate of grant August 22, 2013Condition and settlement of rights Persons who have received allotment of share subscription rights must hold the position of director
or executive officer of the Company at the time of grant.Period of providing service for stock options —Exercise period From August 23, 2013 to August 22, 2033
The 2014 planName of Company The CompanyDate of approval of the Board of Directors August 6, 2014Position and number of grantees Directors, 10 and Executive Officers, 12Class and number of stocks Common stock 18,300 sharesDate of grant August 21, 2014Condition and settlement of rights Persons who have received allotment of share subscription rights must hold the position of director
or executive officer of the Company at the time of grant.Period of providing service for stock options —Exercise period From August 22, 2014 to August 21, 2034
The 2015 planName of Company The CompanyDate of approval of the Board of Directors August 6, 2015Position and number of grantees Directors, 11 and Executive Officers, 12Class and number of stocks Common stock 14,600 sharesDate of grant August 21, 2015Condition and settlement of rights Persons who have received allotment of share subscription rights must hold the position of director
or executive officer of the Company at the time of grant.Period of providing service for stock options —Exercise period From August 22, 2015 to August 21, 2035
73LINTEC ANNUAL REPORT 2017
FINANCIAL SECTION

The 2016 planName of Company The CompanyDate of approval of the Board of Directors August 9, 2016Position and number of grantees Directors, 11 and Executive Officers, 12Class and number of stocks Common stock 12,200 sharesDate of grant August 24, 2016Condition and settlement of rights Persons who have received allotment of share subscription rights must hold the position of director
or executive officer of the Company at the time of grant.Period of providing service for stock options —Exercise period From August 25, 2016 to August 24, 2036
The following tables summarize the scale and movement of stock options for the years ended March 31, 2017 and 2016:
(Non-vested stock options) (unit: shares)
The 2006 plan The 2007 plan The 2008 plan The 2009 plan The 2010 plan The 2011 plan The 2012 plan The 2013 plan The 2014 plan The 2015 plan The 2016 plan
Stock options outstanding at April 1, 2016 — — — — — — — — — — — Stock options granted — — — — — — — — — — 12,200 Forfeitures — — — — — — — — — — — Conversion to vested
stock options — — — — — — — — — — 12,200Stock options outstanding at March 31, 2017 — — — — — — — — — — —
(Vested stock options) (unit: shares)
The 2006 plan The 2007 plan The 2008 plan The 2009 plan The 2010 plan The 2011 plan The 2012 plan The 2013 plan The 2014 plan The 2015 plan The 2016 plan
Stock options outstanding at April 1, 2016 3,300 2,900 5,200 7,700 7,200 6,800 13,600 20,600 17,200 14,600 — Conversion from non- vested stock options — — — — — — — — — — 12,200 Stock options exercised — — — — — — — — — — — Forfeitures — — — — — — — — — — —Stock options outstanding at March 31, 2017 3,300 2,900 5,200 7,700 7,200 6,800 13,600 20,600 17,200 14,600 12,200
The following table summarizes the price information of stock options as of March 31, 2017:
The 2006 plan The 2007 plan The 2008 plan The 2009 plan The 2010 plan The 2011 plan The 2012 plan The 2013 plan The 2014 plan The 2015 plan The 2016 plan
Exercise price ¥ 1 ¥ 1 ¥ 1 ¥ 1 ¥ 1 ¥ 1 ¥ 1 ¥ 1 ¥ 1 ¥ 1 ¥ 1Average market price of the stock at the time of exercise — — — — — — — — — — —Fair value at the date of grant 2,788 1,947 1,481 1,726 1,474 1,303 1,203 1,595 1,825 2,283 1,445
The fair value of stock options granted during the year ended March 31, 2017 was valued by using the Black Scholes option pricing model with the following assumptions:
The 2016 plan
Volatility 35.515%Expected remaining period 10 yearsExpected dividend per share ¥54Risk free interest rate (0.078)%
The expected remaining period for stock options is assumed to be the mid-point of the exercise period.
LINTEC ANNUAL REPORT 201774
FINANCIAL SECTION

19. Income Taxes1. The Company and its consolidated subsidiaries are subject to a number of taxes based on income which, in the aggregate, resulted in a statutory tax rate of approximately 30.86% and 33.06% for the years ended March 31, 2017 and 2016, respectively. Income taxes of the foreign consolidated subsidiaries are based generally on the tax rates applicable in their countries of incorporation. The effective tax rates reflected in the consolidated statement of income for the years ended March 31, 2017 and 2016 differ from the statutory tax rate for the following reasons:
2017 2016Statutory tax rate 30.86% 33.06%Effect of: Permanently non-deductible expenses for income tax purposes such as entertainment expenses 0.39 0.40 Permanently non-taxable income for income tax purposes such as dividend income (16.68) (10.49) Municipal Tax 0.37 0.34 The difference of tax rates applied to foreign subsidiaries (5.14) (8.77) Tax deduction in accordance with special tax measures (3.28) (2.93) Decrease of valuation allowance for such as net operating loss carryforward 1.56 5.52 Consolidating adjustment of dividend income from consolidated subsidiaries 18.12 13.95 Effect of revised corporate tax rate ― 1.53 Other, net 1.03 3.28Effective tax rate 27.23% 35.89%
2. The significant components of deferred tax assets and liabilities as of March 31, 2017 and 2016 were as follows:
Millions of yen
Thousands of U.S. dollars
2017 2016 2017Deferred tax assets: Accrued bonuses ¥ 699 ¥ 698 $ 6,235 Accrued enterprise taxes 170 135 1,521 Operating loss carryforwards 1,107 720 9,872 Net defined benefit liability 3,736 3,462 33,302 Retirement benefit trust 1,141 1,348 10,174 Research and development cost 562 497 5,015 Loss on valuation of inventories 269 269 2,398 Allowance for doubtful accounts 138 121 1,232 Unrealized gain 350 371 3,126 Excess of depreciation expense 331 385 2,953 Other 680 575 6,068 Gross deferred tax assets 9,188 8,587 81,904 Valuation allowance (959) (912) (8,549)
8,229 7,675 73,355Deferred tax liabilities: Revaluation of fixed assets in accordance with special tax measures (187) (192) (1,667) Net unrealized holding gain on securities (343) (253) (3,059) Depreciation expense of subsidiaries (508) (211) (4,533) Dividend income from consolidated subsidiaries (460) (846) (4,104) Other (75) (97) (675)
(1,575) (1,601) (14,040) Net deferred tax assets ¥ 6,654 ¥ 6,074 $ 59,314
Note: The net deferred tax assets as of March 31, 2017 and 2016 were included in the following items on the consolidated balance sheets:
Millions of yen
Thousands of U.S. dollars
2017 2016 2017Current assets–Deferred tax assets ¥1,614 ¥1,121 $14,390Noncurrent assets–Deferred tax assets 5,063 4,978 45,137Current liabilities–Other 10 14 96Noncurrent liabilities–Other 13 10 116
75LINTEC ANNUAL REPORT 2017
FINANCIAL SECTION

20. Business Combinations1. Business combination by acquisition(1) Outline of business combination 1 Name of the acquired company Name of the acquired company: VDI, LLC (“VDI”) Business description: Manufacture and sales of functional films 2 Major reasons for the business combination: VDI maintains a manufacturing base in Kentucky, the United States.
VDI is producing functional films, such as metalized films and sputtering films, and selling them to customers in the United States and other countries.
The Company is convinced that VDI’s products can be expected to produce synergies with window films and other functional films manufactured by the Group and to contribute significantly to the expansion of the Group’s business and the improvement of its operating results in the future. The Company is planning to link VDI’s acquisition to business development in new fields, utilizing VDI’s outstanding metalizing technologies that had not existed in the Group previously.
3 Effective date of the business combination: October 31, 2016 4 Legal form of the business combination: Acquisition of membership interests 5 Name of the acquired company after the combination: VDI, LLC 6 Ratio of acquired voting rights: 100% (Ratio of membership interests 100%) 7 Major reasons for the determination of acquiring the company: The determination was made because the Company acquired all of
the membership interests of VDI through LINTEC USA HOLDING, INC., a wholly owned holding company in the United States, by the acquisition of membership interests in exchange for cash.
(2) Period for which the operating results of the acquired company are included in the consolidated financial statements
From November 1, 2016 to December 31, 2016(3) Acquisition cost of the acquired company and breakdown of consideration
for the acquisition by type Consideration for the acquisition Cash: U.S. $26 million (¥2,701 million) Acquisition cost: U.S. $26 million (¥2,701 million)
Note: The yen amounts are conversions based on the exchange rate as of October 31, 2016.
(4) Content and amount of major acquisition-related costs Advisory expenses and others: ¥52 million (U.S. $468 thousands)(5) Amount of goodwill arising from the business combination, cause of
the goodwill, and amortization method and period 1 Amount of goodwill arising from the business combination ¥1,839 million (U.S. $16,398 thousands) 2 Cause of the goodwill The goodwill arose due to VDI’s future additional earnings power
that is expected from future business development. 3 Amortization method and period By straight-line method over 10 years
(6) Amounts of assets received and liabilities assumed on the date of business combination, and their major components
Millions of yen Thousands of
U.S. dollars
2017Current assets ¥ 473 $ 4,223Non-current assets 1,713 15,272 Total assets ¥2,187 $19,496
Current liabilities ¥ 222 $ 1,987Non-current liabilities 1,102 9,830 Total liabilities ¥1,325 $11,818
2. Business combination by acquisition(1) Outline of business combination 1 Name of the acquired company Name of the acquired company: MACtac Americas, LLC (“MACtac”) Business description: Manufacture and sales of label materials for
printing, VIP label materials, graphic sheets, industrial and medical tapes, etc.
2 Major reasons for the business combination: MACtac maintains a manufacturing base in the United States and
Mexico and develops printing pressure sensitive labels and adhesive films for the printing industry, mainly in North America. It has built a solid position in the U.S. market by developing products using its unique excellent adhesion formula and high-speed coating technology. MACtac also deals with graphic sheets and various kinds of industrial and medical tapes.
The Company is convinced that the full-scale entry in the North American market for printing pressure sensitive labels and adhesive films and the proactive development of its original products using its own technological development capabilities through MACtac will contribute significantly to the acceleration of the global development of Printing and Variable Information Products Operations, the core business of the Group. The Company is also planning to link MACtac’s acquisition to business enhance-ment and expansion in not only the North American market, but also Japan and other regions, by utilizing MACtac’s unique technical capabilities and brand equity and maximizing synergy effect with the Company’s technologies.
3 Effective date of the business combination: December 1, 2016 4 Legal form of the business combination: Acquisition of membership interests 5 Name of the acquired company after the combination: MACtac Americas, LLC 6 Ratio of acquired voting rights: 100% (Ratio of membership interests 100%) 7 Major reasons for the determination of acquiring the company: The determination was made because the Company acquired all of
the membership interests of MACtac through LINTEC USA HOLDING, INC., a wholly owned holding company in the United States, by the acquisition of membership interests in exchange for cash.
(2) Period for which the operating results of the acquired company are included in the consolidated financial statements
From December 1, 2016 to December 31, 2016(3) Acquisition cost of the acquired company and breakdown of consideration
for the acquisition by type
LINTEC ANNUAL REPORT 201776
FINANCIAL SECTION
Consideration for the acquisition Cash: U.S. $306 million (¥34,417 million) Acquisition cost: U.S. $306 million (¥34,417 million)
Note: The yen amounts are conversions based on the exchange rate as of November 31, 2016.
(4) Content and amount of major acquisition-related costs Advisory expenses and others: ¥652 million (U.S. $5,813 thousands)(5) Amount of goodwill arising from the business combination, cause of
the goodwill, and amortization method and period 1 Amount of goodwill arising from the business combination ¥30,889 million (U.S. $275,330 thousands) 2 Cause of the goodwill The goodwill arose due to MACtac’s future additional earnings
power that is expected from future business development. 3 Amortization method and period By straight-line method over 10 years(6) Amounts of assets received and liabilities assumed on the date of
business combination, and their major components
Millions of yen Thousands of
U.S. dollars
2017Current assets ¥ 9,066 $ 80,817Non-current assets 6,820 60,793 Total assets ¥15,887 $141,611
Current liabilities ¥ 4,794 $ 42,738Non-current liabilities 7,564 67,427 Total liabilities ¥12,359 $110,165
(7) Approximate amount of impact on the consolidated statement of income for the fiscal year ended March 31, 2017 assuming that the business combination was completed on the first day of the fiscal year ended March 31, 2017, and the calculation method
Millions of yen Thousands of
U.S. dollars
2017Net sales ¥31,584 $281,526Operating income 525 4,682
(Method of calculating the proforma information)The proforma information is the difference between the amounts of net sales and operating income on the consolidated statement of income calculated assuming that the business combination was completed on the first day of the fiscal year ended March 31, 2017 and the impact of net sales and operating income on the consolidated statement of income. In addition, amortization is calculated by assuming the goodwill and other intangible assets recognized upon the business combination were recognized on the first day of the fiscal year ended March 31, 2017. This note is not subject to independent audit.
3. Business combination by acquisition(1) Outline of business combination 1 Name of the acquired company Name of the acquired company: Lintec Graphic Films Limited
(“LGF”) Business description: Process and sales of adhesive products 2 Major reasons for the business combination: LGF engages in the processing and sales of the Company’s adhesive
products, such as label materials for printing, graphic materials, and window films for the UK and other European regions.
LGF executed a license agreement with the Company on its trademarks in October 2010 and facilitated close collaborations when the Company
participated in LABELEXPO EUROPE 2015 on a large scale, the world’s biggest label-related exhibition held in Belgium in September 2015. Thanks to these efforts, LGF is positioned as the most important partner to promote the Company’s brand strategy in Europe.
Following the acquisition of LGF, the Company will further accelerate the cultivation of new customers by sharing and utilizing LGF’s marketing capabilities and the broad distribution networks on a group-wide basis. It will also release its original products with high-level functionality to the European market ahead of others, making the most of the Company’s notable technical development capabilities. By doing so, the Group seeks to further promote the global develop-ment of its printing and industrial materials products business.
3 Effective date of the business combination: November 30, 2016 4 Legal form of the business combination: Acquisition of shares 5 Name of the acquired company after the combination: Lintec Graphic Films Limited 6 Ratio of acquired voting rights: 100% 7 Major reasons for the determination of acquiring the company: The determination was made because the Company acquired all of
the voting rights of LGF through LINTEC EUROPE B.V., a wholly owned European subsidiary, by the acquisition of shares in exchange for cash.
(2) Period for which the operating results of the acquired company are included in the consolidated financial statements
From December 1, 2016 to December 31, 2016(3) Acquisition cost of the acquired company and breakdown of consideration
for the acquisition by type Consideration for the acquisition Cash: U.S. $9,136 thousands (¥1,024 million) Acquisition cost: U.S. $9,136 thousands (¥1,024 million)(4) Content and amount of major acquisition-related costs Advisory expenses and others: ¥66 million (U.S. $595 thousands)(5) Amount of goodwill arising from the business combination, cause of
the goodwill, and amortization method and period 1 Amount of goodwill arising from the business combination ¥733 million (U.S. $6,539 thousands) 2 Cause of the goodwill The goodwill arose due to LGF’s future additional earnings power
that is expected from future business development. 3 Amortization method and period By straight-line method over 5 years(6) Amounts of assets received and liabilities assumed on the date of
business combination, and their major components
Millions of yen Thousands of
U.S. dollars
2017Current assets ¥378 $3,375Non-current assets 144 1,286 Total assets ¥523 $4,662
Current liabilities ¥171 $1,531Non-current liabilities 59 534 Total liabilities ¥231 $2,065
77LINTEC ANNUAL REPORT 2017
FINANCIAL SECTION

21. Asset Retirement ObligationsThere is no asset retirement obligation as of March 31, 2017 and 2016.
22. Rental PropertyNo specific disclosure for rental property has been made as of March 31, 2017 and 2016 because of its immateriality.
23. Segment Information1. Overview of reportable segments (1) Decision procedures for reportable segments The business segments of our group are subject to periodic review, because each of them provides its own financial information separately from other business units of our group and the board of directors not only makes a decision on allocation of management resources, but also evaluates the performance of them. Our group consists of 6 business segments, each of which develops comprehensive strategies and conducts business activities in overseas and domestic markets. Based on product manufacturing methods and similarity of the markets where the products are introduced, we aggregate these business segments into 3 distinguishable units, such as “Printing and Industrial Materials Products,” “Electronic and Optical Products,” and “Paper and Converted Products,” to include in this report.(2) Products and services handled in each segment Products and services handled in each segment were as follows:
Reportable segments Main products and services
Printing and Industrial Materials Products
Adhesive products for seals and labels, Label materials for barcode, Barcode printers, Labeling machines, Automobile-use adhesive products, Industrial-use adhesive tapes, Window films, Films for outdoor signs and advertising, Interior finishing mounting sheets
Electronic and Optical Products Semiconductor-related adhesive tapes, Semiconductor-related equipment, Multilayer ceramic capacitor-related tapes, LCDs-related adhesive products
Paper and Converted Products Color papers for envelopes, Colored construction papers, Special function papers, High-grade printing papers, High-grade papers for paper products, Release papers for general-use, Release films for optical-related products, Casting papers for synthetic leather, Casting papers for carbon fiber composite materials
2. Method of calculating sales and income (loss), assets, and other items by reportable segment reported The reported information regarding business segments is processed mostly following the accounting procedures listed in “Significant Accounting Policies” used as basis for preparing consolidated financial statements. The profits of the segments reported are based on operating income. The values for internal sales and transfers conducted between segments are given based on the market price for transactions between consolidated companies, and on the first cost for transactions within the same company. As stated in Note 1 (t), “Changes in accounting principles,” the depreciation method of property, plant and equipment has been changed from this consolidated fiscal year. Due to the change, the segment income of this consolidated fiscal year increases by ¥738 million (U.S.$6,578 thousand) in Printing and Industrial Materials Products, ¥1,026 million (U.S.$9,148 thousand) in Electronic and Optical Products, and ¥635 million (U.S.$5,663 thousand) in Paper and Converted Products respectively compared with that using the conventional method.
LINTEC ANNUAL REPORT 201778
FINANCIAL SECTION

3. Information on sales and income (loss), assets, and other items by reportable segment for the years ended March 31, 2017 and 2016 are outlined as follows: Millions of yen
2017Printing and
Industrial MaterialsProducts
Electronic andOptical
Products
Paper andConverted
Products Total Adjustments Consolidation
Net salesNet sales to external customers ¥85,661 ¥83,205 ¥37,108 ¥205,975 ¥ — ¥205,975Intra-segment sales and transfers 60 73 15,523 15,657 (15,657) — Total ¥85,721 ¥83,278 ¥52,632 ¥221,633 ¥(15,657) ¥205,975Segment income ¥ 1,672 ¥ 9,155 ¥ 5,767 ¥ 16,595 ¥ (0) ¥ 16,595OthersDepreciation and amortization ¥ 2,706 ¥ 2,748 ¥ 2,011 ¥ 7,466 ¥ — ¥ 7,466Amortization of goodwill ¥ 315 ¥ — ¥ — ¥ 315 ¥ — ¥ 315
Thousands of U.S. dollars
2017Printing and
Industrial MaterialsProducts
Electronic andOptical
Products
Paper andConverted
Products Total Adjustments Consolidation
Net salesNet sales to external customers $763,540 $741,645 $330,767 $1,835,953 $ — $1,835,953Intra-segment sales and transfers 536 656 138,368 139,562 (139,562) — Total $764,077 $742,302 $469,136 $1,975,515 $(139,562) $1,835,953Segment income $ 14,911 $ 81,603 $ 51,405 $ 147,919 $ (0) $ 147,919OthersDepreciation and amortization $ 24,124 $ 24,498 $ 17,930 $ 66,553 $ — $ 66,553Amortization of goodwill $ 2,809 $ — $ — $ 2,809 $ — $ 2,809
Notes: i. Segment income adjustments show elimination of the amount of intra-segment transactions. ii. Segment income is adjusted to be reported as operating income in the consolidated statement of income. iii. The amounts to be written off as depreciation and amortization of goodwill are allocated among the business segment on the basis of reasonable criteria. iv. Since companies, offices, and factories serve as the base for administrative classification of segment’s assets, no allocation to the business segment is done.
Millions of yen
2016Printing and
Industrial MaterialsProducts
Electronic andOptical
Products
Paper andConverted
Products Total Adjustments Consolidation
Net salesNet sales to external customers ¥87,638 ¥85,422 ¥37,440 ¥210,501 ¥ — ¥210,501Intra-segment sales and transfers 461 473 17,135 18,070 (18,070) — Total ¥88,100 ¥85,895 ¥54,576 ¥228,572 ¥(18,070) ¥210,501Segment income ¥ 2,785 ¥10,562 ¥ 4,303 ¥ 17,651 ¥ 40 ¥ 17,692OthersDepreciation and amortization ¥ 2,974 ¥ 3,068 ¥ 2,757 ¥ 8,800 ¥ — ¥ 8,800Amortization of goodwill ¥ 71 ¥ — ¥ — ¥ 71 ¥ — ¥ 71
Notes: i. Segment income adjustments show elimination of the amount of intra-segment transactions. ii. Segment income is adjusted to be reported as operating income in the consolidated statement of income. iii. The amounts to be written off as depreciation and amortization of goodwill are allocated among the business segment on the basis of reasonable criteria. iv. Since companies, offices, and factories serve as the base for administrative classification of segment’s assets, no allocation to the business segment is done.
79LINTEC ANNUAL REPORT 2017
FINANCIAL SECTION

Related Information1. Information by product and serviceSince the Company and its consolidated subsidiaries disclose the same information in its segment information section, it has been omitted.
2. Information by geographical segmentMillions of yen Thousands of U.S. dollars
2017Japan Asia Others Total Japan Asia Others Total
Sales ¥128,203 ¥65,142 ¥12,629 ¥205,975 $1,142,736 $580,646 $112,570 $1,835,953
Note: Sales information is based on location of customers and it is classified by country or region.
Millions of yen Thousands of U.S. dollars
2017
Japan AsiaNorth
AmericaEurope Total Japan Asia
North America
Europe Total
Property, plant and equipment ¥54,155 ¥11,119 ¥8,403 ¥193 ¥73,871 $482,713 $99,112 $74,901 $1,720 $658,447
Millions of yen
2016Japan Asia Others Total
Sales ¥128,239 ¥70,301 ¥11,960 ¥210,501
Note: Sales information is based on location of customers and it is classified by country or region.
Millions of yen
2016
Japan AsiaNorth
America Europe Total
Property, plant and equipment ¥50,303 ¥12,914 ¥1,597 ¥43 ¥64,859
(Changes in presentation)Property, plant and equipment of “North America,” which was included in “Others” in the previous consolidated fiscal year, is separately presented in this consolidated fiscal year due to its increased quantitative materiality. To reflect this change in presentation, ¥1,641 million presented as “Others” in the consolidated balance sheet of the previous fiscal year has been reclassified into ¥1,597 million of “North America” and ¥43 million of “Europe.”
3. Information by principal customers
Millions of yen Thousands of
U.S. dollars
2017Name of the customer Related reportable segment SalesSumitomo Chemical Company, Limited Electronic and Optical Products ¥22,210 $197,975
Since there are no outside customers that make up more than 10% of net sales on the consolidated statement of income for the year ended March 31, 2016, it has been omitted.
LINTEC ANNUAL REPORT 201780
FINANCIAL SECTION

Information on impairment losses on noncurrent assets by reportable segmentMillions of yen
2017Printing and
Industrial MaterialsProducts
Electronic andOptical
Products
Paper andConverted
Products Total Consolidation
Impairment loss ¥— ¥— ¥— ¥— ¥34
Thousands of U.S. dollars
2017Printing and
Industrial MaterialsProducts
Electronic andOptical
Products
Paper andConverted
Products Total Consolidation
Impairment loss $— $— $— $— $304
Note: Since companies, offices, and factories serve as the base for administrative classification of segment’s assets, no allocation to the segment of the enterprise is done.
There is no impairment loss on noncurrent assets for the year ended March 31, 2016.
Information related to the amount of amortization of goodwill and the unamortized amount of goodwill by reportable segmentMillions of yen
2017Printing and
Industrial MaterialsProducts
Electronic andOptical
Products
Paper andConverted
Products Total Consolidation
Unamortized amount of goodwill ¥— ¥— ¥— ¥— ¥34,558
Thousands of U.S. dollars
2017Printing and
Industrial MaterialsProducts
Electronic andOptical
Products
Paper andConverted
Products Total Consolidation
Unamortized amount of goodwill $— $— $— $— $308,039
Notes: i. Since the Company and its consolidated subsidiaries disclose the same information of the amount of amortization of goodwill in the reportable segment information section, it has been omitted. ii. Since companies, offices, and factories serve as the base for administrative classification of segment’s assets, no allocation to the segment of the enterprise is done.
Millions of yen
2016Printing and
Industrial MaterialsProducts
Electronic andOptical
Products
Paper andConverted
Products Total Consolidation
Unamortized amount of goodwill ¥— ¥— ¥— ¥— ¥22
Notes: i. Since the Company and its consolidated subsidiaries disclose the same information of the amount of amortization of goodwill in the reportable segment information section, it has been omitted. ii. Since companies, offices, and factories serve as the base for administrative classification of segment’s assets, no allocation to the segment of the enterprise is done.
Information on profit arising from negative goodwill by reportable segmentThere is no profit arising from negative goodwill for the years ended March 31, 2017 and 2016.
81LINTEC ANNUAL REPORT 2017
FINANCIAL SECTION

24. Related Party TransactionsThe Company and its consolidated subsidiaries have transactions with NP Trading Co., Ltd., a subsidiary of Nippon Paper Industries Co., Ltd. The transactions between the companies for the years ended March 31, 2017 and 2016 were as follows:
Millions of yen
Thousands of U.S. dollars
For the year 2017 2016 2017Sales of fine & specialty paper products and converted products ¥11,422 ¥11,578 $101,809Purchase of stencil, chemicals and equipment 4,665 5,053 41,584
Millions of yen
Thousands of U.S. dollars
At year-end 2017 2016 2017Trade notes and accounts receivable ¥3,941 ¥4,085 $35,132Trade notes and accounts payable 1,835 1,979 16,360Other liabilities 3 33 27
These related party transactions are carried out on an arm’s-length basis similar to third party transactions.
25. Amounts Per ShareThe amounts per share of net assets and net income as of and for the years ended March 31, 2017 and 2016 were as follows:
Yen U.S. dollars
2017 2016 2017Net assets ¥2,465.43 ¥2,370.49 $21.98Net income (basic) 158.69 151.07 1.41Net income (diluted) 158.46 150.86 1.41
The bases for calculation were as follows:(1) Basic and diluted net income per share
Millions of yenThousands of U.S. dollars
2017 2016 2017Net income (basic) per share: Profit attributable to owners of parent ¥11,450 ¥10,899 $102,060 Amount not attributable to common shareholders — — — Profit attributable to owners of parent attributable to common shares ¥11,450 ¥10,899 $102,060 Weighted-average number of common shares issued during the year (thousand) 72,152 72,144 72,152Net income (diluted) per share: Adjustment of profit attributable to owners of parent related to dilutive securities ¥ — ¥ — $ — Adjustment of dilutive securities (thousand) 106 102 106 [Share subscription rights (thousand)] [106] [102] [106]
(2) Net assets per share
Millions of yenThousands of U.S. dollars
2017 2016 2017Total net assets ¥178,690 ¥172,101 $1,592,752Amount deducted from total net assets 806 1,064 7,185 [Share subscription rights] [186] [169] [1,665] [Non-controlling interests] [619] [895] [5,520]Net assets attributable to common shares ¥177,884 ¥171,037 $1,585,566Number of shares of common stock outstanding used in calculation of net assets per share (thousand) 72,151 72,152 72,151
LINTEC ANNUAL REPORT 201782
FINANCIAL SECTION

26. Short-Term loans payable, Long-Term loans payable and Other Interest-Bearing DebtsShort-term bank loans are represented generally by 30-day or 90-day notes issued by the Company and its consolidated subsidiaries to banks at annual interest rates from 0.51% to 2.05% at March 31, 2017 and from 0.27% to 0.66% at March 31, 2016. Short-term and long-term loans payable as of March 31, 2017 and 2016 consisted of the following:
Millions of yen
Thousands of U.S. dollars
2017 2016 2017Short-term loans payable ¥ 641 ¥1,695 $ 5,720Current portion of long-term loans payable 3,051 — 27,202Long-term loans payable 17,795 — 158,616
¥21,488 ¥1,695 $191,539
Other interest-bearing debts as of March 31, 2017 and 2016 consisted of the following:
Millions of yen Thousands of
U.S. dollars
2017 2016 2017Short-term lease obligation ¥201 ¥196 $1,799Long-term lease obligation 277 349 2,469
Planned repayment amounts after the balance sheet date (March 31, 2017) for long-term loans payable and lease obligation are as follows:Millions of yen Thousands of U.S. dollars
2017Over 1 year
within 2 yearsOver 2 years
within 3 yearsOver 3 years
within 4 yearsOver 4 years
within 5 yearsOver 1 year
within 2 yearsOver 2 years
within 3 yearsOver 3 years
within 4 yearsOver 4 years
within 5 years
Long-term loans payable ¥3,058 ¥3,058 ¥9,321 ¥1,234 $27,263 $27,263 $83,089 $11,000Lease obligation 157 87 20 8 1,403 780 185 75
27. Subsequent Event1. The following distribution of retained earnings was approved at a meeting of the board of directors held on May 8, 2017.
Millions of yen Thousands of
U.S. dollars
2017Cash dividends (¥33 per share) ¥2,381 $21,222
2. About rationalization of management at a consolidated subsidiary in the United StatesAt a meeting of the board of directors held on June 22, 2017, the Company resolved to undertake a fundamental management rationalization to improve the profitability of MADICO, INC. (“Madico”), its wholly owned consolidated subsidiary in the United States.
(1) Reasons to rationalize management Madico maintains manufacturing bases in Massachusetts and Florida, the United States and produces and distributes functional specialty films such
as window films and PV backsheets. However, Madico is facing in a difficulty to secure profits due to a decline in orders and a rapid fall in prices along with the rapid commoditization of
PV backsheets that had led the performance of the business, and a significant operating losses has been recorded since 2012. Despite the continuous work on rationalizing management until now, Madico has not achieved a great and expected effect and it is difficult to
recover from the current situation of recording operating losses. Consequently, the decision to undertake a fundamental management rationalization has been made including the withdrawal from PV backsheets business.(2) Overview of rationalization of management 1 Withdrawal from PV backsheets business Madico will completely withdraw from this business that they manufacture and sell at the Massachusetts base. 2 Restructuring of production system Madico will integrate our production bases in the base of Florida, and will convert the Massachusetts base as a research and development center
for new product development. 3 Employee reduction Madico will reduce headcounts, mainly from employees at the Massachusetts base.(3) Impact on the business results The Company is currently examining the impact of mentioned above on its business results.
83LINTEC ANNUAL REPORT 2017
FINANCIAL SECTION

Basic Framework of Internal Control over Financial Reporting
Hiroyuki Nishio, Representative Director, President, CEO and COO of LINTEC Corporation, and Hitoshi Asai, Director, Vice President Executive Officer &
Chief Financial Officer of LINTEC Corporation, are responsible for designing and operating adequate internal control over financial reporting for
consolidated financial statements of LINTEC Corporation and consolidated subsidiaries (the “Company”) in accordance with the basic framework set
forth in “Standards and Practice Standards for Management Assessment and Audit concerning Internal Control Over Financial Reporting” issued by
Business Accounting Council.
Internal control achieves its objectives to a reasonable extent given that all individual components of internal control are integrated and function
as a whole. Internal control over financial reporting for consolidated financial statements may not completely prevent or detect misstatements in
financial reporting.
Scope of Assessment, Assessment Date and Assessment Procedure
We assessed the effectiveness of the Company’s internal control over financial reporting for the accompanying consolidated financial statements as of
March 31, 2017 in accordance with the standards for assessment of internal control over financial reporting generally accepted in Japan. For this
assessment, we first evaluated the company-level controls which would have a material impact on the reliability of overall financial reporting on a
consolidated basis. We then selected the process-level controls to be assessed based on the results of the company-level control assessment. For the
process-level control assessment, we evaluated the effectiveness of internal control by analyzing processes in scope, identifying key controls that would
have a material impact on the reliability of the financial reporting, and assessing the design and operation of such key controls.
We determined the scope of assessment by selecting consolidated subsidiaries based on their materiality of impact on the reliability of financial
reporting. We determined their materiality of impact by considering both quantitative and qualitative aspects. The scope of our process-level control
assessment was determined based on the results of our assessment of company-level controls, which included its 16 consolidated subsidiaries. We
excluded 19 consolidated subsidiaries from the scope of the company-level control assessment since their quantitative and qualitative impacts were
deemed insignificant.
For the purpose of determining the scope of process-level controls assessment, we selected 2 consolidated subsidiaries as “Significant Business
Locations,” which contributed approximately two thirds of the Company’s net sales on a consolidated basis for the fiscal year ended March 31, 2016.
For the Significant Business Locations, we primarily included business processes related to sales, accounts receivable, and inventory in the scope of
assessment as the aforementioned accounts were closely associated with the Company’s business objectives. In addition, we included certain business
processes in the scope of assessment not only from “Significant Business Locations” but also from all subsidiaries and affiliates, which were related to
significant accounts involving estimates and management’s judgment or include high-risk operations and/or transactions, as “business processes with a
material impact on financial reporting.”
We did not include the evaluation of internal control over financial reporting of MACtac Americas, LLC and its consolidated subsidiaries (“MACtac”)
which became our wholly-owned subsidiaries on December 1, 2016 by the acquisition of membership interests in exchange for cash, in its assessment
of and conclusion on the effectiveness of our internal control over financial reporting as of March 31, 2017. Because we judged that the acquisition of
membership interests was performed in the second half of this fiscal year and constituted an unavoidable circumstance under which the sufficient
assessment procedures for a certain part of the internal control over financial reporting could not be performed.
Assessment Result
Based on the results of our assessment mentioned scope in above, we concluded that the Company’s internal control over financial reporting for the
accompanying consolidated financial statements as of March 31, 2017 was effective although we could not perform the sufficient assessment procedures
for a certain part of the internal control over financial reporting in an unavoidable circumstance because the acquisition of membership interests of
MACtac, which became our wholly-owned subsidiaries on December 1, 2016, was performed in the second half of this fiscal year.
Management’s Report on Internal Control
over Financial Reporting
LINTEC ANNUAL REPORT 201784
FINANCIAL SECTION

Report of Independent Auditors
85LINTEC ANNUAL REPORT 2017
FINANCIAL SECTION

LINTEC ANNUAL REPORT 201786
FINANCIAL SECTION
Head Office23-23, Honcho, Itabashi-ku, Tokyo 173-0001, JapanPhone: +81-3-5248-7711 Fax: +81-3-5248-7760URL: http://www.lintec-global.com/
EstablishedOctober 15, 1934
Fiscal Year-EndMarch 31
Net Assets¥178,690 million
Common StockAuthorized: 300,000,000 shares Issued: 76,564,240 shares
Stock ListingTokyo Stock Exchange, 1st SectionSecurities Code: 7966
Shareholder Register Agent for Common StockMitsubishi UFJ Trust and Banking Corporation1-4-5, Marunouchi, Chiyoda-ku,Tokyo 100-8212, Japan
Number of Employees4,760 (Consolidated)2,539 (Parent company only)
Major Shareholders
Nippon Paper Industries Co., Ltd. 30.12%
Japan Trustee Services Bank, Ltd. (Trust Account) 5.15%
The Master Trust Bank of Japan, Ltd. (Trust Account) 3.56%
National Mutual Insurance Federation of Agricultural Cooperatives 3.18%
Tamie Shoji 2.49%
Major Subsidiaries * Consolidated Subsidiary
DomesticLINTEC COMMERCE, INC.* LINTEC SIGN SYSTEM, INC.*FUJI-LIGHT, INC.*LINTEC SERVICES, INC.LINTEC CUSTOMER SERVICE, INC.PRINTEC, INC.TOKYO LINTEC KAKO, INC.
OverseasLINTEC USA HOLDING, INC.*LINTEC OF AMERICA, INC.*MACTAC AMERICAS, LLC*MADICO, INC.*VDI, LLC*MACTAC MEXICO, S.A. DE C.V.*MACTAC CANADA ULC*LINTEC EUROPE B.V.*LINTEC GRAPHIC FILMS LIMITED*LINTEC ADVANCED TECHNOLOGIES (EUROPE) GMBH*LINTEC (SUZHOU) TECH CORPORATION*LINTEC ADVANCED TECHNOLOGIES (SHANGHAI), INC.*LINTEC SPECIALITY FILMS (TAIWAN), INC.*LINTEC HI-TECH (TAIWAN), INC.*LINTEC ADVANCED TECHNOLOGIES (TAIWAN), INC.*LINTEC KOREA, INC.*LINTEC SPECIALITY FILMS (KOREA), INC.*LINTEC ADVANCED TECHNOLOGIES (KOREA), INC.*LINTEC ASIA PACIFIC REGIONAL HEADQUARTERS PRIVATE LIMITED*LINTEC SINGAPORE PRIVATE LIMITED*PT. LINTEC INDONESIA*PT. LINTEC JAKARTA*LINTEC (THAILAND) CO., LTD.*LINTEC BKK PTE LIMITED*LINTEC INDUSTRIES (MALAYSIA) SDN. BHD.*LINTEC INDUSTRIES (SARAWAK) SDN. BHD.*LINTEC KUALA LUMPUR SDN. BHD.*LINTEC ADVANCED TECHNOLOGIES (MALAYSIA) SDN. BHD.*LINTEC VIETNAM CO., LTD.*LINTEC HANOI VIETNAM CO., LTD.*LINTEC ADVANCED TECHNOLOGIES (PHILIPPINES), INC.*LINTEC PHILIPPINES (PEZA), INC.*LINTEC INDIA PRIVATE LIMITED*
Ownership and Distribution of Shares Share Price / Trading Volume
Apr. 2014 Apr. 2015 Apr. 2016
3,500
3,000
10
8
6
4
2
0
2,500
2,000
0
1,500
¥
Share Price
Million sharesTrading Volume
Apr. 2014 Apr. 2015 Apr. 2016
3,500
3,000
10
8
6
4
2
0
2,500
2,000
1,000
1,500
¥
Share Price
Million sharesTrading Volume
Financial Institutions ............................. 20.78%
Securities Companies .............................. 1.00%
Other Companies ................................... 33.34%
Overseas Companies ............................. 22.52%
Individuals and Other ............................. 16.60%
Treasury Stock ......................................... 5.76%
Investor InformationAs of March 31, 2017
87LINTEC ANNUAL REPORT 2017
FINANCIAL SECTION

Printed on LINTEC high-grade printing paper and fancy paper
LINTEC Corporation23-23, Honcho, Itabashi-ku,Tokyo 173-0001, Japanwww.lintec-global.com/
Printed in Japan


![Bond behavior in NSM-strengthened masonry · 2019. 1. 14. · 20 NSM-strengthened concrete elements, see e.g. [8–15], little attention has been given to 21 strengthened masonry](https://img.pdfslide.net/doc/110x75/5fecd0ae3c8f5d1e1310a62b/bond-behavior-in-nsm-strengthened-masonry-2019-1-14-20-nsm-strengthened-concrete.jpg)