Embed Size (px)
Citation preview

th
Anniversary
Moving onto
a New Banking Era

Hana Bank was first
established in 1971 as a short-term
finance and investment company.
Despite its relatively short history, Hana
ranks 4th in terms of deposits and
outperforms other bigger and older
banks in profitability and asset
soundness. At the end of 2000, the Bank
had the second lowest precautionary and
below credit ratio and the third-best NPL
ratio in the Korean banking industry.
PROFILE
P r e p a r i n gP r e p a r i n ganother
great leap

The Bank’s core strength stems from its
dominant position at the high end of the
retail banking market. High net-worth
customers contribute more than 35% of
the Bank’s total deposits, which gives the
Bank the highest per capita deposits in
the industry. Adding to these stre n g t h s ,
the Bank has the lowest expenses-to-
assets ratio, making it the most eff i c i e n t
in the Korean banking industry.
For its outstanding productivity and
p rofit performance, the Bank has been
selected as the best bank in Korea by
such leading trade journals as A s i a m o n e y,
E u romoney and Finance Asia.
Having matured into an established
industry member, the Bank now charts a
new course toward its goal: becoming
one of the leading full-service financial
institutions in Korea.
Profit Centers
Financial Section
Subsidiaries
Organization Chart
Board of Directors
Executive Officers
Shareholder Information
Corporate Data
Financial Highlights
Letter to shareholders
Hana’s 30 years
Standing Members of Board
of Directors
Governance Structure
Vision and Strategy
2001 Business Plan
Risk Management
2
4
6
8
9
10
12
13
17
21
88
89
90
91
92
93
CONTENTS
f o r w a r d

FI N A N C I A L HI G H L I G H T S
2 FINANCIAL HIGHLIGHTSHana Bank Annual Report 2000
FI N A N C I A L HI G H L I G H T S
Total AssetsIn trillions of Korean Won
Total DepositsIn trillions of Korean Won
1 9 . 5
‘96
Operating incomeIn billions of Korean Won
6 5 . 15 6 . 9
‘97‘96
+4.61 4 . 5
‘96
+170.71 1 7 . 4
‘96
Total LoansIn trillions of Korean Won
* The definition of total deposits and total loans is different from those in Audit Report (deposits-see page 27, Loans-see page 35)* Trust account is included in total assets, total deposits and total loans
+3.21 0 . 4
‘96
-119.3
Net interest incomeIn billions of Korean Won
4 4 . 5
‘96
Net incomeIn billions of Korean Won
-123.8
2 2 . 7
‘97
4 7 . 1
‘99
2 7 . 8
‘98
5 1 . 2
‘00
+4.2
‘98
1 7 6 . 0
- 6 1 . 6
‘00‘99
8 0 . 9
1 8 . 2
‘97
2 1 . 1
‘98
3 6 . 6
‘99
4 1 . 1
‘00
1 6 2 . 6
‘97
4 1 2 . 2
‘98
5 2 2 . 9
‘99
6 9 3 . 6
‘00
1 4 . 3
‘97
1 3 . 4
‘98
2 3 . 1
‘99
2 6 . 3
‘00
4 3 . 5
‘97
1 1 0 . 8
‘98
1 4 4 . 3
‘99
2 0 . 5
‘00

FINANCIAL HIGHLIGHTS 3Hana Bank Annual Report 2000
‘98.12 ‘99.12 ‘00.12 2001(P)
Large Corp
Re-balancing Portfolio
* The loans in 1998 include loans fromBoram Bank
* see page 27
‘000
5
10
15
20
Funding rateLending rate
NIM
‘96 ‘97 ‘98 ‘99
Cost-income ratio( % )NIS and NIM( % )
1 3 , 0 5 01 2 , 0 7 1 1 1 , 8 8 1 1 1 , 6 9 0
3 9 % 3 6 %
2 5 %
5 2 %
4 6 %
3 9 %
6 0 %
‘98.12 ‘99.12 ‘00.12 2001(P)
SME & Others
5 , 9 6 4 6 , 5 0 2
8 , 4 2 0
1 0 , 9 5 0
‘98.12 ‘99.12 ‘00.12 2001(P)
Retail
2 , 7 4 8
4 , 4 8 9
5 , 9 9 9
7 , 4 2 1
Total Loans*
1 9 %
2 3 %2 5 %
1 3 %
2 . 6 5 % 2 . 1 8 %3 . 3 7 %
2 . 1 6 % 2 . 0 8 %
‘00
80
70
60
50
30‘96 ‘97 ‘98 ‘99
6 6 . 6 0 %
6 0 . 7 7 %
3 5 . 7 0 %4 1 . 0 0 % 4 1 . 1 0 %
2 8 %3 1 %
3 6 %
2 7 %

4 LETTER TO SHAREHOLDERSHana Bank Annual Report 2000
LETTER TO SHAREHOLDERS
My dear shareholders,
In retrospect, the year 2000 was another turbulent period for Korea. The untangling of the Daewoo problem, the
management crisis of some large corporations, soaring oil prices, and an intensive corporate restructuring were
some of the more serious difficulties that tested the nation’s economy as well as the financial industry.
But as before, we have successfully coped with the economic turmoil, and have passed the trials of the economy
to come out stronger and wiser. First of all, asset quality was the area to which we devoted the most of our
resources and energies. To maintain our long-held tradition of having the best asset quality in the industry, we
provisioned W559.7 billion against possible loan loss and wrote off W535.7 billion worth of bad assets, including
trust accounts. As a result, our substandard and below credit ratio of FSC standard improved from 8.58% to 5.60%
over the past year. Due to the reduction of substandard and below credits, net income amounted to only W20.5
billion, despite operating income, excluding irregular income, increased from W728.9 billion in 1999 to W828.2
billion in 2000. We deeply regret to provide our shareholders with a less cash dividend than the year before.
Our business result reflected the harshness of the market environment, but we have made worthy progress in our
strategic areas. We substantially expanded our target customer base of high-net-worth households and
professionals. Low-cost deposits increased in proportion to total deposits as well as in volume. Household and
SME loans also rose markedly. We have invited Allianz Group, a world leader in asset management, as our new
major shareholder, and expanded our capital base with their equity investment. In addition, we have also
expanded our business operations by venturing into bancassurance and investment trust management with our
new major shareholder. In Internet banking, which is fast-emerging as a strategic area of future financial business,
the Bank was named “Best Bank of the Year” by four major dailies. Investment banking was another area where
we excelled: We were also named “the best M&A house in Korea” by E u r o m o n e y .
This year we will keep our management focus on profitability and asset quality.
To improve profitability, we will first upgrade our funding and lending structures. Low-cost funding sources will be
further cultivated to raise relatively cheap funds from the present 20% to 25% in terms of proportion to total Won
deposits. To further disperse risks inherent in lending, large corporate loans outstanding will continually be
redirected to the household and Small & Medium-sized Enterprise (SME) sectors. Such structural upgrading will not
only lead to a bigger net interest margin but also become a cornerstone that heightens the Bank’s corporate value.
In order to enhance asset quality, we believe
the right mind-set is the foundation
for the sound management of financial institutions.
Hana Bank has that mind-set.
Seung-Yu KimChairman & CEO

Second, to better carry out the profitability and asset
plans, we will realign our operation structure to market
needs. As SMEs are growing both in number and in scale,
we plan to establish a wholly-independent business unit
dedicated to serving that growth market. Our Internet
banking services will be further expanded, and our ATMs
located at 200 some convenient stores will be given better
exposure through an intensive promotional campaign.
The use of outside marketing support services, which
have proven effective in marketing loans and credit cards,
will also be broadened.
The third part of our plan for 2001 is to continue our
search for strategic business partners. In addition to
bancassurance and investment trust management, we
plan to venture into other areas in partnership with the
world’s leading institutions. Equity partnership will also
be given consideration. Last year, we introduced an
official electronic authentication card, and this year we
will continue developing products that enable
corporations to conduct financial transactions online in a
real-time environment.
Fourth, we will focus on developing human resources to
improve customer service. Encouraged by the
performance of Private Bankers and Relationship
Managers, we will continue to support our high net-
worth customers and corporate finance specialists(RM) to
improve their customer relationships. In particular, we
will innovate our training programs for tellers, section
officers and branch managers, those Bank representatives
who are the first to come in contact with customers.
Because they can make lasting imprints on customers
with their job knowledge and work attitude, we will
develop an employee training system that rewards their
outstanding customer performance when assisting
c u s t o m e r s .
In order to enhance asset quality, we believe the right
mind-set is the foundation for the sound management of
financial institutions. Hana Bank has that mind-set. Our
corporate culture of putting bank assets above ourselves
has been more effective than any of the most
sophisticated systems in keeping our asset quality sound.
We will do our utmost to carry on this culture.
Of course, advanced risk management systems can help,
and we will continue to upgrade ours. We have been
encouraged by what the recently-developed Hana
Grading System has demonstrated in terms of managing
credit risk, but it still needs to be improved and fine-
tuned. An upgraded Hana Grading System will play an
integral part of the total risk management system we plan
to complete in the near future. This total system will be
used for risk-weighted performance measuring and
pricing, which will in turn be a basis of a rational and
objective reward system on our agenda. Through this
system and other measures, we will strive to bring down
our NPL ratio from the 5.6% of last year-end to the 2%
level, where most of the world-leading banks stand.
Moreover, with a fully integrated risk management
system, we should be able to raise the level of
transparency in accounting. Following International
Financial Service’s recommendations, we have adopted
international accounting standards in addition to Korean
standards. To list our stocks on major international stock
markets, we are taking the necessary steps to adopt U.S.
accounting standards.
The year 2001 is our 30th anniversary, and our
achievements made during the past 30 years are
monumental in every aspect of finance. We have
consistently posted a net profit performance for 30 years
since our conversion to a bank, we have been No. 1 in
productivity for the past 10 years. Having completed the
restructuring that had lasted over the past few years, we
now are in a better position to compensate our
shareholders for the trust you have had in us. We project
that our net income for 2001 will be around W300 billion,
while ROE will exceed 17%. And I assure you that these
figures are just the beginning of many heartwarming
numbers to come in the near future. I have our patient
shareholders, loyal customers and dedicated staff to
thank for the picture of a brighter tomorrow.
Sincerely yours,
LETTER TO SHAREHOLDERS 5Hana Bank Annual Report 2000
Seung-Yu KimChairman & CEO

Hana Bank has come a long way since its inception back in 1971 as a short-term finance
and investment company. What grew into the best-performing short-term finance
company, however, came to a crossroads in 1990: Facing an increasingly unstable business
environment, the company had to choose one of the two roads available-commercial
banking and merchant banking. The former was chosen and the choice could not have
been more foresighted. All of the Bank’s peers that took the other road failed to overcome
the blow of the 1997 “IMF crisis” and became insolvent.
Having converted into a bank, Hana quickly discarded the shortcomings inherent in
investment finance and kept the strengths, including a fluid corporate culture ideal for
adopting changes in the banking environment. Armed with a progressive philosophy, the
Bank successfully carried out a niche marketing strategy against the bigger and more
established institutions. When the IMF crisis rocked the financial industry to its core, Hana
was one of the few that came out from the crisis more respected.
In 1993 when the Bank was only three years into banking operations, Euromoney crowned
Hana as the best Korean bank of the year. Other leading trade journals, namely Asiamoney
and Finance Asia, followed with their endorsements, which included “Best Domestic Bank
in Korea”, “Best-Managed Company in Korea”, and “Best Domestic M&A House in
Korea”.
During the past 10 years, the Bank has acquired a regional bank and merged with another
commercial bank of similar size and corporate culture. The latter alliance, in particular, has
strengthened the Bank’s high net-worth customer base, an increasingly lucrative and
strategically important niche market.
Hana has grown into a full-fledged commercial bank with a nationwide branch network.
And Hana will continue to grow bigger and stronger at a pace faster than its peers.
A GLANCE AT HANA’S 30 YEARS

HANA’S THIR
KoreaInvestmentFinanceestablished
In response to a government
effort to bring the curb
market into the main
stream, a group of investors
formed Korea’s first
privately-owned finance
brokerage company.
Converted toBank
Having seen the
liberalization of the
financial markets in the
coming, the short-term
finance company prepared
for an eventual conversion
into a bank by building a
nationwide branch
network, and when the
time came, the transition
was as smooth as had
prepared for.
Euromoney picks Korea’s best bankIn recognition of the Bank’s superior
management style, profitability and
growth potential, the respected
financial journal selected the Bank as
“Korea’s best bank”.
No. 1underwriterBy achieving a total
underwriting volume of
W1 trillion, the company
became a top-ranking
underwriter among its
peers and securities firms.
’71 June ’90 December ’91 July ’93 July

6 HANA’S THIRTY YEARSHana Bank Annual Report 2000
RTY YEARS
Hana’s
Listed onLondon StockMarketDespite negative market
conditions at home, the
Bank successfully issued
US$73 million worth of
GDRs at a 6% premium,
confirming its solid
overseas credibility.
Finance Asia honorsHanaImpressed with the Bank’scomprehensive risk and costmanagement systems, theleading Hong Kong-basedtrade journal named Hana“Korea’s best bank”.
Asiamoney followssuitBased on opinions of 250 fundmanagers of 150 investment firmsworldwide, A s i a m o n e y i n c l u d e dthe Bank in its “Korea’s 10 bestmanaged companies” list. Hanawas the only bank to make the list.
’96 November ’97 June ’98 March June October
IFC invests US$150 million
The World Bank’s
International Finance
Corporation emerged as
the major shareholder by
investing US$150 million in
the Bank.
ChungchongHana launchedBy taking over
Chungchong Bank through
P&A, the Bank expanded
its branch network by 67
new branches, most of
which concentrated in a
region where the Bank had
little presence. The
acquired bank soon became
an independent business
u n i t .

thirty years
’99 January ’00 April
Merger withBoram Bank
The merger with a quality
commercial bank with
similarities in target groups
and management style
enabled the Bank to offer
better customer service, to
expand its customer base of
high net-worth customers
and to lay a firm foundation
for growing into a full-sized
financial institution.
No.1 by customersatisfaction indexThe Bank scored the best in the NationalCustomer Satisfaction Index report. Theindex, developed by Korea ProductivityInstitute in 1999, calibrates thesatisfaction levels of customers withregards to the respective products andservices they actually have used.
Allianz Groupbecomes majorshareholderOne of the world’s top-
three insurance and
financial service groups,
Allianz chose the Bank as a
strategic partner for its
penetration of Korean
markets by taking up a
12.5% stake and establi-
shing business ties for
future joint ventureship.
’98 December
Top customersatisfactionbankKorea Management
Association awarded the
Bank a “Top Customer
Satisfaction Award in
Banking” based on 6,000
consumers’ opinions.
December December
HANA’S THIRTY YEARS 7Hana Bank Annual Report 2000
Euromoney awards HANA as“Best domestic M&A House”Hana providedM&A advisoryservice to clientse x c e e d i n gW420billion in totaltransaction value.

STANDING MEMBERS OF BOARD OF DIRECTORS
Protecting investor interests and
earning their trust in management transparency and efficiency
K. Joe SongDeputy President & CIO
Jong-Yeol KimDeputy Presidentin charge of Retail Banking Group &Credit Card Business Group
Jin-Suk ChunDeputy Presidentin charge of Chungchong Hana Bank
Seung-Yu KimChairman & CEO
Young-Ki KimStanding Memberof Audit Committee
Kyo-Joong YoonSenior Deputy President & COO

GOVERNANCE STRUCTURE 9Hana Bank Annual Report 2000
Hana Bank’s corporate governance structure was set up with a view toward protecting investor interests and
earning their trust in management transparency and corporate efficiency. For higher transparency in bank
management, the majority of the Board of Directors comprises non-standing members with distinguished business
or academic backgrounds.
The Bank prides itself on a corporate governance structure that meets the international standards and on its
commitment to build an unassailable reputation as a trustworthy institution. Hana Bank’s management is
future-oriented, with proper composition and operation of various decision-making bodies, based on the
spirit of creative entrepreneurship.
The Steering Committee consists of seven board members and is responsible for continually rationalizing the Bank’s
corporate governance structure, planning for the Board of Directors and its Committees, and appraising the
operation of the Board of Directors. It is also in charge of recommending and screening candidates for the Board of
Directors (except CEO & Audit Committee members).
This committee is in charge of coming up with ways to heighten managerial performance. It also evaluates the
performance and decides compensation for the Bank President and standing directors. Other duties also include
improving the methods used for measuring managerial performance. It consists of four non-standing board members.
This committee is responsible for the Bank’s overall risk management strategy, overseeing the control of general
risks and setting limits for market risk, credit risk, operation risk, and other types of risk inherent of the banking
industry. It is also in charge of implementing and revising internal regulations pertaining to risk management and
reviewing the status of the Bank’s risk management activities. It consists of three standing board members and four
non-standing board members.
Launched in 2000 as a way to strengthen the function of auditors and to meet global standards, this committee is in
charge of supervising management activities and evaluating internal control systems. It also monitors the
performance of the outside auditor. It consists of three members of Board of Directors and two of three committee
members are non-standing directors.
GOVERNANCE STRUCTURE
Management Development & Compensation Committee
Risk Committee
Audit Committee
Its international-standard corporate governance structure and on its commitment to
build an unassailable reputation as a trustworthy institution
Board of Directors Steering Committee

Retail /Corporatebanking
Enlargeddistribution
H i g hP e r f o r m i n g
Leading B a n k
W o r l d -c l a s s
U n i v e r s a lB a n k
FIRST BANKMERGER
-P&A with Chungchong Bank-M&A with Boram Bank
-Investment Banking-Asset Management-Private Banking-Bancassurance -Brokerage
-Join the ranks of theworld’s 100-best banks
STRATEGIC ALLIANCEJOINT VENTURE TAKE-OFF
Long-Term Strategic Direction
1998 PRESENT 2003
VISION AND STRATEGY
The Bank’s vision is to become a world-class universal bank that consistently delivers maximum
shareholders value and offers a complete selection of high-quality financial services.
Having set a clear vision, the Bank has been making steady progress toward its vision over the
years. To expand its market position and distribution channels in retail and corporate banking, the
Bank acquired a regional bank in 1998 and merged with a commercial bank with a solid position in
the high net-worth individual segment. In addition, to further expand its services and products
range, the Bank launched a bancassurance business in cooperation with Allianz AG in February,
2000, and established an investment trust management company in joint ventureship with the
world’s second largest insurance group in the second half of the year.
The basic strategy for reaching its vision involves strengthening its core areas, which will continue
to be retail, corporate, and investment banking.
10 VISION AND STRATEGYHana Bank Annual Report 2000
Vision
Strategy
Becoming a world-class universal bank that consistently delivers maximum
shareholders value and offers a complete selection of high-qualityfinancial services
Chong-Suk ChoiSenior Executive Vice President & CFOGroup Head of Strategic PlanningGroup

JV JV IB Group of
Hana Bank
C o r p o r a t eB a n k i n g
Division ofH N S E
Hana Securities
JV
Credit Card Group of HanaB a n k
JV
Hana Finance Group
Commercial Banking : >>> Retail banking To better develop its VIP-rich customer base, the Bank
employees a Personal Banker system to cross-sell various products to customers in the middle and higher income
brackets. The Bank also raises low-cost funds by serving the mass market through low-cost distribution channels .
>>> Corporate banking The Bank has been reducing its exposure to the large corporate sector. Instead, it is
increasing the range of services, including offering more loans to medium-sized businesses through its Relationship
Manager system.
Investment Banking : The Bank plans to bolster its underwriting, brokerage, project financing
and M&A advisory operations by finding a strategic partner of world-class level for its securities
s u b s i d i a r y .
Underwriting & Brokerage : The Bank offers underwriting and brokerage services in
cooperation with its securities trading arm, Hana Securities. To strengthen its sales capacity and
improve risk management, the trading subsidiary plans to pursue either business ties with global leaders in
securities trading or adoption of advanced operation systems. The existing Internet trading services will continue to
be upgraded and marketed. Moreover, by sharing customer databases and coordinating marketing strategies, the
two institutions plan to expand cross-marketing programs to retail and corporate customers.
Asset Management : Asset management is one of the areas the Bank has recently ventured into by forming
Hana Allianz Investment Trust Management Corporation with Allianz Group, its major shareholder. The Bank and
the world’s leading insurance corporation plan to nurture the first product of their strategic partnership into Korea’s
leading asset management company.
Bancassurance : Bancassurance is another latest addition to the Bank’s operations. Launched together with
Allianz, the Bank’s bancassurance business is scheduled to grow into a joint venture company.
Credit Card : Credit card business holds a great future for the Bank’s vision of a world-class financial group.
To better keep up with market demand, the Bank has recently upgraded its credit card business to a fully-
independent unit. To further take advantage of its growth potential, the Bank plans to find the right partner from
o v e r s e a s .
IT : To improve operation efficiency and cut costs, the Bank plans to establish a subsidiary that will provide IT
support to all Hana Financial Group members.
CRC / CRV : By establishing a subsidiary specializing in bad asset management, the Bank plans to improve
upon its soundness and to prepare to venture into the asset management area.
VISION AND STRATEGY 11Hana Bank Annual Report 2000
CommercialBanking
InvestmentBanking
UnderwritingBrokerage
AssetManagement
Banca-ssurance Credit Card IT CRC/CRV
Corporate Retail Hana-Allianz Asset Management
JV with Allianz

12 2001 BUSINESS PLANHana Bank Annual Report 2000
2001 BUSINESS PLAN
For 2001, the Bank has set specific targets in three areas: profitability, soundness and capital. In regard to
profitability ROE of 17.63%, ROA and NIM are targeted at 0.73% and 2.49%, respectively. The soundness target
is a substandard and below credit ratio of 1.64%. The capital-related targets are, EPS of W2,093, BPS of W12,519,
and BIS capital adequacy ratio of 10.91%.
1. Restructure operations>>>
Improve funding and lending structures
Funding: Expand low-cost funding sources
Lending: Reduce exposure to large corporations and increase exposure to the SME and household sectors
Re-organization: Gear operation structure to customer needs and income source development
Re-capitalization
2. Bolster management by operation>>>
Retail banking: Systemize and automate the operating base
Corporate banking: Improve the asset quality of credit exposure portfolio, fine-tune pricing to better reflect risk,
and develop new business products
Investment banking: Expand operation to increase fee-based income
Credit card: Step up marketing and increase fee-based services
e-commerce: Expand the online infrastructure and upgrade services to attract more customers away from
teller services, thereby cutting costs while increasing low-cost deposits.
3. Separate and integrate>>>
S e p a r a t i o n
Separate each operation division into an autonomous business unit as a way to instill accountability in management
and modify each unit to customer needs.
Develop a rational performance measurement and compensation system as way to maintain employee quality.
I n t e g r a t i o n
Integrate IT, risk management, performance measurement and database systems to bring efficiencies to operation
and to improve employees’ customer skills.
Performance Target Strategies
EnhancingShareholders
Value
Performance TargetTargets related to PerformanceTargets related to Stock priceTransparency US GAAPAsset Quality
Investor RelationsCorporate ValuationRedefine Standard of PublicationAccept GS in Performance indexJust in time of Offering Information
M e r g e rData BaseI TRisk Management SystemPerformance Measure
Business Plan and Strategy for FY 2001
R e s t r u c t u r i n gR e - C a p i t a l i z a t i o nR e - O r g a n i z a t i o nImproving Funding and LendingS t r u c t u r e
Business Unit ManagementR e t a i lS y s t e m a t i z a t i o nA u t o m a t i o nC o r p o r a t eLoan Portfolio Large corpS M EPricing based on RiskP r e m i u mNew Business Product Investment BankingCredit CardE - C o m m e r c e
S e p a r a t i o nOperation DivisionResponsibility ManagementPerformance Measure & Compensations y s t e mManagerial Accounting System

As illustrated in the diagram below, the Bank’s risk management governance structure comprises four
bodies: Risk Committee, Risk Management Committee, Risk Management Group, and the Middle Offices.
The Risk Committee, the highest risk-related decision-making body, sets limits on how much risk the
Bank can take in each business. Comprising the Bank President, two deputy presidents and four non-
standing board directors, this committee also sets and revise basic risk management policies and
guidelines, decides the amount of risk-weighted capital to be allocated to each unit and reviews the
Bank’s risk exposure and management status.
RISK MANAGEMENT 13Hana Bank Annual Report 2000
RISK MANAGEMENT
Risk management governance
Risk Committee
Risk Management Committee
RISK MANAGEMENT SYSTEM
O r g a n i z a t i on
CREDIT CONTROL TEAM
ALM TEAM
FRONT OFFICE
MIDDLE OFFICE
BACK OFFICE
Risk MgntGroup
Risk MgntC o m m i t t e e
R i s kC o m m i t t e e
Business Unit
Dal-Yong LeeSenior Executive VicePresident & CRO
Jeong-Ho Suh, Ph.DExecutive Vice President &Group Head of RiskManagement Group
The Risk Management Committee monitors whether the business units are adhering to risk limits and checks the
Bank’s exposure to each risk on a monthly basis. Consisting of seven heads of business divisions, this committee
convenes at least once a month and ensures that each business division’s operations meet the risk guidelines set by
the Risk Committee.
The Risk Management Group manages all risk-related activities and issues arising from the banking operations. The group
consists of two teams: ALM and Credit Control Teams. The former is in charge of market risk and liquidity risk, while the
latter handles credit risk. Together, the two teams monitor the Bank’s risk status, measure risk, keep track of the Bank’s assets
exposed to risk, and forecast the movement of risk variables. The teams also interact with the Middle Office of each business
unit on all risk-related activities pertaining to the unit. In addition, the teams report the Bank’s risk exposure and risk
management status--including the Middle Offices’ activities--to the two committee and to the management.
The Bank is in the process of establishing a total risk management system that identifies, measures, monitors and
evaluates all risks inherent in the banking operations. For the initial stage, the Bank, in consultation with IBM and
LKFS, has drawn up plans to upgrade the local and foreign currency front systems and the ALM system and defined
the requisites for establishing a risk management system for each type of risk. Also completed is a data mart modeling
for compiling and processing risk data at the main server. The next stage will involve forming a project team with the
skills defined as necessary in the initial stage and establishing the integrated risk management system. Once completed
in a year or so, the system is expected to create efficiency in the way the Bank manages its assets and to increase
shareholders’ value.
Risk Management Group
RMS Project

Because credit risk is such an important issue in banking business, the Bank makes an all-out effort to contain it
within an acceptable limit.
During 2000, the Bank paid a particular attention to the asset quality of its credit portfolio. The Bank made a
concerted effort to reduce its precautionary and below credit exposure, including the adoption of a “Watch List”
system. The Bank also wrote off and sold a substantial portion of its non-performing credit exposures. “Credit
exposure” is defined as loans and securities in bank and trust accounts.
Such efforts paid off, and the asset quality of the Bank’s credit exposure portfolio has markedly improved over the
past year. As the chart below shows, precautionary and below credit exposures decreased by 33.8%, while total
credit exposure increased by 15.8%.
In addition to its credit exposures portfolio, the Bank’s normal credit exposure portfolio has improved in quality over
the year. As a result of the Bank’s conservative credit exposure management, credit exposures of Grade 1 to Grade 4, or
low-risk credit exposures, increased by 36.4%, while high-risk credit exposures, Grade 8, dropped by 17.4%.
The improvement in asset quality also accompanied a readjusting of the by-industry credit exposure portfolio that has
lead to a reduction in the Bank’s credit exposures to high-risk industries. In response to the weakening economy, the
Bank reduced its exposures to construction and wholesale which carry higher risk in times of economic slowdown. As
of 2000-end, the Bank’s credit exposures in these areas accounted for 9.3% of total credit exposures, a substantial drop
from 13.6% of the previous year.
The Bank also continued its efforts to dilute the unhealthy concentration of credit exposure in the large corporate sector
which carries relatively higher risk. In particular, by constantly readjusting credit limits of large corporate borrowers to
their latest ratings, the Bank reduced its credit exposure to the sector by 6% points. Its credit exposure to the SME and
household sectors, on the other hand, has increased substantially. To further reduce its large corporate exposure, the
Bank will adopt more stringent credit exposure review standards and update corporate credit ratings on a quarterly
b a s i s .
14 RISK MANAGEMENTHana Bank Annual Report 2000
Asset quality improved
With efforts on reducing precautionary and below credit exposures, the bank’s year-end asset soundness
was one of the best in the industry
CREDIT RISK MANAGEMENT
Credit exposure classificationIn Billions of Korean Won
‘00
4 9 7 , 0 8 2
‘99
4 2 9 , 3 7 0
1999 2 0 0 0N o r m a l 3 8 4 , 5 4 5 4 6 7 , 3 9 3
P r e c a u t i o n a r y 2 0 , 2 1 7 1 1 , 2 2 7S u b s t a n d a r d 1 7 , 7 3 5 1 2 , 5 8 4
D o u b t f u l 4 , 7 1 6 5 , 0 1 0Est. loss 2 , 1 5 7 8 6 8
Normal Credit exposure portfolioIn Billions of Korean Won
‘00
4 0 4 , 3 1 2
‘99
3 3 9 , 9 3 2
G r a d e 1999 2 0 0 01 ~ 4 1 5 4 , 5 0 1 2 1 0 , 7 9 15 ~ 6 7 4 , 6 7 1 8 7 , 1 5 6
7+ ~ 7 8 5 , 8 4 6 8 5 , 7 9 48+ 2 4 , 9 1 4 2 0 , 5 7 1
Credit exposure portfolio by sizeIn Billions of Korean Won
‘00
4 9 7 , 0 8 2
‘99
4 2 9 , 3 7 0
1999 2 0 0 0Large Corp. 2 6 9 , 6 4 5 2 8 2 , 8 5 3
SME 6 7 , 2 6 1 8 7 , 6 7 2P u b l i c 4 6 , 6 6 3 6 2 , 5 5 4
H o u s e h o l d 4 5 , 8 0 1 6 4 , 0 1 3

RISK MANAGEMENT 15Hana Bank Annual Report 2000
International-standard corporate credit risk evaluation system adopted
The Bank uses a Hana Credit Grading System, an international-standard corporate credit risk evaluation system and
the banking industry’s first of its kind. The system was developed in cooperation with International Financial
Corporation, one of the Bank’s major shareholders. Currently, there are 100 credit evaluators thoroughly trained on the
use of the sophisticated system. These credit evaluation specialists also function as Relationship Managers. The results
produced from the Hana Credit Grading System serve as important information and data for the Bank’s making of
decisions ranging from innovating credit-related work processes to improving the management decision process.
Credit risk review strengthened
The Bank regularly assesses the credit risk of the top 60 business groups and adds any high-risk groups to the watch list
for constant monitoring. When assessing credit risk, the Bank applies forward-looking criteria. Corporate borrowers with
loans of W10 billion or higher are constantly monitored for any signs that could negatively affect their credit ratings.
Five times a year, each branch also conducts a loan review that involves fine-tuning the loan limits, rating, and
credit risk of its small-amount borrowers. Branch personnel in charge of loan review are regularly educated and
trained on the importance of sound credit management. Seminar is held twice a year on the prevention of loan
default, covering the latest in the cause of loan default and how to deal with it.
Credit decision-making process digitalized
For the first time in the Korean banking industry, the Bank has digitalized its entire credit decision-making process
from loan application to credit evaluation to loan approval. This digitalization is a result of the Bank’s years-long
effort to build a computer database of corporate credit ratings, credit evaluation results and other related data. The
automation of the lending process has introduced efficiencies into the Bank’s credit business, and it has also greatly
improved customer relationships.
The Bank will continue to use every possible means to reduce problem-credit exposures and to fortify credit exposure
management. By keeping close taps on its outstanding credit exposure by borrower, business type, and product, asset
concentration will be prevented and credit risk will be spread out. By running its credit risk management system
through various scenarios of different market conditions, the Bank will further hone its ability to allocate assets and
capital in an efficient manner under any circumstances. In addition, through education and training, a team of
qualified credit risk managers will be fostered. A new credit risk manager course will be created, more seminars on
industry development will be held, and manuals of how to evaluate credit risk by industry will be made available.
A Hana Credit Grading System is an international-standard corporate credit risk
evaluation system and the banking industry’s first of its kind
Measures to be taken in 2001
Credit management strengthened

To maximize net interest income while maintaining interest rate risk at an acceptable level, the Bank actively
manages the matching of its assets and liabilities. It minimizes risk arising from interest rate fluctuations by
analyzing interest rate sensitivity gaps of assets and liabilities on a monthly basis and maintaining the ratio of assets
to liabilities on an accumulative basis at 90% to 160%.(see page 34) The Risk Committee sets the ratio limits and the
ALM team reports monthly to the Risk Management Committee about the ratio.
Price risk facing Korean banks has increased in degree and in kind over the past few years. In the name of market
liberalization, the government continues to expand the limit within which market variables can fluctuate in price.
The futures market has been thriving since its opening two years ago. To effectively manage price risk arising from
the fluctuation of stock prices and exchange rates, and other market variables, the Bank uses a VaR (value-at-risk)
methodology in its management of all investments related to market risk, such as securities, derivatives, etc.
To measure price risk, the Bank uses the value-at-risk (“VaR”) methodology, which captures the potential loss from
adverse market movements. This methodology in turn is based on a Delta-Normal method applied 10-day-hold
period and confidence level of 99%. To supplement its VaR measurement, the Bank also uses a stress test based on
the standard model of Derivatives Policy Group reflected extreme shock.(see page 34)
Each year the Risk Committee allocates a certain portion of the Bank’s net worth against price risk, and, for each
quarter, sets exposure and loss limits by product using a risk-weighted performance index. The Risk Management
Group reports daily, weekly, monthly and quarterly to the Risk Committee and the Risk Management Committee
about the Bank’s exposure to price risk and any price risk-related developments.
Liquidity risk is expected loss from the possibility of the Bank’s inability to meet its liability obligations. The loss of
investment opportunities due to liquidity problem is considered to be a part of liquidity risk. The Bank sets liquidity
limits on all its assets, liabilities and derivatives trading, and it maintains liquidity based on the calculation of liquidity
gaps between assets and liabilities of the same maturity. In the case of assets and liabilities with three-month-or-less-
maturity, the ratio of assets to liabilities is to be maintained above 100%, which is well within the limit recommended
by the Financial Supervision Service (FSS).(see page 34)
As of end of 2000, the Bank’s local currency liquidity ratio was at 122% according to the FSS’s guidelines. To maintain
short-term foreign currency liquidity, the Bank has set the limits for the mismatch ratios of assets and liabilities maturing
in seven days and one month to total foreign currency assets at FSS-recommended over 0% and over -10% relatively. As
of the year-end, these two ratios were 19.5% and 23.5%, testaments to the Bank’s sound foreign liquidity position.
On a monthly basis, the Risk Management Committee checks the Bank’s exposure to liquidity risk based on a liquidity
gap ratio and cash flow reported by the ALM team and the Middle Offices. The committee also readjusts the funding
and asset management policies so as to keep the exposure within the limits set by the Risk Committee.
16 RISK MANAGEMENTHana Bank Annual Report 2000
Interest rate risk management
Price risk management
Liquidity risk management
MARKET RISK MANAGEMENT

PROFIT CENTERS 17Hana Bank Annual Report 2000
The credit card business group is one of the Bank’s fastest growing profit centers. As of the end of 2000, the group
posted W1,250 billion in billings, which represents a 103% jump from the year before. The Hana Bank card
membership hovered at 690,000 and merchants accepting the Bank’s cards numbered 54,000. The group issues and
markets credit cards under the name, Hana, affiliated with Visa, Master, or JCB Card.
In developing innovative products, the group stays a step ahead of customer needs. The Hana Save Card is popular
for its three-month-no-interest payment feature. The Hana Eve Card was developed with features addressing
woman needs. And the Hana Save & Joy Card offers a special discount at selected merchants. Also available from
the card selection is an affinity card that offers mileage and other related benefits together with Korean Airlines. In
2001, the group plans to expand the profit base by developing Visa-affiliated revolving and business cards. In
particular, the group intends to focus on gold and platinum cards for high-income and high net-worth customers.
In 2000, the Bank began a realignment of its organization to better focus on profitability and customers. This new
organization is designed to allow each division to better develop its primary strengths, more closely tie results to
rewards, better perform risk management, and improve strategic capability with the continuously changing
competitive environment. The new organization consists of eight profit centers: retail banking, credit card, corporate
banking, investment banking, treasury, Chungchong Hana, trust business, and e-commerce business groups.
PROFIT CENTERS
Retail banking group
Credit card business group
Focusing more on profitability and customers allows each division to better
develop its primary strengths, more closely tie results to strategiccapability with the continuously changing competitive environment
The Retail Banking Group is one of the three pillars buttressing the Bank’s push toward world-class banking. The
group contributes to the growth of the Bank’s profit base by improving upon its dominance of the high end of the
retail market and expanding its position in the middle market. To further develop its core customer base, the
group runs 49 branches and 16 private banking centers where 77 Private Bankers cater toward high net-
worth customers. Thoroughly trained in diverse aspects of banking, the group’s Private Bankers provide
VIP customers with comprehensive asset management service including financial planning, sale of mutual
funds, advice on tax and real estate expertise.
In 2001, the group will focus on increasing household loans and low-cost deposits. To increase household loans,
the sales organization will be bolstered, the loan broker system expanded, marketing of collateral-linked project
financing stepped up toward housing constructors, and sale of real estate investment trusts strengthened. The
group plans to expand household loans from the current 20% to 25% in proportion to total loans by the year-
end. To attract more low-cost deposits, the securities trading deposit account will be marketed, use of internet
banking including virtual accounts aggressively promoted and ATMs made more available.
Jung-Tae Kim Senior Executive Vice President & Group Head of Retail Banking Group

The Corporate Banking Group has recently been reorganized to better respond to market changes and
to compete more effectively with its peers. The new group now consists of large corporate business
and SME business divisions and has expanded the Relationship Manager (RM) system for its SME
business and global banking operations. The group’s 21 teams of Relationship Managers are groomed
into corporate banking specialists through rigorous training programs including courses on analyzing
the current value and future redemption abilities of corporations.
The group has been reducing its large corporate loan portfolio for the past few years, and
plans to further cut the ratio of total corporate loans from 46% to 39% by this year-end. To
supplement the income base, the group is focusing on its fee-based businesses, including
asset-backed securitization, underwriting, CLO, and derivatives trading, to name a few. As
a part of its customer service, the group regularly provides 7,500 clients with the up-to-date
information on interest rates, exchange rates and taxes. To expand its customer base of small
proprietorships, the group plans to develop a scoring system to streamline its lending
process. A user interface system combining corporate transaction settlement and other value-
added services ideal for corporate customers is also planned. As corporate customers use the
system to conduct their business transactions, the group can monitor all transactions and
make loans for their settlement and purchases. Moreover, such customers will be more
inclined to transfer funds, including employee salaries, through the Bank.
Regarded as the pioneer in investment banking in Korea, Hana Bank’s Investment Banking Group, with its
prominent professionals and broad networks, continues to provide the highest quality financing and advisory
services to the satisfaction of both domestic and international clients. The Group is composed of the Investment
Banking Team and Venture Investment Team. The Investment Banking Team provides financial advisory
services relating to Mergers & Acquisitions, Corporate Restructuring, Project Finance, Privatizations and
Private Equity Investment. The Venture Investment Team makes equity investment in, and provides related
advisory services to venture companies that are in the initial stage of establishment or in the pre-IPO stage.
Some of the highlights made in 2000 attest to the leadership position of the group. The group provided M&A
advisory services to both buy- and sell-side clients with a total transaction value exceeding W420 billion. The
group also syndicated a total of W1.1 trillion through non- and limited-resource project financing. In
recognition of the group’s stellar investment banking performance, the Bank was named “Best Domestic M&A
House” by Euromoney, and ranked “No. 6 in project financing in Asia” and selected as “Runner-up for Best
LBO Deal” for Project Mercury by The Asset.
18 PROFIT CENTERSHana Bank Annual Report 2000
Corporate banking group
Hee-Won ShimExecutive Vice President & Regional GroupHead of Regional SME Banking Division II
Hee-Dae KimExecutive Vice President & Group Head of Large CorporatePromotion Group
Hoon-Kyu KimSenior Executive Vice President& Group Head of Corporate Banking Group
Woong-il (Francis) Lee Senior Executive Vice President &Group Head of Investment Banking Group
Investment banking group

PROFIT CENTERS 19Hana Bank Annual Report 2000
The Bank Account Treasury Group is in charge of overseeing the Bank’s liquidity, profitability and asset
soundness. To maintain sound asset quality in the face of the volatile financial market, the group focused on
reducing the Bank’s high-risk asset portfolio and made encouraging progress. As of the end of 2000, the
Bank’s securities portfolio comprised government bonds and other high-quality investment instruments.
As a result, the group’s performance in improving the Bank’s asset quality exceeded the industry average.
In 2001, the group will continue its focus on the asset quality of the Bank. The risk management systems
will be constantly updated with the latest in software and hardware. In line with the Bank’s effort to
improve the caliber of its asset managers, the group plans to bolster the managerial accounting system
to better measure the performance of each manager. Because the foreign currency market is known for its
volatility, the Foreign Currency Money Market Team will join the group and closely cooperate with the
group’s Domestic Currency Money Market Team. The two teams cooperating to shield the Bank from the
wild fluctuation of currencies will make the group’s other operations more efficient.
Treasury group
Since the P&A of Chungchong Bank in 1998, the Chungchong Group has represented the Chungchong
region including the Taejon metropolitan area in spirit and in substance. Thanks to its biggest presence in
the region, the group has enjoyed an averaged growth rate in deposits of over 50%. Such an impressive
growth can be attributed to its active community involvement. It has contributed to a local credit guarantee
cooperative and an SME support center, both of which pursue the growth of the region’s SME industry. In
addition, as the treasury of Taejon City, the group teamed with the municipal government to set up a
digital infrastructure to cut costs for the city’s civil service operations to make them more efficient.
In 2001, the group aims to increase its net profit by 42% by raising total deposits by 46% and total loans by
59%. To increase household deposits, the group plans to target high income professionals and families.
One-on-one marketing will be employed, while the Private Banker system will be further expanded
through the branch network. The group will step up its effort to develop housing financing products that
meet local customer needs and launch an intensive marketing campaign. Increasing joint projects with
local civic bodies and business organizations will further strengthen the group’s ties with them. By
analyzing the SWOT of its peers, the group will fortify its position in some of the less-established areas.
Chungchong Hana Bank
In line with the Bank’s effort to improve the caliber of its asset managers,
the group plans to bolster the managerial accounting system to better measure
the performance of each manager
Sung-Ho ChoiSenior Executive Vice President & GroupHead of Chungchong Hanabank.
Jin-Sung Kim Group Head of Treasury Group

20 PROFIT CENTERSHana Bank Annual Report 2000
Trust business group
e-commerce business group
The Trust Business Group was the de facto leader in the domestic trust account business in 2000. The
group either maintained the Bank’s leadership position or improved its standing in a number of areas--
setting new industry records in the process. In total, the Bank had the largest position in 6 trust account
markets, including specified money trust. For the first time in bank trust business, the group arranged
and provided a trustee service to an asset-backed commercial paper issue and sold a will trust account.
The Trust Business Group comprises a trust fund team and a trust management team. The former
operates traditional investment vehicles, such as stocks and bonds, as well as real estate and asset-
backed securities. The latter ensures the transparent and efficient operation of trust investments. The
group’s strength lies in the close relationships it has established with high net-worth customers through
the Bank’s Private Banker system. High on its agenda for 2001 is reshuffling the components of its trust
account portfolio with specified money trusts.
The Bank’s basic strategy in e-business is called “e-transformation”, which centers on strengthening customer
relationships and creating additional value by transforming the current branch-based financial process into an
information dealing process using digital channels. To bolster its e-business, the Bank has put more human and
monetary resources on it through internal and external recruits for young pioneers. For corporate customers, the group
offers cash management services, corporate banking system, virtual account services, and corporate credit cards. The
group also offers individual PFM, as well as retail banking services. As icing on the cake, at the end of last year, the
Bank’s home site, hanabank.com received 4 Hit Web Site awards from major Korean newspaper companies for its
convenience and qualified services .
In line with the Bank’s strategy to increase SME loans, the e-Commerce Business Group developed a
corporate purchasing fund loan and marketed it in cooperation with related business groups. As of
the year-end, the Bank had the biggest share in this growth market. To expand its position in the
online settlement market, the group is establishing a foothold in the digital identification card market
created for government contractors.The group will accomplish this by linking its e-cash business
with the purchase cards, buyer credit, receivable notes-backed loans and other similar products of
other groups. An official settlement bank enjoys various benefits, including a steady flow of funds
and new income opportunities. In cooperation with other financial institutions, the group is
preparing demographic-based Web marketing and one-to-one personalized marketing programs for
the planned introduction of the fully integrated one-stop financial service.
Sung-Yoon Song Senior Executive Vice President & Group Head of Banking Support Group
In-Sung Kang Group Head of Information and Technology Group
Michael Jeung Sae Lee Group Head of Trust Business Group

FINANCIAL Section
MANAGEMENT DISCUSSION & ANALYSIS
REPORT OF INDEPENDENT ACCOUNTANTS (Banking Accounts)
NON-CONSOLIDATED BALANCE SHEETS (Banking Accounts)
NON-CONSOLIDATED STATEMENTS OF INCOME (Banking Accounts)
N ON-CONSOLIDATED STATEMENTS OF APPROPRIATIONS OF RETAINED
EARNINGS (Banking Accounts)
NON-CONSOLIDATED STATEMENTS OF CASH FLOWS (Banking Accounts)
NON-CONSOLIDATED NOTES TO FINANCIAL STATEMENTS
(Banking Accounts)
REPORT OF INDEPENDENT ACCOUNTANTS (Trust Accounts)
BALANCE SHEET OF TRUST ACCOUNTS
STATEMENT OF OPERATIONS OF TRUST ACCOUNTS
NOTES TO FINANCIAL STATEMENTS OF TRUST ACCOUNTS
REPORT OF INDEPENDENT ACCOUNTANTS (C o n s o l i d a t e d)
CONSOLIDATED BALANCE SHEETS
CONSOLIDATED STATEMENTS OF INCOME
CONSOLIDATED STATEMENTS OF CHANGES IN EQUITY
CONSOLIDATED STATEMENTS OF CASH FLOWS
CONSOLIDATED NOTES TO FINANCIAL STATEMENTS
22
37
38
39
40
41
42
67
68
69
70
73
74
75
76
78
79

Management Discussion and Analysisyears ended December 31
22 MANAGEMENT DISCUSSION AND ANALYSISHana Bank Annual Report 2000
Key Financial Data (note 1)
Operating Results (In billions of Korean Won)Operating Income(loss) - 6 1 . 6 8 1 . 0 1 7 6 . 0
Net interest income 6 9 3 . 6 5 2 2 . 9 4 1 2 . 2Interest income 2 , 9 5 4 . 8 2 , 2 7 6 . 6 1 , 8 0 1 . 7Interest expenses 2 , 2 6 1 . 2 1 , 7 5 3 . 7 1 , 3 8 9 . 5
Net of non-interest income 1 0 7 . 0 2 5 2 . 8 5 9 . 4Net of commission income 1 1 5 . 2 8 0 . 4 8 1 . 7Net of other operating income - 8 . 2 1 7 2 . 4 - 2 2 . 3
General and administrative expenses - 3 4 0 . 6 - 2 9 9 . 0 - 1 6 7 . 8Provision for credit losses (include provision for Guarantees and Acceptances) - 5 2 1 . 6 - 3 9 5 . 7 - 1 2 7 . 8
Net of non-operating income 7 8 . 9 1 3 1 . 2 - 4 6 . 2Ordinary income 1 7 . 3 2 1 2 . 2 1 2 9 . 8Net of extraordinary income 1 5 . 8 0 . 0 0 . 0Income before income taxes 3 3 . 1 2 1 2 . 2 1 2 9 . 8Income tax expense 1 2 . 6 6 7 . 9 1 9 . 0Net income 2 0 . 5 1 4 4 . 3 1 1 0 . 8
Per Share Data ( w o n )Earnings per common share 1 2 4 1 , 3 5 3 1 , 7 9 0
(Fully diluted) 1 3 0 7 2 6 1 , 5 0 5(Diluted-exclude preferred share held by KDIC) 1 5 6 1 , 2 5 2 1 , 5 0 5
Dividends per common share 2 0 0 4 0 0 4 0 0Book value per common share 1 1 , 4 4 2 1 1 , 7 3 5 1 2 , 3 4 6
(Fully diluted) 9 , 2 2 0 8 , 6 3 8 1 1 , 2 1 6(Diluted-exclude preferred share held by KDIC) 1 1 , 3 1 2 1 1 , 4 9 3 1 1 , 2 1 6
Profitability ratios ( % )Return on assets 0 . 0 6 0 . 5 5 0 . 8 2
(FSC standard)(note 2) 0 . 0 5 0 . 4 7 0 . 6 9Return on average common equity 1 . 0 6 1 0 . 5 8 1 1 . 3 5
(FSC standard )(note 3) 1 . 1 6 8 . 2 7 1 1 . 3 5Net interest margin 2 . 0 8 2 . 1 6 3 . 3 7
(FSC standard)(see table 3) 2 . 0 7 2 . 1 6 3 . 3 4G & D expenses to operating income ratio (see table 14) 4 2 . 5 3 8 . 5 3 5 . 6
Balance sheet data (In billions of Korea Won) L o a n s 2 5 , 6 0 8 . 6 1 7 , 9 7 0 . 3 7 , 7 0 0 . 2S e c u r i t i e s 1 1 , 9 1 8 . 5 9 , 7 0 8 . 2 5 , 6 3 5 . 9Total assets 4 1 , 7 7 4 . 1 3 2 , 3 7 8 . 5 1 6 , 7 1 1 . 7D e p o s i t s 2 8 , 7 5 3 . 3 2 3 , 0 1 9 . 7 1 0 , 8 3 8 . 3B o r r o w i n g s 2 , 6 6 3 . 9 2 , 8 0 4 . 7 1 , 4 6 8 . 3D e b e n t u r e s 1 , 7 7 1 . 1 9 2 0 . 4 5 8 6 . 9Total liabilities 4 0 , 0 1 5 . 7 3 0 , 6 1 2 . 9 1 5 , 8 4 8 . 4Common stock 6 2 1 . 8 5 5 0 . 8 3 4 9 . 6Preferred stock 3 3 5 . 4 4 7 2 . 8 0 . 0Total shareholders’ equity 1 , 7 5 8 . 4 1 , 7 6 5 . 6 8 6 3 . 3
Asset quality ratios (amount - billion won, ratio - %) - Banking account only (see table 16, 19, 20)Total credit of banking account 2 6 , 6 8 1 . 6 1 8 , 9 4 0 . 3 9 2 , 5 0 2Amount of substandard and below credits 1 , 3 8 4 . 1 1 , 4 1 0 . 6 1 8 6 . 1Allowance for possible loan losses & Reserve for possible losses of G&A 8 6 1 . 2 7 0 5 . 0 2 3 9 . 4Substandard and below ratio 5 . 1 9 7 . 4 5 2 . 0 1Coverage ratio
Reserve for credit losses/Total credits 3 . 2 3 3 . 7 2 2 . 5 9Reserve for credit losses/Substandard and below credits 6 2 . 2 2 4 9 . 9 8 1 2 8 . 6 4
Capital Adequacy ratios (%) (Consolidated Base) - FSC standardTotal capital ratio 1 0 . 4 5 1 2 . 3 3 1 3 . 1 0
Tier I ratio 6 . 5 0 8 . 9 9 7 . 9 0T i e r II ratio 3 . 9 5 3 . 5 4 5 . 2 0
2000 1999 1998
note 1) All financial information set forth below is given on a non-consolidated basis and reshuffled in accordance with the 2000 line item classification. The result of trust business reflected in the banking account on non-interest income is discussed in separate part of MD&A
note 2) Total average asset includes interest and principle guaranteed trustnote 3) Average equity includes preferred equity held by KDIC

Management Discussion and Analysis
MANAGEMENT DISCUSSION AND ANALYSIS 23Hana Bank Annual Report 2000
During the year 2000, the Bank devoted the most of its resources
and energies to improving asset quality. (A total of W559.7 billion
was provisioned against possible credit losses and W535.7 billion
Worth of bad assets was written off, those in including trust
accounts.) As a result, the substandard and below credit ratio
calculated based FSC standard improved from 8.58% to 5.60% over
the past year. The coverage ratio of provisions for credit losses to
substandard and below credites rose from 45.17% to 59.89%. As a
result of these asset quality improvement actions, the Bank's net
income fell by W123.8 billion to W20.5 billion.
In 2001, the Bank plans to increase provisions against possible
credit losses by W320.9 billion, in order to completely erase the
remaining bad assets from the balance sheet: W532.8 billion worth
of assets will be written off, and W500.0 billion sold off, including
bad assets in trust accounts. Once these clean-asset measures have
been carried out, its substandard and below credit ratio will be
1.63%, while provisions against credit losses will account for
82.82% of total substandard and below credit.
Net incomeAs of the end of 2000, net interest income, the backbone of the Bank's
income base, stood at W693.6 billion, up 33% from the year before.
Net of non-interest income dropped W145.7 billion over the year. This
drop stemmed from a W74.2 billion decrease in securities-related
gains(see table 10, 18) due mainly to the sluggish stock market and a
W105.8 billion decrease in income from trust operation(see table
10,17). These decreases overwhelmed a W41.3 billion increase made in
fees and commissions in Banking account operating. (see table 10)
General & administrative expenses swelled 14% to W340.6 billion
as a result of increased assets and branches.(see table 13 and 14)
Net provisions for credit losses also rose W125.9 billion over the
year,(see table 15 and 16) which consequently reduced net income
to W20.5 billion.
Net interest incomeNet interest income rose 32.6% to W693.6 billion. Net interest income
in local currency rose 35.9% to W644.9 billion, while that in foreign
currencies inched up W0.3 billion. The increase of net interest income
reflects a healthy rise in interest income in relation to interest expenses.
Interest income rose W678.2 billion while interest expenses increased
W507.5 billion, resulting in a net interest income of W170.7 billion.
Net interest margin, which had dipped noticeably in the 4th
quarter of 1999 due to the Daewoo crisis, began a steady rise in
2000, as the Bank continually improved its asset and liabilities
portfolios and written off non-performing assets. As a result, net
interest spread calculated by FSC standard rose 0.8% points from
the 1.42% of the 4th quarter in 1999 to 2.22% in the 4th quarter in
2000, which is based on quarterly average balance.(see table 3)
O v e r v i e w
In billions of Korean Won(table 1) Income statement
Operating Income(loss) - 6 1 . 6 8 0 . 9 1 7 6 . 0Net interest income 6 9 3 . 6 5 2 2 . 9 4 1 2 . 2
Interest income 2 , 9 5 4 . 8 2 , 2 7 6 . 6 1 , 8 0 1 . 7interest expenses 2 , 2 6 1 . 2 1 , 7 5 3 . 7 1 , 3 8 9 . 5
Net of non-interest income 1 0 7 . 0 2 5 2 . 8 5 9 . 4Fees and commissions(note1) 1 1 5 . 2 8 0 . 4 8 1 . 7Net of other operating income - 8 . 2 1 7 2 . 4 - 2 2 . 3
General and administrative expenses - 3 4 0 . 6 - 2 9 9 . 0 - 1 6 7 . 8Net of provisions for credit losses - 5 2 1 . 6 - 3 9 5 . 7 - 1 2 7 . 8
Net of non-operating income 7 8 . 9 1 3 1 . 2 - 4 6 . 2Ordinary income 1 7 . 3 2 1 2 . 2 1 2 9 . 8Net of extraordinary income 1 5 . 8 0 . 0 0 . 0Income before income tax 3 3 . 1 2 1 2 . 2 1 2 9 . 8Income tax expense 1 2 . 6 6 7 . 9 1 9 . 0Net income 2 0 . 5 1 4 4 . 3 1 1 0 . 8
2000 1999 1998
note1) Exclude Reserve deposit in Bank of Koreanote2) Include Borrowings, Call money, Bonds sold of repurchase agreements, Bills
sold, Due to BoK in foreign currencies
note1) Consist of Fees and Commissions in banking account operation and Fees ontermination of trust account (see table 10)
(table 2) Net interest incomeIn billions of Korean Won
Interest income 2 , 9 5 4 . 8 2 , 2 7 6 . 6 1 , 8 0 1 . 7Won currency 2 , 6 7 7 , 0 2 , 0 1 4 . 2 1 , 5 7 8 . 0
L o a n s 1 , 6 4 3 . 0 1 , 1 6 8 . 8 1 , 0 5 4 . 8Due from banks(note1) 1 1 4 . 3 1 6 2 . 6 3 8 . 8S e c u r i t i e s 8 9 8 . 8 6 5 3 . 2 4 5 5 . 0O t h e r s 2 0 . 9 2 9 . 6 2 9 . 4
Foreign currency 2 7 7 . 8 2 6 2 . 4 2 2 3 . 7L o a n s 2 0 8 . 0 2 0 1 . 0 1 5 9 . 5Due from banks 3 1 . 0 2 . 3 5 0 . 4S e c u r i t i e s 3 8 . 8 3 9 . 1 1 3 . 8
Interest expenses 2 , 2 6 1 . 2 1 , 7 5 3 . 7 1 , 3 8 9 . 5Won currency 2 , 0 3 2 . 1 1 , 5 3 9 . 7 1 , 2 0 6 . 6
D e p o s i t s 1 , 5 8 3 . 4 1 , 2 2 3 . 7 8 1 3 . 6B o r r o w i n g s ( n o t e 2 ) 3 1 4 . 7 2 0 7 . 7 3 0 8 . 1D e b e n t u r e s 1 1 2 . 0 6 9 . 1 3 4 . 0O t h e r s 2 2 . 0 3 9 . 2 5 0 . 9
Foreign currency 2 2 9 . 1 2 1 4 . 0 1 8 2 . 9D e p o s i t s 3 9 . 2 4 6 . 2 6 1 . 3B o r r o w i n g s 1 5 2 . 3 1 4 4 . 1 9 0 . 7D e b e n t u r e s 3 0 . 2 1 8 . 1 2 3 . 7O t h e r s 7 . 4 5 . 6 7 . 2
Net interest income 6 9 3 . 6 5 2 2 . 9 4 1 2 . 2Won currency 6 4 4 . 9 4 7 4 . 5 3 7 1 . 4Foreign currency 4 8 . 7 4 8 . 4 4 0 . 8
2000 1999 1998

Management Discussion and Analysisyears ended December 31
24 MANAGEMENT DISCUSSION AND ANALYSISHana Bank Annual Report 2000
unit : %
Lending rate 1 1 . 8 5 9 . 2 0 9 . 0 4 8 . 1 4 8 . 7 3 9 . 0 6 8 . 7 6 8 . 9 1Funding rate 8 . 6 2 7 . 8 1 7 . 4 5 7 . 2 0 7 . 2 3 7 . 1 8 7 . 0 9 7 . 0 9Net interest spread 3 . 2 3 1 . 3 9 1 . 5 9 0 . 9 4 1 . 5 0 1 . 8 8 1 . 6 7 1 . 8 2Net interest margin 3 . 2 8 2 . 1 8 2 . 1 1 1 . 4 2 1 . 8 1 2 . 2 2 2 . 0 2 2 . 2 2
* The differences between FSC standard and audit report are as follows.FSC standard treats stock as interest earning asset and dividend as interest revenueFSC standard treats credit card account as an interest earning asset and fees from credit card account as an interest revenueTotal interest earning asset is deducted by provision for credit losses by FSC standard
1Q. '99 2Q. '99 3Q. '99 4Q. '99 1Q. '00 2Q. '00 3Q. '00 4Q. '00
Average Interest-Earning Assets and Lending Rate
unit : In billions of Korean Won
Average bs R a t e ( % ) Average bs R a t e ( % ) Average bs R a t e ( % )
Won currency 3 0 , 0 4 8 . 7 8 . 9 1 2 0 , 9 3 2 . 8 9 . 6 2 9 , 8 3 7 . 6 1 6 . 0 4L o a n s 1 8 , 4 7 8 . 0 8 . 8 9 1 2 , 2 2 3 . 0 9 . 5 6 6 , 2 0 2 . 7 1 7 . 0 1Due from banks(note1) 1 , 3 7 3 . 9 8 . 3 2 2 , 2 5 9 . 7 7 . 1 9 3 3 2 . 5 1 1 . 6 6S e c u r i t i e s 1 0 , 1 9 6 . 8 8 . 8 1 6 , 4 5 0 . 1 1 0 . 1 3 3 , 3 0 2 . 4 1 3 . 7 8
Foreign currency 3 , 2 9 4 . 5 8 . 4 3 3 , 3 0 8 . 3 7 . 9 3 2 , 4 0 7 . 2 9 . 3 0L o a n s 2 , 4 3 6 . 9 8 . 5 4 2 , 4 9 9 . 5 8 . 0 4 1 , 4 6 0 . 9 1 0 . 9 2Due from banks 4 2 6 . 9 7 . 2 7 4 0 6 . 0 5 . 5 0 7 1 6 . 2 7 . 0 4S e c u r i t i e s 4 3 0 . 7 9 . 0 1 4 0 2 . 8 9 . 7 2 2 3 0 . 1 6 . 0 2
Total Interest-Earning Assets 3 3 , 3 4 3 . 2 8 . 8 6 2 4 , 2 4 1 . 1 9 . 3 9 1 2 , 2 4 4 . 8 1 4 . 7 1
2 0 0 0 1 9 9 9 1 9 9 8
Total interest-earning assets rose 37.5% over the year to W33,343.2
billion, averaging a 86.2% growth rate for the past two years.
Interest earning assets in local currency rose W9,115.9 billion to
W30,048.7 billion, while those in foreign currencies decreased
W13.8 billion to W3,294.5 billion. Local currency interest-earning
assets rose sharply, as the Bank benefited handsomely from a
quality flight triggered by the instability of the capital markets.
Foreign currency assets, on the other hand, decreased because the
Bank, mindful of the lessons of the 1997-98 financial crisis, has
continued recalling high-risk overseas investments and maintained
a conservative investment stance.
Average rate of return on interest-earning assets continued to
decline since 1998 due to falling interest rates, but the rate of decline
began to ease beginning in the second half of 1998. In 1997 and 1998,
the government had applied a high interest rate policy to jump start
the then lethargic economy, and, as the economy began to pick up
steam in the latter half of 1998, interest rates were reduced to the
previous level. Having anticipated such interest rate movements, the
Bank reduced due from banks, which carried a relatively low rate of
return, and instead expanded loans and securities. In lending in
particular, the Bank redirected large corporate loans to households
and SME borrowers, thereby dispersing credit risk and improving
rate of return. Average rate of return on foreign currency interest-
earning assets rose 0.5% points over the year, as the Bank's more
stringent lending practices led to a sizable reduction in non-
performing credit in foreign currencies.
These changes in asset management also brought about changes in
assets mix as follows:
unit : %
Won currency 9 0 . 1 2 8 6 . 3 5 8 0 . 3 4L o a n s 5 5 . 4 2 5 0 . 4 2 5 0 . 6 6Due from banks 4 . 1 2 9 . 3 2 2 . 7 2S e c u r i t i e s 3 0 . 5 8 2 6 . 6 1 2 6 . 9 6
Foreign currency 9 . 8 8 1 3 . 6 5 1 9 . 6 6L o a n s 7 . 3 1 1 0 . 3 1 1 1 . 9 3Due from banks 1 . 2 8 1 . 6 8 5 . 8 5S e c u r i t i e s 1 . 2 9 1 . 6 6 1 . 8 8
2000 1999 1998
(table 3) Trend of NIM(FSC standard)
(table 4) Average Interest-Earning Assets and Lending Rate
(table 5) Average Interest-Earning Assets Mix
note1) Exclude Reserve deposit in Bank of Korea
note1) exclude Reserve deposite in Bank of Korea

Management Discussion and Analysis
MANAGEMENT DISCUSSION AND ANALYSIS 25Hana Bank Annual Report 2000
Average Interest-Bearing Liabilities and Funding Rate
In billions of Korean Won
Average bs R a t e ( % ) Average bs R a t e ( % ) Average bs R a t e ( % )
Won currency 2 9 , 4 9 2 . 3 6 . 8 9 2 0 , 1 5 6 . 2 7 . 6 4 9 , 6 0 6 . 5 1 2 . 5 6
D e p o s i t s 2 3 , 4 9 5 . 7 6 . 7 4 1 6 , 3 0 1 . 7 7 . 5 1 6 , 9 3 0 . 4 1 1 . 7 4Borrowings(note 1) 4 , 6 9 3 . 5 6 . 7 0 2 , 9 7 9 . 9 6 . 9 7 2 , 2 1 1 . 2 1 3 . 9 3D e b e n t u r e s 1 , 0 5 2 . 0 1 0 . 6 5 6 4 0 . 3 1 0 . 8 0 2 1 9 . 1 1 5 . 5 2Due from trust account 2 5 1 . 1 8 . 0 0 2 3 4 . 3 1 0 . 1 3 2 4 5 . 8 1 5 . 6 1
Foreign currency 3 , 0 6 2 . 5 7 . 4 8 3 , 2 4 9 . 9 6 . 5 8 2 , 3 6 5 . 0 7 . 7 4
D e p o s i t s 6 7 0 . 8 5 . 8 4 8 4 3 . 9 5 . 4 7 8 7 2 . 4 7 . 0 2Borrowings(note 1) 2 , 0 4 2 . 5 7 . 4 6 2 , 0 9 7 . 5 6 . 8 7 1 , 0 9 2 . 2 8 . 3 0D e b e n t u r e s 3 4 9 . 2 8 . 6 5 3 0 8 . 5 5 . 8 7 4 0 0 . 4 5 . 9 2
Total Interest-Bearing Liabilities 3 2 , 5 5 4 . 8 6 . 9 5 2 3 , 4 0 6 . 1 7 . 4 9 1 1 , 9 7 1 . 5 1 1 . 6 1
2 0 0 0 1 9 9 9 1 9 9 8
Average interest-earning assets in local currency rose 3.77% points in
proportion to the total, against those in foreign currencies. Of local
currency assets, the percentages of loans and securities rose 5.0%
point and 3.97% point, respectively, while that of due from banks
decreased 5.2% point. These changes reflect the Bank's asset
management strategies. After 1997 when credit risk was escalating,
the Bank increased relatively lower-risk investment instruments such
as due from banks and government bonds. As credit risk began to
subside in 2000, however, the Bank switched its asset management
strategy back to profitability and thus expanded securities and loans.
Interest-bearing liabilities rose 39.1% over the year 2000 to
W32,554.8 billion. Local currency interest bearing liabilities rose
46.3%, while foreign currency interest bearing liabilities decreased
5.8%. Interest rates on interest bearing liabilities raised continued
to drop since the IMF crisis of late 1997. The average interest rate
dropped from the 11.61% of 1998 to 7.49% in 1999 and to 6.95% in
2000. Average interest rate on local currency interest bearing
liabilities dropped further from 12.56% to 6.89% over the same
period, thanks to the Bank's efforts to raise low-cost funds.
Debentures, however, carried a relatively high interest rate of 10%,
as they consist of a subordinated debts.
Foreign currency interest-bearing liabilities dropped in
proportion to total interest-bearing liabilities, reflecting the
Bank's conservative Lending practices. Local currency interest-
bearing liabilities, on the other hand, swelled as a result of
quality flight. Noteworthy is that the Bank made significant
progress in raising low-cost deposits which rose from
W2.5trillion of 1st quarter 2000 to W5.7trillion of 4th quarter
2001 in average balance base.(see table 8). This is a result of the
Bank's concerted efforts to strengthen its relatively weak
position in the low-cost savings market. As a result of the W3.2
billion increase, average interest rate on deposits dropped 0.77%
points over the year from 7.51% to 6.74%.
(unit : %)
Won currency 9 0 . 5 9 8 6 . 1 2 8 0 . 2 4D e p o s i t s 7 2 . 1 7 6 9 . 6 5 5 7 . 8 9Borrowings(note 1) 1 4 . 4 2 1 2 . 7 3 1 8 . 4 7Bond issued 3 . 2 3 2 . 7 4 1 . 8 3Due from trust account 0 . 7 7 1 . 0 0 2 . 0 5
Foreign currency 9 . 4 1 1 3 . 8 8 1 9 . 7 6D e p o s i t s 2 . 0 6 3 . 6 1 7 . 2 9Borrowings(note 1) 6 . 2 8 8 . 9 7 9 . 1 3Bond issued 1 . 0 7 1 . 3 2 3 . 3 4
2000 1999 1998
note1) Include Borrowings, Bonds sold of repurchase agreements, Bills sold, Due to BoK in foreign currencies
note1) Include Borrowings, Bonds sold of repurchase agreements, Bills sold, Due toBoK in foreign currencies
(table 6) Average Interest-Bearing Liabilities and Funding Rate
(table 7) Average Interest-Bearing Liabilities Mix

Management Discussion and Analysisyears ended December 31
26 MANAGEMENT DISCUSSION AND ANALYSISHana Bank Annual Report 2000
In billions of Korean Won
Low cost deposits 2 , 4 9 7 . 7 2 , 7 0 2 . 4 3 , 5 2 5 . 5 4 , 5 2 3 . 9 4 , 9 7 0 . 9 5 , 2 2 2 . 4 5 , 5 9 9 . 7 5 , 7 4 1 . 5
Core low cost deposits 1 , 8 2 8 . 8 1 , 3 2 3 . 0 1 , 8 2 9 . 4 2 , 2 8 0 . 1 2 , 6 6 1 . 0 2 , 9 0 2 . 0 2 , 9 5 3 . 0 2 , 9 2 4 . 6
Demand deposits 6 4 7 . 9 6 3 3 . 6 6 6 2 . 7 7 7 2 . 7 7 8 1 . 8 8 1 4 . 1 7 9 3 . 0 8 2 3 . 7Low cost saving deposits 1 , 1 8 0 . 9 6 8 9 . 4 1 , 1 6 6 . 7 1 , 5 0 7 . 4 1 , 8 7 9 . 2 2 , 0 8 7 . 9 2 , 1 6 0 . 0 2 , 1 0 0 . 9
M M D A 6 6 8 . 9 1 , 3 7 9 . 4 1 , 6 9 6 . 1 2 , 2 4 3 . 7 2 , 3 0 9 . 9 2 , 3 2 0 . 4 2 , 6 4 6 . 8 2 , 8 1 6 . 9
Time deposits 8 , 5 0 6 . 5 9 , 2 9 4 . 1 9 , 7 2 0 . 0 1 1 , 9 3 5 . 0 1 3 , 5 8 7 . 6 1 3 , 9 5 3 . 2 1 4 , 7 8 6 . 3 1 5 , 6 5 8 . 2
Installment deposits 1 , 3 1 8 . 9 1 , 3 6 0 . 5 1 , 4 9 8 . 3 1 , 6 1 2 . 9 1 , 6 2 9 . 0 1 , 9 7 8 . 9 2 , 1 1 1 . 2 2 , 2 2 4 . 6
CDs, RPs, Bills Solds 3 , 0 7 0 . 1 2 , 7 0 5 . 7 3 , 1 2 5 . 8 3 , 4 6 2 . 9 3 , 8 4 0 . 7 4 , 3 9 4 . 9 4 , 3 4 1 . 2 4 , 8 5 2 . 2
Deposits in won currency 1 5 , 3 9 3 . 2 1 6 , 0 6 2 . 7 1 7 , 8 6 9 . 6 2 1 , 5 3 4 . 7 2 4 , 0 2 8 . 2 2 5 , 5 4 9 . 4 2 6 , 8 3 8 . 4 2 8 , 4 7 6 . 4
Low cost deposit ratio 1 6 . 2 3 % 1 6 . 8 2 % 1 9 . 7 3 % 2 1 . 0 1 % 2 0 . 6 9 % 2 0 . 4 4 % 2 0 . 8 6 % 2 0 . 1 6 %
Core low cost deposit ratio 1 1 . 8 8 % 8 . 2 4 % 1 0 . 2 4 % 1 0 . 5 9 % 1 1 . 0 7 % 1 1 . 3 6 % 1 1 . 0 0 % 1 0 . 2 7 %
* Deposits in Audit Report do not include RPs and Bills solds but deposit defined by Hana Bank internally include RPs and Bills solds
C l a s s i f i c a t i o n 1Q. ’99 2Q. ’99 3Q. ’99 4Q. ’99 1Q. ’00 2Q. ’00 3Q. ’00 4Q. ’00
Net Interest Margin and Net Interest Spread
In billions of Korean Won
Average bs I n t e r e s t R a t e ( % ) Average bs I n t e r e s t R a t e ( % ) Average bs I n t e r e s t R a t e ( % )
Interest-Earning Assets 3 3 , 3 4 3 . 2 2 , 9 5 4 . 8 8 . 8 6 2 4 , 2 4 1 . 1 2 , 2 7 6 . 6 9 . 3 9 1 2 , 2 4 4 . 8 1 , 8 0 1 . 7 1 4 . 7 1Won currency 3 0 , 0 4 8 . 7 2 , 6 7 7 . 0 8 . 9 1 2 0 , 9 3 2 . 8 2 , 0 1 4 . 2 9 . 6 2 9 , 8 3 7 . 6 1 , 5 7 8 . 0 1 6 . 0 4Foreign currency 3 , 2 9 4 . 5 2 7 7 . 8 8 . 4 3 3 , 3 0 8 . 3 2 6 2 . 4 7 . 9 3 2 , 4 0 7 . 2 2 2 3 . 7 9 . 3 0
Interest bearing liabilities 3 2 , 5 5 4 . 8 2 , 2 6 1 . 2 6 . 9 5 2 3 , 4 0 6 . 1 1 , 7 5 3 . 7 7 . 4 9 1 1 , 9 7 1 . 5 1 , 3 8 9 . 5 1 1 . 6 1Won currency 2 9 , 4 9 2 . 3 2 , 0 3 2 . 1 6 . 8 9 2 0 , 1 5 6 . 2 1 , 5 3 9 . 7 7 . 6 4 9 , 6 0 6 . 5 1 , 2 0 6 . 5 1 2 . 5 6Foreign currency 3 , 0 6 2 . 5 2 2 9 . 1 7 . 4 8 3 , 2 4 9 . 9 2 1 4 . 0 6 . 5 8 2 , 3 6 5 . 0 1 8 3 . 0 7 . 7 4
Net interest Margin 2 . 0 8 2 . 1 6 3 . 3 7Won currency 2 . 1 5 2 . 2 7 3 . 7 8Foreign currency 1 . 4 8 1 . 4 7 1 . 6 9
Net interest Spread 1 . 9 1 1 . 9 0 3 . 1 1Won currency 2 . 0 2 1 . 9 8 3 . 4 8Foreign currency 0 . 9 5 1 . 3 5 1 . 5 6
2 0 0 0 1 9 9 9 1 9 9 8
The high interest rates materialized in the wake of the IMF bailout
began to stabilize after 1998 when the economy started to get back
on a growth track, bringing down both funding costs and rate of
return on interest-earning assets. In keeping with decreasing
interest rates, the Bank made efforts to readjust funding costs to
secure the optimum net interest margin. But such efforts were
foiled by the credit crisis of Daewoo Group which led to a
substantial increase the Bank's non-performing assets portfolio,
consequently shrinking its net interest margin. In response, the
Bank doubled its efforts to expand the household and SME loan
portfolios and to developed low-cost funding sources, and as a
result, the Bank's net interest margin began its steep rise after the
fourth quarter of 1999. FSC-based net interest spread, in particular,
nearly doubled from the 0.94% of 1999 to 1.82% at the end of
2000.(see table 3) By continuing liquidating NPLs, cultivating the
mass customer base, and lending to individual and SME
borrowers, the Bank plans to raise its net interest margin to 2.49%
in 2001.
* Based on Audit Report line item and average balance.(FSC standard-see page 25)
(table 8) The trend of deposit structure
(table 9) The trend of NIM and NIS

Management Discussion and Analysis
MANAGEMENT DISCUSSION AND ANALYSIS 27Hana Bank Annual Report 2000
1. Fees and Commissions : The Bank has been discontinuing
low-yield payment guarantees and acceptances based on its
judgement that they don't justify the risk they entail. As a result,
guarantee fees have continued to fall for the last two years,
dropping by W5.3 billion to W9.0 billion in 2000.
Income from the credit card business, however, jumped 68.09% to
W47.4 billion in 2000, as a result of the Bank's stepped-up
marketing efforts in contrast to its conservative approach the year
before. The credit risk of households, which had soared after the
IMF bailout, substantially eased by the end of 1999. In 2001, the
Bank plans to upgrade its credit card operations to a fully
independent business unit and to continue its aggressive approach
to take advantage of the growing use of the plastic money.
2. Trust income : Income from trust operations reflected the Bank's
shrunk trust volume, registering a W8.6 billion decrease. Losses
from trust operations, however, soared to W133.7 billion due to the
liquidation of development trust whose interest and principal are
guaranteed. As a result, net income from trust operations dropped
from W105.9 billion to W32.8 billion in 2000. As the outstanding
balance of development trusts fell from W3,136.1 billion in 1999 to
W360.2 billion in 2000, it is expected that losses from trust operations
for 2001 will be substantially less than the year 2000.
3. Securities-related income : As of the end of 2000, Losses from
disposition and valuation of trading securities amounted to W27.5
billion, W74.2 billion less than the year before. Although falling
interest rates led to a W11.7 billion gain from bond transaction and
evaluation, the sluggish stock market and debt-equity swap for
companies in work-out combined to generate a W39.2 billion loss.
4. Foreign exchange income : Though the Bank's import/export,
FX, and wire remittance business was on a steady rise in 2000,
stabilizing exchange rates were mainly responsible for reducing the
Bank's foreign exchange income by W11.6 billion to W14.9 billion.
General and administrative expenses rose 13.9% over the year to
W340.6 billion, reflecting the increased assets and rising prices.
Net of Non-Interest Income
In billions of Korean Won
2000 1999 1998
In billions of Korean Won
Credit card number (customers) 6 8 9 , 7 2 2 3 0 4 , 8 7 3 1 4 4 , 0 4 5Affiliation (affiliations) 5 4 , 4 2 8 4 4 , 0 8 6 1 7 , 2 5 2Credit card account 4 4 0 . 4 1 1 8 . 4 7 8 . 0Billing amount 1 , 2 5 9 . 5 6 2 0 . 5 3 4 3 . 0
2000 1999 1998
unit : million dollar
E x p o r t 1 2 , 8 9 5 8 , 0 7 3 3 , 2 6 9I m p o r t 1 1 , 3 1 5 6 , 6 2 2 2 , 3 7 8Exchange / Sending 5 , 2 5 0 5 , 1 5 1 2 , 9 9 8
2000 1999 1998
General and Administrative expenses
In billions of Korean Won
General and Administrative expenses 3 4 0 . 6 2 9 9 . 0 1 6 7 . 8Salaries and Wages 1 3 4 . 9 1 2 6 . 1 5 3 . 7Retirement benefits 1 2 . 1 9 . 7 1 2 . 8Fringe benefits 2 3 . 9 1 7 . 7 2 4 . 2D e p r e c i a t i o n 3 8 . 8 3 2 . 1 1 4 . 7O t h e r s 1 3 0 . 9 1 1 3 . 4 6 2 . 4
2 0 0 0 1 9 9 9 1 9 9 8
In billions of Korean Won
G&A expense to Operating income ratio 4 2 . 5 % 3 8 . 5 % 3 5 . 6 %
General and Administrative expenses 3 4 0 . 6 2 9 9 . 0 1 6 7 . 8Operating income before provisions
and G&A expenses 8 0 0 . 7 7 7 5 . 7 4 7 1 . 6
G&A expense to Operating income ratio 4 1 . 1 % 4 1 . 0 % 3 5 . 7 %
General and Administrative expenses 3 4 0 . 6 2 9 9 . 0 1 6 7 . 8Operating income exclude irregular income* 8 2 8 . 2 7 2 9 . 0 4 7 0 . 5
Fees and Commissions in Banking account operation 1 1 1 . 7 7 0 . 4 5 1 . 0
Guarantee fees 9 . 0 1 4 . 3 1 4 . 2Fees from credit card 4 7 . 4 2 8 . 2 2 2 . 6O t h e r s 5 5 . 3 2 7 . 9 1 4 . 2
Income from trust operation 3 2 . 8 1 3 8 . 7 - 9 . 5Fees from trust operations 1 6 3 . 0 1 7 1 . 6 4 7 . 1Losses from trust operations - 1 3 3 . 7 - 4 2 . 9 - 8 7 . 3Fees on termination of trust account 3 . 5 1 0 . 0 3 0 . 7
Income from disposition and valuation of trading securities - 2 7 . 5 4 6 . 7 1 . 1
Income from disposition and valuation of trading bonds 1 1 . 7 - 7 . 6 - 1 6 . 6
Income from disposition and valuation of trading stocks - 3 9 . 2 5 4 . 3 1 7 . 7
Income from foreign currency trading 1 4 . 9 2 6 . 5 3 4 . 9O t h e r s - 2 4 . 9 - 2 9 . 5 - 1 8 . 1Total net of Non-interest income 1 0 7 . 0 2 5 2 . 8 5 9 . 4
* Irregular income : Income from disposition and valuation of trading securities,G&A expenses and Provisions for credit
(table 10) Trend of Non-Interest Income
(table 11) The result of credit card operation
(table 12) The trend of foreign exchand transaction
(table 13) G & A expenses breakdown
(table 14) G&A expenses to Operating income ratio

Management Discussion and Analysisyears ended December 31
28 MANAGEMENT DISCUSSION AND ANALYSISHana Bank Annual Report 2000
During the year 2000, the Bank wrote off non-performing credit
belonging to Daewoo Group and corporations in work-out
programs, and provisioned against possible credit losses in
accordance with the conservative forward-looking criteria. As a
result, provisions for credit losses increased W125.9 billion over
the year to W521.6 billion.
During the year 2000, the Bank built up enough provisions against
possible credit losses. As of the year-end, the percentage of
precautionary credit against which the Bank provisioned was
7.1%, that of substandard credit was 34.5%, doubtful credit 81.2%
and estimated loss credit 100%. In addition, considering the
amount of collateral in each category, doubtful and below credit is
covered more than enough, with the possibility of some of the
provisions to return to the income side of the ledger. As 61.4% of
substandard credit and 81.2% of precautionary credit are covered
by collateral and provisions combined, the possibility of having to
set additional provisions is very low.(see table 16)
In addition, the Bank plans a W495.8 billion write-off and a W500.0
billion sale of bad assets include bad assets in trust accounts in
2001. Once these have been carried out, the Bank's balance sheet
will have been free of any non-performing assets, its profitability
substantially enhanced and its BIS capital ratio greatly improved.
1. Decrease of losses from trust operation
In billions of Korean Won
In billions of Korean Won
Classification of credits 8 6 0 . 0 9 4 5 . 2 3 9 2 . 1 4 6 . 8 1 3 8 4 . 1Provisions for each credits 6 0 . 8 3 2 6 . 3 3 1 8 . 5 4 6 . 8 6 9 1 . 6Collateral to each credits 6 3 7 . 7 2 5 3 . 8 2 1 8 . 1 8 2 . 8 5 5 4 . 7P r o v i s i o n s / C r e d i t s ( % ) 7 . 0 7 3 4 . 5 2 8 1 . 2 3 1 0 0 . 0 0 4 9 . 9 7(Provisions + Collateral)/Credits(%) 8 1 . 2 2 6 1 . 3 7 1 3 6 . 8 5 2 7 6 . 9 2 9 0 . 0 4
P r e c a u t i o n a r y S u b s t a n d a r d D o u b t f u l Est. Loss T o t a l
Improvement of Operation Base
Ending balance of interest and principal guaranteed trust 3 6 0 . 6 3 , 1 3 6 . 7 2 , 4 6 5 . 7The source of losses from trust operation 1 3 3 . 7 4 2 . 9 8 7 . 3
Provisions for credit losses 4 5 . 5 7 8 . 4 8 5 . 9Losses from disposition and valuation of securities 7 3 . 5 - 5 8 . 7 3 7 . 3Losses from interest gap 3 0 . 2 1 8 . 7 3 . 1O t h e r s - 1 5 . 5 4 . 5 - 3 9 . 0
Ending balance of trust credits in interest & principal guaranteed trust 2 7 6 . 9 2 , 9 7 9 . 1 1 , 6 8 3 . 5Substandard and below credits 2 2 0 . 1 7 2 1 . 5 1 5 7 . 5Provisions for credit losses 1 2 0 . 9 2 3 6 . 3 7 0 . 0Provisions/Substandard and below credits(%) 5 4 . 9 3 2 . 7 4 4 . 4
Outstanding Balance of stock & Losses from stock operation Beginning BS Ending BS P r o f i t sT o t a l 1 0 8 . 5 2 . 3 - 8 2 . 6
Pure Trading 4 3 . 1 0 - 2 6 . 8Debt-Equity swap 6 5 . 4 2 . 3 - 5 5 . 8
* Credit classification in 1998 did not apply FLC standard.
2 0 0 0 1 9 9 9 1 9 9 8
Net of Provisions for credit losses
In billions of Korean Won
Bad debt expenses 5 3 4 . 2 4 0 6 . 4 1 2 7 . 8Transfer from allowance for acceptances and Guarantees - 1 2 . 6 - 1 0 . 7 0 . 0
Net provisions for credit losses 5 2 1 . 6 3 9 5 . 7 1 2 7 . 8
2000 1999 1998
(table 15) Trends of credit losses
(table 16) Problem credit & Coverage ratio
(table 17) Breakdown of losses from trust operation
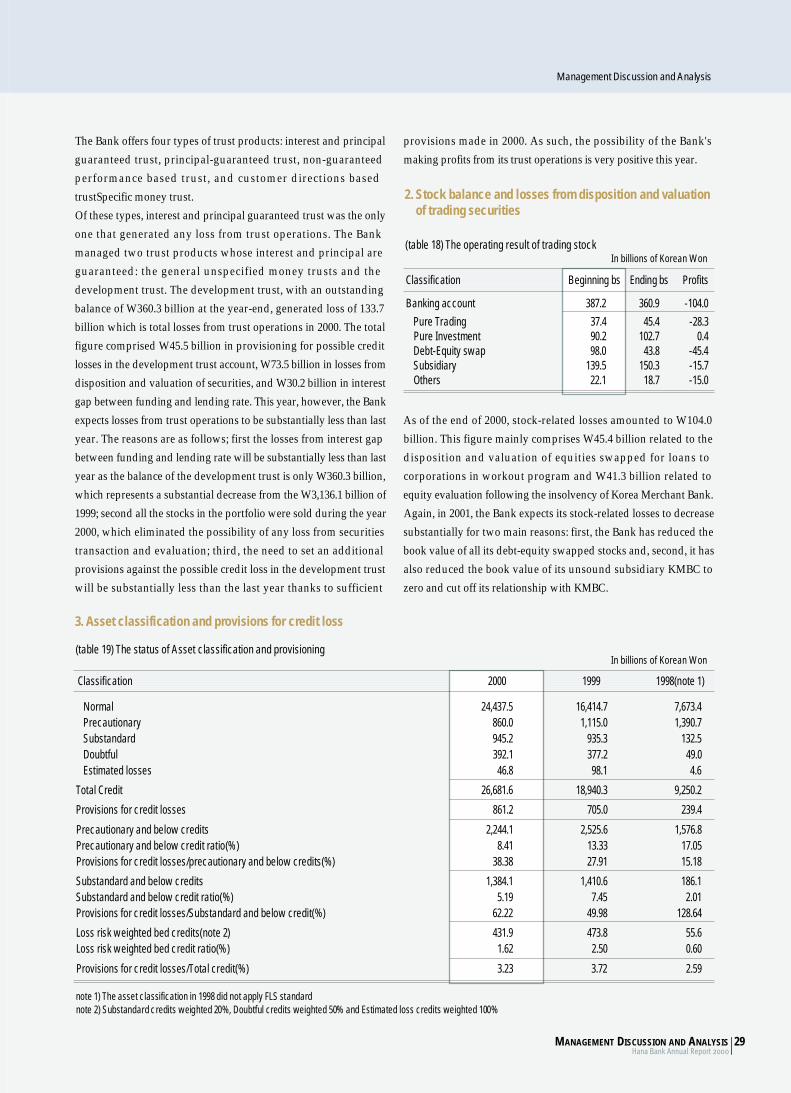
Management Discussion and Analysis
MANAGEMENT DISCUSSION AND ANALYSIS 29Hana Bank Annual Report 2000
The Bank offers four types of trust products: interest and principal
guaranteed trust, principal-guaranteed trust, non-guaranteed
performance based trust, and customer directions based
trustSpecific money trust.
Of these types, interest and principal guaranteed trust was the only
one that generated any loss from trust operations. The Bank
managed two trust products whose interest and principal are
guaranteed: the general unspecified money trusts and the
development trust. The development trust, with an outstanding
balance of W360.3 billion at the year-end, generated loss of 133.7
billion which is total losses from trust operations in 2000. The total
figure comprised W45.5 billion in provisioning for possible credit
losses in the development trust account, W73.5 billion in losses from
disposition and valuation of securities, and W30.2 billion in interest
gap between funding and lending rate. This year, however, the Bank
expects losses from trust operations to be substantially less than last
year. The reasons are as follows; first the losses from interest gap
between funding and lending rate will be substantially less than last
year as the balance of the development trust is only W360.3 billion,
which represents a substantial decrease from the W3,136.1 billion of
1999; second all the stocks in the portfolio were sold during the year
2000, which eliminated the possibility of any loss from securities
transaction and evaluation; third, the need to set an additional
provisions against the possible credit loss in the development trust
will be substantially less than the last year thanks to sufficient
provisions made in 2000. As such, the possibility of the Bank's
making profits from its trust operations is very positive this year.
As of the end of 2000, stock-related losses amounted to W104.0
billion. This figure mainly comprises W45.4 billion related to the
disposition and valuation of equities swapped for loans to
corporations in workout program and W41.3 billion related to
equity evaluation following the insolvency of Korea Merchant Bank.
Again, in 2001, the Bank expects its stock-related losses to decrease
substantially for two main reasons: first, the Bank has reduced the
book value of all its debt-equity swapped stocks and, second, it has
also reduced the book value of its unsound subsidiary KMBC to
zero and cut off its relationship with KMBC.
3. Asset classification and provisions for credit loss
N o r m a l 2 4 , 4 3 7 . 5 1 6 , 4 1 4 . 7 7 , 6 7 3 . 4P r e c a u t i o n a r y 8 6 0 . 0 1 , 1 1 5 . 0 1 , 3 9 0 . 7S u b s t a n d a r d 9 4 5 . 2 9 3 5 . 3 1 3 2 . 5D o u b t f u l 3 9 2 . 1 3 7 7 . 2 4 9 . 0Estimated losses 4 6 . 8 9 8 . 1 4 . 6
Total Credit 2 6 , 6 8 1 . 6 1 8 , 9 4 0 . 3 9 , 2 5 0 . 2
Provisions for credit losses 8 6 1 . 2 7 0 5 . 0 2 3 9 . 4
Precautionary and below credits 2 , 2 4 4 . 1 2 , 5 2 5 . 6 1 , 5 7 6 . 8Precautionary and below credit ratio(%) 8 . 4 1 1 3 . 3 3 1 7 . 0 5Provisions for credit losses/precautionary and below credits(%) 3 8 . 3 8 2 7 . 9 1 1 5 . 1 8
Substandard and below credits 1 , 3 8 4 . 1 1 , 4 1 0 . 6 1 8 6 . 1Substandard and below credit ratio(%) 5 . 1 9 7 . 4 5 2 . 0 1Provisions for credit losses/Substandard and below credit(%) 6 2 . 2 2 4 9 . 9 8 1 2 8 . 6 4
Loss risk weighted bed credits(note 2) 4 3 1 . 9 4 7 3 . 8 5 5 . 6Loss risk weighted bed credit ratio(%) 1 . 6 2 2 . 5 0 0 . 6 0
Provisions for credit losses/Total credit(%) 3 . 2 3 3 . 7 2 2 . 5 9
note 1) The asset classification in 1998 did not apply FLS standardnote 2) Substandard credits weighted 20%, Doubtful credits weighted 50% and Estimated loss credits weighted 100%
C l a s s i f i c a t i o n 2 0 0 0 1 9 9 9 1998(note 1)
2. Stock balance and losses from disposition and valuationof trading securities
In billions of Korean Won
In billions of Korean Won
Banking account 3 8 7 . 2 3 6 0 . 9 - 1 0 4 . 0Pure Trading 3 7 . 4 4 5 . 4 - 2 8 . 3Pure Investment 9 0 . 2 1 0 2 . 7 0 . 4Debt-Equity swap 9 8 . 0 4 3 . 8 - 4 5 . 4S u b s i d i a r y 1 3 9 . 5 1 5 0 . 3 - 1 5 . 7O t h e r s 2 2 . 1 1 8 . 7 - 1 5 . 0
C l a s s i f i c a t i o n Beginning bs Ending bs P r o f i t s
(table 18) The operating result of trading stock
(table 19) The status of Asset classification and provisioning

Management Discussion and Analysisyears ended December 31
30 MANAGEMENT DISCUSSION AND ANALYSISHana Bank Annual Report 2000
The chart above shows the
quarterly movements of the
Bank's substandard-and-below
credit. The Bank's loan default
ratio began to rise from the
Hanbo crisis in the first quarter of
1997 and turned downward after
the third quarter of that year. Of
course, the ratio turned upward
in the fourth quarter of 1999 due
to the adoption of the FLC, but
the rise did not last long. During
the course of 2000, the ratio
remained stabilized, below 10%.
Although ratio of decrease of
substandard and below credits
were erratic, ratio of decrease of
substandard and below credits
excluding write-offs and loans
sale began to exceed ratio of
increase of substandard and
below credits in the first quarter
of 2000 and on, which means that
substandard and below credits
were on, a gradual decrease since
then.
If this decreasing trend continues,
the Bank expects that gains from
the recovery of substandard and
below credits will exceed losses
related to loans going bad.
However, to reduce its
substandard and below credits
ratio to below 2% and thus raise
its asset quality to the level of
banks in the advanced nations,
the Bank plans to build credit loss
provisions to around W320.0
billion to write off and sell bad
assets in this year.

Management Discussion and Analysis
MANAGEMENT DISCUSSION AND ANALYSIS 31Hana Bank Annual Report 2000
Loan Portfolio
Loans in won(note 1) 1 8 , 8 3 9 . 3 7 3 . 5 1 2 , 2 7 7 . 3 6 8 . 3 5 , 1 6 4 . 1 6 7 . 2Large Enterprise 5 , 4 8 6 . 8 2 1 . 4 3 , 5 3 7 . 4 1 9 . 7 1 , 8 8 7 . 7 2 4 . 5S M E 6 , 6 2 3 . 2 2 5 . 9 5 , 3 0 0 . 8 2 9 . 5 2 , 3 7 6 . 0 3 1 . 0H o u s e h o l d 5 , 3 3 8 . 3 2 0 . 8 3 , 2 7 9 . 3 1 8 . 2 7 1 0 . 4 9 . 2Public and interbank 1 , 3 9 1 . 0 5 . 4 1 5 9 . 8 0 . 9 1 9 0 . 0 2 . 5
Loans in foreign currencies 1 , 0 0 7 . 4 3 . 9 9 5 8 . 5 5 . 3 6 1 7 . 8 8 . 0Bills purchased in foreign currencies 1 , 2 4 6 . 4 4 . 9 1 , 1 8 1 . 9 6 . 6 5 9 1 . 9 7 . 7Advances for customers 1 7 1 . 6 0 . 7 1 9 2 . 6 1 . 1 3 3 . 8 0 . 4Bonds purchased under repurchase agreement 8 2 0 . 0 3 . 2 9 2 0 . 0 5 . 1 0 . 0 0 . 0Credit card accounts 4 4 0 . 4 1 . 7 1 1 8 . 4 0 . 7 7 8 . 0 1 . 0Call loans 7 6 7 . 4 3 . 0 4 1 2 . 3 2 . 3 2 4 1 . 5 3 . 1Privately-placed debentures 2 , 1 9 4 . 8 8 . 6 1 , 7 7 4 . 6 9 . 9 9 7 3 . 1 1 2 . 6Others(note 2) 1 2 1 . 3 0 . 5 1 3 4 . 7 0 . 7 0 . 0 0 . 0Total loans 2 5 , 6 0 8 . 6 1 0 0 . 0 1 7 , 9 7 0 . 3 1 0 0 . 0 7 , 7 0 0 . 2 1 0 0 . 0
(Loan loss provision) ( 8 2 1 . 2 ) ( 6 5 5 . 1 ) ( 2 3 9 . 4 )(Discounting present value) ( 4 8 . 6 ) ( 2 4 . 6 ) ( 0 . 0 )
note 1) Include Bills purchased in won currencynote 2) Include Factoring receivables and Loans to be swaped to equity
2 0 0 0 ( % ) 1 9 9 9 ( % ) 1 9 9 8 ( % )
As of the end of 2000, the Bank's total loans stood at W25.6 trillion,
a 42.5% increase from the year before. The total figure comprised
mostly Loans in won and Credit card account.
Loans in won rose by W6,562.0 billion over the year. Of the
amount, W2,059.0 billion, the largest share, came from household
loans, followed by W1,949.4 billion from large corporate loans,
W1,322.4 billion from SME loans, and W1,231.2 billion from loans
to public enterprises. Although large corporate loans increased in
amount, the actual increase was due to a simple reshuffling. As
some trust accounts, such as the development trust, were either
discontinued or reduced, healthy large corporate loans managed
under the trust account were transferred to the bank account.
Increasing household loans was one of the Bank's top priority
projects in 2000. As a result, household loans jumped 62.8% over
the year to W5,338.3 billion, and credit card account soared 272%
to W440.4 billion. Increasing household loans not only has a
benefit of higher rate of return than corporate loans but also
contributes to dispersing credit risk. Since the IMF bailout of 1997,
the Bank had held a conservative approach toward household
loans until the first half of 1998 due to high credit risk. But as the
improving economy eased credit risk and the default ratio of
household loans proved to be less than that of corporate loans
during the "IMF years", the Bank has adopted an aggressive stance
toward increasing household loans since the second half of 1998.
Deposit structure
Deposit in won currency 3 1 , 3 4 4 . 3 9 6 . 4 2 4 , 1 7 0 . 2 9 7 . 7 1 1 , 0 7 2 . 8 9 3 . 3Low cost deposits 6 , 9 4 5 . 0 2 1 . 4 5 , 9 0 1 . 7 2 3 . 9 1 , 9 4 6 . 1 1 6 . 4
Core low cost deposits 3 , 8 4 2 . 3 1 1 . 8 2 , 9 0 2 . 6 1 1 . 7 1 , 2 6 7 . 9 1 0 . 7M M D A 3 , 1 0 2 . 7 9 . 5 2 , 9 9 9 . 1 1 2 . 1 6 7 8 . 2 5 . 7
Time deposits 1 6 , 8 4 7 . 6 5 1 . 8 1 3 , 1 8 2 . 1 5 3 . 3 5 , 2 6 2 . 8 4 4 . 3Installment deposits 1 , 8 7 0 . 7 5 . 8 1 , 5 6 0 . 2 6 . 3 8 6 2 . 9 7 . 3C D s 1 , 9 1 4 . 5 5 . 9 1 , 8 4 3 . 4 7 . 5 1 , 9 7 1 . 3 1 6 . 6R P s * 1 , 3 5 6 . 9 4 . 2 1 , 0 0 1 . 4 4 . 0 8 1 7 . 1 6 . 9Bills solds* 2 , 4 0 9 . 5 7 . 4 6 8 1 . 5 2 . 8 2 1 2 . 6 1 . 8
Deposit in foreign currency 1 , 1 7 8 . 2 3 . 6 5 7 1 . 0 2 . 3 7 9 5 . 3 6 . 7D e p o s i t s 1 , 1 7 5 . 4 3 . 6 5 3 2 . 4 2 . 2 7 9 5 . 3 6 . 7R P s * 2 . 8 0 . 0 3 8 . 7 0 . 2 0 . 0 0 . 0
Total deposits 3 2 , 5 2 2 . 5 1 0 0 . 0 2 4 , 7 4 1 . 2 1 0 0 . 0 1 1 , 8 6 8 . 1 1 0 0 . 0
* RPs and Bills sold are classified as Borrowings in audit report but Hanabank internally defined as deposits
2 0 0 0 ( % ) 1 9 9 9 ( % ) 1 9 9 8 ( % )
(table 21) Loan protfolio of Banking Account
(table 22) Deposit structure of Banking AccountIn billions of Korean Won
In billions of Korean Won

Management Discussion and Analysisyears ended December 31
32 MANAGEMENT DISCUSSION AND ANALYSISHana Bank Annual Report 2000
As of the end of 2000, the Bank's total deposits amounted to
W32,522.5 billion, up 31.5% from the year before. Local currency
deposits rose W7.2 trillion to W31,344.3 billion, while foreign
currency increased W607.2 billion to W1,178.2 billion.
To review the increase of local currency deposits by type, low-
cost deposits rose W1,043.3 billion. Of this figure, W939.7 billion
came from demand deposits and low-cost savings deposits and
a mere W103.6 billion from the MMDA. The growth of the
MMDA, which is sensitive to interest rate movements, failed to
reflect the Bank's efforts to increase low-cost deposits. This can
be ascribed to the fact that the Bank set the volume in which the
MMDA can maintain its core deposits at around W3 trillion.
The Bank plans to readjust the size of the MMDA by thoroughly
analyzing the product's transaction sustenance ratio and
maintenance cost.
Meanwhile, the ratio of time deposits to total deposits inched
down over the year. During the year, the Bank reduced some
high-interest time deposits to further enhance profitability.
Bills sold increased in volume, because the Bank sold “Bills
sold”, as a way to avoid the Totalized income tax of individual
financial income, which was to go into effect this year.
As of the year-end 2000, the Bank's BIS capital adequacy ratio
stood at 10.45%, which represents a 1.88% point decrease from
the year before. The reasons for the decrease are as follows: first,
the Bank repurchased W137.4 billion of the preferred shares it
had received from the Korea Deposits Insurance corporation in
relation to the P&A of Chungchong Bank and the merger of
Boram Bank; second, the liberal allocation of provisions against
possible loan losses in turn cut into net income; and third, the
rapid inflow of funds in search of safe havens ballooned the
Bank's risk-weighted assets.
Having returned W137.4 billion of the preferred shares, the Bank
has the following redemption plan.
BIS capital adequacy ratio
Tier 1 capital 1 , 7 1 5 . 4 1 , 8 6 8 . 4 8 6 4 . 8Paid in capital 9 5 7 . 2 1 , 0 2 3 . 6 3 4 9 . 6
Common share 6 2 1 . 8 5 5 0 . 8 3 4 9 . 6Preferred share 3 3 5 . 4 4 7 2 . 8 0 . 0
Capital surplus 4 2 4 . 5 3 3 9 . 7 1 6 9 . 1Retained earnings 3 6 0 . 8 4 0 8 . 9 3 4 6 . 4Adjustment and etc. - 2 7 . 1 9 6 . 2 - 0 . 2
Tier 2 capital 1 , 0 4 1 . 3 7 3 5 . 5 5 6 9 . 2Evaluation income
form investment securities 1 1 . 5 0 . 0 0 . 0Allowance for credit losses 1 7 2 . 1 9 9 . 9 1 3 6 . 8Subordinate debt 8 5 7 . 7 6 3 5 . 6 4 3 2 . 4
Investment to nonconsolidated
s u b s i d i a r i e s 0 . 0 4 1 . 3 0 . 0
Total Capital 2 , 7 5 6 . 7 2 , 5 6 2 . 6 1 , 4 3 4 . 1
Total Risk-weighted assets 2 6 , 3 8 2 . 3 2 0 , 7 7 8 . 8 1 0 , 9 4 4 . 6
Capital adequacy ratio(%) 1 0 . 4 5 1 2 . 3 3 1 3 . 1 0Tier 1 ratio(%) 6 . 5 0 8 . 9 9 7 . 9 0Tier 2 ratio(%) 3 . 9 5 3 . 5 4 5 . 2 0
2 0 0 0 1 9 9 9 1 9 9 8
unit : million won
Chungchong P&A 2 8 , 6 6 0 2 8 , 6 6 0 4 2 , 9 9 0 2 1 , 4 9 5 2 1 , 4 9 5Boram P&A 1 0 8 , 7 3 5 1 0 8 , 7 3 5 1 1 2 , 0 3 0
T o t a l 1 3 7 , 3 9 5 1 3 7 , 3 9 5 1 5 5 , 0 2 0 2 1 , 4 9 5 2 1 , 4 9 5
2 0 0 0 2 0 0 1 2 0 0 2 2 0 0 3 2 0 0 4
Other information
In billions of Korean Won
VaR for 10 days 4 4 . 1 3 . 0 5 0 . 1 6 . 6 1 4 . 4 1 1 8 . 2
Ratio to Equity Capital 1 . 6 0 % 0 . 1 1 % 1 . 8 2 % 0 . 2 4 % 0 . 4 1 % 4 . 1 8 %
D e r i t i v e sFX Open Position
BondsWon Foreign
S t o c k s T o t a l
In billions of Korean Won
Won currency(billion won) 1 9 , 1 7 6 . 6 1 5 , 7 6 5 . 6 1 2 1 . 6 4Foreign currency(hundred dollar) 2 , 0 3 9 . 9 1 , 3 3 8 . 3 1 5 2 . 4 3
A s s e t s L i a b i l i t i e s %
(table 23) The status of Capital Adequacy ratio
(table 24) Time schedule of repurchase of preferred share
(table 25) Targets and Limits for VaR
(table 26) Liquidity ratio
In billions of Korean Won

Management Discussion and Analysis
MANAGEMENT DISCUSSION AND ANALYSIS 33Hana Bank Annual Report 2000
In billions of Korean Won
In billions of Korean Won
Won currency 3 4 , 9 2 1 . 7 1 0 0 . 0 0 3 3 , 3 3 1 . 2 1 0 0 . 0 0Below 3% 8 6 1 . 4 2 . 4 7 6 , 1 2 5 . 1 1 8 . 3 8between 3% and 5% 1 0 9 . 4 0 . 3 1 3 9 5 . 8 1 . 1 9between 5% and 7% 6 , 8 0 4 . 1 1 9 . 4 8 1 1 , 2 1 2 . 7 3 3 . 6 4between 7% and 9% 1 4 , 1 3 7 . 3 4 0 . 4 8 1 3 , 8 5 4 . 4 4 1 . 5 7between 9% and 11% 1 0 , 0 8 6 . 5 2 8 . 8 8 1 , 0 4 1 . 3 3 . 1 2between 11% and 13% 1 , 8 8 9 . 2 5 . 4 1 5 4 9 . 8 1 . 6 5Over 13% 1 , 0 3 3 . 8 2 . 9 7 1 5 2 . 1 0 . 4 6
Foreign currency 3 , 7 7 8 . 3 1 0 0 . 0 0 3 , 1 8 8 . 7 1 0 0 . 0 0Below 3% 5 9 1 . 1 1 5 . 6 4 6 1 . 4 1 . 9 3between 3% and 5% 6 0 . 0 1 . 5 9 2 5 . 8 0 . 8 1between 5% and 7% 5 1 5 . 5 1 3 . 6 4 9 4 7 . 1 2 9 . 7 0between 7% and 9% 1 , 7 3 6 . 3 4 5 . 9 5 2 , 0 4 7 . 3 6 4 . 2 0between 9% and 11% 8 2 6 . 9 2 1 . 8 9 1 0 7 . 1 3 . 3 6between 11% and 13% 4 3 . 8 1 . 1 6 0 . 0 0 . 0 0Over 13% 4 . 7 0 . 1 2 0 . 0 0 . 0 0
A s s e t s ( % ) L i a b i l i t i e s ( % )
Won currency 3 7 , 9 4 6 . 9 3 8 , 0 9 4 . 2 - 1 4 7 . 3Due in 3 months or less 1 1 , 0 2 4 . 6 1 5 , 7 6 5 . 6 - 4 , 7 4 1 . 0Due between 3 months and 6 months 5 , 2 9 6 . 0 5 , 3 1 2 . 6 - 1 6 . 6Due between 6 months and 1 year 8 , 5 2 3 . 7 7 , 0 3 9 . 7 1 , 4 8 4 . 0Due between 1 year and 3 years 7 , 8 1 4 . 8 2 , 7 1 5 . 9 5 , 0 9 8 . 9Due after 3 years 5 , 2 8 7 . 8 7 , 2 6 0 . 4 - 1 , 9 7 2 . 6
Foreign currency 3 , 8 2 7 . 3 3 , 6 7 9 . 8 1 4 7 . 5Due in 3 months or less 2 , 6 5 0 . 9 1 , 7 9 8 . 2 8 5 2 . 7Due between 3 months and 6 months 3 6 4 . 3 2 4 7 . 9 1 1 6 . 4Due between 6 months and 1 year 2 8 0 . 4 4 4 0 . 0 - 1 5 9 . 6Due between 1 year and 3 years 3 1 7 . 8 9 6 2 . 1 - 6 4 4 . 2Due after 3 years 2 1 3 . 9 2 3 1 . 6 - 1 7 . 7
A s s e t s L i a b i l i t i e s G a p
In billions of Korean Won
Won currency 3 4 , 9 2 1 . 7 3 3 , 3 3 1 . 2 1 , 5 9 0 . 5Due in 3 months or less 1 4 , 2 9 9 . 0 1 3 , 8 5 4 . 4 4 4 4 . 6Due between 3 months and 6 months 3 , 8 5 8 . 7 5 , 2 6 5 . 7 - 1 , 4 0 7 . 0Due between 6 months and 1 year 6 , 8 6 3 . 0 6 , 9 9 3 . 5 - 1 3 0 . 5Due between 1 year and 3 years 6 , 5 8 7 . 9 2 , 4 6 7 . 4 4 , 1 2 0 . 5Due after 3 years 3 , 3 1 3 . 1 4 , 7 5 0 . 2 - 1 , 4 3 7 . 1
Foreign currency 3 , 7 7 8 . 3 3 , 1 8 8 . 7 5 8 9 . 6Due in 3 months or less 2 , 1 8 2 . 0 1 , 9 5 4 . 0 2 2 8 . 0Due between 3 months and 6 months 6 5 7 . 7 1 , 1 8 6 . 5 - 5 2 8 . 8Due between 6 months and 1 year 1 9 6 . 9 4 6 . 9 1 5 0 . 0Due between 1 year and 3 years 3 9 6 . 3 1 . 3 3 9 5 . 0Due after 3 years 3 4 5 . 4 0 . 0 3 4 5 . 4
A s s e t s L i a b i l i t i e s G a p
(table 27) Maturity Gap
(table 28) Interest Gap
(table 29) Funding and Lending Structure

Management Discussion and Analysisyears ended December 31
34 MANAGEMENT DISCUSSION AND ANALYSISHana Bank Annual Report 2000
Banking AccountLoans in Won O
Corporate Loans O O O
Household Loans O O O
Government and Public corporate Loans O O OInter-bank Loans X X X
Loans in foreign currencies O O O O
Bills purchased in won O O OBills discounted O
Local L/C discounted X
Bills bought in foreign currencies X O O OAdvances for customers O O O O
Factoring receivables O O O O
Privately-placed debentures O O O OCredit card accounts O O O
Credit card accounts X
Credit card loans OBonds purchased under repurchase agreement X X X X
Call loans X X X X
Gross LoansGuarantees and Acceptance(note 1) X O O OSuspense receivable as credit X O O O
Transfer from bad foreign bills bought X O O O
Trust AccountInterest and Principal Guaranteed Trust O O O O
L o a n s
Privately Placed debentures
C P sPrincipal Guaranteed Trust O O X O
L o a n sPrivately Placed debenturesC P s
Non-Guaranteed Trust O O X OL o a n sPrivately Placed debenturesC P s
Specific Trust O X X OL o a n sPrivately Placed debenturesC P s
note 1) Normal and Precautionary in Guarantees and Acceptances and normal in Principle Guaranteed trust and Non-Guaranteed trust don’t make provision following the FSS
g u i d e l i n e
Loans defined by Credits to be Provisioning effect Credits for Audit Report line item Hanabank internally p r o v i s i o n e d to bank’s profit NPL classification
(table 30) The Definition of Loans used in Korean Banking System

Management Discussion and Analysis
MANAGEMENT DISCUSSION AND ANALYSIS 35Hana Bank Annual Report 2000
Income form interest margin - 3 0 . 2 4 . 1 1 . 5 7 5 . 5 2 3 . 9 3 3 . 2 2 . 2 1 1 0 . 0Income related securities transaction and evaluation - 7 3 . 5 2 . 2 0 . 0 1 6 . 8 0 . 0 0 . 0 0 . 0 - 5 4 . 5
Bond transaction 9 . 2 2 . 2 0 . 0 1 6 8 0 . 0 0 . 0 0 . 0 2 8 . 1Stock transaction - 8 1 . 0 0 . 0 0 . 0 0 . 0 0 . 0 0 . 0 0 . 0 - 8 1 . 0Stock evaluation - 1 . 6 0 . 0 0 . 0 0 . 0 0 . 0 0 . 0 0 . 0 - 1 . 6
Income form loan sale - 2 . 6 0 . 0 0 . 0 - 0 . 7 0 . 0 0 . 0 0 . 0 - 3 . 3Other income 1 8 . 0 - 2 . 9 0 . 0 0 . 1 0 . 0 0 . 0 0 . 0 1 5 . 2
Income from discounting present value 1 8 . 0 0 . 0 0 . 0 0 . 4 0 . 0 0 . 0 0 . 0 1 8 . 4Reserve for trust losses 0 . 0 - 2 . 9 0 . 0 - 0 . 3 0 . 0 0 . 0 0 . 0 - 3 . 2
Reserve for credit losses - 4 5 . 5 5 . 4 0 . 0 - 2 . 5 4 . 4 0 . 0 0 . 0 - 3 8 . 1Net of trust management income - 1 3 3 . 7 8 . 8 1 . 5 8 9 . 2 2 8 . 3 3 3 . 2 2 . 2 2 9 . 3Fees on early termination of trust account 0 . 0 0 . 1 0 . 0 2 . 3 0 . 0 1 . 2 0 . 0 3 . 5Total income form trust business - 1 3 3 . 7 8 . 9 1 . 5 9 1 . 4 2 8 . 3 3 4 . 3 2 . 2 3 2 . 8Absorption from the bank 1 3 3 . 7 0 . 0 0 . 0 0 . 0 0 . 0 0 . 0 0 . 0 1 3 3 . 7
Principal Guaranteed Non GuaranteedI n t e r e s t Non mark Mark Non mark M a r k Specific Asset trust T o t a lG u a r a n t e e d to market to market to market to market money trust
In billions of Korean Won
In billions of Korean Won
Trust assets Trust assets
I n t & P r i n Prin. Trust credits to N o n Trust credits to Credits to be Credits inG u a r a n t e e d G u a r a n t e e d be consolidated - G u a r a n t e e d be provisioned p r o v i s i o n e d Specific T o t a l
Bank credits(a) ( b ) ( c ) ( d = b + c ) ( e ) ( f = d + e ) ( g = a + f ) t r u s t ( h ) c r e d i t ( I = g + h )
N o r m a l 2 4 , 4 3 7 . 5 2 3 . 6 3 9 0 . 6 4 1 4 . 2 1 , 8 8 1 . 0 2 , 2 9 5 . 1 2 6 , 7 3 2 . 7 1 , 1 0 7 . 3 2 7 , 8 3 9 . 9P r e c a u t i o n a r y 8 6 0 . 0 3 3 . 2 5 . 8 3 9 . 1 9 6 . 4 1 3 5 . 5 9 9 5 . 5 5 0 . 0 1 , 0 4 5 . 5S u b s t a n d a r d 9 4 5 . 2 1 8 1 . 7 0 . 1 1 8 1 . 8 5 2 . 8 2 3 4 . 6 1 , 1 7 9 . 8 1 . 1 1 , 1 8 1 . 0D o u b t f u l 3 9 2 . 1 2 0 . 9 0 . 1 2 0 . 9 1 4 . 8 3 5 . 8 4 2 7 . 9 3 6 . 2 4 6 4 . 0Est. loss 4 6 . 8 1 7 . 5 0 . 0 1 7 . 5 3 . 6 2 1 . 1 6 7 . 9 0 . 8 6 8 . 8Total credits 2 6 , 6 8 1 . 6 2 7 6 . 9 3 9 6 . 7 6 7 3 . 6 2 , 0 4 8 . 6 2 , 7 2 2 . 1 2 9 , 4 0 3 . 8 1 , 1 9 5 . 4 3 0 , 5 9 9 . 1Problem credits
Precautionary and below credits 2 , 2 4 4 . 1 2 5 3 . 3 6 . 1 2 5 9 . 4 1 6 7 . 6 4 2 7 . 0 2 , 6 7 1 . 1 8 8 . 1 2 , 7 5 9 . 2Substandard and below credits 1 , 3 8 4 . 1 2 2 0 . 1 0 . 2 2 2 0 . 3 7 1 . 2 2 9 1 . 5 1 , 6 7 5 . 6 3 8 . 1 1 , 7 1 3 . 7Bad credits(doubtful and below) 4 3 8 . 9 3 8 . 4 0 . 1 3 8 . 5 1 8 . 4 5 6 . 9 4 9 5 . 8 3 7 . 0 5 3 2 . 8
Asset soundness ratioPrecautionary ratio 3 . 2 2 % 1 2 . 0 1 % 1 . 4 7 % 5 . 8 0 % 4 . 7 1 % 4 . 9 8 % 3 . 3 9 % 4 . 1 8 % 3 . 4 2 %Precautionary and below ratio 8 . 4 1 % 9 1 . 4 9 % 1 . 5 3 % 3 8 . 5 1 % 8 . 1 8 % 1 5 . 6 9 % 9 . 0 8 % 7 . 3 7 % 9 . 0 2 %Substandard and below ratio 5 . 1 9 % 7 9 . 4 8 % 0 . 0 6 % 3 2 . 7 1 % 3 . 4 8 % 1 0 . 7 1 % 5 . 7 0 % 3 . 1 9 % 5 . 6 0 %Bad assets ratio 1 . 6 4 % 1 3 . 8 6 % 0 . 0 3 % 5 . 7 1 % 0 . 9 0 % 2 . 0 9 % 1 . 6 9 % 3 . 0 9 % 1 . 7 4 %
P r o v i s i o n i n gProvisions for credit losses 8 6 1 . 2 1 2 0 . 9 0 . 2 1 2 1 . 0 4 4 . 2 1 6 5 . 2 1 , 0 2 6 . 4 0 . 0 1 , 0 2 6 . 4Present value discounts 4 8 . 6 2 6 . 8 0 . 5 2 7 . 3 0 . 0 2 7 . 3 7 5 . 9 0 . 0 7 5 . 9
Coverage ratioProvisions/total credits 3 . 2 3 % 4 3 . 6 5 % 0 . 0 5 % 1 7 . 9 7 % 2 . 1 6 % 6 . 0 7 % 3 . 4 9 % 0 . 0 0 % 3 . 3 5 %Provision/precautionary and below credits 3 8 . 3 8 % 4 7 . 7 0 % 3 . 2 5 % 4 6 . 6 7 % 2 6 . 3 6 % 3 8 . 6 9 % 3 8 . 4 3 % 0 . 0 0 % 3 7 . 2 0 %Provision/substandard and below credits 6 2 . 2 2 % 5 4 . 9 1 % 8 9 . 5 5 % 5 4 . 9 4 % 6 2 . 0 4 % 5 6 . 6 8 % 6 1 . 2 5 % 0 . 0 0 % 5 9 . 8 9 %
* Provision in interest and principal guaranteed trust directly effect to bank’s profits.* Provision in principal guaranteed trust which is operated performance base does not effect to bank’s profits as long as the leanding rate is higher then zero.* Provision in nonguaranteed trust does not effect to bank’s profits.* The specitic money trust is operated by directions of truster so the credits in specitic money trust does not make provision.
(table 31) Operating result of trust business
(table 32) Asset classification and provision(FY2000)

Management Discussion and Analysisyears ended December 31
36 MANAGEMENT DISCUSSION AND ANALYSISHana Bank Annual Report 2000
N o r m a lP r e c a u t i o n a r yS u b s t a n d a r d
D o u b t f u lEst. lossTotal credits
Problem credits
P r e c a u t i o n a r yPrecautionary and below creditsSubstandard and below creditsBad credits(doubtful and below)
Asset soundness ratio
Precautionary ratioPrecautionary and below ratioSubstandard and below ratioBad assets ratio
P r o v i s i o n i n g
Provisions for credit lossesPresent value discounts
Coverage ratio
Provisions/total creditsProvision/precautionary and below creditsProvision/substandard and below credits
In billions of Korean Won
Trust assets Trust assets
I n t & P r i n Prin. Trust credits to N o n Trust credits to Credits to be Credits inG u a r a n t e e d G u a r a n t e e d be consolidated - G u a r a n t e e d be provisioned p r o v i s i o n e d Specific T o t a l
Bank credits(a) ( b ) ( c ) ( d = b + c ) ( e ) ( f = d + e ) ( g = a + f ) t r u s t ( h ) c r e d i t ( I = g + h )
1 6 , 4 1 4 . 7 1 , 6 1 5 . 6 8 6 . 5 1 , 7 0 2 . 1 3 , 6 6 8 . 2 5 , 3 7 0 . 3 2 1 , 7 8 5 . 0 6 5 3 . 8 2 2 , 4 3 8 . 81 , 1 1 5 . 0 3 0 0 . 9 4 . 3 3 0 5 . 2 4 0 9 . 9 7 1 5 . 1 1 , 8 3 0 . 1 8 9 . 2 1 , 9 1 9 . 3
9 3 5 . 3 5 5 6 . 9 2 . 8 5 5 9 . 7 1 6 1 . 8 7 2 1 . 5 1 , 6 5 6 . 8 5 4 . 1 1 , 7 1 0 . 9
3 7 7 . 2 2 9 . 3 0 . 0 2 9 . 3 1 1 . 2 4 0 . 5 4 1 7 . 7 3 . 5 4 2 1 . 29 8 . 1 4 2 . 4 3.2 45.6 9.3 5 4 . 9 153.0 0 . 0 1 5 3 . 0
1 8 , 9 4 0 . 3 2,545.1 96.8 2,641.9 4 , 2 6 0 . 4 6,902.3 25,842.6 800.6 2 6 , 6 4 3 . 2
1 , 1 1 5 . 0 3 0 0 . 9 4 . 3 3 0 5 . 2 4 0 9 . 9 7 1 5 . 1 1 , 8 3 0 . 1 8 9 . 2 1 , 9 1 9 . 32,525.6 9 2 9 . 5 1 0 . 3 9 3 9 . 8 592.2 1 , 5 3 2 . 0 4,057.6 1 4 6 . , 8 4 , 2 0 4 . 41 , 4 1 0 . 6 6 2 8 . 6 6 . 0 6 3 4 . 6 1 8 2 . 3 816.9 2 , 2 2 7 . 5 5 7 . 6 2 , 2 8 5 . 1
4 7 5 . 3 71.7 3.2 7 4 . 9 20.5 9 5 . 4 5 7 0 . 7 3 . 5 5 7 4 . 2
5 . 8 9 % 1 1 . 8 2 % 4 . 4 4 % 1 1 . 5 5 % 9 . 6 2 % 1 0 . 3 6 % 7 . 0 8 % 1 1 . 1 4 % 7 . 2 0 %1 3 . 3 3 % 3 6 . 5 2 % 1 0 . 6 4 % 3 5 . 5 7 % 1 3 . 9 0 % 2 2 . 2 0 % 1 5 . 7 0 % 1 8 . 3 4 % 1 5 . 7 8 %7 . 4 5 % 2 4 . 7 0 % 6 . 2 0 % 2 4 . 0 2 % 4 . 2 8 % 1 1 . 8 4 % 8 . 6 2 % 7 . 1 9 % 8 . 5 8 %2 . 5 1 % 2 . 8 2 % 3 . 3 1 % 2 . 8 4 % 0 . 4 8 % 1 . 3 8 % 2 . 2 1 % 0 . 4 4 % 2 . 1 6 %
7 0 5 . 0 2 3 6 . 3 6 . 5 2 4 2 . 7 8 4 . 2 3 2 7 . 2 1 , 0 3 2 . 2 0 . 0 1 , 0 3 2 . 22 4 . 6 0 . 0 0 . 0 0 . 0 0 . 0 0 . 0 2 4 . 6 0 . 0 2 4 . 6
3 . 7 2 % 9 . 2 8 % 6 . 6 9 % 9 . 1 9 % 1 . 9 8 % 4 . 7 4 % 3 . 9 9 % 0 . 0 0 % 3 . 8 7 %2 7 . 9 1 % 2 5 . 4 2 % 6 2 . 8 3 % 2 5 . 8 3 % 1 4 . 2 6 % 2 1 . 3 6 % 2 5 . 4 4 % 0 . 0 0 % 2 4 . 5 5 %4 9 . 9 8 % 3 7 . 5 9 % 1 0 7 . 8 7 % 3 8 . 2 5 % 4 6 . 3 2 % 4 0 . 0 5 % 4 6 . 3 4 % 0 . 0 0 % 4 5 . 1 9 %
* Provision in interest and principal guaranteed trust directly effect to bank’s profits.* Provision in principal guaranteed trust which is operated performance base does not effect to bank’s profits as long as the leanding rate is higher then zero.* Provision in nonguaranteed trust does not effect to bank’s profits.* The specitic money trust is operated by directions of truster so the credits in specitic money trust does not make provision.
(table 33) Asset classification and provision(FY1999)

R e p o rt of Independent Accountants
To the Board of Directors and Shareholders of Hana Bank
We have audited the accompanying balance sheets of Hana Bank ("the Bank") as of December 31, 2000 and 1999, and the related statements ofincome, appropriations of retained earnings and cash flows for the years then ended. These financial statements are the responsibility of theBank's management. Our responsibility is to express an opinion on these financial statements based on our audits.
We conducted our audits in accordance with auditing standards generally accepted in the Republic of Korea. Those standards require that weplan and perform the audit to obtain reasonable assurance about whether the financial statements are free of material misstatement. An auditincludes examining, on a test basis, evidence supporting the amounts and disclosures in the financial statements. An audit also includesassessing the accounting principles used and significant estimates made by management, as well as evaluating the overall financial statementpresentation. We believe that our audits provide a reasonable basis for our opinion.
In our opinion, the financial statements referred to above present fairly, in all material respects, the financial position of Hana Bank as ofDecember 31, 2000 and 1999, and the results of its operations, the changes in its retained earnings, and its cash flows for the years then ended inaccordance with financial accounting standards generally accepted in the Republic of Korea.
As discussed in note 2 to the financial statements, since 1999, the Bank changed its method of accounting and presentation for certain items inaccordance with revised financial accounting standards. The accounting changes include accounting treatment for the allowance for possibleloan losses, valuation of securities, valuation of receivables under troubled debt restructurings, reserve for possible losses on acceptances andguarantees, deferred taxes, prior period adjustments, and stock issuance costs.
Without qualifying our opinion, we draw attention to note 14 to the financial statements. The operations of the Bank have beensignificantly affected, and may continue to be affected for the foreseeable future, by the general adverse economic conditions in theRepublic of Korea and the Asia Pacific region. The ultimate effect of these uncertainties on the financial position of the Bank as ofDecember 31, 2000 can not presently be determined and accordingly, no adjustments have been made in the accompanying financialstatements related to such uncertainties.
The amounts expressed in U.S. Dollars are provided solely for the convenience of the users of the financial statements and have beentranslated on the basis set forth in note 3 to the financial statements.
The accompanying financial statements are not intended to present the financial position, results of operations and cash flows inaccordance with accounting principles and practices generally accepted in countries and jurisdictions other than the Republic ofKorea. The procedures and practices utilized to audit such financial statements may differ from those generally accepted and appliedin other countries and jurisdictions. Accordingly, this report and the accompanying financial statements are not intended to be usedby those who are not informed about Korean accounting principles or auditing standards and their application in practice.
Seoul, KoreaJanuary 26, 2001
FINANCIAL STATEMENTS 37Hana Bank Annual Report 2000
Samil Accounting CorporationKukjae Center Building 21st Flr.191 Hangangro 2ga, YongsankuSeoul 140-702, KOREA(C.P.O Box 2170, 100-621)

38 FINANCIAL STATEMENTSHana Bank Annual Report 2000
In Millions of Korean Won In Thousands of U.S. Dollars (Note 3)
A s s e t sCash and due from banks (Note 4) W 3 , 0 9 4 , 3 9 7 W 3 , 7 1 4 , 4 7 6 $ 2 , 4 5 6 , 4 5 6 $ 2 , 9 4 8 , 6 9 9Trading securities (Note 5) 5 8 4 , 4 5 4 6 0 8 , 8 4 6 4 6 3 , 9 6 3 4 8 3 , 3 2 6Investment securities (Note 6) 1 1 , 3 3 4 , 0 4 0 9 , 0 9 9 , 3 1 4 8 , 9 9 7 , 4 1 2 7 , 2 2 3 , 3 9 8Loans (Note 7) 2 5 , 6 0 8 , 6 3 1 1 7 , 9 7 0 , 2 9 2 2 0 , 3 2 9 , 1 5 1 1 4 , 2 6 5 , 5 3 3(Allowance for possible loan losses) ( 8 2 1 , 1 7 1 ) ( 6 5 5 , 0 9 6 ) ( 6 5 1 , 8 7 8 ) ( 5 2 0 , 0 4 1 )(Present value discounts) ( 4 8 , 5 9 8 ) ( 2 4 , 5 9 0 ) ( 3 8 , 5 7 9 ) ( 1 9 , 5 2 0 )
Property, plant and equipment (Note 8) 5 5 8 , 4 8 5 5 0 9 , 2 5 6 4 4 3 , 3 4 7 4 0 4 , 2 6 7(Accumulated depreciation) ( 1 5 8 , 3 1 8 ) ( 1 3 7 , 7 6 2 ) ( 1 2 5 , 6 7 9 ) ( 1 0 9 , 3 6 1 )
Intangible assets (Note 8) 6 7 8 2 6 6 5 3 8 2 1 1Guarantee deposits 3 0 2 , 1 8 1 2 9 9 , 1 1 5 2 3 9 , 8 8 3 2 3 7 , 4 4 9Accounts receivable 2 0 9 , 8 0 5 9 , 8 5 3 1 6 6 , 5 5 2 7 , 8 2 2Accrued income 4 4 1 , 5 2 7 5 4 7 , 7 4 9 3 5 0 , 5 0 2 4 3 4 , 8 2 5Prepaid expenses 3 6 2 , 6 1 0 1 5 3 , 6 2 7 2 8 7 , 8 5 5 1 2 1 , 9 5 5Deferred income tax assets (Note 21) 1 2 6 , 0 1 7 5 5 , 8 5 1 1 0 0 , 0 3 7 4 4 , 3 3 6O t h e r 1 7 9 , 4 1 1 2 2 7 , 3 3 9 1 4 2 , 4 2 2 1 8 0 , 4 7 2
Total assets W 4 1 , 7 7 4 , 1 4 9 W 3 2 , 3 7 8 , 5 3 6 $ 3 3 , 1 6 1 , 9 8 2 $ 2 5 , 7 0 3 , 3 7 1
Liabilities and Stockholders' EquityDeposits (Note 9) W 2 8 , 7 5 3 , 2 8 9 W 2 3 , 0 1 9 , 7 2 4 $ 2 2 , 8 2 5 , 5 0 5 $ 1 8 , 2 7 3 , 9 7 3Call money 3 3 5 , 5 5 3 1 2 2 , 7 3 5 2 6 6 , 3 7 5 9 7 , 4 3 2Borrowings (Note 10) 2 , 6 6 3 , 8 5 7 2 , 8 0 4 , 6 6 4 2 , 1 1 4 , 6 7 6 2 , 2 2 6 , 4 5 4Bonds sold on repurchase agreements 1 , 3 5 9 , 7 0 5 1 , 0 4 0 , 0 1 3 1 , 0 7 9 , 3 8 8 8 2 5 , 6 0 4Bills sold 2 , 4 0 9 , 5 1 1 6 8 1 , 5 0 4 1 , 9 1 2 , 7 6 6 5 4 1 , 0 0 5Due to Bank of Korea in foreign currencies 2 3 7 , 1 5 5 4 1 5 , 5 3 7 1 8 8 , 2 6 3 3 2 9 , 8 7 0Debentures (Note 11) 1 , 7 7 1 , 0 6 6 9 2 0 , 4 1 1 1 , 4 0 5 , 9 4 3 7 3 0 , 6 5 9Reserve for possible losses of
acceptances and guarantees (Note 12) 4 0 , 0 0 1 4 9 , 9 1 4 3 1 , 7 5 4 3 9 , 6 2 4Due to trust accounts 8 0 6 , 9 4 8 3 7 2 , 3 2 3 6 4 0 , 5 8 7 2 9 5 , 5 6 4Unearned income 1 1 0 , 5 5 6 1 0 4 , 8 6 2 8 7 , 7 6 4 8 3 , 2 4 3Accrued expenses 8 9 6 , 8 2 2 7 1 5 , 1 9 7 7 1 1 , 9 3 3 5 6 7 , 7 5 2Accounts payable 2 1 1 , 8 4 2 1 9 , 4 9 1 1 6 8 , 1 6 9 1 5 , 4 7 2O t h e r 4 1 9 , 4 4 9 3 4 6 , 6 0 2 3 3 2 , 9 7 5 2 7 5 , 1 4 8
Total liabilities 4 0 , 0 1 5 , 7 5 4 3 0 , 6 1 2 , 9 7 7 3 1 , 7 6 6 , 0 9 8 2 4 , 3 0 1 , 8 0 0
Commitments and contingencies (Note 14)
Common stock, par value : W5,000, authorized : 500 million shares, issuedand outstanding : 124,363,180 shares in 2000 and 110,163,180 shares in 1999 (Notes 1 and 15) 6 2 1 , 8 1 6 5 5 0 , 8 1 6 4 9 3 , 6 2 2 4 3 7 , 2 6 0
Preferred stock, par value : W5,000,non-cumulative, non-participating preferred stock authorized : 250 million shares, issued and outstanding : 67,081,000 shares in 2000 and 94,560,000 shares in 1999 (Note 1 and 15) 3 3 5 , 4 0 5 4 7 2 , 8 0 0 2 6 6 , 2 5 8 3 7 5 , 3 2 7
Capital surplus (Note 16) 4 0 0 , 7 9 7 3 4 5 , 7 8 4 3 1 8 , 1 6 9 2 7 4 , 4 9 7Retained earnings (Note 17) 3 6 3 , 9 3 8 4 1 2 , 2 3 9 2 8 8 , 9 0 8 3 2 7 , 2 5 2Capital adjustments (Note 6) 3 6 , 4 3 9 ( 1 6 , 0 8 0 ) 2 8 , 9 2 7 ( 1 2 , 7 6 5 )
Total shareholders' equity 1 , 7 5 8 , 3 9 5 1 , 7 6 5 , 5 5 9 1 , 3 9 5 , 8 8 4 1 , 4 0 1 , 5 7 1
Total liabilities and shareholders' equity W 4 1 , 7 7 4 , 1 4 9 W 3 2 , 3 7 8 , 5 3 6 $ 3 3 , 1 6 1 , 9 8 2 $ 2 5 , 7 0 3 , 3 7 1
2000 1999 2000 1999
The accompanying notes are an integral part of the financial statements.
N O N - C O N S O L I D ATED BALANCE SHEETS (Banking Accounts)As of December 31, 2000 and 1999

FINANCIAL STATEMENTS 39Hana Bank Annual Report 2000
N O N - C O N S O L I D ATED STATEMENTS OF INCOME (Banking Accounts)For the years ended December 31, 2000 and 1999
In Millions of Korean Won In Thousands of U.S. Dollars (Note 3)
Operating revenueInterest income :
Interest on due from banks W 1 4 5 , 3 2 2 W 1 8 4 , 8 8 9 $ 1 1 5 , 3 6 2 $ 1 4 6 , 7 7 2Interest on securities 9 3 7 , 5 6 6 6 9 2 , 2 8 0 7 4 4 , 2 7 7 5 4 9 , 5 5 9Interest on loans 1 , 8 5 0 , 9 7 6 1 , 3 6 9 , 8 2 4 1 , 4 6 9 , 3 7 8 1 , 0 8 7 , 4 2 0O t h e r 2 0 , 9 6 0 2 9 , 6 4 8 1 6 , 6 3 9 2 3 , 5 3 5
2 , 9 5 4 , 8 2 4 2 , 2 7 6 , 6 4 1 2 , 3 4 5 , 6 5 6 1 , 8 0 7 , 2 8 6Commission income 1 4 7 , 8 0 9 1 0 6 , 1 5 1 1 1 7 , 3 3 7 8 4 , 2 6 7Other operating income :
Gain on disposition of trading securities 2 5 , 7 7 7 6 5 , 4 2 8 2 0 , 4 6 3 5 1 , 9 3 9Gain on valuation of trading securities 7 4 0 5 , 4 8 8 5 8 7 4 , 3 5 7Dividend on securities 8 , 3 8 9 3 , 2 6 9 6 , 6 5 9 2 , 5 9 5Gain on foreign currency trading 1 9 4 , 3 8 7 7 9 , 4 8 1 1 5 4 , 3 1 2 6 3 , 0 9 5Fees from trust accounts 1 6 3 , 0 2 4 1 7 1 , 5 6 2 1 2 9 , 4 1 5 1 3 6 , 1 9 3O t h e r 1 1 5 , 6 8 1 2 0 , 6 0 0 9 1 , 8 3 2 1 6 , 3 5 3
5 0 7 , 9 9 8 3 4 5 , 8 2 8 4 0 3 , 2 6 8 2 7 4 , 5 3 2
3 , 6 1 0 , 6 3 1 2 , 7 2 8 , 6 2 0 2 , 8 6 6 , 2 6 1 2 , 1 6 6 , 0 8 5Operating expense
Interest expenses :Interest on deposits W 1 , 6 2 2 , 6 2 7 W 1 , 2 6 9 , 8 9 6 $ 1 , 2 8 8 , 1 0 6 $ 1 , 0 0 8 , 0 9 4Interest on borrowings 4 6 6 , 9 5 8 3 5 1 , 7 5 7 3 7 0 , 6 9 0 2 7 9 , 2 3 9Interest on debentures 1 4 2 , 2 1 1 8 7 , 2 5 3 1 1 2 , 8 9 3 6 9 , 2 6 5O t h e r 2 9 , 4 2 6 4 4 , 7 8 3 2 3 , 3 5 9 3 5 , 5 5 0
2 , 2 6 1 , 2 2 2 1 , 7 5 3 , 6 8 9 1 , 7 9 5 , 0 4 8 1 , 3 9 2 , 1 4 8Commission expenses 3 2 , 6 0 2 2 5 , 7 7 1 2 5 , 8 8 1 2 0 , 4 5 8Other operating expenses :
Loss on disposition of trading securities 3 7 , 5 6 2 1 7 , 4 2 8 2 9 , 8 1 8 1 3 , 8 3 5Loss on valuation of trading securities 1 6 , 4 9 1 6 , 7 7 2 1 3 , 0 9 1 5 , 3 7 6Loss on foreign currency trading 1 7 9 , 4 9 8 5 2 , 9 5 1 1 4 2 , 4 9 3 4 2 , 0 3 5Bad debt expense 5 3 4 , 2 3 6 4 0 6 , 4 6 0 4 2 4 , 0 9 8 3 2 2 , 6 6 4O t h e r 2 6 9 , 9 4 3 8 5 , 6 2 3 2 1 4 , 2 9 0 6 7 , 9 7 0
1 , 0 3 7 , 7 3 0 5 6 9 , 2 3 4 8 2 3 , 7 9 0 4 5 1 , 8 8 0General and administrative expenses (Note 19) 3 4 0 , 6 3 3 2 9 8 , 9 7 6 2 7 0 , 4 0 8 2 3 7 , 3 3 9
3 , 6 7 2 , 1 8 7 2 , 6 4 7 , 6 7 0 2 , 9 1 5 , 1 2 7 2 , 1 0 1 , 8 2 5
Operating income (loss) ( 6 1 , 5 5 6 ) 8 0 , 9 5 0 ( 4 8 , 8 6 6 ) 6 4 , 2 6 0
Non-operating income (Note 20) 1 9 4 , 2 8 4 1 8 2 , 6 6 5 1 5 4 , 2 3 1 1 4 5 , 0 0 7Non-operating expenses (Note 20) 1 1 5 , 4 8 6 5 1 , 3 8 2 9 1 , 6 7 8 4 0 , 7 8 9
Ordinary income 1 7 , 2 4 2 2 1 2 , 2 3 3 1 3 , 6 8 7 1 6 8 , 4 7 8
Extraordinary gain 1 5 , 8 3 6 - 1 2 , 5 7 2 - Extraordinary losses - - - -
Income before income taxes 3 3 , 0 7 8 2 1 2 , 2 3 3 2 6 , 2 5 9 1 6 8 , 4 7 8
Income tax expense (Note 21) 1 2 , 5 7 7 6 7 , 9 1 1 9 , 9 8 4 5 3 , 9 1 0
Net income (Note 22) W 2 0 , 5 0 1 W 1 4 4 , 3 2 2 $ 1 6 , 2 7 5 $ 1 1 4 , 5 6 8
(Ordinary income per share : for current year :W43, for prior year :W1,353Earning per share for current year :W124, for prior year :W1,353Diluted ordinary income earnings per share for current year W42, for prior year :W736 Diluted earnings per share for current year :W109, for prior year W736)
2000 1999 2000 1999
The accompanying notes are an integral part of the financial statements.

40 FINANCIAL STATEMENTSHana Bank Annual Report 2000
In Millions of Korean Won In Thousands of U.S. Dollars (Note 3)
2000 1999 2000 1999
The accompanying notes are an integral part of the financial statements.
Unappropriated retained earnings at end of year
Carried over from prior year W 1 4 0 W 1 4 3 $ 1 1 1 $ 1 1 4Cumulative effect from accounting changes (Note 17) ( 3 8 , 3 6 9 ) ( 6 3 , 4 9 9 ) ( 3 0 , 4 5 9 ) ( 5 0 , 4 0 8 )Prior period adjustments, net (Note 17) - 1 , 0 2 5 - 8 1 4Net income 2 0 , 5 0 1 1 4 4 , 3 2 2 1 6 , 2 7 5 1 1 4 , 5 6 8
( 1 7 , 7 2 8 ) 8 1 , 9 9 1 ( 1 4 , 0 7 3 ) 6 5 , 0 8 8
Transfer from voluntary reserves
Reserve for overseas investment 1 2 , 2 0 0 - 9 , 6 8 5 - Reserve for future dividends 3 8 , 2 0 0 - 3 0 , 3 2 4 -
5 0 , 4 0 0 - 4 0 , 0 0 9 -
Appropriations of retained earnings
Legal reserve 2 , 1 0 0 1 4 , 5 0 0 1 , 6 6 7 1 1 , 5 1 1Reserve for business rationalization - 6 3 - 5 0Reserve for future dividends - 9 , 0 0 0 - 7 , 1 4 5General purpose contingency reserve - 6 , 2 0 0 - 4 , 9 2 1Cash dividends
(4% for common stock and 1% or 2% for preferred stock in 2000.8% for common stock and 1% or 2% for preferred stock in 1999.) 3 0 , 4 3 4 5 2 , 0 8 8 2 4 , 1 6 0 4 1 , 3 5 0
3 2 , 5 3 4 8 1 , 8 5 1 2 5 , 8 2 7 6 4 , 9 7 7Unappropriated retained earnings to be
carried over to subsequent year W 1 3 8 W 1 4 0 $ 1 0 9 $ 1 1 1
N O N - C O N S O L I D ATED STATEMENTS OF APPROPRIATIONS OF RETAINED EARNINGS (Banking Accounts)For the years ended December 31, 2000 and 1999Dates of Appropriation : March 10, 2001 and March 20, 2000

FINANCIAL STATEMENTS 41Hana Bank Annual Report 2000
N O N - C O N S O L I D ATED STATEMENTS OF CASH FLOWS (Banking Accounts)For the years ended December 31, 2000 and 1999
In Millions of Korean Won In Thousands of U.S. Dollars (Note 3)
Cash provided from operating activities :
Net income W 2 0 , 5 0 1 W 1 4 4 , 3 2 2 $ 1 6 , 2 7 5 $ 1 1 4 , 5 6 8
Items not affecting operating cash flows :
Depreciation and amortization 3 8 , 9 6 3 3 2 , 2 9 2 3 0 , 9 3 0 2 5 , 6 3 5Provision for possible loan losses 5 3 4 , 2 3 6 4 0 6 , 4 6 0 4 2 4 , 0 9 8 3 2 2 , 6 6 4Provision for severance benefits 1 2 , 0 7 7 8 , 5 6 3 9 , 5 8 7 6 , 7 9 8Unrealized gain on securities, net 7 8 , 7 6 0 ( 5 2 , 3 1 8 ) 6 2 , 5 2 3 ( 4 1 , 5 3 2 )Gain on securities transactions, net ( 1 3 0 , 1 9 0 ) ( 1 1 3 , 8 4 0 ) ( 1 0 3 , 3 5 0 ) ( 9 0 , 3 7 1 )Reversal of reserve for possible losses
on acceptances and guarantees ( 1 2 , 6 2 8 ) ( 1 0 , 7 1 1 ) ( 1 0 , 0 2 4 ) ( 8 , 5 0 3 )Payment of retirement benefits ( 1 , 5 9 4 ) ( 1 , 1 7 9 ) ( 1 , 2 6 5 ) ( 9 3 6 )Gain on sales of loans, net 4 , 7 6 3 ( 9 , 3 4 7 ) 3 , 7 8 1 ( 7 , 4 2 0 )Changes in accrual basis accounts, net ( 2 , 3 7 8 , 2 7 3 ) 5 9 5 , 6 8 2 ( 1 , 8 8 7 , 9 6 8 ) 4 7 2 , 8 7 6O t h e r ( 1 5 , 9 1 5 ) 1 1 2 , 9 2 7 ( 1 2 , 6 3 5 ) 8 9 , 6 4 6
W ( 1 , 8 4 9 , 3 0 0 ) W 1 , 1 1 2 , 8 5 1 $ ( 1 , 4 6 8 , 0 4 8 ) $ 8 8 3 , 4 2 5Cash flows from investing activities :
Increase in trading securities W ( 3 , 1 4 4 ) W ( 2 3 2 , 5 2 3 ) $ ( 2 , 4 9 6 ) $ ( 1 8 4 , 5 8 6 )Increase in investment securities ( 1 , 9 9 9 , 7 0 3 ) ( 5 4 , 1 7 9 ) ( 1 , 5 8 7 , 4 4 4 ) ( 4 3 , 0 0 9 )Increase in property, plant and equipment ( 6 7 , 3 9 3 ) ( 1 4 3 , 2 6 3 ) ( 5 3 , 4 9 9 ) ( 1 1 3 , 7 2 8 )Decrease (increase) in intangible assets ( 5 3 8 ) 6 , 1 8 8 ( 4 2 7 ) 4 , 9 1 2Decrease (increase) in guarantee deposits ( 3 , 0 6 6 ) 8 , 7 0 6 ( 2 , 4 3 4 ) 6 , 9 1 1Decrease (increase) in accounts receivable ( 1 9 9 , 9 5 2 ) 8 5 , 3 9 1 ( 1 5 8 , 7 3 0 ) 6 7 , 7 8 7Cash inflows from business combination - 4 9 2 , 5 9 2 - 3 9 1 , 0 3 9Other - 1 6 - 1 3
( 2 , 2 7 3 , 7 9 6 ) 1 6 2 , 9 2 8 ( 1 , 8 0 5 , 0 3 0 ) 1 2 9 , 3 3 9Cash flows from financing activities:
Increase (decrease)in borrowings ( 1 4 0 , 8 0 7 ) 4 8 7 , 2 5 2 ( 1 1 1 , 7 7 8 ) 3 8 6 , 8 0 0Increase in bills sold 1 , 7 2 8 , 0 0 7 3 0 2 , 8 5 9 1 , 3 7 1 , 7 6 1 2 4 0 , 4 2 1Increase (decrease) in debentures 8 4 7 , 6 3 8 ( 2 0 , 3 3 7 ) 6 7 2 , 8 8 9 ( 1 6 , 1 4 4 )Increase in foreign exchanges payable 4 2 , 2 5 0 1 3 , 4 0 3 3 3 , 5 4 0 1 0 , 6 4 0Issuance of new stock for cash 1 2 6 , 0 1 3 2 2 8 , 4 2 4 1 0 0 , 0 3 4 1 8 1 , 3 3 2Increase (decrease) in bonds sold
under repurchase agreements 3 1 9 , 6 9 2 ( 4 6 , 4 6 4 ) 2 5 3 , 7 8 4 ( 3 6 , 8 8 5 )Decrease in due to Bank of
Korea in foreign currencies ( 1 7 8 , 3 8 2 ) ( 3 7 3 , 0 4 9 ) ( 1 4 1 , 6 0 7 ) ( 2 9 6 , 1 4 1 )Increase (decrease) in call money 2 1 2 , 8 1 8 ( 3 0 1 , 2 1 9 ) 1 6 8 , 9 4 3 ( 2 3 9 , 1 2 0 )Increase (decrease) in due to trust accounts 3 9 6 , 1 6 8 ( 2 7 5 , 2 1 2 ) 3 1 4 , 4 9 4 ( 2 1 8 , 4 7 4 )Increase (decrease) in accounts payable 1 9 2 , 3 5 1 ( 1 0 1 , 7 5 4 ) 1 5 2 , 6 9 7 ( 8 0 , 7 7 6 )Cash dividends ( 5 2 , 0 8 8 ) ( 2 7 , 9 5 5 ) ( 4 1 , 3 5 0 ) ( 2 2 , 1 9 2 )O t h e r 9 , 3 5 7 ( 1 1 2 , 8 4 5 ) 7 , 4 2 8 ( 8 9 , 5 8 1 )
3 , 5 0 3 , 0 1 7 ( 2 2 6 , 8 9 7 ) 2 , 7 8 0 , 8 3 5 ( 1 8 0 , 1 2 0 )
Net increase in cash ( 6 2 0 , 0 7 9 ) 1 , 0 4 8 , 8 8 2 ( 4 9 2 , 2 4 3 ) 8 3 2 , 6 4 4Cash and cash equivalents at beginning of the year 3 , 7 1 4 , 4 7 6 2 , 6 6 5 , 5 9 4 2 , 9 4 8 , 6 9 9 2 , 1 1 6 , 0 5 5
Cash and cash equivalents at end of the year W 3 , 0 9 4 , 3 9 7 W 3 , 7 1 4 , 4 7 6 $ 2 , 4 5 6 , 4 5 6 $ 2 , 9 4 8 , 6 9 9
C a s h 7 5 4 , 1 4 4 9 8 0 , 2 6 0 5 9 8 , 6 7 0 7 7 8 , 1 6 9Foreign currencies 3 4 , 0 5 8 2 4 , 2 2 0 2 7 , 0 3 7 1 9 , 2 2 7Due from Banks 1 , 7 9 3 , 8 9 5 2 , 4 6 8 , 7 4 0 1 , 4 2 4 , 0 6 5 1 , 9 5 9 , 7 8 4Due from Banks in foreign currencies 5 1 2 , 3 0 0 2 4 1 , 2 5 6 4 0 6 , 6 8 4 1 9 1 , 5 1 9
2000 1999 2000 1999
The accompanying notes are an integral part of the financial statements.

42 FINANCIAL STATEMENTSHana Bank Annual Report 2000
N O N - C O N S O L I D ATED NOTES TO FINANCIAL STATEMENTS December 31, 2000 and 1999
1. The Bank:
Hana Bank ("the Bank") was incorporated in 1971 as Korea Investment and Finance Corporation under the Commercial Code of the Republic ofKorea to provide financing services as a financial intermediary. On September 20, 1972, the Bank was granted approval by the Ministry ofFinance (presently the Ministry of Finance and Economy) to operate under the short-term Financing Business Law.
On June 29, 1991, the Bank was granted approval by the Ministry of Finance to engage in banking activities and the Bank's name was changedto Hana Bank. It became a nationwide commercial bank in July 1991.
On June 29, 1998, the Bank purchased certain assets and assumed most of the liabilities of Choong-Chung Bank by the order of the FinancialSupervisory Commission (Note 26) . As of January 1, 1999, the Bank completed a merger with Boram Bank (Note 27).
The Bank is engaged in the commercial banking business under the Banking Act, in the trust business under the Trust Business Act, in theforeign exchange transaction business and in other related businesses.
On June 5, 1972, the Bank listed its shares on the Korean Stock Exchange. On February 12, 1973, the Bank was registered as a foreign capitalinvested company under the Foreign Capital Inducement Law. The Bank's common stock and preferred stock outstanding as of December 31,2000 are W621,816 million and W335,405 million, respectively.
In accordance with its Articles of Incorporation, the Bank is authorized to issue convertible bonds and bonds with stock warrants to investorsother than shareholders in amounts up to W200 billion each. As of December 31, 2000 and 1999, the Bank has issued convertible bonds in theamount of W88 billion and W84 billion, respectively (see note 11).
2. Summary of Significant Accounting Policies:
The significant accounting policies followed by the Bank in the preparation of its financial statements are summarized below.
Basis of Financial Statement Presentation
The official accounting records of the Bank are maintained in Korean won in accordance with the relevant laws and regulations of theRepublic of Korea.
The Bank operates both a commercial banking business and a trust business in which the Bank, as a fiduciary, holds and manages the propertyof others. Under the Trust Business Act, the trust funds are accounted for and reported separately from the Bank's own commercial bankingb u s i n e s s .
The accompanying financial statements have been extracted from the Bank's Korean language financial statements that were prepared usingaccounting principles, procedures and reporting practices generally accepted in the Republic of Korea. These standards vary fromInternational Accounting Standards and the accounting principles generally accepted in the country of the reader. The financial statementshave been translated from Korean into English, and have been formatted in a manner different from the presentation under Korean financialstatement practices. Certain supplementary information included in the Korean language statutory financial statements, but not required forthe fair presentation of the Bank's financial position or results of operations, is not presented in the accompanying financial statements.Accordingly, the accompanying financial statements are not intended to present the financial position, results of operations and cash flows inaccordance with accounting principles and practices generally accepted in countries and jurisdictions other than Korea.
The preparation of financial statements in conformity with financial accounting standards requires management to make estimates andassumptions that affect the reported amounts of assets and liabilities at the date of the financial statements, and the reported amounts ofrevenues and expenses during the reporting period. Due to the inherent uncertainty involved in making estimates, actual results could differfrom those estimates.
Accounting Changes
During 1999, the Bank changed the methods of accounting and presentation of financial statements in accordance with revised financialaccounting standards. The accounting changes include accounting treatments for the allowance for possible loan losses, valuation ofsecurities, valuation of receivables under troubled debt restructuring, allowance for possible losses of guarantees and acceptances, deferredtaxes, prior period adjustments, and stock issuance costs.
The cumulative effects on assets and liabilities arising as a result of the adoption of revised financial standards were W38,369 million andW63,499 million in 2000 and 1999, respectively. The changes were added to or deducted from beginning retained earnings or capitaladjustments pursuant to the addendum to the revised financial accounting standards.
Recognition of Interest Income
Interest income on loans and investments is recognized on an accrual basis. However, interest income on overdue or dishonored loans isrecognized on a cash basis, except for those secured and guaranteed by financial institutions. As of December 31, 2000 and 1999, accruedinterest income not recognized in the financial statements were W73,596 million and W94,831 million, respectively.

N O N - C O N S O L I D ATED NOTES TO FINANCIAL STATEMENTS December 31, 2000 and 1999
N O N - C O N S O L I D ATED NOTES TO FINANCIAL STAT E M E N T SDecember 31, 2000 and 1999
Allowance for possible loan losses
From 1999, the Bank adopted a method of corporate loan classification for calculating the allowance for possible loan losses by incorporating theborrowers' future debt service capacity ("Forward Looking Criteria (FLC)"). This credit rating model considers the financial and non-financialfactors of borrowers and classifies borrowers' credit risk by thirteen ratings (1,2,3,4,5,6,7+,7,8+,8,9,10+,10). Provisions are determined by applyingthe following minimum percentages to the various credit ratings:
Credit ratings Loan classifications Provision percentages
1 ~ 8+ N o r m a l 0 ~ 1.2%8 P r e c a u t i o n a r y 2 %9 S u b s t a n d a r d 2 0 %
1 0 + D o u b t f u l 5 0 %1 0 Estimated loss 1 0 0 %
Household and credit card loans are classified based on the delinquent periods, value of collateral, and reasonably estimated collectibility.
Securities
All securities are initially carried at cost including incidental expenses, determined by the moving average method.
Marketable securities held for short-term capital gain purposes are classified as trading securities. Other securities are classified as investments e c u r i t i e s .
Trading securities
Trading securities are marketable securities held for short-term trading and carried at their market values at the balance sheet date. Unrealizedgains and losses on trading securities are included in current operations.
Investment securities
Investments in marketable equity securities of non-controlled investees are carried at fair value. Temporary changes in fair value are accountedfor in the capital adjustment account, a component of stockholders' equity. Declines in fair value which are anticipated to be permanent arerecorded in current operations after eliminating any previously recorded capital adjustment for temporary changes. Subsequent recoveries orother future changes in fair value are recorded in current operations up to the original book value before decline.
Investments in non-marketable equity securities of non-controlled investees are carried at cost, except for declines in the Bank's proportionateownership of the underlying book value of the investee which are anticipated to be permanent, which are recorded in current operations. Theamounts of such losses recognized for the years ended December 31, 2000 and 1999 are W39,633 and W8,203 million, respectively. Subsequentrecoveries are also recorded in current operations up to the original cost of the investment.
Investments in equity securities of companies over which the Bank exerts significant control or influence (controlled investees) are recordedusing the equity method. Differences between the initial purchase price and the Bank's initial proportionate ownership of the net book value ofthe investee are amortized over 20 years or less using the straight-line method. Under the equity method, the Bank records changes in itsproportionate ownership of the book value of the investee as current operations, capital adjustments or adjustments to retained earnings,depending on the nature of the underlying change in book value of the investee.
Premiums and discounts on debt securities are amortized over the life of the debt using the effective interest method. Investments in debtsecurities which the Bank has the intent and ability to hold to maturity are generally carried at cost, adjusted for the amortization of discounts orpremiums (amortized cost). Declines in the fair value of debt securities which are anticipated to be permanent are recorded in currentoperations. The amounts of such losses recognized for the years ended December 31, 2000 and 1999 are W16,200 million and W10,357 million,respectively. Subsequent recoveries are also recorded in current operations up to the amortized cost of the investment.
Other investments in debt securities are carried at fair value. Temporary differences between fair value and amortized cost are accounted for inthe capital adjustment account. Declines in fair value which are anticipated to be permanent are recorded in current operations after eliminatingany previously recorded capital adjustment for temporary changes. Subsequent recoveries or other future changes in fair value are recorded inthe capital adjustment account.
Property, plant and Equipment
Property, plant and equipment are recorded at cost. Routine maintenance and repairs are charged to expense as incurred. Expenditure thatenhances the value or extends the useful economic life of the facilities involved is treated as additions to property, plant and equipment.
Depreciation is computed using the declining-balance method (the straight-line method for buildings) over the estimated useful lives of the assetsas described below.
Estimated Useful Life-years
Buildings, structures and Auxiliary facilities 5 0Vehicles, furniture and Fixtures 5Structures in leased offices used for business purposes 5
FINANCIAL STATEMENTS 43Hana Bank Annual Report 2000

N O N - C O N S O L I D ATED NOTES TO FINANCIAL STAT E M E N T SDecember 31, 2000 and 1999
Intangible Assets
Trademarks and goodwill are stated at cost, net of accumulated amortization. Goodwill and trademarks are amortized using the straight-linemethod over five and ten years, respectively.
Present Value Discounts
If the present value of a loan is different from the book value due to the rescheduling of terms as agreed by the related parties (as in the case ofcourt receivership, court mediation or workout), the present value discount on the loan is offset against the allowance for possible loan losses, ifavailable, or charged to current expenses.
The difference between book value and present value is recorded as 'present value discounts' in the balance sheet and amortized to currentearnings over the related period using the effective interest rate method.
New Stock Issuance Costs and Debenture Issuance Costs
Effective January 1, 1999, pursuant to the revised financial accounting standards, new stock issuance costs and debenture issuance costs, whichhad been previously recorded as deferred charges are deducted from paid-in capital in excess of par value and the amounts of debenture issuance,respectively. Debenture issuance costs are amortized as interest expense over the redemption term using the effective interest rate method.
Foreign Currency Translation
Assets and liabilities denominated in foreign currencies are translated into Korean won using the exchange rates of W1,259.70:US$1 andW1,145.40:US$1 in effect as of December 31, 2000 and 1999, respectively. Resulting translation gains and losses are charged to currento p e r a t i o n s .
Bonds Purchased Under Resale Agreements and Bonds Sold Under Repurchase Agreements
Bonds purchased under resale agreements and bonds sold under repurchase agreements are included in assets and liabilities in theaccompanying balance sheet.
Accrued Severance Benefits
Directors and employees with more than one year of service are entitled to receive a lump-sum payment upon termination of their employmentwith the Bank, based on their length of service and rate of pay at the time of termination. Accrued severance benefits represent the amounts tobe paid if all eligible employees and directors were to terminate their employment as of the balance sheet date. Actual payments of severancebenefits for the years ended December 31, 2000 and 1999 were W1,594 million and W1,179 million, respectively.
Reserve for Possible Losses on Acceptances and Guarantees
Acceptances and guarantees outstanding do not appear on the balance sheet, but are presented as off-balance sheet items in the notes to thefinancial statements.
The Bank provides a minimum provision of 20% of guaranteed amounts for companies classified as "substandard," 50% for "doubtful," and 100%for "estimated loss." The Bank records the provision as a reserve for possible losses on acceptances and guarantees in the liabilities section ofthe balance sheet.
Income Tax Expenses
Pursuant to revised financial accounting standards generally accepted in the Republic of Korea, the Bank changed its method of accounting forincome tax expenses from the current income tax method to the deferred tax method in 1999.
Deferred taxes represent the tax effects of the different tax and financial account bases of assets and liabilities, and are recorded at enacted taxrates which are expected to be in effect when the temporary differences reverse. The provision for income taxes represents taxes currentlypayable for the year plus the change in the net deferred tax balance from the previous balance sheet date. Valuation allowances are establishedwhen necessary to reduce deferred tax assets to the amount expected to be realized.
Gain (Loss) on Prior Period Adjustments
Prior period adjustments are charged to retained earnings carried over from prior year.
Derivative Financial Instruments
Derivative financial instruments include futures, forwards and swap contracts, and are principally linked to interest rates, foreign currencyexchange rates or equity indices.
In accordance with revised financial accounting standards related to derivatives accounting, effective January 1, 2000, the Bank recorded thefair values of rights and obligations related to derivatives contracts on the balance sheet as assets and liabilities and recognized the relatedgains or losses in the income statement. However, the effective portions of the unrealized gains or losses arising from "cash flow" hedgederivative financial instruments are deferred and recorded in capital adjustments.
Translation of Financial Statements of Overseas Branches
Accounts and records of the overseas branches are maintained in foreign currencies. In translating financial statements of overseas branches,the Bank applied the appropriate rate of exchange at balance sheet date.
44 FINANCIAL STATEMENTSHana Bank Annual Report 2000

N O N - C O N S O L I D ATED NOTES TO FINANCIAL STATEMENTS December 31, 2000 and 1999
FINANCIAL STATEMENTS 45Hana Bank Annual Report 2000
Stock Options
The Bank applies the fair value method in calculation of fair value of stock options and allocates it over the period from the option grant date tothe exercise date and charges it to operations.
3. United States Dollar Amounts :
The Bank operates primarily in Korean won and its official accounting records are maintained in Korean won. The U.S. dollar amounts areprovided herein as supplementary information solely for the convenience of the reader. All won amounts are expressed in U.S. dollars at therate of W1,259.7:US$1, the base exchange rate on December 31, 2000. This presentation is not required by or in accordance with Korean orUnited States generally accepted accounting principles, and should not be constructed as a representation that the Won amounts showncould be converted in or settled in U.S. dollars at this or any other rate.
The 1999 U.S. dollar amounts, which had been previously expressed at the rate published on December 31, 1999, have been restated to reflectthe exchange rate in effect on December 31, 2000.
4. Cash and Due from Banks :
Cash and due from banks as of December 31, 2000 and 1999 are summarized as follows :
Due from banks in Won currency at December 31, 2000 and 1999 comprise of the following :
Checking accounts deposited in the Bank of Korea represent reserves required and restricted for the payment of deposits under the Bank ofKorea Act. Furthermore, as of December 31, 2000 and 1999, W581 million and W646 million respectively, of other deposits are restricted as towithdrawal under agreements with counterparties.
Due from banks in foreign currencies as of December 31, 2000 and 1999 comprise the following :
As of December 31, 2000 and 1999, W30,426 and W29,133 million respectively, of checking accounts are deposits reserved at the Bank of Koreaunder the Bank of Korea Act for the settlement with foreign banks. Furthermore, W8,235 million of other deposits in foreign currencies as ofDecember 31, 1999 are restricted as to withdrawal under the agreements with counterparties.
Millions of Won
Cash on hand W 7 5 4 , 1 4 4 W 9 8 0 , 2 6 0Foreign currencies 34,058 2 4 , 2 2 0Due from banks in Won 1,793,895 2 , 4 6 8 , 7 4 0Due from banks in foreign currencies 512,300 2 4 1 , 2 5 6
W 3,094,397 W 3 , 7 1 4 , 4 7 6
2000 1999
Millions of Won
Checking accounts - Bank of Korea W 7 4 0 , 6 6 8 W 4 8 9 , 3 7 5Certificates of deposits 6.9 ~ 7.8 Other Banks 7 9 0 , 6 9 4 1 , 2 0 0 , 2 9 5Time deposits 7.0 ~ 8.5 Other financial
I n s t i t u t i o n s 2 2 , 4 7 2 7 0 9 , 9 1 7Other deposits 0.0 ~ 10.1 Other financial
I n s t i t u t i o n s 2 4 0 , 0 6 1 6 9 , 1 5 3
W 1 , 7 9 3 , 8 9 5 W 2 , 4 6 8 , 7 4 0
Annual interestrate (%) of 2000 Depository 2000 1999
Millions of Won
Checking accounts - Foreign Banks W 1 7 2 , 4 9 6 W 8 4 , 1 0 7Time deposits 7 . 4 7 Domestic Banks 3 3 9 , 8 0 4 1 4 8 , 9 1 4Other deposits in Foreign currencies 6 . 4 9 Foreign Banks - 8 , 2 3 5
W 5 1 2 , 3 0 0 W 2 4 1 , 2 5 6
Annual averageinterest rate
of 2000 Depository 2000 1999

N O N - C O N S O L I D ATED NOTES TO FINANCIAL STAT E M E N T SDecember 31, 2000 and 1999
46 FINANCIAL STATEMENTSHana Bank Annual Report 2000
The term structures of due from banks outstanding at December 31, 2000 and 1999 are as follows (millions of Won) :
1) As of December 31, 2000
2) As of December 31, 1999
5. Trading Securities:
Trading securities as of December 31, 2000 and 1999 comprise the following (millions of Won) :
1) As of December 31, 2000
2) As of December 31, 1999
(*) Acquisition cost represents prior year's closing book balances of securities or acquisition costs for securities purchased for current period.
Within 1 month W 4 4 8 , 9 6 5 W 2 6 5 , 3 9 9 W 7 1 4 , 3 6 41 ~ 3 months 4 6 4 , 5 3 0 2 2 8 , 0 0 6 6 9 2 , 5 3 63 ~ 6 months 1 0 6 , 3 4 4 1 8 , 8 9 5 1 2 5 , 2 3 96 months ~ 1 year 1 2 , 1 2 0 - 1 2 , 1 2 01 ~ 3 years 3 0 , 0 0 0 - 3 0 , 0 0 0More than 3 years 7 3 1 , 9 3 6 - 7 3 1 , 9 3 6
W 1 , 7 9 3 , 8 9 5 W 5 1 2 , 3 0 0 W 2,306,195
Term Due from Banks Due from BanksStructures In Won currency in foreign currencies Total
Within 1 month W 5 8 , 2 8 6 W 1 2 8 , 0 2 8 W 1 8 6 , 3 1 41 ~ 3 months 1 , 1 4 4 , 5 1 8 8 7 , 8 1 2 1 , 2 3 2 , 3 3 03 ~ 6 months 5 4 8 , 9 1 4 2 5 , 4 1 6 5 7 4 , 3 3 06 months ~ 1 year 1 7 3 , 1 8 1 - 1 7 3 , 1 8 11 ~ 3 years 3 0 , 1 1 6 - 3 0 , 1 1 6More than 3 years 5 1 3 , 7 2 5 - 5 1 3 , 7 2 5
W 2 , 4 6 8 , 7 4 0 W 2 4 1 , 2 5 6 W 2 , 7 0 9 , 9 9 6
Term Due from Banks Due from BanksStructures In Won currency in foreign currencies Total
Equity securities - W 6 4 , 6 1 9 W 4 8 , 3 6 9Debt securities
Government and public bonds 7 . 0 0 ~ 9 . 3 9 1 6 5 , 1 7 9 1 6 5 , 3 1 5Debentures issued by financial institutions 6 . 6 3 ~ 7 . 8 0 2 2 6 , 8 1 6 2 2 7 , 1 8 7Corporate bonds 1 . 0 0 ~ 1 0 . 0 0 1 2 3 , 2 1 6 1 2 3 , 6 1 1Securities denominated in foreign currencies 0 . 2 5 ~ 1 3 . 7 5 2 0 , 1 9 4 1 9 , 9 7 2
5 3 5 , 4 0 5 5 3 6 , 0 8 5
W 6 0 0 , 0 2 4 W 5 8 4 , 4 5 4
Annual interest Acquisition C a r r y i n gRate (%) C o s t ( * ) V a l u e
Equity securities - W 5 0 , 8 3 6 W 5 6 , 1 0 5Debt securities
Government and public bonds 4.71 ~ 8.60 3 9 1 , 3 4 3 3 8 5 , 2 1 3Debentures issued by financial institutions 6.50 ~ 14.82 1 5 6 , 4 1 0 1 5 4 , 7 5 3Corporate bonds 5.01 ~ 13.69 8 , 9 6 3 8 , 1 1 3Securities denominated in foreign currencies 8.38 ~ 9.36 4 , 6 2 3 4 , 6 6 2
5 6 1 , 3 3 9 5 5 2 , 7 4 1
W 6 1 2 , 1 7 5 W 6 0 8 , 8 4 6
Annual interest Acquisition C a r r y i n gRate (%) C o s t ( * ) V a l u e

N O N - C O N S O L I D ATED NOTES TO FINANCIAL STATEMENTS December 31, 2000 and 1999
FINANCIAL STATEMENTS 47Hana Bank Annual Report 2000
The information about trading securities by industry as of December 31, 2000 and 1999 is summarized as follows :
6. Investment Securities:
Investment securities as of December 31, 2000 and 1999 comprise the following (millions of won) :
As of December 31, 2000 , W1,763,232 million of the investment securities are restricted as collateral for borrowings from the Bank of Korea and other financial institutions.
Stocks and equity investments as of December 31, 2000 and 1999 are as follows (millions of won) :
(*) net of treasury stocks
Investment securities valued by the equity method as of December 31, 2000 are summarized as follows (millions of won) :
Financial institutions W 2 4 6 , 7 7 8 4 2 . 2 2 W 1 7 6 , 4 8 8 2 8 . 9 9Public administration 2 7 4 , 1 0 4 4 6 . 9 0 3 8 8 , 7 5 4 6 3 . 8 5M a n u f a c t u r i n g 5 6 , 0 1 7 9 . 5 8 2 4 , 4 0 0 4 . 0 1Wholesale and retail 5 , 4 3 3 0 . 9 3 1 4 , 2 9 9 2 . 3 5O t h e r 2 , 1 2 2 0 . 3 7 4 , 9 0 5 0 . 8 0
W 5 8 4 , 4 5 4 1 0 0 . 0 0 W 6 0 8 , 8 4 6 1 0 0 . 0 0
2000 1999
Industry Millions of Won Ratio(%) Millions of Won Ratio(%)
Investments using the equity methodHana Securities 5 4 . 7 7 ( * ) W 1 3 3 , 3 4 7 3 9 . 6 8 ( * ) W 9 6 , 0 6 6Korea Merchant Banking Corporation - - 2 6 . 3 6 ( * ) 4 1 , 2 9 1Hana Research 1 0 0 . 0 0 2 , 0 0 1 1 0 0 . 0 0 1 , 9 9 8Hana Risjad Finance 7 0 . 0 0 - 7 0 . 0 0 1 5 5Hana Allianz 5 0 . 0 0 1 5 , 0 0 0 - -
1 5 0 , 3 4 8 1 3 9 , 5 1 0Marketable equity securities (non-equity method) 4 8 , 3 8 4 8 0 , 6 6 8
Non-marketable equity securities (non-equity method) 9 5 , 0 8 9 8 8 , 9 1 4Other investments 1 8 , 7 4 9 1 5 7 , 1 4 7
W 3 1 2 , 5 7 0 W 4 6 6 , 2 3 9
2000 1999
Ownership (%) Carrying value Ownership (%) Carrying value
Carrying value
Current period adjustments
Stocks and equity investments - W 3 1 2 , 5 7 0 W 4 6 6 , 2 3 9Government and public bonds 5.00 - 18.40 8 1 8 , 3 5 0 1 , 4 3 6 , 4 4 2Debentures issued by financial institutions 6.35 - 17.00 4 , 6 8 3 , 8 3 9 2 , 4 3 9 , 1 0 0Corporate bonds 1.00 - 25.00 4 , 4 5 5 , 1 7 7 4 , 0 0 1 , 8 4 2Beneficiary certificates - 4 1 6 , 2 0 3 3 6 0 , 6 3 9Securities denominated in foreign currencies - 6 4 2 , 6 3 1 3 6 6 , 0 4 5O t h e r - 5 , 2 7 0 2 9 , 0 0 7
W 1 1 , 3 3 4 , 0 4 0 W 9 , 0 9 9 , 3 1 4
Annual interestrate (%) 2000 1999
Domestic subsidiariesHana Securities W 9 7 , 2 3 4 W 2 5 , 7 1 1 W 1 0 , 4 0 2 W 1 3 3 , 3 4 7Korea Merchant Banking Corporation 4 1 , 2 9 1 ( 4 1 , 2 9 1 ) - -Hana Research 1 , 9 9 8 3 - 2 , 0 0 1Hana Allianz 1 5 , 0 0 0 - - 1 5 , 0 0 0
1 5 5 , 5 2 3 ( 1 5 , 5 7 7 ) 1 0 , 4 0 2 1 5 0 , 3 4 8Overseas subsidiaryHana Risjad Finance 8 0 ( 8 0 ) - -
W 1 5 5 , 6 0 3 W ( 1 5 , 6 5 7 ) W 1 0 , 4 0 2 W 1 5 0 , 3 4 8
Acquisition Cost Gain (Loss) on equity method (*) Capital Adjustment Book value

N O N - C O N S O L I D ATED NOTES TO FINANCIAL STAT E M E N T SDecember 31, 2000 and 1999
48 FINANCIAL STATEMENTSHana Bank Annual Report 2000
During the year ended December 31, 2000, the Bank purchased W5,063 million (973,180 shares) and W7,399 million (1,594,340 shares) ofadditional preferred and common stocks of Hana Securities, respectively. The difference between the acquisition cost and the Bank'sproportionate ownership of the net book value of the investee is amortized over 5 years using the straight-line method, resulting in W3,538million of gain on equity method related to common stocks and W2,286 million of capital adjustments related to preferred stocks.
The Bank invested W15,000 million in Hana Allianz investment trust management Co. Ltd. which was established on December 14, 2000,resulting in fifty percent ownership of the company.
On November 15, 2000, Korea Merchant Bank Corporation ("KMBC"), equity investee of the Bank as of December 31, 1999, made a capitalreduction with no reimbursement as ordered by the Financial Supervisory Commission. Accordingly, the Bank charged W41,291 million of theinvestment to KMBC to operations as a loss on equity method for the year ended December 31, 2000.
In connection with the funding public capital to KMBC by the Government for restructuring, as the shareholder of KMBC, the Bank purchasedW23,000 million of security finance bonds for the Government at par value on December 22, 2000, and accounted W6,356 of the differencebetween fair value and acquisition cost of the securities to capital adjustment as a account of loss on investment securities.
Details of marketable equity securities as of December 31, 2000 comprise the following (millions of won) :
SK Securities were acquired as a result of a total return swap contract that the Boram Bank had entered into with SK Securities in 1997. TheBank is restricted as to disposition within 2 years of acquisition by the counterparty.
Details of non-marketable equity securities as of December 31, 2000 comprise the following (millions of won):
39 Shopping 2 4 0 , 0 0 0 2 , 9 1 W 1 , 2 4 2 W 3 , 3 8 4SK Securities 6 , 0 5 9 , 1 0 6 2 , 2 6 2 8 , 1 0 4 8 , 8 4 6Hankang Debt Restructuring Fund 2 , 0 8 0 , 0 0 0 1 . 6 4 1 0 , 4 0 0 5 , 6 0 6S h i n w o n 3 , 1 4 9 , 2 0 0 4 . 9 5 2 , 8 9 6 1 , 9 5 3Namkwang Engineering & Construction Co., Ltd. 3 , 0 0 0 , 0 0 0 1 7 . 9 6 1 5 , 0 0 0 2 , 6 1 0Ssangyong Engineering & Construction Co. Ltd. 4 , 3 2 2 , 2 0 0 3 . 5 0 2 1 , 6 1 1 1 , 5 1 3Ssangyong Motor Co. 3 , 5 1 3 , 8 0 0 9 . 2 3 2 , 7 7 6 2 , 1 0 8KIS Information 1 , 4 8 3 , 5 0 0 3 . 5 3 6 6 7 1 , 5 2 8Inchon Iron & Steel Co., Ltd. 1 , 6 1 0 , 6 3 4 1 . 3 3 6 , 4 4 2 6 , 4 4 2Haitai Confectionery Co., Ltd. 4 , 1 5 3 , 8 0 0 2 . 5 5 9 , 9 6 9 9 , 9 6 9O t h e r - - 1 0 , 3 2 2 4 , 4 2 5
W 1 0 9 , 4 2 9 W 4 8 , 3 8 4
C o m p a n y Number of Stocks Ownership (%) Acquisition cost Carrying Value
Corporation Restructuring FundSamsung Life Insurance Co.Korea Securities Finance CorporationLG CapitalKorea Asset Management Co.Iffcom, Ltd.Dawoo Shipbuilding & Marine Eng.Halla Heavy IndustriesB.C CardKIS InformationShindo Venture Capital Co.Oasis Venture Capital Co.Ezville Inc.O t h e r
C o m p a n y Number of Stocks Ownership (%) Carrying value
7 , 9 2 0 , 0 0 04 7 , 7 0 0
1 , 2 4 7 , 6 5 35 7 4 , 3 5 25 0 0 , 0 0 03 3 , 0 0 0
5 0 1 , 4 0 34 1 1 , 1 0 98 7 , 1 2 0
2 2 9 , 5 4 41 0 0 , 0 0 02 0 0 , 0 0 02 0 0 , 0 0 0
-
3 . 1 30 . 2 41 . 8 30 . 8 21 . 9 22 . 8 50 . 2 62 . 0 51 . 9 84 . 8 0
1 0 . 0 01 0 . 0 01 0 . 0 0
-
W 39,6001 5 , 8 3 6
8 , 2 4 34 , 1 1 32 , 2 1 01 , 9 8 01 , 4 8 71 , 3 3 71 , 3 3 11 , 3 2 11 , 0 5 41 , 0 0 01 , 0 0 0
1 4 , 5 7 7
W 95,089

N O N - C O N S O L I D ATED NOTES TO FINANCIAL STATEMENTS December 31, 2000 and 1999
FINANCIAL STATEMENTS 49Hana Bank Annual Report 2000
Debt securities as of December 31, 2000 and 1999 comprise the following (millions of won) :
1) As of December 31, 2000
Due to the sale of some of held-to maturity debt securities, the Bank reclassified W4,184,409 million of held-to maturity debt securities toavailable-for-sale debt securities in 2000. The Bank realized a gain on the sale of W6,379,287 million of investment debt securities during 2000.Related to this, W148,323 million and W2,813 million are included in gains and losses on disposition of investment securities, respectively.
2) As of December 31, 1999
Details of gains (losses) on valuation of investment securities appropriated in capital adjustments as of December 31, 2000 and 1999 are asfollows (millions of won) :
The information about investment securities by currency and country as of December 31, 2000 and 1999 is summarized as follows (millions of won) :
1) As of December 31, 2000
A v a i l a b l e - f o r - s a l eGovernment and public bonds W 8 1 1 , 1 0 3 W 7 8 6 , 9 4 6 W 8 1 8 , 2 4 7Debentures issued by financial institutions 4 , 7 6 7 , 2 1 0 4 , 6 5 3 , 3 9 6 4 , 6 8 3 , 8 3 9Corporate bonds 4 , 3 5 6 , 5 5 8 4 , 3 9 2 , 9 9 2 4 , 4 4 5 , 2 2 7Securities denominated in foreign currencies 6 9 8 , 7 6 6 717,800 6 4 2 , 6 3 1
1 0 , 6 3 3 , 6 3 7 1 0 , 5 5 1 , 1 3 4 1 0 , 5 8 9 , 9 4 4H e l d - t o - m a t u r i t y
Government and public bonds 1 0 3 1 0 3 1 0 3Corporate bonds 1 0 , 0 0 0 9 , 9 5 0 9 , 9 5 0
1 0 , 1 0 3 1 0 , 0 5 3 1 0 , 0 5 3
W 1 0 , 6 4 3 , 7 4 0 W 1 0 , 5 6 1 , 1 8 7 W 1 0 , 5 9 9 , 9 9 7
Par value Acquisition cost Carrying Value
A v a i l a b l e - f o r - s a l eGovernment and public bonds W 6 5 2 , 9 8 7 W 6 3 6 , 5 0 5 W 631,580 Debentures issued by financial institutions 6 7 2 , 4 2 5 6 2 3 , 2 1 6 6 1 9 , 3 2 2Corporate bonds 9 3 6 , 0 5 5 9 9 4 , 4 8 0 9 6 8 , 9 3 2Securities in foreign currencies 1 9 9 , 6 3 5 1 5 2 , 0 0 3 1 5 7 , 0 8 7
2 , 4 6 1 , 1 0 2 2 , 4 0 6 , 2 0 4 2 , 3 7 6 , 9 2 1H e l d - t o - m a t u r i t y
Government and public bonds 8 0 6 , 6 7 9 8 0 4 , 2 3 9 8 0 4 , 8 6 2Debentures issued by financial institutions 1 , 8 8 5 , 5 0 2 1 , 8 1 5 , 7 6 3 1 , 8 1 9 , 7 7 8Corporate bonds 3 , 0 1 9 , 7 7 1 3 , 0 3 6 , 6 1 2 3 , 0 3 2 , 9 1 0Securities in foreign currencies 2 3 0 , 9 9 7 2 2 3 , 7 3 4 2 0 8 , 6 8 7
5 , 9 4 2 , 9 4 9 5 , 8 8 0 , 3 4 8 5 , 8 6 6 , 2 3 7
W 8 , 4 0 4 , 0 5 1 W 8 , 2 8 6 , 5 5 2 W 8,243,158
Par value Acquisition cost Carrying Value
Stocks and equity investments W ( 4 5 , 3 7 0 ) W (1,598) Government and public bonds 2 5 , 9 3 7 ( 4 , 5 9 7 )Debentures issued by financial institutions 2 1 , 8 1 3 ( 3 , 6 8 9 )Corporate bonds 5 3 , 0 0 2 ( 1 6 , 1 1 2 )Securities denominated in foreign currencies ( 1 6 , 6 6 4 ) 6 , 2 0 5Other securities ( 2 , 8 5 9 ) 3 , 7 1 1
W 3 5 , 8 5 9 W (16,080)
Account name 2 0 0 0 1 9 9 9
A m o u n t
Rep. of Korea W 1 0 , 6 9 0 , 3 9 1 9 9 . 9 9 W 6 3 0 , 0 2 1 9 8 . 0 4C h i n a - - 1 , 0 9 5 0 . 1 7U . S . A 1 , 0 1 8 0 . 0 1 - -O t h e r - 1 1 , 5 1 5 1 . 7 9
W 1 0 , 6 9 1 , 4 0 9 1 0 0 . 0 0 W 6 4 2 , 6 3 1 1 0 0 . 0 0
Origination Country Domestic Currency Ratio (%) Foreign Currency Ratio (%)

N O N - C O N S O L I D ATED NOTES TO FINANCIAL STAT E M E N T SDecember 31, 2000 and 1999
50 FINANCIAL STATEMENTSHana Bank Annual Report 2000
2) As of December 31, 1999
The information about investment securities by industry as of December 31, 2000 and 1999 is summarized as follows :
7. Loans:
Loans as of December 31, 2000 and 1999 comprise the following :
The information about loans in won (including bills purchased and factoring receivables) and loans in foreign currencies by industry as ofDecember 31, 2000 and 1999 is summarized as follows (millions of won) :
1) As of December 31, 2000
M a n u f a c t u r i n g W 6 , 4 7 2 , 7 0 9 W 8 5 7 , 8 1 8 W 7 , 3 3 0 , 5 2 7 3 6 . 7Wholesale & retail 1 , 4 9 8 , 7 4 7 1 , 3 7 7 1 , 5 0 0 , 1 2 4 7 . 5Financial business 7 8 2 , 5 2 3 7 6 , 2 6 9 8 5 8 , 7 9 2 4 . 3C o n s t r u c t i o n 1 , 4 1 3 , 7 6 3 2 3 , 9 3 4 1 , 4 3 7 , 6 9 7 7 . 2H o u s e h o l d 5 , 3 3 7 , 0 4 2 - 5 , 3 3 7 , 0 4 2 2 6 . 7Real estate & renting 2 3 2 , 3 0 9 - 2 3 2 , 3 0 9 1 . 2Public & Other 3 , 2 2 3 , 5 1 3 4 8 , 0 2 7 3 , 2 7 1 , 5 4 0 1 6 . 4
W 1 8 , 9 6 0 , 6 0 6 W 1 , 0 0 7 , 4 2 5 W 1 9 , 9 6 8 , 0 3 1 1 0 0 . 0
Loans in foreignI n d u s t r y Loans in won c u r r e n c i e s T o t a l Ratio (%)
Rep. of Korea W 8 , 7 3 3 , 2 6 9 1 0 0 . 0 0 W 3 2 0 , 5 2 4 8 7 . 5 7T h a i l a n d - - 7 , 0 7 8 1 . 9 3I n d o n e s i a - - 1 6 , 2 5 8 4 . 4 4C o l u m b i a - - 1 0 , 3 0 9 2 . 8 2C h i n a - - 7 , 0 6 6 1 . 9 3P h i l i p p i n e s - - 5 1 5 0 . 1 4G e r m a n y - - 4 , 2 9 5 1 . 1 7
W 8 , 7 3 3 , 2 6 9 1 0 0 . 0 0 W 3 6 6 , 0 4 5 1 0 0 . 0 0
Origination Country Domestic Currency Ratio (%) Foreign Currency Ratio (%)
Financial business W 6 , 0 1 2 , 0 9 7 5 3 . 0 4 W 3 , 4 0 7 , 0 5 5 3 7 . 4 4Public administration 4 , 1 4 0 , 8 3 3 3 6 . 5 3 4 , 5 0 4 , 6 7 0 4 9 . 5 1M a n u f a c t u r i n g 7 5 1 , 6 3 8 6 . 6 3 6 9 7 , 0 8 6 7 . 6 6C o n s t r u c t i o n 6 3 , 5 1 5 0 . 5 6 4 3 , 2 4 8 0 . 4 8Wholesale and retail 2 0 8 , 1 8 4 1 . 8 4 1 7 8 , 5 6 1 1 . 9 6O t h e r 1 5 7 , 7 7 3 1 . 4 0 2 6 8 , 6 9 4 2 . 9 5
W 1 1 , 3 3 4 , 0 4 0 1 0 0 . 0 0 W 9 , 0 9 9 , 3 1 4 1 0 0 . 0 0
2000 1999
Origination Country Millions of won Ratio (%) Millions of won Ratio (%)
Millions of won
Loans in won Corporate loans 5 . 5 6 ~ 1 2 . 5 8 W 8 , 6 4 0 , 8 2 2 W 6 , 5 1 6 , 7 9 4Household loans 9 . 9 6 ~ 1 4 . 9 3 5 , 3 3 8 , 2 7 8 3 , 2 7 9 , 3 2 3O t h e r s 7 . 8 3 ~ 9 . 7 6 1 , 3 9 1 , 0 2 9 1 5 9 , 7 7 6
1 5 , 3 7 0 , 1 2 9 9 , 9 5 5 , 8 9 3
Loans in foreign currencies 6 . 4 5 ~ 1 1 . 2 5 1 , 0 0 7 , 4 2 5 9 5 8 , 4 9 4Bills purchased in won 1 3 . 8 8 3 , 4 7 1 , 9 0 9 2 , 3 3 2 , 0 5 5Bills purchased in foreign currencies 8 . 8 3 1 , 2 4 6 , 3 7 7 1 , 1 8 1 , 9 1 7Advances to customers 0 . 7 2 ~ 5 . 2 2 1 7 1 , 5 8 9 1 9 2 , 5 5 4Factoring receivables 8 . 4 6 ~ 1 1 . 7 3 1 1 8 , 5 6 8 1 2 4 , 1 3 2Credit card loans 5 . 0 1 ~ 1 7 . 0 1 4 4 0 , 4 3 8 1 1 8 , 3 9 4Bonds purchased under agreements of repurchase 4 . 7 8 ~ 8 . 0 1 8 2 0 , 0 0 0 9 2 0 , 0 0 0Call loans 5 . 2 3 ~ 6 . 5 2 7 6 7 , 3 6 4 4 1 2 , 3 1 1Privately-placed debentures 9 . 9 1 2 , 1 9 4 , 8 3 2 1 , 7 7 4 , 5 4 2
W 2 5 , 6 0 8 , 6 3 1 W 1 7 , 9 7 0 , 2 9 2
Annual interestrate (%) 2000 1999

N O N - C O N S O L I D ATED NOTES TO FINANCIAL STATEMENTS December 31, 2000 and 1999
FINANCIAL STATEMENTS 51Hana Bank Annual Report 2000
2) As of December 31, 1999
The information about loans in foreign currencies by country as of December 31, 2000 and 1999 is summarized as follows :
Details of changes in the allowance for possible loan losses for the years ended December 31, 2000 and 1999 are as follows (millions of won) :
The term structures of loans in won (including bills purchased and factoring receivables), loans in foreign currencies and bills purchased inforeign currencies as of December 31, 2000 are summarized as follows (millions of won) :
M a n u f a c t u r i n gWholesale & retail Financial businessC o n s t r u c t i o nH o u s e h o l dU t i l i t yReal estate & rentingPublic & Other
3 7 . 39 . 06 . 57 . 2
2 4 . 52 . 42 . 3
1 0 . 8
1 0 0 . 0
W 4,981,3141 , 2 0 8 , 0 3 4
8 6 6 , 0 6 59 6 3 , 2 8 6
3 , 2 7 9 , 3 2 33 2 3 , 9 7 33 1 3 , 5 0 0
1 , 4 3 5 , 0 7 9
W 13,370,574
W 343,6024 9 , 2 8 8
4 1 2 , 7 0 32 4 , 5 8 3
- -
3 , 6 3 01 2 4 , 6 8 8
W 958,494
W 4,637,7121 , 1 5 8 , 7 4 6
4 5 3 , 3 6 29 3 8 , 7 0 3
3 , 2 7 9 , 3 2 33 2 3 , 9 7 33 0 9 , 8 7 0
1 , 3 1 0 , 3 9 1
W 12,412,080
Loans in foreign I n d u s t r y Loans in won c u r r e n c i e s T o t a l Ratio (%)
Within 1 month1 ~ 3 months3 ~ 6 months
6 months ~ 1 year1 ~ 3 years
More than 3 years
W 2,209,4294 , 9 3 7 , 8 2 54 , 5 6 1 , 3 9 85 , 3 2 7 , 9 4 52 , 2 0 9 , 9 6 21 , 9 6 7 , 8 4 9
W 21,214,408
W 561,4423 9 1 , 9 9 02 1 8 , 5 6 93 4 , 2 1 3
3 44 0 , 1 2 9
W 1,246,377
W 53,8921 4 6 , 2 7 51 0 9 , 4 7 72 1 5 , 0 4 02 2 9 , 9 8 52 5 2 , 7 5 6
W 1,007,425
W 1,594,095 4 , 3 9 9 , 5 6 04 , 2 3 3 , 3 5 25 , 0 7 8 , 6 9 21 , 9 7 9 , 9 4 31 , 6 7 4 , 9 6 4
W 18,960,606
T e r m Loans in foreign Bills purchasedS t r u c t u r e s Loans in won c u r r e n c i e s in foreign currencies T o t a l
Republic of Korea W 965,530 9 5 . 8 W 888,477 9 2 . 7I n d o n e s i a 2 3 , 4 9 3 2 . 3 2 8 , 0 0 6 2 . 9C h i n a 7 , 6 5 8 0 . 8 1 5 , 1 9 8 1 . 6Hong Kong 4 , 6 4 0 0 . 5 4 , 1 1 6 0 . 4T h a i l a n d - - 1 3 , 9 8 0 1 . 5B r a z i l - - 3 , 1 6 8 0 . 3T u r k e y - - 5 , 5 4 9 0 . 6O t h e r 6 , 1 0 4 0 . 6 - -
W 1,007,425 1 0 0 . 0 W 958,494 1 0 0 . 0
2000 1999
Origination Country Millions of won Ratio (%) Millions of won Ratio (%)
Beginning balance W 655,096 W 239,398Carried over on merger - 2 1 3 , 4 0 0Carried over from overseas subsidiary - 2 2 , 5 3 6Offset with present value discounts ( 4 3 , 4 0 4 ) ( 1 0 , 0 4 8 )Transfer from allowances for acceptances and guarantees ( 2 5 0 ) ( 6 0 , 6 2 1 )Repurchase loans from KAMCO 8 , 3 6 9 3 0 , 8 9 9W r i t e - o f f s ( 4 0 3 , 2 0 0 ) ( 1 4 8 , 7 6 1 )Remission of loans ( 2 0 , 4 7 0 ) ( 1 9 , 7 8 7 )Decrease from execution of put-back option - ( 1 6 , 9 7 5 )Collection of previously written-off receivables 7 8 , 1 6 5 9 , 1 3 5Changes of currency exchange rate 1 2 , 6 2 9 ( 9 1 1 )Provision for possible loan losses 5 3 4 , 2 3 6 3 9 6 , 8 3 1
Closing balance W 821,171 W 655,096
Details of changes 2 0 0 0 1 9 9 9
Millions of Won

N O N - C O N S O L I D ATED NOTES TO FINANCIAL STAT E M E N T SDecember 31, 2000 and 1999
52 FINANCIAL STATEMENTSHana Bank Annual Report 2000
Allowance for : Loans in won Loans in foreign currenciesBills purchased in foreign currenciesAdvances to customersCredit card loansPrivately-placed debenturesAccount receivableO t h e r
2 0 0 0 1 9 9 9
A m o u n t
Loans in won(*) W 17,215,161 W 546,077 W 583,525 W 239,479 W 19,527 W 18,603,769Loans in foreign currencies 6 0 7 , 8 5 0 1 8 9 , 8 0 8 1 7 5 , 7 2 2 2 7 , 1 2 7 2 , 3 4 8 1 , 0 0 2 , 8 5 5Bills purchased in foreign currency 1 , 1 8 7 , 0 0 1 1 9 , 2 4 7 1 7 , 9 3 1 2 2 , 1 9 8 - 1 , 2 4 6 , 3 7 7Advances to customers 6 , 1 6 6 1 , 5 1 3 8 7 , 2 7 9 5 2 , 2 9 3 1 9 , 0 4 8 1 6 6 , 2 9 9Credit card loans 4 3 0 , 8 4 0 6 , 0 3 0 4 2 2 , 1 9 5 1 , 3 3 1 4 4 0 , 4 3 8Privately-placed debentures 2 , 0 7 1 , 5 9 3 5 2 , 8 2 5 4 2 , 9 4 1 2 5 , 8 8 7 1 2 0 2 , 1 9 3 , 3 6 6O t h e r 1 1 8 , 5 6 9 - 4 2 8 2 , 3 1 0 - 1 2 1 , 3 0 7
W 21,637,180 W 815,500 W 907,868 W 371,489 W 42,374 W 23,774,411
R a t i o ( % ) 9 1 . 0 3 . 4 3 . 8 1 . 6 0 . 2 1 0 0 . 0
N o r m a l P r e c a u t i o n a r y S u b s t a n d a r d D o u b t f u l Estimated loss T o t a l
W 527,4939 8 , 0 9 53 2 , 2 6 99 4 , 4 0 4
4 , 7 1 35 9 , 0 2 8
-5 , 1 6 9
W 821,171
W 307,4848 1 , 1 1 13 7 , 7 7 08 2 , 6 7 92 , 5 0 1
1 3 4 , 7 9 57 , 6 2 11 , 1 3 5
W 655,096
Loans in wonLoans in foreign currenciesAccounts receivableAdvances to customersCredit card loansBills purchased in foreign currenciesPrivately-placed debenturesO t h e r
2 0 0 0 1 9 9 9
Millions of won
W 192,5723 9 , 3 1 81 0 , 2 7 74 3 , 6 6 4
1 , 2 4 41 3 , 0 5 9
1 2 1 , 5 0 02 , 0 3 6
W 423,670
W 73,2429 1 , 7 2 97 , 0 3 7
7 1 35 , 0 4 7
--
4 0 9
W 178,177
As of December 31, 2000, the classification of loans is as follows (millions of won) :
(*) Including bills purchased and factoring receivables
The loan balances above are net of present value discounts. Bonds purchased under agreements of repurchase, call loan and inter-bank loansare not included in the above.
As of December 31, 2000 and 1999, allowances for possible loan losses are provided for the following accounts :
Historical ratios of allowance for possible loan losses to total loans for the most recent three years are as follows (millions of won) :
(*) Loan amount does not include bonds purchased under agreements of repurchase, call loans, interbank loans and are net of present value discounts
Details of loans written-off for the years ended December 31, 2000 and 1999 are as follows (millions of Won) :
L o a n ( * ) W 2 3 , 7 7 4 , 4 1 1 W 1 6 , 5 7 5 , 5 5 1 W 7 , 5 9 2 , 7 0 1Allowance for possible loan losses 8 2 1 , 1 7 1 6 5 5 , 0 9 6 2 3 9 , 3 9 8
R a t i o s 3.45 % 3.95 % 3.15 %
2000.12.31 1999.12.31 1998.12.31
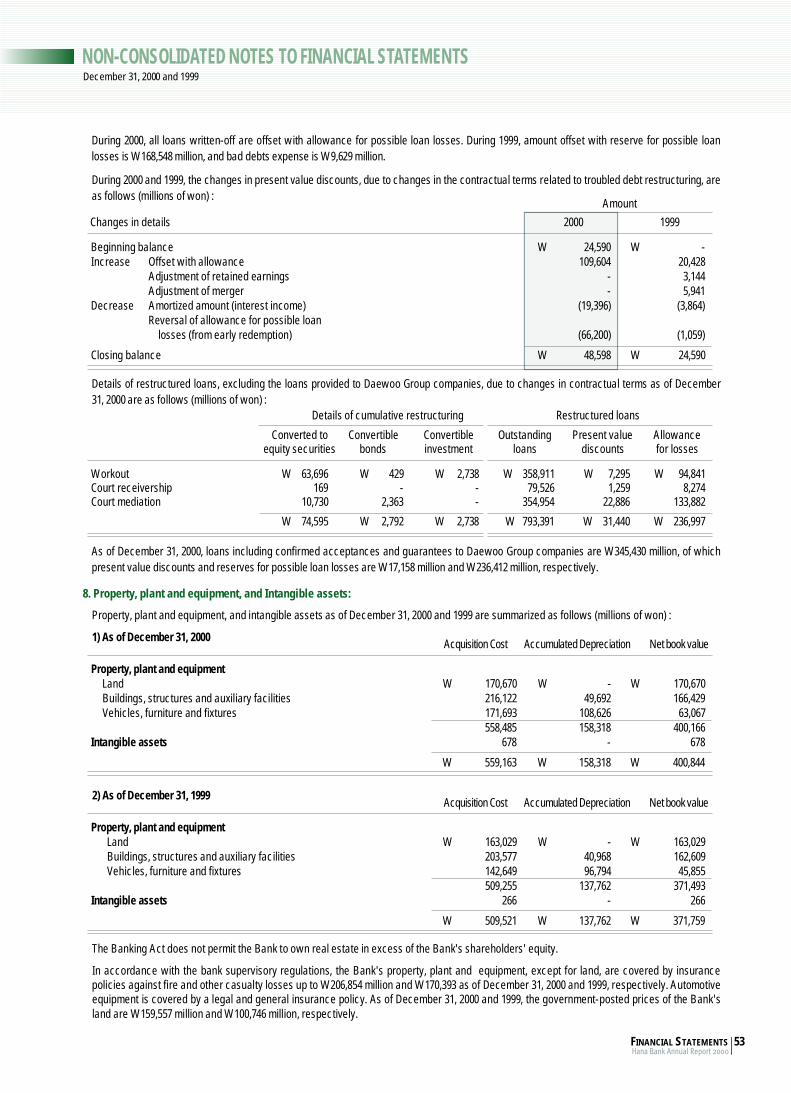
N O N - C O N S O L I D ATED NOTES TO FINANCIAL STATEMENTS December 31, 2000 and 1999
FINANCIAL STATEMENTS 53Hana Bank Annual Report 2000
During 2000, all loans written-off are offset with allowance for possible loan losses. During 1999, amount offset with reserve for possible loanlosses is W168,548 million, and bad debts expense is W9,629 million.
During 2000 and 1999, the changes in present value discounts, due to changes in the contractual terms related to troubled debt restructuring, areas follows (millions of won) :
Details of restructured loans, excluding the loans provided to Daewoo Group companies, due to changes in contractual terms as of December31, 2000 are as follows (millions of won) :
As of December 31, 2000, loans including confirmed acceptances and guarantees to Daewoo Group companies are W345,430 million, of whichpresent value discounts and reserves for possible loan losses are W17,158 million and W236,412 million, respectively.
8. Property, plant and equipment, and Intangible assets:
Property, plant and equipment, and intangible assets as of December 31, 2000 and 1999 are summarized as follows (millions of won) :
1) As of December 31, 2000
2) As of December 31, 1999
The Banking Act does not permit the Bank to own real estate in excess of the Bank's shareholders' equity.
In accordance with the bank supervisory regulations, the Bank's property, plant and equipment, except for land, are covered by insurancepolicies against fire and other casualty losses up to W206,854 million and W170,393 as of December 31, 2000 and 1999, respectively. Automotiveequipment is covered by a legal and general insurance policy. As of December 31, 2000 and 1999, the government-posted prices of the Bank'sland are W159,557 million and W100,746 million, respectively.
Beginning balance W 2 4 , 5 9 0 W -I n c r e a s e Offset with allowance 1 0 9 , 6 0 4 2 0 , 4 2 8
Adjustment of retained earnings - 3 , 1 4 4Adjustment of merger - 5 , 9 4 1
D e c r e a s e Amortized amount (interest income) ( 1 9 , 3 9 6 ) ( 3 , 8 6 4 )Reversal of allowance for possible loan
losses (from early redemption) ( 6 6 , 2 0 0 ) ( 1 , 0 5 9 )
Closing balance W 4 8 , 5 9 8 W 2 4 , 5 9 0
Changes in details 2 0 0 0 1 9 9 9
A m o u n t
W o r k o u t W 63,696 W 429 W 2,738 W 358,911 W 7,295 W 94,841Court receivership 1 6 9 - - 7 9 , 5 2 6 1 , 2 5 9 8 , 2 7 4Court mediation 1 0 , 7 3 0 2 , 3 6 3 - 3 5 4 , 9 5 4 2 2 , 8 8 6 1 3 3 , 8 8 2
W 74,595 W 2,792 W 2,738 W 793,391 W 31,440 W 236,997
Converted to C o n v e r t i b l e C o n v e r t i b l e O u t s t a n d i n g Present value A l l o w a n c eequity securities b o n d s i n v e s t m e n t l o a n s d i s c o u n t s for losses
Details of cumulative restructuring Restructured loans
Property, plant and equipmentL a n d W 1 7 0 , 6 7 0 W - W 1 7 0 , 6 7 0Buildings, structures and auxiliary facilities 2 1 6 , 1 2 2 4 9 , 6 9 2 1 6 6 , 4 2 9Vehicles, furniture and fixtures 1 7 1 , 6 9 3 1 0 8 , 6 2 6 6 3 , 0 6 7
5 5 8 , 4 8 5 1 5 8 , 3 1 8 4 0 0 , 1 6 6Intangible assets 6 7 8 - 6 7 8
W 5 5 9 , 1 6 3 W 1 5 8 , 3 1 8 W 4 0 0 , 8 4 4
Acquisition Cost Accumulated Depreciation Net book value
Property, plant and equipmentL a n d W 1 6 3 , 0 2 9 W - W 1 6 3 , 0 2 9Buildings, structures and auxiliary facilities 2 0 3 , 5 7 7 4 0 , 9 6 8 1 6 2 , 6 0 9Vehicles, furniture and fixtures 1 4 2 , 6 4 9 9 6 , 7 9 4 4 5 , 8 5 5
5 0 9 , 2 5 5 1 3 7 , 7 6 2 3 7 1 , 4 9 3Intangible assets 2 6 6 - 2 6 6
W 5 0 9 , 5 2 1 W 1 3 7 , 7 6 2 W 3 7 1 , 7 5 9
Acquisition Cost Accumulated Depreciation Net book value

N O N - C O N S O L I D ATED NOTES TO FINANCIAL STAT E M E N T SDecember 31, 2000 and 1999
54 FINANCIAL STATEMENTSHana Bank Annual Report 2000
9. Deposits:
Deposits as of December 31, 2000 and 1999 comprise the following :
Deposits from financial institutions as of December 31, 2000 and 1999 are as follows :
The term structures of deposits as of December 31, 2000 are summarized as follows (millions of won) :
Millions of won
Won deposits :Demand deposits 0.00 ~ 1.28 W 1 , 6 2 1 , 3 2 1 W 1 , 1 5 1 , 9 2 3Time and savings deposits 0.73 ~ 10.32 2 3 , 3 2 7 , 6 3 8 1 8 , 9 6 6 , 2 9 2Mutual installment received 8 . 4 4 6 4 5 , 7 7 9 5 2 5 , 7 3 0Housing installment deposits 8 . 7 5 6 8 , 6 5 5 -
2 5 , 6 6 3 , 3 9 3 2 0 , 6 4 3 , 9 4 5Foreign currency deposits :
Demand deposits 0.00 ~ 2.57 2 0 2 , 5 8 0 8 0 , 0 2 5Time and savings deposits 6 . 5 5 9 7 2 , 8 6 0 4 5 2 , 3 3 9
1 , 1 7 5 , 4 4 0 5 3 2 , 3 6 4
Certificates of deposits : 7 . 8 9 1 , 9 1 4 , 4 5 6 1 , 8 4 3 , 4 1 5
W 2 8 , 7 5 3 , 2 8 9 W 2 3 , 0 1 9 , 7 2 4
Annual averageinterest rate(%) 2000 1999
Millions of won
Won deposits :
Demand deposits W 3 3 , 3 9 7 W 8 4 , 0 3 0Time and savings deposits 5 5 0 , 3 3 8 2 4 3 , 4 0 5Mutual installment received 5 8 8 2 , 2 2 9
5 8 4 , 3 2 3 3 2 9 , 6 6 4Foreign currency deposits :
Demand deposits 8 , 3 9 1 9 , 9 0 8Time and savings deposits 2 3 , 8 1 3 1 2 , 7 2 3
3 2 , 2 0 4 2 2 , 6 3 1
W 6 1 6 , 5 2 7 W 3 5 2 , 2 9 5
2000 1999
Within 1 month W 7 , 3 6 4 , 6 3 4 W 4 3 6 , 5 7 3 W 3 6 6 , 3 9 5 W 8 , 1 6 7 , 6 0 21 ~ 3 months 4 , 4 4 3 , 8 2 4 3 4 5 , 6 5 6 2 1 5 , 1 4 7 5 , 0 0 4 , 6 2 73 ~ 6 months 3 , 9 9 5 , 1 0 4 7 9 , 0 9 3 7 3 0 , 6 4 3 4 , 8 0 4 , 8 4 0
6 months ~ 1 year 5 , 4 1 3 , 6 8 7 2 0 4 , 1 6 2 2 4 6 , 1 8 2 5 , 8 6 4 , 0 3 11 ~ 3 years 8 6 6 , 7 9 2 1 , 3 4 7 3 5 6 , 0 8 9 1 , 2 2 4 , 2 2 8
More than 3 years 3 , 5 7 9 , 3 5 2 1 0 8 , 6 0 9 - 3 , 6 8 7 , 9 6 1
W 2 5 , 6 6 3 , 3 9 3 W 1 , 1 7 5 , 4 4 0 W 1 , 9 1 4 , 4 5 6 W 2 8 , 7 5 3 , 2 8 9
T e r m Foreign currency Certificates ofS t r u c t u r e s W o n - D e p o s i t s D e p o s i t s Deposits T o t a l

N O N - C O N S O L I D ATED NOTES TO FINANCIAL STATEMENTS December 31, 2000 and 1999
FINANCIAL STATEMENTS 55Hana Bank Annual Report 2000
10. Borrowings:
Borrowings as of December 31, 2000 and 1999 comprise the following :
The subordinated borrowings included in won-borrowings as of December 31, 2000 and 1999 comprise the following :
The maturities of borrowings as of December 31, 2000 are as follows (millions of won) :
11. Debentures:
Debentures as of December 31, 2000 and 1999 comprise the following :
Millions of won
Millions of won
Won borrowings :Bank of Korea 3 . 0 0 W 5 3 3 , 7 6 4 W 4 1 6 , 3 1 6Korean Government 4.00 ~ 5.00 8 0 , 7 0 3 7 5 , 7 0 9O t h e r 4.50 ~ 8.50 5 6 4 , 4 2 8 5 3 3 , 5 1 2
1 , 1 7 8 , 8 9 5 1 , 0 2 5 , 5 3 7Foreign currency borrowings :
IFC & other L i b o r + 0 . 0 0 ~ 3 . 2 5 9 3 2 , 1 7 8 1 , 6 2 5 , 0 9 8Standard Chartered Bank & other 6 . 7 0 ~ 8 . 2 9 5 2 7 , 5 9 0 9 9 , 7 3 7Dai-Ichi Kangyo L i b o r + 0 . 5 0 2 5 , 1 9 4 5 4 , 2 9 2
1 , 4 8 4 , 9 6 2 1 , 7 7 9 , 1 2 7
W 2 , 6 6 3 , 8 5 7 W 2 , 8 0 4 , 6 6 4
Annual interestrate(%) 2000 1999
Kyobo Life Insurance 1 0 . 0 0 ~ 1 4 . 9 4 W 1 0 0 , 0 0 0 W 1 0 0 , 0 0 0 Lump sum redemptionSamsung Life Insurance 9 . 0 0 ~ 1 6 . 1 6 7 0 , 0 0 0 7 0 , 0 0 0 "LG Fire & Marine Insurance 1 6 . 0 0 4 8 , 0 0 0 4 8 , 0 0 0 "
W 2 1 8 , 0 0 0 W 2 1 8 , 0 0 0
Annual interest L e n d e r rate (%) 2 0 0 0 1999 Condition of borrowings
2 0 0 1 . 1 . 1 ~ 2 0 0 1 . 1 2 . 3 1 W 6 3 0 , 7 4 4 W 9 2 5 , 6 0 8 W 1 , 5 5 6 , 3 5 22 0 0 2 . 1 . 1 ~ 2 0 0 2 . 1 2 . 3 1 1 0 0 , 9 1 3 3 3 2 , 9 8 1 4 3 3 , 8 9 42 0 0 3 . 1 . 1 ~ 2 0 0 3 . 1 2 . 3 1 1 8 2 , 9 6 6 1 9 9 , 4 5 2 3 8 2 , 4 1 82 0 0 4 . 1 . 1 ~ 2 0 0 4 . 1 2 . 3 1 5 6 , 8 9 6 - 5 6 , 8 9 6
T h e r e a f t e r 2 0 7 , 3 7 6 2 6 , 9 2 1 2 3 4 , 2 9 7
W 1 , 1 7 8 , 8 9 5 W 1 , 4 8 4 , 9 6 2 W 2 , 6 6 3 , 8 5 7
Foreign currency P e r i o d W o n - B o r r o w i n g s Borrowings T o t a l
Millions of won
Won-debentures :Subordinated bonds P r i m e + 0 ~ 1 5 . 6 3 W 1 , 1 7 4 , 9 2 5 W 6 7 2 , 0 1 2Subordinated convertible bonds 8 . 0 0 4 9 , 9 9 8 4 9 , 9 9 8B o n d s 8.96 ~ 10.10 8 5 , 0 0 0 5 5 , 0 0 0
1 , 3 0 9 , 9 2 3 7 7 7 , 0 1 0(Adjustments for conversion rights) ( 3 , 5 1 4 ) ( 4 , 9 2 3 )
1 , 3 0 6 , 4 0 9 7 7 2 , 0 8 7Foreign currency debentures :
Foreign currency bonds L + 0.35 ~ 1.75 4 2 9 , 5 5 8 1 1 5 , 6 8 5Subordinated convertible bonds 6M libor 3 7 , 7 9 1 3 4 , 3 6 2
4 6 7 , 3 4 9 1 5 0 , 0 4 7(Present value discounts) ( 2 , 6 9 2 ) ( 1 , 7 2 3 )
4 6 4 , 6 5 7 1 4 8 , 3 2 4
W 1 , 7 7 1 , 0 6 6 W 9 2 0 , 4 1 1
Annual interestrate (%) 2000 1999

N O N - C O N S O L I D ATED NOTES TO FINANCIAL STAT E M E N T SDecember 31, 2000 and 1999
56 FINANCIAL STATEMENTSHana Bank Annual Report 2000
Details of the terms of outstanding subordinated convertible bonds as of December 31, 2000 and 1999 are as follows :
The maturities of debentures as of December 31, 2000 are as follows (millions of won) :
12. Confirmed Acceptances and Guarantees:
Confirmed acceptances and guarantees as of December 31, 2000 and 1999 comprise the following :
(*) acceptances and guarantees for the return of advances related to export, overseas bidding, and contractual obligations.
W o n - d e b e n t u r e sBoram 1s t 1 9 9 7 . 1 1 . 2 5 2003. 1.31 8 . 0 W 30,000 W 30,000Boram 2nd “ “ “ 1 9 , 9 9 8 1 9 , 9 9 8
(Adjustments for conversion rights) ( 3 , 5 1 4 ) ( 4 , 9 2 3 )4 6 , 4 8 4 4 5 , 0 7 5
Foreign currency debenturesIFC 1s t 1998. 6.29 2004. 2.15 6 M libor 3 7 , 7 9 1 3 4 , 3 6 2
W 84,275 W 79,437
Annual Interest Millions of wonIssue date Due date Rate (%) 2 0 0 0 1 9 9 9
Conversion price W 19,616 W 6,236Conversion period 1 9 9 8 . 1 1 . 2 6 - 2 0 0 2 . 1 2 . 3 1 1 9 9 9 . 6 . 3 0 - 2 0 0 3 . 2 . 1 5Disbursement at due date 100% of par value 100% of par valueInterest term A n n u a l A n n u a l
Boram 1st & 2nd IFC 1st
2 0 0 1 . 1 . 1 ~ 2 0 0 1 . 1 2 . 3 1 W - W 1 3 4 , 7 8 8 W 1 3 4 , 7 8 82 0 0 2 . 1 . 1 - 2 0 0 2 . 1 2 . 3 1 8 0 , 0 0 0 6 2 , 9 8 5 1 4 2 , 9 8 52 0 0 3 . 1 . 1 - 2 0 0 3 . 1 2 . 3 1 4 5 9 , 0 7 7 2 3 1 , 7 8 5 6 9 0 , 8 6 22 0 0 4 . 1 . 1 - 2 0 0 4 . 1 2 . 3 1 1 6 6 , 3 0 0 3 7 , 7 9 1 2 0 4 , 0 9 1T h e r e a f t e r 6 0 4 , 5 4 6 - 6 0 4 , 5 4 6
W 1 , 3 0 9 , 9 2 3 W 4 6 7 , 3 4 9 W 1 , 7 7 7 , 2 7 2
Foreign currencyP e r i o d s W o n - D e b e n t u r e s Debentures T o t a l
Millions of won
Acceptances and guarantees in won : W 6 6 5 , 3 1 0 W 6 3 5 , 7 9 0
Acceptances and guarantees in foreign currencies :Acceptances for letters of credit 1 , 5 3 8 , 8 8 5 1 , 1 8 2 , 2 4 8Letters of guarantee for importers 5 6 , 3 3 9 5 6 , 6 5 3Guarantees on credit derivatives 3 1 , 4 9 3 2 8 , 6 3 5O t h e r ( * ) 6 0 2 , 8 0 8 4 5 3 , 5 7 5
2 , 2 2 9 , 5 2 5 1 , 7 2 1 , 1 1 1
W 2 , 8 9 4 , 8 3 5 W 2 , 3 5 6 , 9 0 1
2000 1999

N O N - C O N S O L I D ATED NOTES TO FINANCIAL STATEMENTS December 31, 2000 and 1999
FINANCIAL STATEMENTS 57Hana Bank Annual Report 2000
Information about confirmed acceptances and guarantees by industry as of December 31, 2000 and 1999 is summarized as follows :
Information about confirmed acceptances and guarantees in foreign currencies by country as of December 31, 2000 and 1999 is summarized as follows :
Reserves for possible losses on acceptances and guarantees as of December 31, 2000 and 1999 are composed of the following (millions of won) :
1) As of December 31, 2000
2) As of December 31, 1999
As of December 31, 2000 and 1999, respectively, W3,623 million and W3,304 million of additional reserves for unconfirmed acceptances andguarantees of W6,165 and W10,715 million, provided to Daewoo Group companies, are excluded in the amount of reserve for possible losses onacceptances and guarantees shown above.
M a n u f a c t u r i n g W 2 , 1 9 5 , 3 1 4 7 5 . 9 W 1 , 4 5 2 , 8 0 2 6 1 . 7C o n s t r u c t i o n 1 5 1 , 1 8 7 5 . 2 2 3 1 , 4 4 1 9 . 8Wholesale & retail 2 3 8 , 3 0 4 8 . 2 1 7 9 , 8 6 5 7 . 6Transport & storage 1 6 , 9 0 1 0 . 6 8 1 , 6 9 8 3 . 5Financial business 3 2 , 7 4 3 1 . 1 7 , 5 9 0 0 . 3Real estate & renting 6 , 6 5 4 0 . 2 7 8 3 0 . 0O t h e r 2 5 3 , 7 3 2 8 . 8 4 0 2 , 7 2 2 1 7 . 1
W 2 , 8 9 4 , 8 3 5 1 0 0 . 0 W 2 , 3 5 6 , 9 0 1 1 0 0 . 0
2000 1999
Industry Millions of won Ratio (%) Millions of won Ratio (%)
K o r e a W 2 , 1 9 4 , 9 3 4 9 8 . 5 W 1 , 6 9 1 , 9 2 8 9 8 . 3J a p a n 3 1 , 4 9 2 1 . 4 2 8 , 6 3 5 1 . 6Hong Kong 3 , 0 9 9 0 . 1 5 4 8 0 . 1
W 2 , 2 2 9 , 5 2 5 1 0 0 . 0 W 1 , 7 2 1 , 1 1 1 1 0 0 . 0
2000 1999
Country Millions of won Ratio (%) Millions of won Ratio (%)
Acceptances and guarantees in won W 6 6 5 , 3 1 0 W 8 , 4 9 8 1 . 2 8Acceptances and guarantees in foreign currencies 2 , 2 2 9 , 5 2 5 2 7 , 8 8 0 1 . 2 5
W 2 , 8 9 4 , 8 3 5 W 3 6 , 3 7 8 1 . 2 6
Amount of Acceptances Amount of R e s e r v eand Guarantees Reserve atio (%)
Acceptances and guarantees in won W 6 3 5 , 7 9 0 W 1 3 , 0 8 0 2 . 0 6Acceptances and guarantees in Foreign currencies 1 , 7 2 1 , 1 1 1 3 3 , 5 3 0 1 . 9 5
W 2 , 3 5 6 , 9 0 1 W 4 6 , 6 1 0 1 . 9 8
Amount of Acceptances Amount of R e s e r v eand Guarantees Reserve atio (%)

N O N - C O N S O L I D ATED NOTES TO FINANCIAL STAT E M E N T SDecember 31, 2000 and 1999
58 FINANCIAL STATEMENTSHana Bank Annual Report 2000
13. Assets and Liabilities Denominated in Foreign Currencies:
Significant assets and liabilities denominated in foreign currencies at December 31, 2000 and 1999 are as follows :
1) At December 31, 2000
2) At December 31, 1999
14. Commitments and Contingencies:
Assets :Cash & due from banks W 5 4 6 , 3 5 9 $ 4 3 3 , 7 2 0Trading securities 1 9 , 9 7 2 1 5 , 8 5 4Investment securities 6 4 2 , 6 3 1 5 1 0 , 1 4 6L o a n s 1 , 0 0 7 , 4 2 5 7 9 9 , 7 3 4O t h e r 1 , 7 4 1 , 2 5 5 1 , 3 8 2 , 2 7 9Allowance for possible loan losses ( 1 3 0 , 3 6 7 ) ( 1 0 3 , 4 9 1 )
W 3 , 8 2 7 , 2 7 5 $ 3 , 0 3 8 , 2 4 2Liabilities :
D e p o s i t s W 1 , 1 7 5 , 4 3 9 $ 9 3 3 , 1 1 0B o r r o w i n g s 1 , 4 8 4 , 9 6 2 1 , 1 7 8 , 8 2 2Due to Bank of Korea 2 3 7 , 1 5 5 1 8 8 , 2 6 3D e b e n t u r e s 4 6 7 , 3 4 9 3 7 1 , 0 0 0O t h e r 3 1 4 , 9 4 4 2 5 0 , 0 1 6
W 3 , 6 7 9 , 8 4 9 $ 2 , 9 2 1 , 2 1 1
Thousand of US$ Millions of won Equivalent
Assets :Cash & due from banks W 2 6 5 , 4 7 7 $ 2 3 0 , 4 0 7Trading securities 4 , 6 6 2 4 , 0 7 0Investment securities 3 6 6 , 0 4 5 3 1 9 , 5 7 8L o a n s 2 , 4 3 5 , 5 9 9 2 , 1 2 6 , 4 1 2O t h e r 3 3 , 1 9 6 2 8 , 9 8 3Allowance for possible loan losses ( 1 5 7 , 5 4 9 ) ( 1 3 7 , 5 4 9 )
W 2 , 9 4 7 , 4 3 0 $ 2 , 5 7 1 , 9 0 1Liabilities :
D e p o s i t s W 5 3 2 , 3 6 4 $ 4 6 5 , 2 9 7B o r r o w i n g s 1 , 7 7 9 , 1 2 7 1 , 5 5 1 , 1 0 2Bonds sold on repurchase agreements 3 8 , 6 6 2 3 3 , 7 5 4Due to Bank of Korea 4 1 5 , 5 3 7 3 6 2 , 7 8 8D e b e n t u r e s 1 5 0 , 0 4 7 1 3 1 , 0 0 0O t h e r 8 1 , 9 2 7 7 1 , 5 2 5
W 2 , 9 9 7 , 6 6 4 $ 2 , 6 1 5 , 4 6 6
D e r i v a t i v e s Amount of PositionT o t a l T r a d i n g H e d g i n g T o t a l T r a d i n g H e d g i n g A s s e t s L i a b i l i t i e s
C u r r e n c yF o r w a r d 1 , 2 0 9 , 2 9 0 2 7 6 , 6 3 1 9 3 2 , 6 5 9 ( 2 3 , 0 9 0 ) ( 2 4 , 6 3 8 ) 1 , 5 4 8 2 9 , 8 3 3 5 0 , 3 6 0S w a p 1 0 1 , 0 1 1 - 1 0 1 , 0 1 1 6 , 0 1 4 - 6 , 0 1 4 6 , 4 6 5 3 0 6S u b t o t a l 1 , 3 1 0 , 3 0 1 2 7 6 , 6 3 1 1 , 0 3 3 , 6 7 0 ( 1 7 , 0 7 6 ) ( 2 4 , 6 3 8 ) 7 , 5 6 2 3 6 , 2 9 8 5 0 , 6 6 6
Interest rate Swap 1 4 4 , 8 6 6 - 1 4 4 , 8 6 6 ( 4 , 2 2 9 ) - ( 4 , 2 2 9 ) - 3 , 7 8 4O t h e r s 3 7 , 7 9 1 3 7 , 7 9 1 - ( 3 0 9 ) ( 3 0 9 ) - 4 5 4 3 , 8 5 4T o t a l 1 , 4 9 2 , 9 5 8 3 1 4 , 4 2 2 1 , 1 7 8 , 5 3 6 ( 2 1 , 6 1 4 ) ( 2 4 , 9 4 7 ) 3 , 3 3 3 3 6 , 7 5 2 5 8 , 3 0 4
Unrealized gains and losses (I/S) B / S
Thousand of US$ Millions of won Equivalent

N O N - C O N S O L I D ATED NOTES TO FINANCIAL STATEMENTS December 31, 2000 and 1999
FINANCIAL STATEMENTS 59Hana Bank Annual Report 2000
Information of the amount of position and unrealized gains and losses of derivatives as of December 31, 2000 is as follows(millions of won) :
In accordance with the revised accounting rules of accounting for derivatives during the year ended December 31, 2000, the Bank recordedderivatives transaction on the balance sheet at fair value and recorded the unrealized gains and losses in current operations.
The Bank has entered into forward exchange contracts, currency futures and interest rate swaps with KOFEX. Related to the above, the Bankrecorded for the year ended December 31, 2000, W78,671 million and W47,777 million of gain and loss, respectively, on transaction of derivatives,and W7,183 million and W30,272 million of unrealized gain and unrealized loss, respectively, as other operating income(loss).
The Bank has entered into swap contracts to hedge against the risk of changes in the market interest rate and foreign exchange rate. Related tothe above, the Bank recorded for the year ended December 31, 2000, W5,192 million and W808 million of gain and loss, respectively, ontransaction of derivatives, and W6,374 million and W4,590 million of unrealized gain and unrealized loss, respectively, as other operatingi n c o m e ( l o s s ) .
In the normal course of business, the Bank enters into outstanding commitments, which under the banking accounting standards in the Republicof Korea, are not disclosed in the financial statements. In the opinion of management, these do not represent unusual risks of losses for the Bank.Certain commitments represent various degrees and types of risk to the Bank including credit, interest rate, foreign exchange rate, and liquidityrisk. In many cases, the commitments involving interest and foreign exchange result from decisions to hedge overall interest rate and foreignexchange risk. A summary of significant commitments, categorized in accordance with bank supervisory regulations is as follows:
The Bank, in relation to foreign confirmed acceptances and guarantees, has entered into credit derivatives purchase contract of W31,493 million(US$ 25 million) with Hans Merchant Bank as of December 31, 2000.
In connection with the Bank's letter of credit guarantee for Shinhan International Corporation amounting to US$ 3,397 thousand, SocieteGenerale, Seoul Branch has filed a lawsuit against the Bank claiming settlement. On December 11, 1998, the court determined that the Bankshould pay the claim, including interest for the delayed payment period and the cost of the lawsuit. The Bank made an immediate appeal to ahigher court by whose determination is the Bank won the case on October 24, 2000. Societe Generale, Seoul Branch made a final appeal to theSupreme Court and the result of the determination cannot be estimated as of December 31, 2000.
The Bank has entered into credit line commitments (W55,000 million limit) with several special purpose (asset-back securitization) companies tosupply sufficient funds for the repayment of bonds issued by the companies. There has not been any utilization of the credit line during the yearended December 31, 2000. Rationally expected annual credit amounts to be utilized are W13,900 million and W11,200 million in 2001 and 2002,r e s p e c t i v e l y .
Among the written-off claims of the Bank, the amount on which the legal rights of claims have not been expired is W494,308 million and W284,706million as of December 31, 2000 and 1999, respectively.
The Bank has entered into a commitment with Korea Asset Management Corporation ("KAMCO") to sell non-performing loans with the salesbeing dependent on the collection of the loans, or repurchase under certain conditions. As of December 31, 2000, the non-performing loans soldto KAMCO under the commitment are W68,680 million. The ultimate resolution of these transactions may affect the Bank's financial position,depending on the settlement or repurchase of the loans. The ultimate effect of these significant uncertainties on the settlement or repurchase ofthe non-performing loans as of the balance sheet date cannot presently be determined and accordingly, no adjustments have been made in theaccompanying financial statements related to such uncertainties other than those adjustments disclosed in these financial statements.
The Bank recognizes, in accordance with the Trust Business Act, trust fees from the banking accounts as income from trust operations. If lossesare incurred on trust accounts that have guarantee of principal repayment trust terms, the losses are recognized as a loss from trust operations.Based on the financial statements of Trust Accounts prepared in accordance with the Trust Business Act, the Bank recorded W133,698 millionand W42,942 million of other operating expenses as of December 31, 2000 and 1999, respectively.
Beginning in 1997, Korea and other countries in the Asia Pacific region experienced a severe contraction in substantially all aspects of theireconomies. This situation is commonly referred to as the 1997 Asian financial crisis. In response to this situation, the Korean government and theprivate sector began implementing structural reforms to historical business practices. The Korean economy is currently experiencing additionaldifficulties, particularly in the areas of restructuring private enterprises and reforming the banking industry. The Korean government continues toapply pressure to Korean companies to restructure into more efficient and profitable firms. The banking industry is currently undergoingconsolidations and significant uncertainty exists with regard to the availability of short-term financing during the coming year. The Bank may beeither directly or indirectly affected by the situation described above.
Millions of won
Commercial letters of credit W 1 , 2 9 0 , 6 1 9 W 1 , 2 3 4 , 3 1 0Loan commitments - 7 0Endorsed notes 1 5 0 , 6 9 0 4 7 , 4 9 9
2000 1999

N O N - C O N S O L I D ATED NOTES TO FINANCIAL STAT E M E N T SDecember 31, 2000 and 1999
60 FINANCIAL STATEMENTSHana Bank Annual Report 2000
The accompanying financial statements reflect management's current assessment of the impact to date of the economic situation on thefinancial position of the Bank. Actual results may differ materially from management's current assessment.
15. Capital Stock :
On January 8, 1999, as a direct result of the P&A (Purchase of assets and Assumption of liabilities) of Choong-Chung Bank and the mergerwith Boram Bank, the Bank issued 94,560,000 shares of non-cumulative, non-participating preferred stock for cash at W5,000 per share toKorea Deposit Insurance Corporation ("KDIC"). Upon executing the investment contract with KDIC, the Bank has a right to purchase ("calloption") these preferred stocks. As of December 31, 2000, preferred stock issued outstanding is 67,081,000 shares after the Bank exercised itscall option to purchase 27,479,000 shares on January 27, 2000. The terms for the options on the remaining 44,153,000 and 22,928,000 shares areuntil March 27, 2002 and March 27, 2004, respectively. If the Bank does not exercise its call options, the preferred shares will be converted tocommon stock after the end of the option term.
On April 21, 2000, the Bank issued 14,200,000 (par value of W5,000) common shares to Allianz AG (ownership of 12.46%) at W8,900 per share.The Bank recorded W55,013 million in capital surplus after deducting W367 million of stock issuance costs from W55,380 million of additionalpaid-in capital in excess of par value (Note 16).
During 1999 and 2000, the Bank granted stock options of 1,040,000 and 628,000 shares, respectively, to 57 members of the management.Depending on the Bank's future condition, the Bank may choose a cash benefit or the issuance of common stocks at an exercise price ofW10,020 and W8,500, respectively.
16. Capital Surplus:
Capital surplus as of December 31, 2000 and 1999 comprises the following :
Changes in paid-in capital in excess of par value for the years ended December 31, 2000 and 1999 are summarized as follows :
17. Retained Earnings:
Retained earnings as of December 31, 2000 and 1999 comprise the following :
(A) The general Banking Act requires the Bank to appropriate a minimum of 10% of net income annual income before income taxes as a legalreserve, until such reserve equals 100% of its paid-in capital. This reserve is not available for the payment of cash dividends, but may betransferred to capital stock or used to reduce accumulated deficit, if any.
Millions of won
Paid-in capital in excess of par value W 2 9 5 , 1 4 3 W 2 4 0 , 1 3 0Negative goodwill from merger 1 0 5 , 4 0 7 1 0 5 , 4 0 7O t h e r 2 4 7 2 4 7
W 4 0 0 , 7 9 7 W 3 4 5 , 7 8 4
2000 1999
Millions of won
Beginning balance W 2 4 0 , 1 3 0 W 1 6 9 , 0 8 4Paid-in capital in excess of par value 5 5 , 3 8 0 7 2 , 3 9 3Stock issuance costs ( 3 6 7 ) ( 1 , 3 4 7 )
Closing balance W 2 9 5 , 1 4 3 W 2 4 0 , 1 3 0
2000 1999
Millions of won
A p p r o p r i a t e d :Legal reserve ( A ) W 6 9 , 3 0 0 W 6 7 , 2 0 0Reserve for business rationalization ( B ) 1 0 , 6 0 0 1 0 , 6 0 0Reserve for overseas investment loss ( C ) - 1 2 , 2 0 0Reserve for future dividends ( D ) 5 0 , 8 0 0 6 2 , 8 0 0General purpose contingency reserve ( E ) 2 3 3 , 1 0 0 2 5 9 , 3 0 0
3 6 3 , 8 0 0 4 1 2 , 1 0 0U n a p p r o p r i a t e d 1 3 8 1 3 9
W 3 6 3 , 9 3 8 W 4 1 2 , 2 3 9
Reference 2000 1999

N O N - C O N S O L I D ATED NOTES TO FINANCIAL STATEMENTS December 31, 2000 and 1999
FINANCIAL STATEMENTS 61Hana Bank Annual Report 2000
(B) The reserve for business rationalization is appropriated in accordance with Korean tax laws and provides the Bank with a deduction fromtaxable income. This reserve is not available for payment of cash dividends, but may be transferred to capital stock or used to reduceaccumulated deficit, if any.
(C) Pursuant to the Korean tax laws, the Bank is allowed to claim the amount of retained earnings appropriated for reserve for overseasinvestment loss as deduction from taxable income for the current year. This reserve is not available for payment of dividends until used forthe specified purpose or reversed.
(D) The reserve for future dividends represents amounts appropriated by the Bank for equalizing dividend rates through the years of businessand can be used for any purpose by subsequent stockholders' resolution.
(E) The general-purpose contingency reserve does not have any specified purpose and may be restored to unappropriated retained earningsthrough future shareholders' resolution.
As of December 31, 2000 and 1999, the details of cumulative effects from the change of accounting, as adjusted to retained earnings, are as follows :
1) As of December 31, 2000
2) As of December 31, 1999
Millions of wonCumulative effect from accounting changes
Prior year losses from trust operations W ( 3 8 , 4 5 7 )Gains on valuation of derivatives 1 5 1Losses on valuation of derivatives ( 6 3 )
W ( 3 8 , 3 6 9 )
Millions of wonCumulative effect from accounting changes
Tax effect on deferred tax liability W ( 2 5 , 4 3 8 )Valuation of subsidiary stock on equity method ( 3 6 , 3 1 3 )Present value discounts on prior year's loans ( 3 , 1 4 4 )Change in depreciation method of buildings 1 , 3 9 6
W ( 6 3 , 4 9 9 )

N O N - C O N S O L I D ATED NOTES TO FINANCIAL STAT E M E N T SDecember 31, 2000 and 1999
62 FINANCIAL STATEMENTSHana Bank Annual Report 2000
18. Term Structures of Assets and Liabilities:
As of December 31, 2000, the term structures of assets and liabilities of the Bank are as follows (millions of Won) :
(*) including bills bought and factoring receivables.(**) including due to the Bank of Korea in foreign currency and bonds sold on repurchase agreements in foreign currency.
19. General and Administrative Expenses:
General and administrative expenses for the years ended December 31, 2000 and 1999 comprise the following :Millions of won
Salaries and wages W 1 3 4 , 9 4 4 W 1 2 6 , 0 8 5Severance benefits 1 2 , 0 7 7 9 , 7 4 2Fringe benefits 2 3 , 9 1 2 1 7 , 6 6 5R e n t 1 7 , 3 5 4 1 5 , 8 6 3E n t e r t a i n m e n t 8 , 9 0 6 2 , 6 9 0Depreciation and amortization 3 8 , 9 6 3 3 2 , 2 9 2Taxes and dues 2 2 , 7 0 8 2 0 , 4 7 1A d v e r t i s i n g 1 6 , 4 6 6 1 1 , 7 9 8Consulting fees 2 6 , 2 7 2 2 1 , 6 6 9O t h e r 3 9 , 0 3 1 4 0 , 7 0 1
W 3 4 0 , 6 3 3 W 2 9 8 , 9 7 6
2000 1999
1. In Won Currency( A s s e t s )Due from banks W 913,495 W 106,344 W 12,120 W 30,000 W 731,936 W 1,793,895S e c u r i t i e s 1 , 0 5 8 , 7 9 7 6 1 8 , 9 1 4 2 , 9 1 6 , 9 9 7 4 , 7 7 5 , 2 6 7 1 , 8 8 5 , 9 1 6 1 1 , 2 5 5 , 8 9 1Loans (*) 5 , 9 9 3 , 6 5 5 4 , 2 3 3 , 3 5 2 5 , 0 7 8 , 6 9 2 1 , 9 7 9 , 9 4 3 1 , 6 7 4 , 9 6 4 1 8 , 9 6 0 , 6 0 6Allowance for possible loan losses - - - - ( 6 6 2 , 9 2 7 ) ( 6 6 2 , 9 2 7 )O t h e r 3 , 0 5 8 , 6 9 6 3 3 7 , 4 5 0 5 1 5 , 8 7 4 1 , 0 2 9 , 6 1 1 1 , 6 5 7 , 7 7 8 6 , 5 9 9 , 4 0 9
1 1 , 0 2 4 , 6 4 3 5 , 2 9 6 , 0 6 0 8 , 5 2 3 , 6 8 3 7 , 8 1 4 , 8 2 1 5 , 2 8 7 , 6 6 7 3 7 , 9 4 6 , 8 7 4(Liabilities and Shareholder's equity)D e p o s i t s 1 1 , 8 0 8 , 4 5 7 3 , 9 9 5 , 1 0 4 5 , 4 1 3 , 6 8 7 8 6 6 , 7 9 2 3 , 5 7 9 , 3 5 3 2 5 , 6 6 3 , 3 9 3Certificate of deposits 5 8 1 , 5 4 2 7 3 0 , 6 4 3 2 4 6 , 1 8 2 3 5 6 , 0 8 9 - 1 , 9 1 4 , 4 5 6B o r r o w i n g s 5 5 4 , 4 6 3 2 5 , 6 1 2 5 3 , 9 1 1 2 8 2 , 8 9 1 2 6 2 , 0 1 8 1 , 1 7 8 , 8 9 5Shareholders' equity - - - - 1 , 7 5 8 , 3 9 5 1 , 7 5 8 , 3 9 5O t h e r 2 , 8 2 1 , 1 4 1 5 6 1 , 3 2 4 1 , 3 2 5 , 8 7 5 1 , 2 1 0 , 1 6 7 1 , 6 6 0 , 6 5 4 7 , 5 7 9 , 1 6 1
1 5 , 7 6 5 , 6 0 3 5 , 3 1 2 , 6 8 3 7 , 0 3 9 , 6 5 5 2 , 7 1 5 , 9 3 9 7 , 2 6 0 , 4 2 0 3 8 , 0 9 4 , 3 0 02. In foreign currencies( A s s e t s )Due from banks 4 9 3 , 4 0 5 1 8 , 8 9 5 - - - 5 1 2 , 3 0 0S e c u r i t i e s 5 1 0 , 3 6 2 1 7 , 3 8 9 3 1 , 1 2 7 8 7 , 7 8 7 1 5 , 9 3 8 6 6 2 , 6 0 3L o a n s 2 0 0 , 1 6 7 1 0 9 , 4 7 7 2 1 5 , 0 4 0 2 2 9 , 9 8 4 2 5 2 , 7 5 7 1 , 0 0 7 , 4 2 5Bills purchased 9 5 3 , 4 3 2 2 1 8 , 5 6 9 3 4 , 2 1 3 3 4 4 0 , 1 2 9 1 , 2 4 6 , 3 7 7Allowance for possible loan losses - - - - ( 1 3 0 , 3 6 7 ) ( 1 3 0 , 3 6 7 )O t h e r 4 9 3 , 4 9 2 - - - 3 5 , 4 4 5 5 2 8 , 9 3 7
2 , 6 5 0 , 8 5 8 3 6 4 , 3 3 0 2 8 0 , 3 8 0 3 1 7 , 8 0 5 2 1 3 , 9 0 2 3 , 8 2 7 , 2 7 5( L i a b i l i t i e s )D e p o s i t s 7 8 2 , 2 2 9 7 9 , 0 9 3 2 0 4 , 1 6 2 1 , 3 4 7 108,608 1 , 1 7 5 , 4 3 9Borrowings (**) 522,225 1 6 8 , 8 2 1 2 3 4 , 5 7 1 532,434 2 6 , 9 1 1 1 , 4 8 4 , 9 6 2O t h e r 493,795 - 1,260 428,298 96,095 1 , 0 1 9 , 4 4 8
W 1,798,249 W 247,914 W 439,993 W 962,079 W 231,614 W 3,679,849
1 ~ 3 month 3 ~ 6 month 6 month ~ 1 year 1 ~ 3 year T h e r e a f t e r T o t a l

N O N - C O N S O L I D ATED NOTES TO FINANCIAL STATEMENTS December 31, 2000 and 1999
FINANCIAL STATEMENTS 63Hana Bank Annual Report 2000
20. Non-operating Income and Non-operating Expenses:
Non-operating income for the years ended December 31, 2000 and 1999 comprise the following :
Non-operating expenses of the years ended December 31, 2000 and 1999 comprise the following :
21. Income Tax Expense:
Income tax expenses for the years ended December 31, 2000 and 1999 comprise the following:
The statutory income tax rate applicable to the Bank, including resident tax surcharges, is approximately 30.8%, however, effective tax rates forthe year ended December 31, 2000 and 1999 are approximately 38.0 and 32.0%, respectively, due to above adjustments.
Changes in accumulated temporary differences for the years ended December 31, 2000 are as follows (millions of Won) :
The Bank adjusted W5,728 million of accumulated temporary differences of the difference between prior year income taxes recorded in thebook and actual tax expense as a current increase (decrease) for the year ended December 31, 2000.
Millions of won
Gain on disposition of investment securities W 1 4 9 , 1 8 6 W 8 6 , 5 6 4Reversal of impairment loss on investment debt securities 1 4 , 7 3 1 -Unrealized gain on investment securities - 1 0 , 0 2 5Gain on equity method - 6 2 , 1 3 7Gain on sales of loans 1 6 , 6 3 8 1 7 , 7 6 2O t h e r 1 3 , 7 2 9 6 , 1 7 7
W 1 9 4 , 2 8 4 W 1 8 2 , 6 6 5
2000 1999
Millions of won
Loss on disposition of investment securities W 7 , 2 1 2 W 2 0 , 7 2 5Loss on impairment of investment securities 5 5 , 8 3 3 1 8 , 5 6 0Unrealized loss on investment securities 6 , 2 4 9 -Loss on equity method 1 5 , 6 5 7 -Loss on sales of loans 2 1 , 4 0 1 8 , 4 1 5O t h e r 9 , 1 3 4 3 , 6 8 2
W 1 1 5 , 4 8 6 W 5 1 , 3 8 2
2000 1999
Millions of won
Current income taxes W 8 1 , 6 5 7 W 5 7 , 4 1 4Deferred taxes ( 1 0 8 , 0 6 4 ) ( 1 6 , 2 3 7 )Realization of tax effect from tax loss carryforward 3 8 , 9 8 4 1 1 , 2 4 1Deferred tax adjustments to shareholders' equity - 1 5 , 4 9 3
W 1 2 , 5 7 7 W 6 7 , 9 1 1
2000 1999
Allowance for possible loan losses W 1 1 7 , 8 9 2 W 3 2 4 , 1 5 0 W 1 1 7 , 8 9 2 W 3 2 4 , 1 5 0Reserve for possible losses on acceptances and guarantees 4 9 , 9 1 4 - 9 , 9 1 3 4 0 , 0 0 1Accrued income ( 2 8 1 , 0 4 3 ) ( 2 0 9 , 4 2 8 ) ( 2 8 1 , 0 4 3 ) ( 2 0 9 , 4 2 8 )Gain on valuation of securities ( 2 0 , 4 3 3 ) ( 7 , 4 1 2 ) ( 1 0 , 5 6 2 ) ( 1 7 , 2 8 3 )Loss on valuation of securities 7 , 9 8 5 2 4 , 0 3 9 4 , 3 5 8 2 7 , 6 6 6Loss on impairment of investment securities 1 8 , 5 6 0 5 5 , 8 3 3 1 8 , 2 9 5 5 6 , 0 9 8Gain on equity method ( 6 2 , 1 9 7 ) ( 2 5 , 7 9 1 ) ( 2 3 , 5 4 7 ) ( 6 4 , 4 4 1 )Goodwill amortization 9 , 7 9 3 - 3 , 2 6 6 6 , 5 2 7Reserve for overseas investment loss ( 9 , 4 3 3 ) - ( 9 , 4 3 3 ) -Present value discounts 2 8 , 8 1 2 4 3 , 4 0 4 2 3 , 6 1 8 4 8 , 5 9 8O t h e r 2 4 , 1 8 5 2 1 , 2 6 4 1 6 , 7 1 8 2 8 , 7 3 1
W ( 1 1 5 , 9 6 5 ) W 2 2 6 , 0 5 9 W ( 1 3 0 , 5 2 5 ) W 2 4 0 , 6 1 9
Accounts Beginning Balance Increase Decrease Ending Balance

N O N - C O N S O L I D ATED NOTES TO FINANCIAL STAT E M E N T SDecember 31, 2000 and 1999
64 FINANCIAL STATEMENTSHana Bank Annual Report 2000
As of December 31, 2000 and 1999, deferred income tax assets (liabilities) from temporary differences comprise the following (millions of Won) :
(*) The tax effect of accumulated temporary differences from prior year was adjusted to retained earnings
(**) The tax loss carryforward is transferred in from Boram Bank and deductible in the future years under the Korean Tax Law.
22. Earnings Per Share and Ordinary Income Per Share:
Earnings per share and ordinary income per share for the years ended December 31, 2000 and 1999 are calculated as follows :
Diluted earnings per share and ordinary income per share for the year ended December 31, 2000 and 1999 are calculated as follows :
Korean Won
Diluted ordinary income per shareOrdinary income after income tax expenses W 10,686,119,091 W1 4 4 , 3 2 1 , 6 0 8 , 2 6 8Dividends on Preferred Stock ( 5 , 5 6 1 , 7 0 0 , 0 0 0 )Interest expense on convertible bonds - 4 , 9 1 8 , 6 3 2 , 0 7 4
5,124,419,091 1 4 9 , 2 4 0 , 2 4 0 , 3 4 2Weighted average number of common shares 121,587,355 2 0 2 , 8 0 3 , 8 0 4
W 4 2 W 7 3 6Diluted earnings per shareNet Income W 2 0 , 5 0 1 , 2 9 3 , 7 3 7 W1 4 4 , 3 2 1 , 6 0 8 , 2 6 8Interest expense on convertible bonds - 4 , 9 1 8 , 6 3 2 , 0 7 4
2 0 , 5 0 1 , 2 9 3 , 7 3 7 1 4 9 , 2 4 0 , 2 4 0 , 3 4 2Weighted average number of common shares 1 8 8 , 6 6 8 , 3 5 5 2 0 2 , 8 0 3 , 8 0 4
W 1 0 9 W 7 3 6
2000 1999
Accumulated temporary differences as of beginning of the year (*) W ( 1 1 5 , 9 6 5 ) W ( 3 5 , 7 1 7 ) W ( 1 6 8 , 6 8 2 ) W ( 5 1 , 9 5 4 )
Tax effect from Tax loss carryforward (**) 1 6 8 , 5 2 6 5 1 , 9 0 6 2 9 7 , 2 9 9 9 1 , 5 6 8Changes in temporary differences for the period 3 5 6 , 5 8 4 1 0 9 , 8 2 8 5 2 , 7 1 7 1 6 , 2 3 7
W 4 0 9 , 1 4 5 W 1 2 6 , 0 1 7 W 1 8 1 , 3 3 4 W 5 5 , 8 5 1
2000 1999
Deferred income tax Deferred income taxTotal amounts assets (liabilities) Total amounts assets (liabilities)
Korean Won
Ordinary income per shareOrdinary Income after income tax expenses W 1 0 , 6 8 6 , 1 1 9 , 0 9 1 W1 4 4 , 3 2 1 , 6 0 8 , 2 6 8Dividends on Preferred stock ( 5 , 5 6 1 , 7 0 0 , 0 0 0 ) ( 8 , 0 2 3 , 0 0 0 , 0 0 0 )
5 , 1 2 4 , 4 1 9 , 0 9 1 1 3 6 , 2 9 8 , 6 0 8 , 2 6 8Weighted average of common shares 1 2 0 , 0 5 6 , 6 2 3 1 0 0 , 7 6 3 , 7 3 9
Ordinary Income per share W 4 3 W 1 , 3 5 3
Earnings per shareNet Income W 2 0 , 5 0 1 , 2 9 3 , 7 3 7 W1 4 4 , 3 2 1 , 6 0 8 , 2 6 8Dividends on Preferred Stock ( 5 , 5 6 1 , 7 0 0 , 0 0 0 ) ( 8 , 0 2 3 , 0 0 0 , 0 0 0 )
1 4 , 9 3 9 , 5 9 3 , 7 3 7 1 3 6 , 2 9 8 , 6 0 8 , 2 6 8Weighted average of common shares 1 2 0 , 0 5 6 , 6 2 3 1 0 0 , 7 6 3 , 7 3 9
Earnings per share W 1 2 4 W 1 , 3 5 3
2000 1999

N O N - C O N S O L I D ATED NOTES TO FINANCIAL STATEMENTS December 31, 2000 and 1999
FINANCIAL STATEMENTS 65Hana Bank Annual Report 2000
23. Related Party Transactions:
Significant operating transactions with related parties during the years December 31, 2000 and 1999 and related account balances atDecember 31, 2000 and 1999 are as follows (millions of Won) :
1) 2000
2) 1999
The Bank, as of December 31, 2000 and 1999, is providing medical expenses and housing funds to its employees for the betterment ofemployees' health and housing stability.
24. Information on Operating Segments:
The Bank's service line is composed of its Corporate Banking Group, Retail Banking Group, Choong-Chung Banking Group, the TreasuryGroup, and other administrative and trust segments. Financial information for each operating segment is as follows (in millions of won) :
1) For the year ended December 31, 2000
2) For the year ended December 31, 1999
Operating income W 7 5 6 , 0 9 9 W 3 8 6 , 9 6 3 W 2 1 1 , 2 6 9 W 1 , 3 7 4 , 2 8 8 W 2 , 7 2 8 , 6 1 9L o a n s 8 , 0 5 5 , 4 7 4 4 , 2 5 6 , 1 9 2 1 , 1 9 9 , 9 1 4 3 , 7 7 9 , 0 2 7 1 7 , 2 9 0 , 6 0 7S e c u r i t i e s - - 4 1 1 , 6 2 2 9 , 2 9 6 , 5 3 8 9 , 7 0 8 , 1 6 0D e p o s i t s / b o r r o w i n g s ( * ) 6 , 1 8 6 , 8 9 0 1 5 , 2 8 5 , 2 1 2 2 , 8 9 6 , 2 4 8 3 , 7 1 5 , 8 2 8 2 8 , 0 8 4 , 1 7 8
(*) Including call money, bonds sold on repurchase agreements, bills sold, due to the Bank of Korea in foreign currencies, and debentures.
Corporate Retail Banking Choong-Chung TreasuryBanking Group Group Banking Group Group & other Total
Related parties Account balances T r a n s a c t i o n s
Hana Securities L o a n s W 3,398 Interest income W 123D e p o s i t s 1 4 , 8 3 7 Interest expenses 6 9 5
Hana Research D e p o s i t s 3 0 7 Consulting fees 1 , 0 0 4Interest expenses 6
Hana Risjad Finance L o a n s 7 , 5 2 8 Interest income 4 1 9Interest expenses 7
Related parties Account balances T r a n s a c t i o n s
Hana Securities L o a n s 3 , 5 0 7 Interest income 2 , 7 9 9D e p o s i t s 9 , 7 7 9 Interest expenses 1 , 2 0 1
Hana Research D e p o s i t s 2 7 Consulting fees 9 9 8Interest expenses 4 3
Korea Merchant - Interest income 1 2Banking Corporation Interest expenses 7
Hana Risjad Finance - Interest income 4Interest expenses 6 0
Operating revenue W 8 7 6 , 4 2 7 W 5 7 6 , 8 0 1 W 2 1 4 , 1 5 3 W 1 , 9 4 3 , 2 4 9 W 3 , 6 1 0 , 6 3 0L o a n s 1 0 , 2 7 1 , 7 6 8 7 , 5 9 3 , 6 9 2 1 , 9 8 2 , 2 0 1 4 , 8 9 1 , 2 0 1 2 4 , 7 3 8 , 8 6 2S e c u r i t i e s - - 2 8 4 , 3 0 1 1 1 , 6 3 4 , 1 9 3 1 1 , 9 1 8 , 4 9 4D e p o s i t s / b o r r o w i n g s ( * ) 8 , 1 6 0 , 2 5 5 2 0 , 1 6 4 , 8 7 4 4 , 2 0 6 , 1 2 0 3 , 2 2 7 , 8 2 0 3 5 , 7 5 9 , 0 6 9
Corporate Retail Banking Choong-Chung TreasuryBanking Group Group Banking Group Group & other Total

25. Results of the Trust business:
For the years ended December 31, 2000 and 1999, the results of operations related to the trust business are as follows.
26. Purchase of Assets and Assumption of Liabilities Contract:
The Bank has entered into a "Purchase of Assets and Assets and Assumption of Liabilities" (hereafter "P&A") contract, effective June 29, 1998,to purchase certain assets and assume most of the liabilities of Choong-Chung Bank which ceased operations as of June 29, 1998 by theorder of the Financial Supervisory Commission.
According to the P&A contract, only the performing assets were purchased by the Bank and all non-performing assets were transferred tothe Korea Asset Management Corporation ("KAMCO"). Any future economic loss arising from the non-performing assets will be absorbedaccording to the P&A contract and the subscription agreement with Korea Deposit Insurance Corporation.
On March 31, June 30, and September 30, 1999, put options were executed according to the P&A arrangement. As a consequence of the putoptions, the Bank received cash and securities of W388,045 million from KDIC and KAMCO.
27. Business combination:
On January 1, 1999, the Bank merged with Boram Bank, whose business is similar to that of Hana Bank. The Bank issued 8,761,986 shares ofcommon stock in exchange for all of the issued and outstanding shares of Boram Bank. The exchange rate was 0.2549 share and 0.1485 shareof the Bank's common stock for each share of Boram Bank's common stock and preferred stock, respectively.
28. Reclassification of Financial Statements at December 31, 1999:
Certain accounts in the financial statements at December 31, 1999 have been reclassified to conform to the 2000 presentation. Thesereclassifications had no effect on previously reported net income or stockholders' equity.
29. Event after Balance Sheet Date:
Hana Risjad Finance, the Bank's subsidiary located in Indonesia, had been in the process of liquidation during 2000 and the Bank sold all ofshares of the company to PT. AITI Investment Co. for US$3 million on February 21, 2001.
On January 30, 2001, the Bank has purchased 27,479,000 shares, at W5,000(par value) per share, of its redeemable preferred stock which hadbeen issued and outstanding with the subscription agreements between the Bank and KDIC(see note 5). The stocks are recorded as treasurystocks in capital adjustment.
66 FINANCIAL STATEMENTSHana Bank Annual Report 2000
Millions of won
Trust fees W 1 6 3 , 0 2 4 W 1 7 1 , 5 6 2Early termination fees 3 , 5 1 8 9 , 9 8 7
Operating revenue of trust operations 1 6 6 , 5 4 2 1 8 1 , 5 4 9
Operating loss of trust operations W 1 3 3 , 6 9 8 W 4 2 , 9 4 2
2000 1999
N O N - C O N S O L I D ATED NOTES TO FINANCIAL STAT E M E N T SDecember 31, 2000 and 1999

R e p o rt of Independent Accountants
To the Board of Directors Hana Bank
We have audited the accompanying balance sheet of trust accounts which Hana Bank ("the Bank") operates, as of December 31, 2000, and therelated statement of operations of trust accounts for the year then ended. These financial statements are the responsibility of the Bank'smanagement. Our responsibility is to express an opinion on these financial statements based on our audit.
We conducted our audit in accordance with auditing standards for trust funds generally accepted in the Republic of Korea. Those standardsrequire that we plan and perform the audit to obtain reasonable assurance about whether the financial statements are free of materialmisstatement. An audit includes examining, on a test basis, evidence supporting the amounts and disclosures in the financial statements. Anaudit also includes assessing the accounting principles used and significant estimates made by management, as well as evaluating the overallfinancial statement presentation. We believe that our audit provides a reasonable basis for our opinion.
In our opinion, the financial statements referred to above present fairly, in all material respects, the financial position of trust accounts as ofDecember 31, 2000, and the results of their operations for the year then ended in accordance with trust accounting standards generally acceptedin the Republic of Korea.
Without qualifying our opinion, we draw attention to note 7 to the financial statements. The operations of trust accounts have been significantlyaffected, and may continue to be affected for the foreseeable future, by the general adverse economic conditions in the Republic of Korea and inthe Asia Pacific region. The ultimate effects of these uncertainties on the financial position of trust accounts as of December 31, 2000 can notpresently be determined and accordingly, no adjustments have been made in the accompanying financial statements related to suchu n c e r t a i n t i e s .
The amounts expressed in U.S. Dollars are provided solely for the convenience of the reader and have been translated on the basis set forth innote 3 to the financial statements.
The accompanying financial statements are not intended to present the financial position and results of operations of trust accounts inaccordance with trust accounting principles and practices generally accepted in countries and jurisdictions other than the Republic of Korea.The procedures and practices utilized to audit such financial statements may differ from those generally accepted and applied in other countriesand jurisdictions. Accordingly, this report and the accompanying financial statements are not intended for use by those who are not informedabout Korean trust accounting principles or auditing standards and their application in practice.
Seoul, KoreaFebruary 23, 2001
FINANCIAL STATEMENTS 67Hana Bank Annual Report 2000
Samil Accounting CorporationKukjae Center Building 21st Flr.191 Hangangro 2ga, YongsankuSeoul 140-702, KOREA(C.P.O Box 2170, 100-621)

In Millions ofKorean Won
In Thousands of U.S.Dollars (Note 3)
A s s e t sCash and due from banks W 5 , 3 4 0 $ 4 , 2 3 9
Loans :Loans collateralized by real estate 4 9 5 , 4 1 6 3 9 3 , 2 8 1Loans collateralized by other than real estate 9 7 , 4 3 7 7 7 , 3 4 9Uncollateralized loans 7 1 8 , 9 3 2 5 7 0 , 7 1 7
1 , 3 1 1 , 7 8 5 1 , 0 4 1 , 3 4 7Securities :
Government and public bonds 1 , 1 8 5 , 4 7 8 9 4 1 , 0 7 9Debentures issued by financial institutions 7 7 9 , 0 2 3 6 1 8 , 4 2 0Corporate bonds 1 , 7 6 3 , 0 0 8 1 , 3 9 9 , 5 4 6S t o c k s 9 4 0 , 2 3 1 7 4 6 , 3 9 3Bills purchased 2 , 1 5 1 , 6 8 7 1 , 7 0 8 , 0 9 5Other securities 8 2 7 , 1 6 7 6 5 6 , 6 3 8
7 , 6 4 6 , 5 9 4 6 , 0 7 0 , 1 7 1
Call loans 4 2 0 , 0 0 0 3 3 3 , 4 1 3Accrued income 2 4 1 , 1 8 2 1 9 1 , 4 5 9Due from banking accounts (Note 6) 8 0 2 , 7 6 6 6 3 7 , 2 6 8O t h e r 5 0 5 4 0 1(Allowance for possible loan losses) ( 1 6 5 , 2 3 6 ) ( 1 3 1 , 1 7 1 )
Total assets W 1 0 , 2 6 2 , 9 3 6 $ 8 , 1 4 7 , 1 2 7
L I A B I L I T I E SMoney trusts
Installment money trusts W 5 8 4 , 6 2 8 $ 4 6 4 , 1 0 1Household money trusts 1 , 0 2 4 , 6 4 8 8 1 3 , 4 0 6Development money trusts 3 6 0 , 2 5 0 2 8 5 , 9 8 1New installment money trusts 7 3 4 , 1 8 1 5 8 2 , 8 2 2Retirement trusts 2 2 2 , 9 4 5 1 7 6 , 9 8 2
Specified money trusts 3 , 8 9 6 , 2 0 1 3 , 0 9 2 , 9 6 0Open money trusts 8 6 9 , 0 8 2 6 8 9 , 9 1 2New old-age pension trusts 5 7 1 , 9 9 2 4 5 4 , 0 7 0Unit money trusts 7 5 9 , 5 5 8 6 0 2 , 9 6 7O t h e r 5 5 4 , 3 4 1 4 4 0 , 0 5 8
9 , 5 7 7 , 8 2 6 7 , 6 0 3 , 2 5 9
Security management trusts 2 0 0 , 8 6 9 1 5 9 , 4 5 8Unearned income 3 9 , 3 0 0 3 1 , 1 9 8Accrued trust fees payable 1 5 , 9 1 0 1 2 , 6 3 0Accrued trust dividends payable 3 9 4 , 7 7 7 3 1 3 , 3 9 0Present value discounts 2 7 , 3 0 1 2 1 , 6 7 3Reserve for future trust losses 6 , 1 7 9 4 , 9 0 5O t h e r 7 7 4 6 1 4
Total liabilities W 1 0 , 2 6 2 , 9 3 6 $ 8 , 1 4 7 , 1 2 7
2000 1999
The accompanying notes are an integral part of these statements.
68 FINANCIAL STATEMENTSHana Bank Annual Report 2000
BALANCE SHEET OF TRUST ACCOUNTSDecember 31, 2000 and 1999
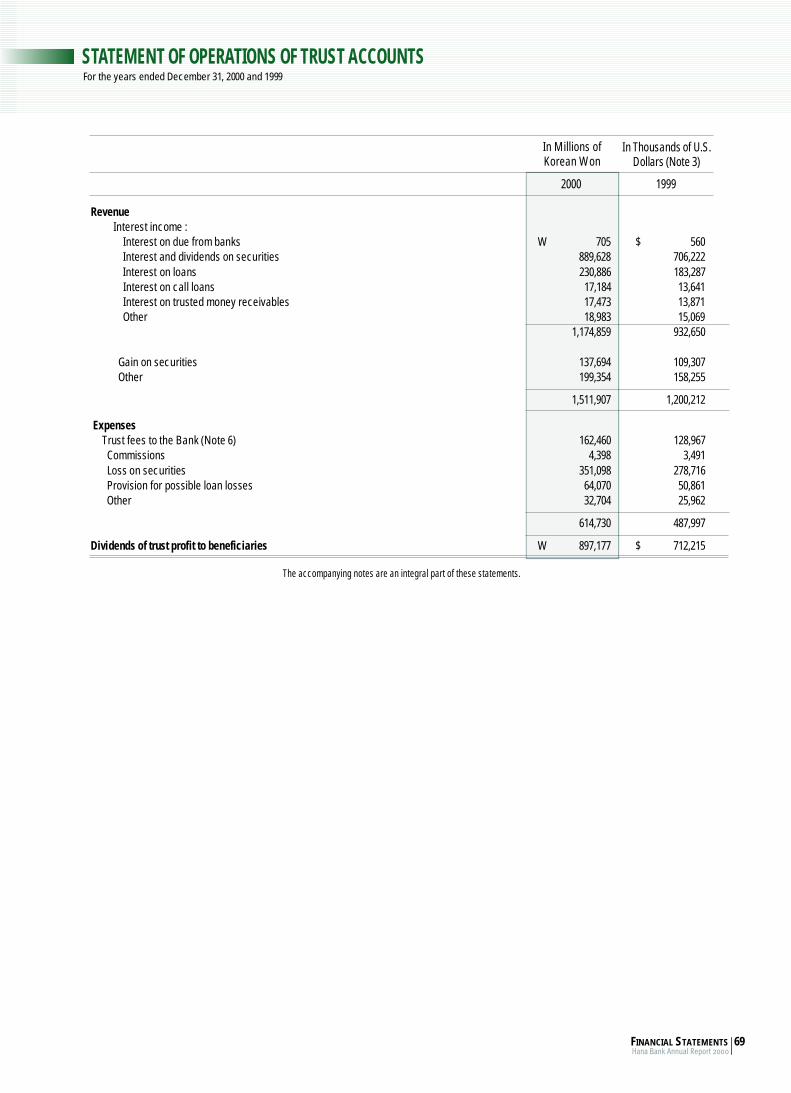
FINANCIAL STATEMENTS 69Hana Bank Annual Report 2000
S TATEMENT OF OPERATIONS OF TRUST ACCOUNTSFor the years ended December 31, 2000 and 1999
In Millions ofKorean Won
In Thousands of U.S.Dollars (Note 3)
R e v e n u eInterest income :
Interest on due from banks W 7 0 5 $ 5 6 0Interest and dividends on securities 8 8 9 , 6 2 8 7 0 6 , 2 2 2Interest on loans 2 3 0 , 8 8 6 1 8 3 , 2 8 7Interest on call loans 1 7 , 1 8 4 1 3 , 6 4 1Interest on trusted money receivables 1 7 , 4 7 3 1 3 , 8 7 1O t h e r 1 8 , 9 8 3 1 5 , 0 6 9
1 , 1 7 4 , 8 5 9 9 3 2 , 6 5 0
Gain on securities 1 3 7 , 6 9 4 1 0 9 , 3 0 7O t h e r 1 9 9 , 3 5 4 1 5 8 , 2 5 5
1 , 5 1 1 , 9 0 7 1 , 2 0 0 , 2 1 2
E x p e n s e sTrust fees to the Bank (Note 6) 1 6 2 , 4 6 0 1 2 8 , 9 6 7C o m m i s s i o n s 4 , 3 9 8 3 , 4 9 1Loss on securities 3 5 1 , 0 9 8 2 7 8 , 7 1 6Provision for possible loan losses 6 4 , 0 7 0 5 0 , 8 6 1O t h e r 3 2 , 7 0 4 2 5 , 9 6 2
6 1 4 , 7 3 0 4 8 7 , 9 9 7
Dividends of trust profit to beneficiaries W 8 9 7 , 1 7 7 $ 7 1 2 , 2 1 5
2000 1999
The accompanying notes are an integral part of these statements.

1. The trustee:
Hana Bank("the Bank"), the trustee, was incorporated in 1971 as Korea Investment and Finance Corporation under the Commercial Code of theRepublic of Korea to provide financing services as a financial intermediary. On September 20, 1972, the Bank was granted approval by theMinistry of Finance (presently the Ministry of Finance and Economy) to operate under the short-term Financing Business Law.
On June 29, 1991, the Bank was granted approval by the Ministry of Finance (presently the Ministry of Finance and Economy) to engage inbanking activities and the Bank's name was changed to Hana Bank. It became a nationwide commercial bank in July 1991.
On June 29, 1998, the Bank purchased certain assets and assumed most of the liabilities of Choong-Chung Bank by the order of the FinancialSupervisory Commission. In addition, the Bank completed the merger with Boram Bank as of January 1, 1999.
The Bank is engaged in the commercial banking business under the Banking Act, in the foreign exchange transaction business, in the trustbusiness under the Trust Business Act and in other related businesses.
On June 5, 1972, the Bank listed its shares on the Korean Stock Exchange. On February 12, 1973, the Bank was registered as a foreign capitalinvested company under the Foreign Capital Inducement Law. The Bank's common stock and preferred stock outstanding as of December 31,2000 are W621,816 million and W335,405 million, respectively.
2. Summary of Significant Accounting Policies :
The financial statements of trust accounts are prepared in accordance with the Trust Business Act, except for certain items not specified inthe Act which were prepared in accordance with the trust accounting standards generally accepted in the Republic of Korea. The significantaccounting policies applied in the preparation of the accompanying financial statements of trust accounts are summarized as follows.
Revenue and Expenses of Trust Accounts
The trust accounts recognizes interest income and other revenues as trust revenue, and also trust operating expenses, dividends of trust profitto the beneficiaries, trust fees to the Bank and other expenses as trust expenses.
Interest Income Recognition
Interest income on loans and investment securities are recognized on an accrual basis, while interest income on overdue and dishonoredloans and securities, except for those guaranteed by financial institutions or collateralized by deposits, is recognized on a cash basis.
Allowance for possible loan losses
The trust accounts classify corporate loans (including bills, privately placed debentures and securities not marked-to-market) and calculate theallowance for possible loan losses by incorporating the borrowers' future debt service capacity ("Forward Looking Criteria (FLC)"), rather thansolely past performance, by applying the credit rating system. The credit rating system considers the financial and non-financial factors ofborrowers and classifies borrowers' credit risk by thirteen ratings (1,2,3,4,5,6,7+,7,8+,8,9,10+,10). Provisions are determined by applying thefollowing minimum percentages to each of credit ratings and loan classifications;
Credit ratings Loan classifications Provision percentages
1 ~ 8+ N o r m a l 0 ~ 1.2%8 P r e c a u t i o n a r y 2 %9 S u b s t a n d a r d 2 0 %
1 0 + D o u b t f u l 5 0 %1 0 Estimated loss 1 0 0 %
Household loans are classified based on the delinquent periods, value of collateral, and reasonably estimated collectibility.
Present Value Discounts
If the present value of a loan is significantly different from book value due to rescheduling of terms as agreed by the related parties (as in thecase of court receivership, court mediation or workout), the present value discounts on the loan is offset against the allowance for possibleloan losses, if available, or charged to current expense.
The difference between book value and present value is recorded as 'present value discounts' in the balance sheet and amortized to currentearnings over the related period using the effective interest rate method.
Securities
The valuation methods used for the securities are summarized as follows.
Valuation method
Marketable stocks and Beneficial certificates Market valueNon-marketable stocks C o s tDebt securities Market valueOther securities C o s t
70 FINANCIAL STATEMENTSHana Bank Annual Report 2000
NOTES TO FINANCIAL STATEMENTS OF TRUST ACCOUNTSDecember 31, 2000

NOTES TO FINANCIAL STATEMENTS OF TRUST ACCOUNTSDecember 31, 2000
Under the transition clause prescribed in Trust Supervision Act, the debt securities and other securities managed in the unspecified moneytrusts, established before November 15, 1998, are not valued by marking to market. Instead, the loan valuation method is applied to thesesecurities and the related unrealized losses are charged to the allowance for possible loan losses.
The securities included in specified money trusts and property trusts are stated at cost.
Due from Banking Accounts
The trust accounts deposit certain amounts with the banking accounts for short-term cash management purposes, and account for them asdue from banking accounts.
Reserve for future trust losses
The trust accounts have provided more than 25% of the trust fees as special reserve until the amount of special reserve equals 5% of investedcapital for certain money trusts which provide guarantees of a principal or a minimum rate of return. For the year ended December 31, 2000, theprovision for the special reserve was W3,708 million.
Dividends of trust profit to beneficiaries
The dividends calculated by the trust revenue deducted by the trust fees to the Bank and other administrative expenses are disbursed to thebeneficiaries and charged to the expenses in trust operation.
Trust Fees
The trust accounts provide trust fees to the Bank for its management of trust assets and operations, and accounts for them as operatingexpenses. For the year ended December 31, 2000, W162,460 million of trust fees was provided and W15,910 million is accounted as accruedtrust fees payable as of December 31, 2000.
3. United States Dollar Amounts :
The Bank's trust accounts operate primarily in Korean won and their official accounting records are maintained in Korean won. The U.S. dollaramounts are provided herein as supplementary information solely for the convenience of the reader. All won amounts are expressed in U.S.dollars at the rate of W1,259.7:US$1, the base exchange rate on December 31, 2000. This presentation is not required by or in accordance withKorean or United States generally accepted accounting principles, and should not be constructed as a representation that the Won amountsshown could be converted in or settled in U.S. dollars at this or any other rate.
4. Details of Trust Funds
The details of the money trust businesses at December 31, 2000 are as follows :Trust Terms
Guarantee of principal repayment or minimum
T r u s t s Period (Years) Dividend rate rate of return
General unspecified money trusts Over 1.5 F i x e d Y e sInstallment money trusts Over 1.5 F l o a t i n g N o ( * )Household money trusts Over 1.5 " N oDevelopment trusts 2 and 3 F i x e d Y e sOld-age living pension trusts Over 5 F l o a t i n g Y e sCorporation money trusts Over 1.5 " N o ( * )Individual pension trusts Over 15 " Y e sHousehold long-term money trusts 3 - 5 " N oLabor preferential trusts 3 - 5 " N oNew installment trusts Over 1.5 " N oRetirement trusts - " Y e sSpecified money trusts: Over 0.25 " N oUnit money trusts Over 1 " N oOpen money trusts 0 . 2 5 - 1 " N oReal estate investment trusts - " N oNew individual pension trusts Over 15 " Y e sNew old-age pension trusts Over 5 " Y e sNew labor preferential trusts 3 - 5 " N oTestament trusts - " N o
(*) The principal repayment is guaranteed for customer accounts opened before April 30, 1996.
General unspecified money trusts, development trusts and some accounts of installment money trusts are subject to a guaranteed principalamount and a fixed rate of return.
FINANCIAL STATEMENTS 71Hana Bank Annual Report 2000

5. Classified Financial Statements of Trust Accounts :
The balance sheet and statement of operations of trust accounts as of December 31, 2000 are classified into principal or dividend guaranteetrusts and performance trusts as follows (millions of Won) :
Classified Balance SheetsMillions of Won
Principal or Dividend P e r f o r m a n c eGuaranteed Trusts T r u s t s T o t a l
( A s s e t s )Cash and due from banks W - W 5 , 3 4 0 W 5 , 3 4 0S e c u r i t i e s 1 , 4 8 0 , 8 8 9 6 , 1 6 5 , 7 0 5 7 , 6 4 6 , 5 9 4L o a n s 4 6 4 , 1 4 8 8 4 7 , 6 3 7 1 , 3 1 1 , 7 8 5Call loans - 4 2 0 , 0 0 0 4 2 0 , 0 0 0Other assets 3 9 , 8 8 2 2 0 1 , 8 0 5 2 4 1 , 6 8 7Due from banking accounts 5 1 6 , 8 0 7 2 8 5 , 9 5 9 8 0 2 , 7 6 6(Allowance for possible loan losses) ( 1 2 5 , 9 7 0 ) ( 3 9 , 2 6 6 ) ( 1 6 5 , 2 3 6 )
T o t a l W 2 , 3 7 5 , 7 5 6 W 7 , 8 8 7 , 1 8 0 W 1 0 , 2 6 2 , 9 3 6
( L i a b i l i t i e s )Money and other trusts W 2 , 2 0 8 , 4 3 8 W 7 , 5 7 0 , 2 5 7 W 9 , 7 7 8 , 6 9 5Other liabilities 1 6 1 , 1 3 9 3 1 6 , 9 2 3 4 7 8 , 0 6 2Reserve for future trust losses 6 , 1 7 9 - 6 , 1 7 9
T o t a l W 2 , 3 7 5 , 7 5 6 W 7 , 8 8 7 , 1 8 0 W 1 0 , 2 6 2 , 9 3 6
Classified Statement of OperationsMillions of Won
Principal or Dividend P e r f o r m a n c eGuaranteed Trusts T r u s t s T o t a l
( R e v e n u e )Interest income W 3 8 5 , 4 1 5 W 7 8 9 , 4 4 4 W 1 , 1 7 4 , 8 5 9Gain on securities 4 2 , 2 4 9 9 5 , 4 4 5 1 3 7 , 6 9 4O t h e r 1 6 6 , 6 5 1 3 2 , 7 0 3 1 9 9 , 3 5 4
5 9 4 , 3 1 5 9 1 7 , 5 9 2 1 , 5 1 1 , 9 0 7( E x p e n s e )
Loss on securities 1 0 7 , 4 0 0 2 4 3 , 6 9 8 3 5 1 , 0 9 8Trust fees to the Bank 4 4 , 2 8 6 1 1 8 , 1 7 4 1 6 2 , 4 6 0Provision for possible loan losses 4 5 , 4 5 2 1 8 , 6 1 8 6 4 , 0 7 0O t h e r 1 8 , 4 4 5 1 8 , 6 5 7 3 7 , 1 0 2
2 1 5 , 5 8 3 3 9 9 , 1 4 7 6 1 4 , 7 3 0
Dividends of trust profit to beneficiaries W 3 7 8 , 7 3 2 W 5 1 8 , 4 4 5 W 8 9 7 , 1 7 7
6. Related Party Transactions :
The details of transactions with the banking accounts of the Bank for the year ended December 31, 2000 and related account receivables andpayables as of December 31, 2000 are summarized as follows.
A c c o u n t Millions of Won
Trust fees to the Bank W 1 6 2 , 4 6 0Interest on due from banking accounts 1 9 , 6 2 5Due from banking accounts 8 0 2 , 7 6 6
7. Commitments and Contingencies :
Written-off claims of trust accounts on which the legal rights of claims have not been expired totaled W3,028 million as of December 31, 2000.
Beginning in 1997, Korea and other countries in the Asia Pacific region experienced a severe contraction in substantially all aspects of theireconomies. This situation is commonly referred to as the 1997 Asian financial crisis. In response to this situation, the Korean government andthe private sector began implementing structural reforms to historical business practices
The Korean economy is currently experiencing additional difficulties, particularly in the areas of restructuring private enterprises and reformingthe banking industry. The Korean government continues to apply pressure Korean companies to restructure into more efficient and profitablefirms. The banking industry is currently undergoing consolidations and significant uncertainty exists with regard to the availability of short-termfinancing during the coming year. The trust accounts of the Bank may be either directly or indirectly affected by the situation described above.
The accompanying financial statements reflect management's current assessment of the impact to date of the economic situation on thefinancial position of trust accounts. Actual results may differ from management's current assessment.
72 FINANCIAL STATEMENTSHana Bank Annual Report 2000
NOTES TO FINANCIAL STATEMENTS OF TRUST ACCOUNTSDecember 31, 2000

R e p o rt of Independent Accountants
To the Board of Directors and Shareholders of Hana Bank
We have audited the accompanying consolidated balance sheets of Hana Bank and its subsidiaries ("the Bank") as of December 31, 2000 and1999, and the related consolidated statements of income, changes in equity and cash flows for the years then ended. These consolidatedfinancial statements are the responsibility of the Bank's management. Our responsibility is to express an opinion on these consolidated financialstatements based on our audits.
We conducted our audits in accordance with auditing standards generally accepted in the Republic of Korea. Those standards require that weplan and perform the audit to obtain reasonable assurance about whether the consolidated financial statements are free of materialmisstatement. An audit includes examining, on a test basis, evidence supporting the amounts and disclosures in the consolidated financialstatements. An audit also includes assessing the accounting principles used and significant estimates made by management, as well asevaluating the overall financial statement presentation. We believe that our audits provide a reasonable basis for our opinion.
In our opinion, the consolidated financial statements referred to above present fairly, in all material respects, the financial position of Hana Bankand its subsidiaries as of December 31, 2000 and 1999, and the results of their operations, the changes in their equity, and their cash flows for theyears then ended in accordance with financial accounting standards generally accepted in the Republic of Korea.
As discussed in note 2 to the consolidated financial statements, since 1999, the Bank changed its method of accounting and presentation forcertain items in accordance with revised financial accounting standards. The accounting changes include accounting treatment for theallowance for possible loan losses, valuation of securities, valuation of receivable under troubled debt restructurings, reserve for possible losseson acceptances and guarantees, deferred taxes, prior period adjustments, and stock issuance costs.
As discussed in note 2 to the consolidated financial statements, the Bank sold entire shares of Hana Risjad Finance, the Bank's subsidiarylocated in Indonesia to PT. AITI Investment Co. for US$ 2,750 thousand on February 21, 2000. Hana Risjad Finance is excluded from consolidationin the accompanying consolidated financial statements as of December 31, 2000.
Without qualifying our opinion, we draw attention to note 6 to the consolidated financial statements. The operations of the Bank have beensignificantly affected, and may continue to be affected for the foreseeable future, by the general adverse economic conditions in the Republic ofKorea and in the Asia Pacific region. Under these adverse economic conditions, certain customers of the Bank, including Daewoo Groupcompanies, have been or are in the process of restructuring loans with their creditor banks and certain companies of Hyundai Group are underliquidity crisis. The ultimate effect of these uncertainties on the financial position of the Bank as of December 31, 2000 can not presently bedetermined and accordingly, no adjustments have been made in the accompanying consolidated financial statements related to suchu n c e r t a i n t i e s .
The amounts expressed in U.S. Dollars are provided solely for the convenience of the reader and have been translated on the basis set forth innote 3 to the consolidated financial statements.
The accompanying consolidated financial statements are not intended to present the financial position, results of operations and cash flows inaccordance with accounting principles and practices generally accepted in countries and jurisdictions other than the Republic of Korea. Theprocedures and practices utilized to audit such financial statements may differ from those generally accepted and applied in other countries andjurisdictions. Accordingly, this report and the accompanying consolidated financial statements are not intended for use by those who are notinformed about Korean accounting principles or auditing standards and their application in practice.
Seoul, KoreaJanuary 26, 2001
FINANCIAL STATEMENTS 73Hana Bank Annual Report 2000
Samil Accounting CorporationKukjae Center Building 21st Flr.191 Hangangro 2ga, YongsankuSeoul 140-702, KOREA(C.P.O Box 2170, 100-621)

74 FINANCIAL STATEMENTSHana Bank Annual Report 2000
In Millions of Korean Won In Thousands of U.S. Dollars (Note 3)
A s s e t sCash and due from banks W 3 , 3 5 2 , 8 0 4 W 3 , 9 7 6 , 6 9 8 $ 2 , 6 6 1 , 5 8 9 $ 3 , 1 5 6 , 8 6 1Trading securities 1 , 5 3 7 , 1 0 9 3 , 4 0 7 , 7 8 4 1 , 2 2 0 , 2 1 8 2 , 7 0 5 , 2 3 5Investment securities 1 1 , 2 2 9 , 4 5 7 9 , 0 4 1 , 6 6 0 8 , 9 1 4 , 3 9 0 7 , 1 7 7 , 6 3 0L o a n s 2 6 , 0 0 9 , 0 1 3 1 9 , 4 1 1 , 0 8 3 2 0 , 6 4 6 , 9 9 0 1 5 , 4 0 9 , 2 9 0
(Reserve for possible loan losses) ( 9 5 3 , 9 7 5 ) ( 9 0 9 , 4 1 4 ) ( 7 5 7 , 3 0 4 ) ( 7 2 1 , 9 2 9 )(Present value discounts) ( 7 9 , 9 7 8 ) ( 2 8 , 6 7 8 ) ( 6 3 , 4 8 9 ) ( 2 2 , 7 6 6 )
Property, plant and equipment 6 5 0 , 3 1 8 6 0 4 , 3 3 4 5 1 6 , 2 4 8 4 7 9 , 7 4 4(Accumulated depreciation) ( 1 8 0 , 6 3 0 ) ( 1 5 7 , 5 1 0 ) ( 1 4 3 , 3 9 1 ) ( 1 2 5 , 0 3 8 )
Intangible assets 6 7 8 2 6 6 5 3 8 2 1 1Guarantee deposits 3 1 2 , 6 1 5 3 0 8 , 7 5 0 2 4 8 , 1 6 6 2 4 5 , 0 9 8Accounts receivable 2 1 3 , 4 7 8 1 6 , 5 7 1 1 6 9 , 4 6 8 1 3 , 1 5 5Accrued income 4 6 0 , 8 3 5 6 8 7 , 5 0 6 3 6 5 , 8 2 9 5 4 5 , 7 7 0Prepaid expenses 3 6 4 , 2 3 7 1 5 5 , 4 1 8 2 8 9 , 1 4 6 1 2 3 , 3 7 7Deferred income tax assets 1 3 5 , 0 1 2 5 5 , 8 5 1 1 0 7 , 1 7 8 4 4 , 3 3 7Negative goodwill ( 1 , 2 1 2 ) ( 8 7 9 ) ( 9 6 2 ) ( 6 9 8 )
O t h e r 1 8 6 , 9 0 8 2 3 0 , 9 4 9 1 4 8 , 3 7 4 1 8 3 , 3 3 6
Total assets W 4 3 , 2 3 6 , 6 6 9 W 3 6 , 8 0 0 , 3 8 9 $ 3 4 , 3 2 2 , 9 8 8 $ 2 9 , 2 1 3 , 6 1 3
Liabilities, Minority Interest and Stockholders' EquityD e p o s i t s W 3 0 , 3 7 5 , 2 7 1 W 2 6 , 6 2 0 , 8 9 5 $ 2 4 , 1 1 3 , 0 9 9 $ 2 1 , 1 3 2 , 7 2 6Call money 3 7 5 , 5 5 3 1 3 2 , 7 3 5 2 9 8 , 1 2 9 1 0 5 , 3 7 0B o r r o w i n g s 2 , 7 0 0 , 8 5 7 2 , 9 1 5 , 2 0 4 2 , 1 4 4 , 0 4 8 2 , 3 1 4 , 2 0 5Bonds sold on repurchase agreements 1 , 3 5 9 , 9 2 4 1 , 0 4 0 , 5 6 0 1 , 0 7 9 , 5 6 2 8 2 6 , 0 3 8Bills sold 2 , 4 0 9 , 5 1 1 6 8 1 , 5 0 4 1 , 9 1 2 , 7 6 6 5 4 1 , 0 0 5Due to Bank of Korea in foreign currencies 2 3 7 , 1 5 5 4 1 5 , 5 3 7 1 8 8 , 2 6 3 3 2 9 , 8 7 0D e b e n t u r e s 1 , 7 7 1 , 0 6 6 9 4 6 , 9 3 0 1 , 4 0 5 , 9 4 3 7 5 1 , 7 1 1Reserve for possible losses on acceptances and guarantees 4 0 , 0 3 7 5 3 , 0 5 0 3 1 , 7 8 3 4 2 , 1 1 3Due to trust accounts 3 0 6 , 5 0 3 2 6 2 , 4 5 9 2 4 3 , 3 1 4 2 0 8 , 3 5 0Unearned income 1 1 4 , 4 4 7 1 2 2 , 5 6 8 9 0 , 8 5 3 9 7 , 2 9 9Accrued expenses 9 1 3 , 1 9 3 7 2 5 , 3 0 2 7 2 4 , 9 2 9 5 7 5 , 7 7 4Account payable 2 1 2 , 3 3 8 1 9 , 8 4 8 1 6 8 , 5 6 3 1 5 , 7 5 6O t h e r 5 4 2 , 9 4 5 9 3 9 , 5 0 3 4 3 1 , 0 0 8 7 4 5 , 8 1 5
Total liabilities 4 1 , 3 5 8 , 8 0 0 3 4 , 8 7 6 , 0 9 5 3 2 , 8 3 2 , 2 6 0 2 7 , 6 8 6 , 0 3 2
Commitments and contingencies (Note 4)Minority interest 1 0 7 , 9 0 2 1 7 2 , 5 0 9 8 5 , 6 5 7 1 3 6 , 9 4 5
Common stock, par value : W5,000,authorized: 500 million shares, issued and outstanding: 124,363,180 shares in 2000 : 110,163,180 shares in 1999 (Note 5) 6 2 1 , 8 1 6 5 5 0 , 8 1 6 4 9 3 , 6 2 2 4 3 7 , 2 6 0
Preferred stock, par value : W5,000, non-cumulative, non-participating preferred stock authorized: 250 million shares, issued and outstanding: 67,081,000 shares in 2000: 94,560,000 shares in 1999 (Note 5) 3 3 5 , 4 0 5 4 7 2 , 8 0 0 2 6 6 , 2 5 8 3 7 5 , 3 2 7
Capital surplus (Note 6) 4 2 4 , 4 6 3 3 3 9 , 7 0 3 3 3 6 , 9 5 6 2 6 9 , 6 7 0Retained earnings (Note 7) 3 6 2 , 2 4 5 4 0 9 , 8 0 6 2 8 7 , 5 6 5 3 2 5 , 3 2 0Capital adjustments 2 6 , 0 3 8 ( 2 1 , 3 4 0 ) 2 0 , 6 7 0 ( 1 6 , 9 4 1 )
Total shareholders' equity 1 , 7 6 9 , 9 6 7 1 , 7 5 1 , 7 8 5 1 , 4 0 5 , 0 7 1 1 , 3 9 0 , 6 3 6
Total liabilities, minority interest and shareholders' equity W 4 3 , 2 3 6 , 6 6 9 W 3 6 , 8 0 0 , 3 8 9 $ 3 4 , 3 2 2 , 9 8 8 $ 2 9 , 2 1 3 , 6 1 3
2000 1999 2000 1999
The accompanying notes are an integral part of these statements.
C O N S O L I D ATED BALANCE SHEETSDecember 31, 2000 and 1999

FINANCIAL STATEMENTS 75Hana Bank Annual Report 2000
C O N S O L I D ATED STATEMENTS OF INCOMEFor the years ended December 31, 2000 and 1999
In Millions of Korean Won In Thousands of U.S. Dollars (Note 3)
Operating revenueInterest income :
Interest on due from banks W 1 5 6 , 1 4 8 W 1 9 6 , 4 8 7 $ 1 2 3 , 9 5 6 $ 1 5 5 , 9 7 9Interest on securities 1 , 1 3 7 , 5 5 4 1 , 0 9 2 , 1 6 3 9 0 3 , 0 3 6 8 6 7 , 0 0 2Interest on loans 1 , 9 3 0 , 6 0 4 1 , 5 2 0 , 9 7 7 1 , 5 3 2 , 5 9 0 1 , 2 0 7 , 4 1 2O t h e r 4 1 , 4 5 1 3 2 , 6 0 2 3 2 , 9 0 6 2 5 , 8 8 1
3 , 2 6 5 , 7 5 7 2 , 8 4 2 , 2 2 9 2 , 5 9 2 , 4 8 8 2 , 2 5 6 , 2 7 4Commission income 2 9 0 , 9 1 4 2 7 4 , 1 0 1 2 3 0 , 9 3 9 2 1 7 , 5 9 2Other operating income :
Gain on disposition of trading securities 1 1 7 , 4 5 9 1 5 0 , 7 0 4 9 3 , 2 4 3 1 1 9 , 6 3 5Gain on valuation of trading securities 3 , 1 8 1 3 7 , 0 9 9 2 , 5 2 5 2 9 , 4 5 1Dividend on securities 9 , 2 2 0 8 , 9 0 4 7 , 3 1 9 7 , 0 6 8Gain on foreign currency trading 1 9 4 , 8 9 2 1 0 7 , 9 3 8 1 5 4 , 7 1 3 8 5 , 6 8 5Fees from trust accounts 1 5 2 , 6 5 7 1 6 0 , 6 8 9 1 2 1 , 1 8 5 1 2 7 , 5 6 1O t h e r 1 8 2 , 0 0 6 9 4 , 3 4 7 1 4 4 , 4 8 4 7 4 , 8 9 7
6 5 9 , 4 1 5 5 5 9 , 6 8 1 5 2 3 , 4 6 9 4 4 4 , 2 9 7
4 , 2 1 6 , 0 8 6 3 , 6 7 6 , 0 1 1 3 , 3 4 6 , 8 9 6 2,918,163 Operating expense
Interest expenses :Interest on deposits W 1 , 9 2 2 , 5 6 3 W 1 , 8 2 3 , 0 6 3 $ 1 , 5 2 6 , 2 0 7 $ 1 , 4 4 7 , 2 2 0
Interest on borrowings 4 6 9 , 9 0 1 3 5 5 , 1 3 3 3 7 3 , 0 2 6 2 8 1 , 9 1 9Interest on debentures 1 4 3 , 3 3 9 9 5 , 8 4 7 1 1 3 , 7 8 8 7 6 , 0 8 7O t h e r 2 5 , 7 4 0 4 2 , 5 9 4 2 0 , 4 3 3 3 3 , 8 1 3
2 , 5 6 1 , 5 4 3 2 , 3 1 6 , 6 3 7 2 , 0 3 3 , 4 5 4 1 , 8 3 9 , 0 3 9Commission expenses 6 6 , 7 2 0 6 9 , 1 1 9 5 2 , 9 6 5 5 4 , 8 6 9Other operating expenses :
Loss on disposition of trading securities 1 9 5 , 6 8 4 5 6 , 7 9 4 1 5 5 , 3 4 2 4 5 , 0 8 5Loss on valuation of trading securities 3 5 , 8 1 2 6 , 9 6 0 2 8 , 4 2 9 5 , 5 2 5Loss on foreign currency trading 1 7 9 , 4 9 8 8 1 , 6 0 5 1 4 2 , 4 9 3 6 4 , 7 8 1Bad debt expense 5 7 4 , 5 7 1 4 8 8 , 5 2 9 4 5 6 , 1 1 7 3 8 7 , 8 1 4O t h e r 1 9 0 , 1 1 0 1 0 0 , 2 8 9 1 5 0 , 9 1 7 7 9 , 6 1 3
1 , 1 7 5 , 6 7 5 7 3 4 , 1 7 7 9 3 3 , 2 9 8 5 8 2 , 8 1 8General and administrative expenses 4 1 2 , 9 3 7 3 6 4 , 4 5 5 3 2 7 , 8 0 6 2 8 9 , 3 1 9
4 , 2 1 6 , 8 7 5 3 , 4 8 4 , 3 8 8 3 , 3 4 7 , 5 2 3 2 , 7 6 6 , 0 4 5
Operating income (loss) ( 7 8 9 ) 1 9 1 , 6 2 3 ( 6 2 7 ) 1 5 2 , 1 1 8
Non-operating income 2 0 8 , 1 0 5 1 5 6 , 7 7 2 1 6 5 , 2 0 2 1 2 4 , 4 5 2Non-operating expenses 1 6 3 , 0 2 2 7 4 , 5 8 6 1 2 9 , 4 1 4 5 9 , 2 0 9
Ordinary income 4 4 , 2 9 4 273,809 3 5 , 1 6 1 2 1 7 , 3 6 1Extraordinary gain 1 5 , 8 3 6 - 1 2 , 5 7 2 - Extraordinary losses 8 6 8 2 , 7 5 5 6 8 9 2,187
Income before income taxes and consolidation adjustments 5 9 , 2 6 2 2 7 1 , 0 5 4 4 7 , 0 4 4 2 1 5 , 1 7 4
Income tax expense 2 3 , 1 7 8 6 7 , 9 1 1 1 8 , 3 9 9 5 3 , 9 1 0
Total net income before consolidation adjustments 3 6 , 0 8 4 2 0 3 , 1 4 3 2 8 , 6 4 5 1 6 1 , 2 6 4
Minority interest income ( 1 8 , 3 1 3 ) ( 5 8 , 6 0 9 ) ( 1 4 , 5 3 8 ) ( 4 6 , 5 2 6 )
Consolidated net income (Note 8) W 1 7 , 7 7 1 W 1 4 4 , 5 3 4 $ 1 4 , 1 0 7 $ 1 1 4 , 7 3 8
(Ordinary income per share : for current year : W178, for prior year W1,728Earnings per share : for current share : W102, for prior year W1,355Diluted ordinary income per share : for current year : W143, for prior year W922Diluted earnings per share : for current year : W94, for prior year W737)
2000 1999 2000 1999
The accompanying notes are an integral part of the these statements.

76 FINANCIAL STATEMENTSHana Bank Annual Report 2000
C O N S O L I D ATED STATEMENTS OF CHANGES IN EQUITYFor the years ended December 31, 2000 and 1999
Paid-in capital Capital surplus
Balance at January 1, 1999
Issue of share in merger of Boram BankIssue of paid-in capitalSales of treasury stockReversal of negative goodwillNet income for 1999D i v i d e n dChanges in reporting entityCumulative effect of change in accounting principlePrior period adjustmentsChanges in capital adjustmentsChanges in minority interest
Balance at December 31, 1999
Balance at January 1, 2000
Issue of paid-in capitalExtinguishment of preferred stockReversal of negative goodwillNet income for 2000D i v i d e n dChanges in reporting entityCumulative effect of change in accounting principleChanges in capital adjustmentsChanges in minority interest
Balance at December 31, 2000
W 349,630
4 3 , 8 1 06 3 0 , 1 7 6
---------
1 , 0 2 3 , 6 1 6
1 , 0 2 3 , 6 1 6
7 1 , 0 0 0( 1 3 7 , 3 9 5 )
-------
W 957,221
W 169,084
1 0 5 , 4 0 67 1 , 0 4 8
2 4 6( 6 , 0 8 1 )
-------
3 3 9 , 7 0 3
3 3 9 , 7 0 3
5 5 , 0 1 3-
2 9 , 7 4 7------
W 424,463
$ 277,550
3 4 , 7 7 85 0 0 , 2 5 9
---------
8 1 2 , 5 8 7
8 1 2 , 5 8 7
5 6 , 3 6 2( 1 0 9 , 0 6 9 )
-------
$ 759,880
$ 134,226
8 3 , 6 7 55 6 , 4 0 1
1 9 5( 4 , 8 2 7 )
-------
2 6 9 , 6 7 0
2 6 9 , 6 7 0
4 3 , 6 7 2-
2 3 , 6 1 4------
$ 336,956
In millions ofKorean Won
In thousands ofU.S Dollars
In thousands ofU.S Dollars
In millions ofKorean Won

FINANCIAL STATEMENTS 77Hana Bank Annual Report 2000
Retained earnings Capital adjustments Minority interest Total equity
W 352,587
3 , 2 2 3---
1 4 4 , 5 3 4( 5 2 , 0 8 8 )
2 4 , 0 2 4( 6 3 , 4 9 9 )
1 , 0 2 5--
4 0 9 , 8 0 6
4 0 9 , 8 0 6
---
1 7 , 7 7 1( 3 0 , 4 3 5 )
3 , 4 7 2( 3 8 , 3 6 9 )
--
W 362,245
W (235)
-------- -
( 2 1 , 1 0 5 )-
( 2 1 , 3 4 0 )
( 2 1 , 3 4 0 )
-------
4 7 , 3 7 8-
W 26,038
W -
----
-----
1 7 2 , 5 0 9
1 7 2 , 5 0 9
1 7 2 , 5 0 9
--------
( 6 4 , 6 0 7 )
W 107,902
W 871,066
1 5 2 , 4 3 97 0 1 , 2 2 4
2 4 6( 6 , 0 8 1 )
1 4 4 , 5 3 4( 5 2 , 0 8 8 )
2 4 , 0 2 4( 6 3 , 4 9 9 )
1 , 0 2 5( 2 1 , 1 0 5 )1 7 2 , 5 0 9
1 , 9 2 4 , 2 9 4
1 , 9 2 4 , 2 9 4
1 2 6 , 0 1 3( 1 3 7 , 3 9 5 )
2 9 , 7 4 71 7 , 7 7 1
( 3 0 , 4 3 5 )3 , 4 7 2
( 3 8 , 3 6 9 )4 7 , 3 7 8
( 6 4 , 6 0 7 )
W 1,877,869
$ 279,897
2 , 5 5 8---
1 1 4 , 7 3 8( 4 1 , 3 5 0 )
1 9 , 0 7 1( 5 0 , 4 0 8 )
8 1 4--
3 2 5 , 3 2 0
3 2 5 , 3 2 0
---
1 4 , 1 0 7( 2 4 , 1 6 0 )
2 , 7 5 6( 3 0 , 4 5 9 )
--
$ 287,564
$ (187)
----
----
( 1 6 , 7 5 4 )-
( 1 6 , 9 4 1 )
( 1 6 , 9 4 1 )
-------
3 7 , 6 1 1-
$ 20,670
$ -
----
-----
1 3 6 , 9 4 5
1 3 6 , 9 4 5
1 3 6 , 9 4 5
--------
( 5 1 , 2 8 8 )
$ 85,657
$ 691,486
1 2 1 , 0 1 15 5 6 , 6 6 0
1 9 5( 4 , 8 2 7 )
1 1 4 , 7 3 8( 4 1 , 3 5 0 )
1 9 , 0 7 1( 5 0 , 4 0 8 )
8 1 4( 1 6 , 7 5 4 )1 3 6 , 9 4 5
1 , 5 2 7 , 5 8 1
1 , 5 2 7 , 5 8 1
1 0 0 , 0 3 4( 1 0 9 , 0 6 9 )
2 3 , 6 1 41 4 , 1 0 7
( 2 4 , 1 6 0 )2 , 7 5 6
( 3 0 , 4 5 9 )3 7 , 6 1 1
( 5 1 , 2 8 8 )
$ 1,490,727
In millions ofKorean Won
In millions ofKorean Won
In millions ofKorean Won
In thousands ofU.S Dollars
In thousands ofU.S Dollars
In thousands ofU.S Dollars
In thousands ofU.S Dollars
In millions ofKorean Won
The accompanying notes are an integral part of these statements

78 FINANCIAL STATEMENTSHana Bank Annual Report 2000
C O N S O L I D ATED STATEMENTS OF CASH FLOWSFor the years ended December 31, 1999 and 2000
In Millions of Korean Won In Thousands of U.S. Dollars (Note 3)
Cash provided from operating activities
Net income W 1 7 , 7 7 1 W 1 4 4 , 5 3 4 $ 1 4 , 1 0 7 $ 1 1 4 , 7 3 7
Items not affecting operating cash flows :
Depreciation and amortization 4 2 , 1 8 2 3 7 , 5 1 0 3 3 , 4 8 6 2 9 , 7 7 7Provision for possible loan losses 5 7 4 , 5 7 1 4 8 8 , 5 2 9 4 5 6 , 1 1 7 3 8 7 , 8 1 4Provision for severance benefits 1 4 , 4 6 2 1 1 , 7 9 2 1 1 , 4 8 0 9 , 3 6 1Unrealized gain on securities, net 9 2 , 5 0 7 ( 2 4 , 5 8 6 ) 7 3 , 4 3 6 ( 1 9 , 5 1 7 )Gain on securities transactions, net ( 6 6 , 4 4 0 ) ( 1 4 8 , 3 9 7 ) ( 5 2 , 7 4 3 ) ( 1 1 7 , 8 0 3 )Reversal of provision for possible losses
of acceptances and guarantees ( 1 2 , 8 6 8 ) ( 1 0 , 7 1 1 ) ( 1 0 , 2 1 5 ) ( 8 , 5 0 3 )Payment of retirement benefits ( 4 , 3 7 4 ) ( 2 , 1 3 1 ) ( 3 , 4 7 2 ) ( 1 , 6 9 2 )Gain on sales of loans, net 7 , 3 4 6 ( 5 , 4 3 8 ) 5 , 8 3 2 ( 4 , 3 1 7 )Loss on equity method 4 1 , 3 6 8 ( 2 3 , 5 4 7 ) 3 2 , 8 3 9 ( 1 8 , 6 9 3 )Changes in accrual basis account, net ( 3 , 8 3 3 , 5 9 9 ) 2 0 8 , 9 9 6 ( 3 , 0 4 3 , 2 6 2 ) 1 6 5 , 9 0 8Reversal of negative goodwill, net ( 8 0 8 ) ( 1 , 6 2 5 ) ( 6 4 1 ) ( 1 , 2 9 0 )Minority interest income 1 8 , 3 1 4 5 8 , 6 0 9 1 4 , 5 3 8 4 6 , 5 2 6O t h e r ( 1 5 , 8 2 8 ) 9 3 3 ( 1 2 , 5 6 5 ) 7 4 2
W ( 3 , 1 2 5 , 3 9 6 ) W 7 3 4 , 4 6 8 $ ( 2 , 4 8 1 , 0 6 3 ) $ 5 8 3 , 0 5 0Cash flows from investing activities :
Decrease in maketable securities W 1 , 7 5 4 , 4 1 3 W ( 3 , 0 0 9 , 8 2 0 ) $ 1 , 3 9 2 , 7 2 3 $ ( 2 , 3 8 9 , 3 1 5 )Decrease in investment securities ( 2 , 0 3 2 , 1 0 7 ) 5 2 8 , 2 1 2 ( 1 , 6 1 3 , 1 6 8 ) 4 1 9 , 3 1 6Increase in premises and equipment ( 7 1 , 3 9 9 ) ( 1 5 0 , 5 2 8 ) ( 5 6 , 6 7 9 ) ( 1 1 9 , 4 9 5 )Decrease in negative goodwill 1 , 1 2 9 - 8 9 6 - Increase in intangible assets ( 5 3 8 ) ( 2 9 9 ) ( 4 2 7 ) ( 2 3 7 )Increase in leasehold deposits ( 3 , 8 6 4 ) ( 3 0 8 , 7 5 1 ) ( 3 , 0 6 7 ) ( 2 4 5 , 0 9 9 )Increase in accounts receivables ( 1 9 7 , 4 2 3 ) ( 1 6 , 5 7 1 ) ( 1 5 6 , 7 2 2 ) ( 1 3 , 1 5 5 )Sales of treasury stock - 1 7 - 1 3
( 5 4 9 , 7 8 9 ) ( 2 , 9 5 7 , 7 4 0 ) ( 4 3 6 , 4 4 4 ) ( 2 , 3 4 7 , 9 7 2 )Cash flows from financing activities:
Increase (decrease) in borrowings ( 1 9 0 , 8 0 7 ) 1 , 3 3 9 , 6 0 9 ( 1 5 1 , 4 7 0 ) 1 , 0 6 3 , 4 3 5Increase in bills sold 1 , 7 2 8 , 0 0 7 4 6 8 , 8 7 0 1 , 3 7 1 , 7 6 0 3 7 2 , 2 0 8Increase in debentures 8 2 1 , 1 1 9 3 5 2 , 2 0 7 6 5 1 , 8 3 7 2 7 9 , 5 9 6Increase in foreign exchanges payable 5 1 , 6 0 8 1 3 , 8 2 2 4 0 , 9 6 8 1 0 , 9 7 2Issuance of new stock for cash 1 2 6 , 0 1 3 2 2 8 , 4 2 4 1 0 0 , 0 3 4 1 8 1 , 3 3 2Increase in securities sold under repurchase agreements 3 1 9 , 3 6 4 2 2 3 , 4 3 0 2 5 3 , 5 2 4 1 7 7 , 3 6 8Increase (decrease) in due to Bank of
Korea in foreign currencies ( 1 7 8 , 3 8 2 ) 4 1 5 , 5 3 7 ( 1 4 1 , 6 0 7 ) 3 2 9 , 8 7 0Increase (decrease) in call money 2 4 2 , 8 1 7 ( 9 8 , 0 0 3 ) 1 9 2 , 7 5 8 ( 7 7 , 7 9 9 )Increase in due to trust accounts 5 , 5 8 7 1 1 1 , 4 4 6 4 , 4 3 5 8 8 , 4 7 0Increase (decrease) in accounts payables 1 9 2 , 4 9 1 ( 2 5 , 3 4 7 ) 1 5 2 , 8 0 7 ( 2 0 , 1 2 1 )Cash dividend ( 5 2 , 0 8 8 ) ( 2 7 , 9 7 0 ) ( 4 1 , 3 5 0 ) ( 2 2 , 2 0 4 )Additional investment in subsidiary ( 1 0 , 6 3 1 ) - ( 8 , 4 3 9 ) -
3 , 0 5 5 , 0 9 8 3 , 0 0 2 , 0 2 5 2 , 4 2 5 , 2 5 7 2 , 3 8 3 , 1 2 7
Cash flow from change in reporting entity ( 3 , 8 0 7 ) - ( 3 , 0 2 2 ) -
Net increase (decrease) in cash ( 6 2 3 , 8 9 4 ) 7 7 8 , 7 5 3 ( 4 9 5 , 2 7 2 ) 6 1 8 , 2 0 5
Cash and cash equivalents at beginning of the year 3 , 9 7 6 , 6 9 8 3 , 1 9 7 , 9 4 5 3 , 1 5 6 , 8 6 1 2 , 5 3 8 , 6 5 6
Cash and cash equivalents at end of the year W 3 , 3 5 2 , 8 0 4 W 3 , 9 7 6 , 6 9 8 $ 2 , 6 6 1 , 5 8 9 $ 3 , 1 5 6 , 8 6 1
C a s h 7 5 4 , 1 4 6 9 8 0 , 2 6 3 5 9 8 , 6 7 1 7 7 8 , 1 7 2Foreign currencies 3 4 , 0 5 9 2 4 , 2 2 7 2 7 , 0 3 7 1 9 , 2 3 2Due from Banks 2 , 0 5 2 , 2 9 9 2 , 7 2 7 , 1 5 2 1 , 6 2 9 , 1 9 7 2 , 1 6 4 , 9 2 2Due from Banks in foreign currencies 5 1 2 , 3 0 0 2 4 5 , 0 5 6 4 0 6 , 6 8 4 1 9 4 , 5 3 5
2000 1999 2000 1999
The accompanying notes are an integral part of these statements.
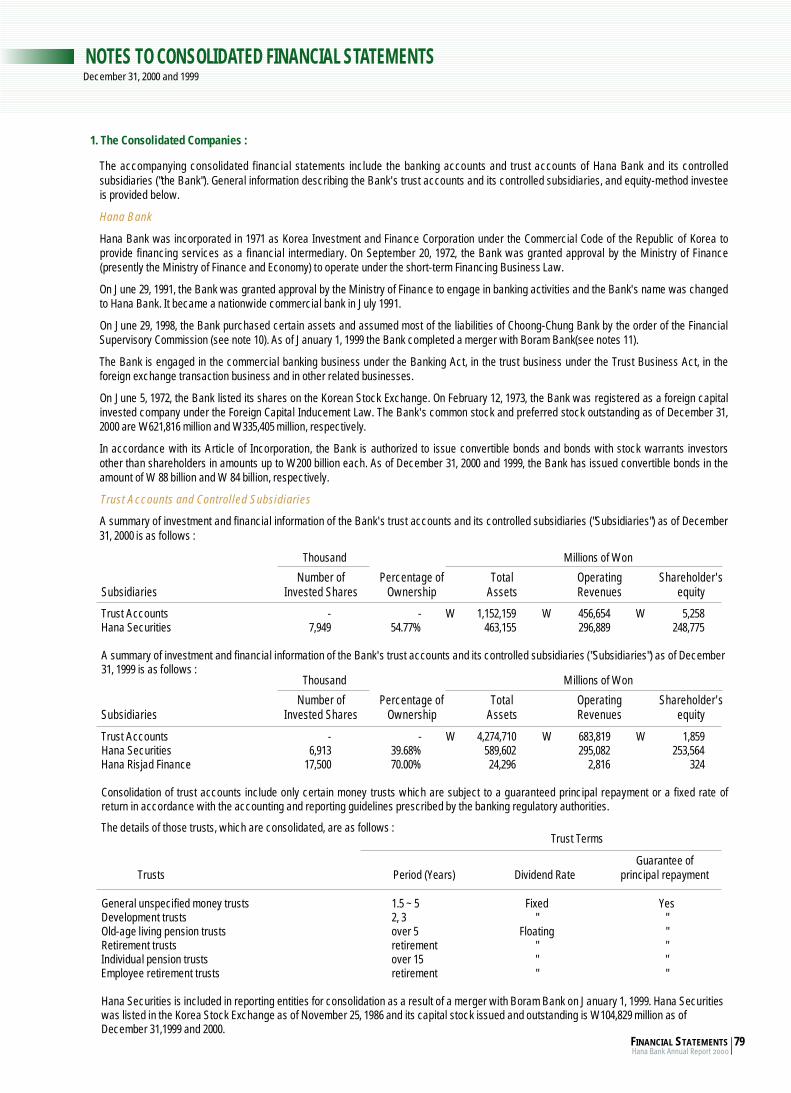
NOTES TO CONSOLIDATED FINANCIAL STATEMENTS December 31, 2000 and 1999
1. The Consolidated Companies :
The accompanying consolidated financial statements include the banking accounts and trust accounts of Hana Bank and its controlledsubsidiaries ("the Bank"). General information describing the Bank's trust accounts and its controlled subsidiaries, and equity-method investeeis provided below.
Hana Bank
Hana Bank was incorporated in 1971 as Korea Investment and Finance Corporation under the Commercial Code of the Republic of Korea toprovide financing services as a financial intermediary. On September 20, 1972, the Bank was granted approval by the Ministry of Finance(presently the Ministry of Finance and Economy) to operate under the short-term Financing Business Law.
On June 29, 1991, the Bank was granted approval by the Ministry of Finance to engage in banking activities and the Bank's name was changedto Hana Bank. It became a nationwide commercial bank in July 1991.
On June 29, 1998, the Bank purchased certain assets and assumed most of the liabilities of Choong-Chung Bank by the order of the FinancialSupervisory Commission (see note 10). As of January 1, 1999 the Bank completed a merger with Boram Bank(see notes 11).
The Bank is engaged in the commercial banking business under the Banking Act, in the trust business under the Trust Business Act, in theforeign exchange transaction business and in other related businesses.
On June 5, 1972, the Bank listed its shares on the Korean Stock Exchange. On February 12, 1973, the Bank was registered as a foreign capitalinvested company under the Foreign Capital Inducement Law. The Bank's common stock and preferred stock outstanding as of December 31,2000 are W621,816 million and W335,405 million, respectively.
In accordance with its Article of Incorporation, the Bank is authorized to issue convertible bonds and bonds with stock warrants investorsother than shareholders in amounts up to W200 billion each. As of December 31, 2000 and 1999, the Bank has issued convertible bonds in theamount of W 88 billion and W 84 billion, respectively.
Trust Accounts and Controlled Subsidiaries
A summary of investment and financial information of the Bank's trust accounts and its controlled subsidiaries ("Subsidiaries") as of December31, 2000 is as follows :
T h o u s a n d Millions of Won
Number of Percentage of Total Operating Shareholder's Subsidiaries Invested Shares Ownership Assets Revenues equity
Trust Accounts - - W 1 , 1 5 2 , 1 5 9 W 4 5 6 , 6 5 4 W 5 , 2 5 8Hana Securities 7 , 9 4 9 5 4 . 7 7 % 4 6 3 , 1 5 5 2 9 6 , 8 8 9 2 4 8 , 7 7 5
A summary of investment and financial information of the Bank's trust accounts and its controlled subsidiaries ("Subsidiaries") as of December31, 1999 is as follows :
T h o u s a n d Millions of Won
Number of Percentage of Total Operating Shareholder's Subsidiaries Invested Shares Ownership Assets Revenues equity
Trust Accounts - - W 4 , 2 7 4 , 7 1 0 W 6 8 3 , 8 1 9 W 1 , 8 5 9Hana Securities 6 , 9 1 3 3 9 . 6 8 % 5 8 9 , 6 0 2 2 9 5 , 0 8 2 2 5 3 , 5 6 4Hana Risjad Finance 1 7 , 5 0 0 7 0 . 0 0 % 2 4 , 2 9 6 2 , 8 1 6 3 2 4
Consolidation of trust accounts include only certain money trusts which are subject to a guaranteed principal repayment or a fixed rate ofreturn in accordance with the accounting and reporting guidelines prescribed by the banking regulatory authorities.
The details of those trusts, which are consolidated, are as follows :Trust Terms
Guarantee of T r u s t s Period (Years) Dividend Rate principal repayment
General unspecified money trusts 1.5 ~ 5 F i x e d Y e sDevelopment trusts 2, 3 " "Old-age living pension trusts over 5 F l o a t i n g "Retirement trusts r e t i r e m e n t " "Individual pension trusts over 15 " "Employee retirement trusts r e t i r e m e n t " "
Hana Securities is included in reporting entities for consolidation as a result of a merger with Boram Bank on January 1, 1999. Hana Securitieswas listed in the Korea Stock Exchange as of November 25, 1986 and its capital stock issued and outstanding is W104,829 million as ofDecember 31,1999 and 2000.
FINANCIAL STATEMENTS 79Hana Bank Annual Report 2000

Hana Risjad Finance which was included in reporting entity for consolidation as a result of a merger with Boram Bank on January 1, 1999 is afinancial services company located in Indonesia and its capital stock is W4,033 million as of December 31, 1999. Hana Risjad Finance had been in theprocess of liquidation during 2000 and the Bank sold entire shares of the company to PT. AITI Investment Co. for US$ 2,750 thousand on February 21,2001. Hana Risjad Finance is excluded from consolidation in the accompanying consolidated financial statements as of December 31, 2000.
In accordance with the Financial Accounting Standards for Consolidated financial statements, Hana Research & Consulting Inc., a small-sizedcompany of which all stocks the Bank has, is excluded from consolidation.
Investment Accounted by Equity Method
A summary of investment and financial information of Hana Research & Consulting Inc. and Hana-Allianz Investment Trust ManagementCo.,LTD , to which equity method of accounting is applied in consolidation as of December 31, 2000, is as follows :
Millions of Won
Number of Percentage of Total Operating Shareholder's Subsidiaries Invested Shares Ownership Assets Revenues equity
Hana Research & Consulting Inc. 4 0 0 1 0 0 . 0 0 ( % ) W 2 , 0 7 5 W 1 , 9 3 6 W 2 , 0 0 1Hana Allianz Investment
Trust Management Co. 3 , 0 0 0 5 0 . 0 0 ( % ) 2 9 , 8 1 3 7 5 2 9 , 7 7 1
The Bank invested W15,000 million in Hana Allianz investment trust management Co. Ltd. which was established on December 14, 2000,resulting in fifty percent ownership of the company.
Korea Merchant Banking Corporation was established on August 24, 1976 to engage in financial services and was listed in the Korea StockExchange as of March 29, 1994. On November 15, 2000, Korea Merchant Bank Corporation("KMBC"), equity investee of the Bank as of December 31, 1999, made capitalreduction with no reimbursement by an order of Financial Supervisory Commission. Accordingly, the Bank charged W41,291 million of theinvestment to KMBC to operations loss on equity method for the year ended December 31, 2000.
2. Summary of Significant Accounting Policies
The significant accounting policies followed by the Bank in the preparation of the accompanying consolidated financial statements aresummarized below.
Basis of Consolidated Financial Statement Presentation
The official accounting records of the Bank are maintained in Korean Won in accordance with the relevant laws and regulations of theRepublic of Korea.
The accompanying consolidated financial statements have been extracted from the Bank's Korean language consolidated financial statementsthat were prepared using accounting principles, procedures and reporting practices generally accepted in the Republic of Korea. Thesestandards vary from International Accounting Standards and the accounting principles generally accepted in the country of the reader. Thefinancial statements have been translated from Korean into English, and have been formatted in a manner different from the presentation underKorean financial statement practices. Certain supplementary information included in the Korean language statutory financial statements, butnot required for a fair presentation of the Bank's financial position or results of operations, is not presented in the accompanying financialstatements. Accordingly, the accompanying financial statements are not intended to present the financial position, results of operations andcash flows in accordance with accounting principles and practices generally accepted in countries and jurisdictions other than Korea.
The preparation of consolidated financial statements in conformity with financial accounting standards requires management to makeestimates and assumptions that affect the reported amounts of assets and liabilities at the date of the financial statements, and the reportedamounts of revenues and expenses during the reporting period. Due to the inherent uncertainty involved in making estimates, actual resultscould differ from those estimates.
Accounting Changes
During 1999, the Bank changed its method of accounting and presentation for certain items in accordance with revised financial accountingstandards. The accounting changes include accounting treatment for the valuation of securities, valuation of receivables under troubled debtrestructurings, reserve for possible losses on guarantees and acceptances, deferred taxes, prior period adjustments, and stock issuancec o s t s .
Recognition of Interest Income
Interest income on loans and investments is recognized on an accrual basis. However, interest income on overdue or dishonored loans isrecognized on a cash basis, except for those secured and guaranteed by financial institutions. As of December 31, 2000 and 1999, accruedinterest income not recognized in the financial statements were W73,596 million and W94,831 million, respectively.
Allowance for Possible Loan Losses
From 1999, the Bank adopted a method of corporate loan classification for calculating the allowance for possible loan losses by incorporatingthe borrowers' future debt service capacity ("Forward Looking Criteria (FLC)"). This credit rating model considers the financial and non-financialfactors of borrowers and classifies borrowers' credit risk by thirteen ratings (1,2,3,4,5,6,7+,7,8+,8,9,10+,10). Provisions are determined byapplying the following minimum percentages to the various credit ratings:
NOTES TO CONSOLIDATED FINANCIAL STAT E M E N T SDecember 31, 2000 and 1999
80 FINANCIAL STATEMENTSHana Bank Annual Report 2000

NOTES TO CONSOLIDATED FINANCIAL STAT E M E N T SDecember 31, 2000 and 1999
Credit ratings Loan classifications Provision percentages
1 ~ 8+ N o r m a l 0 ~ 1.2%8 P r e c a u t i o n a r y 2 %9 S u b s t a n d a r d 2 0 %1 0 + D o u b t f u l 5 0 %1 0 Estimated loss 1 0 0 %
Household and credit card loans are classified based on the delinquent periods, value of collateral, and reasonably estimated collectibility.
Securities
All securities are initially carried at cost including incidental expenses, determined by the moving average method.
Marketable securities held for short-term capital gain purposes are classified as trading securities. Other securities are classified asinvestment securities.
Trading securities
Trading securities are marketable securities held for short-term trading and carried at their market values at the balance sheet date. Unrealizedgains and losses on trading securities are included in current operations.
Investment securities
Investments in marketable equity securities of non-controlled investees are carried at fair value. Temporary changes in fair value areaccounted for in the capital adjustment account, a component of stockholders' equity. Declines in fair value which are anticipated to bepermanent are recorded in current operations after eliminating any previously recorded capital adjustment for temporary changes.Subsequent recoveries or other future changes in fair value are recorded in current operations up to the original book value before decline.
Investments in non-marketable equity securities of non-controlled investees are carried at cost, except for declines in the Bank's proportionateownership of the underlying book value of the investee which are anticipated to be permanent, which are recorded in current operations. Theamounts of such losses recognized for the years ended December 31, 2000 and 1999 are W39,633 and W8,203 million, respectively. Subsequentrecoveries are also recorded in current operations up to the original cost of the investment.
Investments in equity securities of companies over which the Bank exerts significant control or influence (controlled investees) are recordedusing the equity method. Differences between the initial purchase price and the Bank's initial proportionate ownership of the net book value ofthe investee are amortized over 20 years or less using the straight-line method. Under the equity method, the Bank records changes in itsproportionate ownership of the book value of the investee as current operations, capital adjustments or adjustments to retained earnings,depending on the nature of the underlying change in book value of the investee.
Premiums and discounts on debt securities are amortized over the life of the debt using the effective interest method. Investments in debtsecurities which the Bank has the intent and ability to hold to maturity are generally carried at cost, adjusted for the amortization of discountsor premiums (amortized cost). Declines in the fair value of debt securities which are anticipated to be permanent are recorded in currentoperations. The amount of such loss recognized, for the year ended December 31, 2000 and 1999, are W17,200 million and W15,041 millionrespectively. Subsequent recoveries are also recorded in current operations up to the amortized cost of the investment.
Other investments in debt securities are carried at fair value. Temporary differences between fair value and amortized cost are accounted forin the capital adjustment account. Declines in fair value which are anticipated to be permanent are recorded in current operations aftereliminating any previously recorded capital adjustment for temporary changes. Subsequent recoveries or other future changes in fair value arerecorded in the capital adjustment account.
Due to the sale of some of held-to maturity debt securities, the Bank reclassified W4,184,409 million of held-to maturity debt securities toavailable-for-sale debt securities in 2000. The Bank realized a gain on the sale of W6,379,287 million of investment debt securities during 2000.Related to this, W148,323 million and W2,813 million are included in gains and losses on disposition of investment securities, respectively.
Property, Plant and Equipment
Property, plant and equipment are recorded at cost. Routine maintenance and repairs are charged to expense as incurred. Expenditures whichenhance the value or extend the useful life of the facilities involved are treated as additions to premises and equipment.
Depreciation is computed using the declining-balance method (the straight-line method for buildings) over the estimated useful lives of theassets as described below.
Estimated Useful Life-years
Buildings, structures and auxiliary facilities 50 ~ 60Vehicles, furniture and fixtures 5Structures in leased offices used for business purposes 5
FINANCIAL STATEMENTS 81Hana Bank Annual Report 2000

Intangible Assets
Trademarks and goodwill are stated at cost, net of accumulated amortization. Goodwill and trademarks are amortized using the straight-linemethod over five and ten years, respectively.
Present Value Discounts
If the present value of a loan is different from the book value due to the rescheduling of terms as agreed by the related parties (as in the case ofcourt receivership, court mediation or workout), the present value discount on the loan is offset against the allowance for possible loan losses,if available, or charged to current expenses.
The difference between book value and present value is recorded as 'present value discounts' in the balance sheet and amortized to currentearnings over the related period using the effective interest rate method.
New Stock Issuance Costs and Debenture Issuance Costs
Effective January 1, 1999, pursuant to the revised financial accounting standards, new stock issuance costs and debenture issuance costs,which had been previously recorded as deferred charges are deducted from paid-in capital in excess of par value and the amounts ofdebenture issuance, respectively. Debenture issuance costs are amortized as interest expense over the redemption term using the effectiveinterest rate method.
Foreign Currency Translation
Assets and liabilities denominated in foreign currencies are translated into Korean Won using the exchange rate of W1,259.7:US$1 andW1,145.40:US$1 in effect as of December 31, 2000 and 1999, respectively. Resulting translation gain and loss are charged to current operations.
Bonds Purchased Under Resale Agreements and Bonds Sold under Repurchase Agreements
Bonds purchased under resale agreements and bonds sold under repurchase agreements are included in assets and liabilities in theaccompanying consolidated balance sheet.
Accrued Severance Benefits
Directors and employees with more than one year of service are entitled to receive a lump-sum payment upon termination of their employmentwith the Bank, based on their length of service and rate of pay at the time of termination. Accrued severance benefits represent the amounts tobe paid if all eligible employees and directors were to terminate their employment as of the balance sheet date. Actual payments of severancebenefits for the year ended December 31, 2000 and 1999 were W 4,319 million and W2,131 million respectively.
Reserve for Possible Losses on Acceptances and Guarantees
Acceptances and guarantees outstanding do not appear on the balance sheet, but are presented as off-balance sheet items in the notes to thefinancial statements.
The Bank provides a minimum provision of 20% of guaranteed amounts for companies classified as "substandard," 50% for "doubtful," and 100%for "estimated loss." The Bank records the provision as a reserve for possible losses on acceptances and guarantees in the liability section ofthe balance sheet.
Income Tax Expenses
Pursuant to revised financial accounting standards generally accepted in the Republic of Korea, the Bank changed its method of accountingfor income tax expenses from the current income tax method to the deferred tax method in 1999.
Deferred taxes represent the tax effects of the different tax and financial account bases of assets and liabilities, and are recorded at enactedtax rates which are expected to be in effect when the temporary differences reverse. The provision for income taxes represents taxescurrently payable for the year plus the change in the net deferred tax balance from the previous balance sheet date. Valuation allowances areestablished when necessary to reduce deferred tax assets to the amount expected to be realized.
Gain (Loss) on Prior Period Adjustments
Prior period adjustments are charged to retained earnings carried over from prior year.
Derivative Financial Instruments
Derivative financial instruments include futures, forwards and swap contracts, and are principally linked to interest rates, foreign exchangerates or equity indices.
In accordance with revised financial accounting standards related to derivatives accounting, effective January 1, 2000, the Bank recorded thefair values of rights and obligations related to derivatives contracts on the balance sheet as assets and liabilities and recognized the relatedgains or losses in the income statement. However, the effective portions of the unrealized gains or losses arising from "cash flow" hedgederivative financial instruments are deferred and recorded in capital adjustments
Translation of Consolidated Financial Statements of Overseas Branches
Accounts and records of the overseas branches are maintained in foreign currencies. In translating consolidated financial statements ofoverseas branches, the Bank applied the appropriate rate of exchange at balance sheet date.
NOTES TO CONSOLIDATED FINANCIAL STAT E M E N T SDecember 31, 2000 and 1999
82 FINANCIAL STATEMENTSHana Bank Annual Report 2000

NOTES TO CONSOLIDATED FINANCIAL STAT E M E N T SDecember 31, 2000 and 1999
Stock Options
The Bank applies the fair value method in calculation of fair value of stock options and allocates it over the period from the option grant date tothe exercise date and charges it to operations.
Accounting for Trust Accounts
The Bank receive trust fees from the trust accounts for its management or custodian of trust assets and operations, and are entitled to receivespecial trust fees for certain trust accounts in accordance with relevant laws and regulations applicable to trust operations.
Principles of Consolidation
The Bank's investment account and corresponding capital accounts of subsidiaries have been eliminated in the accompanying consolidatedfinancial statements.
All significant inter-company transactions and account balances among the consolidated companies have been eliminated in consolidation.
Investment in 20% to 50% owned company and small-sized company stipulated in financial accounting standard(except for consolidatedcompanies) is accounted using equity method and all the inter-company transactions have been eliminated.
Certain money trust agreements provide that the Bank guarantees a principal amount of trusts or a minimum rate of return. In relation to suchguarantees, the Bank's trust accounts are required to set up a special reserve, not to exceed 5% of annual revenues, until the total reserveequals 3% of the related money trust balance. If the income from trust operations is insufficient to generate the required rate of return, thedeficiency may be either recovered from previously established special reserve or compensated by the Bank's banking accounts. Suchcompensation is accounted for as other operating expenses of the banking accounts and other income of the trust accounts, respectively, inaccordance with the relevant laws and regulations applicable to the trust business. Such compensation amounts are W133,698 and W42,942million for the year ended December 31, 2000 and 1999 respectively and these have been eliminated in consolidation of related trust accounts.
3. United States Dollar Amounts :
The Bank operates primarily in Korean Won and its official accounting records are maintained in Korean Won. The U.S. Dollar amounts areprovided herein as supplementary information solely for the convenience of the reader. All Won amounts are expressed in U.S. Dollars at therate of W1,259.7:US$1, the base exchange rate published on December 31, 2000 and 1999 respectively. This presentation is not required by or inaccordance with Korean or United States generally accepted accounting principles, and should not be construed as a representation that theWon amounts shown could be converted to or settled in U.S. Dollars at this or any other rate.
The 1999 U.S. dollar amounts, which had been previously expressed at the rate published on December 31, 1999, have been restated to reflectthe exchange rate in effect on December 31, 2000.
4. Maturity of Borrowings and Debentures :
The maturities of borrowings as of December 31, 2000 is as follows (millions of Won) :
The maturities of debentures as of December 31, 2000 is as follows (millions of Won) :
FINANCIAL STATEMENTS 83Hana Bank Annual Report 2000
2 0 0 1 . 1 . 1 ~ 2 0 0 1 . 1 2 . 3 1 W 6 6 7 , 7 4 4 W 9 2 5 , 6 0 8 W 1 , 5 9 3 , 3 5 22 0 0 2 . 1 . 1 ~ 2 0 0 2 . 1 2 . 3 1 1 0 0 , 9 1 3 3 3 2 , 9 8 1 4 3 3 , 8 9 42 0 0 3 . 1 . 1 ~ 2 0 0 3 . 1 2 . 3 1 1 8 2 , 9 6 6 1 9 9 , 4 5 2 3 8 2 , 4 1 82 0 0 4 . 1 . 1 ~ 2 0 0 4 . 1 2 . 3 1 5 6 , 8 9 6 - 5 6 , 8 9 6
T h e r e a f t e r 2 0 7 , 3 7 6 2 6 , 9 2 1 2 3 4 , 2 9 7
W 1 , 2 1 5 , 8 9 5 W 1 , 4 8 4 , 9 6 2 W 2 , 7 0 0 , 8 5 7
Won currency Foreign currencyPeriod B o r r o w i n g s Borrowings T o t a l
2 0 0 1 . 1 . 1 - 2 0 0 1 . 1 2 . 3 1 W - W 1 3 4 , 7 8 8 W 1 3 4 , 7 8 82 0 0 2 . 1 . 1 - 2 0 0 2 . 1 2 . 3 1 8 0 , 0 0 0 6 2 , 9 8 5 1 4 2 , 9 8 52 0 0 3 . 1 . 1 - 2 0 0 3 . 1 2 . 3 1 4 5 9 , 0 7 7 2 3 1 , 7 8 5 6 9 0 , 8 6 22 0 0 4 . 1 . 1 - 2 0 0 4 . 1 2 . 3 1 1 6 6 , 3 0 0 3 7 , 7 9 1 2 0 4 , 0 9 1
T h e r e a f t e r 6 0 4 , 5 4 7 - 6 0 4 , 5 4 7
W 1 , 3 0 9 , 9 2 4 W 4 6 7 , 3 4 9 W 1 , 7 7 7 , 2 7 3
Won currency Foreign currencyPeriod B o r r o w i n g s Borrowings T o t a l

5. Assets and Liabilities Denominated in Foreign Currencies:
Significant assets and liabilities denominated in foreign currencies at December 31, 2000 is as follows :
6. Commitments and Contingencies:
Information of the amount of position and unrealized gains and losses of derivatives as of December 31, 2000 is as follows(millions of Won) :
In accordance with the revised accounting rules of accounting for derivatives during the year ended December 31, 2000, the Bank recordedderivatives transaction on the balance sheet at fair value and recorded the unrealized gains and losses in current operations.
The Bank has entered into forward exchange contracts, currency futures and interest rate swaps with KOFEX. Related to the above, the Bankrecorded for the year ended December 31, 2000, W143,694 million and W96,426 million of gain and loss, respectively, on transaction ofderivatives, and W7,183 million and W30,272 million of unrealized gain and unrealized loss, respectively, as other operating income(loss).
The Bank has entered into swap contracts to hedge against the risk of changes in the market interest rate and foreign exchange rate. Relatedto the above, the Bank recorded for the year ended December 31, 2000, W5,192 million and W808 million of gain and loss, respectively, ontransaction of derivatives, and W6,374 million and W4,590 million of unrealized gain and unrealized loss, respectively, as other operatingi n c o m e ( l o s s ) .
In the normal course of business, the Bank enters into outstanding commitments, which under the financial accounting standards in theRepublic of Korea, are not reflected in the accompanying consolidated financial statements. In the opinion of management, these do notrepresent unusual risks of losses for the Bank. Certain commitments represent various degrees and types of risk to the Bank including credit,interest rate, foreign exchange rate, and liquidity risk. In many cases the commitments involving interest and foreign exchange result fromdecisions to hedge overall interest rate and foreign exchange risk.
NOTES TO CONSOLIDATED FINANCIAL STAT E M E N T SDecember 31, 2000 and 1999
84 FINANCIAL STATEMENTSHana Bank Annual Report 2000
Assets :Cash & due from banks W 5 4 6 , 3 5 9 $ 4 3 3 , 7 2 0Trading securities 2 0 , 6 5 1 1 6 , 4 0 9Investment securities 6 4 2 , 6 3 1 5 1 0 , 1 4 6L o a n s 1 , 0 0 7 , 4 2 5 7 9 9 , 7 3 4O t h e r 1 , 7 4 3 , 7 7 5 1 , 3 8 4 , 2 7 9Allowance for possible loan losses ( 1 3 0 , 3 6 7 ) ( 1 0 3 , 4 9 1 )
W 3 , 8 3 0 , 4 7 4 $ 3 , 0 4 0 , 7 9 7
Liabilities :D e p o s i t s W 1 , 1 7 5 , 4 3 9 $ 9 3 3 , 1 1 0B o r r o w i n g s 1 , 4 8 4 , 9 6 2 1 , 1 7 8 , 8 2 2Due to Bank of Korea 2 3 7 , 1 5 5 1 8 8 , 2 6 3D e b e n t u r e s 4 6 7 , 3 4 9 3 7 1 , 0 0 0O t h e r 3 5 4 , 9 4 4 2 5 0 , 0 1 6
W 3 , 7 1 9 , 8 4 9 $ 2 , 9 2 1 , 2 1 1
Millions ofWon
Thousand of US$.E q u i v a l e n t
D e r i v a t i v e s Amount of PositionT o t a l T r a d i n g H e d g i n g T o t a l T r a d i n g H e d g i n g A s s e t s L i a b i l i t i e s
C u r r e n c yF o r w a r d 1 , 2 0 9 , 2 9 0 2 7 6 , 6 3 1 9 3 2 , 6 5 9 ( 2 3 , 0 9 0 ) ( 2 4 , 6 3 8 ) 1 , 5 4 8 2 9 , 8 3 3 5 0 , 3 6 0S w a p 1 0 1 , 0 1 1 - 1 0 1 , 0 1 1 6 , 0 1 4 - 6 , 0 1 4 6 , 4 6 5 3 0 6S u b t o t a l 1 , 3 1 0 , 3 0 1 2 7 6 , 6 3 1 1 , 0 3 3 , 6 7 0 ( 1 7 , 0 7 6 ) ( 2 4 , 6 3 8 ) 7 , 5 6 2 3 6 , 2 9 8 5 0 , 6 6 6
Interest rate Swap 1 4 4 , 8 6 6 - 1 4 4 , 8 6 6 ( 4 , 2 2 9 ) - ( 4 , 2 2 9 ) - 3 , 7 8 4KOSPI 200 futures 3 4 , 3 5 0 3 4 , 3 5 0 4 5 4 5 1 , 1 9 8 1 , 1 5 3O t h e r s 3 7 , 7 9 1 3 7 , 7 9 1 - ( 3 0 9 ) ( 3 0 9 ) - 4 5 4 3 , 8 5 4T o t a l 1 , 5 2 7 , 3 0 8 3 4 8 , 7 7 2 1 , 1 7 8 , 5 3 6 ( 2 1 , 5 6 9 ) ( 2 4 , 9 0 2 ) 3 , 3 3 3 3 7 , 9 5 0 5 9 , 4 5 7
Unrealized gains and losses(I/S) Unrealized gains and losses(B/S)

NOTES TO CONSOLIDATED FINANCIAL STAT E M E N T SDecember 31, 2000 and 1999
Confirmed acceptances and guarantees as of December 31, 2000 and 1999 comprise the following :
The Bank has not reported the acceptances and guarantees in the accompanying consolidated balance sheet. The Bank has, however,recorded the reserve for possible losses on the acceptances and guarantees as a liability.
A summary of other significant commitments, categorized in accordance with bank supervisory regulations is as follows:
In connection with the Bank's securities agency operation, the amount of depositary securities, as of December 31, 2000 and 1999 W1,958,783and W1,660,621 million respectively.
In connection with the Bank's letter of credit guarantee for Shinhan International Corporation amounting to US$ 3,397 thousand, SocieteGeneral, Seoul Branch has filed a lawsuit against the Bank claiming settlement. On December 11, 1998, the court determined that the Bankshould pay the claim, including interest for the delayed payment period and the cost of the lawsuit. The Bank made an immediate appeal to ahigher court by whose determination the Bank won the case on October 24, 2000. Societe General, Seoul Branch made a final appeal to theSupreme Court and the result of the determination cannot be estimated as of December 31, 2000.
The Bank, in relation to foreign confirmed acceptances and guarantees, has entered into credit derivatives purchase contract of W 31,493million( US $ 25 million)with Hans Merchant Bank as of December 31, 2000
Among the written-off claims of the Bank, the amount on which the legal rights of claims have not been expired are W 494,308 million andW284,706 million as of December 31, 2000 and 1999, respectively.
The Bank has entered into credit line commitments (W55,000 million limit) with several special purpose (asset-back securitization) companiesto supply sufficient funds for the repayment of bonds issued by the companies. There is no use of the credit line as of December 31, 2000.Rationally expected annual credit amount is W13,900 million and W11,200 million in 2001 and 2002, respectively.
The Bank has entered into a commitment with Korea Asset Management Corporation ("KAMCO") to sell non-performing loans with the salesbeing dependent on the collection of the loans, or repurchase under certain conditions. As of December 31, 2000, the non-performing loans soldto KAMCO under the commitment are W68,680 million. The ultimate resolution of these transactions may affect the Bank's financial position,depending on the settlement or repurchase of the loans. The ultimate effect of these significant uncertainties on the settlement or repurchase ofthe non-performing loans as of the balance sheet date cannot presently be determined and accordingly, no adjustments have been made in theaccompanying financial statements related to such uncertainties other than those adjustments disclosed in these financial statements.
Beginning in 1997, Korea and other countries in the Asia Pacific region experienced a severe contraction in substantially all aspects of theireconomies. This situation is commonly referred to as the 1997 Asian financial crisis. In response to this situation, the Korean government andthe private sector began implementing structural reforms to historical business practices. The Korean economy is currently experiencingadditional difficulties, particularly in the areas of restructuring private enterprises and reforming the banking industry. The Korean governmentcontinues to apply pressure to Korean companies to restructure into more efficient and profitable firms. The banking industry is currentlyundergoing consolidations and significant uncertainty exists with regard to the availability of short-term financing during the coming year. TheBank may be either directly or in directly affected by the situation described above.
The accompanying financial statements reflect management's current assessment of the impact to date of the economic situation on thefinancial position of the Bank. Actual results may differ materially from management's current assessment.
FINANCIAL STATEMENTS 85Hana Bank Annual Report 2000
Millions of won
Acceptances and guarantees in Won currency : W 6 7 9 , 8 6 0 W 7 0 8 , 2 7 3
Acceptances and guarantees in foreign currencies :Acceptances for letters of credit 1 , 5 3 8 , 8 8 5 1 , 1 8 2 , 2 4 8Letters of guarantee for importers 5 6 , 3 3 9 5 6 , 6 5 3Guarantees on credit derivatives 3 1 , 4 9 3 2 8 , 6 3 5O t h e r 6 0 2 , 8 0 9 4 5 3 , 5 7 5
2 , 2 2 9 , 5 2 6 1 , 7 2 1 , 1 1 1
W 2 , 9 0 9 , 3 8 6 W 2 , 4 2 9 , 3 8 4
2000 1999
Millions of won
Commercial letters of credit W 1 , 2 9 0 , 6 1 9 W 1 , 2 3 4 , 3 1 0Loan commitments 7 0Endorsed notes 1 5 0 , 6 9 0 4 7 , 4 9 9
2000 1999

7. Capital stock:
On January 8, 1999, related to a P&A (Purchase of assets and Assumption of liabilities) of Choong-Chung Bank and the merger with BoramBank, the Bank issued 94,560,000 shares of non-cumulative, non-participating preferred stock for cash at W‹5,000 per share to Korea DepositInsurance Corporation ("KDIC"). Upon executing the investment contract with KDIC, the Bank has a right to purchase ("call option") thesepreferred stocks. As of December 31, 2000, preferred stock issued outstanding is 67,081,000 shares after the Bank exercised its call option topurchase 27,479,000 shares on January 27, 2000. The terms for the options on the remaining 44,153,000 and 22,928,000 shares are until March 27,2002 and March 27, 2004, respectively. If the Bank does not exercise its call options, the preferred shares will be converted to common stockafter the end of the option term.
On April 21, 2000, the Bank issued 14,200,000 (par value of W5,000) common shares to Allianz AG (ownership of 12.46%) at W8,900 per share.The Bank recorded W55,013 million in capital surplus after deducting W367 million of stock issuance costs from W55,380 million of additionalpaid-in capital in excess of par value.
During 1999 and 2000, the Bank granted stock options of 1,040,000 and 628,000 shares, respectively, to 57 members of the management.Depending on the Bank's future condition, the Bank may choose a cash benefit or the issuance of common stocks at an exercise price ofW10,020 and W8,500, respectively.
8. Consolidated Earnings Per Share and Ordinary Income Per Share
Consolidated Earnings per share and ordinary income per share for the years ended December 31, 2000 and 1999 are calculated as follows :
Diluted consolidated earning per share and ordinary income per share for the year ended December 31, 2000 and 1999 are calculated as follows :
NOTES TO CONSOLIDATED FINANCIAL STAT E M E N T SDecember 31, 2000 and 1999
86 FINANCIAL STATEMENTSHana Bank Annual Report 2000
Korean Won
Consolidated ordinary income per shareConsolidated ordinary Income
after income tax expenses W 2 6 , 9 7 0 , 3 5 4 , 6 3 0 W1 8 2 , 1 8 2 , 6 0 6 , 7 9 3Dividends on Preferred stock (5,561,700,000) ( 8 , 0 2 3 , 0 0 0 , 0 0 0 )
2 1 , 4 0 8 , 6 5 4 , 6 3 0 1 7 4 , 1 5 9 , 6 0 6 , 7 9 3Weighted average of common shares 1 2 0 , 0 5 6 , 6 2 3 1 0 0 , 7 6 3 , 7 3 9
Consolidated ordinary Income per share W 1 7 8 W 1 , 7 2 8
Consolidated earnings per shareConsolidated net Income W 1 7 , 7 7 0 , 5 3 0 , 8 4 6 W1 4 4 , 5 3 3 , 6 5 2 , 8 7 2Dividends on Preferred Stock ( 5 , 5 6 1 , 7 0 0 , 0 0 0 ) ( 8 , 0 2 3 , 0 0 0 , 0 0 0 )
1 2 , 2 0 8 , 8 3 0 , 8 4 6 1 3 6 , 5 1 0 , 6 5 2 , 8 7 2Weighted average of common shares 1 2 0 , 0 5 6 , 6 2 3 1 0 0 , 7 6 3 , 7 3 9
Consolidated earnings per share W 1 0 2 W 1 , 3 5 5
2000 1999
Korean Won
Diluted consolidated ordinary income per shareConsolidated ordinary income
after income tax expenses W 2 6 , 9 7 0 , 3 5 4 , 6 3 0 W2 0 5 , 8 9 8 , 2 6 2 , 5 0 8Interest expense on convertible bonds - 4 , 9 1 8 , 6 3 2 , 0 7 4
2 6 , 9 7 0 , 3 5 4 , 6 3 0 2 1 0 , 8 1 6 , 8 9 4 , 5 8 2Weighted average number of common shares 1 8 8 , 6 6 8 , 3 5 5 2 0 2 , 8 0 3 , 8 0 4Diluted consolidated
ordinary income per share W 1 4 3 W 1 , 0 4 0
Diluted consolidated earnings per shareConsolidated net Income W 1 7 , 7 7 0 , 5 3 0 , 8 4 6 W1 4 4 , 5 3 3 , 6 5 2 , 8 7 2Interest expense on convertible bonds 4 , 9 1 8 , 6 3 2 , 0 7 4
1 7 , 7 7 0 , 5 3 0 , 8 4 6 1 4 9 , 4 5 2 , 2 8 4 , 9 4 6Weighted average number of common shares 1 8 8 , 6 6 8 , 3 5 5 2 0 2 , 8 0 3 , 8 0 4
Diluted consolidated earnings per share W 9 4 W 7 3 7
2000 1999

NOTES TO CONSOLIDATED FINANCIAL STAT E M E N T SDecember 31, 2000 and 1999
9. Inter-Company Transactions:
Significant transactions between the Bank and its subsidiaries during the year ended December 31, 2000 and 1999, and related accountbalances at December 31, 2000 and 1999, are as follows (millions of Won):
1) 2000
Related parties Account balances T r a n s a c t i o n s
Hana Securities L o a n s W 3,398 Interest income W 123D e p o s i t s 1 4 , 8 3 7 Interest expenses 6 9 5
Hana Research D e p o s i t s 3 0 7 Consulting fees 1 , 0 0 4Interest expenses 6
Hana Risjad Finance L o a n s 7 , 5 2 8 Interest income 4 1 9Interest expenses 7
2) 1999
Related parties Account balances T r a n s a c t i o n s
Hana Securities L o a n s 3 , 5 0 7 Interest income 2 , 7 9 9D e p o s i t s 9 , 7 7 9 Interest expenses 1 , 2 0 1
Korea Merchant - Interest income 1 2Banking Corporation Interest expenses 7
Hana Risjad Finance - Interest income 4Interest expenses 6 0
10. Purchase of Assets and Assumption of Liabilities Contract :
The Bank has entered into a "Purchase of Assets and Assets and Assumption of Liabilities" (hereafter "P&A") contract, effective June 29, 1998,to purchase certain assets and assume most of the liabilities of Choong-Chung Bank which ceased operations as of June 29, 1998 by the orderof the Financial Supervisory Commission.
According to the P&A contract, only the performing assets were purchased by the Bank and all non-performing assets were transferred tothe Korea Asset Management Corporation ("KAMCO"). Any future economic loss arising from the non-performing assets will be absorbedaccording to the P&A contract and the subscription agreement with Korea Deposit Insurance Corporation.
On March 31, June 30, and September 30, 1999, put options were executed according to the P&A arrangement. As a consequence of the putoptions, the Bank received cash and securities of W388,045 million from KDIC and KAMCO.
11. Business combination:
On January 1, 1999, the Bank merged with Boram Bank, whose business is similar to that of Hana Bank. The Bank issued 8,761,986 shares ofcommon stock in exchange for all of the issued and outstanding shares of Boram Bank. The exchange rate was 0.2549 share and 0.1485 shareof the Bank's common stock for each share of Boram Bank's common stock and preferred stock, respectively.
12. Reclassification of Financial Statements at December 31, 1999 :
Certain account in the financial statements at December 31,1999 have been reclassified to conform to the 2000 presentation. Thesereclassification had no effect on previously reported net income or stockholders' equity.
13. Subsequent events :
On January 30 2001, the Bank has purchased 27,479,000 shares, at W 5,000 (par value) per share, of its redeemable preferred stock which hadbeen issued and outstanding with the subscription agreements between the Bank and KDIC (see note 7). The stocks are recorded as treasurystocks in capital adjustment.
FINANCIAL STATEMENTS 87Hana Bank Annual Report 2000

88 SUBSIDIARIESHana Bank Annual Report 2000
SUBSIDIARIES
Hana Securities is a subsidiary, with the Bank holding a 44.96% equity stake(As of the end of
2000) including preferred stocks. The amount of paid-in capital stands at 104.8 billion won as of
the end of 2000. It is mainly engaged in the following businesses:
1) Transactions of treasury stocks
2) Acceptance and consignment
Address: Hana Securities Bldg., 9th Fl. 23-3 Youido-dong, Yeongdungpo-gu, Seoul , Korea
First established as the Korea Investment & Economic Research Institute on July 3, 1990, Hana
Research & Consulting took on its current name on July 1, 1992 and is one of the Bank's
wholly-owned subsidiaries. Its amount of paid-in capital stands at 2 billion won as of the end
of 2000. It is mainly engaged in the following businesses:
1) Survey and analysis of the economy, various industries, and domestic and overseas
f i n a n c i n g
2) Publication and sales of data and books pertaining to the above
Address: Hana Securities Bldg., 9th Fl. 23-3 Youido-dong, Yeongdungpo-gu, Seoul , Korea
Hana-Allianz ITMC is a subsidiary , with the Bank holding a 50% equity stake. The amount of
paid-in capital stands at 30 billion won as of the end of 2000. It is mainly engaged in the
following business :
Beneficiary Certificates & Mutual Fund Management .
Address : Hana Securities Bldg, 11th Fl. 23-3 Youido-dong, Yeongdungpo-gu, Seoul. Korea
Hana Securities Co., Ltd.
Hana R e s e a r ch & Institute.
Hana Allianz Investment Trust Management Corporation.

ORGANIZATION CHART 89Hana Bank Annual Report 2000
ORGANIZATION CHART
ManagementCommittee Credit Committee
C o m p l i a n c eManagement Team
Secretariat
Strategic PlanningGroup
General Shareholders’M e e t i n g
Board of Directors
BOD SteeringC o m m i t t e e
Management Development& Compensation Committee Risk Committee A u d i t
C o m m i t t e e
CEO
BOD Support Team
Retail Banking GroupRetail Business Promotion TeamLoan CenterPrivate Banking Support TeamDomestic Business Network TeamCustomer Satisfaction Team
Credit Card Business GroupCredit Card Business Center
Corporate Banking GroupCorporate Business Marketing Team
Investment Banking GroupInvestment Banking TeamVenture Investment Team
Treasury GroupBank Account Treasury Team
Clearing Center
Banking Support GroupHuman Resources Department
Human Resources Development TeamLoan Management and Collection DepartmentOperation Support DepartmentSecurity Control Department
Chungchong HanabankChungchong Planning & Management TeamChungchong Business Promotion TeamChungchong Retail TeamChungchong Loan CenterChungchong Business Support TeamChungchong Credit Management TeamChungchong Information Systems TeamChungchong Institutional Marketing Team
Trust Business GroupTrust Account Treasury TeamTrust Risk Control Team
Information & Technology GroupInformation Systems Department
e-Commerce Business GroupElectronic Banking Team
Internet Business Team
Regional Retail Banking Division
Planning &Management Team
StrategyDevelopment Team
ALM Team Credit Control Team
AccountingTeam
CommunicationsTeam
IR Team
Risk Management Group
Corporate Banking DivisionRM BranchOverseas Branch
Int’l Banking TeamCorporate Restructuring TeamInternational Business OperationCenter
Corporate Banking DivisionRM Branch
Branch
Small and Medium CorporateSupport TeamCredit Evaluation Team
Audit & Examination Dept.
Large Corporate Promotion Group Small and Medium CorporatePromotion Group
Chungchong Corporate Banking Center
Branch Branch

Board of Directors
Sang-Bin Lee, Ph.D ( r )Professor of FinanceHan-Yang UniversityVice-Chairman, Korea Securities Association
Yong-Maan Park ( c )PresidentDoosan Corporation
Kun-Rae Sohn ( s )Vice Chairman DongBu Inc.
K.Joe Song ( r )Deputy President & CIOHana Bank
Sang-Hyun Song, J.S.D. (a) (s)Professor of Law, Seoul National UniverstyChairman, The Korea Law Professors Association Inc.
Sang-Ki Woo ( c )Chairman & CEOSindoricoh Corporation
Sang-Boo Yoo ( c )Chairman & CEO, Pohang Iron & Steel Co. Ltd.Vice Chairman, Federation of Korean IndurstriesVice Chairman, Korea-Japan Economic AssociationMember, Steering Committee, Korea-US Business Coucil
Kyo-Joong Yoon ( s )Senior Deputy President & COOHana Bank
( a ) Member of Audit Committee
( c ) Member of Management Development
& Compensation Committee( r ) Risk Committee
( s ) Member of Board of Directors Steering Committee
Jin-Suk Chun ( r )Deputy PresidentChungchong Hana Bank
Moon-Ho Lee ( a )Vice Chairman & CEOLG Academy
E. Han Kim, Ph.D ( r )Fred M.Taylor Professor of Business AdministrationUniversity of Michigan
Jae-Chul Kim ( c )Chairman, Dongwon Industries Co.Chairman, Korea International Trade Assocation
Jong-Yeol KimDeputy PresidentRetail Banking & Credit Card BusinessHana Bank
Joo-Song Kim (a) (s)PresidentRestructuring CommitteeKolon Corporation
Seung-Yu Kim (r) (s)Chairman & CEOHana Bank
Young-Ki Kim ( a )Standing Member of Audit CommitteeHana Bank
Roy A. Karaoglan, Ph.D ( r )ConsultantInternational Finance Corporation
DR. Bernd Gutting ( r ) ( s )CEO & MDAllianz Asset Management Asia Pacific
90 BOARD OF DIRECTORSHana Bank Annual Report 2000

ST R A T E G I C PL A N N I N G GR O U P
Chong-Suk ChoiSenior Executive Vice President & CFOGroup Head of Strategic Planning Group
Yong-Gwan KangGeneral ManagerCommunication Team
Byoung-Ho KimGeneral ManagerPlanning & Management Team, IR Team
Gyeong-Hoi KooGeneral ManagerAccounting Team
Tae-Gyun KwonGeneral ManagerStrategy Development Team
RI S K MA N A G E M E N T GR O U P
Dal-Yong LeeSenior Executive Vice President & CRO
Jeong-Ho Suh. Ph.DExecutive Vice President &Group Head of Risk Management Group
Tae-Young LiGeneral ManagerAsset & Liability Management TeamYoung-Kii ParkGeneral ManagerCredit Control Team
RE T A I L BA N K I N G GR O U P
Jung-Tae KimSenior Executive Vice President &Group Headof Retail Banking Group
Won-Pyo HongRegional HeadKang-Nam Regional Retail Banking Division
Sun-Woo KangRegional HeadSeocho Regional Retail Banking Division
Joon-Ho KimRegional HeadKang-Seo Regional Retail Banking Division
Sam-Deuk KimRegional HeadYoung-Nam Regional Retail BankingD i v i s i o n
Sung-Soo LeeRegional HeadHo-Nam Regional Retail Banking Division
Byong-Kap YoonRegional HeadKang-Buk Regional Retail Banking Division
Hae-Boong JeongGeneral ManagerDomestic Business Network Team
Hee-Cheol KimGeneral ManagerPrivate Banking Support Team
Tae-Oh KimGeneral ManagerRetail Business Marketing Team
Yong-Jae KimGeneral ManagerCustomer Satisfaction Team
Chong-O LimGeneral ManagerLoan Center
CR E D I T CA R D BU S I N E S S GR O U P
Hyung-Soo KimGeneral ManagerCredit Card Business Center
CO R P O R A T E BA N K I N G GR O U P
Hoon-Kyu KimSenior Executive Vice President & Group Headof Corporate Banking Group
Hee-Dae KimExecutive Vice President &Group Headof Large Corporate PromotionG r o u p
Hee-Won ShimExecutive Vice President & Regional GroupHead Regional SME Banking Division II
Bo-Sik JunRegional HeadRegional Large Corporate Banking Division II
Hyo-Joo KangRegional HeadInstitutional Marketing Devision
Kang. M. LeeRegional HeadRegional Large Corporate Banking Division I
Yeon-Sik MoonRegional HeadRegional SME Banking Division I
Chang-Sup RhimRegional HeadKyung-In Corporate Banking Division
In-Bok ChangGeneral ManagerCredit Evaluation Team
Kyu-Tae HanGeneral ManagerInternational Banking Team
Jong-Yo KimGeneral ManagerSME Corporate Support Team
Nam-Yong LeeGeneral ManagerCorporate Restructuring Team
Seo-Ki LeeGeneral ManagerInternational Business Operating Center
Yong-Seung Yang
General ManagerCorporate Business Marketing Team
IN V E S T M E N T BA N K I N G GR O U P
Woong-il (Francis) LeeSenior Executive Vice President & Group Head of Investment Banking Group
Boo-Seong LeeGeneral ManagerVenture Investment Team
Brian B. W. SohGeneral ManagerInvestment Banking Team
TR E A S U R Y GR O U P
Jin-Sung KimGroup Head Treasury Group
Young-Seok ChoGeneral ManagerBank Account Treasury Team
BA N K I N G SU P P O R T GR O U P
Sung-Yoon SongSenior Executive Vice President & Group Head of Banking Support Group
Kyoung-Ho ChoGeneral ManagerHuman Resources Department
Young-Woo JooGeneral ManagerLoan Management and CollectionD e p a r t m e n t
Yong-Sun KimGeneral ManagerOperation Support Department
Jin-Tae LeeGeneral ManagerSecurity Control Department
Young-Ho LimGeneral ManagerHuman Resources Department Team
CH U N G C H O N G HA N A B A N K
Sung-Ho ChoiSenior Executive Vice President &Group Head of Chungchong HanabankG r o u p
Choon JungGeneral ManagerChungchong Planning & ManagementT e a m
Moo-Young JungGeneral ManagerChungchong IT Team
Byung-Hwan LeeGeneral ManagerChungchong Loan Center
Chang-Goo ParkGeneral Manager
Chungchong Institutional Marketing TeamJong-Deok ParkGeneral ManagerChungchong Business Promotion Team& Chungchong Retail Team
Dong-Jin YangGeneral ManagerChungchong Business Support TeamSang-Jong YooGeneral ManagerChungchong Credit Management TeamTrust Risk Control Team
Ji-Ho YunGeneral ManagerChungchong Corporate Banking Center
TR U S T BU S I N E S S GR O U P
Michael Jeung Sae LeeGroup Head Trust Business Group
Moon-Hwan BaeGeneral ManagerTrust Account Treasury Team
Jin-Hyeong LeeGeneral ManagerTrust Risk Control Team
IN F O R M A T I O N A N D
TE C H N O L O G Y GR O U P
In-Sung Kang Group HeadInformation and Technology Group
E - CO M M E R C E BU S I N E S S GR O U P
Hwa-Soo LeeGeneral ManagerInternet Business Team
Ho-Joon MoonGeneral ManagerElectronic Banking TeamCompliance Management Team
CO M P L I A N C E MA N A G E M E N T TE A M
In-Suk ParkCompliance Officer
Byung-Hoon Chung. LawyerGeneral ManagerCompliance Management Team
AU D I T A N D EX A M I N A T I O N
DE P A R T M E N T
Jin-Ho ChuGeneral ManagerAudit and Examination Department
SE C R E T A R I A T
Hyun-Joo LeeGeneral ManagerS e c r e t a r i a t
E x e c u t i v e O f f i c e r s
EXECUTIVE OFFICERS 91Hana Bank Annual Report 2000

92 SHAREHOLDERS INFORMATIONHana Bank Annual Report 2000
SHAREHOLDERS INFORMATION
O t h e rNumber of shares owned by foreign investors :4 0 , 0 0 4 , 8 7 8 ( 3 2 . 1 7 % )Number of shareholders : 34,470Tel : (82-2)2002-1856,1857
For Investment BankingInvestment Banking GroupTel : (82-2)2002-1489Fax : (82-2)773-2653E-mail address : [email protected]
For general information or other inquiriesTel : (82-2)2002-1111E-mail address : [email protected] our Homepage.
Independent AuditorSamil Accounting Corporation(The Korean member firm of
P r i c e w a t e r h o u s e C o o p e r s )191 Hangangro 2-ga, Yongsan-ku, Seoul 140-702,K o r e a
Share Data (As of Dec.31,2000) (In share,Won)
T y p e Number of Authorized Shares Number of Issued Shares Par value
Registered Common Share500,000,000
124,363,180 W 5 , 0 0 0Registered Preferred Share** 67,081,000 W 5 , 0 0 0
T o t a l 500,000,000 191,444,180
* Stock options for 1,668 thousand common shares are outstanding as of Dec 31,2000
* Convertible bonds of US $30,000,000 and W49.998 million are outstanding as of Dec 31,2000 which are equivalent to 6,774,708 and
2,548,837 common shares respectively, if fully converted.
** Preferred shares are scheduled to be redeemed according to the redemption schedule by Jan 2004 (please refer to page 32 for details)
Share Data Trend (In billions of Won,Won,times)
1 9 9 6 1 9 9 7 1 9 9 8 1 9 9 9 2 0 0 0
Net Income 44.5 43.5 110.8 144.3 2 0 . 5D i v i d e n d 1 0 . 7 1 8 . 7 2 8 . 0 5 2 . 1 3 0 . 4( C a s h - W o n ) 2 2 5 4 0 0 4 0 0 4 0 0 2 0 0( S t o c k - S h a r e s ) 0 . 0 4 - - - -
E P S 1 , 7 5 6 1 , 1 7 8 1 , 7 9 0 1 , 3 5 3 124 B P S 1 7 , 7 6 2 1 4 , 8 5 6 1 2 , 3 4 6 1 1 , 7 3 5 11,442 Share Price((High) 1 7 , 7 0 0 1 2 , 7 0 0 1 4 , 5 0 0 1 9 , 5 0 0 11,800 Share Price((Low) 9 , 9 0 0 5 , 0 5 0 3 , 4 5 0 8 , 0 0 0 4,320
PER BAND 5 . 6 ~ 9 . 6 4 . 3 ~ 1 0 . 8 1 . 9 ~ 8 . 1 5 . 9 ~ 1 4 . 4 3 4 . 8 ~ 9 5 . 2Market Average PER 1 9 . 4 1 9 . 3 1 2 . 6 3 0 . 4 2 1 . 0
* As of December 31,2000 fully diluted EPS is W 130
Major Shareholders (As of Dec 31,2000)
N a m e Number of R a t i o ( % )Owned Shares
Allianz AG 15,493,778 1 2 . 4 6 %K o l o n 7,639,305 6 . 1 4 %Sindoricoh Corp. 6,759,982 5 . 4 4 %D o n g w o n 6,419,179 5 . 1 6 %D o o s a n 4,839,505 3 . 8 9 %Pohang Iron & Steel Co. Ltd. 4 , 4 4 0 , 0 0 0 3 . 5 7 %Dong Bu 4 , 0 0 5 , 7 7 3 3 . 2 2 %International Finance Co. 3 , 4 6 4 , 7 5 1 2 . 7 9 %
N a m e Number of R a t i o ( % )Owned Shares
S a m s u n g 3 , 4 2 8 , 4 8 9 2 . 7 6 %National Pension Fund 3,200,000 2 . 5 7 %The Great 2,491,430 2 . 0 0 %C I T I B A N K . N . A . 2,163,086 1 . 7 4 %H y o s u n g 1,941,108 1 . 5 6 %MATHEWS INT’L FUND 1,594,999 1 . 2 8 %L G 1,428,108 1 . 1 5 %H y u n d a i 1,312,080 1 . 0 6 %
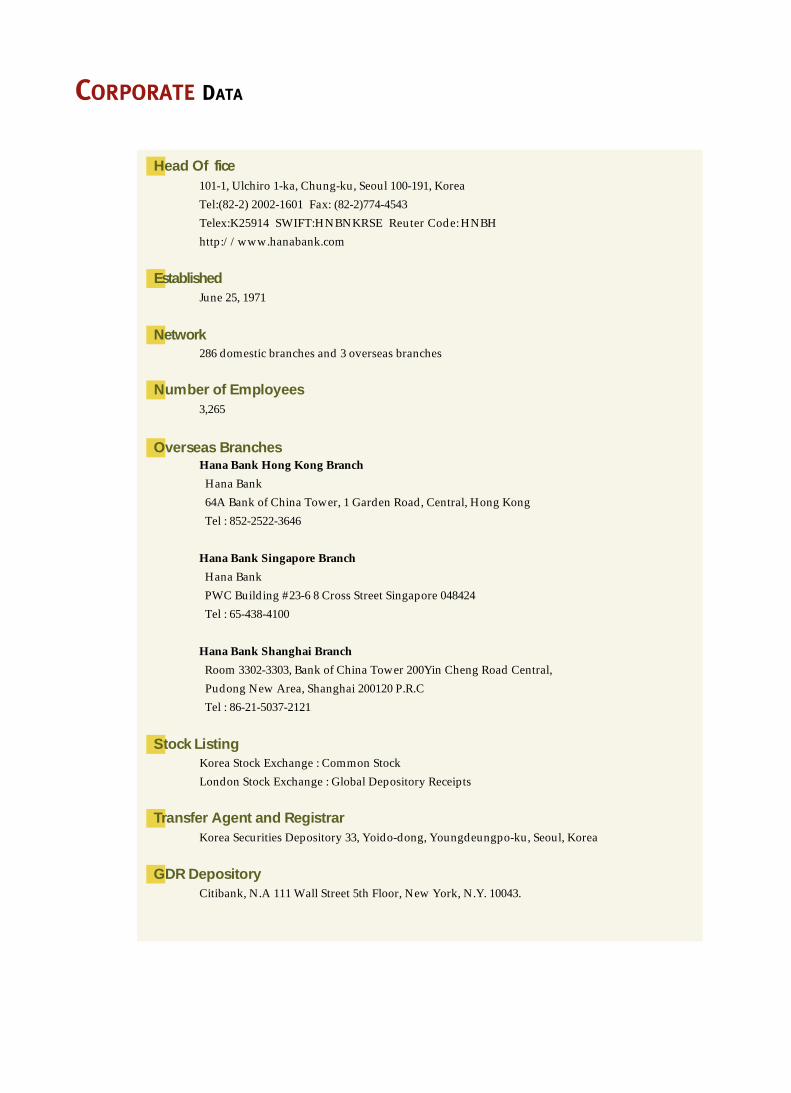
CORPORATE DATA
101-1, Ulchiro 1-ka, Chung-ku, Seoul 100-191, Korea
T el:(82-2) 2002-1601 Fax: ( 8 2 - 2 ) 7 7 4 - 4 5 4 3
T e l ex:K25914 SWIFT:HNBNKRSE Reuter Code: H N B H
h t t p : / / w w w . h a n a b a n k . c o m
June 25, 1971
286 domestic branches and 3 overseas branches
3 , 2 6 5
Hana Bank Hong Kong Branch
Hana Bank
64A Bank of China Tower, 1 Garden Road, Central, Hong Kong
Tel : 852-2522-3646
Hana Bank Singapore Branch
Hana Bank
PWC Building #23-6 8 Cross Street Singapore 048424
Tel : 65-438-4100
Hana Bank Shanghai Branch
Room 3302-3303, Bank of China Tower 200Yin Cheng Road Central,
Pudong New Area, Shanghai 200120 P.R.C
Tel : 86-21-5037-2121
Korea Stock Exchange : Common Stock
London Stock Exchange : Global Depository Receipts
Korea Securities Depository 33, Yoido-dong, Youngdeungpo-ku, Seoul, Korea
Citibank, N.A 111 Wall Street 5th Floor, New York, N.Y. 10043.
Head Of f i c e
E s t a b l i s h e d
N e t w o r k
Number of Employees
Overseas Branches
Stock Listing
Transfer Agent and Registrar
GDR Depository

Investor Relations
Any shareholders wishing to receive detail information on Hana BankPlease request to; IR Team, Strategic Planning GroupHanaBank: HanaBank Building 101-1, Ulchiro 1-ka, Chung-ku, Seoul 100-191, Korea
h t t p : / / w w w.h a n a b a n k . c o m
T EL : 8 2 - 2 - 2 0 0 2 - 1 6 0 1F AX: 8 2 - 2 - 7 7 4 - 4 5 4 3E - m a il : b h k i m @ h a n a b a n k . c o m
j b y o o @ h a n a b a n k . c o m