Embed Size (px)
Citation preview

Moving the Needle!CUNY’s Newest Community College:
Gifted, Named and Soaring a Year after its Establishment
October 3, 2013

CUNY’s Guttman Community College

About Guttman Community College• CUNY’s New Community College officially opened its doors on August 20,
2012, after four years of planning in consultation with experts from around the country and hundreds of faculty and staff across the University.
• Guttman Community College (GCC) enrolled its inaugural class of 300 students in the fall of 2012. As an open-admissions institution, GCC accepts applicants who have a high school diploma or a GED.
• The Board of Trustees of CUNY accepted a gift of $25 million from the Stella and Charles Guttman Foundation on April 29, 2013, accordingly renaming New Community College the Stella and Charles Guttman Community College.

A Year After Welcoming Our First Class
Growing Population Applicants Students Faculty and Staff
Reflecting on 2012-2013 Student Satisfaction Academic Performance
Revisiting the Fall 2012 Cohort Re-enrollment Profile Student Successes
Meeting the Fall 2013 Cohort Student Demographics
Growth
• Applicants• Students• Faculty• Staff

From Admissions to EnrollmentFall
2012Fall
2013
Applicants 5373 7171
Group information sessions attendees
855 838
Individual information sessions attendees
504 555
Summer Bridge attendees
306 293
Enrolled students 289 278
• Applications and number attending individual information sessions increased in 2013.
• Summer Bridge attendance decreased in 2013, but, upon completion of Bridge, a slightly higher percentage of students enrolled than in 2012 (95% vs. 94%).
• CUNY believes 2013 Summer Bridge attendance dropped because GCC did a better job of explaining the Guttman model in the info sessions and applicants decided at an earlier stage whether or not to pursue enrollment.
Preliminary Data
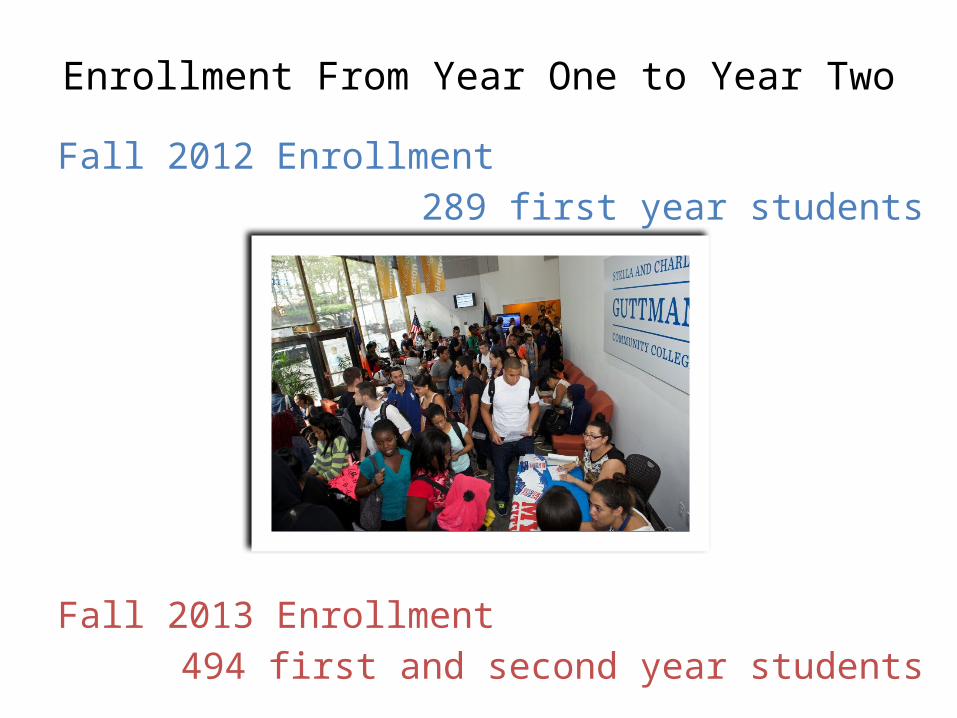
Enrollment From Year One to Year TwoFall 2012 Enrollment
289 first year students
Fall 2013 Enrollment494 first and second year students

Faculty and Staff GrowthFaculty and Staff
CountsFall
2012Fall
2013Full-time Faculty 19 30Part-time Faculty 6 9Faculty Subtotal 25 39Full-time Administration & Staff 36 57Part-time Administration & Staff 17 20Administration and Staff Subtotal 53 77Graduate Coordinators 13 9Peer Mentors 28 50Coordinator and Mentor Subtotal 41 59TOTAL 119 175
Data as of August 2013

Reflecting on 2012-2013
Student SatisfactionAcademic Performance
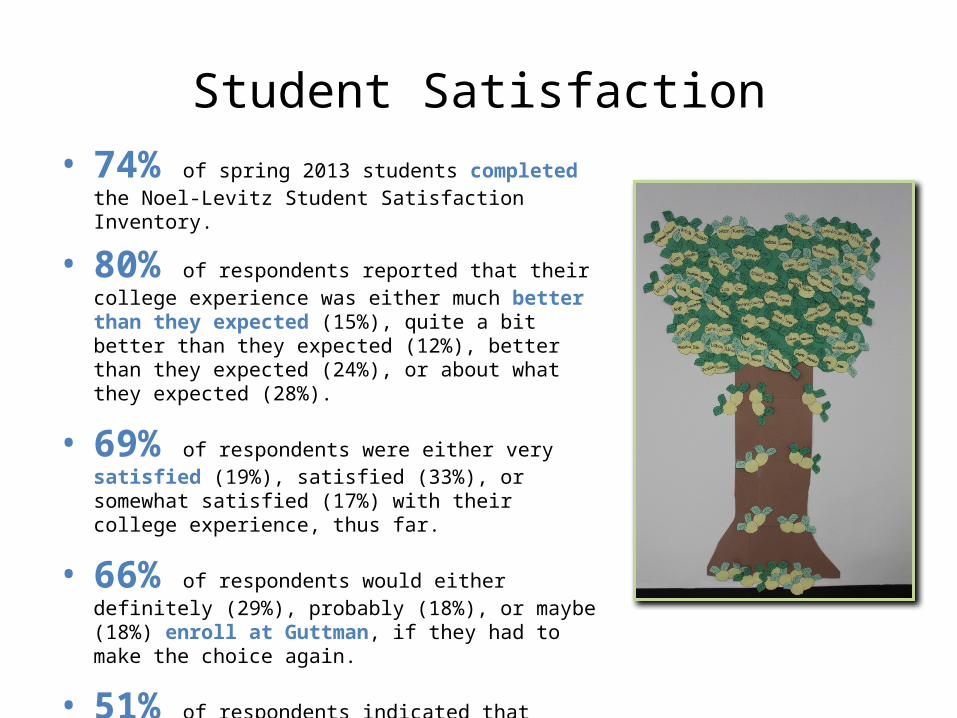
Student Satisfaction• 74% of spring 2013 students completed the Noel-Levitz
Student Satisfaction Inventory.
• 80% of respondents reported that their college experience was either much better than they expected (15%), quite a bit better than they expected (12%), better than they expected (24%), or about what they expected (28%).
• 69% of respondents were either very satisfied (19%), satisfied (33%), or somewhat satisfied (17%) with their college experience, thus far.
• 66% of respondents would either definitely (29%), probably (18%), or maybe (18%) enroll at Guttman, if they had to make the choice again.
• 51% of respondents indicated that Guttman was their first college choice. Respondents identified cost, financial aid, and size of institution, as the three most influential factors in their decision to enroll.

2012-2013 Grade DistributionAcross All Courses
A Grades (A, A-)22%
B Grades (B+, B, B-)
31%
C Grades (C+, C)
19%
D Grades (D) 8%
Did not pass (F or NC)
14%
INC1%
Withdrew5%
NOTES:(1) In the case of course retakes, the most recent grades are included.(2) Total Percentage reflects each grade entry. The 2280 grade entries reflect a duplicated grade count per student (i.e., each student completed multiple courses). The total withdrawals (5%) reflect W-grade entries and not unduplicated student withdrawals from the college.

Percentage of Passing GradesBefore and After Retakes
Ethnographies of Work I (N=289)
Statistics A (N=248)
76%66%
82% 77%
Fall 2012
After Fall1 After Fall2
Composition I (N=223) Ethnographies of Work II (N=243)
77% 76%78%83%
Spring 2013
After Spring1 After Spring2

Revisiting the Fall 2012 Cohort

Fall 2012 to Fall 2013Re-enrollment Profile
As of the September 23, 2013 Census Date
• 216 students re-enrolled• 73 students did not
re-enroll
Re-en-
rolled in Fall 201375%
Did not re-
enroll25%

First Year Credit AttainmentRe-enrolled Students (N=216)
2012-2013 Mean
2012-2013 Std. Dev.
Equated Credits (Degree + Developmental) Attempted 37.8 5.5
Equated Credits (Degree + Developmental) Earned 31.3 9.6Degree Credits Attempted 24.4 4.2Degree Credits Earned 21.2 7.0Grade Point Average 2.72 0.69
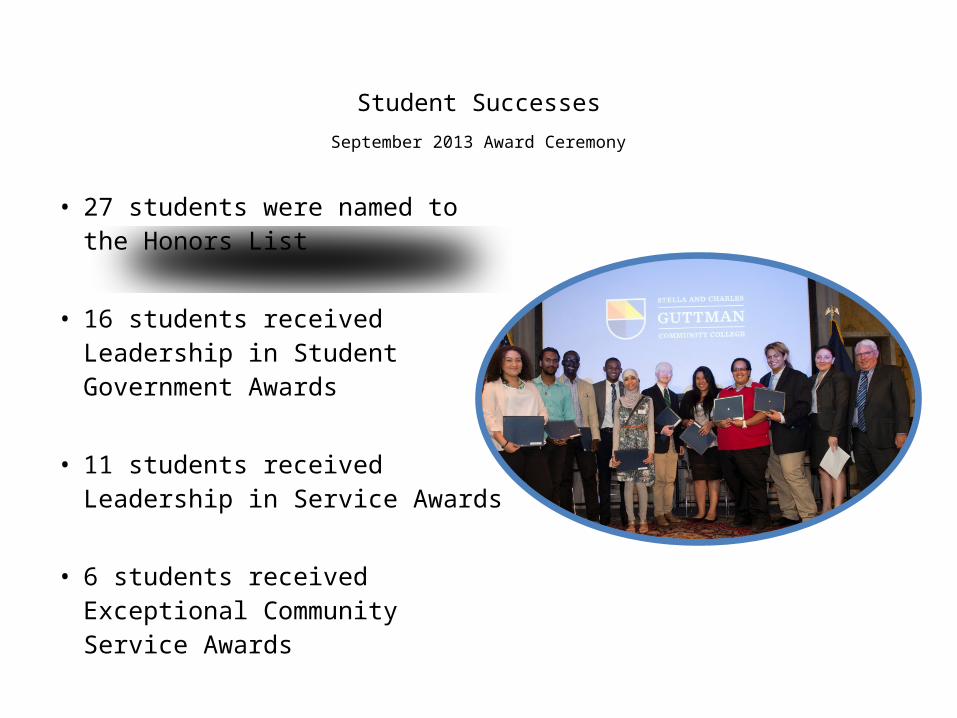
Student SuccessesSeptember 2013 Award Ceremony
• 27 students were named to the Honors List
• 16 students received Leadership in Student Government Awards
• 11 students received Leadership in Service Awards
• 6 students received Exceptional Community Service Awards

Meeting the Fall 2013 Cohort
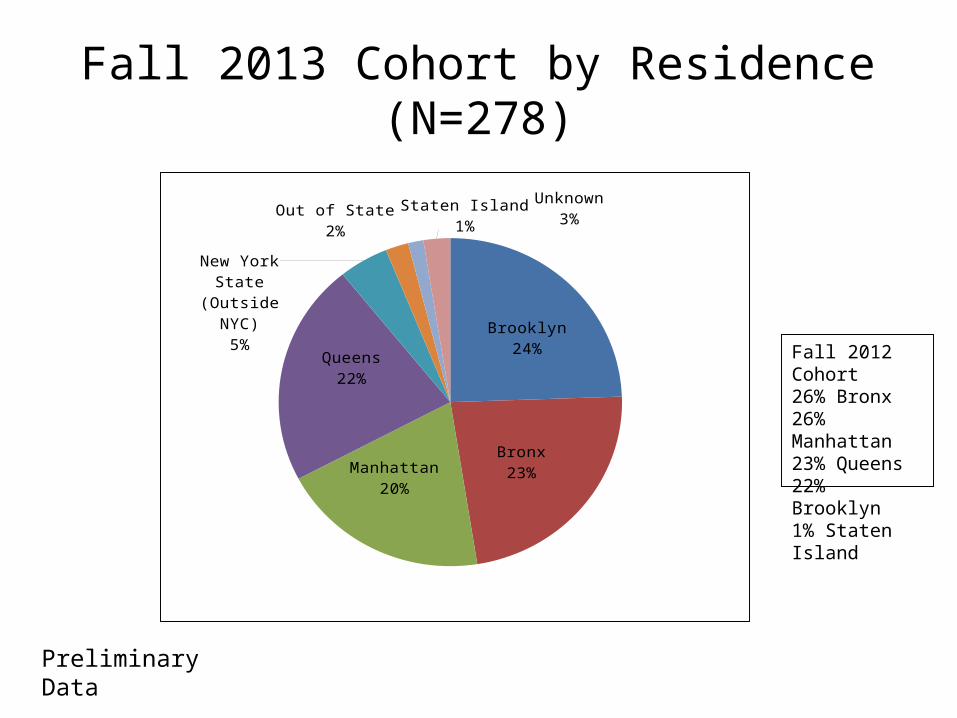
Fall 2013 Cohort by Residence (N=278)
Brooklyn24%
Bronx23%Manhattan
20%
Queens22%
New York State (Outside NYC)
5%
Out of State2%
Staten Island1%
Unknown3%
Preliminary Data
Fall 2012 Cohort26% Bronx26% Manhattan23% Queens22% Brooklyn1% Staten Island

Fall 2013 Cohort by Sex (N=278)
Men38%
Women62%
Fall 2012 Cohort 52% Female48% Male
Preliminary Data

Fall 2013 Cohort by Age (N=278)
19 yrs old18%
20-22 yrs old13%
23-24 yrs old1%
Under 19 yrs old
68%
25 & older1%
Preliminary Data
Fall 2012 Cohort67% Under 19

Discussion