Embed Size (px)
Citation preview

Moving Toward Outcome-Oriented Performance Measurement Systems
Man
agin
g fo
r Pe
rfo
rman
ce a
nd
Res
ult
s Se
ries
Kathe CallahanAssistant ProfessorSchool of Public Affairs and AdministrationRutgers University–Campus at Newark
Kathryn KlobyAssistant ProfessorDepartment of Political ScienceMonmouth University
2 0 0 9 Managing for PerforMance and results series
Kathe Callahanassistant Professorschool of Public affairs and administrationrutgers university–campus at newark
Kathryn Klobyassistant Professordepartment of Political scienceMonmouth university
Moving Toward Outcome-Oriented Performance Measurement Systems


t a B l e o f c o n t e n t s
3
Foreword ..............................................................................................4
Introduction .........................................................................................5trends in Public sector Performance Measurement .......................5government-sponsored Performance Measurement ......................5community indicator Performance Measurement ..........................6shifting gears: from outputs to outcomes ..................................7
Profiles in Outcome-Oriented Performance Measurement Systems ....... 8Profile one: the Washington state government Management
accountability and Performance (gMaP) Program ..................8Profile two: King county, Washington, annual indicators and
Measures (aiMs) High Program .............................................11Profile three: the oregon Progress Board ....................................12
The Challenge of Creating Effective Outcome-Oriented Performance Measurement Systems ...................................................15
finding one: size of staff is not crucial to success ....................15finding two: recruiting enthusiastic Personnel ready to
adapt and learn is essential ..................................................17finding three: Political support is critical for Program success .....17finding four: culture Matters .....................................................19
Recommendations For Creating Effective Outcome-Oriented Performance Measurement Systems ..................................................21
recommendations for designing an outcome-oriented system ....21recommendations for criteria for selecting and agreeing on
outcome indicators ...............................................................21recommendations for Presenting and reporting on outcomes ....22recommendations for sustaining an outcome indicator system ....23
Conclusion .........................................................................................24
Appendix I: Comparison of Government-Sponsored and Community Indicator Approaches .....................................................25
Appendix II: Research Design ............................................................26
Acknowledgements ............................................................................27
References .........................................................................................28
About the Authors ..............................................................................29
Key Contact Information ....................................................................31

iBM center for the Business of government4
Moving toWard outcoMe-oriented PerforMance MeasureMent systeMs
albert Morales
f o r e W o r d
david treworgy
albert Morales Managing Partner iBM center for the Business of government [email protected]
david treworgy Partner Public sector financial Management services iBM global Business services [email protected]
on behalf of the iBM center for the Business of government, we are pleased to present this report, “Moving toward outcome-oriented Performance Measurement systems,” by Kathe callahan and Kathryn Kloby.
Public managers in communities across the country are under increasing pressure by the public to report on the outcomes and results of their pro-grams. With both internal and external demands for information, public man-agers not only need to provide an accounting of resources expended and services provided, but also report on performance and outcomes. the authors note that “implementing a results-oriented focus represents a fundamental shift in the way the public sector does business—a fundamental shift in the nature of thinking, acting, and managing that moves away from a focus on process and regulation to a focus on outcomes and results.”
the authors describe a shift taking place both within government and through independent community indicator projects devoted to developing broad, outcome-oriented indicators of how well a community is doing. they also describe the challenges public managers face in making sense out of the data they collect to inform their decision-making and also inform the public.
the report provides examples of outcome-oriented performance measure-ment systems in place around the country, describes their findings from these case studies, and offers practical recommendations on how to develop useful outcome-oriented measurement systems that other communities—either sponsored by government or community indicator projects—can act upon.
We hope the case studies in this report, and the accompanying recommenda-tions, inspire community leaders across the country to develop their own outcome-oriented performance measurement systems.

www.businessofgovernment.org 5
Moving toWard outcoMe-oriented PerforMance MeasureMent systeMs
Trends in Public Sector Performance MeasurementManaging and measuring for results presents many challenges for public managers in communities across the country. While they may be able to accurately measure how many children are enrolled in school or how many older adults receive Medicare, it is far more difficult to measure the outcomes, or results, of public education and public health programs.
in addition, the way in which many public sector ser-vices are delivered today, in what many refer to as a complex web of outsourced and networked service delivery, further complicates the performance mea-surement challenge. governing through contracts and networks has blurred the lines between public, pri-vate and non-profit sectors and this blurring of lines has literally changed the face of public sector service delivery. in many instances public services designed to provide affordable housing, stimulate economic growth, and promote sustainable development are delivered as a result of collaborations between pub-lic, private and non-profit organizations. While public sector services are often delivered through collabora-tive arrangements, the performance measurement sys-tems designed to measure the outcomes and results of these programs, typically remain the responsibility of the governmental partner.
one of the problems associated with managing for results and measuring outcomes is determining what the desired results and outcomes of government look like. What are the desired results of specific public sector programs and services and what impact do these programs and services have on improving community conditions and overall quality of life? With the broad, and often vague, missions of
many public sector agencies and programs, deter-mining the desired results can be difficult. and though it may not always be appropriate to hold public managers and public sector programs accountable for higher-level outcomes like poverty reduction and increased literacy, public managers are held accountable for a results-orientation that demonstrates how the outcomes of their specific programs and activities contribute to the overall, higher-level societal outcomes that people expect. implementing a results-oriented focus represents a fundamental shift in the way the public sector does business—a fundamental shift in the nature of think-ing, acting, and managing that moves away from a focus on process and regulations to a focus on out-comes and results.
this shift is now taking place in both within govern-ment and through independent organizations devoted to measuring community conditions. this report will focus on both approaches to outcome-oriented performance measurement systems.
Government-Sponsored Performance Measurementgovernment-sponsored performance measurement initiatives are generally designed to systematically assess how much and how well government delivers its services. located within government, public managers and their staff decide what to measure, how to measure, and how to report on their perfor-mance. government-sponsored initiatives have an internal focus with performance indicators designed to measure agency or program performance.
government-sponsored performance measurement initiatives tend to be data rich. that is, they collect
Introduction

iBM center for the Business of government6
Moving toWard outcoMe-oriented PerforMance MeasureMent systeMs
and report on an inordinate amount of indicators. With hundreds of indicators to account for, it can be overwhelming to figure out what the data actually means. With so many indicators it is often difficult to articulate the desired programmatic outcomes and results, or to determine exactly what really mat-ters. in addition, government-sponsored efforts typi-cally have a vertical focus. that is they report information up and down within an organization; rarely is performance information shared across departments or across agencies.
More often than not, the individuals responsible for administering a program establish what they con-sider to be appropriate performance targets. for the most part government-sponsored efforts do not attempt to measure the broad outcomes of collabor-ative efforts or community conditions; instead they measure program-specific outputs and outcomes. stated differently, public managers attempt to mea-sure the outcomes and results they appear to have control over.
While government-sponsored performance measure-ment systems typically do not measure broader com-munity outcomes, this report presents three profiles of government organizations which do support outcome-oriented performance measurement systems:
Washington state’s government Management •accountability and Performance (gMaP) Program
King county, Washington’s “aiMs High” •Program
oregon’s Progress Board•
Community Indicator Performance Measurementcommunity indicator projects are often born from community visioning processes or sustainable develop-ment efforts. typically, they are housed by independent organizations outside of government, such as a com-munity foundation, a university, or a grassroots organi-zation and as such, are usually insulated from traditional political interests. Because of their locus out-side of government, they are more focused on broader community conditions and quality of life, and are less focused on the specific outputs of public sector pro-grams. community indicator projects use high level aggregate data such as the environment, education and
the arts to track trends in community conditions and to alert people—policy makers and interested citizens—when action needs to be taken. ideally, they identify and track community conditions, discover common priorities among people and programs and measure progress toward shared goals and values.
usually an open and inclusive process that brings together a wide-variety of stakeholders is used to determine priorities and select the indicators and conditions that matter most to the community. community indicator projects often rely on members of the community, those with expertise in the various sectors alongside average citizens who have the personal and first-hand knowledge of experience to meaningfully discuss the problems and opportunities confronting the community. this open, inclusive process can generate broad interest and support and insures a diverse perspective on the shared goals, values and desired community conditions.
Many community indicator projects report on broad sectors such as health, housing, education, economy, environment, public safety, cultural life and civic vital-ity, rather than program specific functions. through interactions with a broad group of stakeholders, com-munity indicator projects can develop and track prog-ress on a shared civic agenda. Participants can bring data to life when they ask themselves what is happen-ing in each of the sectors and when they ask them-selves how the progress or lack of progress, in one sector affects the progress, or lack of progress, in the other sectors. When an environmentalist sees connec-tions between affordable housing and habitat preser-vation and a business leader comprehends the public health impacts of traffic patterns and parking demands, common ground can emerge.
community indicators can reveal the common goals and shared values that foster alliances across tradi-tional boundaries and provide citizens with a better compass for understanding issues and the assets available to solve them.
in contrast to traditional government-sponsored performance measures, independent community indicator projects tend to:
focus on “high-level” community conditions •that contribute overall quality of life, community health, community well-being, or community sustainability.

www.businessofgovernment.org 7
Moving toWard outcoMe-oriented PerforMance MeasureMent systeMs
indicators show trends in community conditions •to alert people to when and where there is a need to improve conditions.
emphasize how the actions or inaction of the •broader community impact community indicators.
there are about 170 community indicator systems across the country. these systems have varying lev-els of sophistication in the collection and reporting of performance information. they have recently cre-ated a network, the community indicators consortium (www.communityindicators.net), which is organized around the common belief that infor-mation sharing across areas of interest is a key ele-ment in bringing people together to solve problems. consortium members include both public and non-profit sector members.
interestingly, there is a national-level effort to create national-level outcome indicators. that effort, spon-sored by the non-profit state of the usa, inc. (www.stateoftheusa.org), plans to report key indicators starting in mid-2009.
Shifting Gears: From Outputs to Outcomes focusing on those government programs that are finding ways to make the connection between pro-gram specific performance measures and broader outcomes, we were able to highlight some of the strategies that managers are using to shift the emphasis to the big picture, or broader community issues and indicators.
When reflecting on what is required to change the resolution from program-specific performance mea-sures to community indicators, Michael Jacobson, director of King county “aiMs High” performance measurement initiative notes “there needs to be two kinds of data that reflect what’s going on in the world. We need to understand our relationship to the bigger picture. some of the staff immediately understood the big picture relationship … others are more bureaucratically bound by what they are responsible for.”
the challenge, highlighted by Jacobson and by other program directors we interviewed, is getting the staff to think about the big picture while at the same time assuring them that while they are
expected to report on broad community outcomes, they are not fully responsible for realizing those outcomes. one program or one department can influence an outcome but they cannot control it. as King county executive fellow Marti reinfeld reflects, “We had to be clear that you [government personnel] don’t have to have control over it [out-comes] but you do have influence over it. We have spent a lot of time talking about the control/influence dichotomy with various departments.” in addition to emphasizing the changing philosophy, programs able to bridge the gap between program-specific measures and broader community indicators empha-size the importance of additional training for their employees to build the confidence of their staff in their performance measurement skills, to create opportunities for face-to-face dialogue that allows employees to raise questions, brainstorm new ideas and approaches to measuring community conditions, as well as strengthen their ability to refocus their internal lens to more clearly visualize high level indicators.
More on the Community Indicators Consortium
the community indicators consortium (cic) is a learning network and community of practice for people engaged or interested in the field of commu-nity indicators and their application.
cic is organized around the belief that information sharing across areas of interest is a key element in successful work to benefit people and their concerns about their communities. cic further believes that collaboration and open dialogue across geography and discipline is key to successful democratic deci-sion making and action.
cic also actively fosters collaboration between com-munity indicators users and performance measure-ment users. Bridging the gap that traditionally exists between these two different approaches to measure-ment and evaluation provides a way for community groups and governments to learn how to coordinate their efforts to better serve the people who live and work in their communities. fostering these growing collaborations enhances the lives and well-being of everyone.
Source: Community Indicators Consortium website (www.communityindicators.net)

iBM center for the Business of government8
Moving toWard outcoMe-oriented PerforMance MeasureMent systeMs
Profile One: The Washington State Government Management Accountability and Performance (GMAP) Program
Overview Washington state’s gMaP, or government Management accountability and Performance, is a management approach at the leading edge of government-sponsored performance measurement. sponsored by governor chris gregoire and champi-oned by Program director larisa Benson, gMaP is designed to get better results from state programs through a rigorous, disciplined focus on perfor-mance. More importantly, gMaP works to docu-ment and show results that matter to citizens through citizen involvement and transparency with meaningful performance reports. Public forums serve as a mechanism through which the governor and state managers gain feedback on issues related to economic development, health care, public safety, and transportation. as a result, government performance is evaluated by many stakeholders, the governor and state managers have an opportunity to report on progress or deficiencies directly to the public, and a specific plan of action with deadlines and the promise of tangible results can be deter-mined to address emerging problems. receiving accolades from the council of state governments, Governing’s Public official of the year award pro-gram, and grading the states, the state of Washington is acknowledged for its transparency, innovation, and responsiveness to citizens.
gMaP offers extensive documentation on the pro-gram’s measurement philosophy and process. community forum reports, logic models, perfor-
mance reporting templates, and other resources are readily available for adoption or replication. these resources offer strategies for designing performance measurement efforts with the intention of stimulat-ing learning and informed decision making, for aligning state-level department performance mea-surement initiatives to address the preferences of cit-izens, and provide guidance for selecting indicators and evaluating the validity and reliability of those indicators
Examples of GMAP Indicatorsusing a logic model, figure 1 illustrates how the activities of the Washington state department of corrections maps agency activities (output mea-sures) to high-level outcomes (reducing recidivism). While an agency may not have complete control over high-level outcomes, the logic model summa-rizes the theory behind how the agency can influ-ence the outcomes. for example, the ultimate outcome for the department of corrections logic Model is to reduce recidivism—the rate at which offenders return to prison after release. the recidi-vism rate is measured annually and is strongly influ-enced by factors outside the department’s control. accepting the premise that inmates with marketable skills are more likely to get jobs and that inmates with jobs are less likely to re-offend, then it makes sense for corrections to focus measurement on edu-cation and certification rates which can be mea-sured frequently and which the department can influence. as a result, gMaP focuses attention on how the agency executes the activities and strate-gies that it can influence. if agencies are executing well, but intermediate and ultimate outcomes aren’t changing, the assumptions in the logic model are revisited.
Profiles in Outcome-Oriented Performance Measurement Systems

www.businessofgovernment.org 9
Moving toWard outcoMe-oriented PerforMance MeasureMent systeMs
Figure 1: GMAP: Connecting Program Outputs to Outcomes
Figure 2: GMAP Performance Reporting Template
Source: GMAP Guidelines 2008: www.accountability.wa.gov/guidelines/principles.asp
Source: GMAP Guidelines 2008: http://www.accountability.wa.gov/guidelines/principles.asp
iBM center for the Business of government10
Moving toWard outcoMe-oriented PerforMance MeasureMent systeMs
Within the gMaP infrastructure, the result of con-necting the dots vertically, from a specific activity to the immediate, intermediate and ultimate outcomes, has motivated staff as they see the concrete results and meaning of their work. addressing the notion that government cannot control or influence every-thing, the logic model in figure 1 clearly depicts that agencies are more likely to be in control of out-put and immediate outcomes than the ultimate out-come. this reinforces that leadership understands that government is not the sole problem solver of large-scale community needs or desired outcomes. However, within the culture of gMaP, daring to take on the broader issues and big picture policy goals is considered a necessary risk that has the potential of making a positive and widespread impact on the broader community.
ensuring consistent performance reporting across large scale public organizations can present a num-ber of challenges. to add clarity and minimize con-fusion with regard to performance reporting expectations, gMaP guidelines include templates for performance reporting. figure 2 presents rule-of-thumb techniques for data presentation (see “Graph or table area”), while prompting department heads to think about the meaning of the data and to dis-cuss possible explanations and other important ele-ments (see “Analysis”).
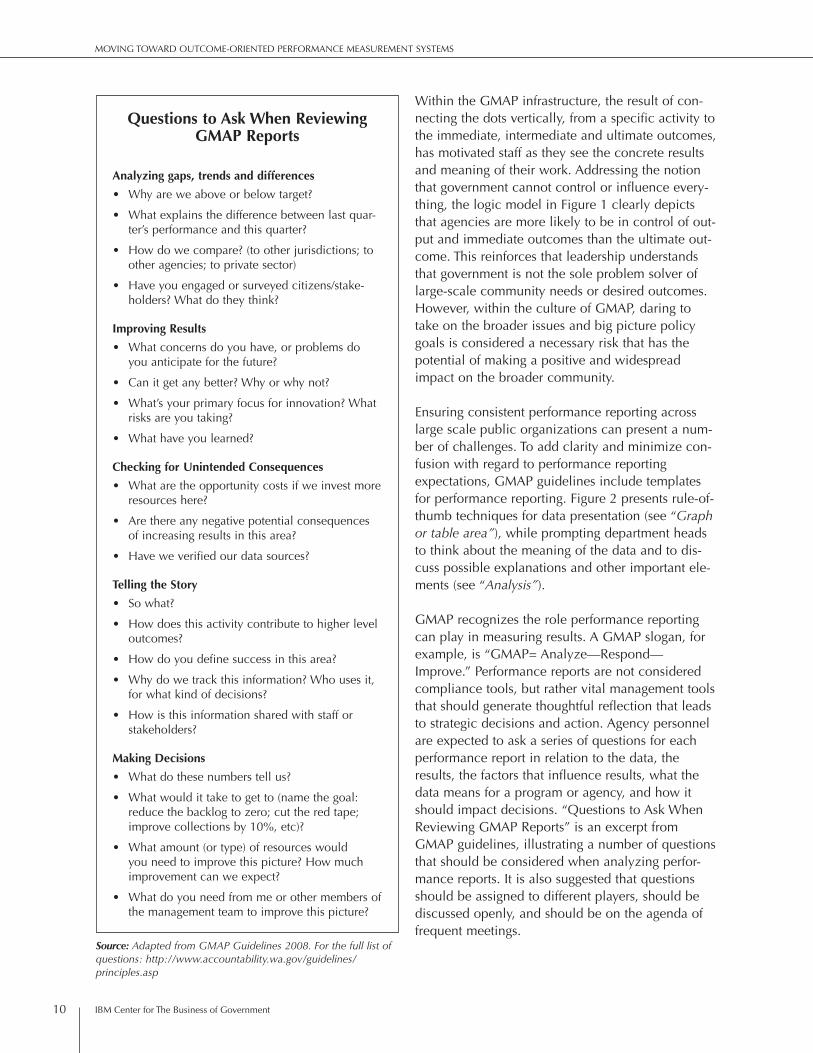
gMaP recognizes the role performance reporting can play in measuring results. a gMaP slogan, for example, is “gMaP= analyze—respond—improve.” Performance reports are not considered compliance tools, but rather vital management tools that should generate thoughtful reflection that leads to strategic decisions and action. agency personnel are expected to ask a series of questions for each performance report in relation to the data, the results, the factors that influence results, what the data means for a program or agency, and how it should impact decisions. “Questions to ask When reviewing gMaP reports” is an excerpt from gMaP guidelines, illustrating a number of questions that should be considered when analyzing perfor-mance reports. it is also suggested that questions should be assigned to different players, should be discussed openly, and should be on the agenda of frequent meetings.
Questions to Ask When Reviewing GMAP Reports
Analyzing gaps, trends and differences
Why are we above or below target? •
What explains the difference between last quar-•ter’s performance and this quarter?
How do we compare? (to other jurisdictions; to •other agencies; to private sector)
Have you engaged or surveyed citizens/stake-•holders? What do they think?
Improving Results
What concerns do you have, or problems do •you anticipate for the future?
can it get any better? Why or why not?•
What’s your primary focus for innovation? What •risks are you taking?
What have you learned?•
Checking for Unintended Consequences
What are the opportunity costs if we invest more •resources here?
are there any negative potential consequences •of increasing results in this area?
Have we verified our data sources?•
Telling the Story
so what?•
How does this activity contribute to higher level •outcomes?
How do you define success in this area?•
Why do we track this information? Who uses it, •for what kind of decisions?
How is this information shared with staff or •stakeholders?
Making Decisions
What do these numbers tell us?•
What would it take to get to (name the goal: •reduce the backlog to zero; cut the red tape; improve collections by 10%, etc)?
What amount (or type) of resources would •you need to improve this picture? How much improvement can we expect?
What do you need from me or other members of •the management team to improve this picture?
Source: Adapted from GMAP Guidelines 2008. For the full list of questions: http://www.accountability.wa.gov/guidelines/ principles.asp

www.businessofgovernment.org 11
Moving toWard outcoMe-oriented PerforMance MeasureMent systeMs
Profile Two: King County, Washington, Annual Indicators and Measures (AIMs) High Program
OverviewKing county executive ron sims’ guiding philoso-phy is that measuring performance is a hallmark of good governance. through his vision and leadership King county managers and staff have developed performance measurement initiatives to improve performance and show results. in particular, the King county aiMs (annual indicators and Measures) High Program works to improve the quality of life for county residents by identifying, assessing, evalu-ating and improving the effectiveness and efficiency of government performance through community-level indicators and county government perfor-mance measures. directed by Michael Jacobson, this program is used as an accountability vehicle to inform citizens of county government efforts and conditions. Key indicators are organized under nine areas: natural resources, land use and transportation, health, safety and infrastructure, housing and home-lessness, economy, education, equity, and gover-nance. a key objective of director Michael Jacobson is to increase the relevance of performance mea-surement as he diligently emphasizes the connec-tion of government action to tangible outcomes that impact the broader community. He also strives to show how county divisions and departments can coordinate their actions to address broad commu-nity concerns. among the project indicators, the Web site offers useful illustrations of how county departments and divisions can work collectively to address broad indicator areas such as safety and infrastructure.
Examples of AIMs High Indicatorsin the case of safety and infrastructure, the county strives to promote the health, safety and well-being of its communities. figure 3 illustrates how this initiative uses both agency-level performance measures and broader community indicators. the community indi-cators are used to demonstrate whether King county residents are safe from threats of crime and injury, and whether they are prepared for an emergency. the performance measures reflect King county govern-ment’s role in keeping residents safe, including prepa-ration and response plans for emergencies and maintaining county infrastructure. available on the
King county aiMs High Web site, each of the shapes in figure 3 (safety and infrastructure and the perfor-mance and community indicators) interactively link to an explanation of county efforts. for example, for each performance measure a narrative addresses the following questions:
Why is this measure important? •
How is our performance? •
What else influences this measure? •
What are our strategies for moving forward?•
How is King county doing? •
What else influences these indicators? •
What role does King county play? •
Safety &Infrastructure
CriminalJustice
Violent CrimeRates
Awareness of3 Days, 3 Ways
Motor VehicleTheft Rates
IncarcerationRates
Motor VehicleDeath Rates
Motor VehicleHospitalization
Injury DeathTrends
EmergencyPreparedness
InjuryPrevention Infrastructure
JuvenileDetention
AdultDetention
InmateSuicides
PreparednessExercises
FloodSafety
Emergency Plansfor VulnerablePopulations
AlternativeSentencing
JuvenileInterventions
AdultInterventions
Correct Routingof 911 Calls
Timely Answering
of 911 Calls
Wireless Accidental911 Calls
Non-emergency911 Calls
Vehicle-relatedFatalities
BridgeCondition
PavementCondition
PotholeRepair
FloodSafety
Sewer LineCondition
Cardiac ArrestSurvival Rates
Firearms inHouseholds
Category
Subcategory
Community Indicator
Performance Measure
CO
MM
UN
ITY
IND
ICAT
OR
SPE
RFO
RM
AN
CE
MEA
SUR
ES
Figure 3: King County AIMs High: Safety and Infrastructure
Source: www.metrokc.gov/aimshigh/safety-infrastructure.asp
iBM center for the Business of government12
Moving toWard outcoMe-oriented PerforMance MeasureMent systeMs
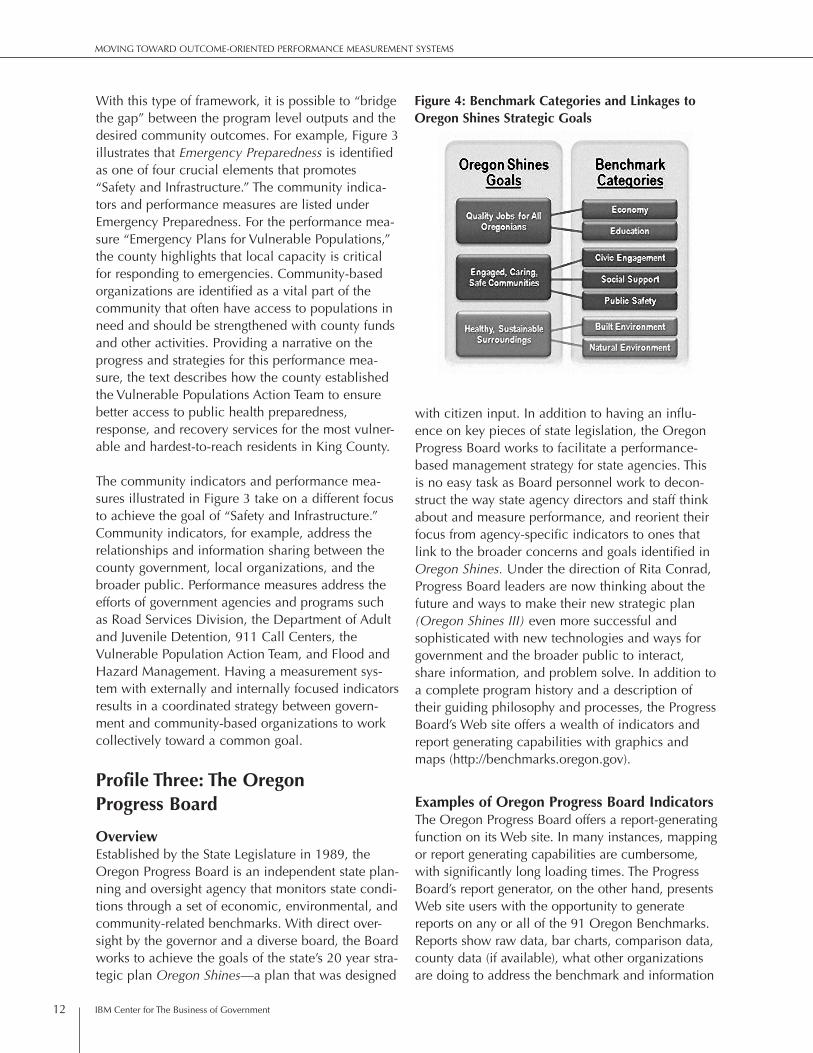
With this type of framework, it is possible to “bridge the gap” between the program level outputs and the desired community outcomes. for example, figure 3 illustrates that Emergency Preparedness is identified as one of four crucial elements that promotes “safety and infrastructure.” the community indica-tors and performance measures are listed under emergency Preparedness. for the performance mea-sure “emergency Plans for vulnerable Populations,” the county highlights that local capacity is critical for responding to emergencies. community-based organizations are identified as a vital part of the community that often have access to populations in need and should be strengthened with county funds and other activities. Providing a narrative on the progress and strategies for this performance mea-sure, the text describes how the county established the vulnerable Populations action team to ensure better access to public health preparedness, response, and recovery services for the most vulner-able and hardest-to-reach residents in King county.
the community indicators and performance mea-sures illustrated in figure 3 take on a different focus to achieve the goal of “safety and infrastructure.” community indicators, for example, address the relationships and information sharing between the county government, local organizations, and the broader public. Performance measures address the efforts of government agencies and programs such as road services division, the department of adult and Juvenile detention, 911 call centers, the vulnerable Population action team, and flood and Hazard Management. Having a measurement sys-tem with externally and internally focused indicators results in a coordinated strategy between govern-ment and community-based organizations to work collectively toward a common goal.
Profile Three: The Oregon Progress Board
Overviewestablished by the state legislature in 1989, the oregon Progress Board is an independent state plan-ning and oversight agency that monitors state condi-tions through a set of economic, environmental, and community-related benchmarks. With direct over-sight by the governor and a diverse board, the Board works to achieve the goals of the state’s 20 year stra-tegic plan Oregon Shines—a plan that was designed
with citizen input. in addition to having an influ-ence on key pieces of state legislation, the oregon Progress Board works to facilitate a performance-based management strategy for state agencies. this is no easy task as Board personnel work to decon-struct the way state agency directors and staff think about and measure performance, and reorient their focus from agency-specific indicators to ones that link to the broader concerns and goals identified in Oregon Shines. under the direction of rita conrad, Progress Board leaders are now thinking about the future and ways to make their new strategic plan (Oregon Shines III) even more successful and sophisticated with new technologies and ways for government and the broader public to interact, share information, and problem solve. in addition to a complete program history and a description of their guiding philosophy and processes, the Progress Board’s Web site offers a wealth of indicators and report generating capabilities with graphics and maps (http://benchmarks.oregon.gov).
Examples of Oregon Progress Board Indicatorsthe oregon Progress Board offers a report-generating function on its Web site. in many instances, mapping or report generating capabilities are cumbersome, with significantly long loading times. the Progress Board’s report generator, on the other hand, presents Web site users with the opportunity to generate reports on any or all of the 91 oregon Benchmarks. reports show raw data, bar charts, comparison data, county data (if available), what other organizations are doing to address the benchmark and information
Figure 4: Benchmark Categories and Linkages to Oregon Shines Strategic Goals

www.businessofgovernment.org 13
Moving toWard outcoMe-oriented PerforMance MeasureMent systeMs
Module 1: oregon’s Progress Making Progress?3. NEW EMPLOYERS Yes, but
Why this answer oregon met its 2005 target ranking for new employers, but just barely. the decade-long trend is worsening and oregon’s rank dropped below target range in four of the last seven years. the gap in rank for new employers between oregon and Washington is lessening.
Corporation for Enterprise Development (CFED)
How Oregon Compares
rank: national rank for new employer identification numbers per 1,000 workers (1st = best)
OR RANK WA RANK
1999 11th 1st
2000 10th 1st
2002 11th 1st
2003 10th 1st
2004 12th 2nd
2005 10th 7th
Corporation for Enterprise Development (CFED)County Datacounty data not available
Figure 5. Oregon Progress Board Report, Excerpt Generated for the New Employers Benchmark
Source: OPB Report Generator, “Business Vitality” report for Benchmarks # 1-6 http://benchmarks.oregon.gov/Quan/BMReporting/default.aspx#cae361b3-9309-481c-9056-781353b1cbfb
1996 7th
1997 7th
1998 14th
1999 11th
2000 10th
2001
2002 11th
2003 10th
2004 12th
2005 10th
2005 target 5th–10th
2010 target 5th–10th
Better
Worse
iBM center for the Business of government14
Moving toWard outcoMe-oriented PerforMance MeasureMent systeMs
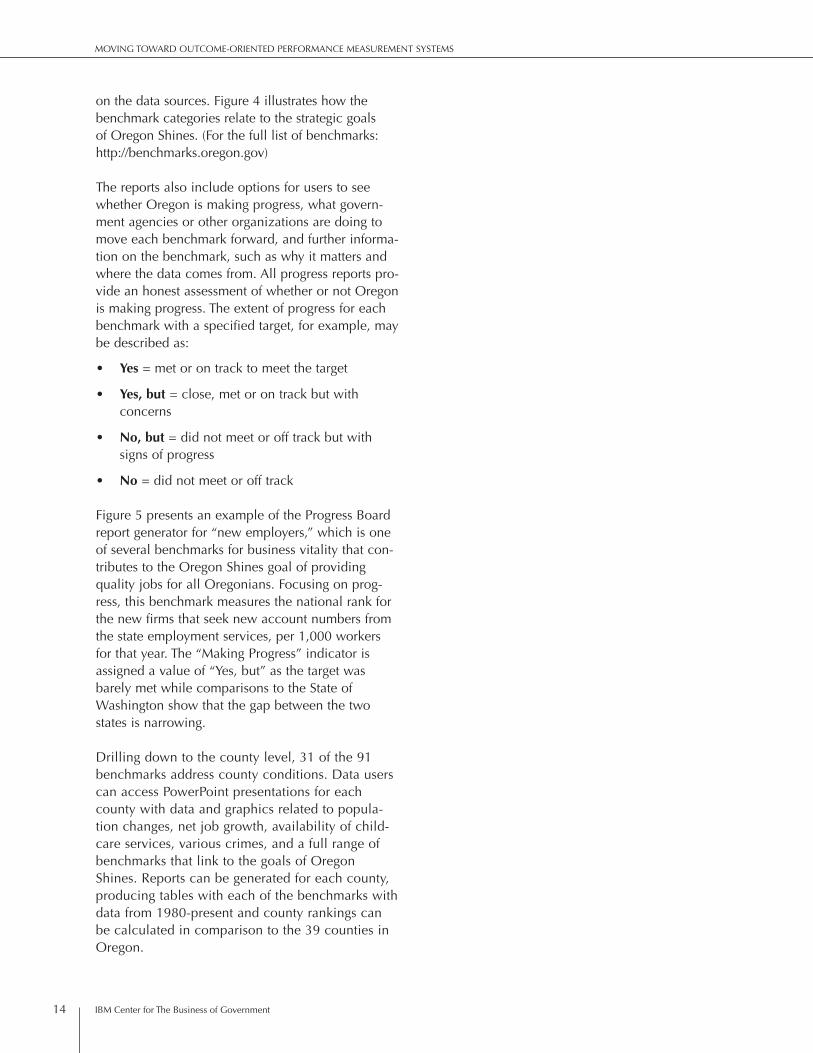
on the data sources. figure 4 illustrates how the benchmark categories relate to the strategic goals of oregon shines. (for the full list of benchmarks: http://benchmarks.oregon.gov)
the reports also include options for users to see whether oregon is making progress, what govern-ment agencies or other organizations are doing to move each benchmark forward, and further informa-tion on the benchmark, such as why it matters and where the data comes from. all progress reports pro-vide an honest assessment of whether or not oregon is making progress. the extent of progress for each benchmark with a specified target, for example, may be described as:
Yes• = met or on track to meet the target
Yes, but• = close, met or on track but with concerns
No, but• = did not meet or off track but with signs of progress
No• = did not meet or off track
figure 5 presents an example of the Progress Board report generator for “new employers,” which is one of several benchmarks for business vitality that con-tributes to the oregon shines goal of providing quality jobs for all oregonians. focusing on prog-ress, this benchmark measures the national rank for the new firms that seek new account numbers from the state employment services, per 1,000 workers for that year. the “Making Progress” indicator is assigned a value of “yes, but” as the target was barely met while comparisons to the state of Washington show that the gap between the two states is narrowing.
drilling down to the county level, 31 of the 91 benchmarks address county conditions. data users can access PowerPoint presentations for each county with data and graphics related to popula-tion changes, net job growth, availability of child-care services, various crimes, and a full range of benchmarks that link to the goals of oregon shines. reports can be generated for each county, producing tables with each of the benchmarks with data from 1980-present and county rankings can be calculated in comparison to the 39 counties in oregon.

www.businessofgovernment.org 15
Moving toWard outcoMe-oriented PerforMance MeasureMent systeMs
Having had the opportunity to talk with a dedicated and experienced group of program directors we were able to learn how some governments have managed to transform performance measurement from an accounting tool to an integrated manage-ment system capable of increasing productivity, advancing transparency and measuring quality of life. We learned how these programs organize them-selves and the resources it takes to implement and sustain their efforts. We learned of the challenges associated with making the transition from a compli-ance-based effort to a performance orientation focused on results. We also discussed the impor-tance of political support and leadership. and finally, we developed a sense of the organizational culture of these trailblazing initiatives.
in addition to interviewing key staff members affili-ated with the programs profiled in this report, we also interviewed the key people running programs that are consistently recognized as best practices including the Portland Multnomah Progress Board in oregon; Washoe county, nevada; statestat Maryland; Baltimore citistat; sustainable seattle; truckee Meadows tomorrow; and Baltimore neighborhood indicators alliance.
Finding One: Size of Staff Is Not Crucial to Successsurprisingly, the programs we looked at were all quite small, with one dedicated staff member and some additional part-time support, and as such the organizational structure was flat. the program direc-tors were in agreement when one said “we check our egos at the door.” there are no superstars among the executive directors, although there are self-described “performance queens” who essentially
live and breathe performance measurement and do everything in their power to make sure this approach is ingrained in the organization’s dna. a web of inclusion is perhaps the most apt metaphor for the structure of these programs. the director is accessible, communicates openly and freely with the staff and with representatives from individual departments who are responsible for their own data collection.
the most effective programs have just one or two degrees of separation from the top elected or appointed official. all spoke of the importance of easy access to the top decision maker. the ready access increased the program directors’ credibility and clout. the knowledge that a program director could walk into the mayor’s office or could pick up the phone and speak with the governor at any given time prompted staff to work harder and smarter. a clear chain of command, with one “boss” is critical to program success. Where there were more than one boss, say a county manager, a mayor and a board of commissioners, it is much more difficult to implement.
the larger, statewide and county-level efforts require some sort of decentralization or regionalization, whereas the smaller, city-wide initiatives can be centralized. for example, in larger jurisdictions, each department or division is responsible for their own data collection. the challenge for state-wide program directors and elected officials is maintain-ing their visibility and maintaining a consistently high level of interaction with regional offices. When asked how governor o’Malley and Maryland statestat director Mathew gallagher manage their travel and frequent meetings with department heads across the state, gallagher replied, “it is an honor
The Challenge of Creating Effective Outcome-Oriented Performance Measurement Systems
iBM center for the Business of government16
Moving toWard outcoMe-oriented PerforMance MeasureMent systeMs
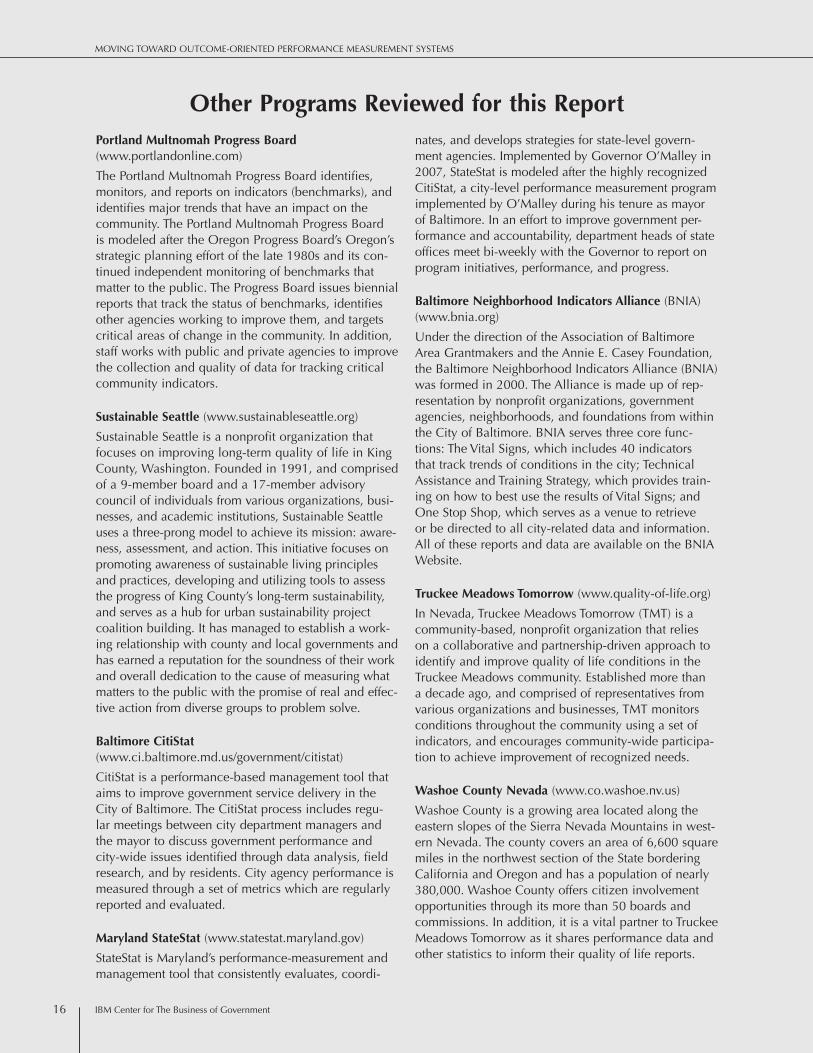
Other Programs Reviewed for this Report Portland Multnomah Progress Board (www.portlandonline.com)
the Portland Multnomah Progress Board identifies, monitors, and reports on indicators (benchmarks), and identifies major trends that have an impact on the community. the Portland Multnomah Progress Board is modeled after the oregon Progress Board’s oregon’s strategic planning effort of the late 1980s and its con-tinued independent monitoring of benchmarks that matter to the public. the Progress Board issues biennial reports that track the status of benchmarks, identifies other agencies working to improve them, and targets critical areas of change in the community. in addition, staff works with public and private agencies to improve the collection and quality of data for tracking critical community indicators.
Sustainable Seattle (www.sustainableseattle.org)
sustainable seattle is a nonprofit organization that focuses on improving long-term quality of life in King county, Washington. founded in 1991, and comprised of a 9-member board and a 17-member advisory council of individuals from various organizations, busi-nesses, and academic institutions, sustainable seattle uses a three-prong model to achieve its mission: aware-ness, assessment, and action. this initiative focuses on promoting awareness of sustainable living principles and practices, developing and utilizing tools to assess the progress of King county’s long-term sustainability, and serves as a hub for urban sustainability project coalition building. it has managed to establish a work-ing relationship with county and local governments and has earned a reputation for the soundness of their work and overall dedication to the cause of measuring what matters to the public with the promise of real and effec-tive action from diverse groups to problem solve.
Baltimore CitiStat (www.ci.baltimore.md.us/government/citistat)
citistat is a performance-based management tool that aims to improve government service delivery in the city of Baltimore. the citistat process includes regu-lar meetings between city department managers and the mayor to discuss government performance and city-wide issues identified through data analysis, field research, and by residents. city agency performance is measured through a set of metrics which are regularly reported and evaluated.
Maryland StateStat (www.statestat.maryland.gov)
statestat is Maryland’s performance-measurement and management tool that consistently evaluates, coordi-
nates, and develops strategies for state-level govern-ment agencies. implemented by governor o’Malley in 2007, statestat is modeled after the highly recognized citistat, a city-level performance measurement program implemented by o’Malley during his tenure as mayor of Baltimore. in an effort to improve government per-formance and accountability, department heads of state offices meet bi-weekly with the governor to report on program initiatives, performance, and progress.
Baltimore Neighborhood Indicators Alliance (Bnia) (www.bnia.org)
under the direction of the association of Baltimore area grantmakers and the annie e. casey foundation, the Baltimore neighborhood indicators alliance (Bnia) was formed in 2000. the alliance is made up of rep-resentation by nonprofit organizations, government agencies, neighborhoods, and foundations from within the city of Baltimore. Bnia serves three core func-tions: the vital signs, which includes 40 indicators that track trends of conditions in the city; technical assistance and training strategy, which provides train-ing on how to best use the results of vital signs; and one stop shop, which serves as a venue to retrieve or be directed to all city-related data and information. all of these reports and data are available on the Bnia Website.
Truckee Meadows Tomorrow (www.quality-of-life.org)
in nevada, truckee Meadows tomorrow (tMt) is a community-based, nonprofit organization that relies on a collaborative and partnership-driven approach to identify and improve quality of life conditions in the truckee Meadows community. established more than a decade ago, and comprised of representatives from various organizations and businesses, tMt monitors conditions throughout the community using a set of indicators, and encourages community-wide participa-tion to achieve improvement of recognized needs.
Washoe County Nevada (www.co.washoe.nv.us)
Washoe county is a growing area located along the eastern slopes of the sierra nevada Mountains in west-ern nevada. the county covers an area of 6,600 square miles in the northwest section of the state bordering california and oregon and has a population of nearly 380,000. Washoe county offers citizen involvement opportunities through its more than 50 boards and commissions. in addition, it is a vital partner to truckee Meadows tomorrow as it shares performance data and other statistics to inform their quality of life reports.

www.businessofgovernment.org 17
Moving toWard outcoMe-oriented PerforMance MeasureMent systeMs
and a privilege to serve the people of the state of Maryland. if that means we need to allocate time for travel to make sure the statestat program is taken seriously and running well, then that is what we have to do.” in smaller jurisdictions it is easier to stay on top of the various departments to insure their compliance with the initiative. in the Baltimore citistat program, for example, meetings with depart-ment heads and the mayor are biweekly, with many face-to-face interactions between department heads, key staff and the mayor on a daily basis.
We certainly are not advocating for such small staffs, but the message we heard loud and clear from all the people we spoke with was it that takes fewer resources than you would expect. in other words, lack of staff should not be an excuse. assign one person, full-time, to performance measurement efforts and you will be amazed at what you will accomplish. Just make sure that one person has the enthusiasm and energy to pull it off.
Finding Two: Recruiting Enthusiastic Personnel Ready to Adapt and Learn is Essentiala successful outcome-oriented performance mea-surement system requires a dedicated program director, not a part-time director, nor a deputy mayor with a zillion other responsibilities, but an individual whose sole responsibility is the successful implementation of a performance measurement sys-tem. the program directors are equal parts politician, statistician, motivator and communications director; they are champions of the cause. they believe in the value of performance measurement and are supported by a small and equally enthusiastic staff.
While size may not matter, enthusiasm does. in King county, Washington, a staff of one runs the show, with some support provided by a temporary staff, some geographic information system (gis) support, and a budget analyst. according to Michael Jacobson, the director there, the performance mea-surement efforts languished for awhile before he came on board as a full-time staff person because there was no one dedicated full time to the effort. “you can’t have high expectations without resources,” he explained. With the addition of dedicated staff members, King county has progressed at “lightening speed.” Jacobson told us, “you don’t need a team of
20 to plan or design your initiative”—what’s most important in terms of staff is enthusiasm. “you want a staff that has a sincere interest in performance mea-surement. you can teach technique. you can’t teach enthusiasm.”
rita conrad directs the oregon Benchmarks pro-gram with the assistance of one part-time staff mem-ber. While she acknowledges it would be wonderful to have additional staff, she is a realist who under-stands the constraints of the state budget. When working with such a small staff, conrad noted, “you need talented people who are able to convince the governors to be excited about the benchmarks—to understand this is the way the state operates.”
Finding Three: Political Support is Critical for Program Successtop political support is essential for undertaking performance measurement work, whether it’s the mayor, a county supervisor or the governor. the most successful performance measurement efforts have the benefit of a chief political champion. these political champions do not simply conceptualize performance measurement as a tool to control employees and improve performance; they embrace performance measurement as part of a broader man-agement system. they are described as visionaries able to see the big picture and able to bridge gov-ernment actions with broader social, economic, and environmental conditions.
in the state of Washington, governor chris gregoire constantly speaks the language of performance mea-surement and management. Her staff understands full well how important performance management is to her administration. High level support is critical if the workforce is to get on board.
in King county, the county executive ron sims is an ardent advocate. He sees the big picture and is con-stantly pushing people all the time. sims wants to see measures that capture the broader outcomes of county initiatives. He also recognizes the discomfort some of his staff has with performance measurement in general, especially when the data is not as good as it could be. sims, like gregoire, creates an orga-nizational environment that minimizes fear and uncertainty and creates instead an environment that encourages people to improve their performance

iBM center for the Business of government18
Moving toWard outcoMe-oriented PerforMance MeasureMent systeMs
Enhancing Alignment Between Government-Sponsored Initiatives and Community Indicator Projects
What we discovered through our research is that just as there is not a one-size fits all approach to performance measurement, there is not a one-size fits all approach to the alignment of government-sponsored initiatives with community indicator projects. We expected to find a government-sponsored program and a community indicator project working together with a free and open exchange of data and ideas. the government-sponsored initiatives would align their program-specific indica-tors to the broad outcomes articulated by members the community. in doing so the community indicator projects would be able to demonstrate how various programs and policies influenced the community out-comes. a joint report could be produced, or website maintained, that would clearly demonstrate the rela-tionship between government efforts and community conditions and complement each other’s efforts.
While we did not find this type of relationship, we are not saying that this type of collaboration does not exist; we just did not observe it in our sample. instead, we found three approaches that range from peaceful co-existence to collaboration to independent operations.
Cooperative Approach (Awareness of one another, sharing of data—typically one way, and informal in nature.)
With this approach, government-sponsored programs operate in parallel with community indicator projects. the government-sponsored efforts are fully aware of the community indicator projects within their jurisdic-tions and the community indicator projects rely on government as a data source. data is shared between the projects, but with this approach it is typically a one-way exchange of performance data. government shares its performance data with the community-indi-cator project, yet the community indicators are seldom referenced in the government reports.
the working relationship between the government-sponsored programs and community indicators projects with this approach is informal. While the government may have an advisory role with representatives from various departments serving on committees or working groups affiliated with the community indicator project, the nature of the relationship is not formalized.
Collaborative Approach (Close alignment and greater reliance on one another.)
With this approach government works collaboratively with the local community indicator project. internally,
government keeps track of performance with manage-rial measures often tied to the budget, but they rely on the community indicator projects to communicate broader outcomes. they rely on the community indi-cator project to produce annual reports and maintain an attractive Web site that informs elected officials, the media, and residents just how well the region is doing. government tends to respond in bureaucratic language, while the community indicator project trans-lates the progress made and areas of concern into plain language.
government provides the data to the community indicator project and they work together to select the indicators to report and how best to present the information. data from other sources such as the u.s. census, chamber of commerce, national Homebuilders’ association and u.s. Bureau of labor statistics are also used in preparing the community indicator report. With this approach it is challenging, at best, to link the community indicators to program-specific indicators. some of the department objectives clearly align with the broader outcomes, but they have a decidedly managerial focus with an emphasis on inputs, process, and outputs (e.g., expenditures, plans approved, codes enforced and complaints inves-tigated). despite the differences in their internal and external perspectives there is a synergy and alignment, as well as a shared sense of purpose between the two approaches.
Independent Approach (One agency reports on inter-mediate and community outcomes, efforts informed by community visioning processes.)
With this approach the government programs are inte-grated—by that we mean they report on broad inter-mediate outcomes and when possible, even broader societal outcomes. Within this independent approach we found two models that achieve similar results: 1) independently perceived units of government reporting on broad indicators of community conditions and 2) government initiatives that are obviously an important part of government and are more than a performance measurement initiative. instead, they reflect the over-all management philosophy of the highest elected official. the first approach, for example, might be an indicator report developed by the auditor’s office, an independently elected official. While technically a part of government they are perceived as independent. the second approach is a more visible and tangible where county or state agencies embrace the “it’s in our dna” approach that reflects the management philosophy of

www.businessofgovernment.org 19
Moving toWard outcoMe-oriented PerforMance MeasureMent systeMs
and outcomes. governor gregoire will often say to her staff, “no one gets in trouble at gMaP for bring-ing forth data that shows we’re not achieving our goals. you get in trouble if you don’t have an action plan for what you’re going to do about it.”
When describing the leadership style of King county executive ron sims, Michael Jacobson noted that sims is seeking the “higher, more ambitious plane of fixing the problem.” He asks the big questions, “How are we going to stop global warming or improve health care?” yet he well understands that to answer these questions he needs to build that bridge and connect the dots between government actions and broader issues. sims is described as pushing staff to go higher and better. Performance measurement is perceived more as a management tool designed to solve problems and inform decision making, not to punish or reprimand individuals and departments that are not meeting their performance targets.
Finding Four: Culture Matters the most successful outcome-oriented performance measurement initiatives create a performance mea-surement culture. as they tell it, performance mea-surement is in their dna. they emphasize the stories about the value of performance measurement and top level champions stay on message. as story tellers they reinforce the positive, not the punitive. as storytellers they use imagery and metaphors to get their point across.
When describing the King county system, Michael Jacobson says that he asks his top managers which
ruler they will use to measure performance: is it the image of a child with a ruler over his head, beaming with pride as his growth? or is it the image of a nun holding a ruler over the head of a student with a devilish grin on her face? the metaphor for mea-surement matters—is it punitive or is it tied to reward? When a story is consistently repeated, peo-ple within the organization develop a sense of understanding, they know what is expected of them and they want to be part of the success story.
While telling a story is important, sharing that story with the media makes that story all the more power-ful. Many of the projects featured in this research had good working relationships with the local media. community indicator projects such as the Baltimore neighborhood indicators association, sustainable seattle, and truckee Meadows tomorrow rely on local media coverage to promote the relevance of measuring community conditions, increase the number of volunteers, and publicize the availability of reports. When you have a good story to tell the media can help make the case for sustaining efforts. in 2003, for example, the oregon Progress Board was nearly eliminated from the state budget. they turned to the media to cover the impact of this budget decision and the public responded with an outcry to save the program.
successful performance measurement efforts also celebrate and acknowledge accomplishments. the programs we looked at all had rituals, routines and celebrations in place such as weekly meetings, quarterly focus groups, and annual retreats that set the stage and provided the venue in which to
the chief elected official rather than the efforts of a spe-cific program. While key staff members are responsible for the overall implementation, the approach is more a management plan than a performance measurement initiative.
the independent approaches we observed were located in states and counties with long histories of strategic visioning efforts centered on economic or environmental sustainability. the long term presence of these initiatives have had an impact on the way people, and government, think and talk about com-munity conditions and public sector performance. they
informed, and continue to inform, the way the public thinks about the future.
the independent programs we observed were estab-lished by executive order or legislation, thus sending a clear, unquestionable, message that they are serious about performance management and they have made a commitment to the people they serve to run an effi-cient, effective and accountable government. this also sends a clear statement to the workforce that this not a passing fad or a short term management reform; this is the way we will manage our government. this is the way we do business.

iBM center for the Business of government20
Moving toWard outcoMe-oriented PerforMance MeasureMent systeMs
acknowledge achievements. these gatherings have a unifying purpose. for example, Baltimore citistat and Maryland statestat are replete with rituals and symbols. their meeting rooms are purposefully designed to reflect the importance of the measure-ment efforts and to facilitate the exchange of infor-mation. the dedicated space communicates “we mean business” and as a result agency directors take their responsibilities very seriously. the podium at the center of the room possesses symbolic impor-tance—the agency director presenting his or her biweekly report stands at the podium and all eyes in the room are focused on that individual.
gMaP holds forums on a regular basis that are orga-nized around issues, not agencies. this symbolizes the importance of collaboration and mutual responsi-bility and breaks down the barriers between agencies.

www.businessofgovernment.org 21
Moving toWard outcoMe-oriented PerforMance MeasureMent systeMs
as we formulated this list of recommendations for measuring program performance and broader out-comes, we relied heavily on the perspectives of community indicator project directors and directors of government-sponsored performance measurement programs. their experiences with designing commu-nity indicator initiatives and generating reports pro-vide useful insights for public managers interested in broadening the focus of performance measurement efforts.
Recommendations for Designing an Outcome-Oriented SystemRecommendation One: Capture intermediate pro-gram outcomes when designing outcome-oriented systems. this is a first step in measuring program performance and broader outcomes. government-sponsored efforts should look beyond the immediate program outcomes and community indicator projects should look toward program-specific indicators to determine what intermediate program outcomes influ-ence the broader community outcomes they report on. intermediate indicators have the potential to strengthen the relevance of both efforts. Management tools such as logic models can help connect the dots between broader agency goals and the impact of day-to-day operations in achieving them.
Recommendation Two: In designing an outcome oriented system, demonstrate the link between pro-gram-specific indicators and community indicators. Present data in such a way that you can see a clear link between the indicators. in doing this, public sector agencies and employees can see how their work contributes to something far bigger and more important than they might imagine, and folks who pay attention to community indicators can trace an
indicator back to specific programs and agencies. this has worked particularly well in oregon where staff are described as having a sense of ownership and “are excited that their issues are elevated to the level of societal measures.” in King county, a key strategy for motivating staff involved reassurance that this enhanced line of reporting would not result in retribution. as a result, the staff was more likely to be motivated to take on and address new chal-lenges rather than fear the unexpected.
Recommendations for Criteria for Selecting and Agreeing on Outcome IndicatorsRecommendation Three: Actionable indicators are more important than measures and plans. chantal stevens, the former executive director of sustainable seattle, emphasizes that available data and indica-tors should be assessable, meaningful, and must hold the promise of actionable improvement, whether on the part of government, community organizations, or citizens. if the data are not relevant, or if there is not an identifiable solution, it is unlikely that the data will hold the attention of the viewing audience, nor will it inspire action among individuals or organized groups to address problems or community needs.
Recommendation Four: Select the most important indicators and avoid developing a cumbersome sys-tem. originally, the truckee Meadows tomorrow sys-tem included as many as 100 indicators. However, they now focus on 30 indicators. similarly, the oregon Progress Board has reduced the number of benchmarks and emphasized the importance of “key” benchmarks to government personnel. While it may be tempting to share all the data you collect in performance reports as a way to promote transparency,
Recommendations For Creating Effective Outcome-Oriented Performance Measurement Systems

iBM center for the Business of government22
Moving toWard outcoMe-oriented PerforMance MeasureMent systeMs
you should be careful to avoid a data dump. too much data can actually diminish transparency and hide the facts.
Recommendation Five: Seek community input to determine, revise, or draft new indicators. sustainable seattle and truckee Meadows tomorrow rely on extensive citizen input with the design or revision of community indicators, under the assump-tion that citizen involvement increases the likelihood of generating meaningful indicators. Working groups and an extensive network of volunteers can be used to facilitate more input by external stakeholders. gMaP holds community forums to determine what matters to citizens and provide feedback on govern-ment progress with meeting a previously identified need. King county recently held focus groups with members of the public on what should be included in a new 4-page performance dashboard.
Recommendations for Presenting and Reporting on OutcomesRecommendation Six: Adopt a plain language policy in reporting outcome. use language that is under-standable to the general public. Plain language reports contain common words, rather than jargon, and they avoid acronyms or unnecessary legal lan-guage that can confuse and frustrate readers. Plain language reports can be read quickly and understood easily. When reporting on pavement conditions, for example, instead of reporting on the miles of bitumi-nous wearing surface that was applied, report on the overall street conditions—rate the smoothness or bumpiness of the streets. Washington’s gMaP pro-vides plain language guidelines for all employees which can be found at: http://www.accountability.wa.gov/plaintalk/ptguidelines/default.asp.
Recommendation Seven: Present data around themes or desired outcomes. reporting around themes reinforces the interconnectedness of the sec-tors, the agencies, the programs, and people. reporting outcomes and results by programs or agencies reinforces the silo mentality—reporting by themes and results serves to reinforce the collabora-tion that is needed to address community conditions and concerns. affordable health care, public safety, quality education and a clean environment are not issues exclusive to one agency or one department.
Recommendation Eight: Highlight progress and let the data speak for itself. Karen Hruby, executive director of truckee Meadows tomorrow, emphasizes that operating at an arm’s length from government (while examining government-generated data) allows for objectivity on the part of data analysts. likewise, citizens are reassured that the data and findings are an honest assessment of community or regional conditions. government-sponsored initia-tives can adopt the oregon Progress Board’s “yes, but…” and “no, but…” style of reporting on prog-ress, where the extent of progress is discussed to highlight government efforts and strategies to address an indicator.
King county aiMs High highlights the factors that affect indicators, while outlining the role of and lim-itations of government. the result is a better under-standing of what government can and cannot do. it becomes evident that while government often assumes the blame for the failure to improve com-munity conditions, there is a shared responsibility among the sectors.
Recommendation Nine: Use performance reporting as an opportunity to reflect and learn. reporting performance is more than simply making informa-tion available to staff, elected officials, and the pub-lic. instead it can be used as a reflective practice that stimulates discussions of what is achieved, how service delivery can be improved, and what matters to the public. gMaP requires that managers and staff clearly articulate how the agency activities will lead to results for staff and the public. Performance reporting is considered an opportunity to help agen-cies “tell the story” of what they do, why they do it, and what results they are getting.
Recommendation Ten: Use the media to your advantage. government is often the first to be criti-cized and last to be celebrated for its accomplish-ments. some of the programs highlighted in this report do an exceptional job of telling their side of the story to the public through the media. Baltimore citistat is highly publicized in local newspapers, as well as national publications, and Maryland statestat, in two short years, has received a similar level of media attention and promotion. governor o’Malley recognizes the importance of getting the message out and making sure the public is aware of his management reforms.

www.businessofgovernment.org 23
Moving toWard outcoMe-oriented PerforMance MeasureMent systeMs
Recommendation Eleven: Report on progress toward meeting community indicators approxi-mately once a year or less frequently. reporting on community indicators is often less frequent, and can be less costly as the data does not change much from year to year. truckee Meadows tomorrow reports on community indicators every two to three years. off-report years can be used to report on key issues facing the region, such as the impact of sub-prime lending on the housing market and what it means for a region.
community indicators, however, should have a con-sistent presence in performance reports and during the strategic planning process. While they may not change that often, assessing how program-specific indicators influence community indicators, or are responding to them, keeps the long view and the big picture in mind as government continuously works to coordinate efforts across departments and with community-based organizations.
Recommendation Twelve: Think about using the Web and other Web 2.0 capabilities. virtually all of the government sponsored and community indicator directors interviewed for this report emphasized the long-term benefits of enhancing the web-based capabilities of their programs. this is in larger part due to the lower costs associated with managing web-based systems designed to store data and allow for multiple users to upload and interact with infor-mation. sustainable seattle is in the process of developing a Wiki-based system or data commons, where government, citizens, and other organizations will be able to enter and manipulate data.
Recommendations for Sustaining an Outcome Indicator SystemRecommendation Thirteen: Build and sustain rela-tionships with other service providers. Meaningful relationships within and across the sectors strength-ens and reinforces the notion that improving com-munity conditions is a collaborative endeavor. real progress is rarely made in silos.
Recommendation Fourteen: Ensure that top leaders are meaningfully engaged. the leaders at the top (mayors, governors, and agency heads) should sleep, eat, and breathe performance management. they
must communicate up and down within the agency and far and wide outside of the agency. they must let the stakeholders know this is the way we do business; that they want to create an environment that encourages and supports productive, responsi-ble and ethical behavior. as rita conrad told us, “if the leaders do it, it must be important.”
Recommendation Fifteen: Institutionalize the pro-cess, build it in bureaucratically. establish a system that can be replicated and sustained to such a degree that it can withstand the turnover in adminis-tration, and the change in priorities. if the tools are in place and the benefits of the process are evident to those who use them the more likely they will sur-vive. think about an executive order (gMaP) or leg-islation (oregon); both approaches provide staying power.
Recommendation Sixteen: Establish a professional home and identity for performance measurement, including communities of practice. We cannot stress enough the importance of regional and national meetings devoted exclusively to perfor-mance management. this can be done incremen-tally with the establishment of a permanent section or conference track with appropriate professional associations such as the american society for Public administration (asPa) or the international city and county Managers association (icMa). But ulti-mately, performance management needs its own home—a meeting place and space that would pro-vide a dedicated opportunity to introduce public managers to new ideas and proven successes, as well as a place to meaningfully discuss the road-blocks and challenges they face in such a way that effective strategies to move the roadblocks can be discussed.

iBM center for the Business of government24
Moving toWard outcoMe-oriented PerforMance MeasureMent systeMs
Measuring performance and documenting outcomes and results can be a daunting task. the measure-ment challenge is complicated by multiple and competing demands, programs and services that seem to defy measurement, limited resources, politi-cal expectations, and networked delivery systems. add to that mix the expectation for more and better performance information related to broader commu-nity conditions and even the most seasoned public managers can feel overwhelmed. as daunting as it may seem, implementing a well designed outcome-oriented performance measurement system is well worth the effort.
the purpose of this report was to explore how both government organizations and community indicator projects can strengthen and improve the relevance and use of performance data. government efforts that are data rich and program specific, we argue, can be improved when they reduce the number of indicators they collect and report on and instead focus on the key measures of performance. We also believe that performance measurement efforts are stronger and more robust when they demonstrate the relationship between program-specific indicators and broader community outcomes.
We hope that this report generates ideas, raises questions and stimulates dialogue among public managers and inspires them to take their perfor-mance measurement efforts to the next level. We hope that public managers think about the bigger picture, that they challenge themselves and their staffs to think about measurement more broadly, and identify key indicators of performance and interme-diate outcomes that resonate with stakeholders both internally and externally. We want to see more and better integrated systems of performance measure-
ment where government-sponsored efforts are more closely aligned and integrated with community indi-cator projects. We want to see performance mea-surement used as a meaningful management tool to motivate and reward dedicated public servants, to improve decision making, strengthen programs and services, increase accountability to ultimately improve government performance and community conditions. We hope that public managers find these recommendations and examples useful as they design and develop strategies to strengthen perfor-mance, demonstrate results and improve community conditions.
Conclusion

www.businessofgovernment.org 25
Moving toWard outcoMe-oriented PerforMance MeasureMent systeMs
While both government-sponsored performance measured initiatives and community indicator projects can develop outcome-oriented performance measurement systems as demonstrated in this paper, there have histori-cally been differences in their approaches and orientation. the table below describes some of these differences.
Government-Sponsored Performance Measurement Community Indicator Projects
Who are the champions? elected officials or high level managers. community leaders, independent organizations.
Who are the designers? Public managers, agency personnel, and technical experts.
the broader community—ranging from government personnel to citizens.
What is the predominant measurement focus?
internal: agency or program specific performance.
external: indicators of community conditions and quality of life.
Who is responsible for the results?
agency personnel. non-profits, community groups, government, citizens.
How often is data reported? Quarterly, monthly, bi-weekly, or weekly.
annually or biennially.
Who are the primary users? elected officials, public managers, agency personnel, and the public.
the public, community leaders, and government.
Appendix I: Comparison of Government-Sponsored and Community Indicator Approaches

iBM center for the Business of government26
Moving toWard outcoMe-oriented PerforMance MeasureMent systeMs
this research is designed to present how outcome-oriented performance measurement systems have made significant progress in advancing public sector performance measurement. in addition, our aim is to explore the relationship between government-sponsored performance measurement initiatives and community indicator projects to determine if and how they work together to measure the outcomes and results of public sector services, and whether it makes sense to further align with each other. We use a comparative study design with a small sample size and multiple methods of data collection.
our sample includes state, county and local level governments that were previously identified in a study conducted by the community indicators consortium. in an april 2007 report the consortium identified jurisdictions that in addition to having implemented government-sponsored performance measurement projects, also had nationally recog-nized community indicator projects located within their jurisdiction. some were identified as having documented collaborative relationships, where the government entity uses community indicators to inform decision making and community indicator projects use government data to inform their indica-tors, while others were identified as having the potential to collaborate. that is, community indica-tors are available to state, county and local govern-ment but they are not used to inform decision making. as a way of determining the current models in public sector performance measurement, we also examined progress boards in the state of oregon, given their reputation for advancing performance measurement and their inclusion of social indictors —which is a similar approach to community indica-tor projects.
the methodological tools used in this research are highlighted below:
in-depth interviews with government and com-•munity indicator project directors to determine the structural features, personnel capacity, cul-tural aspects, and political dynamics that sup-port or hinder advancing measurement efforts. in addition, we asked questions about the rela-tionship between government sponsored and community indicator initiatives, with regard to level of cooperation, collaboration, information sharing, and utilization of data and reports.
a content analysis of state and local newspaper •coverage was conducted to develop a better understanding of the broader, external perspec-tive of each project. a content analysis of the agendas and minutes for the appropriate gov-erning bodies was conducted to determine the internal perspective. specifically, we were look-ing to see how often performance measurement, and in particular, the specific projects were offi-cial agenda items and in what context.
to identify differences and strengths in perfor-•mance reporting among these projects, we ana-lyzed performance reports prepared by each project. the reports were rated using criteria that we developed based on reporting guidelines advanced by the governmental accounting standards Board, the association of government accountants and the canadian comprehensive auditing foundation. each criterion reflects principles of effective reporting as articulated by these organizations, each of which has written extensive guides to performance reporting and citizen-centric reporting. each report was assessed using 11 criteria. the criteria were organized into three categories: report content, report format and report accessibility.
Appendix II: Research Design

www.businessofgovernment.org 27
Moving toWard outcoMe-oriented PerforMance MeasureMent systeMs
We would like to thank the project directors who we interviewed for this research. their experiences, enthusiasm, and tenacity to push the performance measurement envelope ensure that government-sponsored initiatives keep advancing. not only were they ready to share their stories, they were open to our frequent requests for information, illustration, and guidance. We can only hope that we have done an adequate job of presenting their stories so that other public managers might adopt similar approaches in their work.
We would like to thank our research assistants Jongmin shon, leila sadeghi, alicia schatteman of rutgers university for giving us the momentum we needed to get the project underway. donna Parente, research assistant of Monmouth university, was an invaluable addition to our project as she consis-tently addressed our questions and requests with meticulous precision and diligence. all of them managed to maintain a high level of responsiveness to our research needs while managing several proj-ects and assignments.
Mark abramson, Jonathan Bruel, and John Kamensky of the iBM center for the Business of government were valuable resources for key infor-mants, suggestions, and overall support to make this a meaningful report for public managers.
Acknowledgements

iBM center for the Business of government28
Moving toWard outcoMe-oriented PerforMance MeasureMent systeMs
robert Behn, “Why Measure Performance? different Purposes require different Measures,” Public administration review, sept/oct 2003, 63(5), p. 586-606.
robert Behn, “What all Mayors Would like to Know about Baltimore’s citistat Performance strategy,” a report for the iBM center for the Business of government, 2007 Managing for Performance and results series.
robert Behn, “the seven Big errors of Performancestat,” a Policy Brief for the rappaport institute/taubman center, february 2008, www.hks.harvard.edu/thebehnreport/Behn,%207Performancestaterrors.pdf.
Barbara cohn Berman, “involving the Public in Measuring and reporting local government Performance” national civic review, spring 2008, p. 3-10.
government accountability office, Managing for Results: Enhancing Agency Use of Performance Information for Management Decision Making, september 2005, gao-05-927.
ted greenwood, “Bridging the divide Between community indicators and government Performance Measurement,” national civic review, spring 2008, p. 55-59.
lenneal H. Henderson, “the Baltimore citistat Program: Performance and accountability,” Washington: iBM center for the Business of government, 2003.
alfred t. Ho, “engaging citizens in Measuring and reporting community conditions: a Manager’s guide”, Washington: iBM center for the Business of government, 2007.
Jonathan Walters, “citizens and Performance: Benchmarking livability,” governing Magazine, april 1, 2008, www.governing.com/manage/pm/perf0408.htm.
oregon Progress Board, “Breakthrough results for oregon: revamping oregon’s approach to a sustainable future,” september 4, 2007.
Paul Posner, accountability: Questions from the field, a paper presented at the accountable governance international research colloquium, Belfast, ireland, october 2005.
References

www.businessofgovernment.org 29
Moving toWard outcoMe-oriented PerforMance MeasureMent systeMs
a B o u t t H e a u t H o ra B o u t t H e a u t H o r s
Dr. Kathe Callahan is an assistant professor in the school of Public affairs and administration at rutgers, the state university of new Jersey, campus at newark. dr. callahan’s research and teaching inter-ests focus on civic engagement, public sector accountability and perfor-mance measurement. in particular, she studies the impact of citizen participation on performance measurement and improvement. dr. callahan’s most recent book, Elements of Effective Governance: Measurement, Accountability and Participation, (taylor & francis, 2007) explores the relationship between performance measurement, public sector accountability and citizen participation. through theoretical and practical discussions she highlights the importance of measuring gov-ernment performance in ways that resonates with the public. she has published in a number of edited volumes and journals, including the Public Administration Review, Public Performance and Management Review, International Review of Public Administration, the journal of Public Budgeting, Accounting and Financial Management, and the International Journal of Public Administration.
in addition to her academic research, dr. callahan has conducted numerous applied research projects including studies to assess the effectiveness of performance measurement initiatives for the new Jersey department of education, the new Jersey office of economic growth and rutgers university. in 2006, she was selected to serve as the chair of the performance management committee for newark Mayor cory Booker. in 1998, dr. callahan was instrumental in designing and implementing the first sloan-funded citizen-driven performance measurement initiative at rutgers university.
dr. callahan is a board member of the center for accountability and Performance (caP) and a member of the task force on accountability for the american association for Public administration.
dr. callahan holds a Ph.d. in public administration from rutgers university.
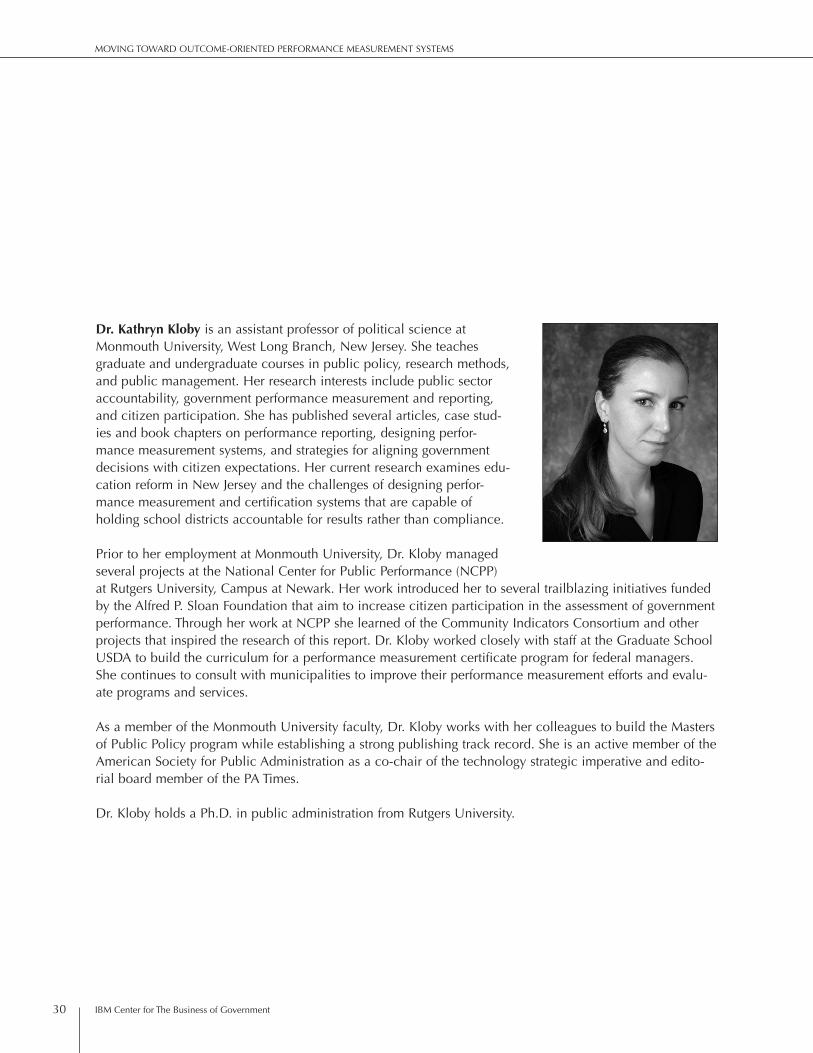
iBM center for the Business of government30
Moving toWard outcoMe-oriented PerforMance MeasureMent systeMs
Dr. Kathryn Kloby is an assistant professor of political science at Monmouth university, West long Branch, new Jersey. she teaches graduate and undergraduate courses in public policy, research methods, and public management. Her research interests include public sector accountability, government performance measurement and reporting, and citizen participation. she has published several articles, case stud-ies and book chapters on performance reporting, designing perfor-mance measurement systems, and strategies for aligning government decisions with citizen expectations. Her current research examines edu-cation reform in new Jersey and the challenges of designing perfor-mance measurement and certification systems that are capable of holding school districts accountable for results rather than compliance.
Prior to her employment at Monmouth university, dr. Kloby managed several projects at the national center for Public Performance (ncPP) at rutgers university, campus at newark. Her work introduced her to several trailblazing initiatives funded by the alfred P. sloan foundation that aim to increase citizen participation in the assessment of government performance. through her work at ncPP she learned of the community indicators consortium and other projects that inspired the research of this report. dr. Kloby worked closely with staff at the graduate school usda to build the curriculum for a performance measurement certificate program for federal managers. she continues to consult with municipalities to improve their performance measurement efforts and evalu-ate programs and services.
as a member of the Monmouth university faculty, dr. Kloby works with her colleagues to build the Masters of Public Policy program while establishing a strong publishing track record. she is an active member of the american society for Public administration as a co-chair of the technology strategic imperative and edito-rial board member of the Pa times.
dr. Kloby holds a Ph.d. in public administration from rutgers university.
www.businessofgovernment.org 31
Moving toWard outcoMe-oriented PerforMance MeasureMent systeMs
K e y c o n t a c t i n f o r M a t i o n
To contact the authors:
Kathe Callahanassistant Professorschool of Public affairs and administrationrutgers university—campus at newark360 Martin luther King Blvd, room 701newark, nJ 07102(973) 353-5093 x 3984
e-mail: [email protected]
Kathryn Klobyassistant Professordepartment of Political scienceMonmouth university400 cedar avenue, Bey Hall 249West long Branch, new Jersey 07764 (732) 263-5892
e-mail: [email protected]

iBM center for the Business of government32
Moving toWard outcoMe-oriented PerforMance MeasureMent systeMs
REPORTS from The IBM Center for The Business of Government
Collaboration: Networks and Partnerships
Preparing for Disasters by William Ross O’Brien, Richard Callahan, Dan M. Haverty, and Ross ClaytonIntegrating Service Delivery Across Levels of Government: Case Studies of Canada and Other Countries by Jeffrey Roy and John Langford
Contracting
The Challenge of Contracting for Large Complex Projects by Trevor L. Brown, Matthew Potoski, and David M. Van SlykeSuccess Factors for Implementing Shared Services in Government by Timothy J. Burns and Kathryn G. Yeaton
E-Government/Technology
Government in 3D: How Public Leaders Can Draw on Virtual Worlds by David C. WyldBiometrics: Enhancing Security in Organizations by Babita GuptaLeveraging Web 2.0 in Government by Ai-Mei Chang and P. K. KannanBest Practices for Implementing Agile Methods: A Guide for Department of Defense Software Developers by Ann L. Fruhling and Alvin E. Tarrell
Financial Management
Strengthening Government’s Ability to Deal with the Financial Crisis by Thomas H. Stanton
Human Capital Management
Federated Human Resource Management in the Federal Government by James R. Thompson and Rob Seidner
Innovation
Transforming Government Through Collaborative Innovation by Satish Nambisan
Managing for Performance and Results
Five Actions to Enhance State Legislative Use of Performance Management by Judy ZelioStrategic Use of Analytics in Government by Thomas H. Davenport and Sirkka L. Jarvenpaa
Organizational Transformation
Four Strategies to Transform State Governance by Keon S. Chi
Presidential Transition
Transformation of the Department of Defense’s Business Systems by Jacques S. Gansler and William LucyshynWhat the Federal Government Can Do to Encourage Green Production by Nicole DarnallThe National Security Council: Recommendations for the New President by D. Robert WorleyStrengthening Homeland Security: Reforming Planning and Resource Allocation by Cindy Williams
For a full listing of IBM Center publications, visit the Center’s website at www.businessofgovernment.org.
Recent reports available on the website include:

About the IBM Center for The Business of GovernmentThe IBM Center for The Business of Government connects public management research with practice. Since 1998, we have helped public sector executives improve the effectiveness of government with practical ideas and original thinking. We sponsor independent research by top minds in academe and the nonprofit sector, and we create opportunities for dialogue on a broad range of public management topics.
The Center is one of the ways that IBM seeks to advance knowledge on how to improve public sector effectiveness. The IBM Center focuses on the future of the operation and management of the public sector.
About IBM Global Business ServicesWith consultants and professional staff in more than 160 countries globally, IBM Global Business Services is the world’s largest consulting services organization. IBM Global Business Services provides clients with business process and industry expertise, a deep understanding of technology solutions that address specific industry issues, and the ability to design, build and run those solutions in a way that delivers bottom-line business value. For more information visit www.ibm.com.
For additional information, contact:Jonathan D. BreulExecutive DirectorIBM Center for The Business of Government1301 K Street, NWFourth Floor, West TowerWashington, DC 20005(202) 515-4504, fax: (202) 515-4375
e-mail: [email protected]: www.businessofgovernment.org