Embed Size (px)
Citation preview
Moving Up or Moving Out? Anti-Sweatshop Activists and Labor Market Outcomes
Ann Harrison (UC Berkeley and NBER) and Jason Scorse (UC Berkeley)*
April 2004
During the 1990s, human rights and anti-sweatshop activists increased their efforts to improve working conditions and raise wages for workers in developing countries. These campaigns took many different forms: direct pressure to change legislation in developing countries, pressure on firms, newspaper campaigns, and grassroots organizing. This paper analyzes the impact of two different types of interventions on labor market outcomes in Indonesian manufacturing: (1) direct US government pressure, which contributed to a doubling of the minimum wage and (2) anti-sweatshop campaigns. The combined effects of the minimum wage legislation and the anti-sweatshop campaigns led to a 50 percent increase in real wages and a 100 percent increase in nominal wages for unskilled workers at targeted plants. We then examine whether higher wages led firms to cut employment or relocate elsewhere. Although the higher minimum wage reduced employment for unskilled workers, anti-sweatshop activism targeted at textiles, apparel, and footwear plants did not. Plants targeted by activists were more likely to close, but those losses were offset by employment gains at surviving plants. The message is a mixed one: activism significantly improved wages for unskilled workers in sweatshop industries, but probably encouraged some plants to leave Indonesia. *Corresponding author: Ann Harrison, Department of Agricultural and Resource Economics, 329 Giannini Hall, UC Berkeley 94720. The authors would like to thank Garrick Blalock for generously sharing his data and expertise on Indonesia. The authors would also like to thank David Card, David Lee, Sylvie Lambert, and seminar participants at DELTA, INSEAD, the World Bank, UC Berkeley and Yale for useful suggestions.
1
I. Introduction Anti-sweatshop campaigns to improve working conditions for developing country workers
increased dramatically during the 1990s. These campaigns took many different forms: direct
pressure to change legislation in developing countries, pressure on firms, newspaper campaigns,
and grassroots organizing. The emergence of a global anti-sweatshop movement, in conjunction
with rapid increases in trade in goods and services, suggests that “globalization” may have two
offsetting effects. While some firms may react to international competition by cutting wages and
relocating to poor countries, new cross-national labor movements may prevent them from doing
so. Indeed, Elliott (1998b) and Elliot and Freeman (2003) argue that the confrontational
approach of pro-globalizers and anti-globalizing activists in the 1990s should be discarded.1
This paper examines the impact of US government pressure and anti-sweatshop campaigns
on labor market outcomes in Indonesia. Indonesia makes an ideal case study because large
increases in export activity and inward foreign investment occurred at the same time that the US
government and human rights organizations pressured the country to improve conditions for its
workers. The pressure took two different forms. First, the United States government threatened
to withdraw special tariff privileges for Indonesian exports if the government failed to address
human rights issues. The Indonesian government responded to US pressure by making the
minimum wage a central component of its labor market policies in the 1990s.2 Minimum wages
quadrupled in nominal terms and doubled in real terms.
1. Kimberly Elliott argues that many efforts to protect worker rights are not thinly veiled protectionist actions, but in fact are sincerely motivated. As proof, she analyzes the pattern of countries sanctioned under the U.S. GSP for not protecting worker rights. She concludes that globalization’s current pace cannot be sustained unless it is made clear that globalization benefits all the workers, not just a chosen few. She suggests that approaches need to be developed that allow globalization to proceed, but at the same time protect the rights of workers. See Elliott (1998a). 2. SMERU Research Institute (2001).
2
A second approach involved grassroots organizing, negative publicity, and consumer
awareness campaigns. In the 1990s, international concern over globalization and labor standards
increased dramatically. Between 1990 and 1996, the number of articles in major newspapers
about sweatshop and child labor activities more than tripled. Major campaigns against large
footwear companies such as Nike forced these firms to raise wage, improve working conditions
for their workers, and sign codes of conduct.
To our knowledge, this is the first study to systematically measure the impact of the anti-
sweatshop movement on labor market outcomes. We measure the impact of these campaigns
using a difference-in-difference approach, comparing wages before and after the advent of the
campaigns. Our results suggest that the doubling of the real minimum wage led to a 25 percent
increase in real wages for unskilled workers between 1990 and 1996. Unskilled wages increased
even more rapidly for workers employed by multinationals and exporters in sweatshop
industries, defined as textiles, footwear, and apparel (TFA), than in other sectors. In particular,
real unskilled wages increased by 10 to 20 percent more in TFA plants than in other export-
oriented or foreign owned industries.
The combined effects of the minimum wage legislation and the anti-sweatshop
campaigns led to as much as a 50 percent increase in real wages and a 100 percent increase in
nominal wages for unskilled workers at targeted plants. We then examine whether higher wages
led firms to cut employment or relocate elsewhere. Despite significant non-compliance, the
minimum wage hike reduced employment for unskilled workers by as much as 10 percentage
points over the period. Although the higher minimum wage reduced employment, anti-
sweatshop activism targeted at textiles, apparel, and footwear plants did not. Plants targeted by
activists were more likely to close, but those losses were offset by employment gains at surviving
3
plants. The fact that wages responded to activist pressure without leading to a significant fall in
employment suggests that anti-sweatshop campaigns in Indonesia were successful in helping the
lowest paid workers achieve sizeable income gains. Our message is a mixed one: activism
significantly improved wages for unskilled workers in sweatshop industries, but probably led
some plants to shut down operations in Indonesia.
To avoid endogeneity problems, we define foreign ownership, export status, and
establishments producing textiles, footwear or apparel based on their status at the beginning of
the sample period. The results are robust to a variety of alternative specifications. We include a
number of controls that could be correlated with foreign ownership and export status, such as
investments in technology, differences in productivity or changing profitability resulting from
exchange rate fluctuations. We also control for output shocks that could be associated with
rising wages in textiles and apparel production; none of our extensions affect the robustness of
the results.
Although other research has shown that foreign enterprises in developing countries are
more likely to pay higher wages, these previous studies do not directly address the impact of
anti-sweatshop activism.3 Other related work includes Edmonds and Pavcnik (2001), who
explore how rice prices affected the use of child labor in Vietnam. Edmonds and Pavcnik (2002)
find that in rural areas, where most people are both rice producers and consumers, the income
effect of higher rice prices has greatly outweighed the higher opportunity costs of not employing
children in the work force, and therefore child labor has declined significantly.4 Previous work
3. Aitken, Lipsey, and Harrison (1997); Harrison and Scorse (2003). 4 However, in urban areas, where families are only rice consumers, the effects of the rice exports on price has led to increases in child labor since urban incomes have declined. Since Vietnam is predominantly rural, the overall effect has been a decline in child labor.
4
has also examined the rationale for labor standards, as well as on the determinants of ratification
of ILO conventions. 5
The structure of this paper is as follows. In Section II, we discuss the background for the
minimum wage increases, present evidence on the development of anti-sweatshop campaigns,
and set up a framework for estimation. We present results on wages in Section III. Section IV
examines the impact of minimum wage legislation and anti-sweatshop activism on employment
and plant exit, while Section V concludes.
II. Background and Framework for Estimation
We begin by describing the role played by the United States is influencing Indonesia’s
labor market policies. The United States put pressure on Indonesia in the late 1980s to improve
labor market conditions, which led to large increases in the minimum wage. We then turn to a
5 Chau and Kanbur (2001) postulate that if ratification of these conventions were costless, or if the benefits greatly outweighed the costs, one would expect complete compliance across countries. Given that this is not the case, Chau and Kanbur investigate the determinants of signing. They find little evidence that variables predicted by standard economic theory— such as per capita gross domestic product (GDP), degree of openness to trade, or average education—are determining factors, but rather that countries with higher domestic standards have a higher probability of adoption.5 Maskus (1996) refutes the argument that a lack of international standards has led to significant erosion of low-skilled wages in developed countries, or is a significant determinant of trade performance and foreign direct investment throughout the developing world. Maskus also reports evidence regarding the impact of labor standards on wages in export processing zones. He claims that overall the zones pay higher wages and have better working conditions, but that in some countries the minimum wage is less likely to be enforced in export processing zones than in the rest of the country. Anecdotal evidence also suggests that efforts to organize workers in export processing zones have been routinely suppressed. Maskus points out that the altruistic reasons echoed in much of the developed world for promoting labor standards, even if sincere, are often used as a guise for trade protectionism and that natural variability in labor standards is an inevitable result of differing levels of economic, social, and cultural development. He also analyzes the extent to which trade instruments such as tariffs, import quotas, and sanctions could potentially be used to enforce international compliance with a minimum set of core labor standards, specifically with respect to developing countries. He finds that trade instruments are never first-best and that often they exacerbate the problems they are meant to solve (primarily because they often reduce the poorest workers’ incomes). In addition, they can lead to other labor market distortions that decrease overall world welfare. He suggests a number of more targeted approaches to address contentious labor issues such as child labor, including labeling schemes as well as aid programs focused on education and poverty alleviation.
5
discussion of the anti-sweatshop movement. To the extent that anti-sweatshop activism also
contributed to US government efforts to raise minimum wages in Indonesia, our approach
provides a lower bound on the impact of the anti-sweatshop movement on wages. However,
separating the impact of US government pressure from sweatshop activism is possible because
the minimum wage increase affected all manufacturing enterprises, while anti-sweatshop
activists concentrated on textiles, apparel, and footwear factories. This section then describes a
theoretical framework and discusses the approach to estimation.
Background Beginning in the late 1980s, North American and European Union groups
expressed concern about Indonesian exporters and the labor market conditions of their workers.
Complaints targeted at Indonesian exports were filed by U.S. groups first in 1989 and again in
May 1992, citing violation of worker rights under the Generalized System of Preferences (GSP).
The 1992 investigation dragged on for over two years, generating considerable pressure on the
Indonesia government to address the accusations of low wages, violations of existing labor
standards, and suppression of unions. The GSP allows poor countries to benefit from low tariffs
on their exports to the U.S. market, but excludes both footwear and textiles and apparel imports
subject to the Multi-Fibre Agreement (MFA). The fact that a large share of Indonesian exports
to the United States (nearly 25 percent in 1996) benefited from special privileges under the GSP
was enough to generate considerable pressure.6 A prominent research institute, describing the
potential loss of GSP status for Indonesia, noted that “the withdrawal of investment guarantees to
U.S. companies that would ensue was a threat of potentially great(er) significance.”7
The Indonesian government responded by raising the minimum wage and encouraging
greater compliance with the legislation, particularly among exporters. As indicated by Figure 1,
6. See Elliott (1998a) for a discussion of the U.S. GSP and its impact on labor standards. 7. SMERU Research Institute (2001).

6
minimum wages quadrupled in nominal terms and doubled in real terms. Large increases in the
real value of the minimum wage occurred in 1989 and between 1992 and 1994, coinciding with
US threats to withdraw GSP preferences to Indonesia. Firms struggled to comply with the rising
minimum wage. Using household surveys, Rama (1996) estimates that the increasing minimum
wage led to a 10 percent increase in average wages, a 2 percent fall in employment, and 5
average percent decline in investment. Using the manufacturing census plant-level data for
Indonesia, we calculated average production and non-production worker wages relative to the
statutory minimum from 1985 through 1999. As indicated by the trends in Figure 1, the ratio of
production worker wages to the minimum wage fell from a factor of more than 2- to-1 in the
Figure 1: Average Wages with Respect to the Minimum Wage & Minimum Wage Compliance In Indonesia 1990-1999
0
1
2
3
4
5
6
7
8
9
1985 1986 1987 1988 1989 1990 1991 1992 1993 1994 1995 1996 1997 1998 1999
Year
Rat
io o
f Wag
e:M
in W
age/
% C
ompl
ianc
e
Ratio of Average Production Wage to Minimum Wage
Ratio of Average Non-Production Wage to MinimumWage
Average Compliance wih the Minimum Wage Law forProduction Workers
Average Compliance with the Minimum Wage Law forNon-Production Workers
Average Minimum Wage (Nominal: Indexed wrt 1985)
Average Minimum Wage (Real: Indexed wrt 1985)
early 1990s to nearly 1-to-1 in the late 1990s. This indicates that average production-worker
wages were hovering just above the minimum wage before the 1997 financial crisis. The
7
proportion of plants paying at least the minimum also declined significantly during this period.
While three-quarters of all plants paid above minimum wages to production workers in the mid-
1980s, by 1999 only about half of all plants paid average wages that exceeded the statutory
regional minimum for production workers.
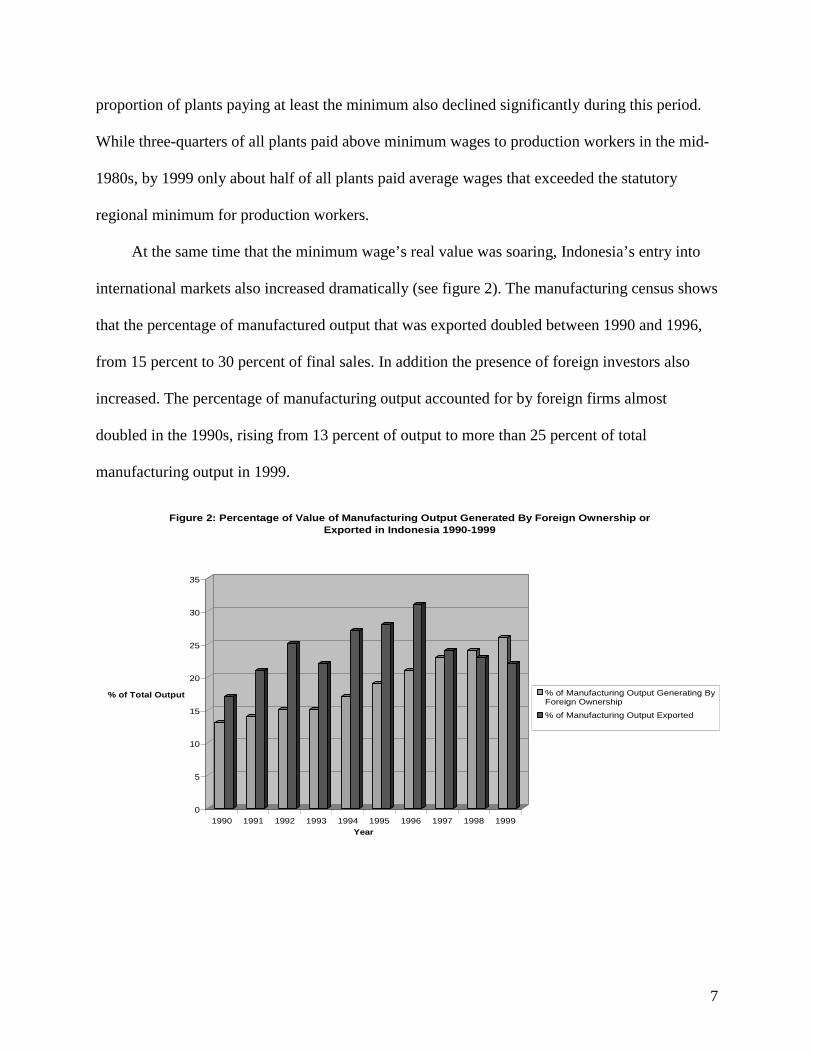
At the same time that the minimum wage’s real value was soaring, Indonesia’s entry into
international markets also increased dramatically (see figure 2). The manufacturing census shows
that the percentage of manufactured output that was exported doubled between 1990 and 1996,
from 15 percent to 30 percent of final sales. In addition the presence of foreign investors also
increased. The percentage of manufacturing output accounted for by foreign firms almost
doubled in the 1990s, rising from 13 percent of output to more than 25 percent of total
manufacturing output in 1999.
0
5
10
15
20
25
30
35
% of Total Output
1990 1991 1992 1993 1994 1995 1996 1997 1998 1999Year
Figure 2: Percentage of Value of Manufacturing Output Generated By Foreign Ownership or Exported in Indonesia 1990-1999
% of Manufacturing Output Generating ByForeign Ownership
% of Manufacturing Output Exported
8
It is clear from the high rates of non-compliance evident in Figure 1 that firms in
Indonesia did not always comply with the new minimum wage legislation. Although
compliance is typically high in developed countries, in developing countries such as Indonesia
compliance with minimum wages can be as low as 40 percent. Consequently, the firm must
decide whether or not to pay the minimum wage. The firm’s choices are similar in the context of
anti-sweatshop campaigns. Faced with the possibility of a negative ad campaign, the firm must
weigh the costs of paying higher wages against the potential negative publicity that may result if
they do not.
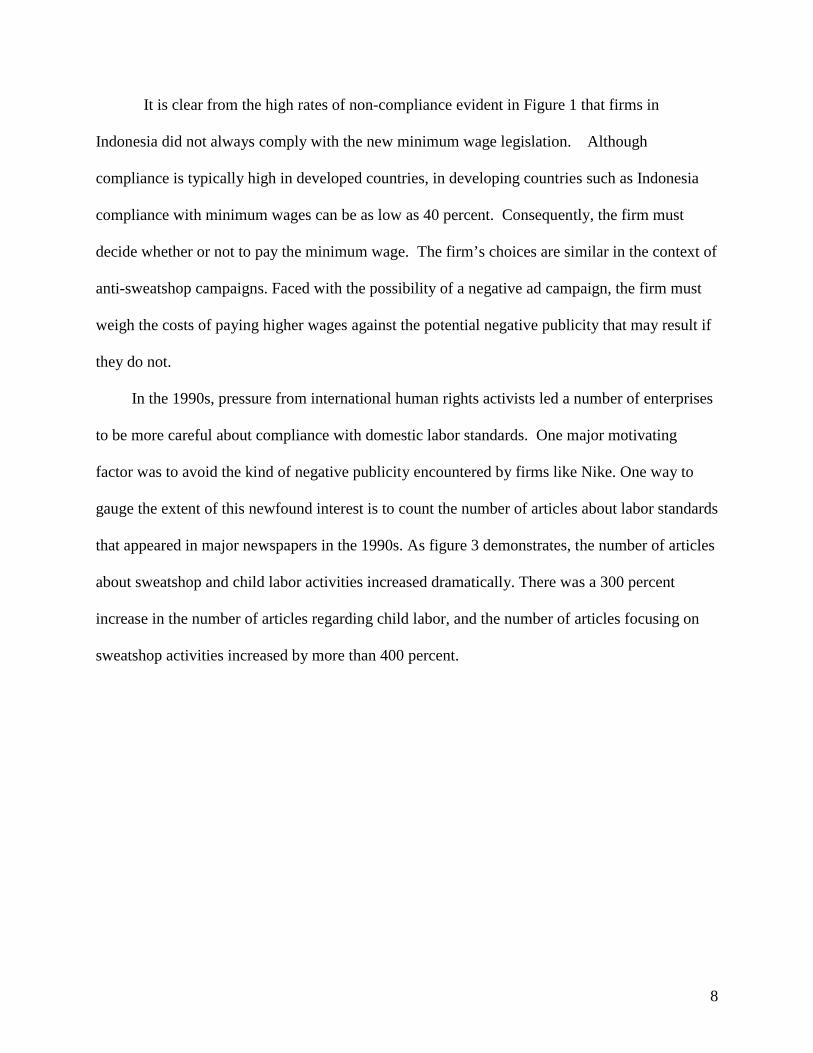
In the 1990s, pressure from international human rights activists led a number of enterprises
to be more careful about compliance with domestic labor standards. One major motivating
factor was to avoid the kind of negative publicity encountered by firms like Nike. One way to
gauge the extent of this newfound interest is to count the number of articles about labor standards
that appeared in major newspapers in the 1990s. As figure 3 demonstrates, the number of articles
about sweatshop and child labor activities increased dramatically. There was a 300 percent
increase in the number of articles regarding child labor, and the number of articles focusing on
sweatshop activities increased by more than 400 percent.
9
Figure 3: Articles about "sweatshops" and "child labor" in Major Newspapers 1990-1999
0
200
400
600
800
1000
1200
1990 1991 1992 1993 1994 1995 1996 1997 1998 1999
Source:LexisNexis
Num
ber
of A
rtic
les
(*Le
xus
max
es a
t 100
0)
Sweatshop ArticlesChild Labor Articles
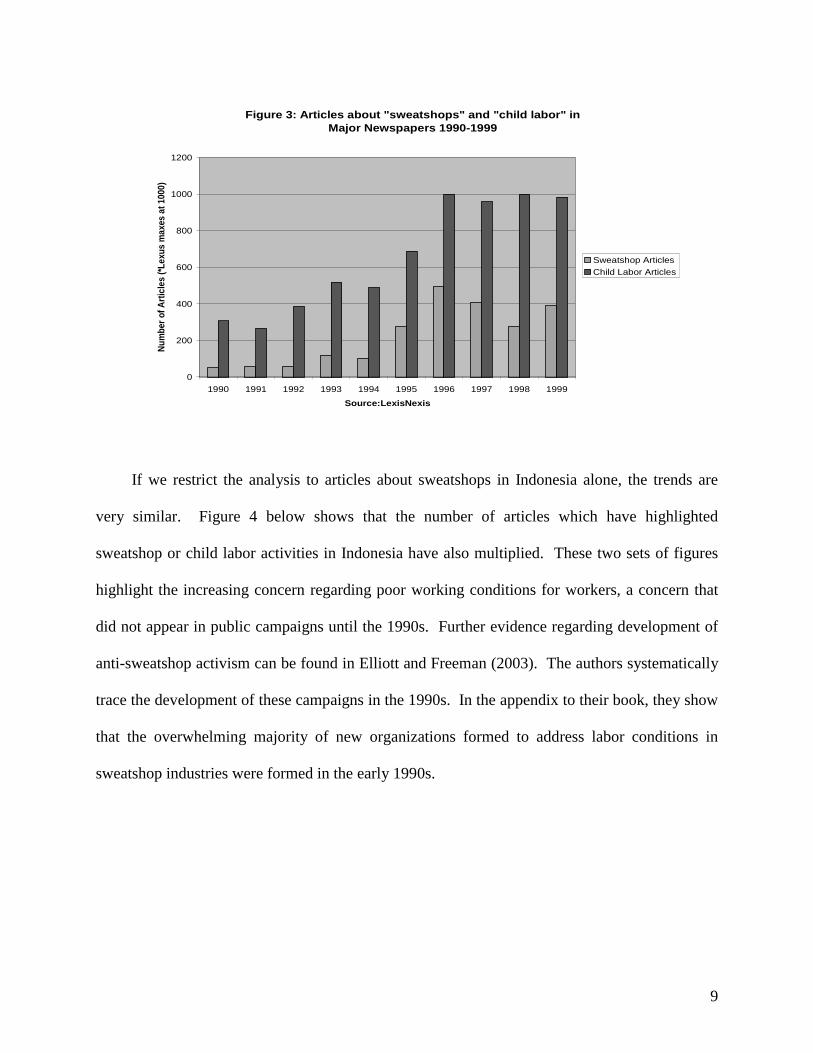
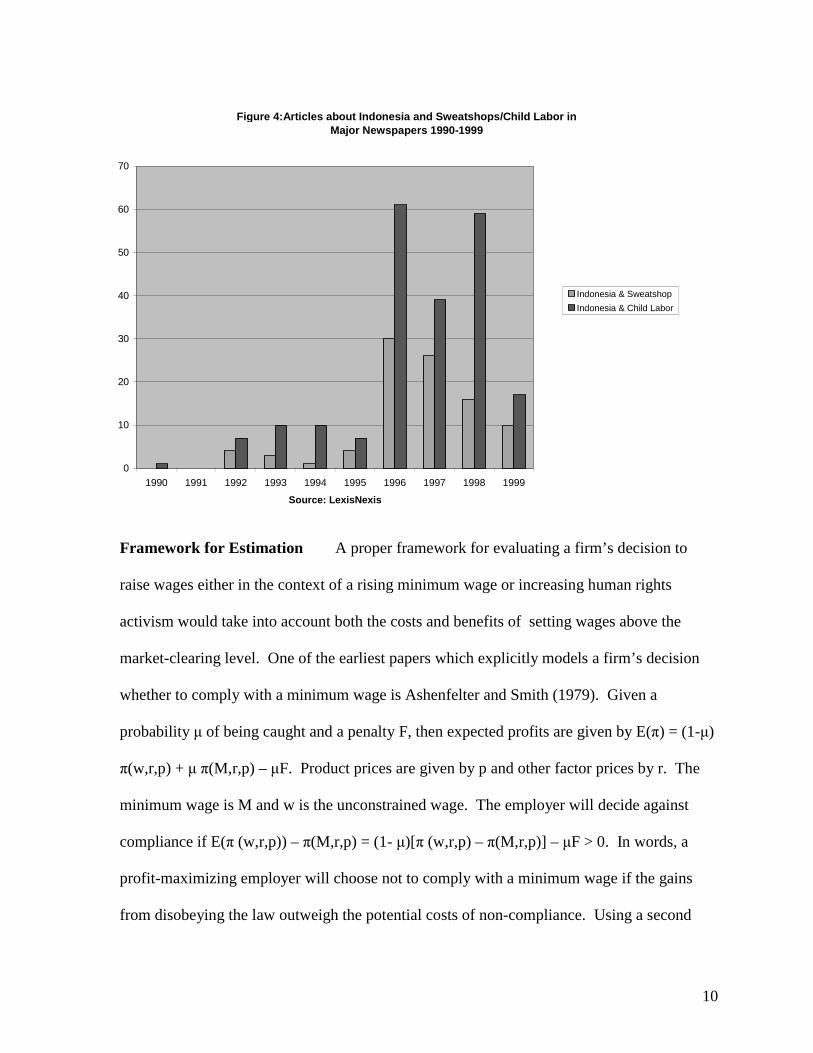
If we restrict the analysis to articles about sweatshops in Indonesia alone, the trends are
very similar. Figure 4 below shows that the number of articles which have highlighted
sweatshop or child labor activities in Indonesia have also multiplied. These two sets of figures
highlight the increasing concern regarding poor working conditions for workers, a concern that
did not appear in public campaigns until the 1990s. Further evidence regarding development of
anti-sweatshop activism can be found in Elliott and Freeman (2003). The authors systematically
trace the development of these campaigns in the 1990s. In the appendix to their book, they show
that the overwhelming majority of new organizations formed to address labor conditions in
sweatshop industries were formed in the early 1990s.
10
Figure 4:Articles about Indonesia and Sweatshops/Child Labor in Major Newspapers 1990-1999
0
10
20
30
40
50
60
70
1990 1991 1992 1993 1994 1995 1996 1997 1998 1999
Source: LexisNexis
Indonesia & Sweatshop
Indonesia & Child Labor
Framework for Estimation A proper framework for evaluating a firm’s decision to
raise wages either in the context of a rising minimum wage or increasing human rights
activism would take into account both the costs and benefits of setting wages above the
market-clearing level. One of the earliest papers which explicitly models a firm’s decision
whether to comply with a minimum wage is Ashenfelter and Smith (1979). Given a
probability µ of being caught and a penalty F, then expected profits are given by E(π) = (1-µ)
π(w,r,p) + µ π(M,r,p) – µF. Product prices are given by p and other factor prices by r. The
minimum wage is M and w is the unconstrained wage. The employer will decide against
compliance if E(π (w,r,p)) – π(M,r,p) = (1- µ)[π (w,r,p) – π(M,r,p)] – µF > 0. In words, a
profit-maximizing employer will choose not to comply with a minimum wage if the gains
from disobeying the law outweigh the potential costs of non-compliance. Using a second
11
order Taylor expansion, we can show that firms will choose to comply with minimum wage
legislation if
G/L – (M – w) + (1/2w)[M-w]2e> 0 (1)
G is a positive function of the probability of detection µ and a negative function of the
penalty F, L is the number of employees in the firm, M is the minimum wage, and w is the
average wage paid by the firm. The value e is the elasticity of demand for labor and is less
than zero. Equation (1) suggests that firms would comply with minimum wage legislation if
the expected penalty from violating the law, given by G/L, exceeds the additional
compensation, given by the difference M-w, that needs to be paid to each employee when the
firm complies with the minimum wage. As indicated by equation (1), firms are more likely to
comply with minimum wage legislation if the probability of detection is high or the penalty
is high, if the minimum wage M is low, or if the firm pays high wages. Since a large number
of employees reduces the per employee cost of compliance in terms of the penalty F per
worker, large firms are also less likely to comply, after controlling for the probability of
detection and other factors.
A linearized version of Equation (1) suggests the following general empirical
specification for an establishment i in region r and time t:
Xirt = α1 + α2Mrt + α3wrt + α4G(µ,F)i + α5Lit + α6Zirt +ωr + eit (2)
12
Equation (2) could be estimated in a number of different ways. For example, X could be defined
as an indicator variable equal to 0 if the establishment fails to comply with the minimum wage,
and equal to 1 if the firm complies. This could be estimated using a probit specification or a
linear probability model. Another possibility—which allows us to capture the whole wage
distribution—is to define the outcome variable X as the change in wages or percentage change in
wages between period t-1 and period t.
Estimating (2) requires information on minimum wages M, the wage w that would have
been paid in the absence of minimum wage regulations, employment L, and measures of the
probability of detection (µ) and penalties associated with non-compliance (F). According to
equation (1), compliance should increase with w and should fall as M rises. The framework also
suggests that compliance or wage growth is likely to rise as the probability of detection and
penalties for noncompliance increase. The set-up also suggests that compliance should vary
inversely with number of employees, L. We would also need to control for differences in types
of workers; we will index labor quality by a vector Z. Minimum wages in Indonesia vary across
districts (indexed by r) and over time (indexed by t); these are available from the government.
Since w is the wage which would have prevailed in the absence of minimum wage legislation, w
is normally not observed. However, in the Indonesian case, around half of all firms do not
comply with the minimum wage. Consequently, we could define w as the average wage in region
r at time t across all firms that do not comply with the minimum wage. However, w is probably a
(downward-biased) measure of the true w, since presumably firms which face a higher gap
between w and M are those most likely to violate the law.
For Indonesia, there is no existing evidence on the probability of detection. It also appears
that for domestic firms in the 1980s, the penalty F for non-compliance was probably close to
13
zero.8 However, as human rights activism and anti-sweatshop organizations have proliferated,
the probability of detection and the penalty F for paying low wages or failing to adhere to the
minimum wage may have increased, particularly for firms with high visibility such as large
multinationals or well established exporters. Why should greater international competition affect
compliance with labor standards? In an imperfectly competitive framework, it is easy to show
that maximizing firm profits with respect to employment leads to a first order condition where
wages are a positive function of final goods prices. If domestic markets are no longer protected
from foreign competition, international prices (which may be lower than domestic prices) could
put downward pressure on wages (w in equations (1) and (2)) and consequently lead to lower
wage growth. If there is imperfect competition, footloose foreign firms may be more likely to
appropriate rents relative to domestic enterprises.
On the other hand, it is equally possible that exporters and multinational firms are more
likely to comply with domestic labor standards. Exporters and multinationals are likely to
face both a higher probability of detection µ and a higher penalty F. The higher probability of
detection results from the additional scrutiny placed on these firms in the 1990s,while the higher
penalty is indicative of the greater costs to multinationals of acquiring a poor image regarding
compliance with labor standards. To capture the impact of anti-sweatshop campaigns on wage
setting behavior, we propose making G(F,µ) a function of export status and foreign ownership,
defined at the beginning of the sample period. Consequently, we define export status EXP and
foreign ownership FOR as dummy variables equal to one if the establishment exported some of
its output or had some foreign ownership in 1990 and continued to do so over the entire period.
Since activism focused primarily on sweatshop industries, we will add variables to allow
8 In Indonesia in the mid-1990s, the dollar amount of the fine from non-compliance was fifty dollars, not a large amount for most enterprises. See Rama (1996).
14
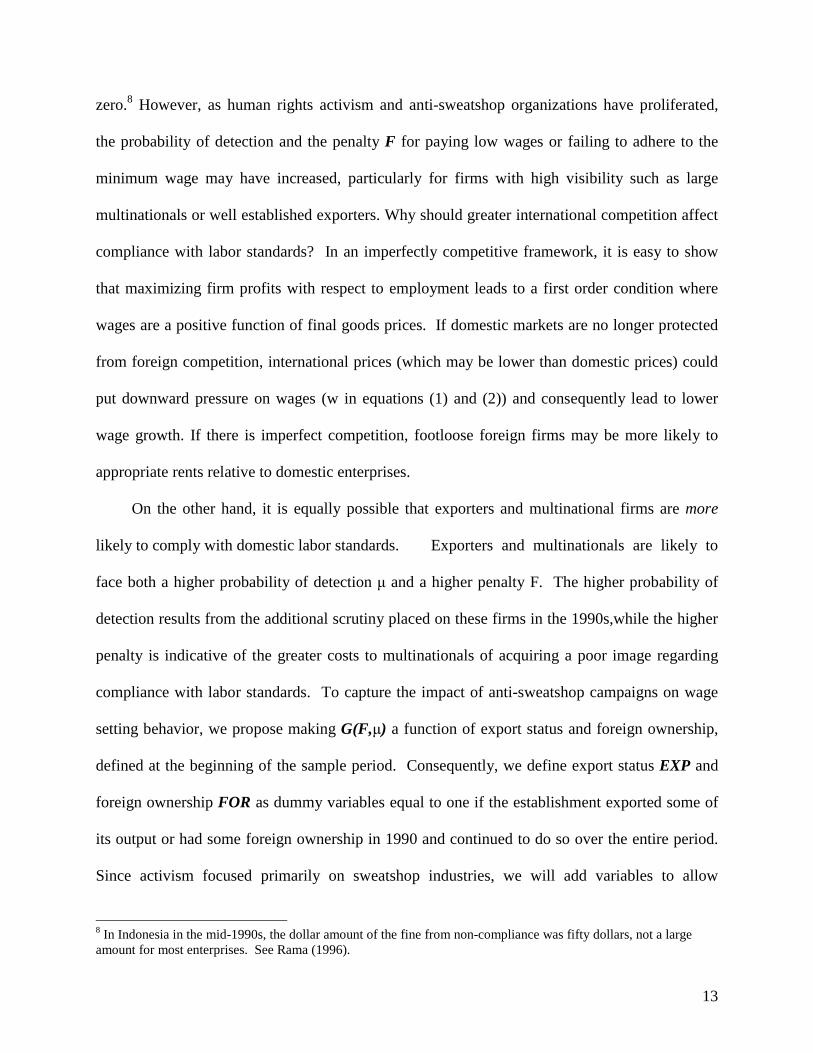
outcomes to vary depending on whether the establishment was producing textiles, footwear or
apparel (TFA) at the beginning of the sample period:
Xirt = α1 + α2Mrt + α3wrt + β1EXPit0 + β2FORit0+ β3TFA it0 + β4(EXP*TFA) it0 +
β5 (FOR*TFA) it0 + α4Lit + α5Zirt + ωr + eit (3)
The vector Z includes a number of factors which could be correlated with FOR and EXP, and
are likely to affect X. This includes worker characteristics and other firm characteristics such as
capital intensity. As indicated in Figure 1, compliance is a much more serious problem for
production workers. Consequently, the results of estimating (3) will be reported primarily for
production workers. Some years in the survey include additional information on employee
education and experience. When available, these will also be included. Estimation will also take
into account the possibility of region-specific effects captured in (3) by ωr.
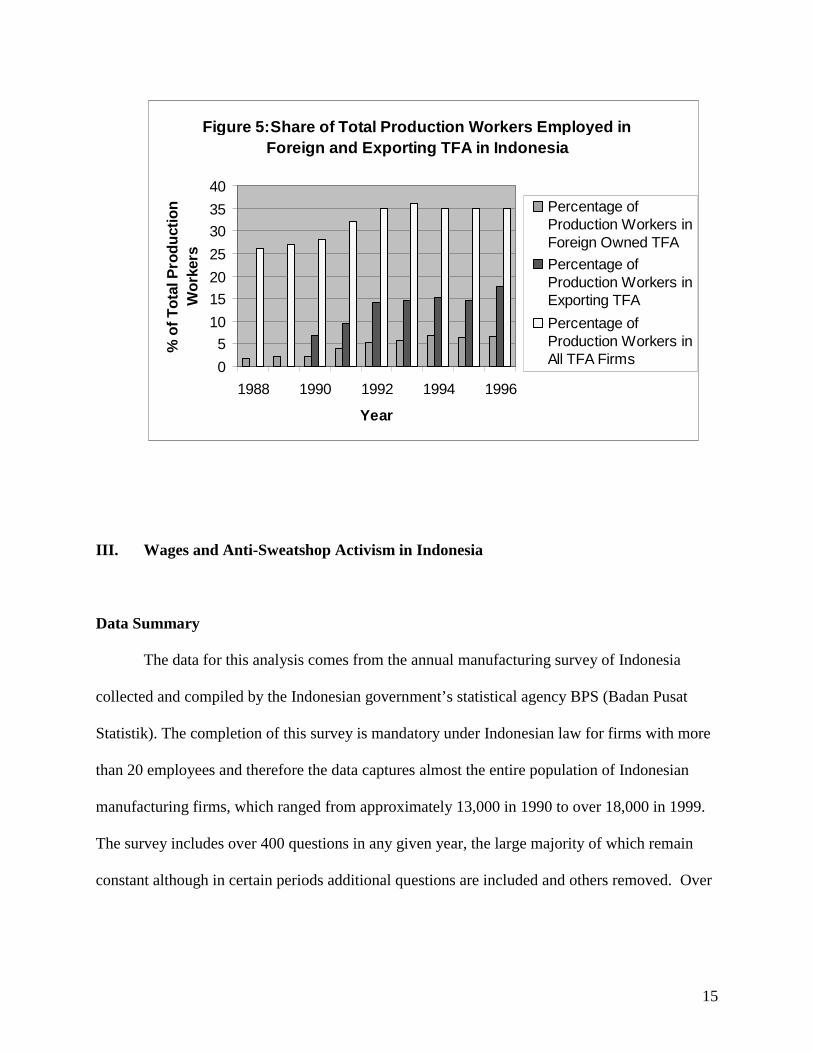
To give the reader an idea of the importance of textiles, apparel, and footwear in the
manufacturing sector in Indonesia in the 1990s, Figure 5 shows the share of TFA in overall
production (unskilled worker) employment. The percentage of all unskilled workers in
manufacturing employment in TFA plants rose from 25 to 35 percent during the period. The
percentage of unskilled workers employed by foreign TFA plants rose from 2 percent to over 5
percent, while the percentage of unskilled workers employed by exporting plants increased from
5 percent to nearly 20 percent of all unskilled employment in manufacturing. This graph
highlights the major importance of textiles, apparel, and footwear plants in employing unskilled
workers during this period.
15
Figure 5:Share of Total Production Workers Employed in Foreign and Exporting TFA in Indonesia
0
5
10
15
20
25
30
35
40
1988 1990 1992 1994 1996
Year
% o
f T
ota
l Pro
du
ctio
n
Wo
rker
sPercentage ofProduction Workers inForeign Owned TFA
Percentage ofProduction Workers inExporting TFA
Percentage ofProduction Workers inAll TFA Firms
III. Wages and Anti-Sweatshop Activism in Indonesia
Data Summary
The data for this analysis comes from the annual manufacturing survey of Indonesia
collected and compiled by the Indonesian government’s statistical agency BPS (Badan Pusat
Statistik). The completion of this survey is mandatory under Indonesian law for firms with more
than 20 employees and therefore the data captures almost the entire population of Indonesian
manufacturing firms, which ranged from approximately 13,000 in 1990 to over 18,000 in 1999.
The survey includes over 400 questions in any given year, the large majority of which remain
constant although in certain periods additional questions are included and others removed. Over
16
the ten year period there is an average of 4.5 observations per firm, reflecting the fact that some
firms go out of business while others enter.
Given that Indonesia has minimum wage laws there would appear to be an incentive for
firms to exaggerate wages in order to feign compliance. However, whether due to ignorance of
these laws or a lack of enforcement a very large percentage of firms reported wages significantly
below the minimum for a number of years. These estimates of compliance are consistent with
other studies which examine compliance with the minimum wage in Indonesia, including a study
by the Indonesian SMERU Research Institute (2001) and Alatas and Cameron (2003). These
studies, based on both worker surveys and the Indonesian Labor Force Survey (Sakernas),
indicate that “a sizeable portion of the sample is receiving less than the minimum wage” (Alatas
and Cameron (1993), p. 16). The SMERU Research Institute (2001) analyzed compliance rates
with the minimum wage in Indonesia using a sample of 40 firms which reported worker-specific
wages within each firm, as well as the national labor force survey. They found compliance rates
of about 60 percent, comparable to those reported in Figure 1. Alatas and Cameron (1993)
report the kernel density estimates of the monthly wage distribution for West Java and Jakarta.
Their results, based on the individual-level surveys, also imply rates of non-compliance as high
as 50 percent. These high levels of non-compliance are likely to be accurate, since individual
households have no incentive to misreport their earnings for the labor force surveys. Using
plant-level data for Morocco, Harrison and Currie (1997) also find self-reported non-compliance
rates of up to 50% in Morocco, presumably due to a lack of enforcement or little fear of penalties
as well. These other studies, many of them also on Indonesia, suggest the high rates of non-
compliance with the minimum wage reported in Figure 1 are likely to be accurate.
17
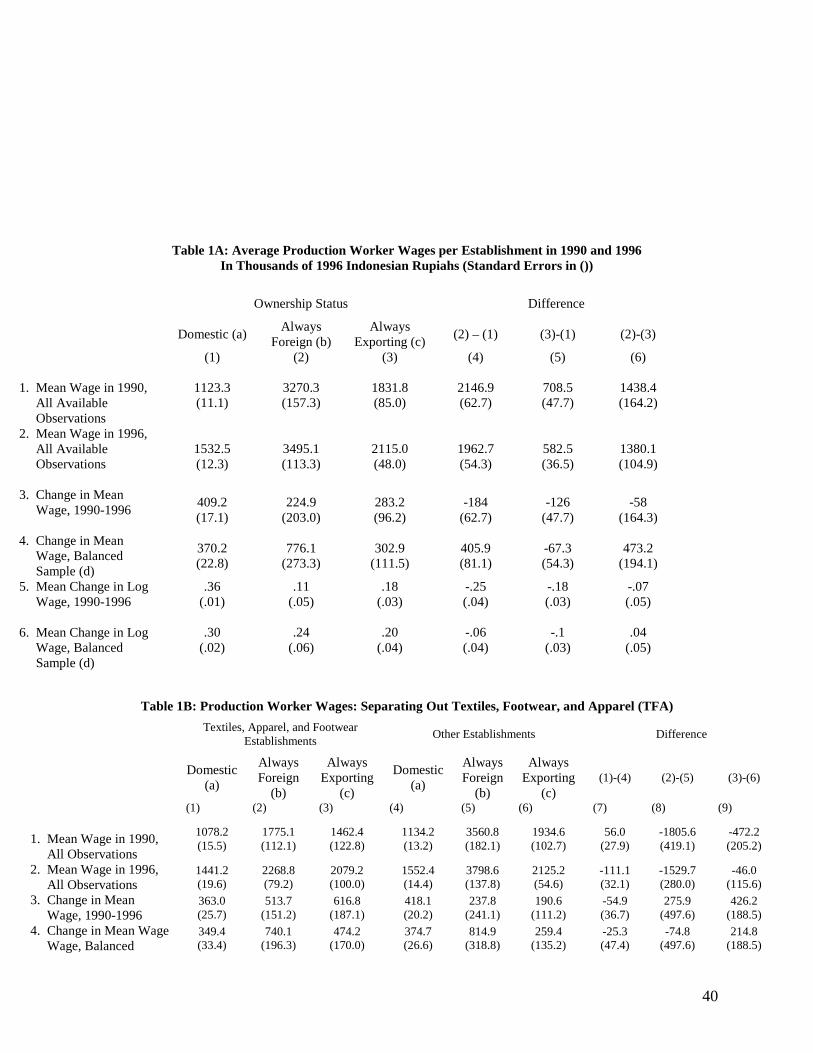
We begin by reporting mean wages in the manufacturing sector in 1990 and 1996 (Table
1). We focus on this period because information on export orientation was not collected before
1990, and the financial crisis which erupted in 1997 makes any evaluations post-1996
problematic. In addition, information on worker characteristics is only available during the mid-
1990s. Since the minimum wage is supposed to apply only to base wages, we define the plant’s
average wage as basic compensation (salary) divided by the number of workers in that skill
category. For the remainder of the analysis, we focus almost exclusively on production worker
wages as a measure of unskilled wages. As indicated earlier, we have chosen not to focus on
skilled worker wages, which were on average two and a half to four times higher than the
legislated minimum wage during the 1990s (see Figure 1).
The first column of Table 1 reports the average production worker wage in 1990 and in
1996, and the difference between 1990 and 1996. The third row reports the difference for all
plants, while the fourth row reports the difference in wages between 1990 and 1996 only for
plants which were present in both years. All wages are reported in thousands of 1996 Indonesian
rupiahs. Based on an exchange rate of about 2,000 rupiahs to the dollar in 1996, average
production worker wages in domestic enterprises increased from about 550 US dollars to 750 US
dollars between 1990 and 1996. Column (2) reports wages for foreign owned enterprises, while
column (3) reports wages for exporters. As discussed earlier, foreign and exporting status is
defined based on information at the beginning of the sample period. In 1990, firms with foreign
equity paid three times the wages of domestic enterprises, averaging 1500 US dollars per worker.
By 1996, the gap had narrowed: foreign firms paid only twice as much as domestic enterprises.
Exporters also paid higher wages than firms producing solely for the domestic market: about 50
percent more in both 1990 and 1996. These significant differences in pay levels between
18
domestic enterprises, foreign firms, and exporters suggest very different levels of compliance
with minimum wages, even at the onset of our study.
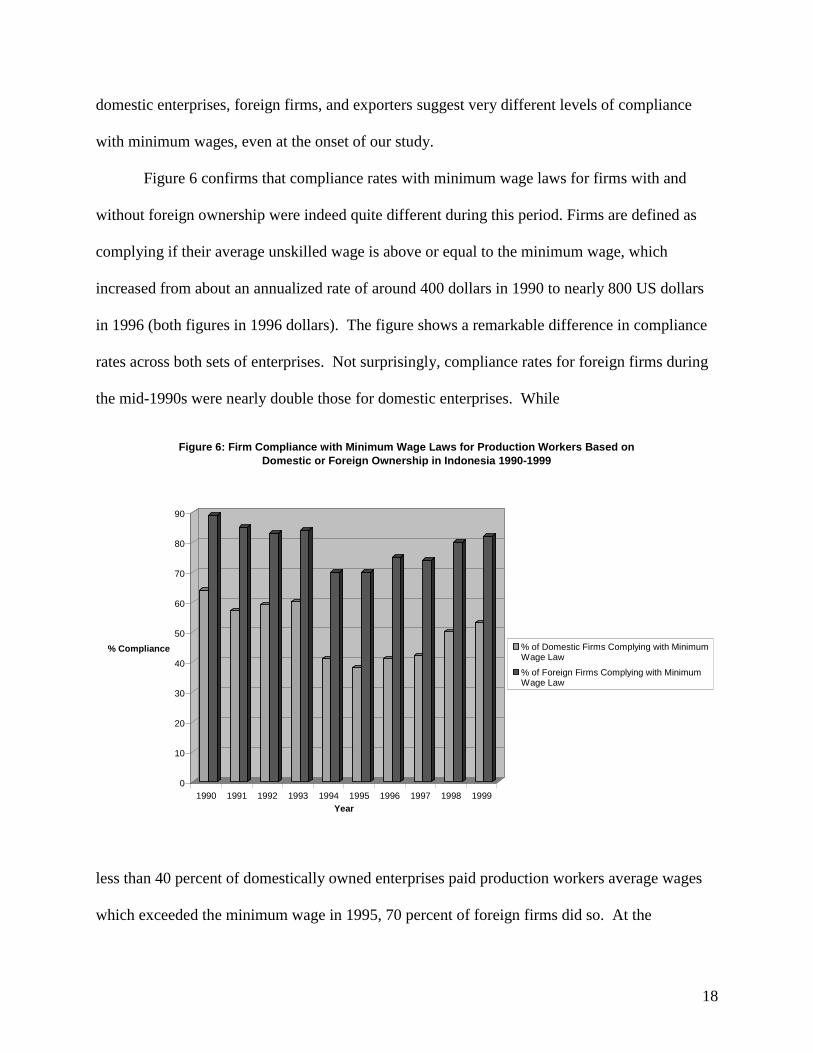
Figure 6 confirms that compliance rates with minimum wage laws for firms with and
without foreign ownership were indeed quite different during this period. Firms are defined as
complying if their average unskilled wage is above or equal to the minimum wage, which
increased from about an annualized rate of around 400 dollars in 1990 to nearly 800 US dollars
in 1996 (both figures in 1996 dollars). The figure shows a remarkable difference in compliance
rates across both sets of enterprises. Not surprisingly, compliance rates for foreign firms during
the mid-1990s were nearly double those for domestic enterprises. While
0
10
20
30
40
50
60
70
80
90
% Compliance
1990 1991 1992 1993 1994 1995 1996 1997 1998 1999Year
Figure 6: Firm Compliance with Minimum Wage Laws for Production Workers Based on Domestic or Foreign Ownership in Indonesia 1990-1999
% of Domestic Firms Complying with MinimumWage Law
% of Foreign Firms Complying with MinimumWage Law
less than 40 percent of domestically owned enterprises paid production workers average wages
which exceeded the minimum wage in 1995, 70 percent of foreign firms did so. At the
19
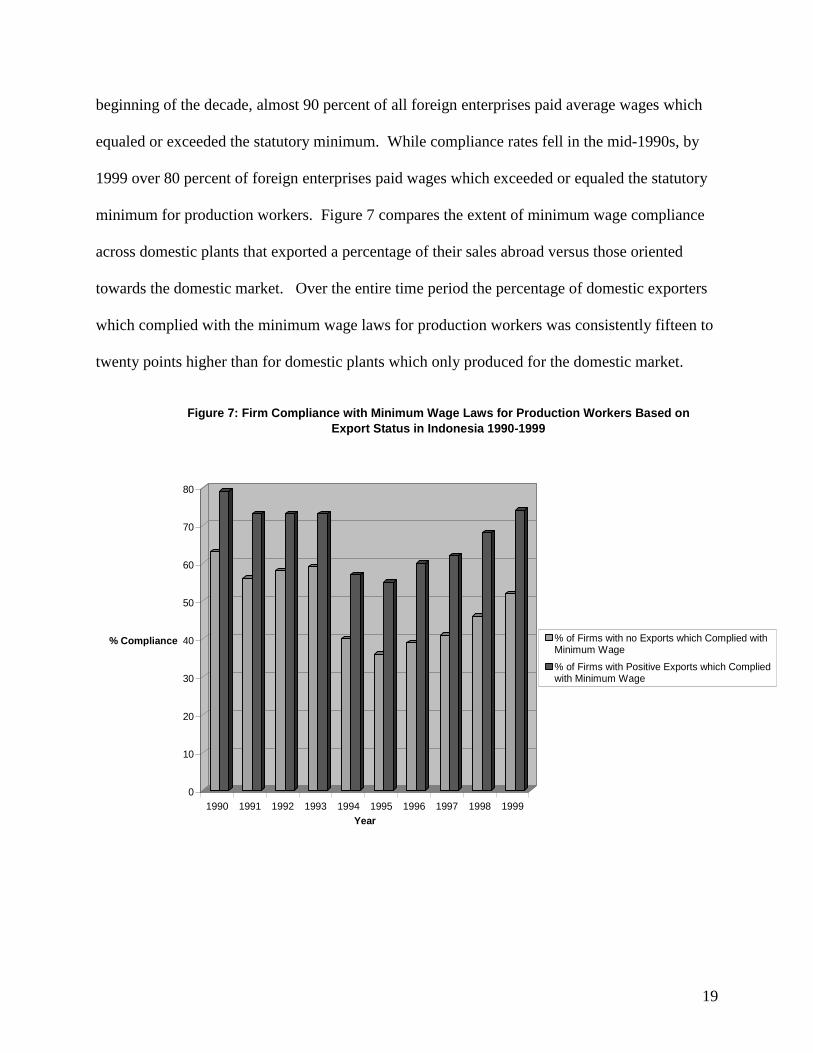
beginning of the decade, almost 90 percent of all foreign enterprises paid average wages which
equaled or exceeded the statutory minimum. While compliance rates fell in the mid-1990s, by
1999 over 80 percent of foreign enterprises paid wages which exceeded or equaled the statutory
minimum for production workers. Figure 7 compares the extent of minimum wage compliance
across domestic plants that exported a percentage of their sales abroad versus those oriented
towards the domestic market. Over the entire time period the percentage of domestic exporters
which complied with the minimum wage laws for production workers was consistently fifteen to
twenty points higher than for domestic plants which only produced for the domestic market.
0
10
20
30
40
50
60
70
80
% Compliance
1990 1991 1992 1993 1994 1995 1996 1997 1998 1999Year
Figure 7: Firm Compliance with Minimum Wage Laws for Production Workers Based on Export Status in Indonesia 1990-1999
% of Firms with no Exports which Complied withMinimum Wage
% of Firms with Positive Exports which Compliedwith Minimum Wage
20
Figures 6 and 7 confirm what is evident in Table 1: multinationals and exporters
generally pay higher wages, leading to higher rates of compliance with minimum wages.
Although comparing rates of compliance with minimum wage legislation is interesting, it does
not address the question of whether changes in minimum wages or anti-sweatshop activism led
to wage growth during this period. Rows 3 and 4 of Table 1 examine the change in wages
between 1990 and 1996 while in rows 5 and 6 we report the results in logs. Across all
enterprises, wages grew more quickly for domestic than for exporting or foreign enterprises.
While real wages for domestic enterprises increased by over thirty percent, real wages for
foreign or exporting enterprises grew less. Columns (4) through (6) present the “difference-in-
differences”, which is the difference in the change in wages across domestic, foreign and
exporting plants. The difference in difference between domestic and foreign or exporting
enterprises is generally negative and statistically significant, indicating faster wage growth for
domestically owned, non-exporting enterprises.
However, the story is completely different for firms producing textiles, footwear or
apparel (TFA). Table 1B decomposes the sample into TFA and non-TFA establishments. The
first three columns report average wages for domestic, foreign and exporting TFA plants, while
the last three columns report those same averages for non-TFA plants. Across domestic TFA and
non-TFA plants, wages are remarkably similar; although wages are slightly lower in TFA plants,
the difference is not statistically significant in 1990. These results are reassuring because they
suggest that the composition of workers across TFA and non-TFA plants was not much different.
However, both foreign and exporting enterprises paid their unskilled workers significantly less in
TFA plants than in other sectors. In 1990, workers in foreign TFA plants were paid half as much
as workers at other foreign plants; exporters in TFA plants paid their workers 30 percent less.
21
These large differences may have been one factor that contributed to the focus of anti-sweatshop
activists on workers in textiles, apparel, and footwear plants.
By 1996, the gap between TFA and non-TFA plants had narrowed considerably,
particularly among exporters. In 1996, the difference in wages between TFA and non-TFA
plants amounted to only 23 dollars per employee per year; the difference—computed in column
(9)—is not statistically significant. The gap between foreign and non-foreign wages also
narrowed, but by less: foreign firms continued to pay about 1,500,000 Rupiahs or 750 dollars
more per worker in total salary in1996 (see row 2, column (8)). Although domestic TFA and
non-TFA plants continued to pay similar wages, domestic TFA plants received smaller wage
increases than workers in other sectors. This suggests that the wage benefits from anti-
sweatshop activism were limited to workers in export-oriented or foreign-owned plants.
Rows (3) and (4) report the wage growth from 1990 to 1996 in levels; rows (5) and (6)
report the wage growth in logs. The difference-in-difference, ie the difference in wage growth
across TFA and non-TFA plants, is reported in columns (7), (8) and (9). The results show that
wage increases for textile and apparel workers were significantly higher in exporting and
foreign-owned establishments. Again, the only exception is for workers in domestic plants
selling only to the domestic market: in these plants, wages for TFA workers increased by 7
percentage points less than for unskilled workers in other sectors.
The results in Table 1 suggest very different patterns of wage growth for textile, apparel,
and footwear plants in the 1990s. While unskilled workers in other exporting and foreign owned
plants generally received smaller wage increases than the rest of the manufacturing labor force in
the 1990s, the opposite was true for workers in textiles and apparel factories. One likely reason
is that exporters and multinational firms outside of textiles and apparel factories already paid
22
higher wages and consequently did not have to increase wages as much to remain in compliance
with minimum wage legislation. However, in TFA plants, unskilled wages grew 30 to 40
percent in real terms between 1990 and 1996.
None of the means in Table 1 control for plant characteristics, which could possibly
explain differential wage growth. For example, wage growth could differ due to plant
characteristics such as changes in size, capital intensity, productivity growth, profitability, and
other factors. Wages could also differ due to differences in educational levels of workers. Table
2 presents the results of estimating equation (3). The dependent variable is the change in the log
wage between 1990 and 1996. The minimum wage gap is defined as the log of the minimum
wage in 1996 less the log of the plant’s initial wage for unskilled workers in 1990. If that
difference is negative, the gap is set equal to zero.
The first row includes only the ownership dummies defined as in Table 1, as well as the
minimum wage gap. We only include plants that were present in all years of the sample. The
results in the first row are consistent with the difference-in-differences presented in Table 1:
while wages in most foreign-owned or exporting plants did not increase faster than in other
plants, TFA employers were the exception. Controlling for the impact of minimum wage
changes, the results suggest that wages in foreign and exporting TFA plants grew 9 to 14 percent
faster than in other plants.
The coefficient on the minimum wage gap, .518, suggests that a 1 percent increase in the
gap led to a .518 percent increase in the real unskilled wage. Since the average gap between the
minimum wage in 1996 and the unskilled wage in 1990 was 50 percent, this implies that the
minimum wage increase was associated with a 25 percent real wage increase for unskilled
workers between 1990 and 1996. The coefficient on the minimum wage gap is robust to the
23
addition of a number of plant and region controls, as the results in column (6) indicate. It is
possible to add region controls because the minimum wage is set at a level more disaggregated
than that of the region: at the district level.
Rows (2) through (9) in Table 2 add a number of controls to the basic specification. In
the second row we add the alternative wage, which in the framework is defined as the wage the
plant would pay if it did not adhere to the minimum wage. We compute it as the average wage
paid by non-complying plants. It is calculated separately for foreign, exporting, and domestic
enterprises, and also varies by region. The third row adds a number of additional controls for
plant and worker characteristics, including log changes in real material inputs, the real value of
the reported capital stock, and size L (defined as the total number of employees). We also add
details on educational attainment for employees at the individual plant. In the years 1995
through 1997, the survey included questions regarding the educational attainment of the plant’s
labor force. The addition of plant characteristics and controls for educational attainment
increases the magnitude and significance of the coefficients on DFI*TFA or EXP*TFA. In the
third row, the coefficients suggest that real wages in TFA foreign and exporting plants increased
12 to 17 percentage points more than in other enterprises.
The next three rows add total factor productivity, technology expenditures, and output
growth. There are several alternative explanations for the increase in wages for exporters: First,
plants may have self-selected into exporting on the basis of higher productivity; previous studies
suggest that the more productive enterprises are most likely to export. Consequently, we redo
the analysis, controlling for plant-level productivity growth, using total factor productivity
growth (TFPG) as our measure of productivity. Second, exporting and foreign owned
enterprises might have experienced a positive demand shock relative to other enterprises. The
24
addition of productivity growth and output growth controls for this possibility. Third, wages in
foreign TFA plants might have increased due to investments in new technology; adding
technology expenditures in row (6) controls for this possibility. The results are robust to the
inclusion of all these controls.
The last two rows of Table 2 test whether (1) non-production worker wages responded in
the same way and (2) whether firms cut non-wage benefits to offset the higher wages induced by
minimum wage changes and activist pressure. We would expect small effects of activism on
non-production worker wages, which as we saw in Figure 1 were generally three to four times
higher than the minimum wage. The results in row (8) of Table 2 confirm that activist pressure
resulted in increases in unskilled worker wages but not in skilled worker wages. This suggests
that the observed increase in wages is not associated with a sector-specific positive output shock,
which would affect wages for both skilled and unskilled workers. Finally, the last row of Table
2 shows that firms did not compensate for higher wages by cutting non-wage benefits. The
dependent variable includes all non-wage compensation paid to production workers. The results
show no impact of ownership on these factors.
Table 3 presents additional robustness tests. We repeat most of the specifications
reported in Tables 2 using annual changes in wages, the minimum wage gap, and the other
controls. We report the results for four sets of plants: (1) all enterprises with available data (2)
the balanced sample, which includes enterprises with data from 1990 through 1996 (3) entrants,
defined as plants appearing after the start date and (4) exiters, defined as plants leaving the
sample before the end date. The first-difference results are consistent with the long differences
reported in Table 2. Real wage growth for TFA exporters is on average 4 percentage points
higher per year than for other enterprises. This is true for both new entrants as well as surviving
25
plants. The only exception is exiting plants. Plants that exit the sample are less likely to respond
to both minimum wage pressures and to anti-sweatshop activism.
In rows (4) through (8), we extend the sample back to 1988. This extension is imperfect
since there is no data on export status before 1990. To address the lack of information on export
status prior to 1990 we assumed that firms in 1988 had the same status as in 1990. The results
are consistent with the 1990-1996 sample, but we expand the sample by nearly 20,000
observations. The higher annual growth rate of wages for TFA exporters translates to a higher
growth of real wages of about 20 to 25 percent over a six year period.
In rows (9) through (12), we redefine the minimum wage gap as equal to the district-level
log change in the minimum wage between 1990 and 1996. The advantage of this specification is
that it removes the lagged wage from the right-hand side, which could lead to possible
simultaneity biases since the dependent variable is defined as the change in the log wage. The
disadvantage of this specification, however, is that we cannot account for the fact that plants with
wages further from the legislated minimum wage are more likely to increase wages in order to
comply with the new legislation. The results are entirely consistent with the other specifications,
showing large effects of the minimum wage increase on wages and showing that TFA exporting
plants enterprises experienced wage increases relative to non-TFA plants.
Rows (13) through (20) report the same extensions as the last two rows in Table 2, using
annual data. Again, there is no evidence that other benefits were cut in order to meet the higher
labor standards for unskilled workers. Nor is there any evidence that these effects extended to
skilled workers, which we identify as non-production workers in the sample. Both the
minimum wage changes and the anti-sweatshop campaigns had no significant impact on the
wages of skilled workers. The results for non-production workers provides evidence against the
26
claim that TFA sectors simply experienced a positive output or price shock; if this were true, we
would expect the benefits to also extend to skilled workers.
In rows (20) through (28) we divide the sample into large and small enterprises, where
large enterprises are those defined as having more than 25 workers at the beginning of the
sample period. Small plants—those with 25 or fewer employees--could be considered part of the
informal sector and are generally less likely to adhere to minimum wage legislation or other
labor standards. The results confirm that smaller plants were less affected by the minimum wage
increase than larger plants: the coefficient on the minimum wage gap is about 1/3 smaller for
small plants. In addition, it appears that the benefits of anti-sweatshop activism were
concentrated on large plants. While large TFA exporters show wage gains of five percent per
year in real terms between 1990 and 1996—leading to a 25 percent gain over the period—
workers in small plants experienced no such gains.
The results in Tables 1 through 3 suggest that wages increased systematically more for
exporting TFA plants than for other similar plants. In addition to the 25 percent increase in real
wages induced by the minimum wage changes, real wages rose an additional twenty to twenty
five percent more between 1990 and 1996 for TFA exporters. This suggests that combined
effects of the minimum wage legislation and the anti-sweatshop campaigns led to up to a 50
percent increase in real wages and a 100 percent increase in nominal wages for unskilled workers
in targeted exporting plants (see Appendix Table 1.A for real versus nominal values). Below, we
explore whether these wage gains resulted in employment losses or led plants to shut down
operations in Indonesia.
IV. Employment and Exit in Indonesia
27
Employment The orthodox approach to minimum wages suggests that an increase in
mandated wages should lead to a fall in employment, as employers are driven up their labor
demand curve. Prior to the 1990s, standard textbook treatments of minimum wages reported that
imposing a wage floor would lead to adverse consequences for employment. However, a series
of influential studies (1994, 1995) published by David Card and Alan Krueger in the 1990s has
reopened the debate on the employment effects of minimum wages. In their book, Myth and
Measurement: The New Economics of the Minimum Wage, Card and Krueger argue that the
imposition of a minimum wage need not have negative employment consequences if there are
imperfections in the labor market. These imperfections include the following possibilities: (1)
the existence of monopsony employers (2) search costs for employers and (3) efficiency wages.
If any of these three imperfections characterize the local labor market, an increase in the
minimum wage (or an increase in compliance with the existing minimum wage) could lead to an
increase or no change in employment. Card and Krueger document their claim with a series of
papers which examine exogenous increases in minimum wages across US states.
This unorthodox finding, which has caused an enormous debate among labor economists,
has interesting implications for labor market policies in developing countries. If policy makers
can raise wages by increasing the statutory minimum or encouraging compliance with the
existing minimum without increasing unemployment, then minimum wage policies could
become a powerful tool for combating poverty. This was precisely the thinking behind a 1995
World Bank Report which strongly recommended the introduction of a national minimum wage
to reduce poverty in Trinidad and Tobago.
One consequence of this debate in the United States has been to encourage a number of
new studies on the impact of minimum wages on employment in developing countries. Strobl
28
and Walsh (2000) examine the impact of a national minimum wage introduced in Trinidad and
Tobago in 1998, Bell (1997) examines the impact of minimum wages in Columbia and Mexico,
and Maloney and Nunez (2000) examine the impact of minimum wages in eight Latin American
countries. Three studies--Rama (1999), SMERU (2001), and Alatas and Cameron (2003)--
examine the impact of the rising minimum wage on employment in Indonesia.
The results are mixed. For example, Bell (1997) finds that minimum wages in Columbia
led to employment declines, while the minimum wage in Mexico had no impact on employment.
Strobl and Walsh (2000) find inconclusive effects for Trinidad and Tobago, in part because the
minimum wage was not enforced. All these studies, using primarily labor force data but also
plant-level data, uncover widespread evidence of lack of compliance. In Honduras, for example,
which has a very high minimum wage relative to average wages, the minimum wage appears to
have had no impact on the wage distribution.
The most recent study, by Alatas and Cameron (2003), uses the most sophisticated
approach in its effort to identify the impact of the rising minimum wage on employment in
Indonesia. Using a difference-in-difference approach, the authors seek to examine whether
employment in the textile and apparel sector fell as a result of the minimum wage. Following
Card and Krueger (1994) they exploit the large geographic variation in the rate of increase in the
mandated minimum wage and compare changes in employment on either side of the Jakarta-
West Java border. Comparing similar types of enterprises, they examine the employment impact
of the minimum wage using the same census data as we use in this study, but they focus
exclusively on firms in the clothing, textiles, leather and footwear industries. They find no
employment impact for large firms—foreign or domestic.
29
In Table 4, we again use the difference-in-differences (DID) approach adopted by Card
and Krueger (1995) to examine the impact of minimum wages on employment in Indonesia. We
focus on the changes in employment between 1990 and 1996, which was the period of the large
rise in both the magnitude and compliance with the minimum wage. The first column reports the
number of production workers in 1990 and in 1996, and the difference between 1990 and 1996.
The third row reports the difference for all plants, while the fourth row reports the difference in
employment between 1990 and 1996 only for plants with data on employment in both years.
Across domestic enterprises, the mean number of employees fell slightly, from an average of 69
employees per plant to an average of 67 employees per plant. Columns (2) and (3) show that
employment growth for unskilled workers was concentrated in foreign-owned and exporting
enterprises. Between 1990 and 1996, average unskilled employment increased from 360 workers
to 507 workers per plant for foreign enterprises. For exporters, plants which remained in the
sample the whole period gained 200 employees on average, while those that entered later or
exited the sample lost employees. For the balanced sample, reported in rows (4) and (6),
employment gains were significantly higher among the foreign owned and exporting enterprises.
Across all enterprises (reported in rows 3 and 5), domestic plants lost employment while foreign
plants gained employment.
The bottom half of Table 4 reports those same differences for TFA and non-TFA plants.
As in the earlier DID calculations, columns (7) through (9) report the “difference-in-differences”,
which is the difference in the change in employment across TFA and non-TFA firms between
1990 and 1996. As indicated in the bottom half of Table 4, the difference-in-differences is
positive, suggesting that compared to the change in employment across other types of enterprises
between 1990 and 1996, the change in employment for exporting or foreign TFA plants was
30
larger. Focusing on rows (3) and (4) and columns (8) and (9), we see that exporting and foreign
TFA plants increased employment by 300 to 400 workers more than other plants. The results in
Table 4 suggest that increased vigilance vis-à-vis textiles and apparel enterprises did not appear
to hurt their employment, at least relative to growth in employment of other types of enterprises.
Table 5 repeats the analysis in a regression context. With or without controls, the results
are consistent across specifications. There is no evidence that the differential wage increases
among TFA multinationals and exporters led to employment declines. The coefficients on
FOR*TFA and EXP*TFA are consistently positive, although they are not statistically significant.
Consistent with Table 4, the coefficient on FOR alone is significant and positive in rows (1) and
(2), before we add proxies for positive productivity and output shocks. There is no evidence that
higher wage growth negatively affected employment in foreign enterprises, exporting
enterprises, or textiles and apparel producers. In fact, it is clear from the tables that employment
growth was significantly higher for exporters and foreign enterprises, as well as for textiles and
apparel plants. These results are consistent with Alatas and Cameron (2003).
However, the results in Table 5 show a robust and negative impact of the minimum wage
increase on employment growth. Without adding controls, the coefficient on the minimum wage
gap is -.041, which suggests that a 100 percentage point increase in the minimum wage gap
would be accompanied by a 4 percentage point decline in employment. In rows (8) and (9),
where we define the minimum wage gap alternatively as a zero-one variable and as the
percentage increase in the district-level minimum wage, we also show large negative effects of
the minimum wage increase on employment, ranging from 9 to 12 percent. Plants paying wages
in 1990 below the 1996 minimum wage lost on average 9 percent of their employees, after
controlling for other determinants of employment growth. These are large effects that need to be
31
seriously considered in any campaign to increase the mandated minimum wage or to increase
compliance with the minimum wage. Indonesia, however, is an unusual case: most countries do
not experience 100 percent real increases in the value of the minimum wage over a five year
period.
As a final check, we redo the analysis of employment using annual data instead of the long
differenced panel. The results are reported in the last 4 rows of Table 5. We again report the
results using all firms as well as the balanced sample, entrants, and exiters. As before, there are
no significant effects of anti-sweatshop activism on employment changes from year to year. The
negative and significant impact of the minimum wage on employment is consistent with the long
difference results, suggesting a fall in employment of almost one percentage point per year due
to minimum wage increases alone.
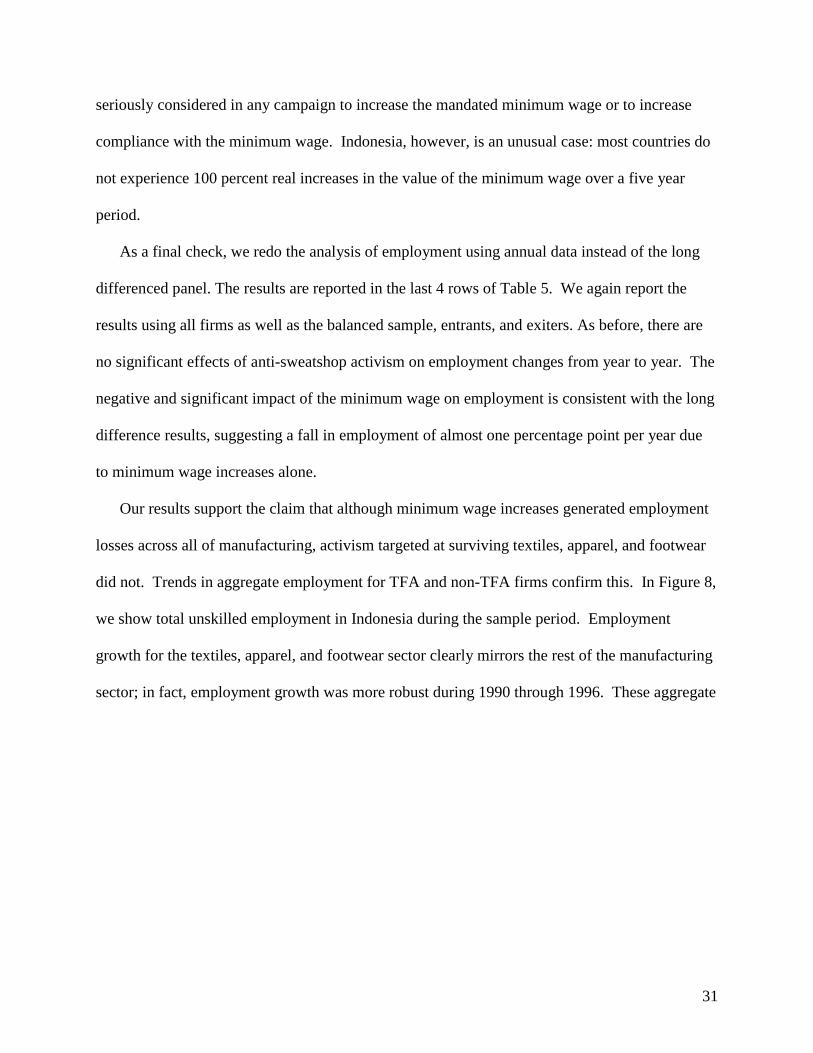
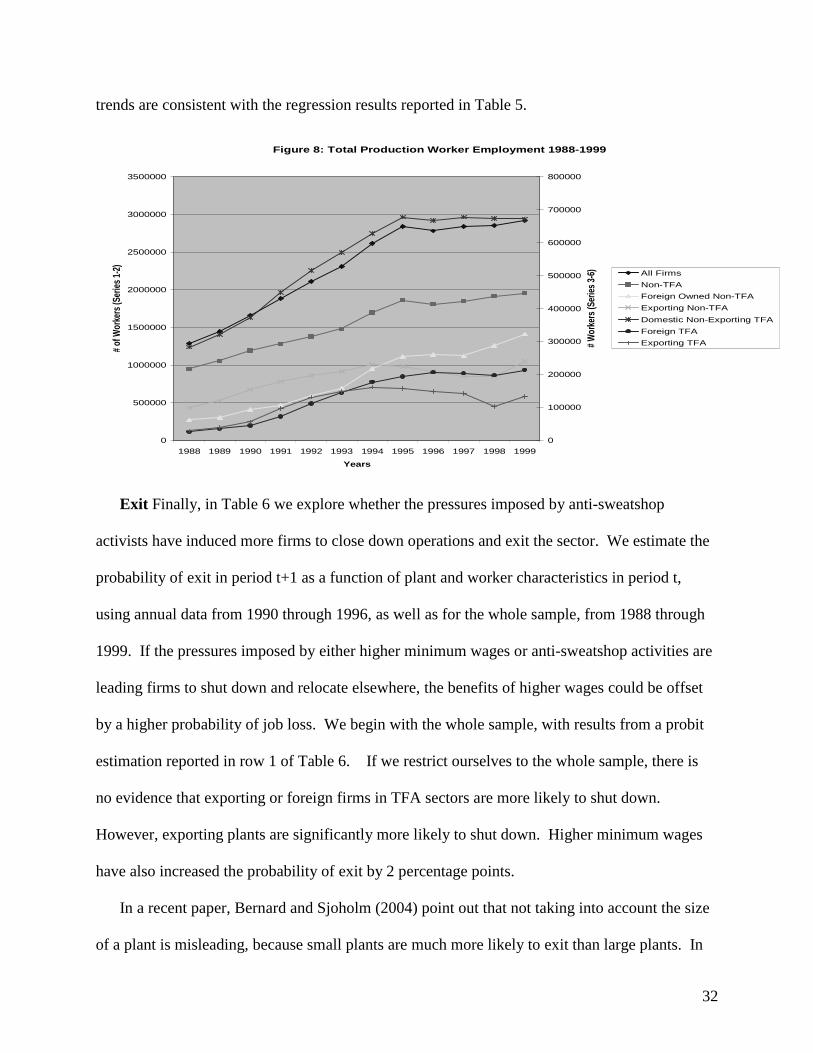
Our results support the claim that although minimum wage increases generated employment
losses across all of manufacturing, activism targeted at surviving textiles, apparel, and footwear
did not. Trends in aggregate employment for TFA and non-TFA firms confirm this. In Figure 8,
we show total unskilled employment in Indonesia during the sample period. Employment
growth for the textiles, apparel, and footwear sector clearly mirrors the rest of the manufacturing
sector; in fact, employment growth was more robust during 1990 through 1996. These aggregate
32
trends are consistent with the regression results reported in Table 5.
Figure 8: Total Production Worker Employment 1988-1999
0
500000
1000000
1500000
2000000
2500000
3000000
3500000
1988 1989 1990 1991 1992 1993 1994 1995 1996 1997 1998 1999
Years
# of
Wor
kers
(Ser
ies
1-2)
0
100000
200000
300000
400000
500000
600000
700000
800000
# W
orke
rs (S
erie
s 3-
6) All Firms
Non-TFA
Foreign Owned Non-TFA
Exporting Non-TFA
Domestic Non-Exporting TFA
Foreign TFA
Exporting TFA
Exit Finally, in Table 6 we explore whether the pressures imposed by anti-sweatshop
activists have induced more firms to close down operations and exit the sector. We estimate the
probability of exit in period t+1 as a function of plant and worker characteristics in period t,
using annual data from 1990 through 1996, as well as for the whole sample, from 1988 through
1999. If the pressures imposed by either higher minimum wages or anti-sweatshop activities are
leading firms to shut down and relocate elsewhere, the benefits of higher wages could be offset
by a higher probability of job loss. We begin with the whole sample, with results from a probit
estimation reported in row 1 of Table 6. If we restrict ourselves to the whole sample, there is
no evidence that exporting or foreign firms in TFA sectors are more likely to shut down.
However, exporting plants are significantly more likely to shut down. Higher minimum wages
have also increased the probability of exit by 2 percentage points.
In a recent paper, Bernard and Sjoholm (2004) point out that not taking into account the size
of a plant is misleading, because small plants are much more likely to exit than large plants. In
33
particular, they point out that in the Indonesian data, plants with less than 20 workers were
eliminated from the sample after 1989, which could lead us to conclude that exporters and
foreign plants are less likely to exit because they are significantly larger than other plants. To
address this possibility, in the second row we only include plants with at least 100 workers.
Although most of the coefficients are unaffected, the coefficient on exporting TFA firms does
increase in magnitude and becomes statistically significant, indicating that these firms have a 2
percent higher probability of exiting the sample. Minimum wages have about the same impact,
raising exit probabilities significantly.
If we expand the sample to include data from 1988 to 1999, we continue to find the
following: although foreign owned plants are less likely to exit the sample, exporters are
significantly more likely to exit. Interestingly, our results contradict Bernard and Sjoholm
(2004), who find that foreign plants in Indonesia are more footloose than other plants. Our
results suggest the opposite: foreign plants are less footloose. This could be because the number
of foreign enterprises in Indonesia in the 1980s—Bernard and Sjoholm examine data which ends
in 1989—was small and consequently a few plants could lead to large rates of entry and exit.
Our data focuses on the 1990s, when there were more foreign plants in Indonesia.
In general, large exporters are 5 percentage points more likely to exit than other large firms.
TFA exporters are even more likely to exit, with an increased probability of exit equal to 4 to 5
percentage points, similar to the impact of the higher minimum wage. Since on average about 10
percent of the sample exits each year, this implies that exporting and engaging in textiles,
apparel, and footwear production doubles that probability. (see Figure 10 for a visual
representation). However, it is important to note that these larger exit probabilities are limited to
plants with more than 100 employees. Since there is clearly a non-random probability of exit
34
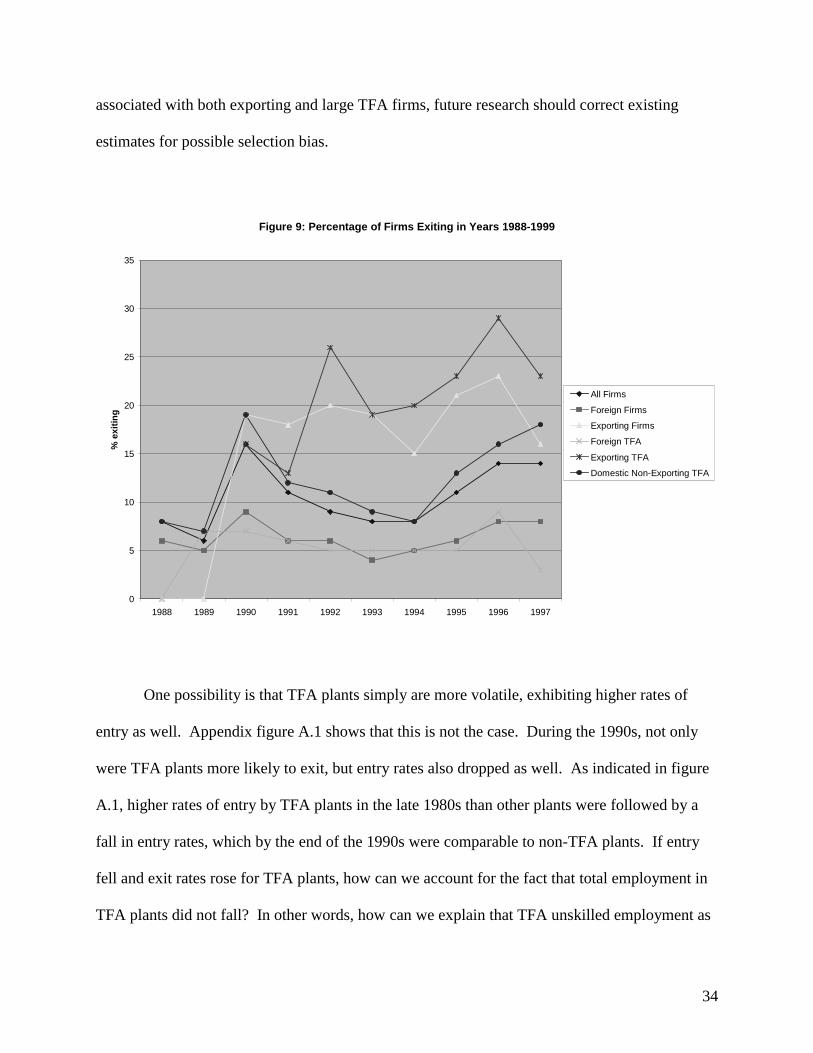
associated with both exporting and large TFA firms, future research should correct existing
estimates for possible selection bias.
Figure 9: Percentage of Firms Exiting in Years 1988-1999
0
5
10
15
20
25
30
35
1988 1989 1990 1991 1992 1993 1994 1995 1996 1997
% e
xiti
ng
All Firms
Foreign Firms
Exporting Firms
Foreign TFA
Exporting TFA
Domestic Non-Exporting TFA
One possibility is that TFA plants simply are more volatile, exhibiting higher rates of
entry as well. Appendix figure A.1 shows that this is not the case. During the 1990s, not only
were TFA plants more likely to exit, but entry rates also dropped as well. As indicated in figure
A.1, higher rates of entry by TFA plants in the late 1980s than other plants were followed by a
fall in entry rates, which by the end of the 1990s were comparable to non-TFA plants. If entry
fell and exit rates rose for TFA plants, how can we account for the fact that total employment in
TFA plants did not fall? In other words, how can we explain that TFA unskilled employment as

35
a percentage of total manufacturing employment increased at the same time that exit became
proportionately higher? The reason, as shown in Table 4, is that remaining TFA plants--
particularly exporters and foreign-owned plants—increased unskilled employment by as much as
fifty percent. Employment increases within surviving plants compensated for higher exit by
some TFA enterprises.
Finally, in Table 7 we test whether higher wages for exporting TFA plants are due to
higher compliance with the minimum wage. The results presented in Table7A suggest that all of
the differences in wage growth between TFA exporters and others is due to higher compliance
with the minimum wage. To show this, we add an interaction between the minimum wage and
ownership. This allows for differential effects of minimum wage changes on wage growth. This
is likely if, as we documented earlier in the paper, compliance differs dramatically across
ownership classes. In both the long differences and the annual wage changes, we show that all
of the higher wage growth for TFA exporters is due to higher compliance with the minimum
wage. In fact, the long differences show that while on average a 1 percent increase in the
minimum wage gap led to a .5 percent increase in wages, for exporting TFA enterprises the
minimum wage increase led to a one-for-one increase in the plant wage.
In Table 7B we explore to what extent the higher exit probabilities for exporting TFA
plants can be traced to higher compliance with the minimum wage. There is no evidence that
TFA exporters were more likely to exit because they paid their unskilled workers higher wages.
Using three different measures of wage growth, we are unable to find any relationship between
exit and higher wages. Although the higher wages paid by TFA exporters are clearly linked to
higher compliance with the minimum wage laws, there is no evidence that these higher
compliance rates are associated with the higher observed exit probabilities.
36
V. Conclusion
During the 1990s, human rights and anti-sweatshop activists increased their efforts to
improve working conditions and raise wages for workers in developing countries. These
campaigns took many different forms: direct pressure to change legislation in developing
countries, pressure on firms, newspaper campaigns, and grassroots organizing. This paper
analyzes the impact of two different types of interventions on labor market outcomes in
Indonesian manufacturing: (1) direct US government pressure and (2) anti-sweatshop
campaigns. The results suggest that direct pressure from the US government in the form of
threatening to withdraw GSP privileges, which contributed to a doubling of the minimum wage,
resulted in a 25 percent increase in real wages for unskilled workers between 1990 and 1996.
We examine the impact of anti-sweatshop campaigns using a difference-in-difference approach.
Unskilled real wages increased by an additional 10 to 20 percent for exporters and multinational
plants in sweatshop industries, defined as textiles, footwear, and apparel (TFA), than in other
similar plants.
The combined effects of the minimum wage legislation and the anti-sweatshop
campaigns led to a 50 percent increase in real wages and a 100 percent increase in nominal
wages for unskilled workers at targeted exporting plants. One question which naturally arises is
how this could possibly be achieved without adverse consequences for employment. If firms are
operating in a competitive environment, then mandated cost increases should naturally lead them
to reduce their workforce or shut down and relocate elsewhere. However, it is important to keep
in mind that for a well-known brand name such as Nike, labor costs from developing country
37
factories in 1998 only accounted for about 4 percent of the total cost of a ninety dollar shoe.9 To
the extent that there existed imperfect competition or inelastic demand, firms could have
accepted higher labor costs without reducing employment or relocating factories elsewhere.
This study then examines whether these higher wages led firms to cut employment or
shut down operations. Our results suggest that the minimum wage increases led to employment
losses of as much as 10 percentage points for unskilled workers across all sectors in
manufacturing. Textiles, apparel, and footwear exporters were also significantly more likely to
leave Indonesia after 1990. Surprisingly, however, anti-sweatshop activism did not have
significant adverse effects on employment. How can we explain that TFA unskilled employment
increased at the same time that many firms were relocating elsewhere? The reason is that
remaining TFA plants--particularly exporters and foreign-owned plants—increased unskilled
employment by as much as fifty percent. We also find that foreign plants both inside and
outside of sweatshop industries were less likely to close down, contradicting recent evidence
which suggests that they are more footloose than other firms. The message is a mixed one:
activism significantly improved wages for the lowest paid workers in Indonesian manufacturing,
but may also have encouraged exporters to relocate elsewhere.
9 Here is the link to an interview that is no longer contained on Nike's webpage: http://cbae.nmsu.edu/~dboje/NIKfaqcompensation.html The interview is from 1998, and we checked into it's original URL source. We found the URL was valid, but Nike redesigned its website, and what's found from this link has been removed.
38
Bibliography
Aitken, Brian, Ann Harrison and Robert Lipsey, "Wages and Foreign Ownership: A Comparative
Study of Mexico, Venezuela, and the United States", Journal of International Economics, May 1996, Vol. 40, Nos. 3/4, pages 345-371.
Alatas, Vivi and Lisa Cameron, “The Impact of Minimum Wages on Employment in a Low Income
Country: An Evaluation using the Difference-in-Differences Approach”, World Bank Policy Research Working Paper 2985, March 2003.
Ashenfelter, Orley and Smith, Robert S, “Compliance with Minimum Wage Law”, The Journal of Political Economy, April 1979, Vol. 87, No. 2, pages 333-350. Bell, Linda (1997), “The Impact of Minimum Wages in Mexico and Columbia”, Journal of Labor Economics, 15(3), pt.2., pp. S102-S135. Bernard, Andrew, and Fredrik Sjoholm, (2004), “Foreign Onwers and Plant Survival”, NBER Working Paper Number 10039. Card, David. and Alan Krueger (1994), “Minimum Wages and Employment: A Case Study of the Fast- Food Industry in New Jersey and Pennsylvania”, American Economic Review, 84(4), September, pp 772-793. Chau, Nancy H. and Kanbur, Ravi, “The Adoption of International Labor Standard Conventions: Who,
When, and Why?” in Brookings Trade Forum 2001 (Rodrik, Dani and Collins, Susan M. eds), The Brookings Institution, Washington D.C., 2002.
Currie, Janet and Ann Harrison, “Sharing the Costs: The Impact of Trade Reform on Capital and Labor in Morocco”, The Journal of Labor Economics, 1997, Vol 15, No. 3. Edmonds, Eric and Nina Pavcnik, “Does Globalization Increase Child Labor? Evidence from Vietnam”,Working Paper, Dartmouth College, 2001. Elliott, Kimberly Ann (1998a), “Preferences for Workers? Worker Rights and the US Generalized System of Preferences”, Institute for International Economics. Elliott, Kimberly Ann (1998b), “International Labor Standards and Trade: What Should Be Done?” in Launching New Global Trade Talks: An Action Agenda, Jeffrey Schott, editor. Washington: Institute for International Economics Elliott, Kimberly Ann and Richard Freeman (2003), CWCan Labor Standards Improve Under Globalization? Washington, DC: Institute for International Economics.
39
Eskeland, Gunnar, and Ann Harrison, “Moving to Greener Pastures? Multinationals and the Pollution Haven Hypothesis”, Journal of Development Economics, 2003. Harrison, Ann and Scorse, Jason, “Do Foreign Firms Pay More: Evidence from the Indonesian Manufacturing Sector 1990-1999”, Working Paper, UC-Berkeley, 2003. Maloney, William F. and Jairo Nunez, “Minimum Wages in Latin America”, World Bank Working Paper, 2000. Maskus, Keith, “Should Core Labor Standards be Imposed Through International Trade Policy?”, Working Paper, World Bank, 1996. Rama, Martin, “The Consequences of Doubling the Minimum Wage: The Case of Indonesia”, World Bank working Paper, 1996. SMERU Research Report, Wage and Employment Effects of Minimum Wage Policy in the Indonesian Urban Labor Market, SMERU Research Report, SMERU Research Institute, Indonesia, October 2001. Strobl, Eric and Frank Walsh, “Minimum Wages and Compliance: The Case of Trinidad and Tobago”, University College Dublin, Working Paper, 2000. Udomsaph, Charles, “Premiums to Employment in Establishments with Foreign Direct Investment: Evidence from Thai manufacturing”, Working Paper, UC-Berkeley, 2002.
40
Table 1A: Average Production Worker Wages per Establishment in 1990 and 1996 In Thousands of 1996 Indonesian Rupiahs (Standard Errors in ())
Ownership Status Difference
Domestic (a) Always
Foreign (b) Always
Exporting (c) (2) – (1) (3)-(1) (2)-(3)
(1) (2) (3) (4) (5) (6) 1. Mean Wage in 1990, All Available Observations
1123.3 (11.1)
3270.3 (157.3)
1831.8 (85.0)
2146.9 (62.7)
708.5 (47.7)
1438.4 (164.2)
2. Mean Wage in 1996, All Available Observations
1532.5 (12.3)
3495.1 (113.3)
2115.0 (48.0)
1962.7 (54.3)
582.5 (36.5)
1380.1 (104.9)
3. Change in Mean Wage, 1990-1996
409.2 (17.1)
224.9 (203.0)
283.2 (96.2)
-184 (62.7)
-126 (47.7)
-58 (164.3)
4. Change in Mean Wage, Balanced Sample (d)
370.2 (22.8)
776.1 (273.3)
302.9 (111.5)
405.9 (81.1)
-67.3 (54.3)
473.2 (194.1)
5. Mean Change in Log Wage, 1990-1996
.36 (.01)
.11 (.05)
.18 (.03)
-.25 (.04)
-.18 (.03)
-.07 (.05)
6. Mean Change in Log Wage, Balanced Sample (d)
.30 (.02)
.24 (.06)
.20 (.04)
-.06 (.04)
-.1 (.03)
.04 (.05)
Table 1B: Production Worker Wages: Separating Out Textiles, Footwear, and Apparel (TFA)
Textiles, Apparel, and Footwear Establishments
Other Establishments Difference
Domestic (a)
Always Foreign
(b)
Always Exporting
(c)
Domestic (a)
Always Foreign
(b)
Always Exporting
(c) (1)-(4) (2)-(5) (3)-(6)
(1) (2) (3) (4) (5) (6) (7) (8) (9) 1. Mean Wage in 1990, All Observations
1078.2 (15.5)
1775.1 (112.1)
1462.4 (122.8)
1134.2 (13.2)
3560.8 (182.1)
1934.6 (102.7)
56.0 (27.9)
-1805.6 (419.1)
-472.2 (205.2)
2. Mean Wage in 1996, All Observations
1441.2 (19.6)
2268.8 (79.2)
2079.2 (100.0)
1552.4 (14.4)
3798.6 (137.8)
2125.2 (54.6)
-111.1 (32.1)
-1529.7 (280.0)
-46.0 (115.6)
3. Change in Mean Wage, 1990-1996
363.0 (25.7)
513.7 (151.2)
616.8 (187.1)
418.1 (20.2)
237.8 (241.1)
190.6 (111.2)
-54.9 (36.7)
275.9 (497.6)
426.2 (188.5)
4. Change in Mean Wage Wage, Balanced
349.4 (33.4)
740.1 (196.3)
474.2 (170.0)
374.7 (26.6)
814.9 (318.8)
259.4 (135.2)
-25.3 (47.4)
-74.8 (497.6)
214.8 (188.5)
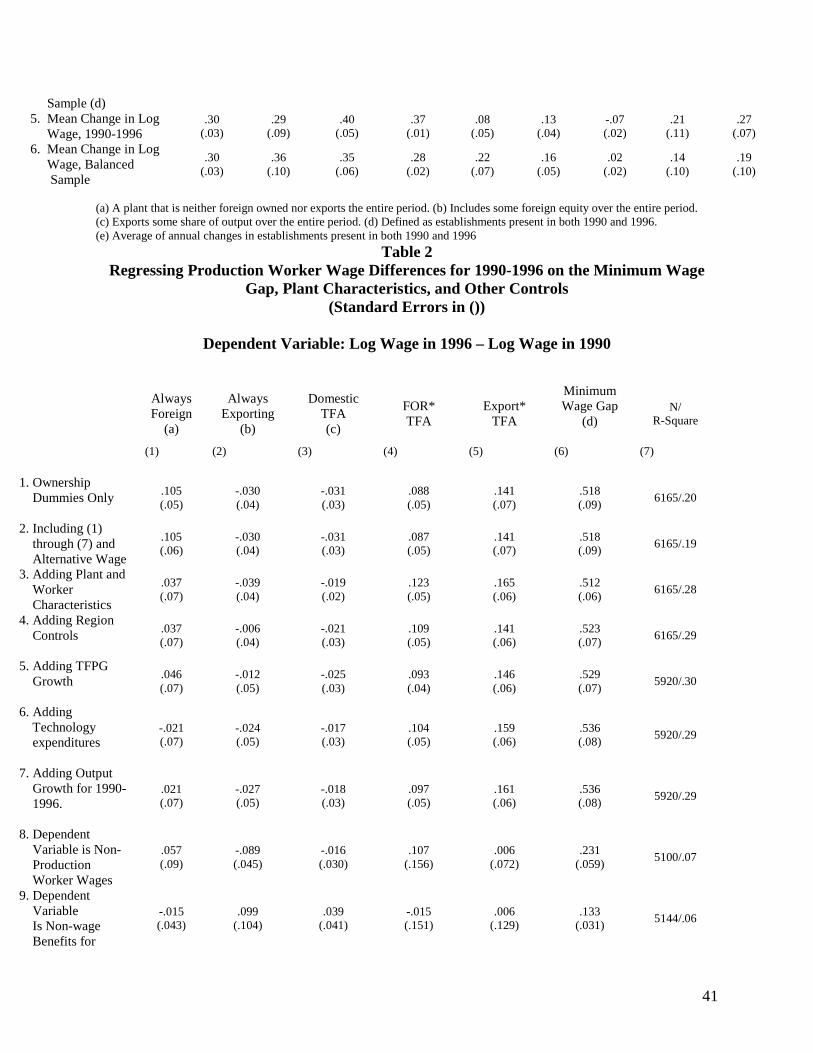
41
Sample (d) 5. Mean Change in Log Wage, 1990-1996
.30 (.03)
.29 (.09)
.40 (.05)
.37 (.01)
.08 (.05)
.13 (.04)
-.07 (.02)
.21 (.11)
.27 (.07)
6. Mean Change in Log Wage, Balanced Sample
.30 (.03)
.36 (.10)
.35 (.06)
.28 (.02)
.22 (.07)
.16 (.05)
.02 (.02)
.14 (.10)
.19 (.10)
(a) A plant that is neither foreign owned nor exports the entire period. (b) Includes some foreign equity over the entire period. (c) Exports some share of output over the entire period. (d) Defined as establishments present in both 1990 and 1996. (e) Average of annual changes in establishments present in both 1990 and 1996
Table 2 Regressing Production Worker Wage Differences for 1990-1996 on the Minimum Wage
Gap, Plant Characteristics, and Other Controls (Standard Errors in ())
Dependent Variable: Log Wage in 1996 – Log Wage in 1990
Always Foreign
(a)
Always Exporting
(b)
Domestic TFA (c)
FOR* TFA
Export* TFA
Minimum Wage Gap
(d)
N/ R-Square
(1) (2) (3) (4) (5) (6) (7)
1. Ownership Dummies Only
.105 (.05)
-.030 (.04)
-.031 (.03)
.088 (.05)
.141 (.07)
.518 (.09)
6165/.20
2. Including (1) through (7) and Alternative Wage
.105 (.06)
-.030 (.04)
-.031 (.03)
.087 (.05)
.141 (.07)
.518 (.09)
6165/.19
3. Adding Plant and Worker Characteristics
.037 (.07)
-.039 (.04)
-.019 (.02)
.123 (.05)
.165 (.06)
.512 (.06)
6165/.28
4. Adding Region Controls
.037 (.07)
-.006 (.04)
-.021 (.03)
.109 (.05)
.141 (.06)
.523 (.07)
6165/.29
5. Adding TFPG Growth
.046 (.07)
-.012 (.05)
-.025 (.03)
.093 (.04)
.146 (.06)
.529 (.07)
5920/.30
6. Adding Technology expenditures
-.021 (.07)
-.024 (.05)
-.017 (.03)
.104 (.05)
.159 (.06)
.536 (.08)
5920/.29
7. Adding Output Growth for 1990- 1996.
.021 (.07)
-.027 (.05)
-.018 (.03)
.097 (.05)
.161 (.06)
.536 (.08)
5920/.29
8. Dependent Variable is Non- Production Worker Wages
.057 (.09)
-.089 (.045)
-.016 (.030)
.107 (.156)
.006 (.072)
.231 (.059)
5100/.07
9. Dependent Variable Is Non-wage Benefits for
-.015 (.043)
.099 (.104)
.039 (.041)
-.015 (.151)
.006 (.129)
.133 (.031)
5144/.06
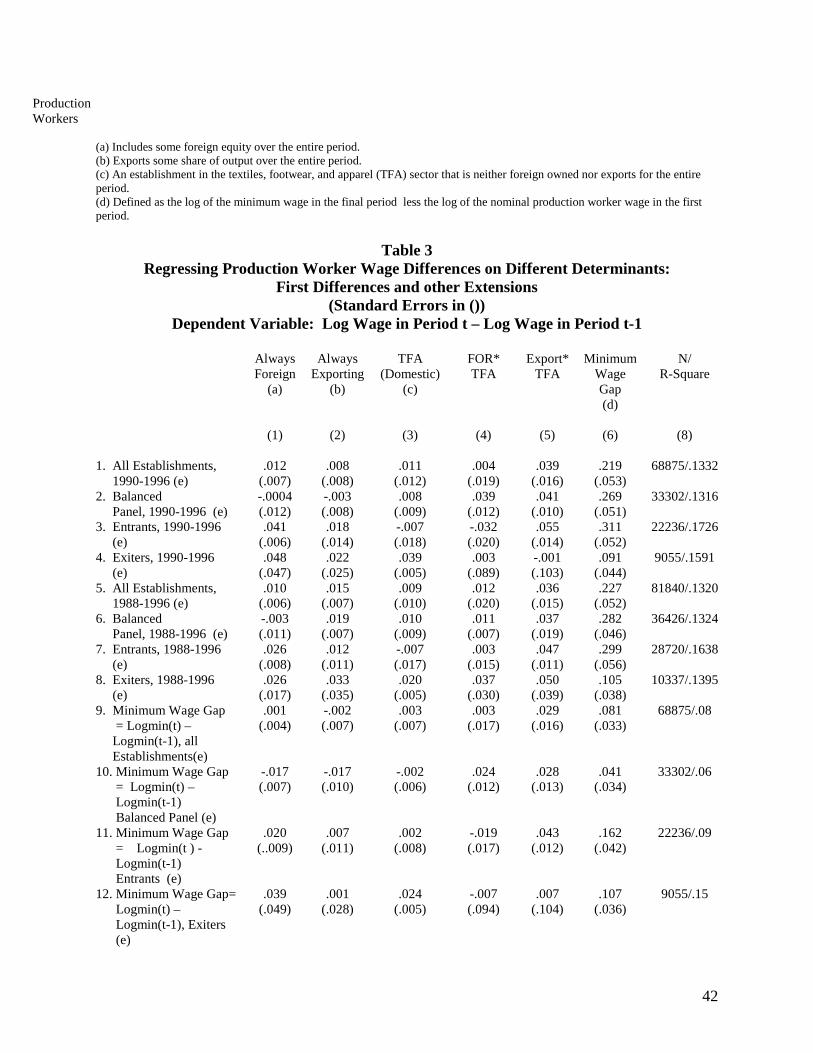
42
Production Workers
(a) Includes some foreign equity over the entire period. (b) Exports some share of output over the entire period. (c) An establishment in the textiles, footwear, and apparel (TFA) sector that is neither foreign owned nor exports for the entire period. (d) Defined as the log of the minimum wage in the final period less the log of the nominal production worker wage in the first period.
Table 3
Regressing Production Worker Wage Differences on Different Determinants: First Differences and other Extensions
(Standard Errors in ()) Dependent Variable: Log Wage in Period t – Log Wage in Period t-1
Always Foreign
(a)
Always Exporting
(b)
TFA (Domestic)
(c)
FOR* TFA
Export* TFA
Minimum Wage Gap (d)
N/ R-Square
(1) (2) (3) (4) (5) (6) (8)
1. All Establishments, 1990-1996 (e)
.012 (.007)
.008 (.008)
.011 (.012)
.004 (.019)
.039 (.016)
.219 (.053)
68875/.1332
2. Balanced Panel, 1990-1996 (e)
-.0004 (.012)
-.003 (.008)
.008 (.009)
.039 (.012)
.041 (.010)
.269 (.051)
33302/.1316
3. Entrants, 1990-1996 (e)
.041 (.006)
.018 (.014)
-.007 (.018)
-.032 (.020)
.055 (.014)
.311 (.052)
22236/.1726
4. Exiters, 1990-1996 (e)
.048 (.047)
.022 (.025)
.039 (.005)
.003 (.089)
-.001 (.103)
.091 (.044)
9055/.1591
5. All Establishments, 1988-1996 (e)
.010 (.006)
.015 (.007)
.009 (.010)
.012 (.020)
.036 (.015)
.227 (.052)
81840/.1320
6. Balanced Panel, 1988-1996 (e)
-.003 (.011)
.019 (.007)
.010 (.009)
.011 (.007)
.037 (.019)
.282 (.046)
36426/.1324
7. Entrants, 1988-1996 (e)
.026 (.008)
.012 (.011)
-.007 (.017)
.003 (.015)
.047 (.011)
.299 (.056)
28720/.1638
8. Exiters, 1988-1996 (e)
.026 (.017)
.033 (.035)
.020 (.005)
.037 (.030)
.050 (.039)
.105 (.038)
10337/.1395
9. Minimum Wage Gap = Logmin(t) – Logmin(t-1), all Establishments(e)
.001 (.004)
-.002 (.007)
.003 (.007)
.003 (.017)
.029 (.016)
.081 (.033)
68875/.08
10. Minimum Wage Gap = Logmin(t) – Logmin(t-1) Balanced Panel (e)
-.017 (.007)
-.017 (.010)
-.002 (.006)
.024 (.012)
.028 (.013)
.041 (.034)
33302/.06
11. Minimum Wage Gap = Logmin(t ) - Logmin(t-1) Entrants (e)
.020 (..009)
.007 (.011)
.002 (.008)
-.019 (.017)
.043 (.012)
.162 (.042)
22236/.09
12. Minimum Wage Gap= Logmin(t) – Logmin(t-1), Exiters (e)
.039 (.049)
.001 (.028)
.024 (.005)
-.007 (.094)
.007 (.104)
.107 (.036)
9055/.15

43
Table 3, Continued
Always Foreign
(a)
Always Exporting
(b)
TFA (Domestic)
(c)
FOR* TFA
Export* TFA
Minimum Wage Gap (d)
N/ R-Square
(1) (2) (3) (4) (5) (6) (8)
13. Non-prod wages: All Establishments, 1990-1996 (e)
.004 (.007)
-.012 (.008)
.014 (.005)
-.002 (.013)
.039 (.016)
.109 (.019)
58563/.0281
14. Non-prod wages: Balanced Panel, 1990-1996 (e)
.007 (.017)
-.022 (.007)
.008 (.005)
.050 (.027)
.016 (.013)
.106 (.023)
29156/.0219
15. Non-prod wages: Entrants, 1990-1996 (e)
.006 (.011)
-.002 (.012)
.014 (.014)
-.024 (.008)
.053 (.029)
.147 (.023)
18573/.0389
16. Non-prod wages: Exiters, 1990-1996 (e)
.0228 (.053)
.050 (.043)
.015 (.015)
-.138 (.088)
-.057 (.041)
.044 (.011)
7479/.0318
17. Prod worker benefits 1990-1996: Establishments(e)
.018 (.012)
.004 (.015)
-.011 (.010)
.008 (.019)
.0138 (.032)
.043 (.025)
61059/.0282
18. Prod worker benefits 1990-1996: Balanced Panel (e)
.013 (.012)
.0003 (.017)
-.005 (.013)
-.008 (.031)
.015 (.033)
.039 (.024)
30122/.0239
19. Prod worker benefits 1990-1996: Entrants (e)
.004 (.014)
.004 (.019)
-.008 (.018)
.047 (.028)
-.013 (.053)
.078 (.027)
19370/.0346
20. Prod worker benefits 1990-1996: Exiters (e)
.071 (.057)
-.015 (.047)
-.021 (.016)
-.075 (.099)
-.032 (.122)
.002 (.028)
7979/.0389
21. Big firms: All Establishments, 1990-1996 (e)
.015 (.008)
.004 (.009)
.009 (.013)
.006 (.020)
.042 (.017)
.250 (.063)
51762/.1226
22. Big firms: Balanced Panel, 1990-1996 (e)
.002 (.012)
-.006 (.009)
.002 (.010)
.036 (.012)
.046 (.010)
.310 (.065)
24779/.1249
23. Big firms: Entrants, 1990-1996(e)
.041 (.008)
.011 (.015)
-.009 (.016)
-.032 (.021)
.055 (.017)
.357 (.049)
17170/.1663
24. Big firms: Exiters, 1990-1996(e)
.042 (.047)
-.036 (.029)
.050 (.013)
.016 (.083)
-.005 (.110)
.127 (.051)
6317/.1523
25. Small firms: All Establishments, 1990-1996 (e)
.040 (.089)
.021 (.041)
-.002 (.012)
.. -.019 (.056)
.178 (.034)
12179/.2315
26. Small firms: Balanced Panel, 1990-1996 (e)
.118 (.116)
-.046 (.059)
.017 (.011)
.. .036 (.095)
.221 (.036)
3410/.2848
27. Small firms: Entrants, 1990-1996(e)
.152 (.097)
.051 (.059)
-.029 (.020)
.. -.015 (.062)
.231 (.044)
4705/.2373
28. Small firms: Exiters, .. -.055 .128 .. -.21 .135 2079/.2485
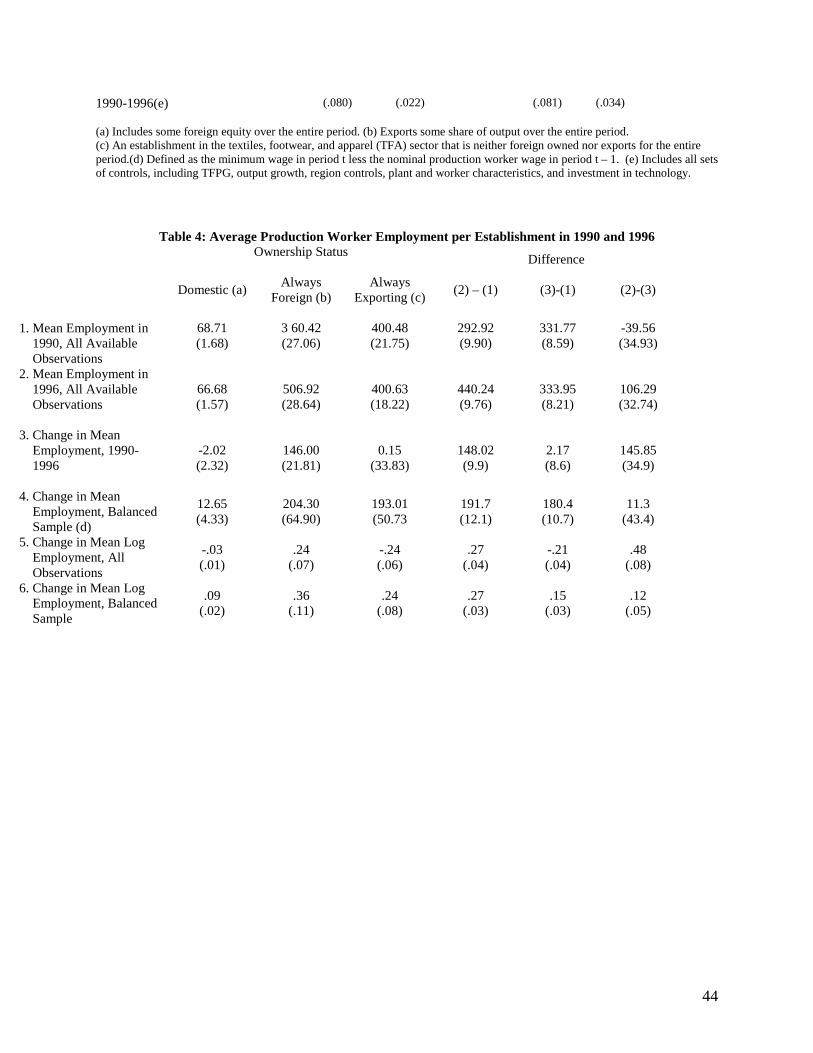
44
1990-1996(e) (.080) (.022) (.081) (.034) (a) Includes some foreign equity over the entire period. (b) Exports some share of output over the entire period. (c) An establishment in the textiles, footwear, and apparel (TFA) sector that is neither foreign owned nor exports for the entire period.(d) Defined as the minimum wage in period t less the nominal production worker wage in period t – 1. (e) Includes all sets of controls, including TFPG, output growth, region controls, plant and worker characteristics, and investment in technology.
Table 4: Average Production Worker Employment per Establishment in 1990 and 1996
Ownership Status
Difference
Domestic (a) Always
Foreign (b) Always
Exporting (c) (2) – (1) (3)-(1) (2)-(3)
1. Mean Employment in 1990, All Available Observations
68.71 (1.68)
3 60.42 (27.06)
400.48 (21.75)
292.92 (9.90)
331.77 (8.59)
-39.56 (34.93)
2. Mean Employment in 1996, All Available Observations
66.68 (1.57)
506.92 (28.64)
400.63 (18.22)
440.24 (9.76)
333.95 (8.21)
106.29 (32.74)
3. Change in Mean Employment, 1990- 1996
-2.02 (2.32)
146.00 (21.81)
0.15 (33.83)
148.02 (9.9)
2.17 (8.6)
145.85 (34.9)
4. Change in Mean Employment, Balanced Sample (d)
12.65 (4.33)
204.30 (64.90)
193.01 (50.73
191.7 (12.1)
180.4 (10.7)
11.3 (43.4)
5. Change in Mean Log Employment, All Observations
-.03 (.01)
.24 (.07)
-.24 (.06)
.27 (.04)
-.21 (.04)
.48 (.08)
6. Change in Mean Log Employment, Balanced Sample
.09 (.02)
.36 (.11)
.24 (.08)
.27 (.03)
.15 (.03)
.12 (.05)
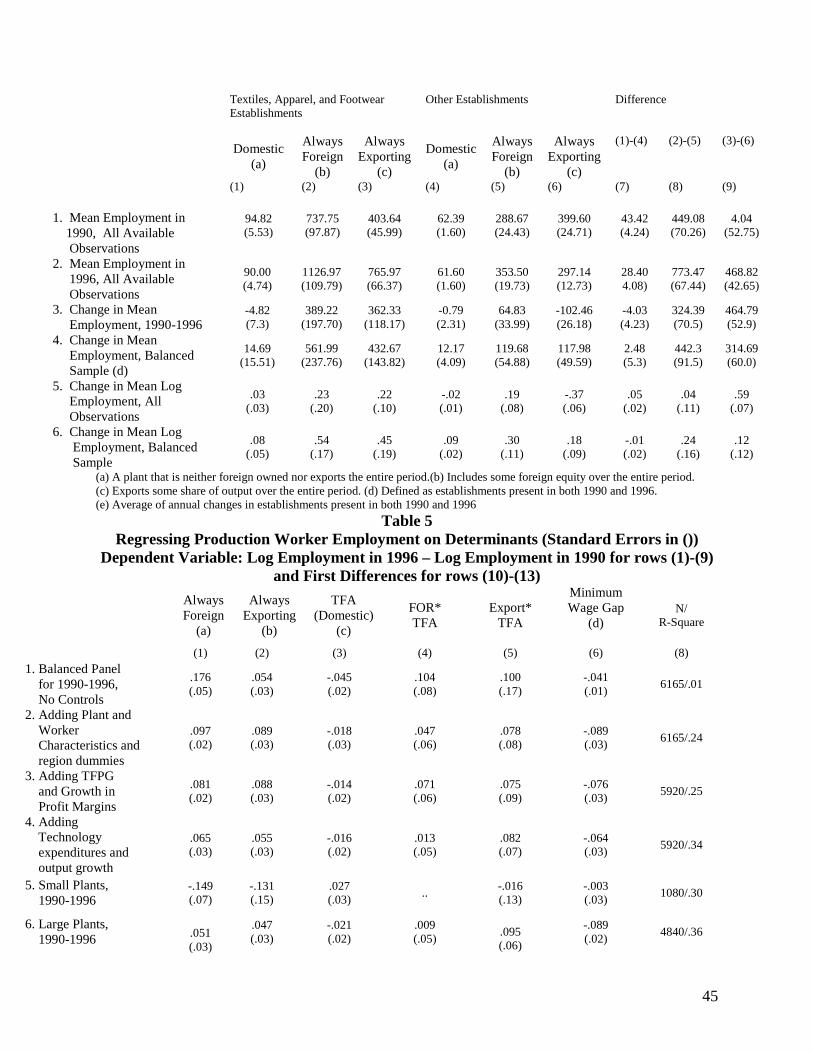
45
(a) A plant that is neither foreign owned nor exports the entire period.(b) Includes some foreign equity over the entire period. (c) Exports some share of output over the entire period. (d) Defined as establishments present in both 1990 and 1996. (e) Average of annual changes in establishments present in both 1990 and 1996
Table 5 Regressing Production Worker Employment on Determinants (Standard Errors in ())
Dependent Variable: Log Employment in 1996 – Log Employment in 1990 for rows (1)-(9) and First Differences for rows (10)-(13)
Always Foreign
(a)
Always Exporting
(b)
TFA (Domestic)
(c)
FOR* TFA
Export* TFA
Minimum Wage Gap
(d)
N/ R-Square
(1) (2) (3) (4) (5) (6) (8) 1. Balanced Panel for 1990-1996, No Controls
.176 (.05)
.054 (.03)
-.045 (.02)
.104 (.08)
.100 (.17)
-.041 (.01)
6165/.01
2. Adding Plant and Worker Characteristics and region dummies
.097 (.02)
.089 (.03)
-.018 (.03)
.047 (.06)
.078 (.08)
-.089 (.03)
6165/.24
3. Adding TFPG and Growth in Profit Margins
.081 (.02)
.088 (.03)
-.014 (.02)
.071 (.06)
.075 (.09)
-.076 (.03)
5920/.25
4. Adding Technology expenditures and output growth
.065 (.03)
.055 (.03)
-.016 (.02)
.013 (.05)
.082 (.07)
-.064 (.03)
5920/.34
5. Small Plants, 1990-1996
-.149 (.07)
-.131 (.15)
.027 (.03)
.. -.016 (.13)
-.003 (.03)
1080/.30
6. Large Plants, 1990-1996 .051
(.03)
.047 (.03)
-.021 (.02)
.009 (.05)
.095 (.06)
-.089 (.02)
4840/.36
Textiles, Apparel, and Footwear Establishments
Other Establishments Difference
Domestic (a)
Always Foreign
(b)
Always Exporting
(c)
Domestic (a)
Always Foreign
(b)
Always Exporting
(c)
(1)-(4) (2)-(5) (3)-(6)
(1) (2) (3) (4) (5) (6) (7) (8) (9) 1. Mean Employment in 1990, All Available Observations
94.82 (5.53)
737.75 (97.87)
403.64 (45.99)
62.39 (1.60)
288.67 (24.43)
399.60 (24.71)
43.42 (4.24)
449.08 (70.26)
4.04 (52.75)
2. Mean Employment in 1996, All Available Observations
90.00 (4.74)
1126.97 (109.79)
765.97 (66.37)
61.60 (1.60)
353.50 (19.73)
297.14 (12.73)
28.40 4.08)
773.47 (67.44)
468.82 (42.65)
3. Change in Mean Employment, 1990-1996
-4.82 (7.3)
389.22 (197.70)
362.33 (118.17)
-0.79 (2.31)
64.83 (33.99)
-102.46 (26.18)
-4.03 (4.23)
324.39 (70.5)
464.79 (52.9)
4. Change in Mean Employment, Balanced Sample (d)
14.69 (15.51)
561.99 (237.76)
432.67 (143.82)
12.17 (4.09)
119.68 (54.88)
117.98 (49.59)
2.48 (5.3)
442.3 (91.5)
314.69 (60.0)
5. Change in Mean Log Employment, All Observations
.03 (.03)
.23 (.20)
.22 (.10)
-.02 (.01)
.19 (.08)
-.37 (.06)
.05 (.02)
.04 (.11)
.59 (.07)
6. Change in Mean Log Employment, Balanced Sample
.08 (.05)
.54 (.17)
.45 (.19)
.09 (.02)
.30 (.11)
.18 (.09)
-.01 (.02)
.24 (.16)
.12 (.12)
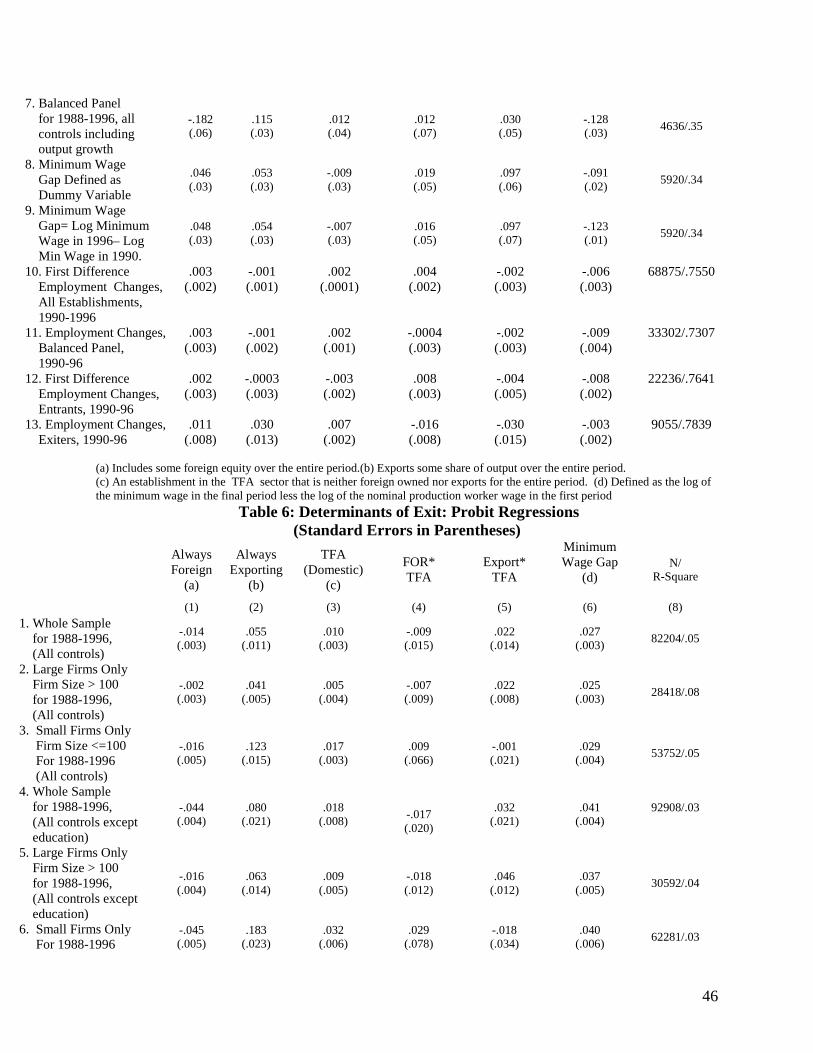
46
7. Balanced Panel for 1988-1996, all controls including output growth
-.182 (.06)
.115 (.03)
.012 (.04)
.012 (.07)
.030 (.05)
-.128 (.03)
4636/.35
8. Minimum Wage Gap Defined as Dummy Variable
.046 (.03)
.053 (.03)
-.009 (.03)
.019 (.05)
.097 (.06)
-.091 (.02)
5920/.34
9. Minimum Wage Gap= Log Minimum Wage in 1996– Log Min Wage in 1990.
.048 (.03)
.054 (.03)
-.007 (.03)
.016 (.05)
.097 (.07)
-.123 (.01)
5920/.34
10. First Difference Employment Changes, All Establishments, 1990-1996
.003 (.002)
-.001 (.001)
.002 (.0001)
.004 (.002)
-.002 (.003)
-.006 (.003)
68875/.7550
11. Employment Changes, Balanced Panel, 1990-96
.003 (.003)
-.001 (.002)
.002 (.001)
-.0004 (.003)
-.002 (.003)
-.009 (.004)
33302/.7307
12. First Difference Employment Changes, Entrants, 1990-96
.002 (.003)
-.0003 (.003)
-.003 (.002)
.008 (.003)
-.004 (.005)
-.008 (.002)
22236/.7641
13. Employment Changes, Exiters, 1990-96
.011 (.008)
.030 (.013)
.007 (.002)
-.016 (.008)
-.030 (.015)
-.003 (.002)
9055/.7839
(a) Includes some foreign equity over the entire period.(b) Exports some share of output over the entire period. (c) An establishment in the TFA sector that is neither foreign owned nor exports for the entire period. (d) Defined as the log of the minimum wage in the final period less the log of the nominal production worker wage in the first period
Table 6: Determinants of Exit: Probit Regressions (Standard Errors in Parentheses)
Always Foreign
(a)
Always Exporting
(b)
TFA (Domestic)
(c)
FOR* TFA
Export* TFA
Minimum Wage Gap
(d)
N/ R-Square
(1) (2) (3) (4) (5) (6) (8) 1. Whole Sample for 1988-1996, (All controls)
-.014 (.003)
.055 (.011)
.010 (.003)
-.009 (.015)
.022 (.014)
.027 (.003)
82204/.05
2. Large Firms Only Firm Size > 100 for 1988-1996, (All controls)
-.002 (.003)
.041 (.005)
.005 (.004)
-.007 (.009)
.022 (.008)
.025 (.003)
28418/.08
3. Small Firms Only Firm Size <=100 For 1988-1996 (All controls)
-.016 (.005)
.123 (.015)
.017 (.003)
.009 (.066)
-.001 (.021)
.029 (.004)
53752/.05
4. Whole Sample for 1988-1996, (All controls except education)
-.044 (.004)
.080 (.021)
.018 (.008)
-.017 (.020)
.032 (.021)
.041 (.004)
92908/.03
5. Large Firms Only Firm Size > 100 for 1988-1996, (All controls except education)
-.016 (.004)
.063 (.014)
.009 (.005)
-.018 (.012)
.046 (.012)
.037 (.005)
30592/.04
6. Small Firms Only For 1988-1996
-.045 (.005)
.183 (.023)
.032 (.006)
.029 (.078)
-.018 (.034)
.040 (.006)
62281/.03
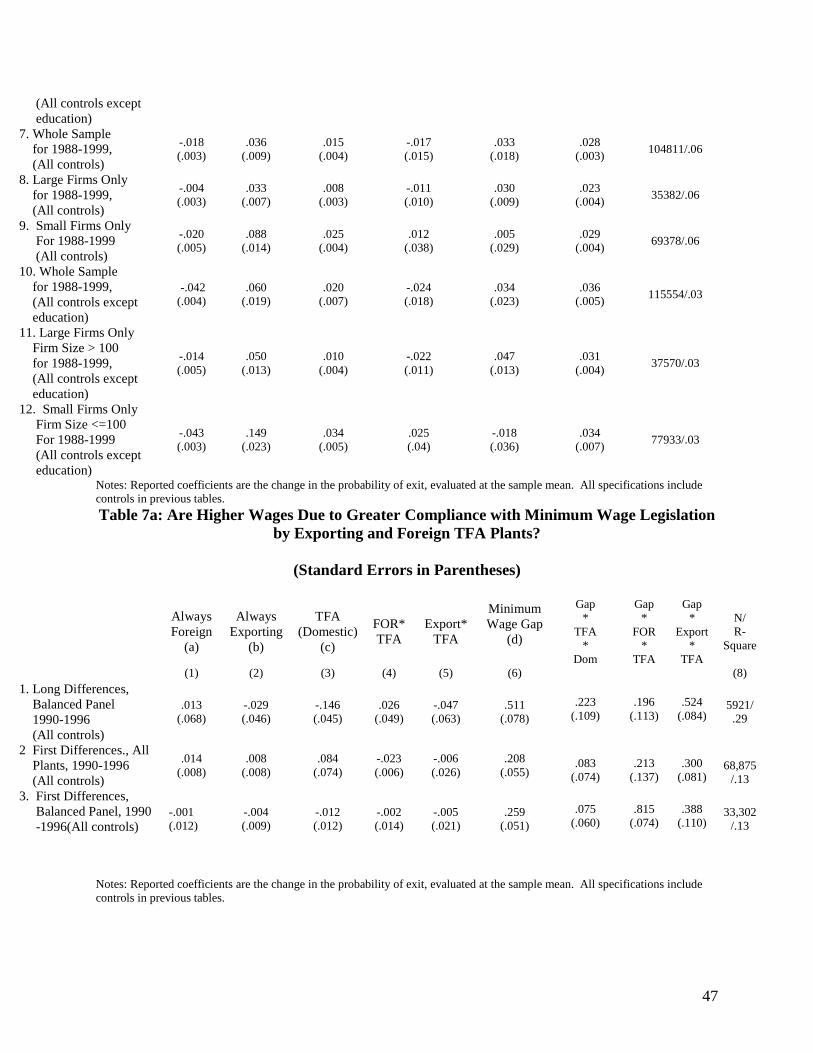
47
(All controls except education) 7. Whole Sample for 1988-1999, (All controls)
-.018 (.003)
.036 (.009)
.015 (.004)
-.017 (.015)
.033 (.018)
.028 (.003)
104811/.06
8. Large Firms Only for 1988-1999, (All controls)
-.004 (.003)
.033 (.007)
.008 (.003)
-.011 (.010)
.030 (.009)
.023 (.004)
35382/.06
9. Small Firms Only For 1988-1999 (All controls)
-.020 (.005)
.088 (.014)
.025 (.004)
.012 (.038)
.005 (.029)
.029 (.004)
69378/.06
10. Whole Sample for 1988-1999, (All controls except education)
-.042 (.004)
.060 (.019)
.020 (.007)
-.024 (.018)
.034 (.023)
.036 (.005)
115554/.03
11. Large Firms Only Firm Size > 100 for 1988-1999, (All controls except education)
-.014 (.005)
.050 (.013)
.010 (.004)
-.022 (.011)
.047 (.013)
.031 (.004)
37570/.03
12. Small Firms Only Firm Size <=100 For 1988-1999 (All controls except education)
-.043 (.003)
.149 (.023)
.034 (.005)
.025 (.04)
-.018 (.036)
.034 (.007)
77933/.03
Notes: Reported coefficients are the change in the probability of exit, evaluated at the sample mean. All specifications include controls in previous tables.
Table 7a: Are Higher Wages Due to Greater Compliance with Minimum Wage Legislation by Exporting and Foreign TFA Plants?
(Standard Errors in Parentheses)
Always Foreign
(a)
Always Exporting
(b)
TFA (Domestic)
(c)
FOR* TFA
Export* TFA
Minimum Wage Gap
(d)
Gap *
TFA *
Dom
Gap *
FOR *
TFA
Gap *
Export *
TFA
N/ R-
Square
(1) (2) (3) (4) (5) (6) (8) 1. Long Differences, Balanced Panel 1990-1996 (All controls)
.013 (.068)
-.029 (.046)
-.146 (.045)
.026 (.049)
-.047 (.063)
.511 (.078)
.223
(.109)
.196
(.113)
.524
(.084) 5921/
.29
2 First Differences., All Plants, 1990-1996 (All controls)
.014 (.008)
.008 (.008)
.084 (.074)
-.023 (.006)
-.006 (.026)
.208 (.055)
.083
(.074)
.213
(.137)
.300
(.081)
68,875
/.13
3. First Differences, Balanced Panel, 1990 -1996(All controls)
-.001 (.012)
-.004 (.009)
-.012 (.012)
-.002 (.014)
-.005 (.021)
.259 (.051)
.075
(.060)
.815
(.074)
.388
(.110) 33,302
/.13
Notes: Reported coefficients are the change in the probability of exit, evaluated at the sample mean. All specifications include controls in previous tables.
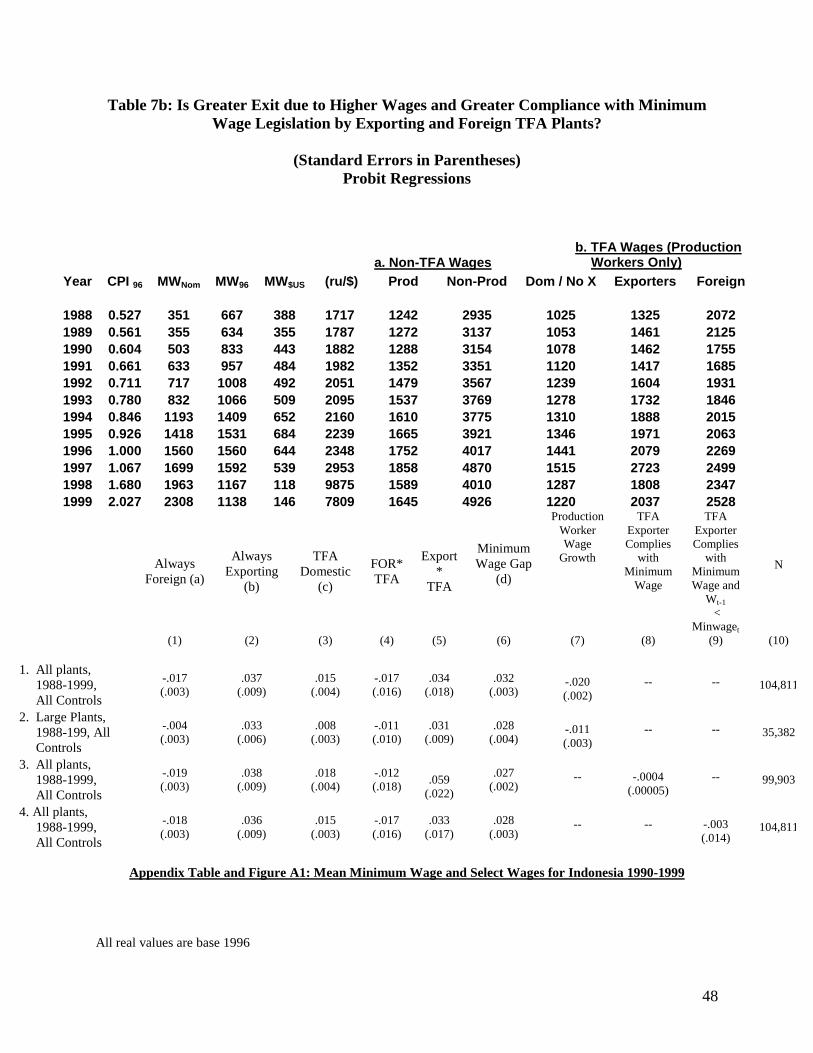
48
Table 7b: Is Greater Exit due to Higher Wages and Greater Compliance with Minimum Wage Legislation by Exporting and Foreign TFA Plants?
(Standard Errors in Parentheses)
Probit Regressions
Always Foreign (a)
Always Exporting
(b)
TFA Domestic
(c)
FOR* TFA
Export*
TFA
Minimum Wage Gap
(d)
Production Worker Wage
Growth
TFA Exporter Complies
with Minimum
Wage
TFA Exporter Complies
with Minimum Wage and
Wt-1 <
Minwaget
N
(1) (2) (3) (4) (5) (6) (7) (8) (9) (10)
1. All plants, 1988-1999, All Controls
-.017 (.003)
.037 (.009)
.015 (.004)
-.017 (.016)
.034 (.018)
.032 (.003)
-.020 (.002)
--
--
104,811
2. Large Plants, 1988-199, All Controls
-.004 (.003)
.033 (.006)
.008 (.003)
-.011 (.010)
.031 (.009)
.028 (.004)
-.011 (.003)
--
-- 35,382
3. All plants, 1988-1999, All Controls
-.019 (.003)
.038 (.009)
.018 (.004)
-.012 (.018)
.059
(.022)
.027 (.002)
--
-.0004
(.00005)
-- 99,903
4. All plants, 1988-1999, All Controls
-.018 (.003)
.036 (.009)
.015 (.003)
-.017 (.016)
.033 (.017)
.028 (.003)
--
--
-.003 (.014)
104,811
Appendix Table and Figure A1: Mean Minimum Wage and Select Wages for Indonesia 1990-1999
All real values are base 1996
a. Non-TFA Wages b. TFA Wages (Production
Workers Only) Year CPI 96 MWNom MW96 MW$US (ru/$) Prod Non-Prod Dom / No X Exporters Foreign
1988 0.527 351 667 388 1717 1242 2935 1025 1325 2072 1989 0.561 355 634 355 1787 1272 3137 1053 1461 2125 1990 0.604 503 833 443 1882 1288 3154 1078 1462 1755 1991 0.661 633 957 484 1982 1352 3351 1120 1417 1685 1992 0.711 717 1008 492 2051 1479 3567 1239 1604 1931 1993 0.780 832 1066 509 2095 1537 3769 1278 1732 1846 1994 0.846 1193 1409 652 2160 1610 3775 1310 1888 2015 1995 0.926 1418 1531 684 2239 1665 3921 1346 1971 2063 1996 1.000 1560 1560 644 2348 1752 4017 1441 2079 2269 1997 1.067 1699 1592 539 2953 1858 4870 1515 2723 2499 1998 1.680 1963 1167 118 9875 1589 4010 1287 1808 2347 1999 2.027 2308 1138 146 7809 1645 4926 1220 2037 2528
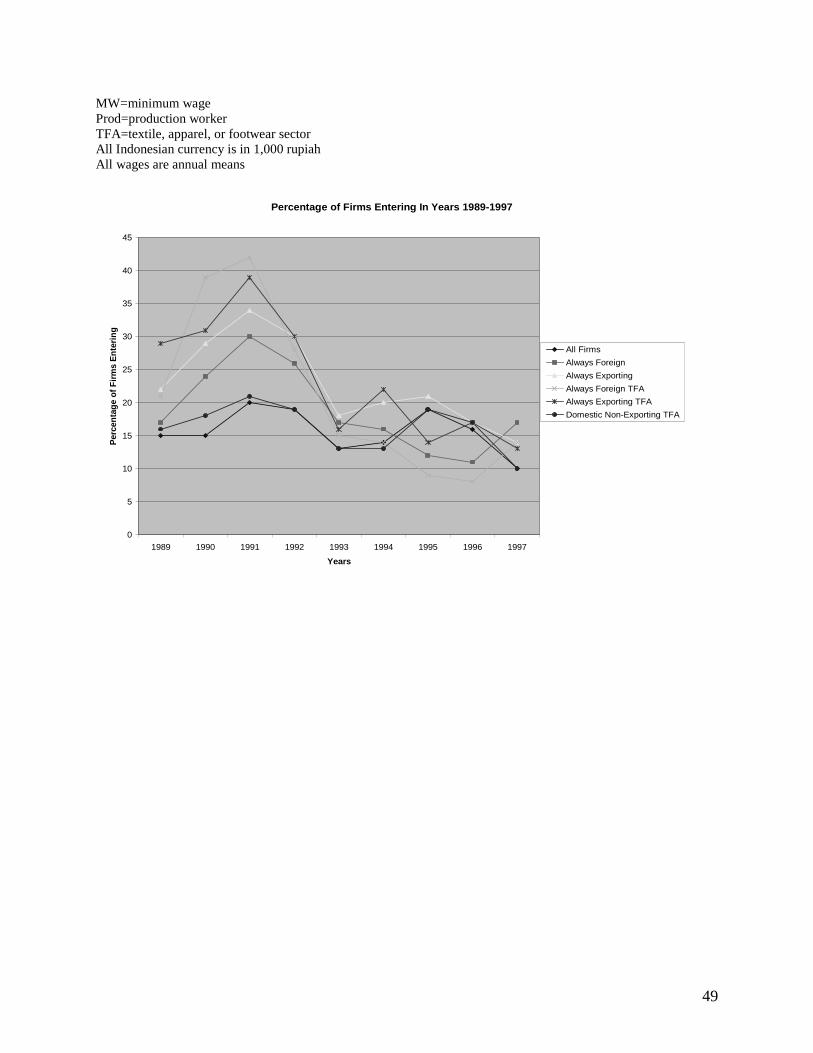
49
MW=minimum wage Prod=production worker TFA=textile, apparel, or footwear sector All Indonesian currency is in 1,000 rupiah All wages are annual means
Percentage of Firms Entering In Years 1989-1997
0
5
10
15
20
25
30
35
40
45
1989 1990 1991 1992 1993 1994 1995 1996 1997
Years
Per
cen
tag
e of
Fir
ms
En
teri
ng
All Firms
Always Foreign
Always Exporting
Always Foreign TFA
Always Exporting TFA
Domestic Non-Exporting TFA
![Sweatshop - repositorio.ufop.br · Catalogação: M543a Menezes, Natália Ferraz. Aproximações entre newsgames e jornalismo [manuscrito]: uma análise do jogo Sweatshop / Natália](https://img.pdfslide.net/doc/110x75/601d36e21d670170c2786ca9/sweatshop-catalogao-m543a-menezes-natlia-ferraz-aproximaes-entre.jpg)