Embed Size (px)
Citation preview
Mozambique
GLOBAL FOREST RESOURCES ASSESSMENT 2015
COUNTRY REPORT
Rome, 2014

FAO, at the request of its member countries, regularly monitors the world´s forests and theirmanagement and uses through the Global Forest Resources Assessment (FRA). This country reportis prepared as a contribution to the FAO publication, the Global Forest Resources Assessment 2015(FRA 2015).The content and the structure are in accordance with the recommendations and guidelines given byFAO in the document Guide for country reporting for FRA 2015 (http://www.fao.org/3/a-au190e.pdf).These reports were submitted to FAO as official government documents.
The content and the views expressed in this report are the responsibility of the entity submitting thereport to FAO. FAO may not be held responsible for the use which may be made of the informationcontained in this report.
FRA 2015 – Country Report, Mozambique
3
TABLE OF CONTENTSReport preparation and contact persons...............................................................................................................................41. What is the area of forest and other wooded land and how has it changed over time? ................................................. 52. What is the area of natural and planted forest and how has it changed over time? ..................................................... 193. What are the stocks and growth rates of the forests and how have they changed? .....................................................234. What is the status of forest production and how has it changed over time? .................................................................375. How much forest area is managed for protection of soil and water and ecosystem services? ..................................... 446. How much forest area is protected and designated for the conservation of biodiversity and how has it changed overtime? ................................................................................................................................................................................... 497. What is the area of forest affected by woody invasive species? .................................................................................. 528. How much forest area is damaged each year? ............................................................................................................ 559. What is the forest area with reduced canopy cover? ....................................................................................................5910. What forest policy and regulatory framework exists to support implementation of sustainable forest managementSFM? .................................................................................................................................................................................. 6011. Is there a national platform that promotes stakeholder participation in forest policy development? ............................ 6212. What is the forest area intended to be in permanent forest land use and how has it changed over time? .................. 6313. How does your country measure and report progress towards SFM at the national level? ........................................ 6614. What is the area of forest under a forest management plan and how is this monitored? ........................................... 6815. How are stakeholders involved in the management decision making for publicly owned forests? .............................. 7016. What is the area of forest under an independently verified forest certification scheme? .............................................7117. How much money do governments collect from and spend on forests? .....................................................................7318. Who owns and manages the forests and how has this changed? ..............................................................................7519. How many people are directly employed in forestry? ................................................................................................. 8120. What is the contribution of forestry to Gross Domestic Product (GDP)? .................................................................... 8321. What is forest area likely to be in the future ...............................................................................................................84
FRA 2015 – Country Report, Mozambique
4
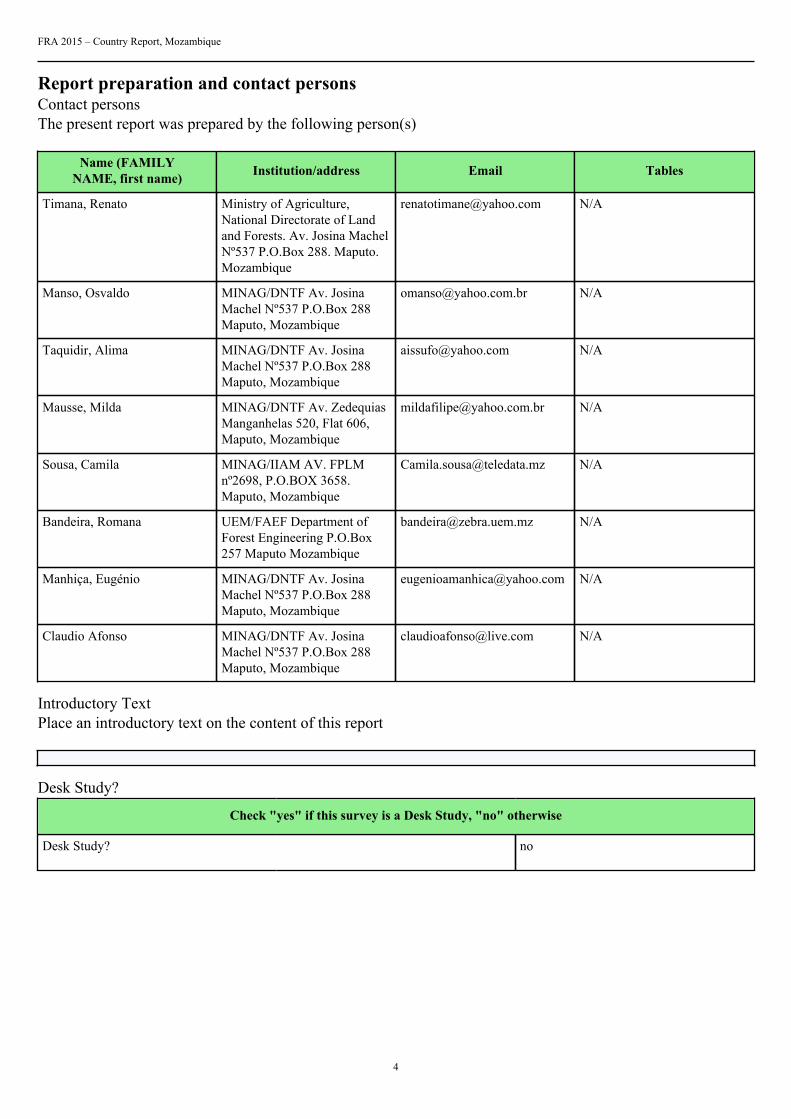
Report preparation and contact personsContact personsThe present report was prepared by the following person(s)
Name (FAMILYNAME, first name) Institution/address Email Tables
Timana, Renato Ministry of Agriculture,National Directorate of Landand Forests. Av. Josina MachelNº537 P.O.Box 288. Maputo.Mozambique
Manso, Osvaldo MINAG/DNTF Av. JosinaMachel Nº537 P.O.Box 288Maputo, Mozambique
Taquidir, Alima MINAG/DNTF Av. JosinaMachel Nº537 P.O.Box 288Maputo, Mozambique
Mausse, Milda MINAG/DNTF Av. ZedequiasManganhelas 520, Flat 606,Maputo, Mozambique
Sousa, Camila MINAG/IIAM AV. FPLMnº2698, P.O.BOX 3658.Maputo, Mozambique
Bandeira, Romana UEM/FAEF Department ofForest Engineering P.O.Box257 Maputo Mozambique
Manhiça, Eugénio MINAG/DNTF Av. JosinaMachel Nº537 P.O.Box 288Maputo, Mozambique
Claudio Afonso MINAG/DNTF Av. JosinaMachel Nº537 P.O.Box 288Maputo, Mozambique
Introductory TextPlace an introductory text on the content of this report
Desk Study?
Check "yes" if this survey is a Desk Study, "no" otherwise
Desk Study? no
FRA 2015 – Country Report, Mozambique
5
1. What is the area of forest and other wooded land and how has it changed over time?Documents for this question:
• Guide for country reporting FRA 2015• FRA 2015 Terms and Definitions
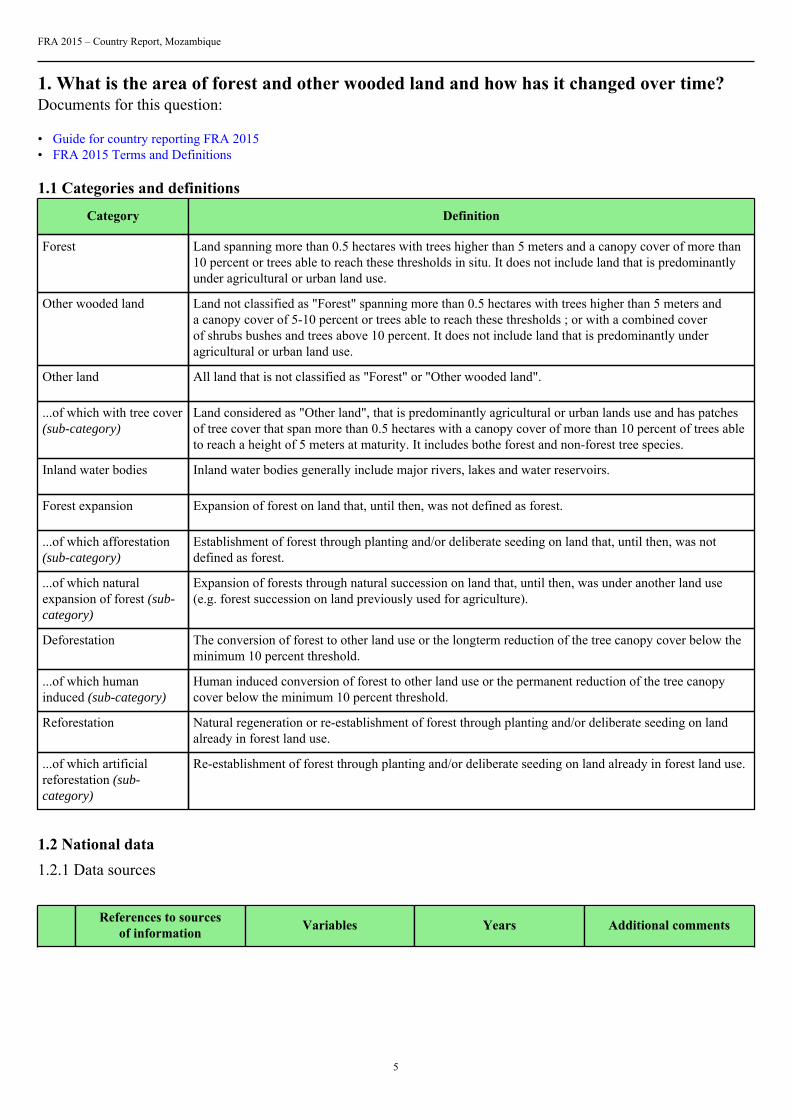
1.1 Categories and definitions
Category Definition
Forest Land spanning more than 0.5 hectares with trees higher than 5 meters and a canopy cover of more than10 percent or trees able to reach these thresholds in situ. It does not include land that is predominantlyunder agricultural or urban land use.
Other wooded land Land not classified as "Forest" spanning more than 0.5 hectares with trees higher than 5 meters anda canopy cover of 5-10 percent or trees able to reach these thresholds ; or with a combined coverof shrubs bushes and trees above 10 percent. It does not include land that is predominantly underagricultural or urban land use.
Other land All land that is not classified as "Forest" or "Other wooded land".
...of which with tree cover(sub-category)
Land considered as "Other land", that is predominantly agricultural or urban lands use and has patchesof tree cover that span more than 0.5 hectares with a canopy cover of more than 10 percent of trees ableto reach a height of 5 meters at maturity. It includes bothe forest and non-forest tree species.
Inland water bodies Inland water bodies generally include major rivers, lakes and water reservoirs.
Forest expansion Expansion of forest on land that, until then, was not defined as forest.
...of which afforestation(sub-category)
Establishment of forest through planting and/or deliberate seeding on land that, until then, was notdefined as forest.
...of which naturalexpansion of forest (sub-category)
Expansion of forests through natural succession on land that, until then, was under another land use(e.g. forest succession on land previously used for agriculture).
Deforestation The conversion of forest to other land use or the longterm reduction of the tree canopy cover below theminimum 10 percent threshold.
...of which humaninduced (sub-category)
Human induced conversion of forest to other land use or the permanent reduction of the tree canopycover below the minimum 10 percent threshold.
Reforestation Natural regeneration or re-establishment of forest through planting and/or deliberate seeding on landalready in forest land use.
...of which artificialreforestation (sub-category)
Re-establishment of forest through planting and/or deliberate seeding on land already in forest land use.
1.2 National data1.2.1 Data sources
References to sourcesof information Variables Years Additional comments
FRA 2015 – Country Report, Mozambique
6
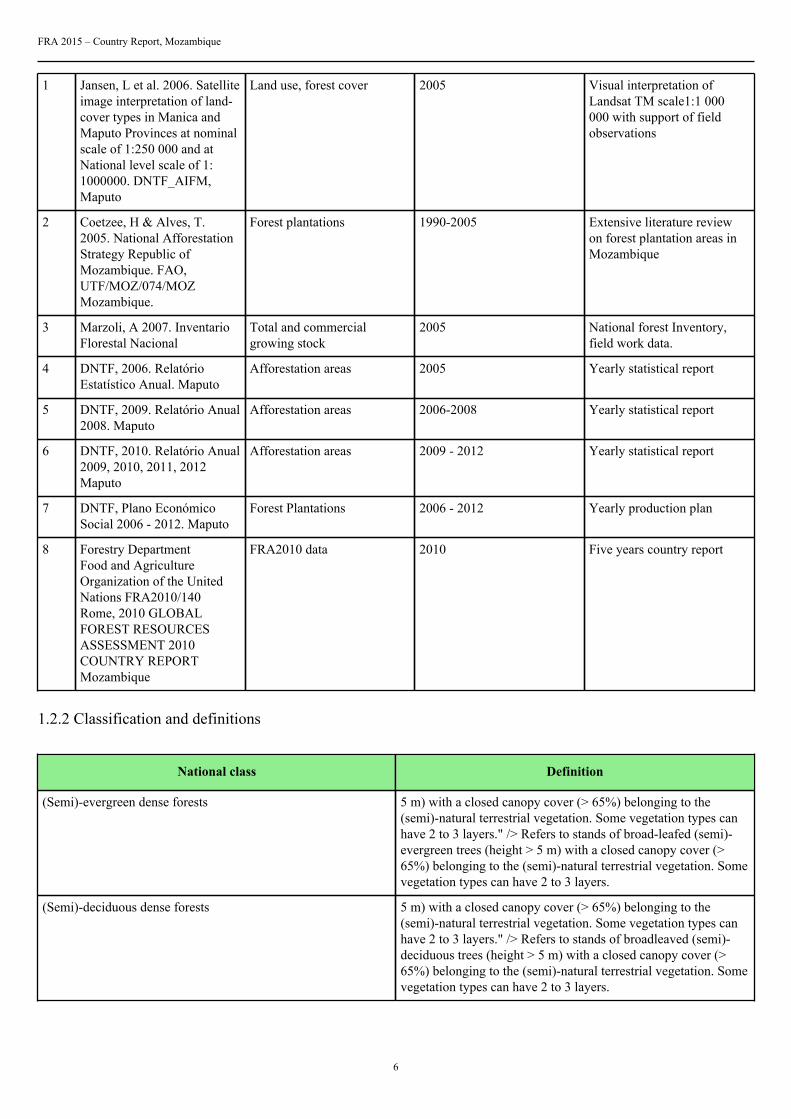
1 Jansen, L et al. 2006. Satelliteimage interpretation of land-cover types in Manica andMaputo Provinces at nominalscale of 1:250 000 and atNational level scale of 1:1000000. DNTF_AIFM,Maputo
Land use, forest cover 2005 Visual interpretation ofLandsat TM scale1:1 000000 with support of fieldobservations
2 Coetzee, H & Alves, T.2005. National AfforestationStrategy Republic ofMozambique. FAO,UTF/MOZ/074/MOZMozambique.
Forest plantations 1990-2005 Extensive literature reviewon forest plantation areas inMozambique
3 Marzoli, A 2007. InventarioFlorestal Nacional
Total and commercialgrowing stock
2005 National forest Inventory,field work data.
4 DNTF, 2006. RelatórioEstatístico Anual. Maputo
Afforestation areas 2005 Yearly statistical report
5 DNTF, 2009. Relatório Anual2008. Maputo
Afforestation areas 2006-2008 Yearly statistical report
6 DNTF, 2010. Relatório Anual2009, 2010, 2011, 2012Maputo
Afforestation areas 2009 - 2012 Yearly statistical report
7 DNTF, Plano EconómicoSocial 2006 - 2012. Maputo
Forest Plantations 2006 - 2012 Yearly production plan
8 Forestry DepartmentFood and AgricultureOrganization of the UnitedNations FRA2010/140Rome, 2010 GLOBALFOREST RESOURCESASSESSMENT 2010COUNTRY REPORTMozambique
FRA2010 data 2010 Five years country report
1.2.2 Classification and definitions
National class Definition
(Semi)-evergreen dense forests 5 m) with a closed canopy cover (> 65%) belonging to the(semi)-natural terrestrial vegetation. Some vegetation types canhave 2 to 3 layers." /> Refers to stands of broad-leafed (semi)-evergreen trees (height > 5 m) with a closed canopy cover (>65%) belonging to the (semi)-natural terrestrial vegetation. Somevegetation types can have 2 to 3 layers.
(Semi)-deciduous dense forests 5 m) with a closed canopy cover (> 65%) belonging to the(semi)-natural terrestrial vegetation. Some vegetation types canhave 2 to 3 layers." /> Refers to stands of broadleaved (semi)-deciduous trees (height > 5 m) with a closed canopy cover (>65%) belonging to the (semi)-natural terrestrial vegetation. Somevegetation types can have 2 to 3 layers.
FRA 2015 – Country Report, Mozambique
7
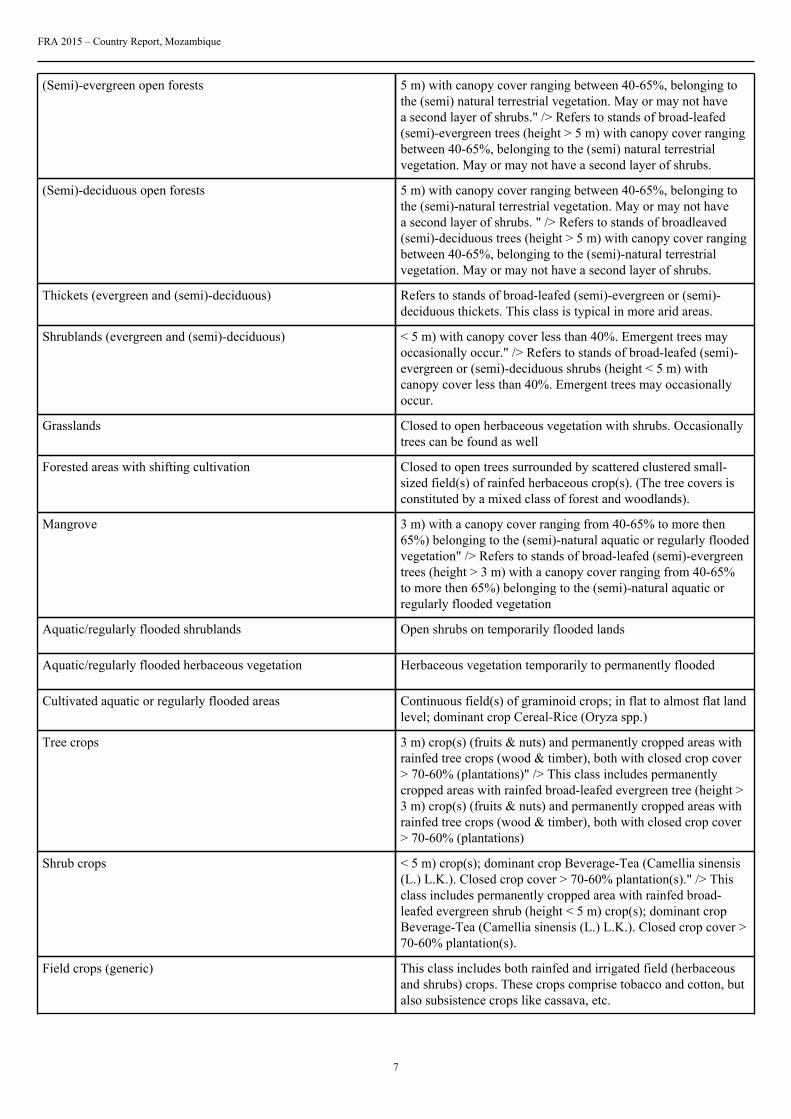
(Semi)-evergreen open forests 5 m) with canopy cover ranging between 40-65%, belonging tothe (semi) natural terrestrial vegetation. May or may not havea second layer of shrubs." /> Refers to stands of broad-leafed(semi)-evergreen trees (height > 5 m) with canopy cover rangingbetween 40-65%, belonging to the (semi) natural terrestrialvegetation. May or may not have a second layer of shrubs.
(Semi)-deciduous open forests 5 m) with canopy cover ranging between 40-65%, belonging tothe (semi)-natural terrestrial vegetation. May or may not havea second layer of shrubs. " /> Refers to stands of broadleaved(semi)-deciduous trees (height > 5 m) with canopy cover rangingbetween 40-65%, belonging to the (semi)-natural terrestrialvegetation. May or may not have a second layer of shrubs.
Thickets (evergreen and (semi)-deciduous) Refers to stands of broad-leafed (semi)-evergreen or (semi)-deciduous thickets. This class is typical in more arid areas.
Shrublands (evergreen and (semi)-deciduous) < 5 m) with canopy cover less than 40%. Emergent trees mayoccasionally occur." /> Refers to stands of broad-leafed (semi)-evergreen or (semi)-deciduous shrubs (height < 5 m) withcanopy cover less than 40%. Emergent trees may occasionallyoccur.
Grasslands Closed to open herbaceous vegetation with shrubs. Occasionallytrees can be found as well
Forested areas with shifting cultivation Closed to open trees surrounded by scattered clustered small-sized field(s) of rainfed herbaceous crop(s). (The tree covers isconstituted by a mixed class of forest and woodlands).
Mangrove 3 m) with a canopy cover ranging from 40-65% to more then65%) belonging to the (semi)-natural aquatic or regularly floodedvegetation" /> Refers to stands of broad-leafed (semi)-evergreentrees (height > 3 m) with a canopy cover ranging from 40-65%to more then 65%) belonging to the (semi)-natural aquatic orregularly flooded vegetation
Aquatic/regularly flooded shrublands Open shrubs on temporarily flooded lands
Aquatic/regularly flooded herbaceous vegetation Herbaceous vegetation temporarily to permanently flooded
Cultivated aquatic or regularly flooded areas Continuous field(s) of graminoid crops; in flat to almost flat landlevel; dominant crop Cereal-Rice (Oryza spp.)
Tree crops 3 m) crop(s) (fruits & nuts) and permanently cropped areas withrainfed tree crops (wood & timber), both with closed crop cover> 70-60% (plantations)" /> This class includes permanentlycropped areas with rainfed broad-leafed evergreen tree (height >3 m) crop(s) (fruits & nuts) and permanently cropped areas withrainfed tree crops (wood & timber), both with closed crop cover> 70-60% (plantations)
Shrub crops < 5 m) crop(s); dominant crop Beverage-Tea (Camellia sinensis(L.) L.K.). Closed crop cover > 70-60% plantation(s)." /> Thisclass includes permanently cropped area with rainfed broad-leafed evergreen shrub (height < 5 m) crop(s); dominant cropBeverage-Tea (Camellia sinensis (L.) L.K.). Closed crop cover >70-60% plantation(s).
Field crops (generic) This class includes both rainfed and irrigated field (herbaceousand shrubs) crops. These crops comprise tobacco and cotton, butalso subsistence crops like cassava, etc.
FRA 2015 – Country Report, Mozambique
8
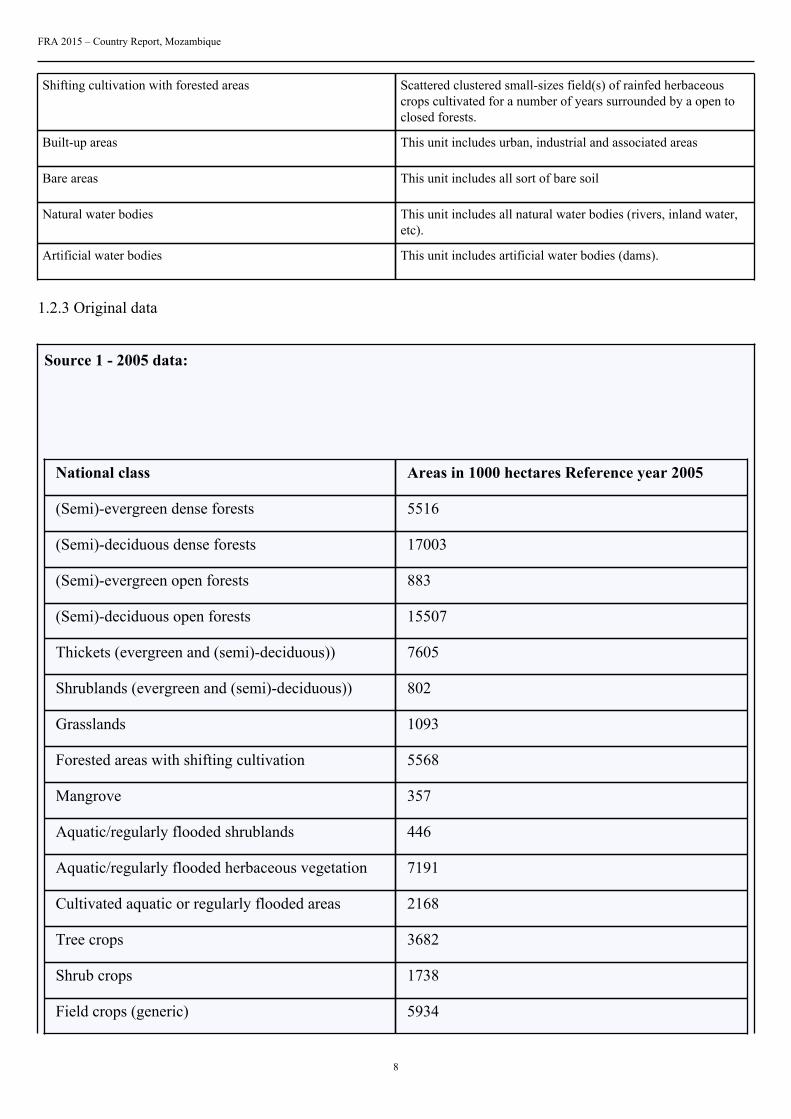
Shifting cultivation with forested areas Scattered clustered small-sizes field(s) of rainfed herbaceouscrops cultivated for a number of years surrounded by a open toclosed forests.
Built-up areas This unit includes urban, industrial and associated areas
Bare areas This unit includes all sort of bare soil
Natural water bodies This unit includes all natural water bodies (rivers, inland water,etc).
Artificial water bodies This unit includes artificial water bodies (dams).
1.2.3 Original data
Source 1 - 2005 data:
National class Areas in 1000 hectares Reference year 2005
(Semi)-evergreen dense forests 5516
(Semi)-deciduous dense forests 17003
(Semi)-evergreen open forests 883
(Semi)-deciduous open forests 15507
Thickets (evergreen and (semi)-deciduous)) 7605
Shrublands (evergreen and (semi)-deciduous)) 802
Grasslands 1093
Forested areas with shifting cultivation 5568
Mangrove 357
Aquatic/regularly flooded shrublands 446
Aquatic/regularly flooded herbaceous vegetation 7191
Cultivated aquatic or regularly flooded areas 2168
Tree crops 3682
Shrub crops 1738
Field crops (generic) 5934
FRA 2015 – Country Report, Mozambique
9
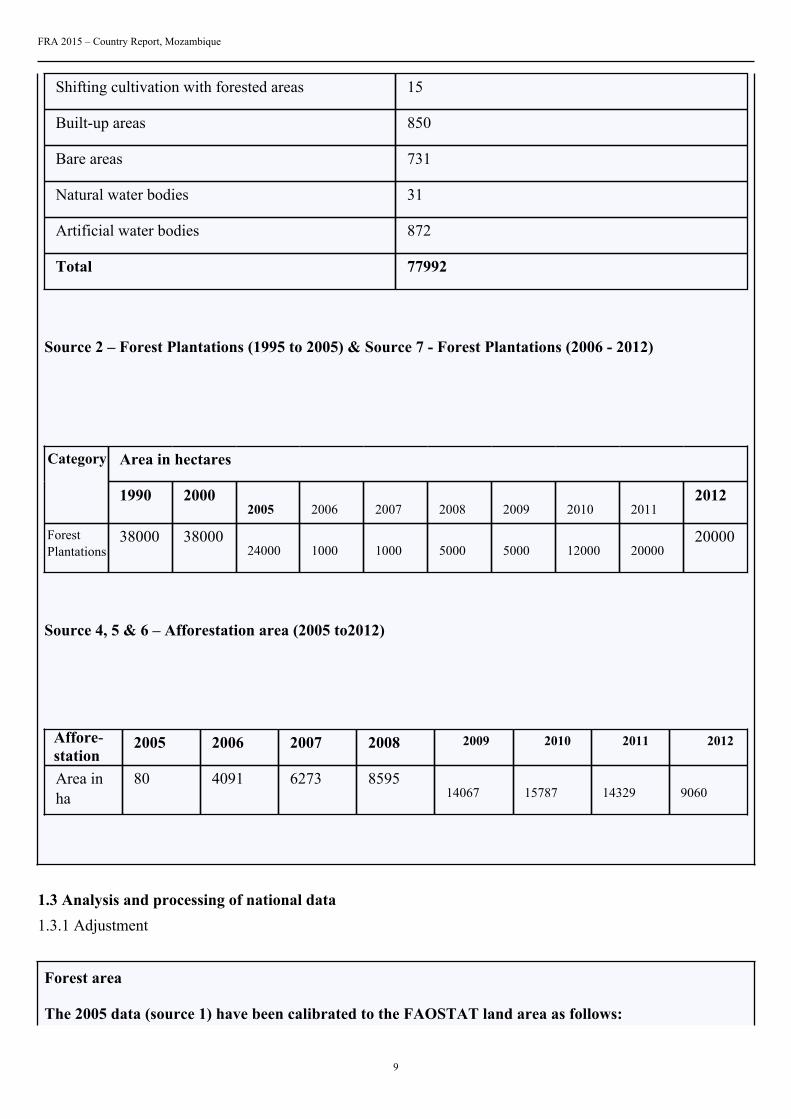
Shifting cultivation with forested areas 15
Built-up areas 850
Bare areas 731
Natural water bodies 31
Artificial water bodies 872
Total 77992
Source 2 – Forest Plantations (1995 to 2005) & Source 7 - Forest Plantations (2006 - 2012)
Area in hectaresCategory
1990 2000 2005
2006
2007
2008
2009
2010
2011
2012
ForestPlantations
38000
38000
24000
1000
1000
5000
5000
12000
20000
20000
Source 4, 5 & 6 – Afforestation area (2005 to2012)
Affore-station
2005 2006 2007 2008 2009 2010 2011 2012
Area inha
80 4091 6273 8595 14067
15787
14329
9060
1.3 Analysis and processing of national data1.3.1 Adjustment
Forest area
The 2005 data (source 1) have been calibrated to the FAOSTAT land area as follows:
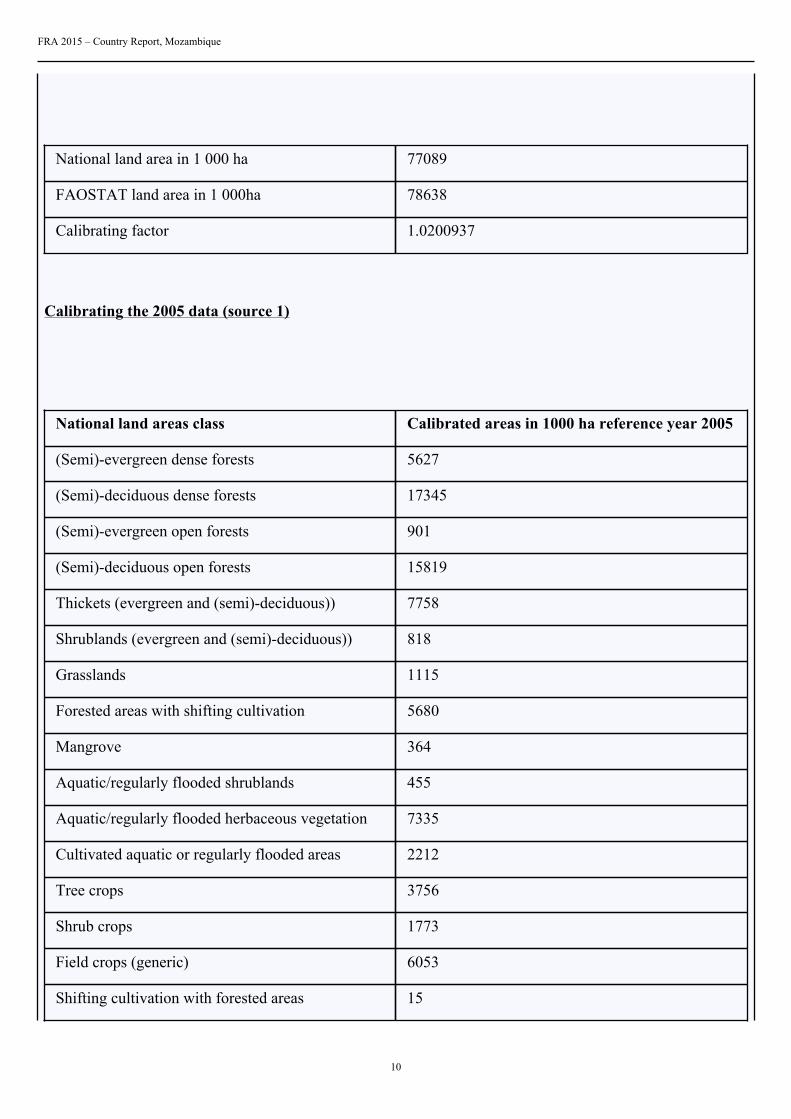
FRA 2015 – Country Report, Mozambique
10
National land area in 1 000 ha 77089
FAOSTAT land area in 1 000ha 78638
Calibrating factor 1.0200937
Calibrating the 2005 data (source 1)
National land areas class Calibrated areas in 1000 ha reference year 2005
(Semi)-evergreen dense forests 5627
(Semi)-deciduous dense forests 17345
(Semi)-evergreen open forests 901
(Semi)-deciduous open forests 15819
Thickets (evergreen and (semi)-deciduous)) 7758
Shrublands (evergreen and (semi)-deciduous)) 818
Grasslands 1115
Forested areas with shifting cultivation 5680
Mangrove 364
Aquatic/regularly flooded shrublands 455
Aquatic/regularly flooded herbaceous vegetation 7335
Cultivated aquatic or regularly flooded areas 2212
Tree crops 3756
Shrub crops 1773
Field crops (generic) 6053
Shifting cultivation with forested areas 15
FRA 2015 – Country Report, Mozambique
11
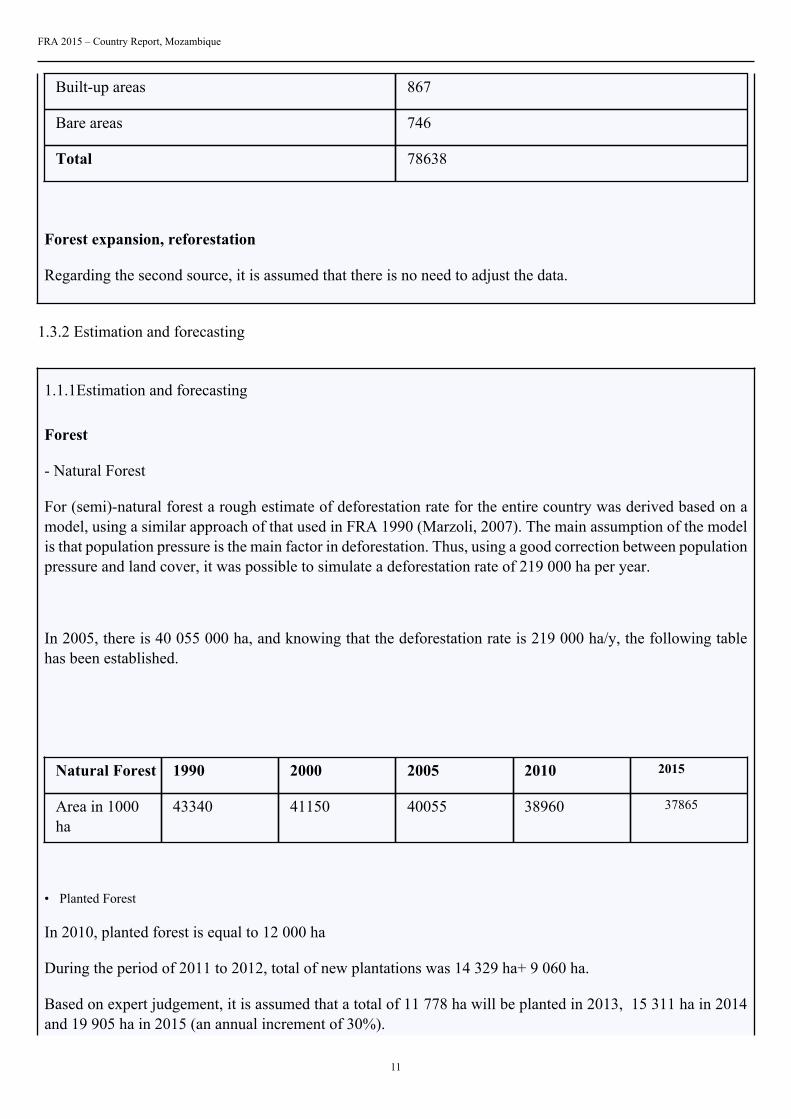
Built-up areas 867
Bare areas 746
Total 78638
Forest expansion, reforestation
Regarding the second source, it is assumed that there is no need to adjust the data.
1.3.2 Estimation and forecasting
1.1.1Estimation and forecasting
Forest
- Natural Forest
For (semi)-natural forest a rough estimate of deforestation rate for the entire country was derived based on amodel, using a similar approach of that used in FRA 1990 (Marzoli, 2007). The main assumption of the modelis that population pressure is the main factor in deforestation. Thus, using a good correction between populationpressure and land cover, it was possible to simulate a deforestation rate of 219 000 ha per year.
In 2005, there is 40 055 000 ha, and knowing that the deforestation rate is 219 000 ha/y, the following tablehas been established.
Natural Forest 1990 2000 2005 2010 2015
Area in 1000ha
43340 41150 40055 38960 37865
• Planted Forest
In 2010, planted forest is equal to 12 000 ha
During the period of 2011 to 2012, total of new plantations was 14 329 ha+ 9 060 ha.
Based on expert judgement, it is assumed that a total of 11 778 ha will be planted in 2013, 15 311 ha in 2014and 19 905 ha in 2015 (an annual increment of 30%).
FRA 2015 – Country Report, Mozambique
12
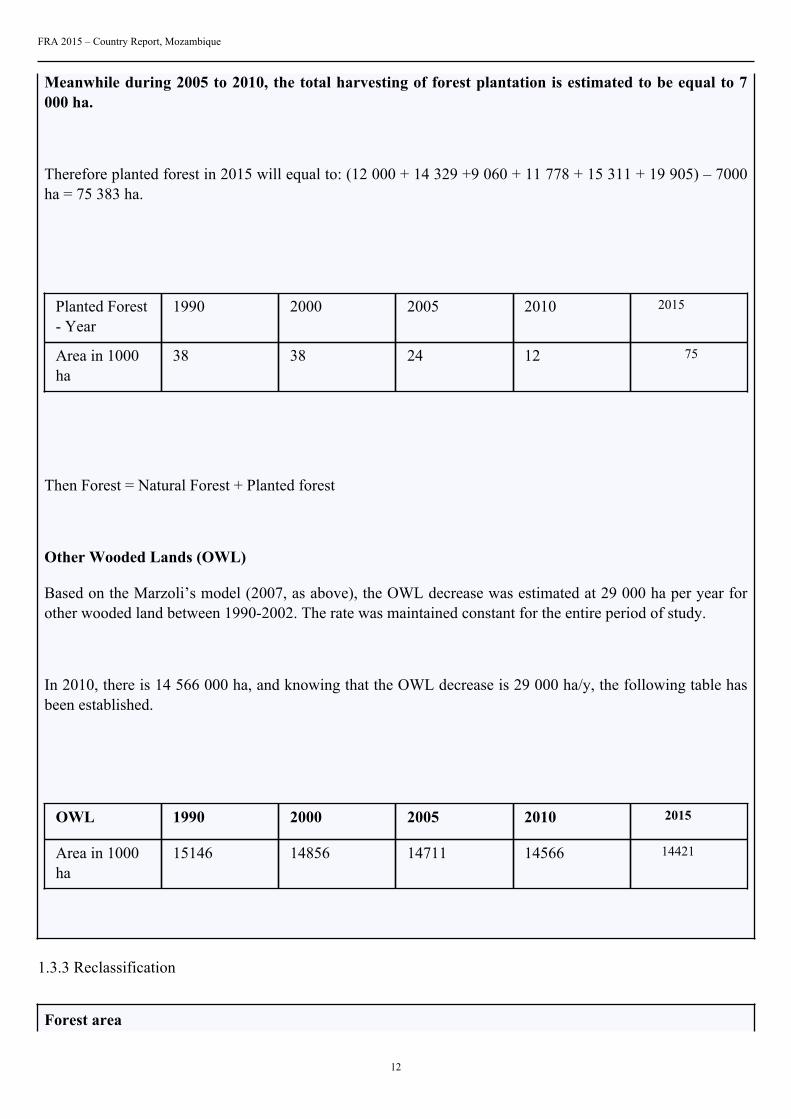
Meanwhile during 2005 to 2010, the total harvesting of forest plantation is estimated to be equal to 7000 ha.
Therefore planted forest in 2015 will equal to: (12 000 + 14 329 +9 060 + 11 778 + 15 311 + 19 905) – 7000ha = 75 383 ha.
Planted Forest- Year
1990 2000 2005 2010 2015
Area in 1000ha
38 38 24 12 75
Then Forest = Natural Forest + Planted forest
Other Wooded Lands (OWL)
Based on the Marzoli’s model (2007, as above), the OWL decrease was estimated at 29 000 ha per year forother wooded land between 1990-2002. The rate was maintained constant for the entire period of study.
In 2010, there is 14 566 000 ha, and knowing that the OWL decrease is 29 000 ha/y, the following table hasbeen established.
OWL 1990 2000 2005 2010 2015
Area in 1000ha
15146 14856 14711 14566 14421
1.3.3 Reclassification
Forest area
FRA 2015 – Country Report, Mozambique
13
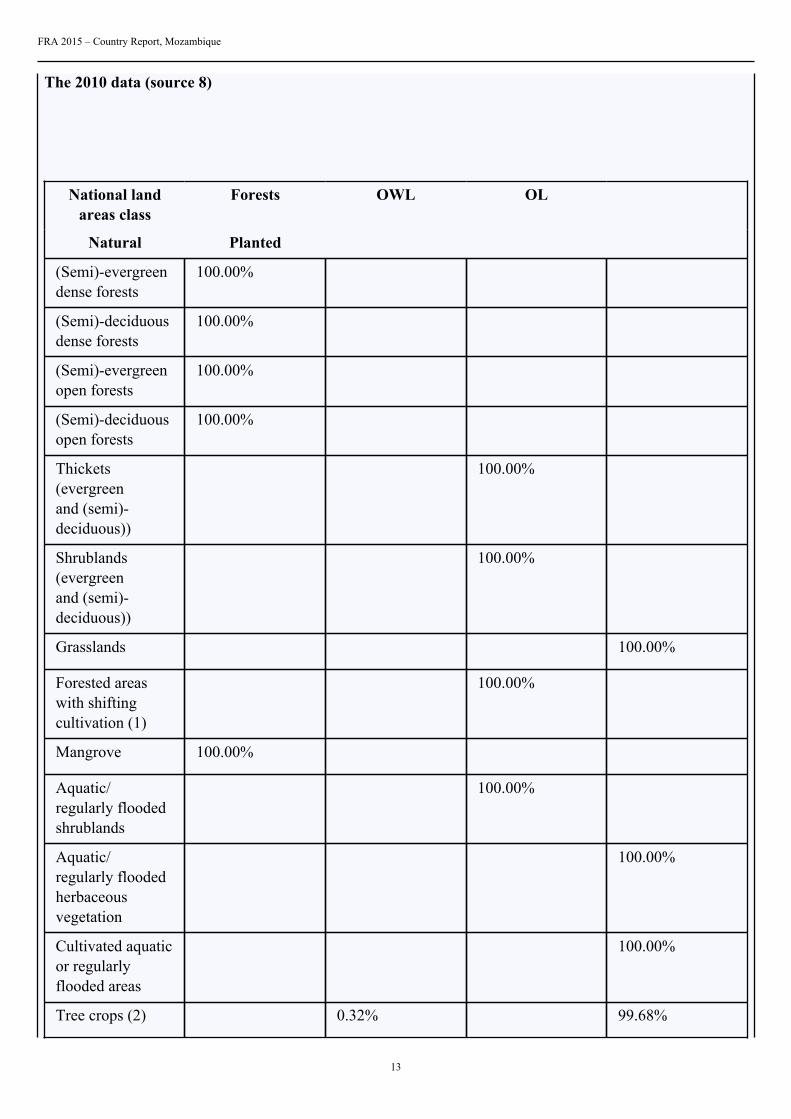
The 2010 data (source 8)
National landareas class
Forests OWL OL
Natural Planted
(Semi)-evergreendense forests
100.00%
(Semi)-deciduousdense forests
100.00%
(Semi)-evergreenopen forests
100.00%
(Semi)-deciduousopen forests
100.00%
Thickets(evergreenand (semi)-deciduous))
100.00%
Shrublands(evergreenand (semi)-deciduous))
100.00%
Grasslands 100.00%
Forested areaswith shiftingcultivation (1)
100.00%
Mangrove 100.00%
Aquatic/regularly floodedshrublands
100.00%
Aquatic/regularly floodedherbaceousvegetation
100.00%
Cultivated aquaticor regularlyflooded areas
100.00%
Tree crops (2) 0.32% 99.68%
FRA 2015 – Country Report, Mozambique
14
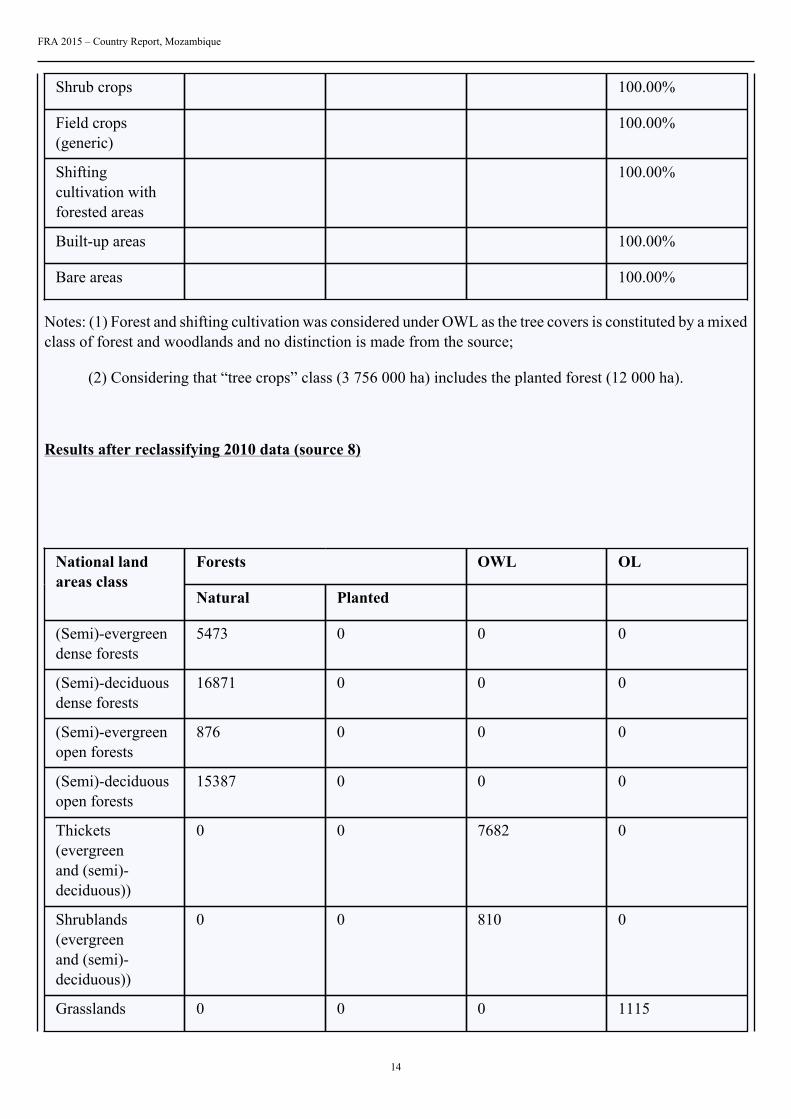
Shrub crops 100.00%
Field crops(generic)
100.00%
Shiftingcultivation withforested areas
100.00%
Built-up areas 100.00%
Bare areas 100.00%
Notes: (1) Forest and shifting cultivation was considered under OWL as the tree covers is constituted by a mixedclass of forest and woodlands and no distinction is made from the source;
(2) Considering that “tree crops” class (3 756 000 ha) includes the planted forest (12 000 ha).
Results after reclassifying 2010 data (source 8)
Forests OWL OLNational landareas class
Natural Planted
(Semi)-evergreendense forests
5473 0 0 0
(Semi)-deciduousdense forests
16871 0 0 0
(Semi)-evergreenopen forests
876 0 0 0
(Semi)-deciduousopen forests
15387 0 0 0
Thickets(evergreenand (semi)-deciduous))
0 0 7682 0
Shrublands(evergreenand (semi)-deciduous))
0 0 810 0
Grasslands 0 0 0 1115
FRA 2015 – Country Report, Mozambique
15
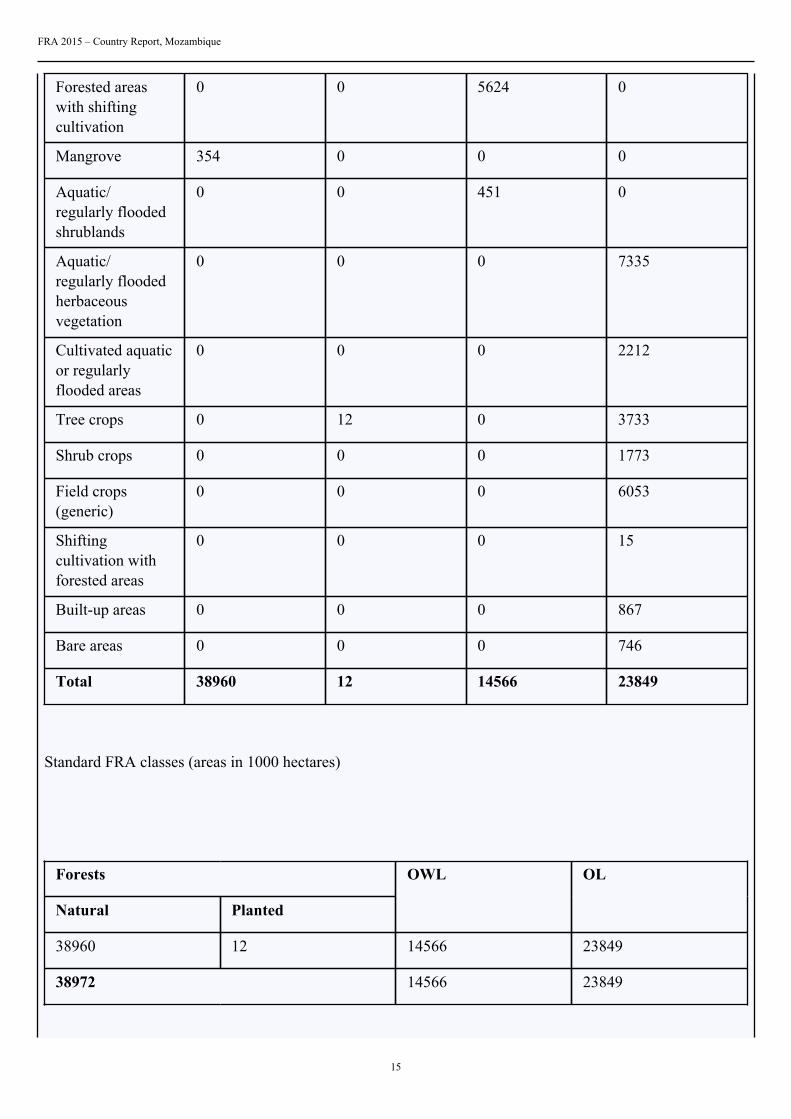
Forested areaswith shiftingcultivation
0 0 5624 0
Mangrove 354 0 0 0
Aquatic/regularly floodedshrublands
0 0 451 0
Aquatic/regularly floodedherbaceousvegetation
0 0 0 7335
Cultivated aquaticor regularlyflooded areas
0 0 0 2212
Tree crops 0 12 0 3733
Shrub crops 0 0 0 1773
Field crops(generic)
0 0 0 6053
Shiftingcultivation withforested areas
0 0 0 15
Built-up areas 0 0 0 867
Bare areas 0 0 0 746
Total 38960 12 14566 23849
Standard FRA classes (areas in 1000 hectares)
Forests
Natural Planted
OWL
OL
38960 12 14566 23849
38972 14566 23849
FRA 2015 – Country Report, Mozambique
16
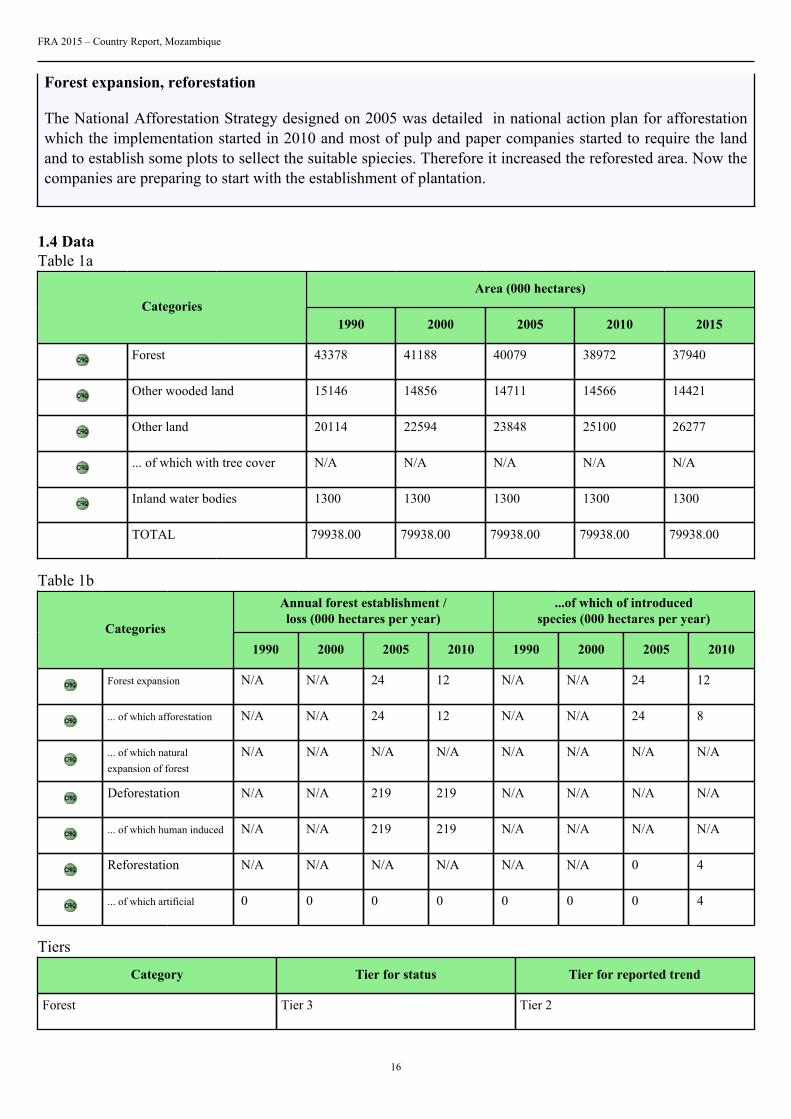
Forest expansion, reforestation
The National Afforestation Strategy designed on 2005 was detailed in national action plan for afforestationwhich the implementation started in 2010 and most of pulp and paper companies started to require the landand to establish some plots to sellect the suitable spiecies. Therefore it increased the reforested area. Now thecompanies are preparing to start with the establishment of plantation.
1.4 DataTable 1a
Area (000 hectares)Categories
1990 2000 2005 2010 2015
Forest 43378 41188 40079 38972 37940
Other wooded land 15146 14856 14711 14566 14421
Other land 20114 22594 23848 25100 26277
... of which with tree cover N/A N/A N/A N/A N/A
Inland water bodies 1300 1300 1300 1300 1300
TOTAL 79938.00 79938.00 79938.00 79938.00 79938.00
Table 1bAnnual forest establishment /loss (000 hectares per year)
...of which of introducedspecies (000 hectares per year)
Categories1990 2000 2005 2010 1990 2000 2005 2010
Forest expansion N/A N/A 24 12 N/A N/A 24 12
... of which afforestation N/A N/A 24 12 N/A N/A 24 8
... of which naturalexpansion of forest
N/A N/A N/A N/A N/A N/A N/A N/A
Deforestation N/A N/A 219 219 N/A N/A N/A N/A
... of which human induced N/A N/A 219 219 N/A N/A N/A N/A
Reforestation N/A N/A N/A N/A N/A N/A 0 4
... of which artificial 0 0 0 0 0 0 0 4
Tiers
Category Tier for status Tier for reported trend
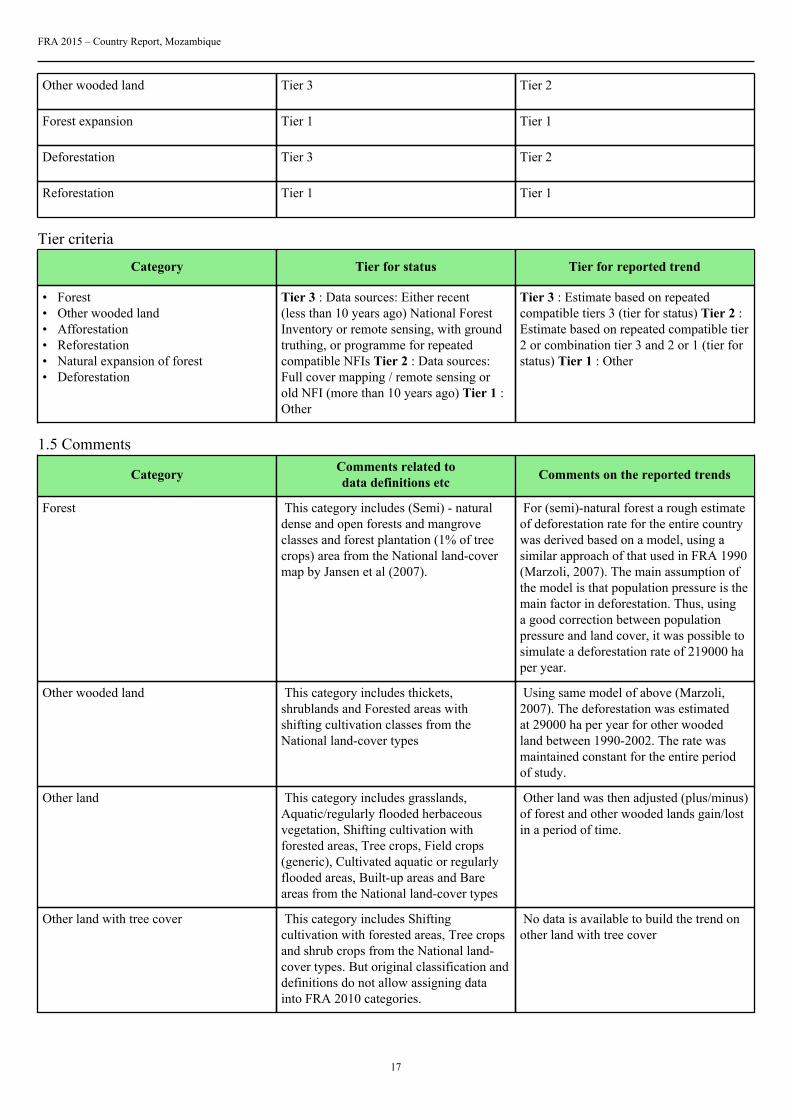
Forest Tier 3 Tier 2
FRA 2015 – Country Report, Mozambique
17
Other wooded land Tier 3 Tier 2
Forest expansion Tier 1 Tier 1
Deforestation Tier 3 Tier 2
Reforestation Tier 1 Tier 1
Tier criteria
Category Tier for status Tier for reported trend
• Forest• Other wooded land• Afforestation• Reforestation• Natural expansion of forest• Deforestation
Tier 3 : Data sources: Either recent(less than 10 years ago) National ForestInventory or remote sensing, with groundtruthing, or programme for repeatedcompatible NFIs Tier 2 : Data sources:Full cover mapping / remote sensing orold NFI (more than 10 years ago) Tier 1 :Other
Tier 3 : Estimate based on repeatedcompatible tiers 3 (tier for status) Tier 2 :Estimate based on repeated compatible tier2 or combination tier 3 and 2 or 1 (tier forstatus) Tier 1 : Other
1.5 Comments
Category Comments related todata definitions etc Comments on the reported trends
Forest This category includes (Semi) - naturaldense and open forests and mangroveclasses and forest plantation (1% of treecrops) area from the National land-covermap by Jansen et al (2007).
For (semi)-natural forest a rough estimateof deforestation rate for the entire countrywas derived based on a model, using asimilar approach of that used in FRA 1990(Marzoli, 2007). The main assumption ofthe model is that population pressure is themain factor in deforestation. Thus, usinga good correction between populationpressure and land cover, it was possible tosimulate a deforestation rate of 219000 haper year.
Other wooded land This category includes thickets,shrublands and Forested areas withshifting cultivation classes from theNational land-cover types
Using same model of above (Marzoli,2007). The deforestation was estimatedat 29000 ha per year for other woodedland between 1990-2002. The rate wasmaintained constant for the entire periodof study.
Other land This category includes grasslands,Aquatic/regularly flooded herbaceousvegetation, Shifting cultivation withforested areas, Tree crops, Field crops(generic), Cultivated aquatic or regularlyflooded areas, Built-up areas and Bareareas from the National land-cover types
Other land was then adjusted (plus/minus)of forest and other wooded lands gain/lostin a period of time.
Other land with tree cover This category includes Shiftingcultivation with forested areas, Tree cropsand shrub crops from the National land-cover types. But original classification anddefinitions do not allow assigning datainto FRA 2010 categories.
No data is available to build the trend onother land with tree cover
FRA 2015 – Country Report, Mozambique
18
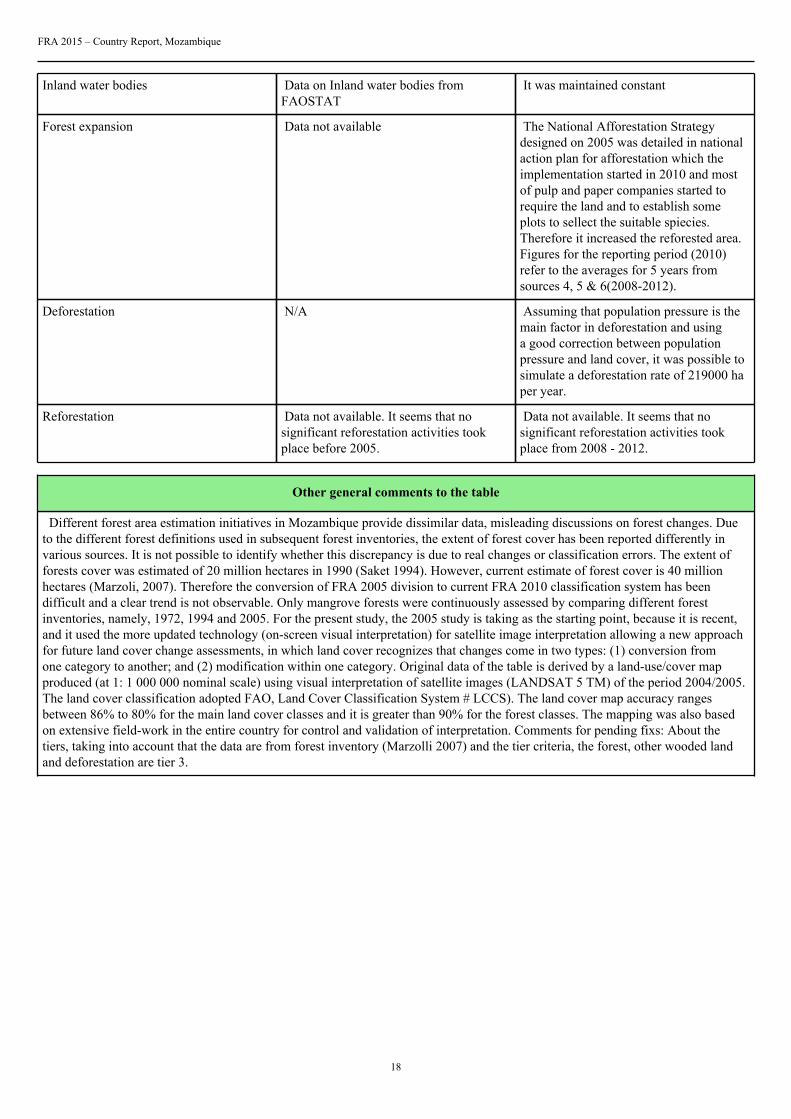
Inland water bodies Data on Inland water bodies fromFAOSTAT
It was maintained constant
Forest expansion Data not available The National Afforestation Strategydesigned on 2005 was detailed in nationalaction plan for afforestation which theimplementation started in 2010 and mostof pulp and paper companies started torequire the land and to establish someplots to sellect the suitable spiecies.Therefore it increased the reforested area.Figures for the reporting period (2010)refer to the averages for 5 years fromsources 4, 5 & 6(2008-2012).
Deforestation N/A Assuming that population pressure is themain factor in deforestation and usinga good correction between populationpressure and land cover, it was possible tosimulate a deforestation rate of 219000 haper year.
Reforestation Data not available. It seems that nosignificant reforestation activities tookplace before 2005.
Data not available. It seems that nosignificant reforestation activities tookplace from 2008 - 2012.
Other general comments to the table
Different forest area estimation initiatives in Mozambique provide dissimilar data, misleading discussions on forest changes. Dueto the different forest definitions used in subsequent forest inventories, the extent of forest cover has been reported differently invarious sources. It is not possible to identify whether this discrepancy is due to real changes or classification errors. The extent offorests cover was estimated of 20 million hectares in 1990 (Saket 1994). However, current estimate of forest cover is 40 millionhectares (Marzoli, 2007). Therefore the conversion of FRA 2005 division to current FRA 2010 classification system has beendifficult and a clear trend is not observable. Only mangrove forests were continuously assessed by comparing different forestinventories, namely, 1972, 1994 and 2005. For the present study, the 2005 study is taking as the starting point, because it is recent,and it used the more updated technology (on-screen visual interpretation) for satellite image interpretation allowing a new approachfor future land cover change assessments, in which land cover recognizes that changes come in two types: (1) conversion fromone category to another; and (2) modification within one category. Original data of the table is derived by a land-use/cover mapproduced (at 1: 1 000 000 nominal scale) using visual interpretation of satellite images (LANDSAT 5 TM) of the period 2004/2005.The land cover classification adopted FAO, Land Cover Classification System # LCCS). The land cover map accuracy rangesbetween 86% to 80% for the main land cover classes and it is greater than 90% for the forest classes. The mapping was also basedon extensive field-work in the entire country for control and validation of interpretation. Comments for pending fixs: About thetiers, taking into account that the data are from forest inventory (Marzolli 2007) and the tier criteria, the forest, other wooded landand deforestation are tier 3.
FRA 2015 – Country Report, Mozambique
19
2. What is the area of natural and planted forest and how has it changed over time?Documents for this question:
• Guide for country reporting FRA 2015• FRA 2015 Terms and Definitions
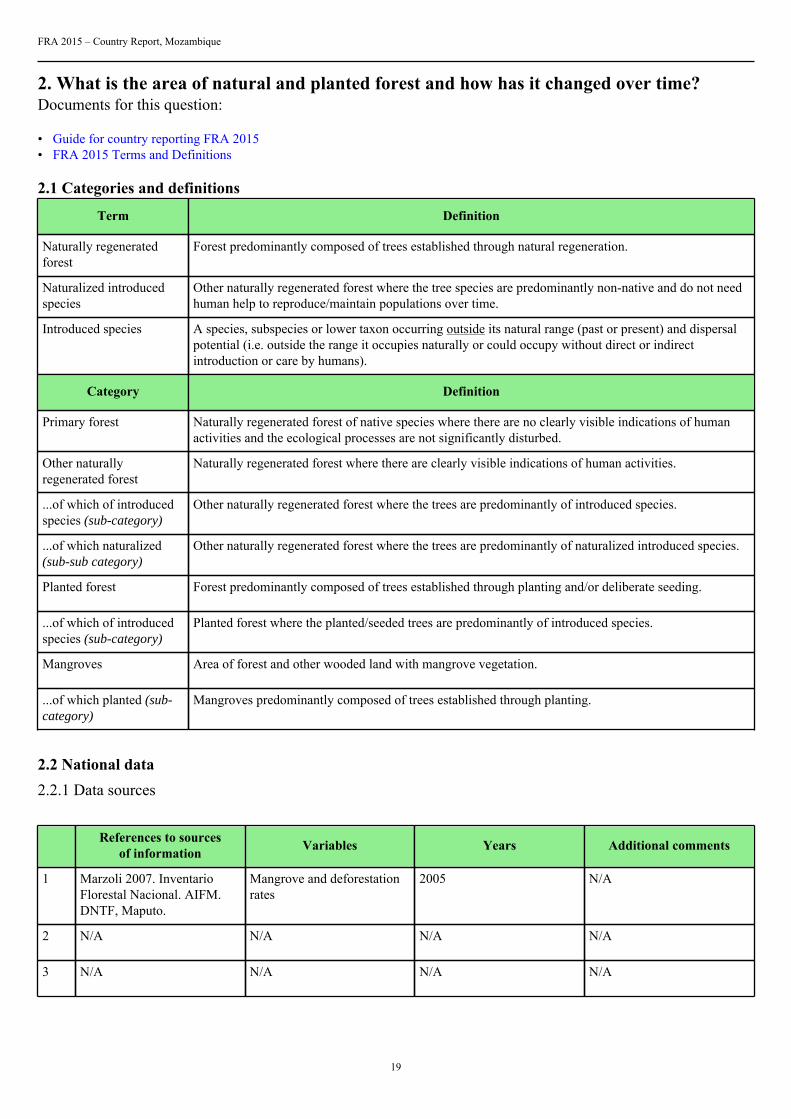
2.1 Categories and definitions
Term Definition
Naturally regeneratedforest
Forest predominantly composed of trees established through natural regeneration.
Naturalized introducedspecies
Other naturally regenerated forest where the tree species are predominantly non-native and do not needhuman help to reproduce/maintain populations over time.
Introduced species A species, subspecies or lower taxon occurring outside its natural range (past or present) and dispersalpotential (i.e. outside the range it occupies naturally or could occupy without direct or indirectintroduction or care by humans).
Category Definition
Primary forest Naturally regenerated forest of native species where there are no clearly visible indications of humanactivities and the ecological processes are not significantly disturbed.
Other naturallyregenerated forest
Naturally regenerated forest where there are clearly visible indications of human activities.
...of which of introducedspecies (sub-category)
Other naturally regenerated forest where the trees are predominantly of introduced species.
...of which naturalized(sub-sub category)
Other naturally regenerated forest where the trees are predominantly of naturalized introduced species.
Planted forest Forest predominantly composed of trees established through planting and/or deliberate seeding.
...of which of introducedspecies (sub-category)
Planted forest where the planted/seeded trees are predominantly of introduced species.
Mangroves Area of forest and other wooded land with mangrove vegetation.
...of which planted (sub-category)
Mangroves predominantly composed of trees established through planting.
2.2 National data2.2.1 Data sources
References to sourcesof information Variables Years Additional comments
1 Marzoli 2007. InventarioFlorestal Nacional. AIFM.DNTF, Maputo.
Mangrove and deforestationrates
2005 N/A
2 N/A N/A N/A N/A
3 N/A N/A N/A N/A
FRA 2015 – Country Report, Mozambique
20
4 N/A N/A N/A N/A
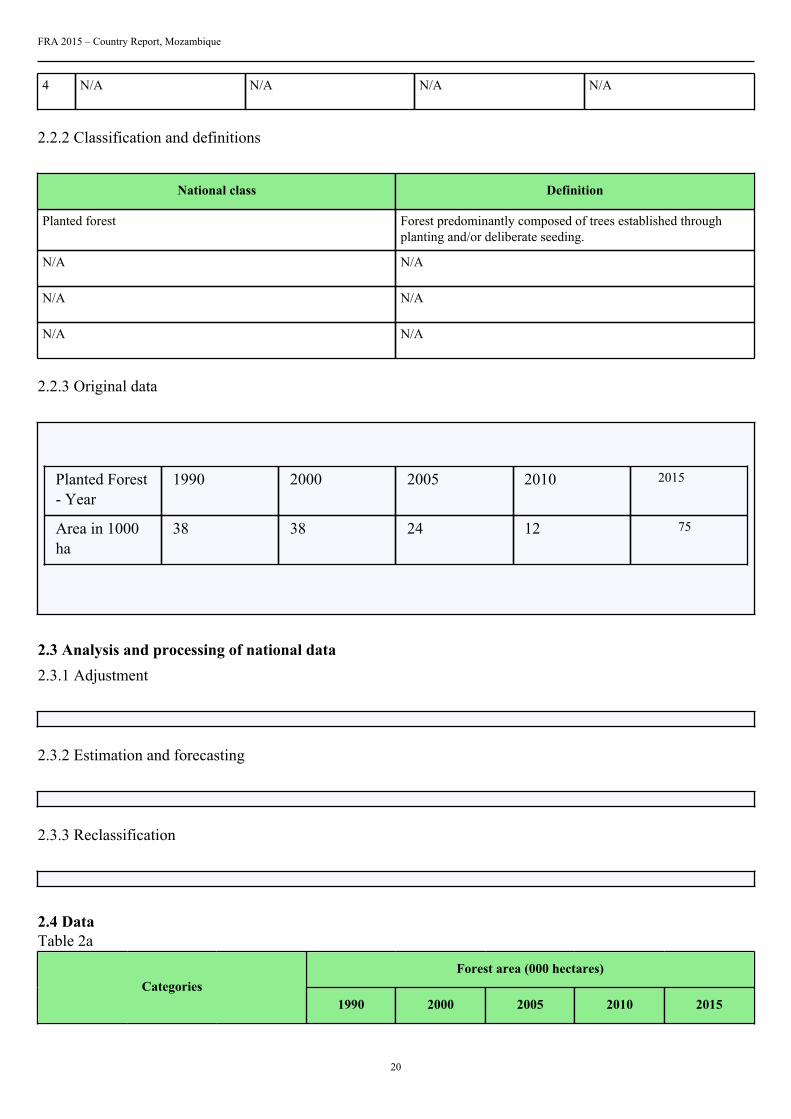
2.2.2 Classification and definitions
National class Definition
Planted forest Forest predominantly composed of trees established throughplanting and/or deliberate seeding.
N/A N/A
N/A N/A
N/A N/A
2.2.3 Original data
Planted Forest- Year
1990 2000 2005 2010 2015
Area in 1000ha
38 38 24 12 75
2.3 Analysis and processing of national data2.3.1 Adjustment
2.3.2 Estimation and forecasting
2.3.3 Reclassification
2.4 DataTable 2a
Forest area (000 hectares)Categories
1990 2000 2005 2010 2015
FRA 2015 – Country Report, Mozambique
21
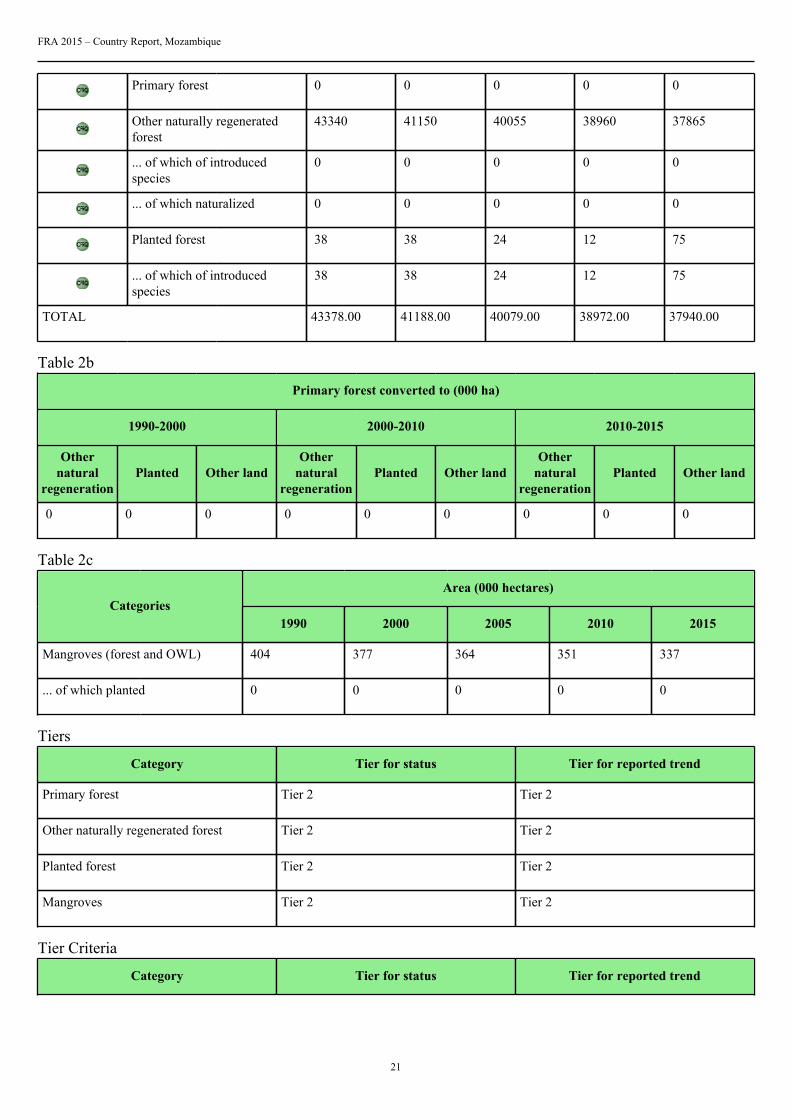
Primary forest 0 0 0 0 0
Other naturally regeneratedforest
43340 41150 40055 38960 37865
... of which of introducedspecies
0 0 0 0 0
... of which naturalized 0 0 0 0 0
Planted forest 38 38 24 12 75
... of which of introducedspecies
38 38 24 12 75
TOTAL 43378.00 41188.00 40079.00 38972.00 37940.00
Table 2b
Primary forest converted to (000 ha)
1990-2000 2000-2010 2010-2015
Othernatural
regenerationPlanted Other land
Othernatural
regenerationPlanted Other land
Othernatural
regenerationPlanted Other land
0 0 0 0 0 0 0 0 0
Table 2c
Area (000 hectares)Categories
1990 2000 2005 2010 2015
Mangroves (forest and OWL) 404 377 364 351 337
... of which planted 0 0 0 0 0
Tiers
Category Tier for status Tier for reported trend
Primary forest Tier 2 Tier 2
Other naturally regenerated forest Tier 2 Tier 2
Planted forest Tier 2 Tier 2
Mangroves Tier 2 Tier 2
Tier Criteria
Category Tier for status Tier for reported trend
FRA 2015 – Country Report, Mozambique
22
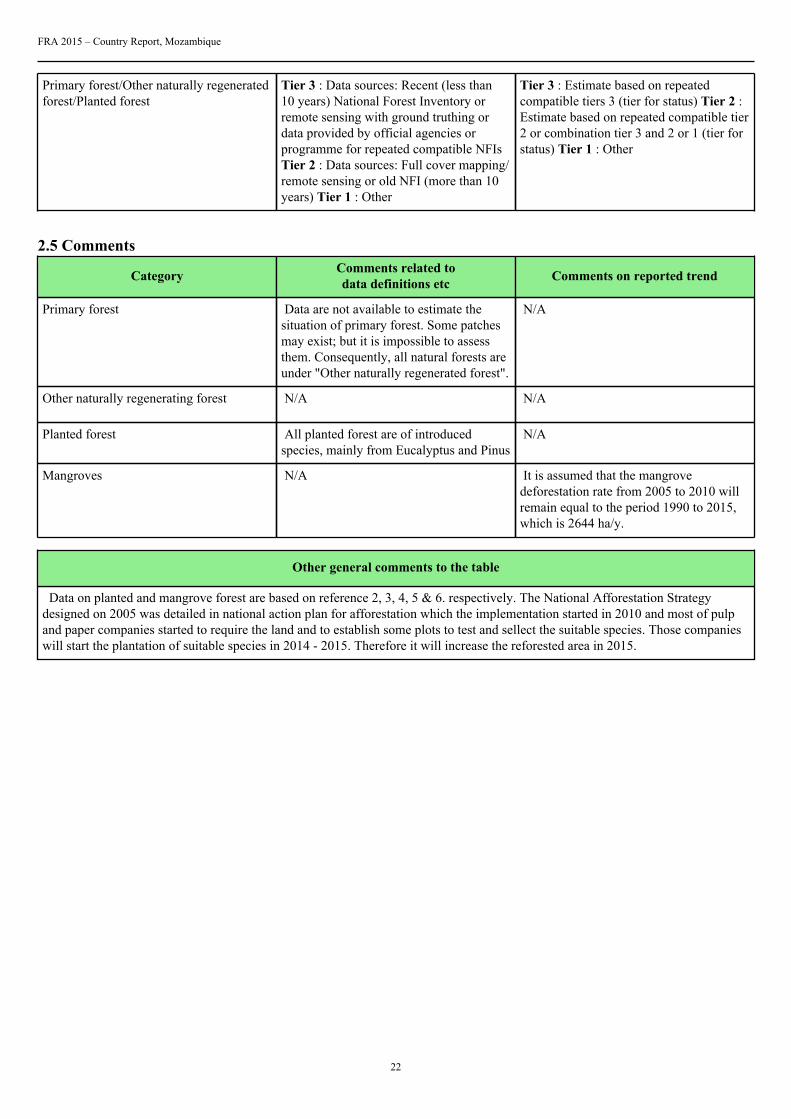
Primary forest/Other naturally regeneratedforest/Planted forest
Tier 3 : Data sources: Recent (less than10 years) National Forest Inventory orremote sensing with ground truthing ordata provided by official agencies orprogramme for repeated compatible NFIsTier 2 : Data sources: Full cover mapping/remote sensing or old NFI (more than 10years) Tier 1 : Other
Tier 3 : Estimate based on repeatedcompatible tiers 3 (tier for status) Tier 2 :Estimate based on repeated compatible tier2 or combination tier 3 and 2 or 1 (tier forstatus) Tier 1 : Other
2.5 Comments
Category Comments related todata definitions etc Comments on reported trend
Primary forest Data are not available to estimate thesituation of primary forest. Some patchesmay exist; but it is impossible to assessthem. Consequently, all natural forests areunder "Other naturally regenerated forest".
N/A
Other naturally regenerating forest N/A N/A
Planted forest All planted forest are of introducedspecies, mainly from Eucalyptus and Pinus
N/A
Mangroves N/A It is assumed that the mangrovedeforestation rate from 2005 to 2010 willremain equal to the period 1990 to 2015,which is 2644 ha/y.
Other general comments to the table
Data on planted and mangrove forest are based on reference 2, 3, 4, 5 & 6. respectively. The National Afforestation Strategydesigned on 2005 was detailed in national action plan for afforestation which the implementation started in 2010 and most of pulpand paper companies started to require the land and to establish some plots to test and sellect the suitable species. Those companieswill start the plantation of suitable species in 2014 - 2015. Therefore it will increase the reforested area in 2015.
FRA 2015 – Country Report, Mozambique
23
3. What are the stocks and growth rates of the forests and how have they changed?Documents for this question:
• Guide for country reporting FRA 2015• FRA 2015 Terms and Definitions
3.1 Categories and definitions
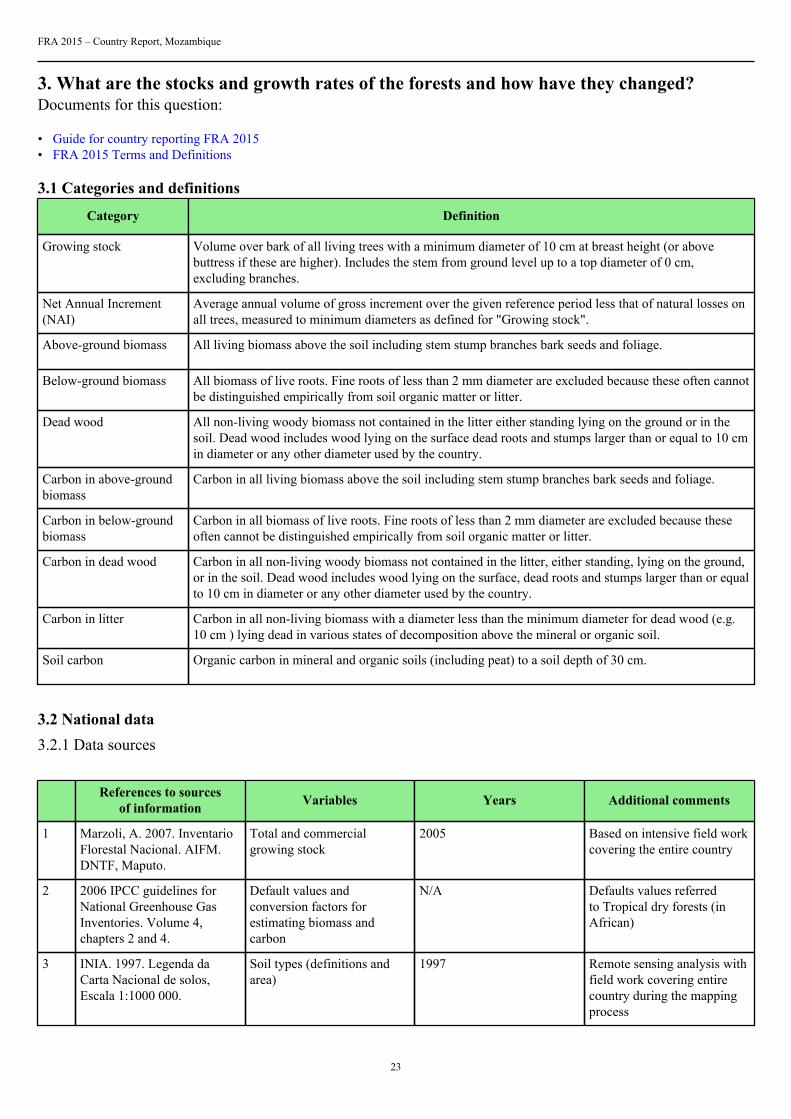
Category Definition
Growing stock Volume over bark of all living trees with a minimum diameter of 10 cm at breast height (or abovebuttress if these are higher). Includes the stem from ground level up to a top diameter of 0 cm,excluding branches.
Net Annual Increment(NAI)
Average annual volume of gross increment over the given reference period less that of natural losses onall trees, measured to minimum diameters as defined for "Growing stock".
Above-ground biomass All living biomass above the soil including stem stump branches bark seeds and foliage.
Below-ground biomass All biomass of live roots. Fine roots of less than 2 mm diameter are excluded because these often cannotbe distinguished empirically from soil organic matter or litter.
Dead wood All non-living woody biomass not contained in the litter either standing lying on the ground or in thesoil. Dead wood includes wood lying on the surface dead roots and stumps larger than or equal to 10 cmin diameter or any other diameter used by the country.
Carbon in above-groundbiomass
Carbon in all living biomass above the soil including stem stump branches bark seeds and foliage.
Carbon in below-groundbiomass
Carbon in all biomass of live roots. Fine roots of less than 2 mm diameter are excluded because theseoften cannot be distinguished empirically from soil organic matter or litter.
Carbon in dead wood Carbon in all non-living woody biomass not contained in the litter, either standing, lying on the ground,or in the soil. Dead wood includes wood lying on the surface, dead roots and stumps larger than or equalto 10 cm in diameter or any other diameter used by the country.
Carbon in litter Carbon in all non-living biomass with a diameter less than the minimum diameter for dead wood (e.g.10 cm ) lying dead in various states of decomposition above the mineral or organic soil.
Soil carbon Organic carbon in mineral and organic soils (including peat) to a soil depth of 30 cm.
3.2 National data3.2.1 Data sources
References to sourcesof information Variables Years Additional comments
1 Marzoli, A. 2007. InventarioFlorestal Nacional. AIFM.DNTF, Maputo.
Total and commercialgrowing stock
2005 Based on intensive field workcovering the entire country
2 2006 IPCC guidelines forNational Greenhouse GasInventories. Volume 4,chapters 2 and 4.
Default values andconversion factors forestimating biomass andcarbon
N/A Defaults values referredto Tropical dry forests (inAfrican)
3 INIA. 1997. Legenda daCarta Nacional de solos,Escala 1:1000 000.
Soil types (definitions andarea)
1997 Remote sensing analysis withfield work covering entirecountry during the mappingprocess
FRA 2015 – Country Report, Mozambique
24
4 N/A N/A N/A N/A
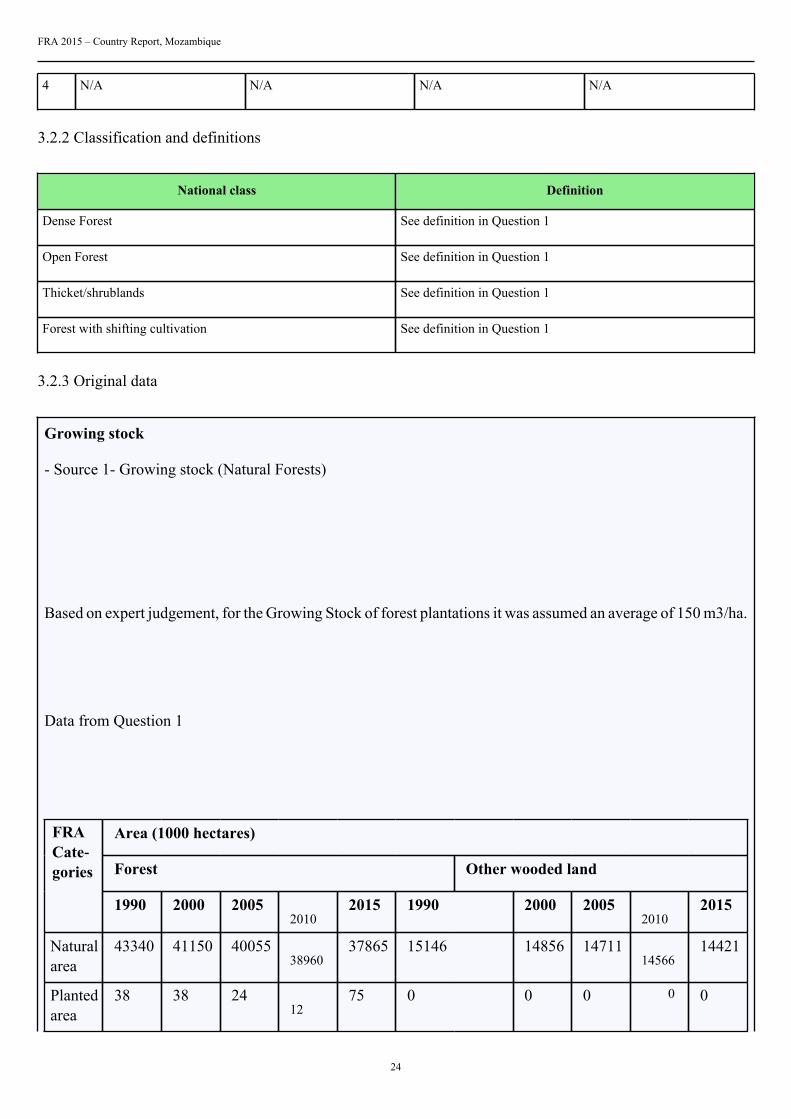
3.2.2 Classification and definitions
National class Definition
Dense Forest See definition in Question 1
Open Forest See definition in Question 1
Thicket/shrublands See definition in Question 1
Forest with shifting cultivation See definition in Question 1
3.2.3 Original data
Growing stock
- Source 1- Growing stock (Natural Forests)
Based on expert judgement, for the Growing Stock of forest plantations it was assumed an average of 150 m3/ha.
Data from Question 1
Area (1000 hectares)
Forest Other wooded land
FRACate-gories
1990 2000 2005 2010
2015 1990 2000 2005 2010
2015
Naturalarea
43340 41150 40055 38960
37865 15146 14856 14711 14566
14421
Plantedarea
38 38 24 12
75
0 0 0 0 0
FRA 2015 – Country Report, Mozambique
25
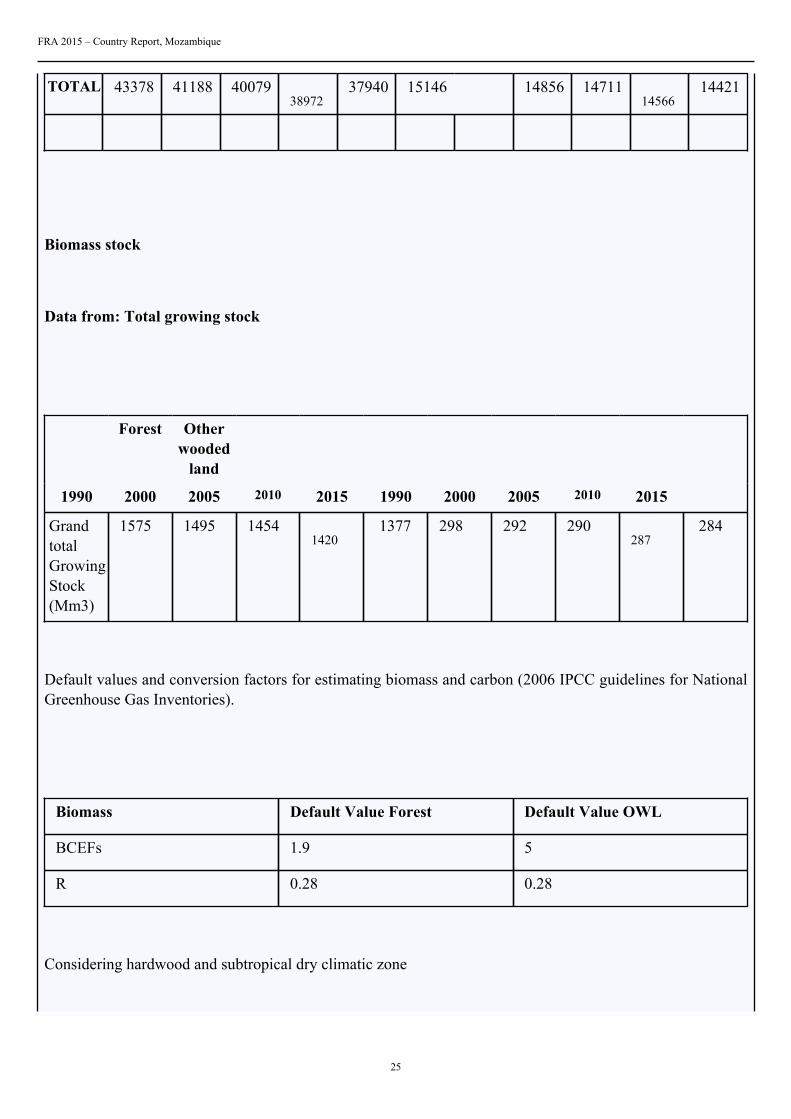
TOTAL 43378 41188 40079 38972
37940 15146 14856 14711 14566
14421
Biomass stock
Data from: Total growing stock
Forest Otherwooded
land
1990 2000 2005 2010 2015 1990 2000 2005 2010 2015
GrandtotalGrowingStock(Mm3)
1575 1495 1454 1420
1377 298 292 290 287
284
Default values and conversion factors for estimating biomass and carbon (2006 IPCC guidelines for NationalGreenhouse Gas Inventories).
Biomass Default Value Forest Default Value OWL
BCEFs 1.9 5
R 0.28 0.28
Considering hardwood and subtropical dry climatic zone
FRA 2015 – Country Report, Mozambique
26
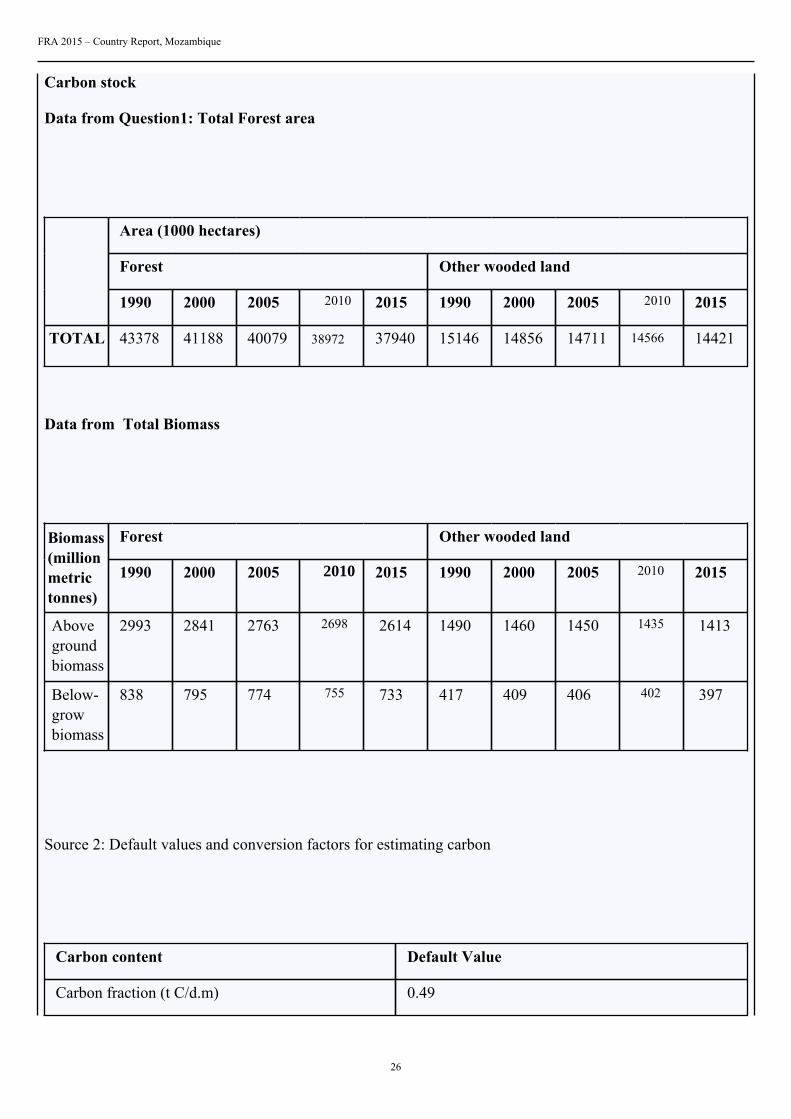
Carbon stock
Data from Question1: Total Forest area
Area (1000 hectares)
Forest Other wooded land
1990 2000 2005 2010 2015 1990 2000 2005 2010 2015
TOTAL 43378 41188 40079 38972 37940 15146 14856 14711
14566 14421
Data from Total Biomass
Forest Other wooded landBiomass(millionmetrictonnes)
1990 2000 2005 2010 2015 1990 2000 2005 2010 2015
Abovegroundbiomass
2993 2841 2763 2698 2614 1490 1460 1450 1435 1413
Below-growbiomass
838 795 774 755 733 417 409 406 402 397
Source 2: Default values and conversion factors for estimating carbon
Carbon content Default Value
Carbon fraction (t C/d.m) 0.49
FRA 2015 – Country Report, Mozambique
27
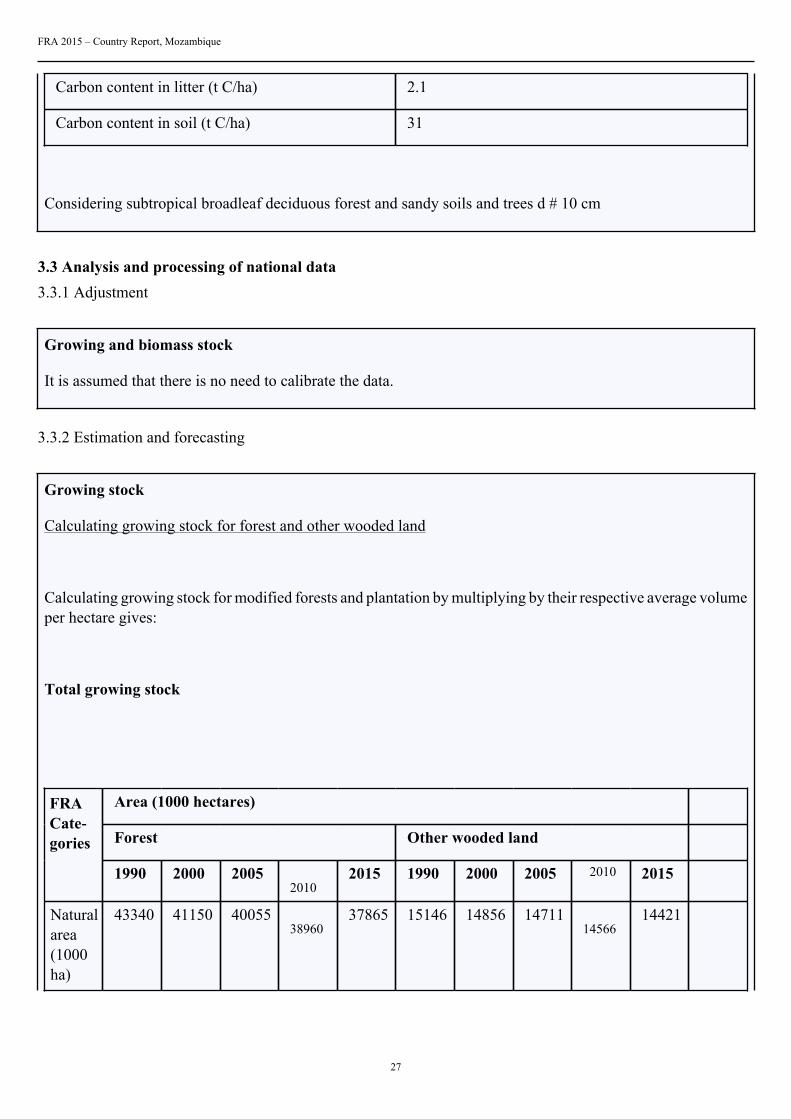
Carbon content in litter (t C/ha) 2.1
Carbon content in soil (t C/ha) 31
Considering subtropical broadleaf deciduous forest and sandy soils and trees d # 10 cm
3.3 Analysis and processing of national data3.3.1 Adjustment
Growing and biomass stock
It is assumed that there is no need to calibrate the data.
3.3.2 Estimation and forecasting
Growing stock
Calculating growing stock for forest and other wooded land
Calculating growing stock for modified forests and plantation by multiplying by their respective average volumeper hectare gives:
Total growing stock
Area (1000 hectares)
Forest Other wooded land
FRACate-gories
1990 2000 2005 2010
2015 1990 2000 2005 2010 2015
Naturalarea(1000ha)
43340 41150 40055 38960
37865 15146 14856 14711 14566
14421
FRA 2015 – Country Report, Mozambique
28
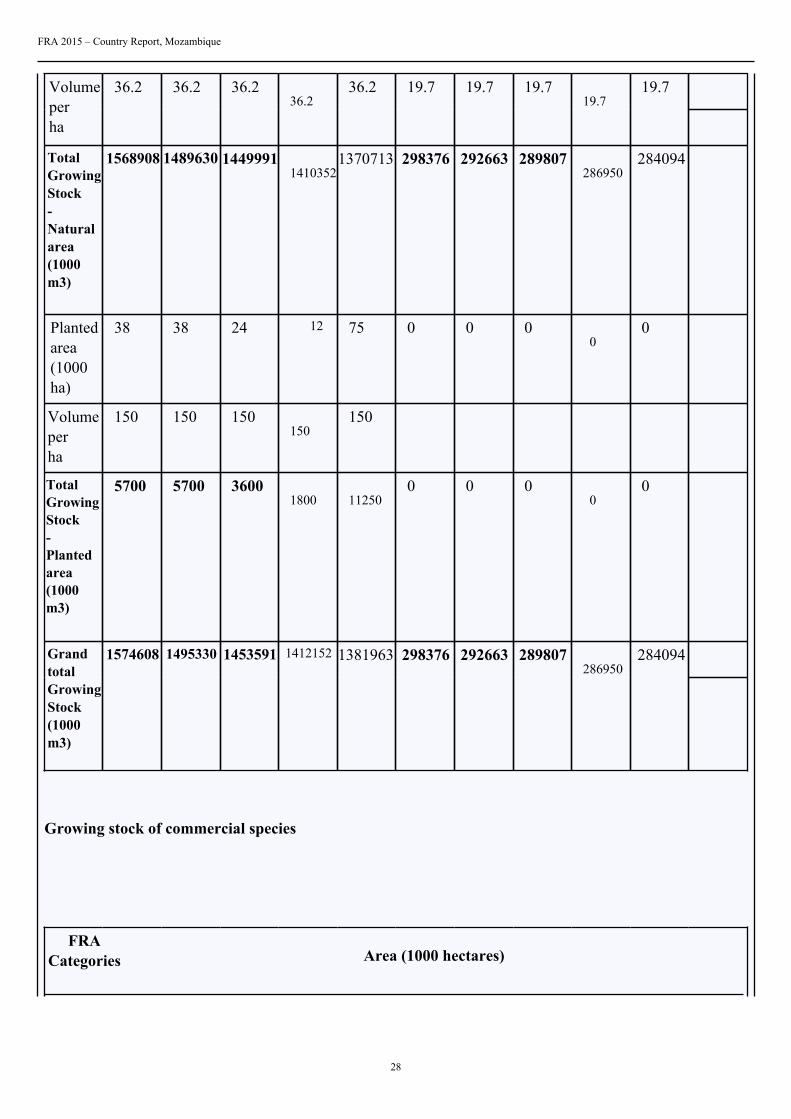
Volumeperha
36.2 36.2 36.2 36.2
36.2 19.7 19.7 19.7 19.7
19.7
TotalGrowingStock-Naturalarea(1000m3)
1568908 1489630 1449991 1410352
1370713 298376 292663 289807 286950
284094
Plantedarea(1000ha)
38 38 24 12 75 0 0 0 0
0
Volumeperha
150 150 150 150
150
TotalGrowingStock-Plantedarea(1000m3)
5700 5700 3600 1800
11250
0 0 0 0
0
GrandtotalGrowingStock(1000m3)
1574608 1495330 1453591 1412152 1381963 298376 292663 289807 286950
284094
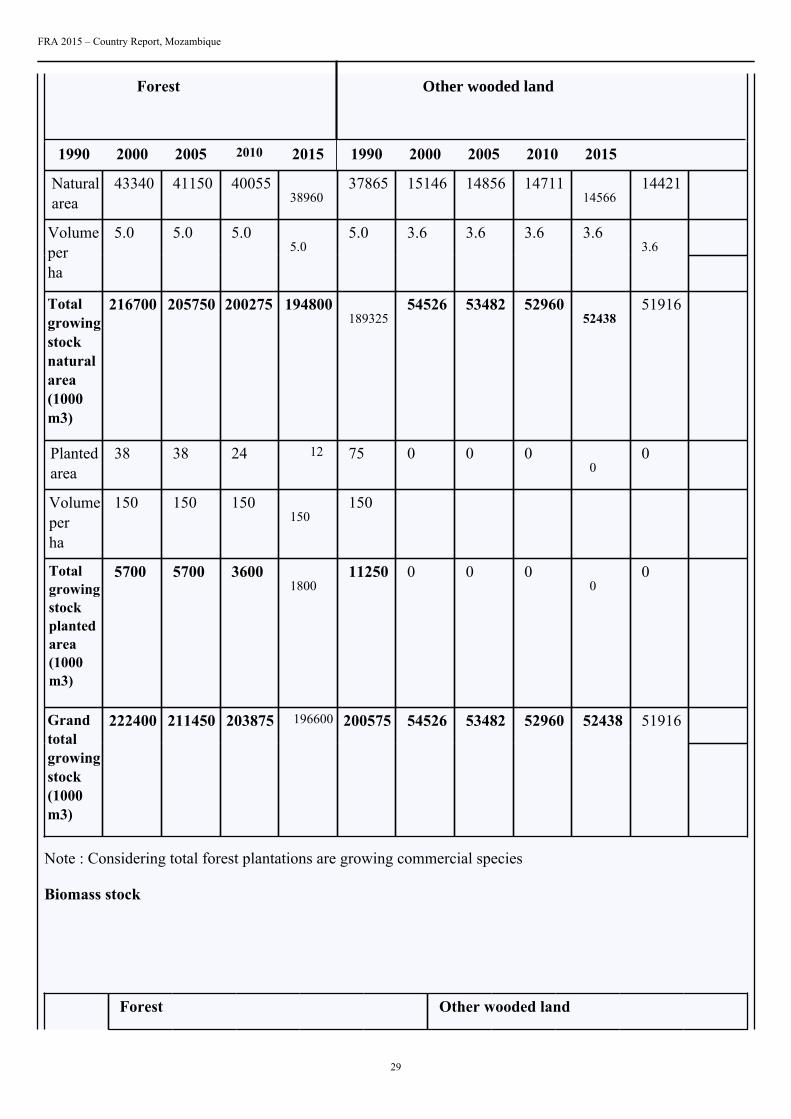
Growing stock of commercial species
FRACategories Area (1000 hectares)
FRA 2015 – Country Report, Mozambique
29
Forest
1990 2000 2005 2010 2015 1990 2000 2005 2010 2015
Naturalarea
43340 41150 40055 38960
37865 15146 14856 14711 14566
14421
Volumeperha
5.0 5.0 5.0 5.0
5.0 3.6 3.6 3.6 3.6 3.6
Totalgrowingstocknaturalarea(1000m3)
216700 205750 200275 194800 189325
54526 53482 52960 52438
51916
Plantedarea
38 38 24 12 75 0 0 0 0
0
Volumeperha
150 150 150 150
150
Totalgrowingstockplantedarea(1000m3)
5700 5700 3600 1800
11250 0 0 0 0
0
Grandtotalgrowingstock(1000m3)
222400 211450 203875 196600 200575 54526 53482 52960 52438 51916
Note : Considering total forest plantations are growing commercial species
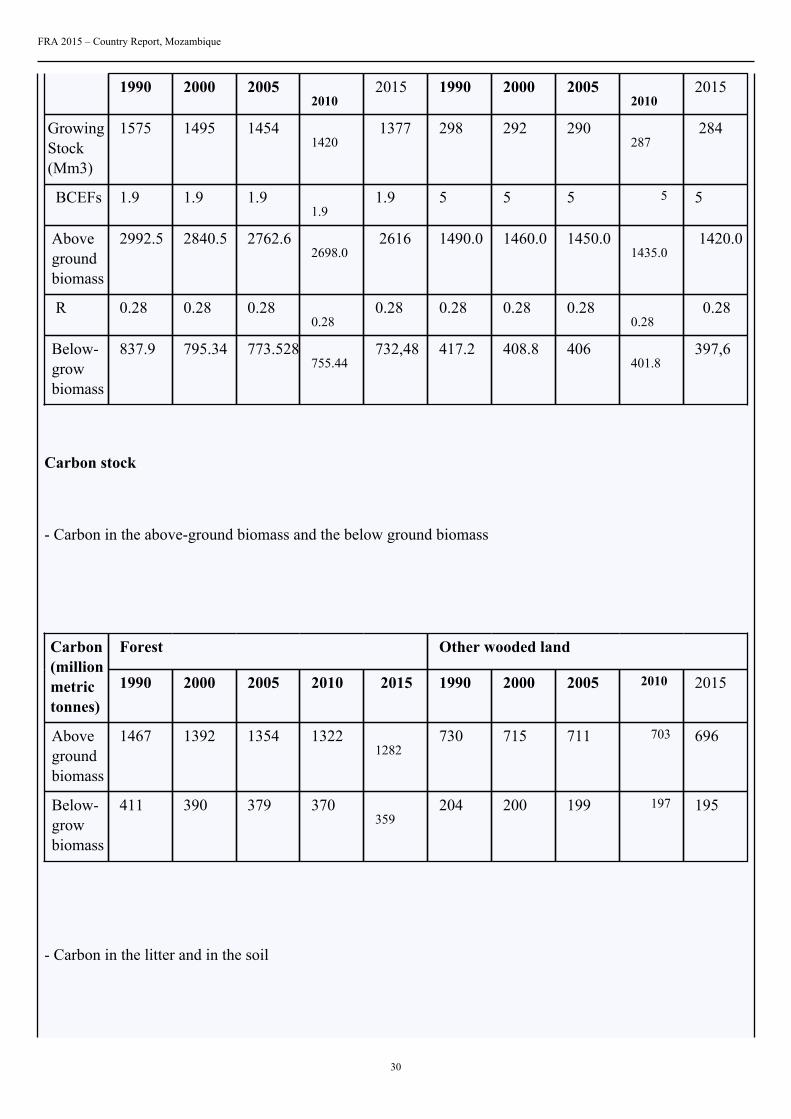
Biomass stock
Forest Other wooded land
Other wooded land
FRA 2015 – Country Report, Mozambique
30
1990 2000 2005 2010
2015 1990 2000 2005 2010
2015
GrowingStock(Mm3)
1575 1495 1454 1420
1377 298 292 290 287
284
BCEFs 1.9 1.9 1.9 1.9
1.9 5 5 5 5 5
Abovegroundbiomass
2992.5 2840.5 2762.6 2698.0
2616 1490.0 1460.0 1450.0 1435.0
1420.0
R 0.28 0.28 0.28 0.28
0.28 0.28 0.28 0.28 0.28
0.28
Below-growbiomass
837.9 795.34 773.528 755.44
732,48 417.2 408.8 406 401.8
397,6
Carbon stock
- Carbon in the above-ground biomass and the below ground biomass
Forest Other wooded landCarbon(millionmetrictonnes)
1990 2000 2005 2010 2015 1990 2000 2005 2010 2015
Abovegroundbiomass
1467 1392 1354 1322 1282
730 715 711 703 696
Below-growbiomass
411 390 379 370 359
204 200 199 197 195
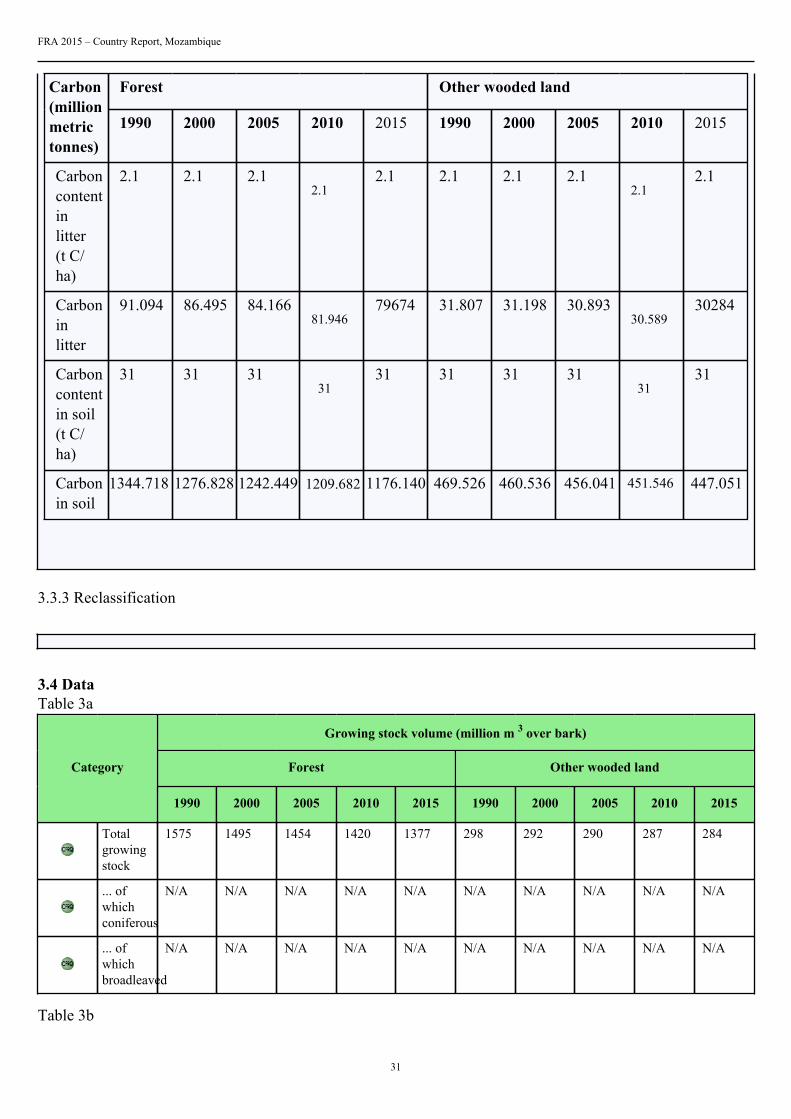
- Carbon in the litter and in the soil
FRA 2015 – Country Report, Mozambique
31
Forest Other wooded landCarbon(millionmetrictonnes)
1990 2000 2005 2010 2015 1990 2000 2005 2010 2015
Carboncontentinlitter(t C/ha)
2.1 2.1 2.1 2.1
2.1 2.1 2.1 2.1 2.1
2.1
Carboninlitter
91.094 86.495 84.166 81.946
79674 31.807 31.198 30.893 30.589
30284
Carboncontentin soil(t C/ha)
31 31 31 31
31 31 31 31 31
31
Carbonin soil
1344.718 1276.828 1242.449 1209.682 1176.140 469.526 460.536 456.041
451.546 447.051
3.3.3 Reclassification
3.4 DataTable 3a
Growing stock volume (million m 3 over bark)
Forest Other wooded landCategory
1990 2000 2005 2010 2015 1990 2000 2005 2010 2015
Totalgrowingstock
1575 1495 1454 1420 1377 298 292 290 287 284
... ofwhichconiferous
N/A N/A N/A N/A N/A N/A N/A N/A N/A N/A
... ofwhichbroadleaved
N/A N/A N/A N/A N/A N/A N/A N/A N/A N/A
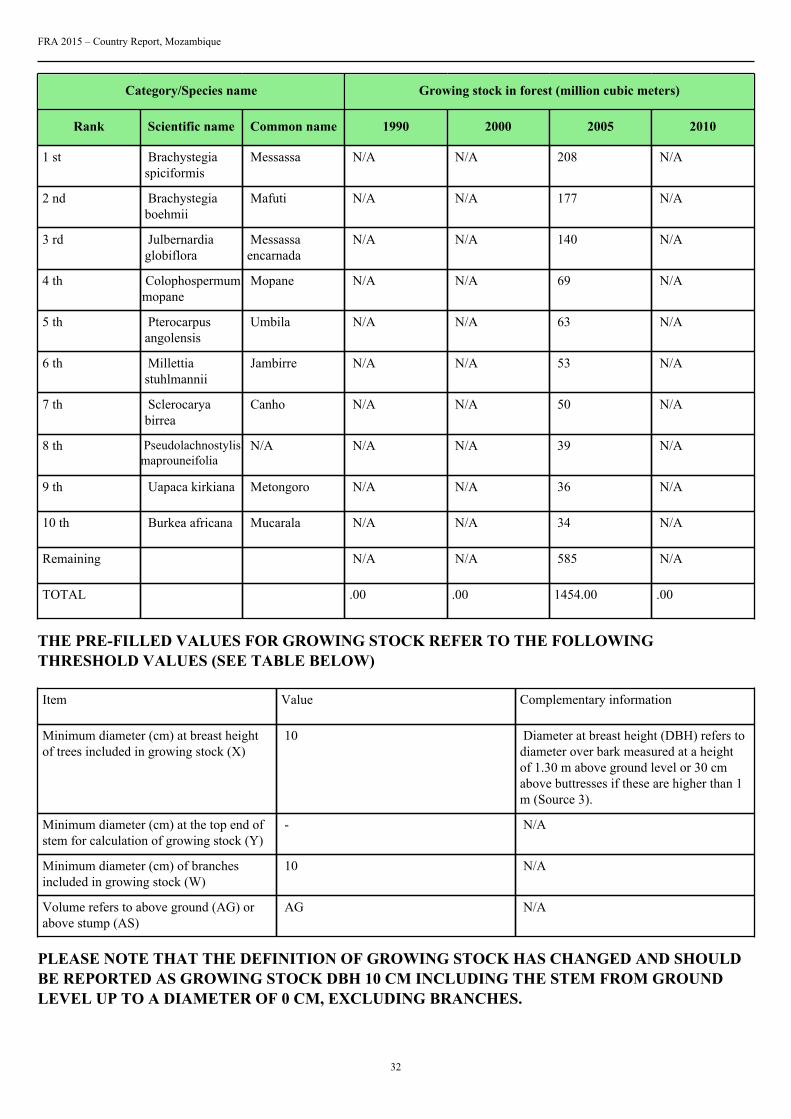
Table 3b
FRA 2015 – Country Report, Mozambique
32
Category/Species name Growing stock in forest (million cubic meters)
Rank Scientific name Common name 1990 2000 2005 2010
1 st Brachystegiaspiciformis
Messassa N/A N/A 208 N/A
2 nd Brachystegiaboehmii
Mafuti N/A N/A 177 N/A
3 rd Julbernardiaglobiflora
Messassaencarnada
N/A N/A 140 N/A
4 th Colophospermummopane
Mopane N/A N/A 69 N/A
5 th Pterocarpusangolensis
Umbila N/A N/A 63 N/A
6 th Millettiastuhlmannii
Jambirre N/A N/A 53 N/A
7 th Sclerocaryabirrea
Canho N/A N/A 50 N/A
8 th Pseudolachnostylismaprouneifolia
N/A N/A N/A 39 N/A
9 th Uapaca kirkiana Metongoro N/A N/A 36 N/A
10 th Burkea africana Mucarala N/A N/A 34 N/A
Remaining N/A N/A 585 N/A
TOTAL .00 .00 1454.00 .00
THE PRE-FILLED VALUES FOR GROWING STOCK REFER TO THE FOLLOWINGTHRESHOLD VALUES (SEE TABLE BELOW)
Item Value Complementary information
Minimum diameter (cm) at breast heightof trees included in growing stock (X)
10 Diameter at breast height (DBH) refers todiameter over bark measured at a heightof 1.30 m above ground level or 30 cmabove buttresses if these are higher than 1m (Source 3).
Minimum diameter (cm) at the top end ofstem for calculation of growing stock (Y)
- N/A
Minimum diameter (cm) of branchesincluded in growing stock (W)
10 N/A
Volume refers to above ground (AG) orabove stump (AS)
AG N/A
PLEASE NOTE THAT THE DEFINITION OF GROWING STOCK HAS CHANGED AND SHOULDBE REPORTED AS GROWING STOCK DBH 10 CM INCLUDING THE STEM FROM GROUNDLEVEL UP TO A DIAMETER OF 0 CM, EXCLUDING BRANCHES.
FRA 2015 – Country Report, Mozambique
33
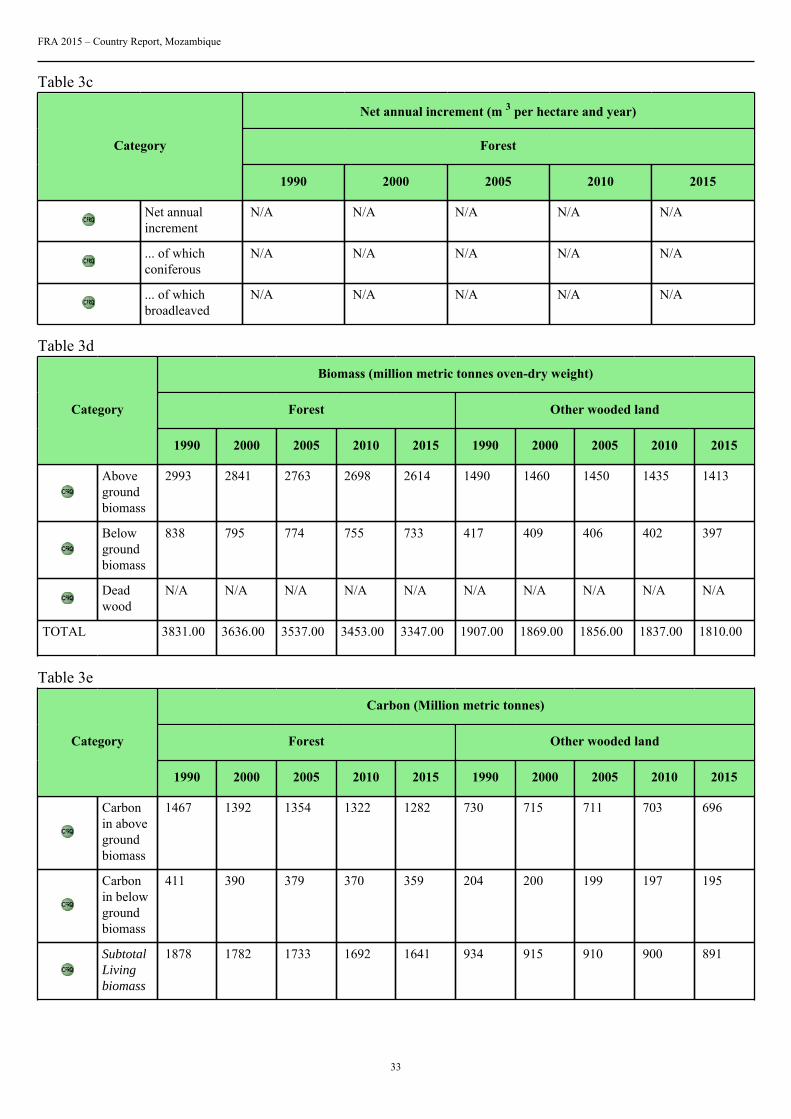
Table 3c
Net annual increment (m 3 per hectare and year)
ForestCategory
1990 2000 2005 2010 2015
Net annualincrement
N/A N/A N/A N/A N/A
... of whichconiferous
N/A N/A N/A N/A N/A
... of whichbroadleaved
N/A N/A N/A N/A N/A
Table 3d
Biomass (million metric tonnes oven-dry weight)
Forest Other wooded landCategory
1990 2000 2005 2010 2015 1990 2000 2005 2010 2015
Abovegroundbiomass
2993 2841 2763 2698 2614 1490 1460 1450 1435 1413
Belowgroundbiomass
838 795 774 755 733 417 409 406 402 397
Deadwood
N/A N/A N/A N/A N/A N/A N/A N/A N/A N/A
TOTAL 3831.00 3636.00 3537.00 3453.00 3347.00 1907.00 1869.00 1856.00 1837.00 1810.00
Table 3e
Carbon (Million metric tonnes)
Forest Other wooded landCategory
1990 2000 2005 2010 2015 1990 2000 2005 2010 2015
Carbonin abovegroundbiomass
1467 1392 1354 1322 1282 730 715 711 703 696
Carbonin belowgroundbiomass
411 390 379 370 359 204 200 199 197 195
SubtotalLivingbiomass
1878 1782 1733 1692 1641 934 915 910 900 891
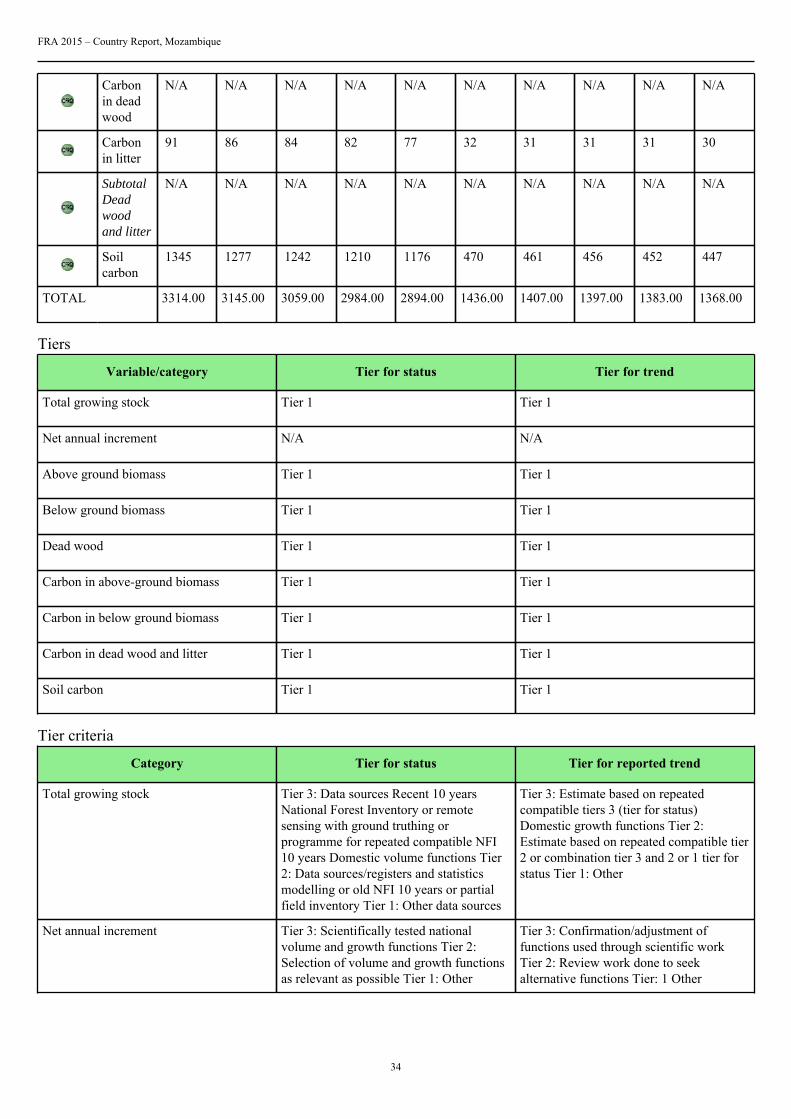
FRA 2015 – Country Report, Mozambique
34
Carbonin deadwood
N/A N/A N/A N/A N/A N/A N/A N/A N/A N/A
Carbonin litter
91 86 84 82 77 32 31 31 31 30
SubtotalDeadwoodand litter
N/A N/A N/A N/A N/A N/A N/A N/A N/A N/A
Soilcarbon
1345 1277 1242 1210 1176 470 461 456 452 447
TOTAL 3314.00 3145.00 3059.00 2984.00 2894.00 1436.00 1407.00 1397.00 1383.00 1368.00
Tiers
Variable/category Tier for status Tier for trend
Total growing stock Tier 1 Tier 1
Net annual increment N/A N/A
Above ground biomass Tier 1 Tier 1
Below ground biomass Tier 1 Tier 1
Dead wood Tier 1 Tier 1
Carbon in above-ground biomass Tier 1 Tier 1
Carbon in below ground biomass Tier 1 Tier 1
Carbon in dead wood and litter Tier 1 Tier 1
Soil carbon Tier 1 Tier 1
Tier criteria
Category Tier for status Tier for reported trend
Total growing stock Tier 3: Data sources Recent 10 yearsNational Forest Inventory or remotesensing with ground truthing orprogramme for repeated compatible NFI10 years Domestic volume functions Tier2: Data sources/registers and statisticsmodelling or old NFI 10 years or partialfield inventory Tier 1: Other data sources
Tier 3: Estimate based on repeatedcompatible tiers 3 (tier for status)Domestic growth functions Tier 2:Estimate based on repeated compatible tier2 or combination tier 3 and 2 or 1 tier forstatus Tier 1: Other
Net annual increment Tier 3: Scientifically tested nationalvolume and growth functions Tier 2:Selection of volume and growth functionsas relevant as possible Tier 1: Other
Tier 3: Confirmation/adjustment offunctions used through scientific workTier 2: Review work done to seekalternative functions Tier: 1 Other
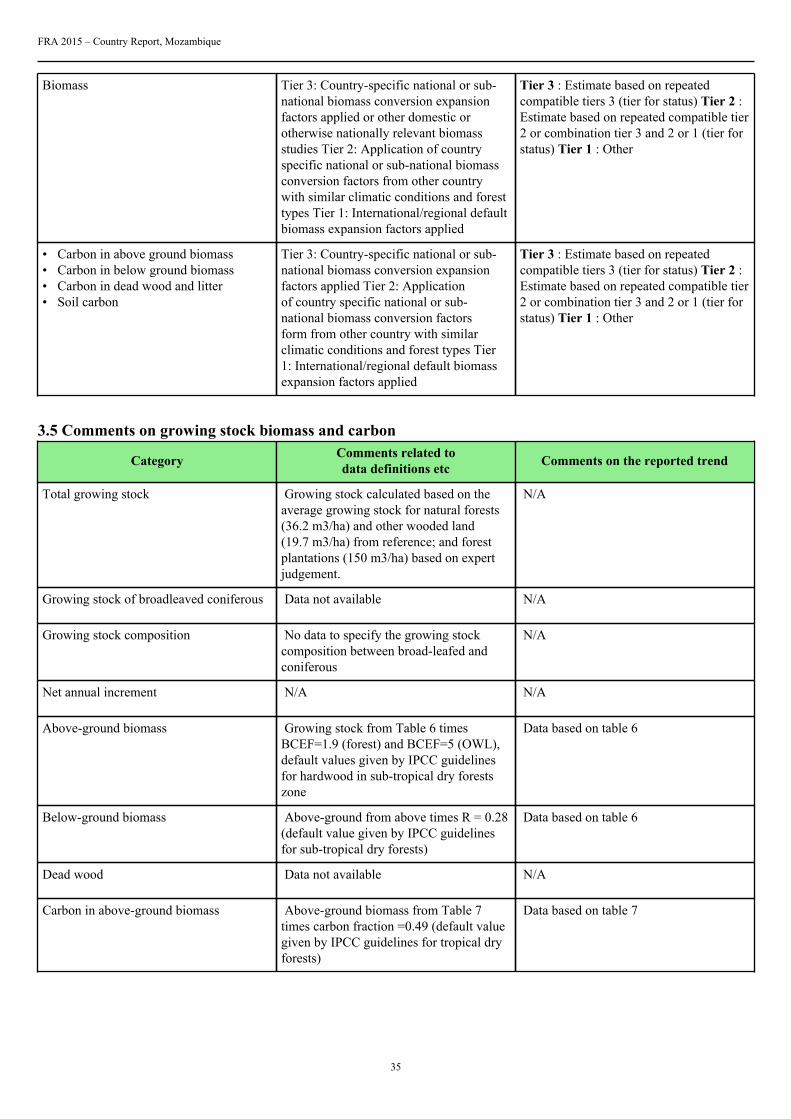
FRA 2015 – Country Report, Mozambique
35
Biomass Tier 3: Country-specific national or sub-national biomass conversion expansionfactors applied or other domestic orotherwise nationally relevant biomassstudies Tier 2: Application of countryspecific national or sub-national biomassconversion factors from other countrywith similar climatic conditions and foresttypes Tier 1: International/regional defaultbiomass expansion factors applied
Tier 3 : Estimate based on repeatedcompatible tiers 3 (tier for status) Tier 2 :Estimate based on repeated compatible tier2 or combination tier 3 and 2 or 1 (tier forstatus) Tier 1 : Other
• Carbon in above ground biomass• Carbon in below ground biomass• Carbon in dead wood and litter• Soil carbon
Tier 3: Country-specific national or sub-national biomass conversion expansionfactors applied Tier 2: Applicationof country specific national or sub-national biomass conversion factorsform from other country with similarclimatic conditions and forest types Tier1: International/regional default biomassexpansion factors applied
Tier 3 : Estimate based on repeatedcompatible tiers 3 (tier for status) Tier 2 :Estimate based on repeated compatible tier2 or combination tier 3 and 2 or 1 (tier forstatus) Tier 1 : Other
3.5 Comments on growing stock biomass and carbon
Category Comments related todata definitions etc Comments on the reported trend
Total growing stock Growing stock calculated based on theaverage growing stock for natural forests(36.2 m3/ha) and other wooded land(19.7 m3/ha) from reference; and forestplantations (150 m3/ha) based on expertjudgement.
N/A
Growing stock of broadleaved coniferous Data not available N/A
Growing stock composition No data to specify the growing stockcomposition between broad-leafed andconiferous
N/A
Net annual increment N/A N/A
Above-ground biomass Growing stock from Table 6 timesBCEF=1.9 (forest) and BCEF=5 (OWL),default values given by IPCC guidelinesfor hardwood in sub-tropical dry forestszone
Data based on table 6
Below-ground biomass Above-ground from above times R = 0.28(default value given by IPCC guidelinesfor sub-tropical dry forests)
Data based on table 6
Dead wood Data not available N/A
Carbon in above-ground biomass Above-ground biomass from Table 7times carbon fraction =0.49 (default valuegiven by IPCC guidelines for tropical dryforests)
Data based on table 7
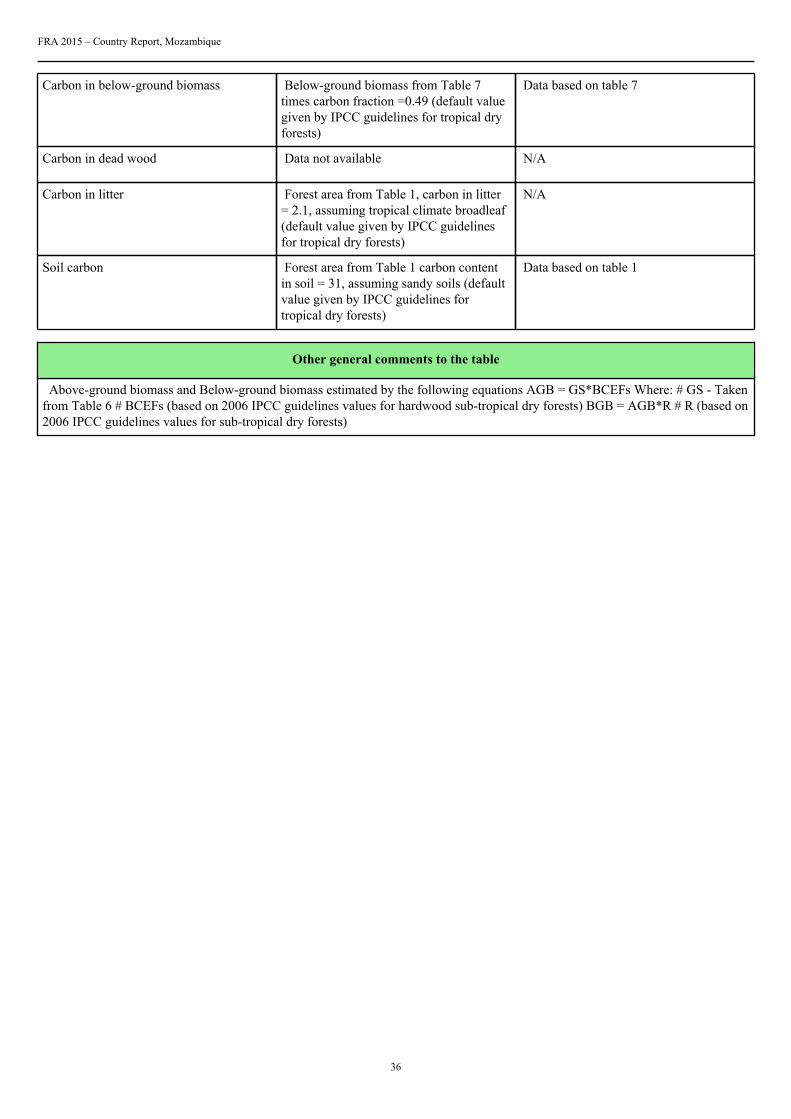
FRA 2015 – Country Report, Mozambique
36
Carbon in below-ground biomass Below-ground biomass from Table 7times carbon fraction =0.49 (default valuegiven by IPCC guidelines for tropical dryforests)
Data based on table 7
Carbon in dead wood Data not available N/A
Carbon in litter Forest area from Table 1, carbon in litter= 2.1, assuming tropical climate broadleaf(default value given by IPCC guidelinesfor tropical dry forests)
N/A
Soil carbon Forest area from Table 1 carbon contentin soil = 31, assuming sandy soils (defaultvalue given by IPCC guidelines fortropical dry forests)
Data based on table 1
Other general comments to the table
Above-ground biomass and Below-ground biomass estimated by the following equations AGB = GS*BCEFs Where: # GS - Takenfrom Table 6 # BCEFs (based on 2006 IPCC guidelines values for hardwood sub-tropical dry forests) BGB = AGB*R # R (based on2006 IPCC guidelines values for sub-tropical dry forests)
FRA 2015 – Country Report, Mozambique
37
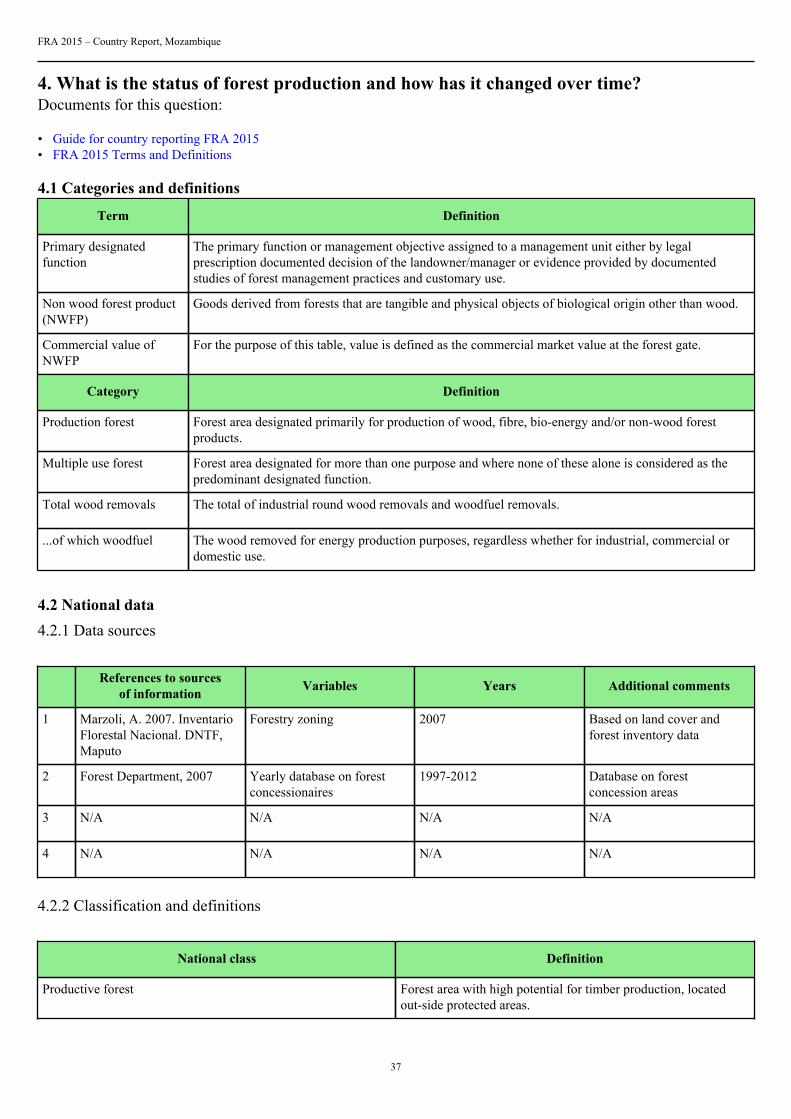
4. What is the status of forest production and how has it changed over time?Documents for this question:
• Guide for country reporting FRA 2015• FRA 2015 Terms and Definitions
4.1 Categories and definitions
Term Definition
Primary designatedfunction
The primary function or management objective assigned to a management unit either by legalprescription documented decision of the landowner/manager or evidence provided by documentedstudies of forest management practices and customary use.
Non wood forest product(NWFP)
Goods derived from forests that are tangible and physical objects of biological origin other than wood.
Commercial value ofNWFP
For the purpose of this table, value is defined as the commercial market value at the forest gate.
Category Definition
Production forest Forest area designated primarily for production of wood, fibre, bio-energy and/or non-wood forestproducts.
Multiple use forest Forest area designated for more than one purpose and where none of these alone is considered as thepredominant designated function.
Total wood removals The total of industrial round wood removals and woodfuel removals.
...of which woodfuel The wood removed for energy production purposes, regardless whether for industrial, commercial ordomestic use.
4.2 National data4.2.1 Data sources
References to sourcesof information Variables Years Additional comments
1 Marzoli, A. 2007. InventarioFlorestal Nacional. DNTF,Maputo
Forestry zoning 2007 Based on land cover andforest inventory data
2 Forest Department, 2007 Yearly database on forestconcessionaires
1997-2012 Database on forestconcession areas
3 N/A N/A N/A N/A
4 N/A N/A N/A N/A
4.2.2 Classification and definitions
National class Definition
Productive forest Forest area with high potential for timber production, locatedout-side protected areas.

FRA 2015 – Country Report, Mozambique
38
Multiple use forest Forest area with low potential for timber production and locatedout-side protected areas
N/A N/A
N/A N/A
4.2.3 Original data
Source 3 - Zoning of Natural Forests
Natural Forest’s Zoning Área in 1000 ha (2005)
Productive forests 26907
Conservation forests 4256
Protection of soil and water 8905
Total Natural forest area 40068
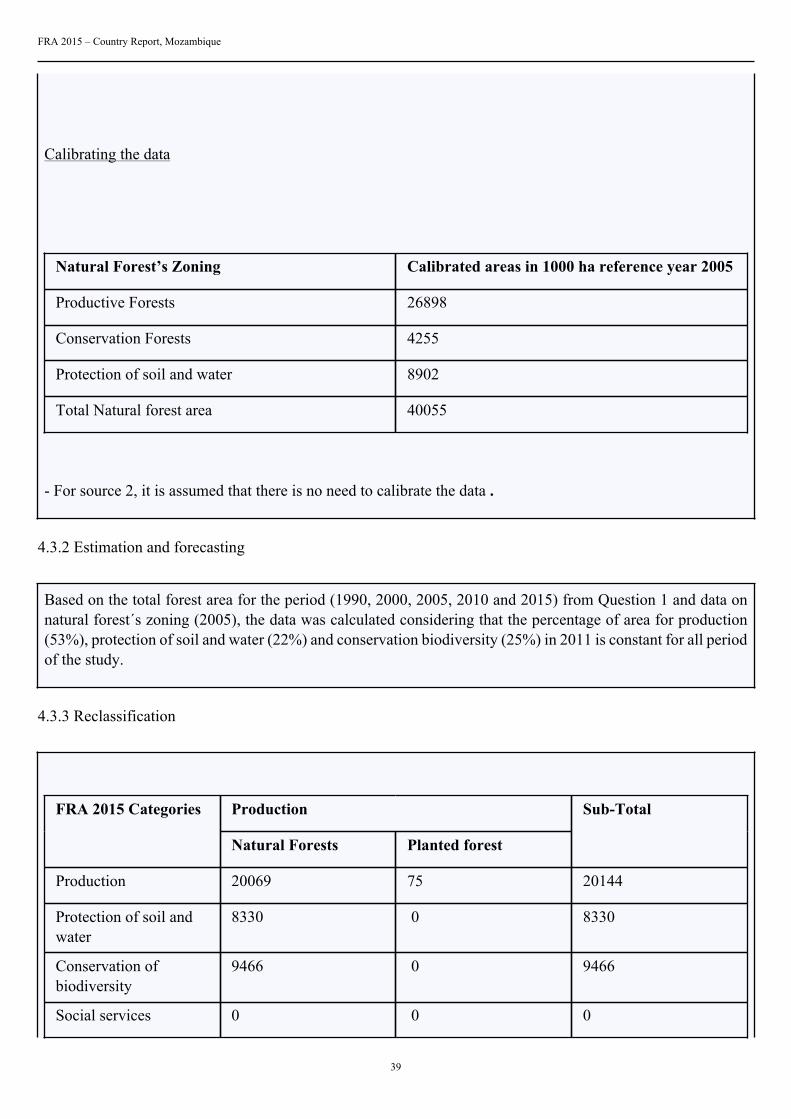
4.3 Analysis and processing of national data4.3.1 Adjustment
- Calibrating the 2005 data (source 3)
Area in 1000 ha (2005)
Forest Area in 1000 ha
(from source 1)
40068
Forest Area in 1000 ha
(from T1 FRA2010)
40055
Calibrating factor 0.999676
FRA 2015 – Country Report, Mozambique
39
Calibrating the data
Natural Forest’s Zoning Calibrated areas in 1000 ha reference year 2005
Productive Forests 26898
Conservation Forests 4255
Protection of soil and water 8902
Total Natural forest area 40055
- For source 2, it is assumed that there is no need to calibrate the data .
4.3.2 Estimation and forecasting
Based on the total forest area for the period (1990, 2000, 2005, 2010 and 2015) from Question 1 and data onnatural forest´s zoning (2005), the data was calculated considering that the percentage of area for production(53%), protection of soil and water (22%) and conservation biodiversity (25%) in 2011 is constant for all periodof the study.
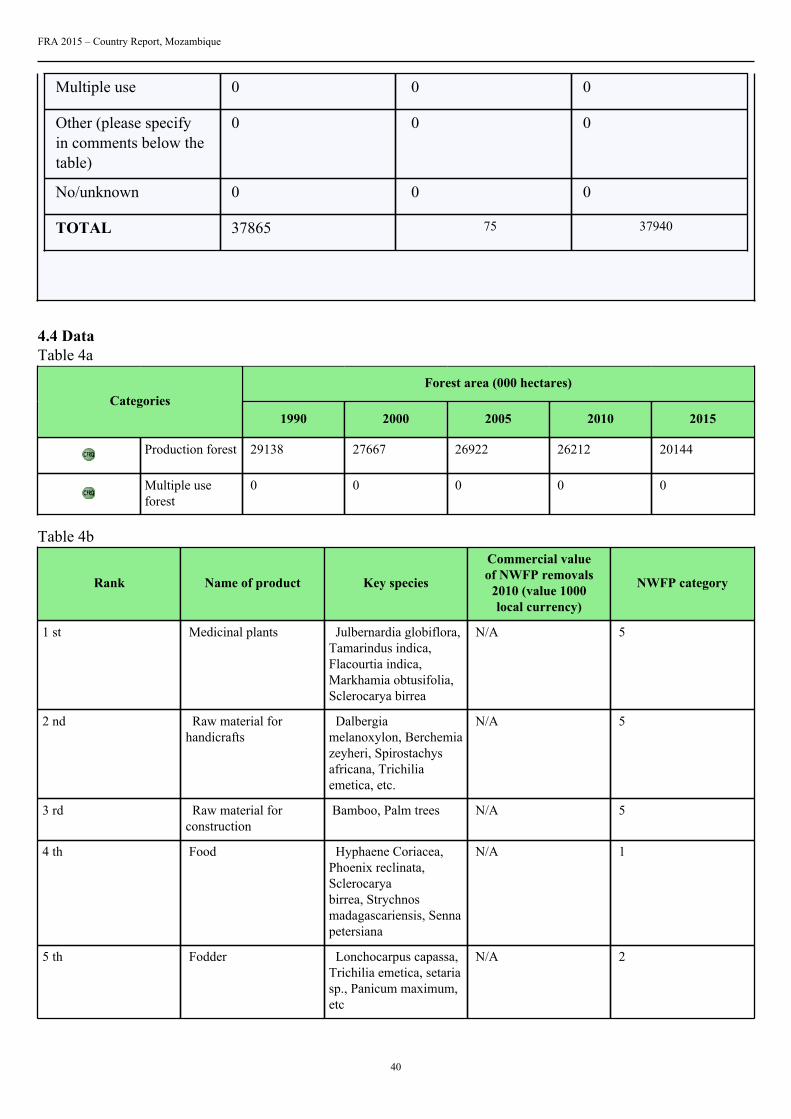
4.3.3 Reclassification
ProductionFRA 2015 Categories
Natural Forests Planted forest
Sub-Total
Production 20069 75 20144
Protection of soil andwater
8330 0 8330
Conservation ofbiodiversity
9466 0 9466
Social services 0 0 0
FRA 2015 – Country Report, Mozambique
40
Multiple use 0 0 0
Other (please specifyin comments below thetable)
0 0 0
No/unknown 0 0 0
TOTAL 37865 75 37940
4.4 DataTable 4a
Forest area (000 hectares)Categories
1990 2000 2005 2010 2015
Production forest 29138 27667 26922 26212 20144
Multiple useforest
0 0 0 0 0
Table 4b
Rank Name of product Key species
Commercial valueof NWFP removals
2010 (value 1000local currency)
NWFP category
1 st Medicinal plants Julbernardia globiflora,Tamarindus indica,Flacourtia indica,Markhamia obtusifolia,Sclerocarya birrea
N/A 5
2 nd Raw material forhandicrafts
Dalbergiamelanoxylon, Berchemiazeyheri, Spirostachysafricana, Trichiliaemetica, etc.
N/A 5
3 rd Raw material forconstruction
Bamboo, Palm trees N/A 5
4 th Food Hyphaene Coriacea,Phoenix reclinata,Sclerocaryabirrea, Strychnosmadagascariensis, Sennapetersiana
N/A 1
5 th Fodder Lonchocarpus capassa,Trichilia emetica, setariasp., Panicum maximum,etc
N/A 2
FRA 2015 – Country Report, Mozambique
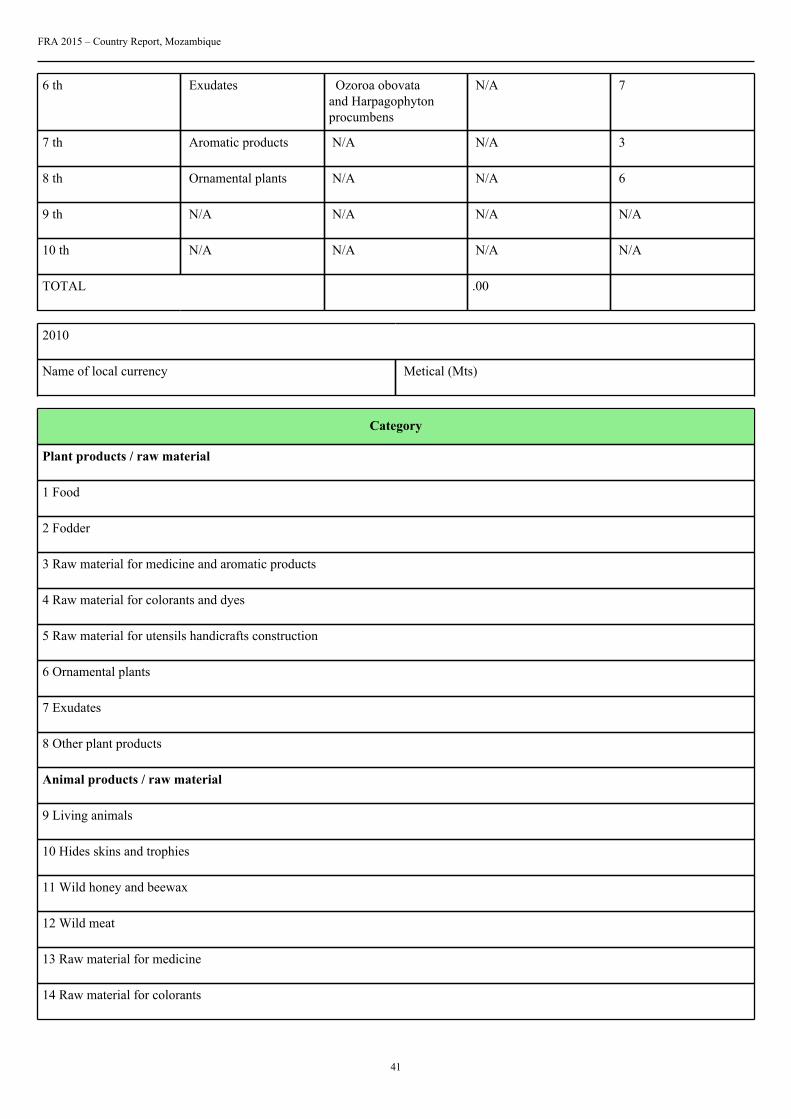
41
6 th Exudates Ozoroa obovataand Harpagophytonprocumbens
N/A 7
7 th Aromatic products N/A N/A 3
8 th Ornamental plants N/A N/A 6
9 th N/A N/A N/A N/A
10 th N/A N/A N/A N/A
TOTAL .00
2010
Name of local currency Metical (Mts)
Category
Plant products / raw material
1 Food
2 Fodder
3 Raw material for medicine and aromatic products
4 Raw material for colorants and dyes
5 Raw material for utensils handicrafts construction
6 Ornamental plants
7 Exudates
8 Other plant products
Animal products / raw material
9 Living animals
10 Hides skins and trophies
11 Wild honey and beewax
12 Wild meat
13 Raw material for medicine
14 Raw material for colorants
FRA 2015 – Country Report, Mozambique
42
15 Other edible animal products
16 Other non-edible animal products
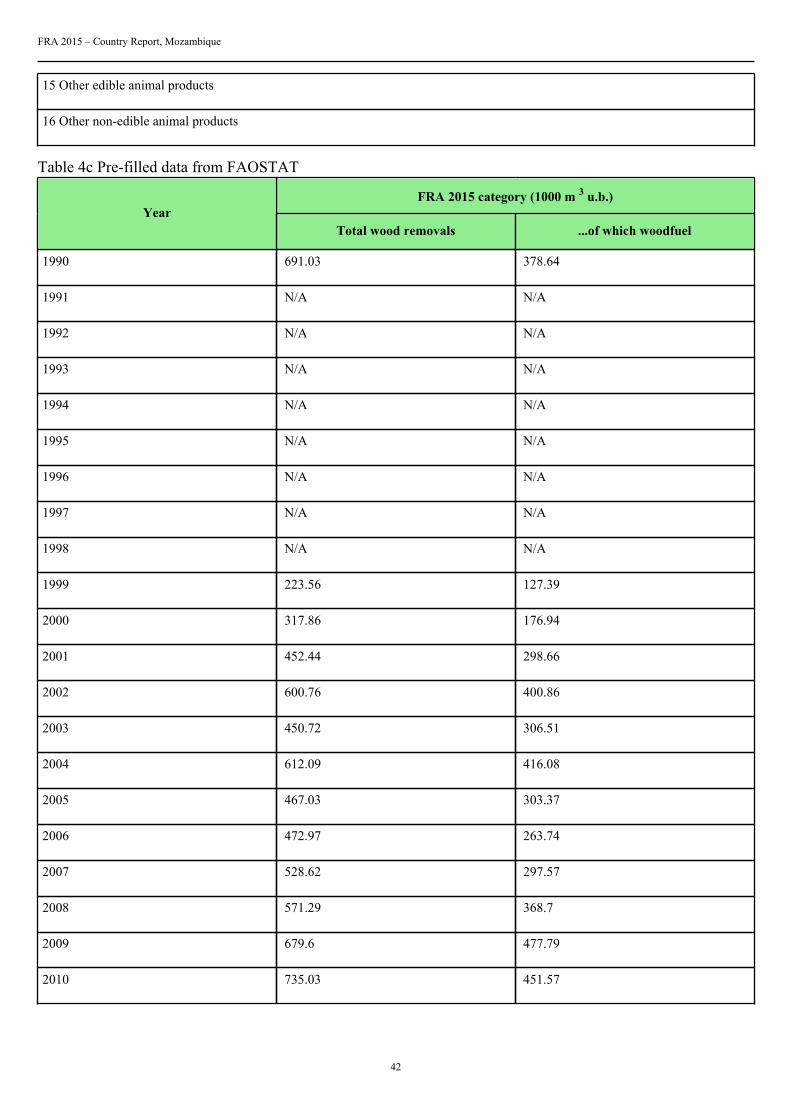
Table 4c Pre-filled data from FAOSTAT
FRA 2015 category (1000 m 3 u.b.)Year
Total wood removals ...of which woodfuel
1990 691.03 378.64
1991 N/A N/A
1992 N/A N/A
1993 N/A N/A
1994 N/A N/A
1995 N/A N/A
1996 N/A N/A
1997 N/A N/A
1998 N/A N/A
1999 223.56 127.39
2000 317.86 176.94
2001 452.44 298.66
2002 600.76 400.86
2003 450.72 306.51
2004 612.09 416.08
2005 467.03 303.37
2006 472.97 263.74
2007 528.62 297.57
2008 571.29 368.7
2009 679.6 477.79
2010 735.03 451.57
FRA 2015 – Country Report, Mozambique
43
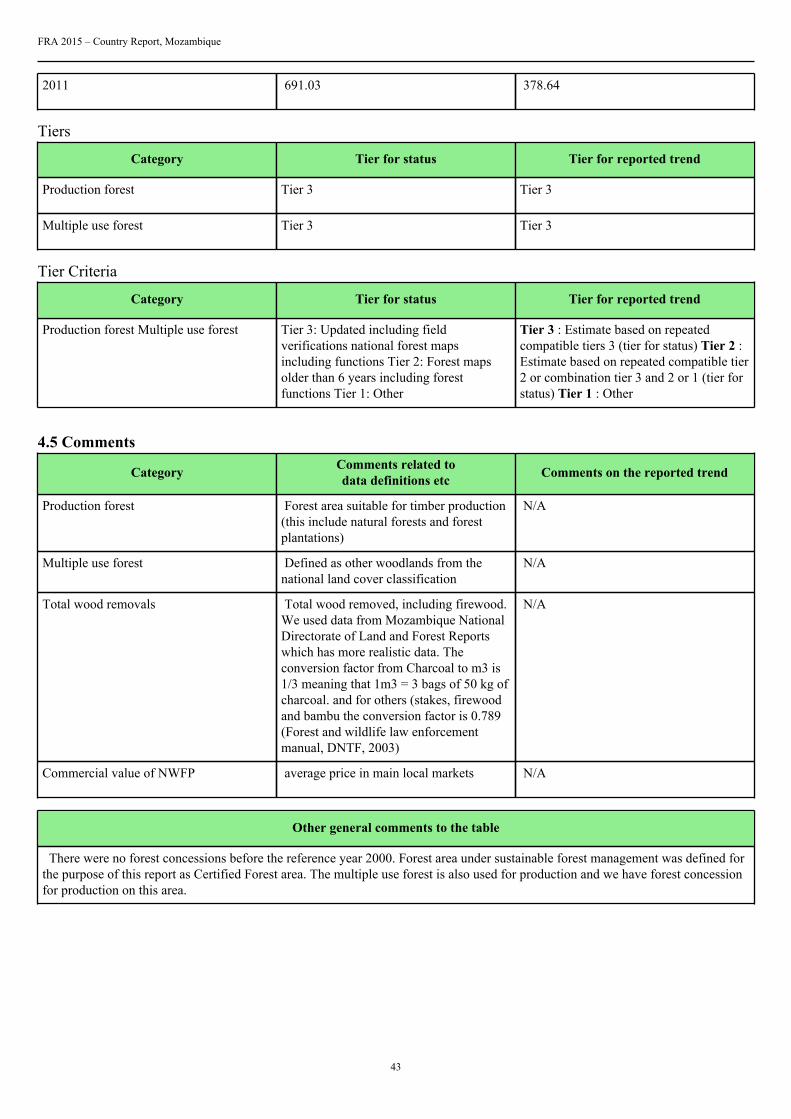
2011 691.03 378.64
Tiers
Category Tier for status Tier for reported trend
Production forest Tier 3 Tier 3
Multiple use forest Tier 3 Tier 3
Tier Criteria
Category Tier for status Tier for reported trend
Production forest Multiple use forest Tier 3: Updated including fieldverifications national forest mapsincluding functions Tier 2: Forest mapsolder than 6 years including forestfunctions Tier 1: Other
Tier 3 : Estimate based on repeatedcompatible tiers 3 (tier for status) Tier 2 :Estimate based on repeated compatible tier2 or combination tier 3 and 2 or 1 (tier forstatus) Tier 1 : Other
4.5 Comments
Category Comments related todata definitions etc Comments on the reported trend
Production forest Forest area suitable for timber production(this include natural forests and forestplantations)
N/A
Multiple use forest Defined as other woodlands from thenational land cover classification
N/A
Total wood removals Total wood removed, including firewood.We used data from Mozambique NationalDirectorate of Land and Forest Reportswhich has more realistic data. Theconversion factor from Charcoal to m3 is1/3 meaning that 1m3 = 3 bags of 50 kg ofcharcoal. and for others (stakes, firewoodand bambu the conversion factor is 0.789(Forest and wildlife law enforcementmanual, DNTF, 2003)
N/A
Commercial value of NWFP average price in main local markets N/A
Other general comments to the table
There were no forest concessions before the reference year 2000. Forest area under sustainable forest management was defined forthe purpose of this report as Certified Forest area. The multiple use forest is also used for production and we have forest concessionfor production on this area.
FRA 2015 – Country Report, Mozambique
44
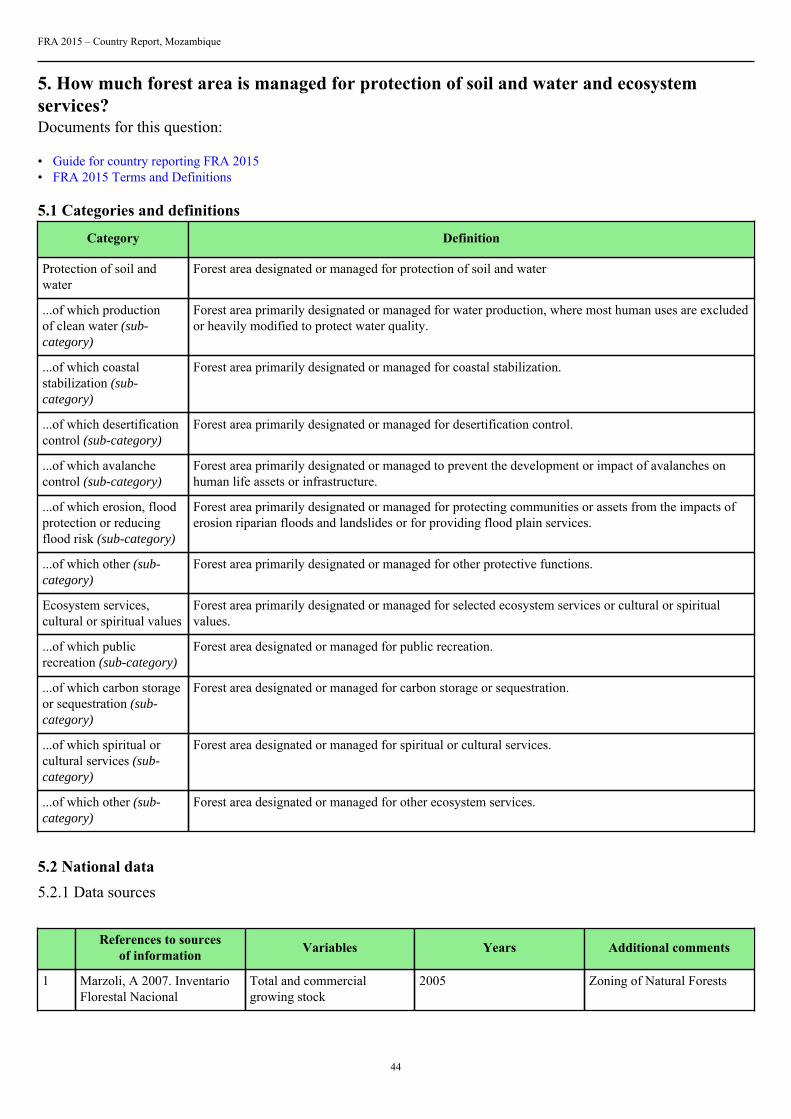
5. How much forest area is managed for protection of soil and water and ecosystemservices?Documents for this question:
• Guide for country reporting FRA 2015• FRA 2015 Terms and Definitions
5.1 Categories and definitions
Category Definition
Protection of soil andwater
Forest area designated or managed for protection of soil and water
...of which productionof clean water (sub-category)
Forest area primarily designated or managed for water production, where most human uses are excludedor heavily modified to protect water quality.
...of which coastalstabilization (sub-category)
Forest area primarily designated or managed for coastal stabilization.
...of which desertificationcontrol (sub-category)
Forest area primarily designated or managed for desertification control.
...of which avalanchecontrol (sub-category)
Forest area primarily designated or managed to prevent the development or impact of avalanches onhuman life assets or infrastructure.
...of which erosion, floodprotection or reducingflood risk (sub-category)
Forest area primarily designated or managed for protecting communities or assets from the impacts oferosion riparian floods and landslides or for providing flood plain services.
...of which other (sub-category)
Forest area primarily designated or managed for other protective functions.
Ecosystem services,cultural or spiritual values
Forest area primarily designated or managed for selected ecosystem services or cultural or spiritualvalues.
...of which publicrecreation (sub-category)
Forest area designated or managed for public recreation.
...of which carbon storageor sequestration (sub-category)
Forest area designated or managed for carbon storage or sequestration.
...of which spiritual orcultural services (sub-category)
Forest area designated or managed for spiritual or cultural services.
...of which other (sub-category)
Forest area designated or managed for other ecosystem services.
5.2 National data5.2.1 Data sources
References to sourcesof information Variables Years Additional comments
1 Marzoli, A 2007. InventarioFlorestal Nacional
Total and commercialgrowing stock
2005 Zoning of Natural Forests
FRA 2015 – Country Report, Mozambique
45
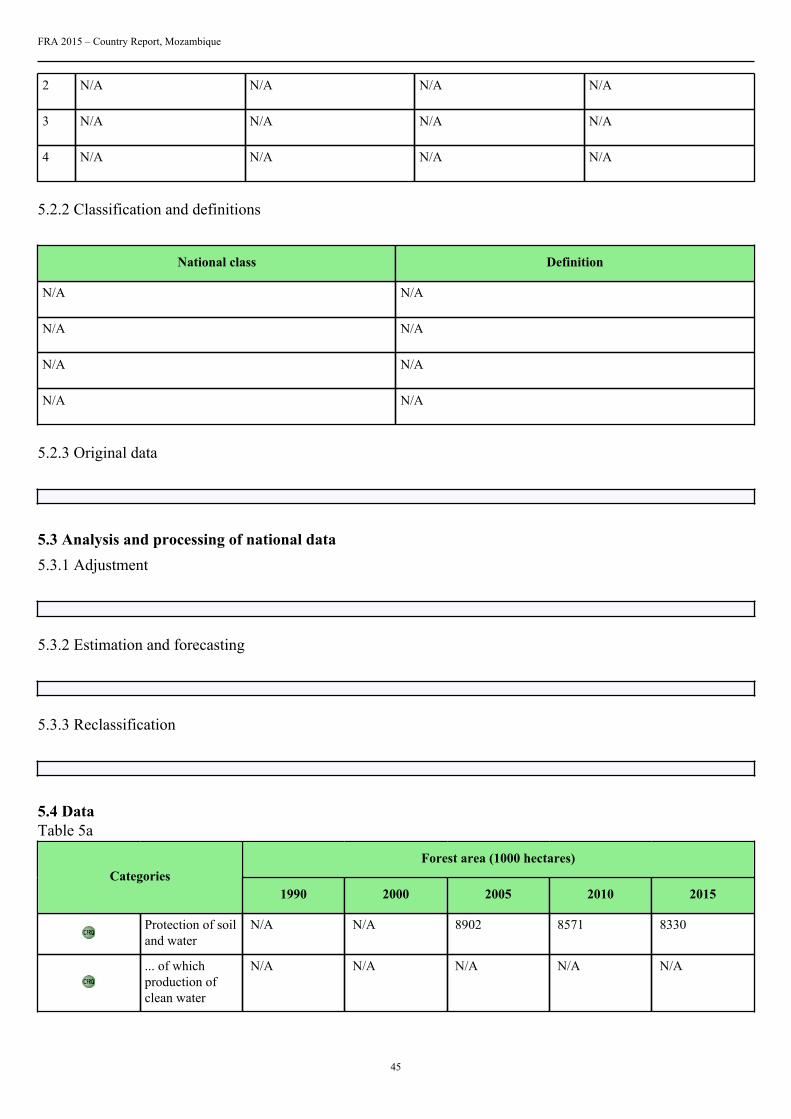
2 N/A N/A N/A N/A
3 N/A N/A N/A N/A
4 N/A N/A N/A N/A
5.2.2 Classification and definitions
National class Definition
N/A N/A
N/A N/A
N/A N/A
N/A N/A
5.2.3 Original data
5.3 Analysis and processing of national data5.3.1 Adjustment
5.3.2 Estimation and forecasting
5.3.3 Reclassification
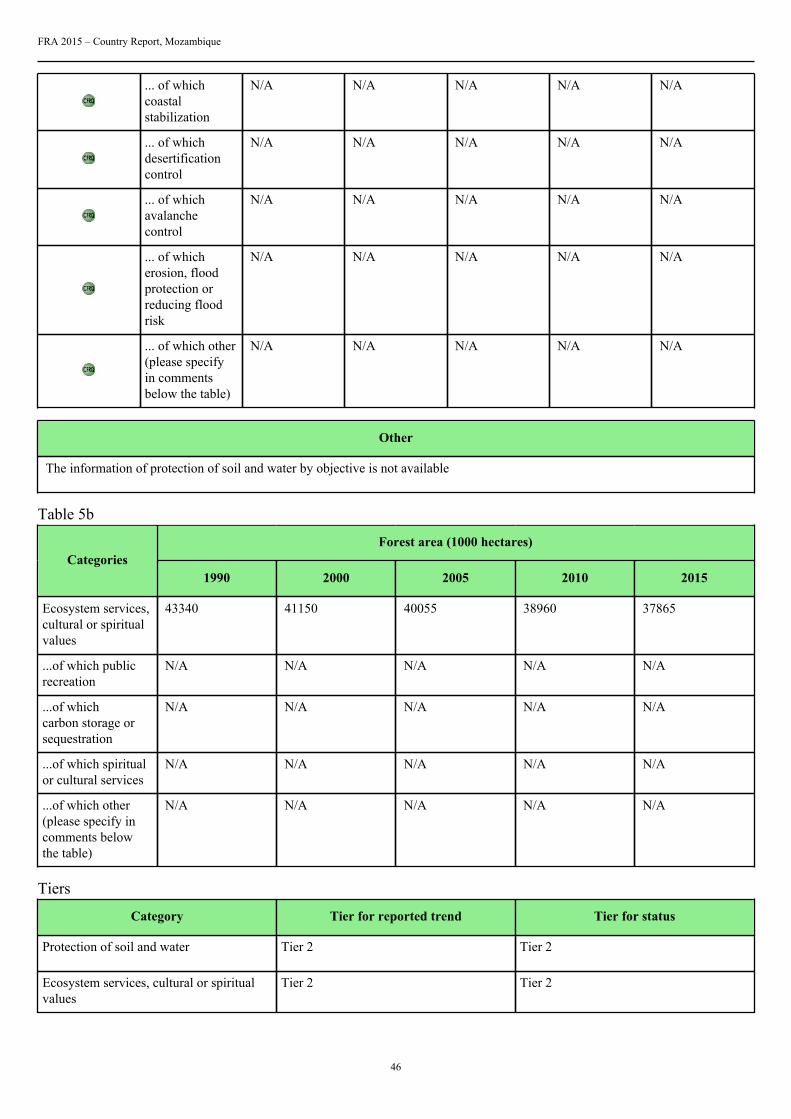
5.4 DataTable 5a
Forest area (1000 hectares)Categories
1990 2000 2005 2010 2015
Protection of soiland water
N/A N/A 8902 8571 8330
... of whichproduction ofclean water
N/A N/A N/A N/A N/A
FRA 2015 – Country Report, Mozambique
46
... of whichcoastalstabilization
N/A N/A N/A N/A N/A
... of whichdesertificationcontrol
N/A N/A N/A N/A N/A
... of whichavalanchecontrol
N/A N/A N/A N/A N/A
... of whicherosion, floodprotection orreducing floodrisk
N/A N/A N/A N/A N/A
... of which other(please specifyin commentsbelow the table)
N/A N/A N/A N/A N/A
Other
The information of protection of soil and water by objective is not available
Table 5b
Forest area (1000 hectares)Categories
1990 2000 2005 2010 2015
Ecosystem services,cultural or spiritualvalues
43340 41150 40055 38960 37865
...of which publicrecreation
N/A N/A N/A N/A N/A
...of whichcarbon storage orsequestration
N/A N/A N/A N/A N/A
...of which spiritualor cultural services
N/A N/A N/A N/A N/A
...of which other(please specify incomments belowthe table)
N/A N/A N/A N/A N/A
Tiers
Category Tier for reported trend Tier for status
Protection of soil and water Tier 2 Tier 2
Ecosystem services, cultural or spiritualvalues
Tier 2 Tier 2
FRA 2015 – Country Report, Mozambique
47
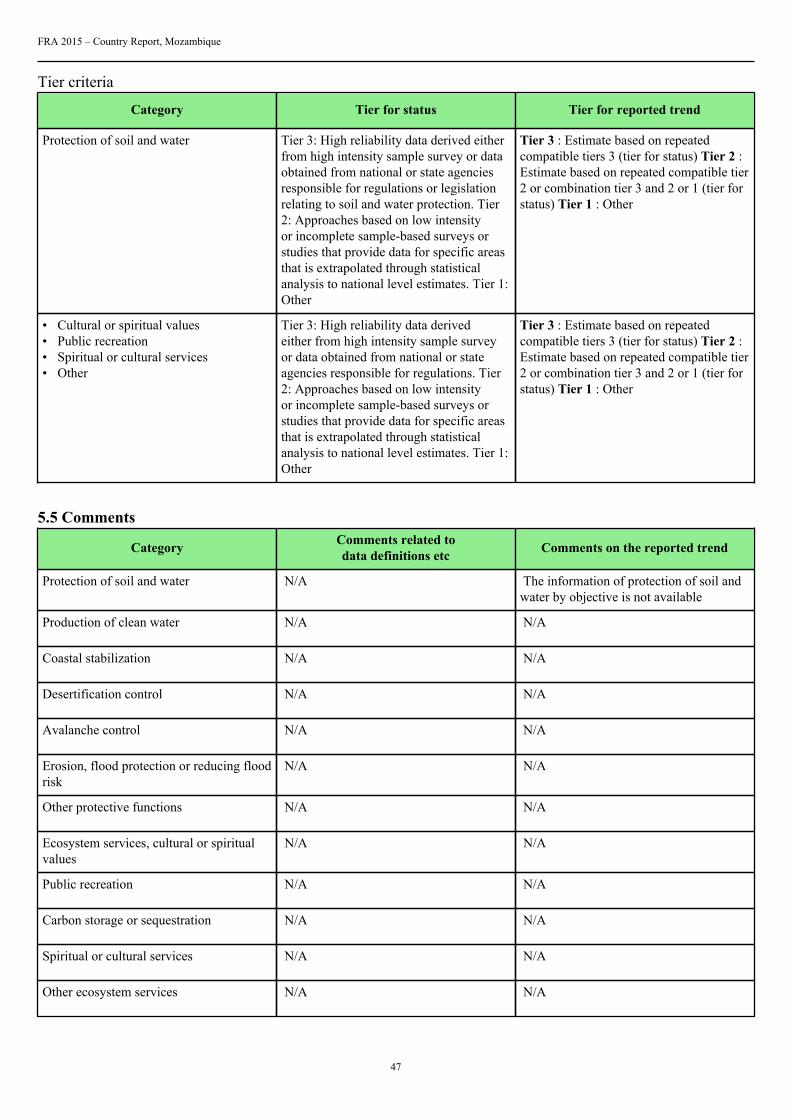
Tier criteria
Category Tier for status Tier for reported trend
Protection of soil and water Tier 3: High reliability data derived eitherfrom high intensity sample survey or dataobtained from national or state agenciesresponsible for regulations or legislationrelating to soil and water protection. Tier2: Approaches based on low intensityor incomplete sample-based surveys orstudies that provide data for specific areasthat is extrapolated through statisticalanalysis to national level estimates. Tier 1:Other
Tier 3 : Estimate based on repeatedcompatible tiers 3 (tier for status) Tier 2 :Estimate based on repeated compatible tier2 or combination tier 3 and 2 or 1 (tier forstatus) Tier 1 : Other
• Cultural or spiritual values• Public recreation• Spiritual or cultural services• Other
Tier 3: High reliability data derivedeither from high intensity sample surveyor data obtained from national or stateagencies responsible for regulations. Tier2: Approaches based on low intensityor incomplete sample-based surveys orstudies that provide data for specific areasthat is extrapolated through statisticalanalysis to national level estimates. Tier 1:Other
Tier 3 : Estimate based on repeatedcompatible tiers 3 (tier for status) Tier 2 :Estimate based on repeated compatible tier2 or combination tier 3 and 2 or 1 (tier forstatus) Tier 1 : Other
5.5 Comments
Category Comments related todata definitions etc Comments on the reported trend
Protection of soil and water N/A The information of protection of soil andwater by objective is not available
Production of clean water N/A N/A
Coastal stabilization N/A N/A
Desertification control N/A N/A
Avalanche control N/A N/A
Erosion, flood protection or reducing floodrisk
N/A N/A
Other protective functions N/A N/A
Ecosystem services, cultural or spiritualvalues
N/A N/A
Public recreation N/A N/A
Carbon storage or sequestration N/A N/A
Spiritual or cultural services N/A N/A
Other ecosystem services N/A N/A
FRA 2015 – Country Report, Mozambique
48
Other general comments to the table
The information of forest area by objective is not available
FRA 2015 – Country Report, Mozambique
49
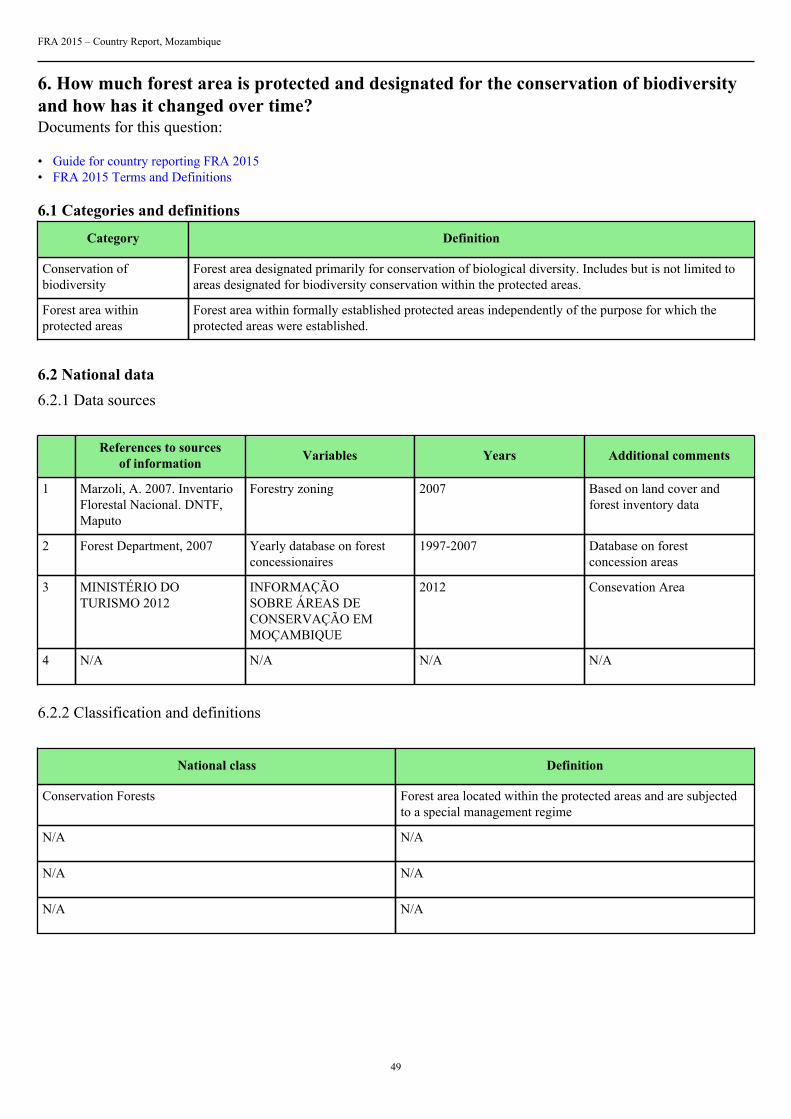
6. How much forest area is protected and designated for the conservation of biodiversityand how has it changed over time?Documents for this question:
• Guide for country reporting FRA 2015• FRA 2015 Terms and Definitions
6.1 Categories and definitions
Category Definition
Conservation ofbiodiversity
Forest area designated primarily for conservation of biological diversity. Includes but is not limited toareas designated for biodiversity conservation within the protected areas.
Forest area withinprotected areas
Forest area within formally established protected areas independently of the purpose for which theprotected areas were established.
6.2 National data6.2.1 Data sources
References to sourcesof information Variables Years Additional comments
1 Marzoli, A. 2007. InventarioFlorestal Nacional. DNTF,Maputo
Forestry zoning 2007 Based on land cover andforest inventory data
2 Forest Department, 2007 Yearly database on forestconcessionaires
1997-2007 Database on forestconcession areas
3 MINISTÉRIO DOTURISMO 2012
INFORMAÇÃOSOBRE ÁREAS DECONSERVAÇÃO EMMOÇAMBIQUE
2012 Consevation Area
4 N/A N/A N/A N/A
6.2.2 Classification and definitions
National class Definition
Conservation Forests Forest area located within the protected areas and are subjectedto a special management regime
N/A N/A
N/A N/A
N/A N/A
FRA 2015 – Country Report, Mozambique
50
6.2.3 Original data
See 4.2.3.
6.3 Analysis and processing of national data6.3.1 Adjustment
See 4.3.1.
6.3.2 Estimation and forecasting
See 4.3.2.
6.3.3 Reclassification
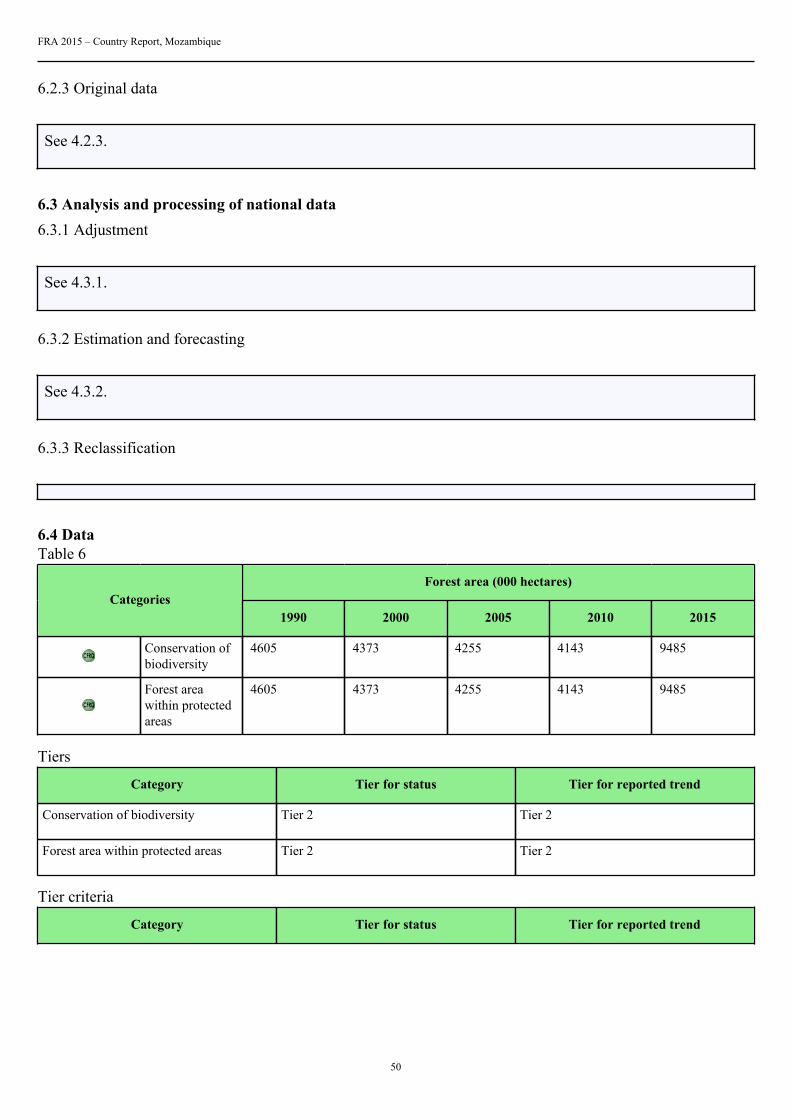
6.4 DataTable 6
Forest area (000 hectares)Categories
1990 2000 2005 2010 2015
Conservation ofbiodiversity
4605 4373 4255 4143 9485
Forest areawithin protectedareas
4605 4373 4255 4143 9485
Tiers
Category Tier for status Tier for reported trend
Conservation of biodiversity Tier 2 Tier 2
Forest area within protected areas Tier 2 Tier 2
Tier criteria
Category Tier for status Tier for reported trend
FRA 2015 – Country Report, Mozambique
51
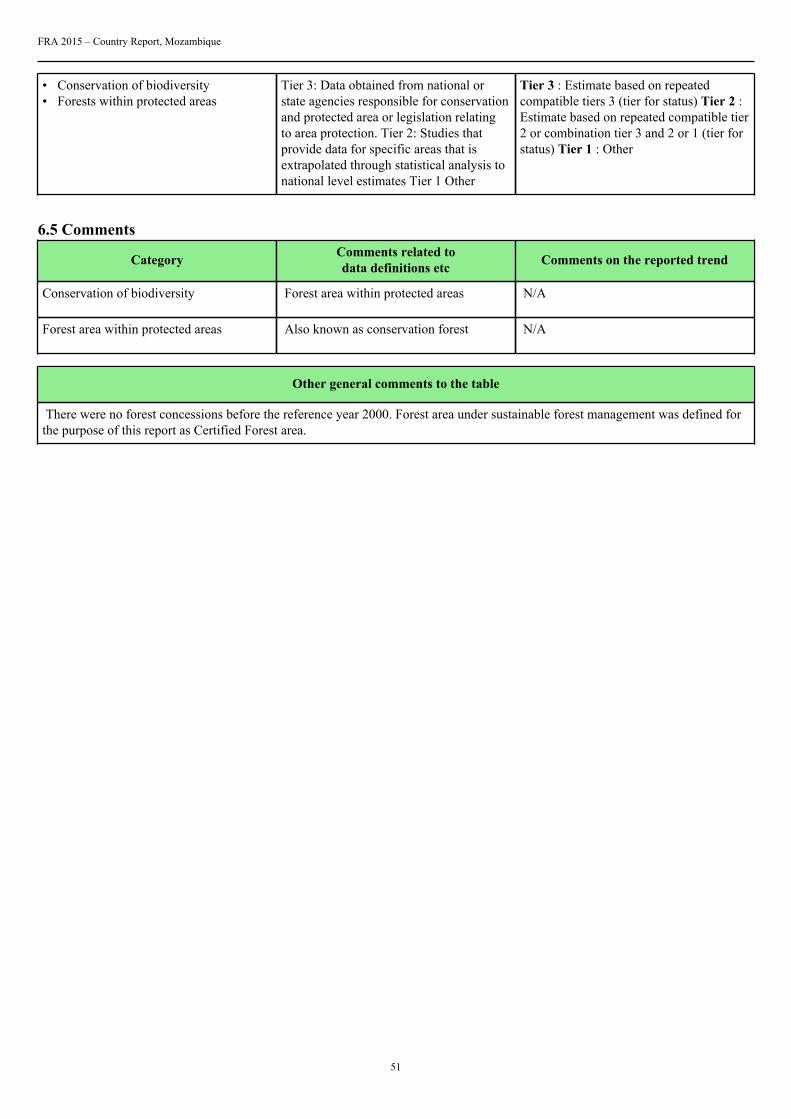
• Conservation of biodiversity• Forests within protected areas
Tier 3: Data obtained from national orstate agencies responsible for conservationand protected area or legislation relatingto area protection. Tier 2: Studies thatprovide data for specific areas that isextrapolated through statistical analysis tonational level estimates Tier 1 Other
Tier 3 : Estimate based on repeatedcompatible tiers 3 (tier for status) Tier 2 :Estimate based on repeated compatible tier2 or combination tier 3 and 2 or 1 (tier forstatus) Tier 1 : Other
6.5 Comments
Category Comments related todata definitions etc Comments on the reported trend
Conservation of biodiversity Forest area within protected areas N/A
Forest area within protected areas Also known as conservation forest N/A
Other general comments to the table
There were no forest concessions before the reference year 2000. Forest area under sustainable forest management was defined forthe purpose of this report as Certified Forest area.
FRA 2015 – Country Report, Mozambique
52
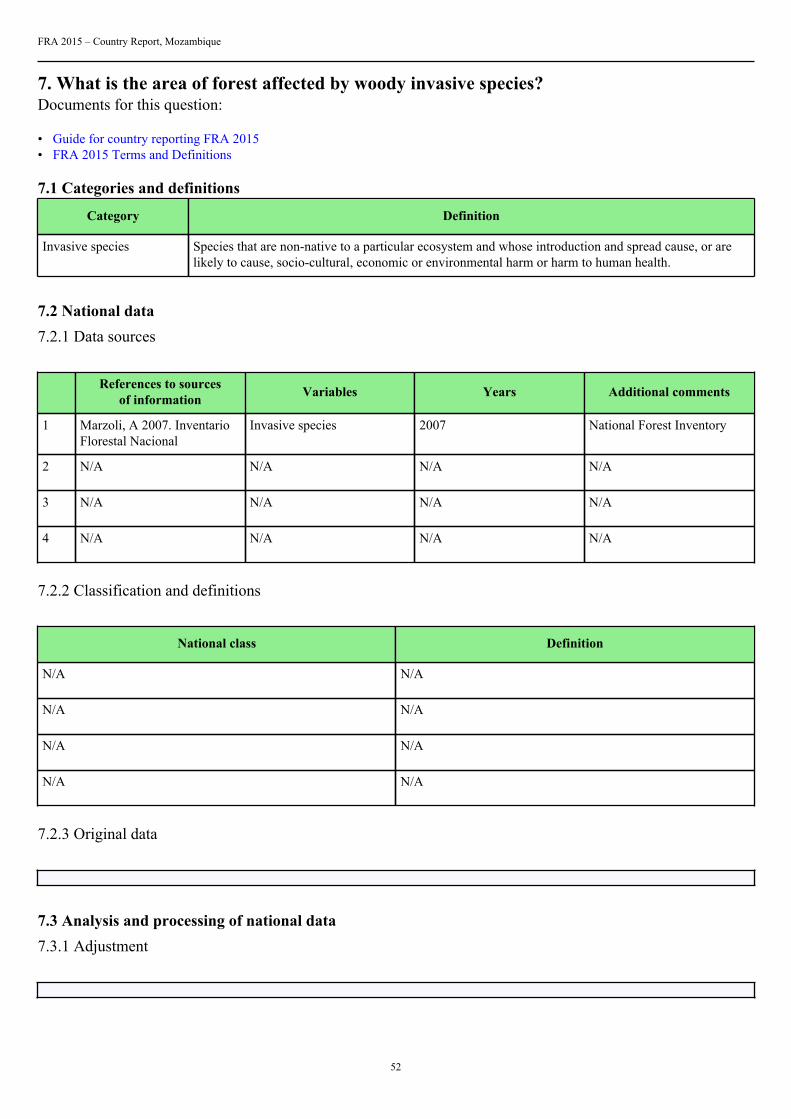
7. What is the area of forest affected by woody invasive species?Documents for this question:
• Guide for country reporting FRA 2015• FRA 2015 Terms and Definitions
7.1 Categories and definitions
Category Definition
Invasive species Species that are non-native to a particular ecosystem and whose introduction and spread cause, or arelikely to cause, socio-cultural, economic or environmental harm or harm to human health.
7.2 National data7.2.1 Data sources
References to sourcesof information Variables Years Additional comments
1 Marzoli, A 2007. InventarioFlorestal Nacional
Invasive species 2007 National Forest Inventory
2 N/A N/A N/A N/A
3 N/A N/A N/A N/A
4 N/A N/A N/A N/A
7.2.2 Classification and definitions
National class Definition
N/A N/A
N/A N/A
N/A N/A
N/A N/A
7.2.3 Original data
7.3 Analysis and processing of national data7.3.1 Adjustment
FRA 2015 – Country Report, Mozambique
53
7.3.2 Estimation and forecasting
7.3.3 Reclassification
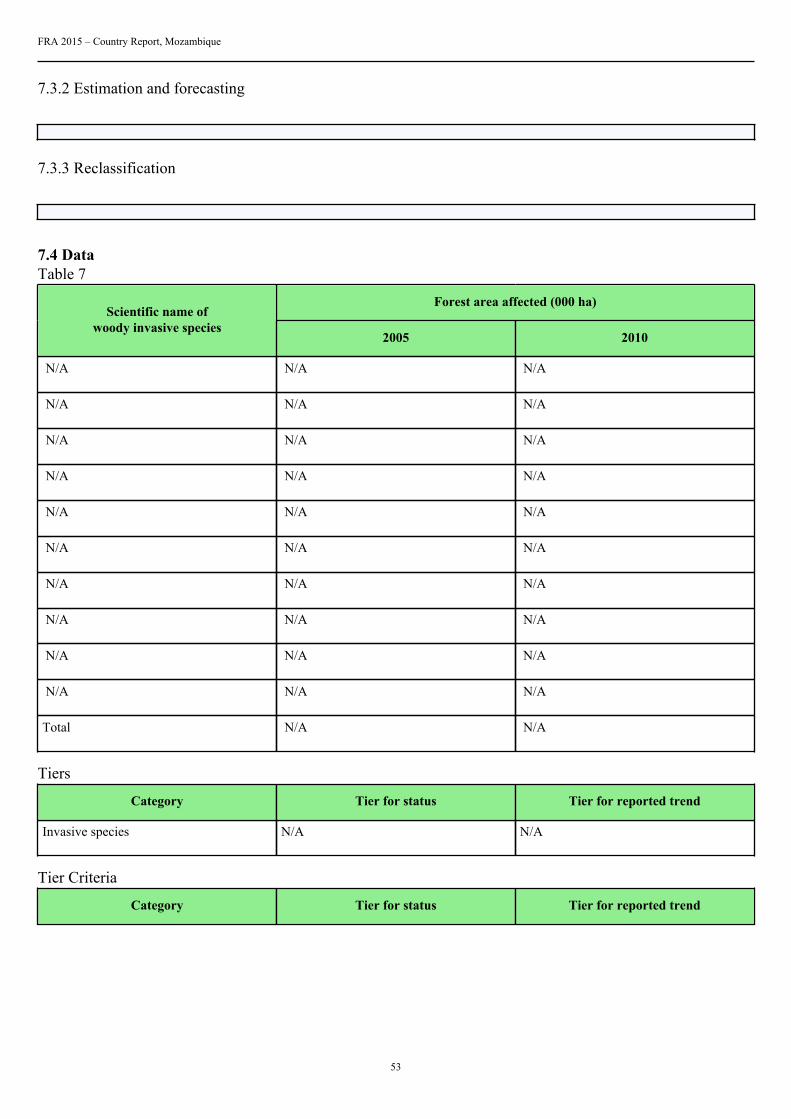
7.4 DataTable 7
Forest area affected (000 ha)Scientific name of
woody invasive species2005 2010
N/A N/A N/A
N/A N/A N/A
N/A N/A N/A
N/A N/A N/A
N/A N/A N/A
N/A N/A N/A
N/A N/A N/A
N/A N/A N/A
N/A N/A N/A
N/A N/A N/A
Total N/A N/A
Tiers
Category Tier for status Tier for reported trend
Invasive species N/A N/A
Tier Criteria
Category Tier for status Tier for reported trend
FRA 2015 – Country Report, Mozambique
54
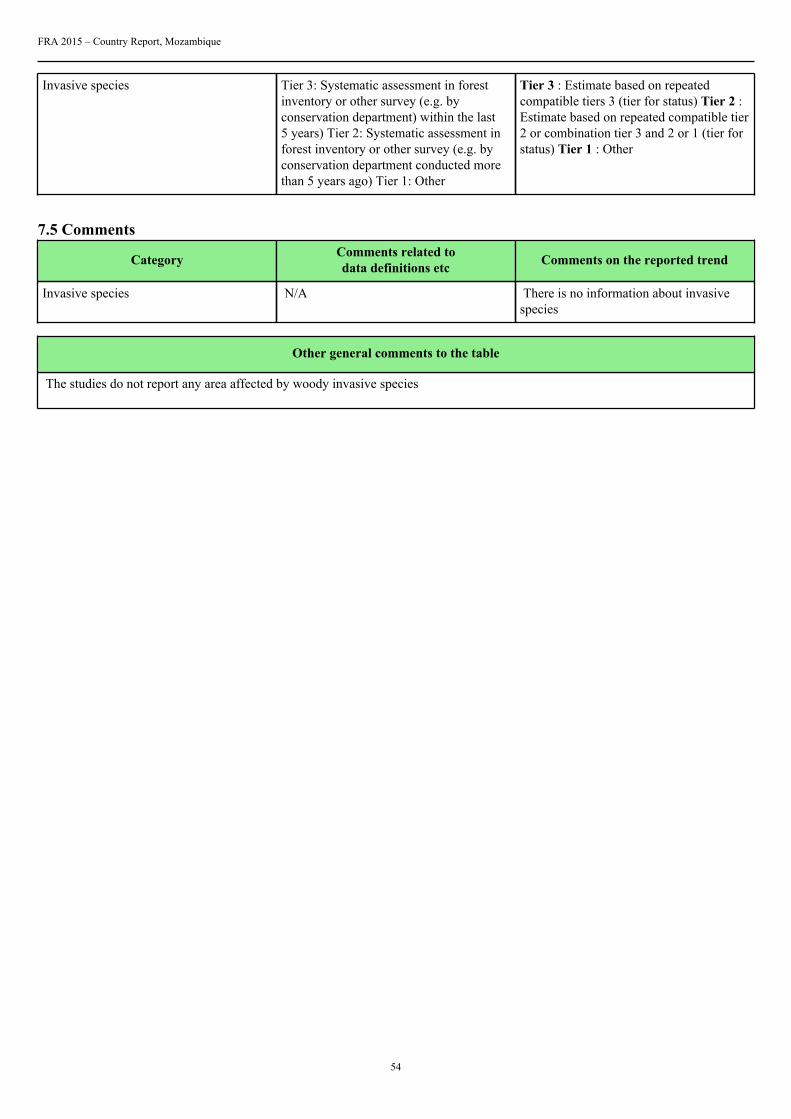
Invasive species Tier 3: Systematic assessment in forestinventory or other survey (e.g. byconservation department) within the last5 years) Tier 2: Systematic assessment inforest inventory or other survey (e.g. byconservation department conducted morethan 5 years ago) Tier 1: Other
Tier 3 : Estimate based on repeatedcompatible tiers 3 (tier for status) Tier 2 :Estimate based on repeated compatible tier2 or combination tier 3 and 2 or 1 (tier forstatus) Tier 1 : Other
7.5 Comments
Category Comments related todata definitions etc Comments on the reported trend
Invasive species N/A There is no information about invasivespecies
Other general comments to the table
The studies do not report any area affected by woody invasive species
FRA 2015 – Country Report, Mozambique
55
8. How much forest area is damaged each year?Documents for this question:
• Guide for country reporting FRA 2015• FRA 2015 Terms and Definitions
8.1 Categories and definitions
Category Definition
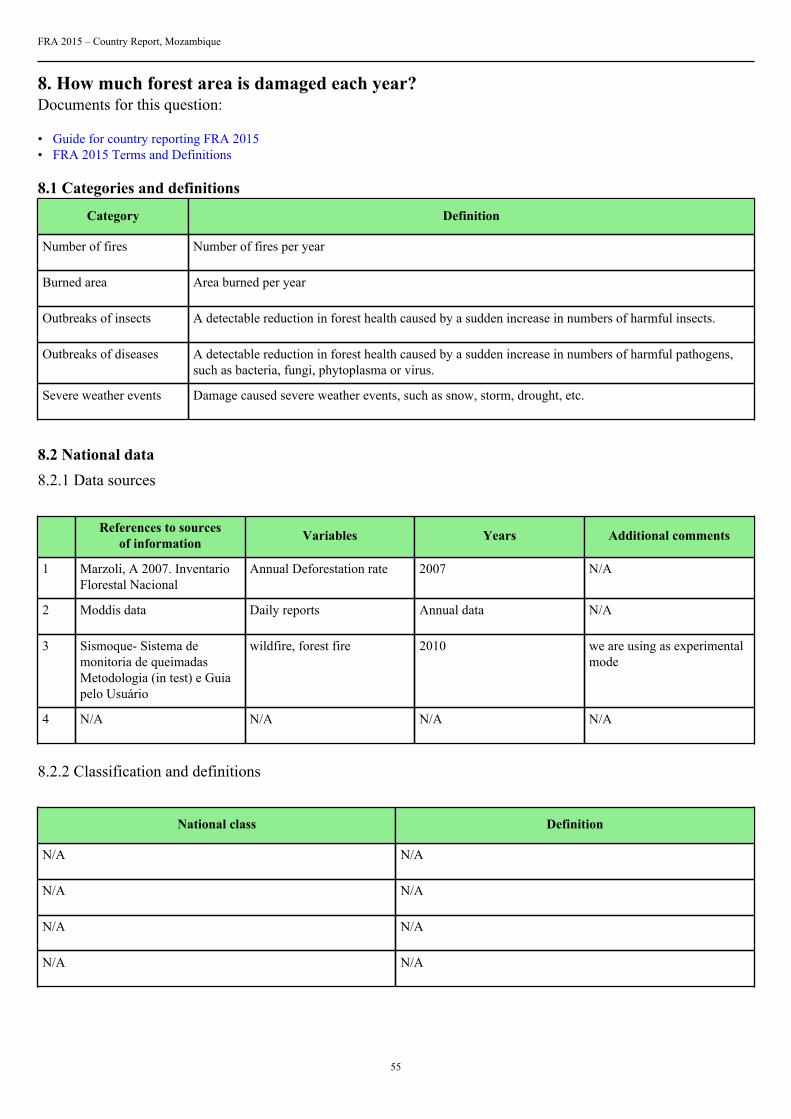
Number of fires Number of fires per year
Burned area Area burned per year
Outbreaks of insects A detectable reduction in forest health caused by a sudden increase in numbers of harmful insects.
Outbreaks of diseases A detectable reduction in forest health caused by a sudden increase in numbers of harmful pathogens,such as bacteria, fungi, phytoplasma or virus.
Severe weather events Damage caused severe weather events, such as snow, storm, drought, etc.
8.2 National data8.2.1 Data sources
References to sourcesof information Variables Years Additional comments
1 Marzoli, A 2007. InventarioFlorestal Nacional
Annual Deforestation rate 2007 N/A
2 Moddis data Daily reports Annual data N/A
3 Sismoque- Sistema demonitoria de queimadasMetodologia (in test) e Guiapelo Usuário
wildfire, forest fire 2010 we are using as experimentalmode
4 N/A N/A N/A N/A
8.2.2 Classification and definitions
National class Definition
N/A N/A
N/A N/A
N/A N/A
N/A N/A
FRA 2015 – Country Report, Mozambique
56
8.2.3 Original data
8.3 Analysis and processing of national data8.3.1 Adjustment
8.3.2 Estimation and forecasting
8.3.3 Reclassification
8.4 DataTable 8a
000 ha, number of fires
2003 2004 2005 2006 2007Category
000 ha # 000 ha # 000 ha # 000 ha # 000 ha #
Totalland areaburned
9675.3 143153 9675.8 109783 8752 158070 8729.8 133033 10433.5 150239
... ofwhichforestareaburned
2450.37 N/A 2676.29 N/A 1712.29 N/A 3321.19 N/A 4618.69 N/A
2008 2009 2010 2011 2012Category
000 ha # 000 ha # 000 ha # 000 ha # 000 ha #
Totalland areaburned
10190.8 177078 10239.8 128771 10748.4 157926 9889.3 144940 8817 95002
... ofwhichforestareaburned
3310.66 N/A 1620.49 N/A 3552.54 N/A 2918.42 N/A 3073.84 N/A
Table 8b
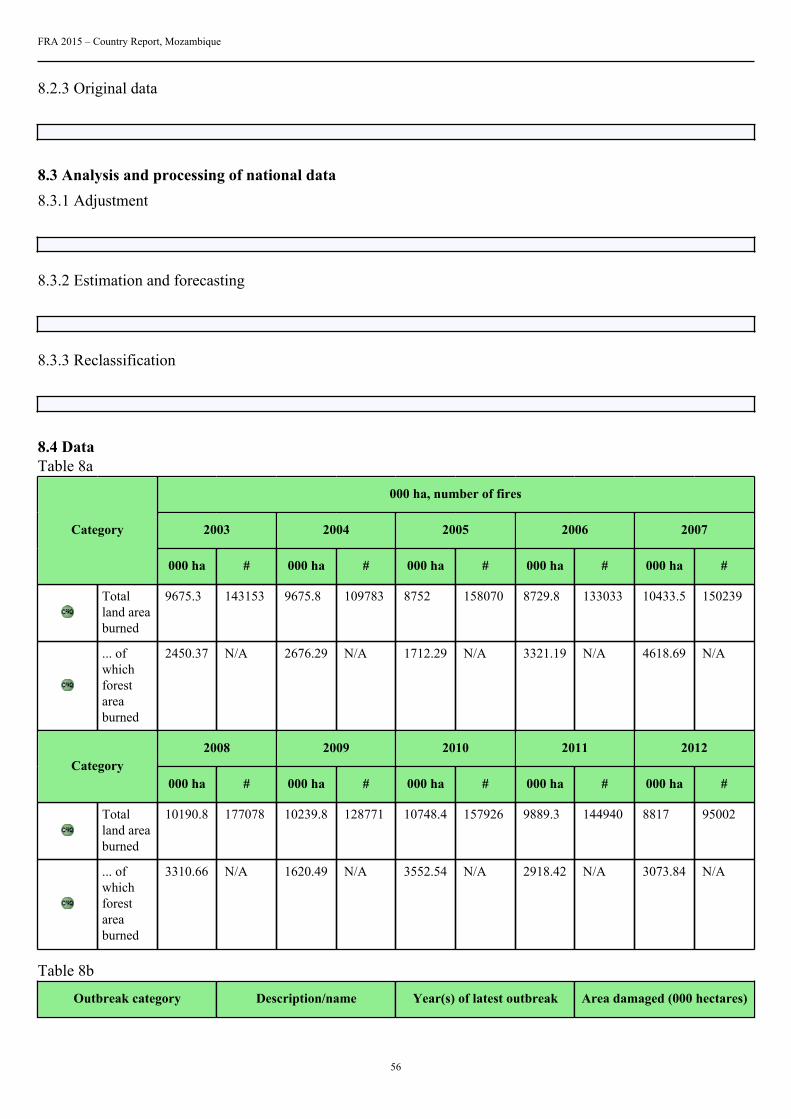
Outbreak category Description/name Year(s) of latest outbreak Area damaged (000 hectares)
FRA 2015 – Country Report, Mozambique
57
N/A N/A N/A N/A
N/A N/A N/A N/A
N/A N/A N/A N/A
N/A N/A N/A N/A
N/A N/A N/A N/A
N/A N/A N/A N/A
N/A N/A N/A N/A
N/A N/A N/A N/A
N/A N/A N/A N/A
N/A N/A N/A N/A
Outbreak category
1 Insects
2 Diseases
3 Severe weather events
Tiers
Category Tier for status Tier for trend
Area affected by fire Tier 2 Tier 2
• Insects• Diseases• Severe weather events
N/A N/A
Tier criteria
Category Tier for status Tier for reported trend
Burned area Tier 3 : National fire monitoring routinesTier 2 : Remote sensing surveys Tier 1 :Other
Tier 3 : Estimate based on repeatedcompatible tiers 3 (tier for status) Tier 2 :Estimate based on repeated compatible tier2 or combination tier 3 and 2 or 1 (tier forstatus) Tier 1 : Other
• Insects• Diseases• Severe weather events
Tier 3 : Systematic survey (e.g. viainventory or aerial damage assessment)Tier 2 : Management records Tier 1 :Other
Tier 3 : Estimate based on repeatedcompatible tiers 3 (tier for status) Tier 2 :Estimate based on repeated compatible tier2 or combination tier 3 and 2 or 1 (tier forstatus) Tier 1 : Other
FRA 2015 – Country Report, Mozambique
58
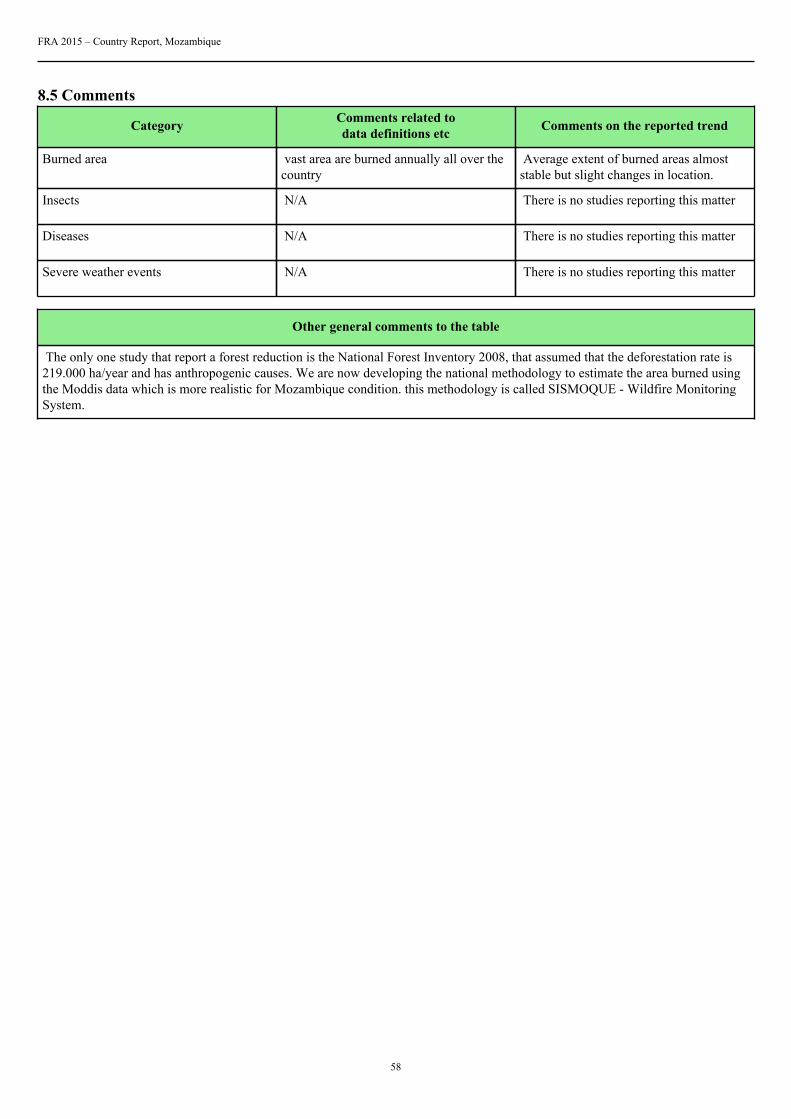
8.5 Comments
Category Comments related todata definitions etc Comments on the reported trend
Burned area vast area are burned annually all over thecountry
Average extent of burned areas almoststable but slight changes in location.
Insects N/A There is no studies reporting this matter
Diseases N/A There is no studies reporting this matter
Severe weather events N/A There is no studies reporting this matter
Other general comments to the table
The only one study that report a forest reduction is the National Forest Inventory 2008, that assumed that the deforestation rate is219.000 ha/year and has anthropogenic causes. We are now developing the national methodology to estimate the area burned usingthe Moddis data which is more realistic for Mozambique condition. this methodology is called SISMOQUE - Wildfire MonitoringSystem.
FRA 2015 – Country Report, Mozambique
59
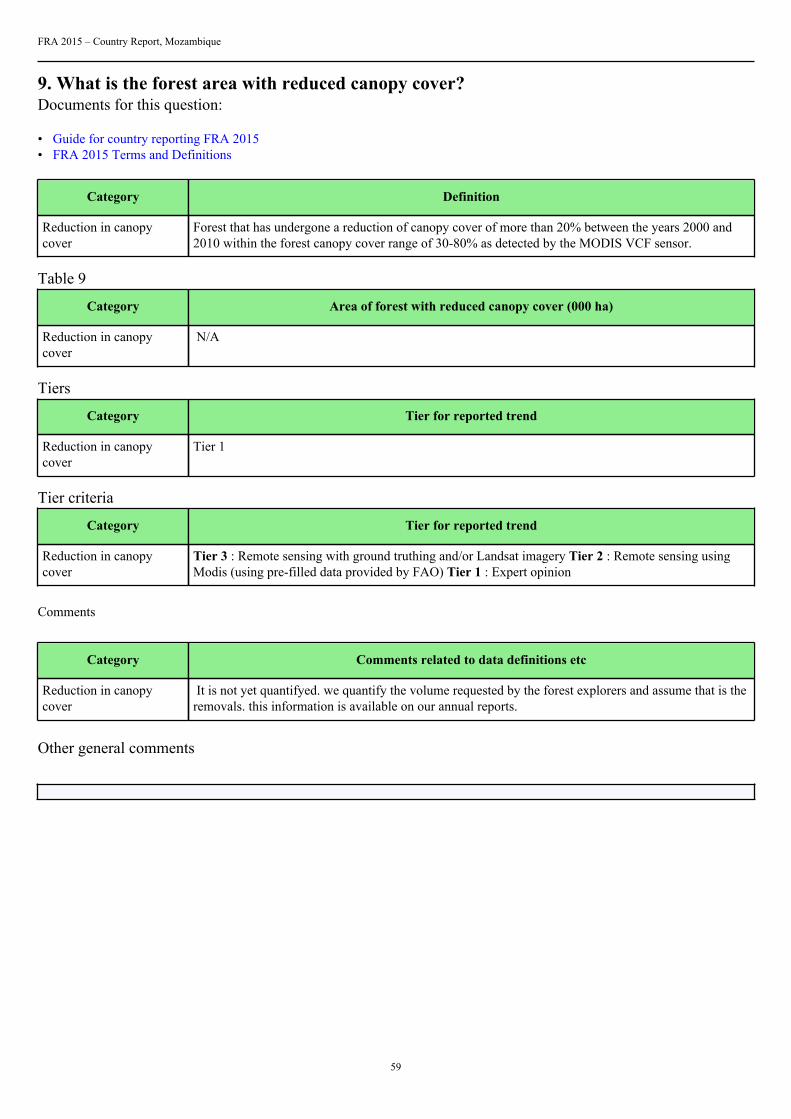
9. What is the forest area with reduced canopy cover?Documents for this question:
• Guide for country reporting FRA 2015• FRA 2015 Terms and Definitions
Category Definition
Reduction in canopycover
Forest that has undergone a reduction of canopy cover of more than 20% between the years 2000 and2010 within the forest canopy cover range of 30-80% as detected by the MODIS VCF sensor.
Table 9
Category Area of forest with reduced canopy cover (000 ha)
Reduction in canopycover
N/A
Tiers
Category Tier for reported trend
Reduction in canopycover
Tier 1
Tier criteria
Category Tier for reported trend
Reduction in canopycover
Tier 3 : Remote sensing with ground truthing and/or Landsat imagery Tier 2 : Remote sensing usingModis (using pre-filled data provided by FAO) Tier 1 : Expert opinion
Comments
Category Comments related to data definitions etc
Reduction in canopycover
It is not yet quantifyed. we quantify the volume requested by the forest explorers and assume that is theremovals. this information is available on our annual reports.
Other general comments
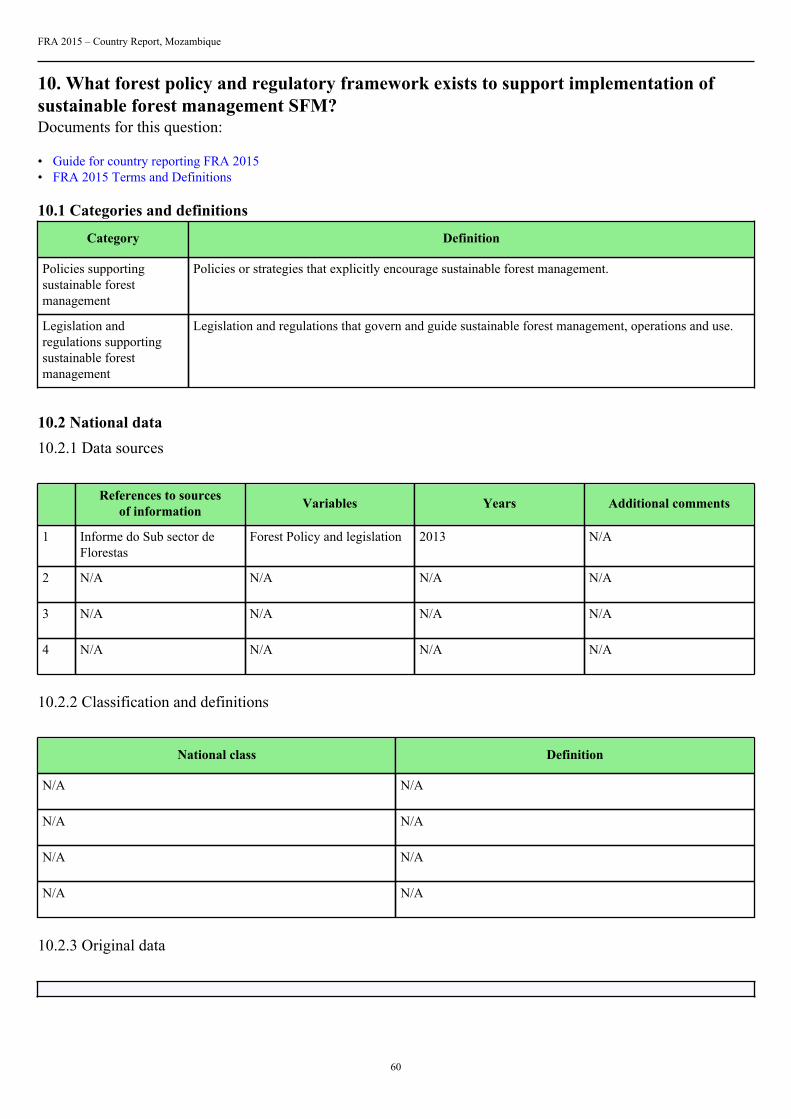
FRA 2015 – Country Report, Mozambique
60
10. What forest policy and regulatory framework exists to support implementation ofsustainable forest management SFM?Documents for this question:
• Guide for country reporting FRA 2015• FRA 2015 Terms and Definitions
10.1 Categories and definitions
Category Definition
Policies supportingsustainable forestmanagement
Policies or strategies that explicitly encourage sustainable forest management.
Legislation andregulations supportingsustainable forestmanagement
Legislation and regulations that govern and guide sustainable forest management, operations and use.
10.2 National data10.2.1 Data sources
References to sourcesof information Variables Years Additional comments
1 Informe do Sub sector deFlorestas
Forest Policy and legislation 2013 N/A
2 N/A N/A N/A N/A
3 N/A N/A N/A N/A
4 N/A N/A N/A N/A
10.2.2 Classification and definitions
National class Definition
N/A N/A
N/A N/A
N/A N/A
N/A N/A
10.2.3 Original data
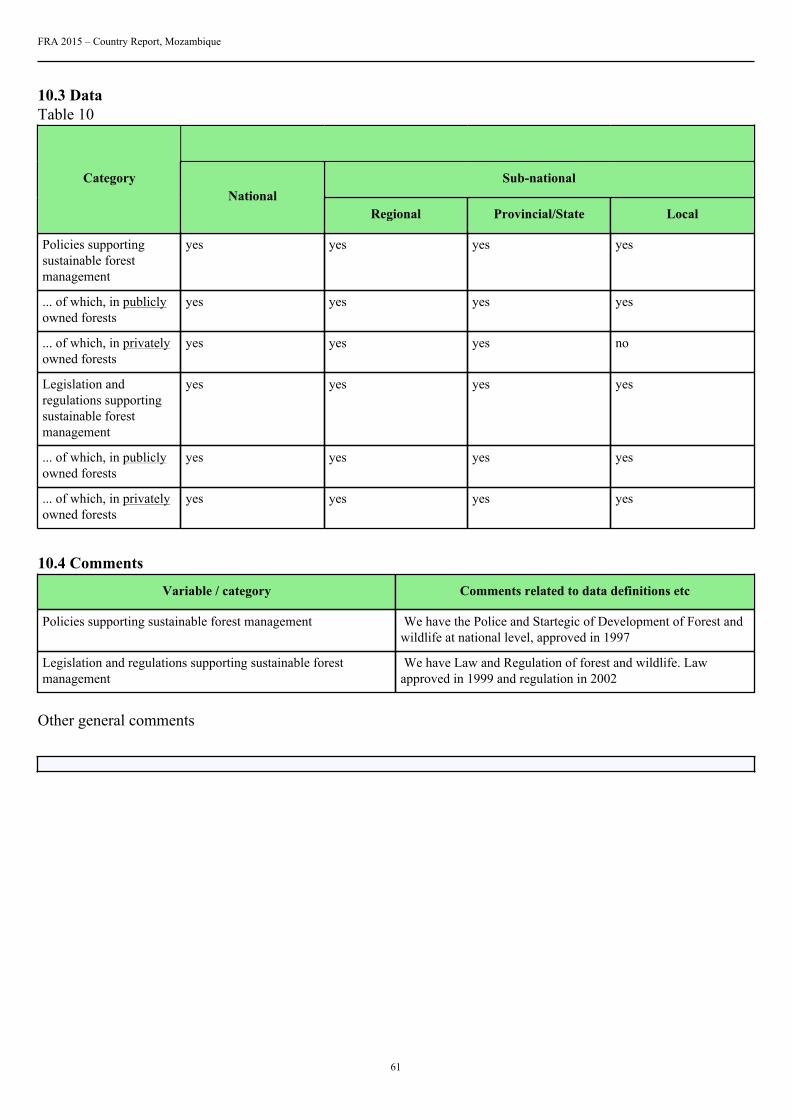
FRA 2015 – Country Report, Mozambique
61
10.3 DataTable 10
Sub-nationalCategoryNational
Regional Provincial/State Local
Policies supportingsustainable forestmanagement
yes yes yes yes
... of which, in publiclyowned forests
yes yes yes yes
... of which, in privatelyowned forests
yes yes yes no
Legislation andregulations supportingsustainable forestmanagement
yes yes yes yes
... of which, in publiclyowned forests
yes yes yes yes
... of which, in privatelyowned forests
yes yes yes yes
10.4 Comments
Variable / category Comments related to data definitions etc
Policies supporting sustainable forest management We have the Police and Startegic of Development of Forest andwildlife at national level, approved in 1997
Legislation and regulations supporting sustainable forestmanagement
We have Law and Regulation of forest and wildlife. Lawapproved in 1999 and regulation in 2002
Other general comments
FRA 2015 – Country Report, Mozambique
62
11. Is there a national platform that promotes stakeholder participation in forest policydevelopment?Documents for this question:
• Guide for country reporting FRA 2015• FRA 2015 Terms and Definitions
11.1 Categories and definitions
Category Definition
National stakeholderplatform
A recognized procedure that a broad range of stakeholders can use to provide opinions, suggestions,analysis, recommendations and other input into the development of national forest policy.
11.2 National data11.2.1 Data sources
References to sources of information Years Additional comments
1 Report of Forest Forum 2012 2012 This forest forum is created in 2005
2 N/A N/A N/A
3 N/A N/A N/A
4 N/A N/A N/A
Table 11Is there a national platform that promotes or allows forstakeholder participation in forest policy development?
yes
11.3 Comments
Category Comments related to data definitions etc
National stakeholder platform This platform is called Forest Forum, which involves thegovernment institutions, private sector, localb communities,NGOs and Civil Society
Other general comments
FRA 2015 – Country Report, Mozambique
63
12. What is the forest area intended to be in permanent forest land use and how has itchanged over time?Documents for this question:
• Guide for country reporting FRA 2015• FRA 2015 Terms and Definitions
12.1 Categories and definitions
Category Definition
Forest area intended to bein permanent forest landuse
Forest area that is designated or expected to be retained as forest and is highly unlikely to be convertedto other land use.
...of which permanentforest estate (sub-category)
Forest area that is designated by law or regulation to be retained as forest and may not be converted toother land use.
12.2 National data12.2.1 Data sources
References to sourcesof information Variables Years Additional comments
1 Ministerio de turismo.Informe sobre as áreas deconversacao 2012
Conservation area 2012 N/A
2 N/A N/A N/A N/A
3 N/A N/A N/A N/A
4 N/A N/A N/A N/A
12.2.2 Classification and definitions
National class Definition
N/A N/A
N/A N/A
N/A N/A
N/A N/A
12.2.3 Original data
FRA 2015 – Country Report, Mozambique
64
12.3 Analysis and processing of national data12.3.1 Adjustment
12.3.2 Estimation and forecasting
12.3.3 Reclassification
12.4 DataTable 12
Categories Forest area 2010 (000 ha)
Forest area intended to be in permanentforest land use
9051
... of which permanent forest estate 9051
Tiers
Category Tier for status
Forest area intended to be in permanent forest land use Tier 3
Permanent forest estate Tier 3
Tier Criteria
Category Tier for status
Forest area intended to be in permanent forest land use Tier 3 : National or sub-national land use plans strategydocuments or other reports within the past 10 years Tier 2 :National or sub-national land use plans strategy documents orother reports within the past 20 years Tier 1 : Other
Permanent forest estate Tier 3 : National or sub-national land use plans strategydocuments or other reports within the past 10 years Tier 2 :National or sub-national land use plans strategy documents orother reports within the past 20 years Tier 1 : Other
12.5 Comments
Category Comments related to data definitions etc
Forest area intended to be in permanent forest land use only conservation area because are designated by law
FRA 2015 – Country Report, Mozambique
65
Permanent forest estate The Forest area that is designated or expected to be retainedas forest and is highly unlikely to be converted to other landuse is conservation fores area which is is designated by law orregulation to be retained as forest. Thus are the same.
Other general comments
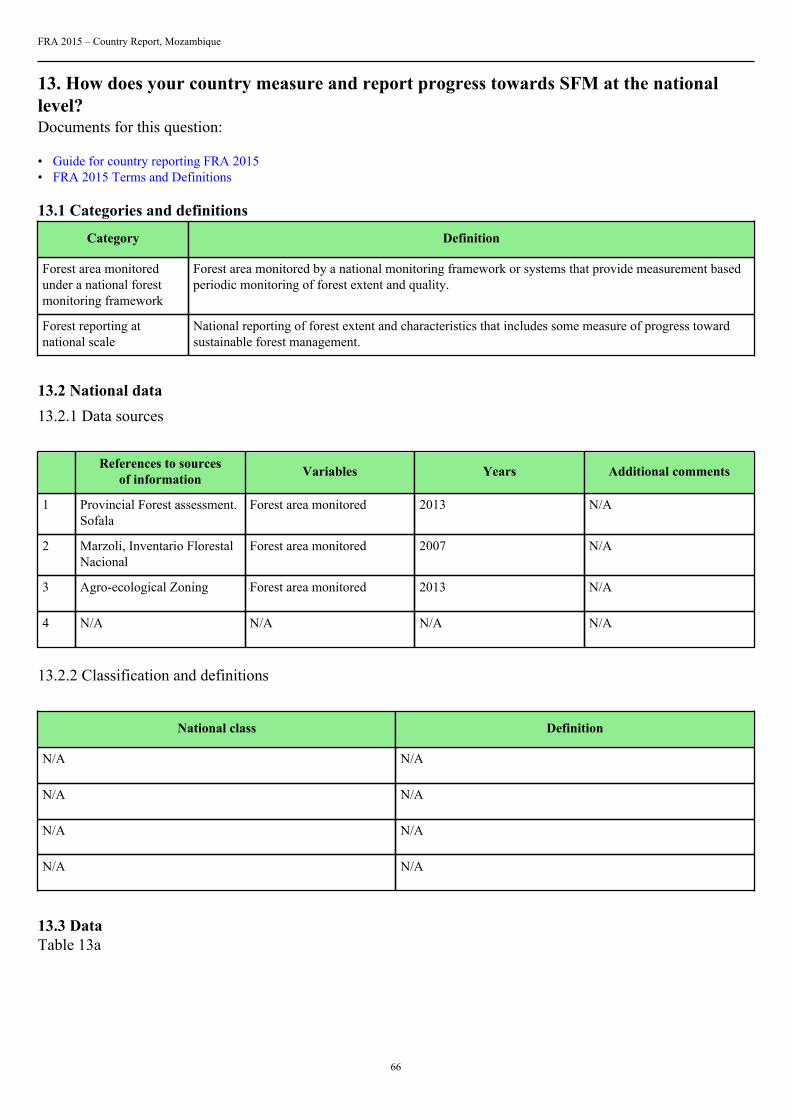
FRA 2015 – Country Report, Mozambique
66
13. How does your country measure and report progress towards SFM at the nationallevel?Documents for this question:
• Guide for country reporting FRA 2015• FRA 2015 Terms and Definitions
13.1 Categories and definitions
Category Definition
Forest area monitoredunder a national forestmonitoring framework
Forest area monitored by a national monitoring framework or systems that provide measurement basedperiodic monitoring of forest extent and quality.
Forest reporting atnational scale
National reporting of forest extent and characteristics that includes some measure of progress towardsustainable forest management.
13.2 National data13.2.1 Data sources
References to sourcesof information Variables Years Additional comments
1 Provincial Forest assessment.Sofala
Forest area monitored 2013 N/A
2 Marzoli, Inventario FlorestalNacional
Forest area monitored 2007 N/A
3 Agro-ecological Zoning Forest area monitored 2013 N/A
4 N/A N/A N/A N/A
13.2.2 Classification and definitions
National class Definition
N/A N/A
N/A N/A
N/A N/A
N/A N/A
13.3 DataTable 13a
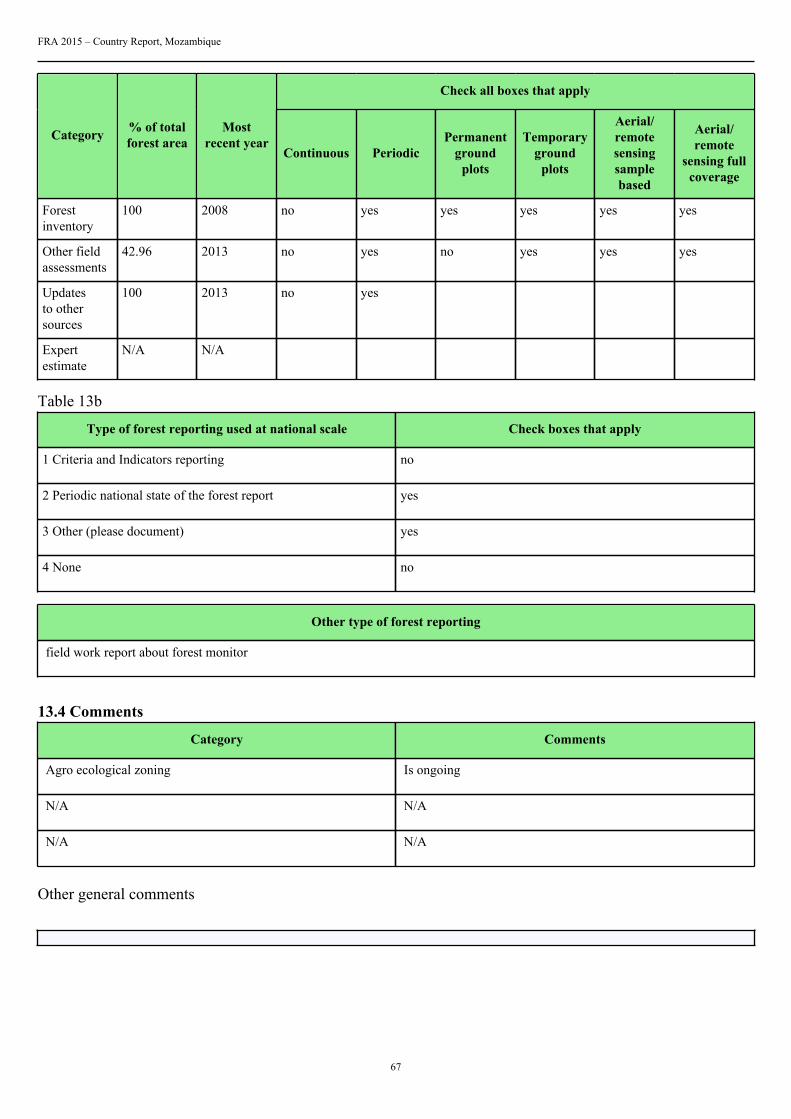
FRA 2015 – Country Report, Mozambique
67
Check all boxes that apply
Category % of totalforest area
Mostrecent year
Continuous PeriodicPermanent
groundplots
Temporaryground
plots
Aerial/remotesensingsamplebased
Aerial/remote
sensing fullcoverage
Forestinventory
100 2008 no yes yes yes yes yes
Other fieldassessments
42.96 2013 no yes no yes yes yes
Updatesto othersources
100 2013 no yes
Expertestimate
N/A N/A
Table 13b
Type of forest reporting used at national scale Check boxes that apply
1 Criteria and Indicators reporting no
2 Periodic national state of the forest report yes
3 Other (please document) yes
4 None no
Other type of forest reporting
field work report about forest monitor
13.4 Comments
Category Comments
Agro ecological zoning Is ongoing
N/A N/A
N/A N/A
Other general comments
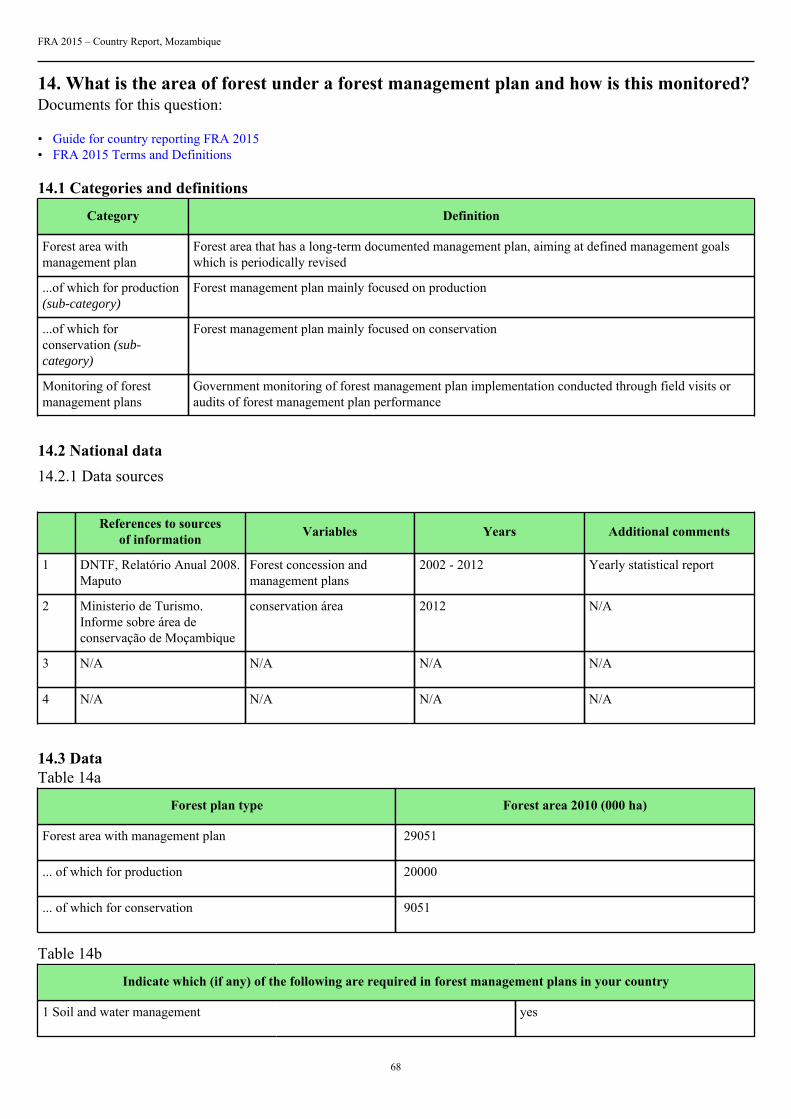
FRA 2015 – Country Report, Mozambique
68
14. What is the area of forest under a forest management plan and how is this monitored?Documents for this question:
• Guide for country reporting FRA 2015• FRA 2015 Terms and Definitions
14.1 Categories and definitions
Category Definition
Forest area withmanagement plan
Forest area that has a long-term documented management plan, aiming at defined management goalswhich is periodically revised
...of which for production(sub-category)
Forest management plan mainly focused on production
...of which forconservation (sub-category)
Forest management plan mainly focused on conservation
Monitoring of forestmanagement plans
Government monitoring of forest management plan implementation conducted through field visits oraudits of forest management plan performance
14.2 National data14.2.1 Data sources
References to sourcesof information Variables Years Additional comments
1 DNTF, Relatório Anual 2008.Maputo
Forest concession andmanagement plans
2002 - 2012 Yearly statistical report
2 Ministerio de Turismo.Informe sobre área deconservação de Moçambique
conservation área 2012 N/A
3 N/A N/A N/A N/A
4 N/A N/A N/A N/A
14.3 DataTable 14a
Forest plan type Forest area 2010 (000 ha)
Forest area with management plan 29051
... of which for production 20000
... of which for conservation 9051
Table 14b
Indicate which (if any) of the following are required in forest management plans in your country
1 Soil and water management yes
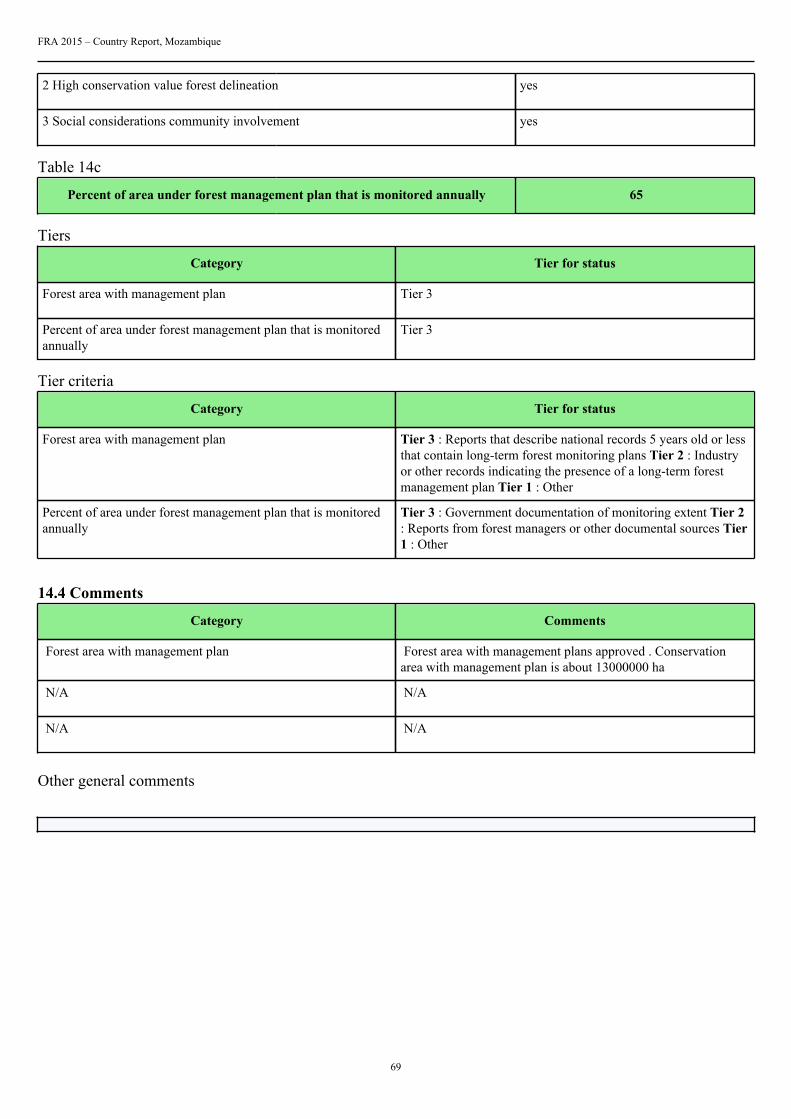
FRA 2015 – Country Report, Mozambique
69
2 High conservation value forest delineation yes
3 Social considerations community involvement yes
Table 14c
Percent of area under forest management plan that is monitored annually 65
Tiers
Category Tier for status
Forest area with management plan Tier 3
Percent of area under forest management plan that is monitoredannually
Tier 3
Tier criteria
Category Tier for status
Forest area with management plan Tier 3 : Reports that describe national records 5 years old or lessthat contain long-term forest monitoring plans Tier 2 : Industryor other records indicating the presence of a long-term forestmanagement plan Tier 1 : Other
Percent of area under forest management plan that is monitoredannually
Tier 3 : Government documentation of monitoring extent Tier 2: Reports from forest managers or other documental sources Tier1 : Other
14.4 Comments
Category Comments
Forest area with management plan Forest area with management plans approved . Conservationarea with management plan is about 13000000 ha
N/A N/A
N/A N/A
Other general comments
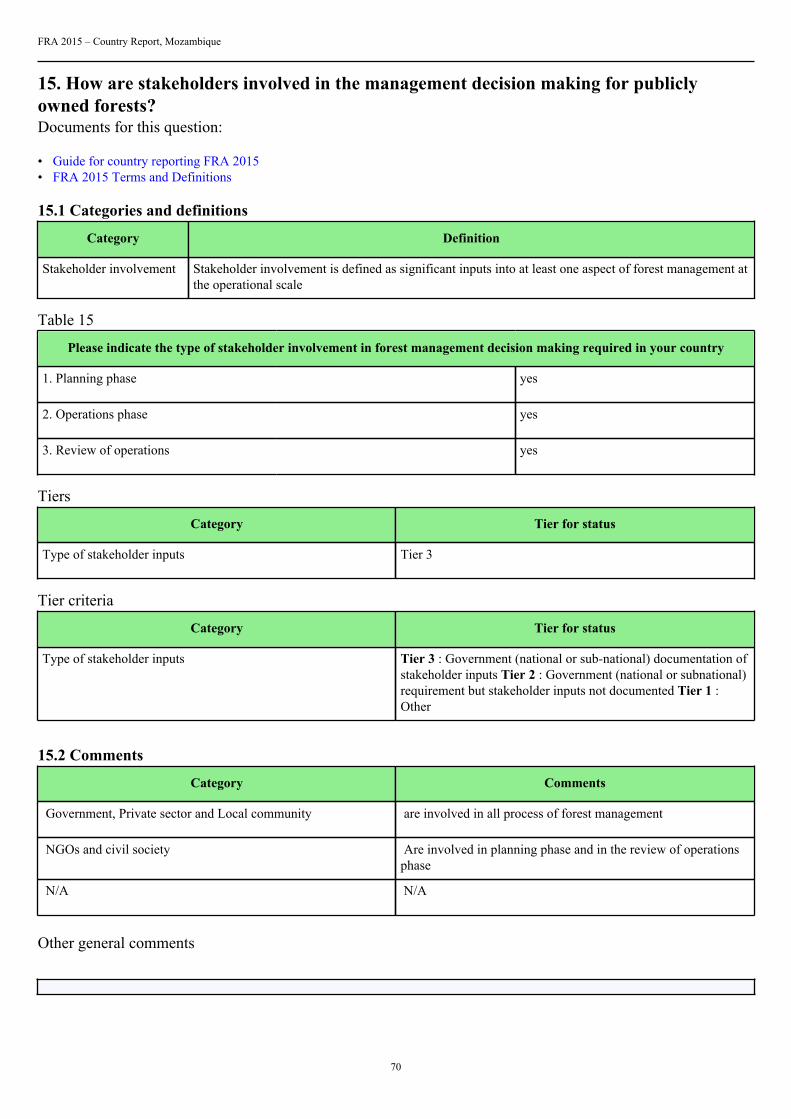
FRA 2015 – Country Report, Mozambique
70
15. How are stakeholders involved in the management decision making for publiclyowned forests?Documents for this question:
• Guide for country reporting FRA 2015• FRA 2015 Terms and Definitions
15.1 Categories and definitions
Category Definition
Stakeholder involvement Stakeholder involvement is defined as significant inputs into at least one aspect of forest management atthe operational scale
Table 15
Please indicate the type of stakeholder involvement in forest management decision making required in your country
1. Planning phase yes
2. Operations phase yes
3. Review of operations yes
Tiers
Category Tier for status
Type of stakeholder inputs Tier 3
Tier criteria
Category Tier for status
Type of stakeholder inputs Tier 3 : Government (national or sub-national) documentation ofstakeholder inputs Tier 2 : Government (national or subnational)requirement but stakeholder inputs not documented Tier 1 :Other
15.2 Comments
Category Comments
Government, Private sector and Local community are involved in all process of forest management
NGOs and civil society Are involved in planning phase and in the review of operationsphase
N/A N/A
Other general comments
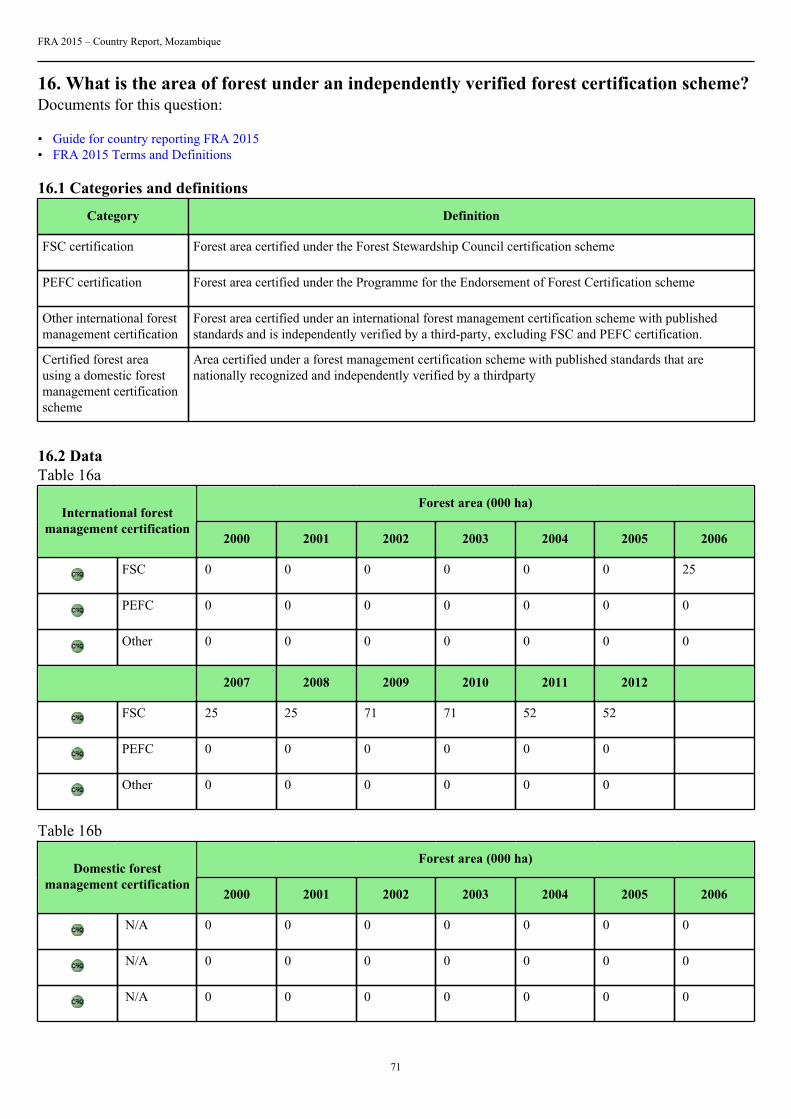
FRA 2015 – Country Report, Mozambique
71
16. What is the area of forest under an independently verified forest certification scheme?Documents for this question:
• Guide for country reporting FRA 2015• FRA 2015 Terms and Definitions
16.1 Categories and definitions
Category Definition
FSC certification Forest area certified under the Forest Stewardship Council certification scheme
PEFC certification Forest area certified under the Programme for the Endorsement of Forest Certification scheme
Other international forestmanagement certification
Forest area certified under an international forest management certification scheme with publishedstandards and is independently verified by a third-party, excluding FSC and PEFC certification.
Certified forest areausing a domestic forestmanagement certificationscheme
Area certified under a forest management certification scheme with published standards that arenationally recognized and independently verified by a thirdparty
16.2 DataTable 16a
Forest area (000 ha)International forest
management certification2000 2001 2002 2003 2004 2005 2006
FSC 0 0 0 0 0 0 25
PEFC 0 0 0 0 0 0 0
Other 0 0 0 0 0 0 0
2007 2008 2009 2010 2011 2012
FSC 25 25 71 71 52 52
PEFC 0 0 0 0 0 0
Other 0 0 0 0 0 0
Table 16b
Forest area (000 ha)Domestic forest
management certification2000 2001 2002 2003 2004 2005 2006
N/A 0 0 0 0 0 0 0
N/A 0 0 0 0 0 0 0
N/A 0 0 0 0 0 0 0
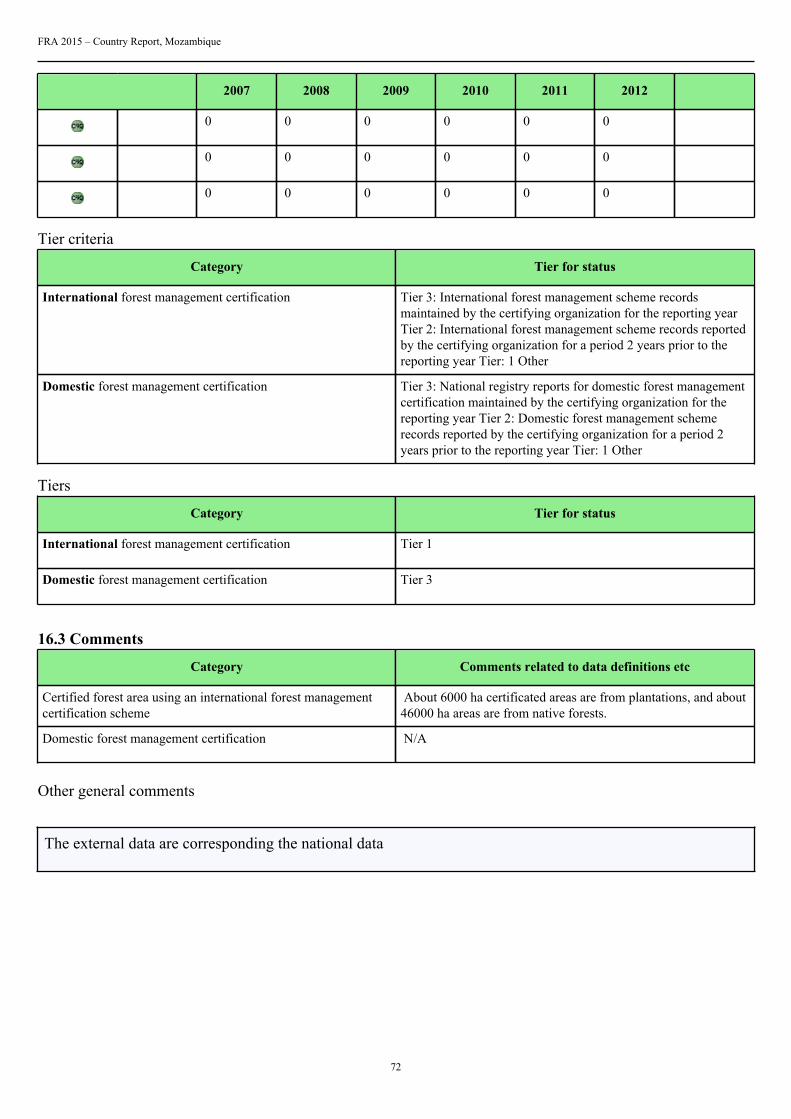
FRA 2015 – Country Report, Mozambique
72
2007 2008 2009 2010 2011 2012
0 0 0 0 0 0
0 0 0 0 0 0
0 0 0 0 0 0
Tier criteria
Category Tier for status
International forest management certification Tier 3: International forest management scheme recordsmaintained by the certifying organization for the reporting yearTier 2: International forest management scheme records reportedby the certifying organization for a period 2 years prior to thereporting year Tier: 1 Other
Domestic forest management certification Tier 3: National registry reports for domestic forest managementcertification maintained by the certifying organization for thereporting year Tier 2: Domestic forest management schemerecords reported by the certifying organization for a period 2years prior to the reporting year Tier: 1 Other
Tiers
Category Tier for status
International forest management certification Tier 1
Domestic forest management certification Tier 3
16.3 Comments
Category Comments related to data definitions etc
Certified forest area using an international forest managementcertification scheme
About 6000 ha certificated areas are from plantations, and about46000 ha areas are from native forests.
Domestic forest management certification N/A
Other general comments
The external data are corresponding the national data
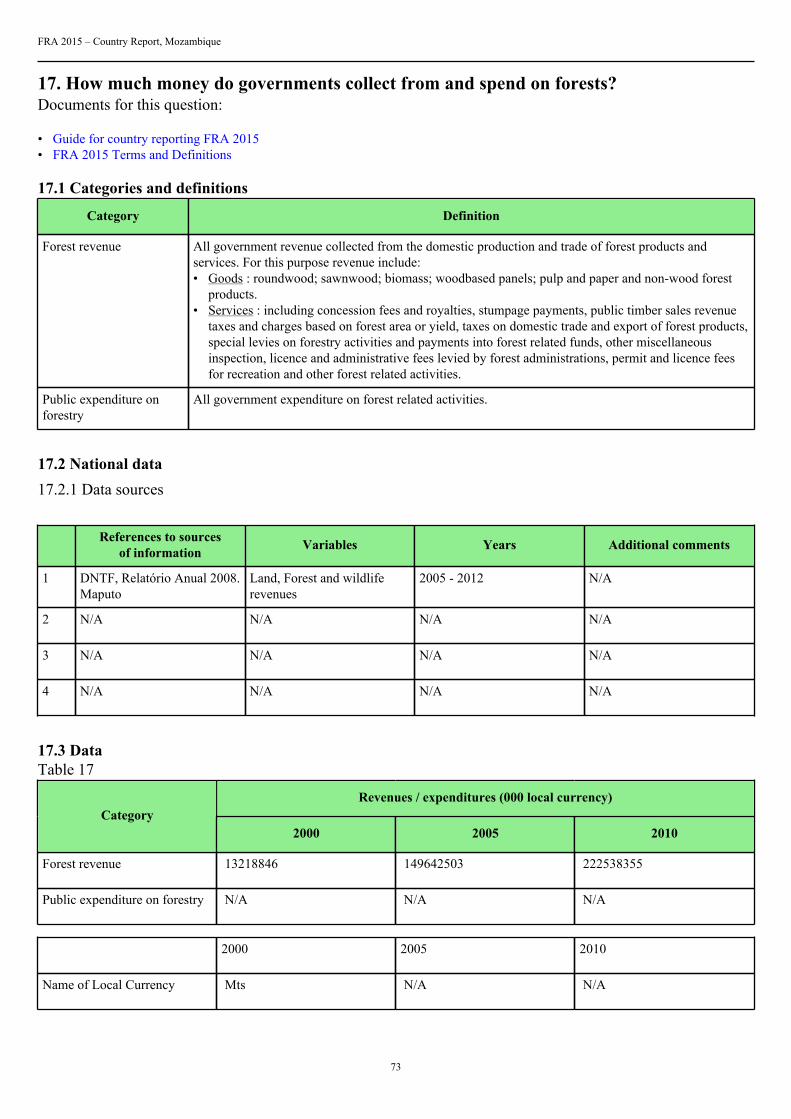
FRA 2015 – Country Report, Mozambique
73
17. How much money do governments collect from and spend on forests?Documents for this question:
• Guide for country reporting FRA 2015• FRA 2015 Terms and Definitions
17.1 Categories and definitions
Category Definition
Forest revenue All government revenue collected from the domestic production and trade of forest products andservices. For this purpose revenue include:• Goods : roundwood; sawnwood; biomass; woodbased panels; pulp and paper and non-wood forest
products.• Services : including concession fees and royalties, stumpage payments, public timber sales revenue
taxes and charges based on forest area or yield, taxes on domestic trade and export of forest products,special levies on forestry activities and payments into forest related funds, other miscellaneousinspection, licence and administrative fees levied by forest administrations, permit and licence feesfor recreation and other forest related activities.
Public expenditure onforestry
All government expenditure on forest related activities.
17.2 National data17.2.1 Data sources
References to sourcesof information Variables Years Additional comments
1 DNTF, Relatório Anual 2008.Maputo
Land, Forest and wildliferevenues
2005 - 2012 N/A
2 N/A N/A N/A N/A
3 N/A N/A N/A N/A
4 N/A N/A N/A N/A
17.3 DataTable 17
Revenues / expenditures (000 local currency)Category
2000 2005 2010
Forest revenue 13218846 149642503 222538355
Public expenditure on forestry N/A N/A N/A
2000 2005 2010
Name of Local Currency Mts N/A N/A
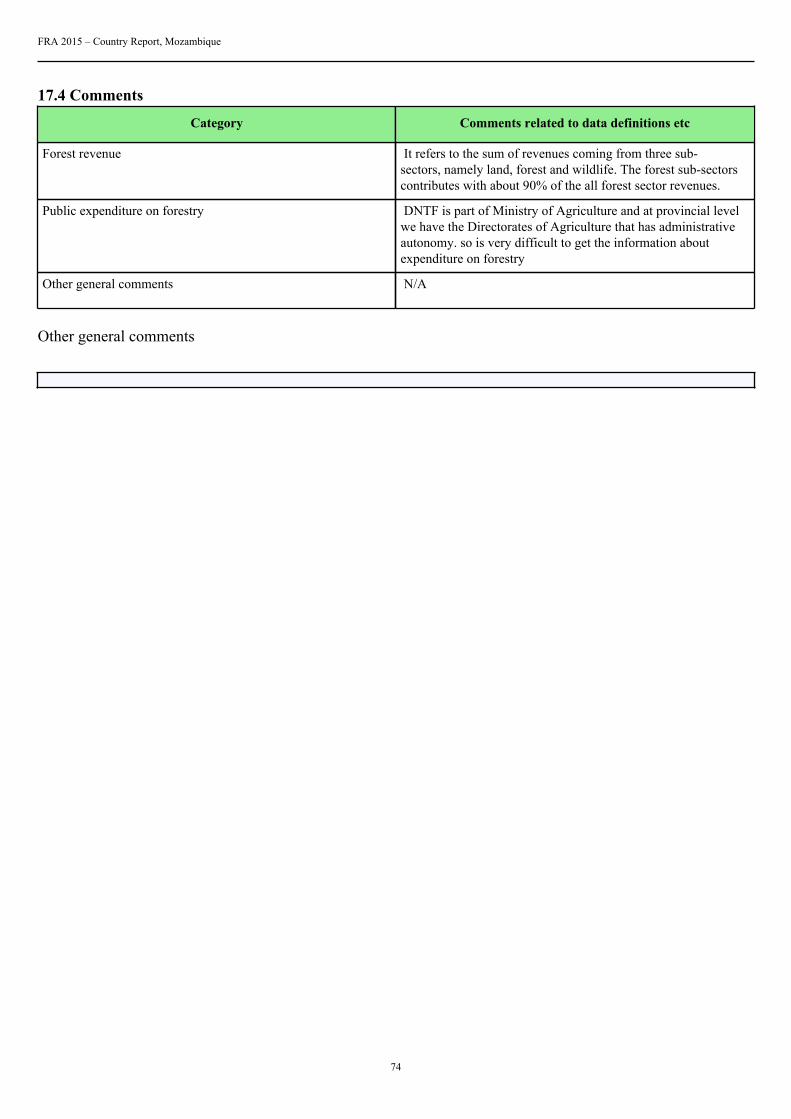
FRA 2015 – Country Report, Mozambique
74
17.4 Comments
Category Comments related to data definitions etc
Forest revenue It refers to the sum of revenues coming from three sub-sectors, namely land, forest and wildlife. The forest sub-sectorscontributes with about 90% of the all forest sector revenues.
Public expenditure on forestry DNTF is part of Ministry of Agriculture and at provincial levelwe have the Directorates of Agriculture that has administrativeautonomy. so is very difficult to get the information aboutexpenditure on forestry
Other general comments N/A
Other general comments
FRA 2015 – Country Report, Mozambique
75
18. Who owns and manages the forests and how has this changed?Documents for this question:
• Guide for country reporting FRA 2015• FRA 2015 Terms and Definitions
18.1 Categories and definitions
Category Definition
Public ownership Forest owned by the State or administrative units of the public administration or by institutions orcorporations owned by the public administration.
...of which owned by thestate at national scale(sub-category)
Forest owned by the State at the national scale or administrative units of the public administration or byinstitutions or corporations owned by the public administration.
...of which owned by thestate at the sub-nationalgovernment scale (sub-category)
Forest owned by the State at the sub-national government scale or administrative units of the publicadministration or by institutions or corporations owned by the public administration.
Private ownership Forest owned by individuals, families, communities, private cooperatives corporations and otherbusiness entities, private, religious and educational institutions, pension or investment funds, NGOs,nature conservation associations and other private institutions.
...of which individuals(sub-category)
Forest owned by individuals and families.
...of which privatebusiness entities andinstitutions (sub-category)
Forest owned by private corporations cooperatives companies and other business entities as well asprivate nonprofit organizations such as NGOs nature conservation associations, and private religiousand educational institutions etc.
...of which local tribal andindigenous communities(sub-category)
Forest owned by a group of individuals belonging to the same community residing within or in thevicinity of a forest area or forest owned by communities of indigenous or tribal people The communitymembers are coowners that share exclusive rights and duties and benefits contribute to the communitydevelopment.
Unknown ownership Forest area where ownership is unknown includes areas where ownership is unclear or disputed.
Categories related tomanagement rights
of public forestsDefinition
Public Administration The Public Administration (or institutions or corporations owned by the Public Administration) retainsmanagement rights and responsibilities within the limits specified by the legislation.
Individuals households Forest management rights and responsibilities are transferred from the Public Administration toindividuals or households through long-term leases or management agreements.
Private companies Forest management rights and responsibilities are transferred from the Public Administration tocorporations, other business entities private cooperatives, private nonprofit institutions and associations,etc., through long-term leases or management agreements.
Communities Forest management rights and responsibilities are transferred from the Public Administration to localcommunities (including indigenous and tribal communities) through long-term leases or managementagreements.
Other form ofmanagement rights
Forests for which the transfer of management rights does not belong to any of the categories mentionedabove.
18.2 National data
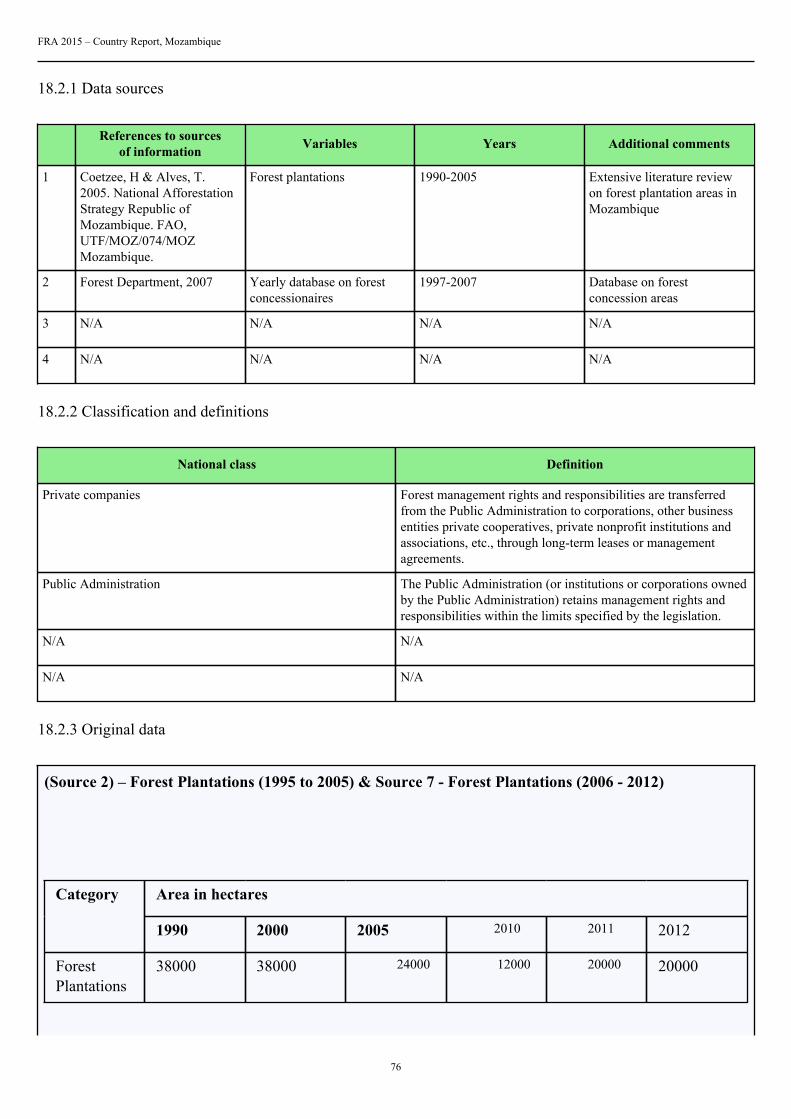
FRA 2015 – Country Report, Mozambique
76
18.2.1 Data sources
References to sourcesof information Variables Years Additional comments
1 Coetzee, H & Alves, T.2005. National AfforestationStrategy Republic ofMozambique. FAO,UTF/MOZ/074/MOZMozambique.
Forest plantations 1990-2005 Extensive literature reviewon forest plantation areas inMozambique
2 Forest Department, 2007 Yearly database on forestconcessionaires
1997-2007 Database on forestconcession areas
3 N/A N/A N/A N/A
4 N/A N/A N/A N/A
18.2.2 Classification and definitions
National class Definition
Private companies Forest management rights and responsibilities are transferredfrom the Public Administration to corporations, other businessentities private cooperatives, private nonprofit institutions andassociations, etc., through long-term leases or managementagreements.
Public Administration The Public Administration (or institutions or corporations ownedby the Public Administration) retains management rights andresponsibilities within the limits specified by the legislation.
N/A N/A
N/A N/A
18.2.3 Original data
(Source 2) – Forest Plantations (1995 to 2005) & Source 7 - Forest Plantations (2006 - 2012)
Area in hectaresCategory
1990 2000 2005 2010 2011 2012
ForestPlantations
38000 38000 24000 12000 20000 20000
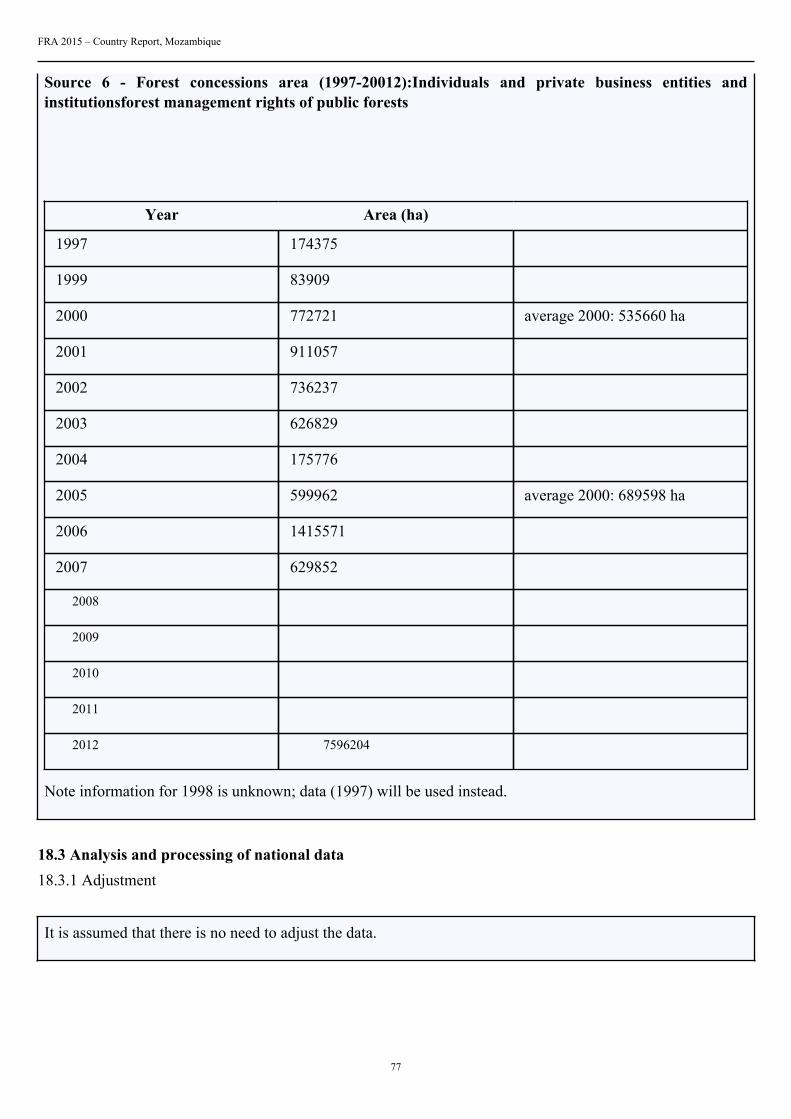
FRA 2015 – Country Report, Mozambique
77
Source 6 - Forest concessions area (1997-20012):Individuals and private business entities andinstitutionsforest management rights of public forests
Year Area (ha)
1997 174375
1999 83909
2000 772721 average 2000: 535660 ha
2001 911057
2002 736237
2003 626829
2004 175776
2005 599962 average 2000: 689598 ha
2006 1415571
2007 629852
2008
2009
2010
2011
2012 7596204
Note information for 1998 is unknown; data (1997) will be used instead.
18.3 Analysis and processing of national data18.3.1 Adjustment
It is assumed that there is no need to adjust the data.
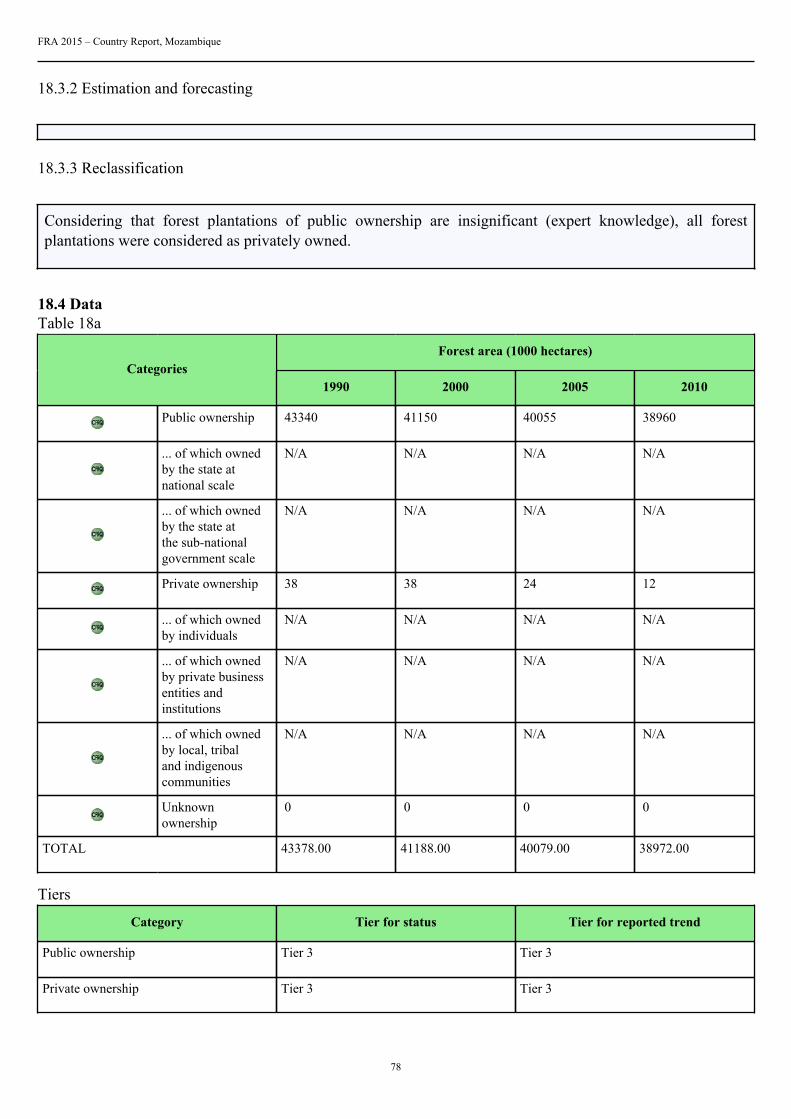
FRA 2015 – Country Report, Mozambique
78
18.3.2 Estimation and forecasting
18.3.3 Reclassification
Considering that forest plantations of public ownership are insignificant (expert knowledge), all forestplantations were considered as privately owned.
18.4 DataTable 18a
Forest area (1000 hectares)Categories
1990 2000 2005 2010
Public ownership 43340 41150 40055 38960
... of which ownedby the state atnational scale
N/A N/A N/A N/A
... of which ownedby the state atthe sub-nationalgovernment scale
N/A N/A N/A N/A
Private ownership 38 38 24 12
... of which ownedby individuals
N/A N/A N/A N/A
... of which ownedby private businessentities andinstitutions
N/A N/A N/A N/A
... of which ownedby local, tribaland indigenouscommunities
N/A N/A N/A N/A
Unknownownership
0 0 0 0
TOTAL 43378.00 41188.00 40079.00 38972.00
Tiers
Category Tier for status Tier for reported trend
Public ownership Tier 3 Tier 3
Private ownership Tier 3 Tier 3
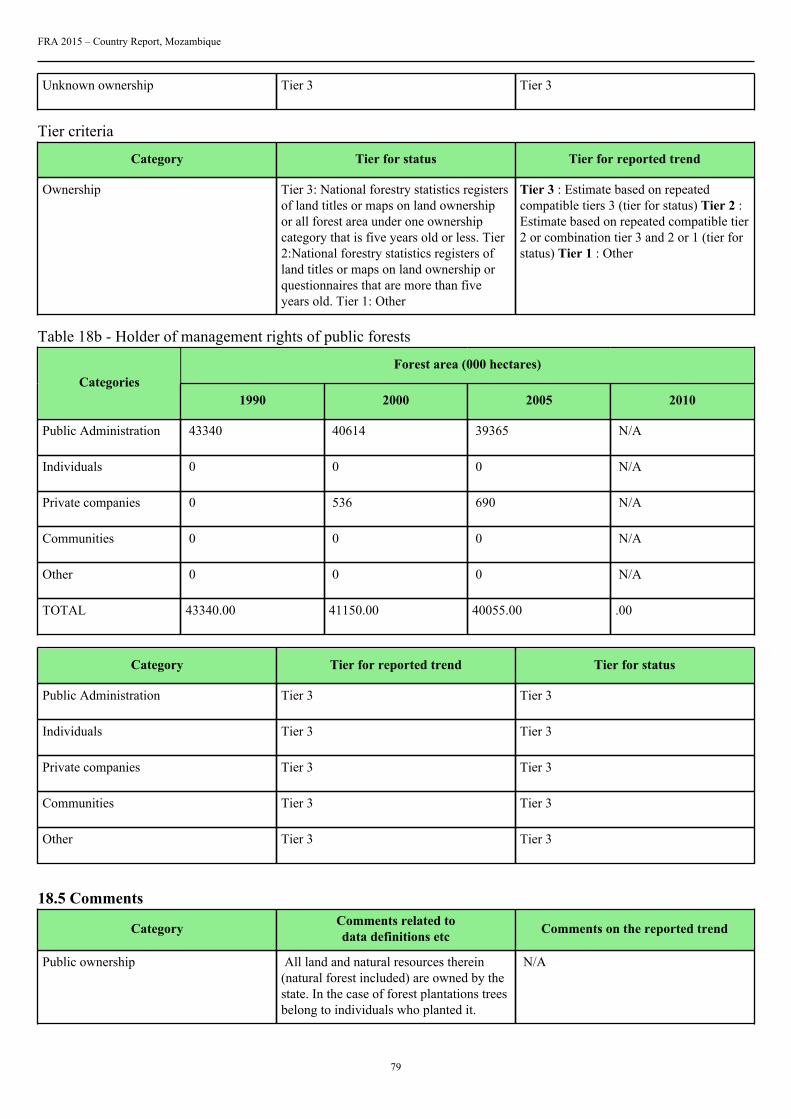
FRA 2015 – Country Report, Mozambique
79
Unknown ownership Tier 3 Tier 3
Tier criteria
Category Tier for status Tier for reported trend
Ownership Tier 3: National forestry statistics registersof land titles or maps on land ownershipor all forest area under one ownershipcategory that is five years old or less. Tier2:National forestry statistics registers ofland titles or maps on land ownership orquestionnaires that are more than fiveyears old. Tier 1: Other
Tier 3 : Estimate based on repeatedcompatible tiers 3 (tier for status) Tier 2 :Estimate based on repeated compatible tier2 or combination tier 3 and 2 or 1 (tier forstatus) Tier 1 : Other
Table 18b - Holder of management rights of public forests
Forest area (000 hectares)Categories
1990 2000 2005 2010
Public Administration 43340 40614 39365 N/A
Individuals 0 0 0 N/A
Private companies 0 536 690 N/A
Communities 0 0 0 N/A
Other 0 0 0 N/A
TOTAL 43340.00 41150.00 40055.00 .00
Category Tier for reported trend Tier for status
Public Administration Tier 3 Tier 3
Individuals Tier 3 Tier 3
Private companies Tier 3 Tier 3
Communities Tier 3 Tier 3
Other Tier 3 Tier 3
18.5 Comments
Category Comments related todata definitions etc Comments on the reported trend
Public ownership All land and natural resources therein(natural forest included) are owned by thestate. In the case of forest plantations treesbelong to individuals who planted it.
N/A
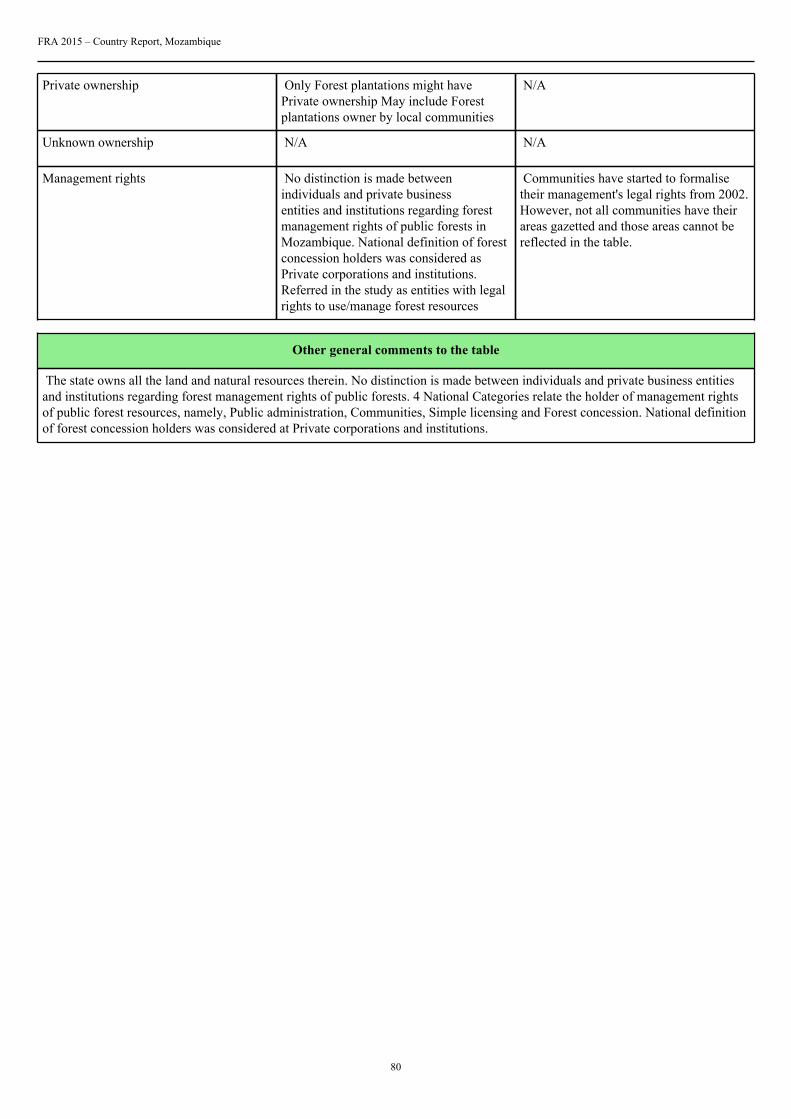
FRA 2015 – Country Report, Mozambique
80
Private ownership Only Forest plantations might havePrivate ownership May include Forestplantations owner by local communities
N/A
Unknown ownership N/A N/A
Management rights No distinction is made betweenindividuals and private businessentities and institutions regarding forestmanagement rights of public forests inMozambique. National definition of forestconcession holders was considered asPrivate corporations and institutions.Referred in the study as entities with legalrights to use/manage forest resources
Communities have started to formalisetheir management's legal rights from 2002.However, not all communities have theirareas gazetted and those areas cannot bereflected in the table.
Other general comments to the table
The state owns all the land and natural resources therein. No distinction is made between individuals and private business entitiesand institutions regarding forest management rights of public forests. 4 National Categories relate the holder of management rightsof public forest resources, namely, Public administration, Communities, Simple licensing and Forest concession. National definitionof forest concession holders was considered at Private corporations and institutions.
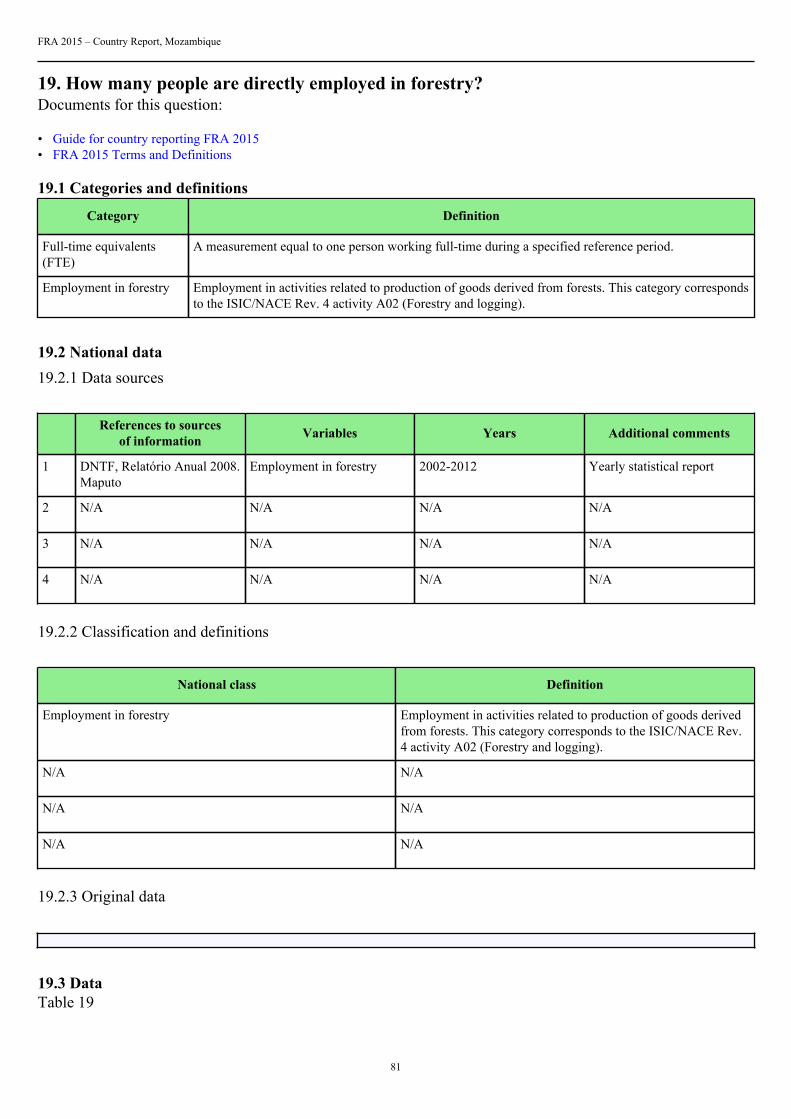
FRA 2015 – Country Report, Mozambique
81
19. How many people are directly employed in forestry?Documents for this question:
• Guide for country reporting FRA 2015• FRA 2015 Terms and Definitions
19.1 Categories and definitions
Category Definition
Full-time equivalents(FTE)
A measurement equal to one person working full-time during a specified reference period.
Employment in forestry Employment in activities related to production of goods derived from forests. This category correspondsto the ISIC/NACE Rev. 4 activity A02 (Forestry and logging).
19.2 National data19.2.1 Data sources
References to sourcesof information Variables Years Additional comments
1 DNTF, Relatório Anual 2008.Maputo
Employment in forestry 2002-2012 Yearly statistical report
2 N/A N/A N/A N/A
3 N/A N/A N/A N/A
4 N/A N/A N/A N/A
19.2.2 Classification and definitions
National class Definition
Employment in forestry Employment in activities related to production of goods derivedfrom forests. This category corresponds to the ISIC/NACE Rev.4 activity A02 (Forestry and logging).
N/A N/A
N/A N/A
N/A N/A
19.2.3 Original data
19.3 DataTable 19
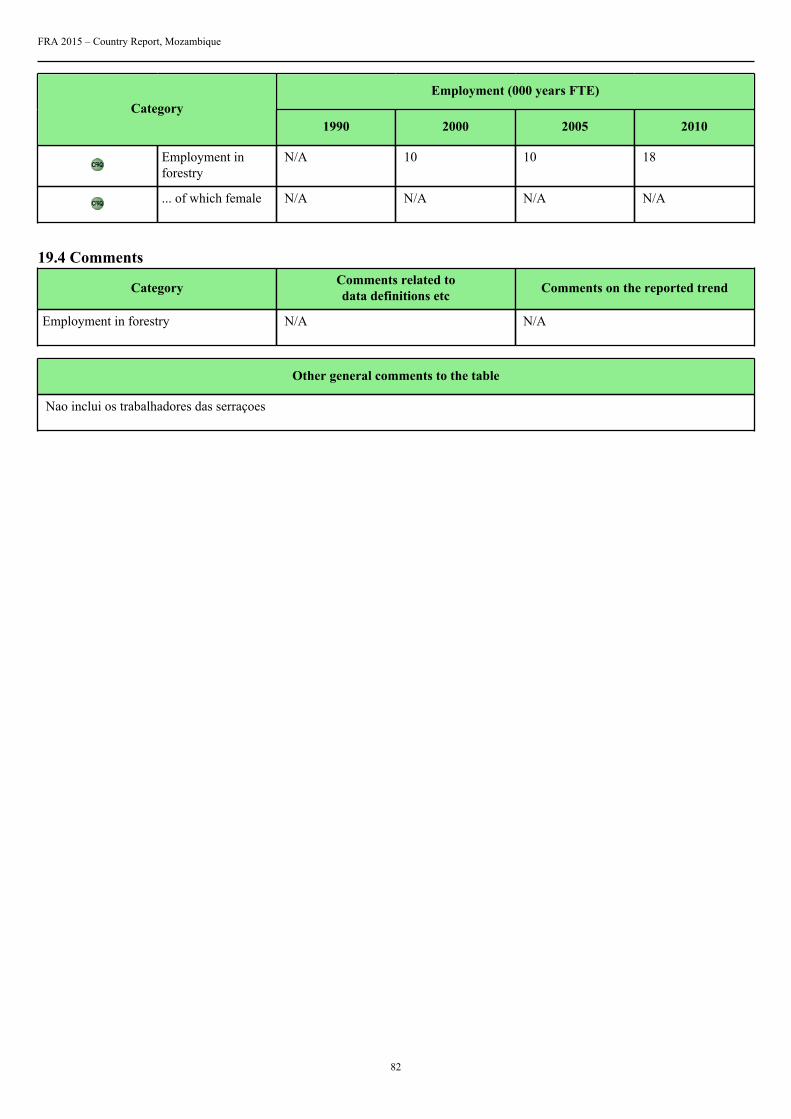
FRA 2015 – Country Report, Mozambique
82
Employment (000 years FTE)Category
1990 2000 2005 2010
Employment inforestry
N/A 10 10 18
... of which female N/A N/A N/A N/A
19.4 Comments
Category Comments related todata definitions etc Comments on the reported trend
Employment in forestry N/A N/A
Other general comments to the table
Nao inclui os trabalhadores das serraçoes
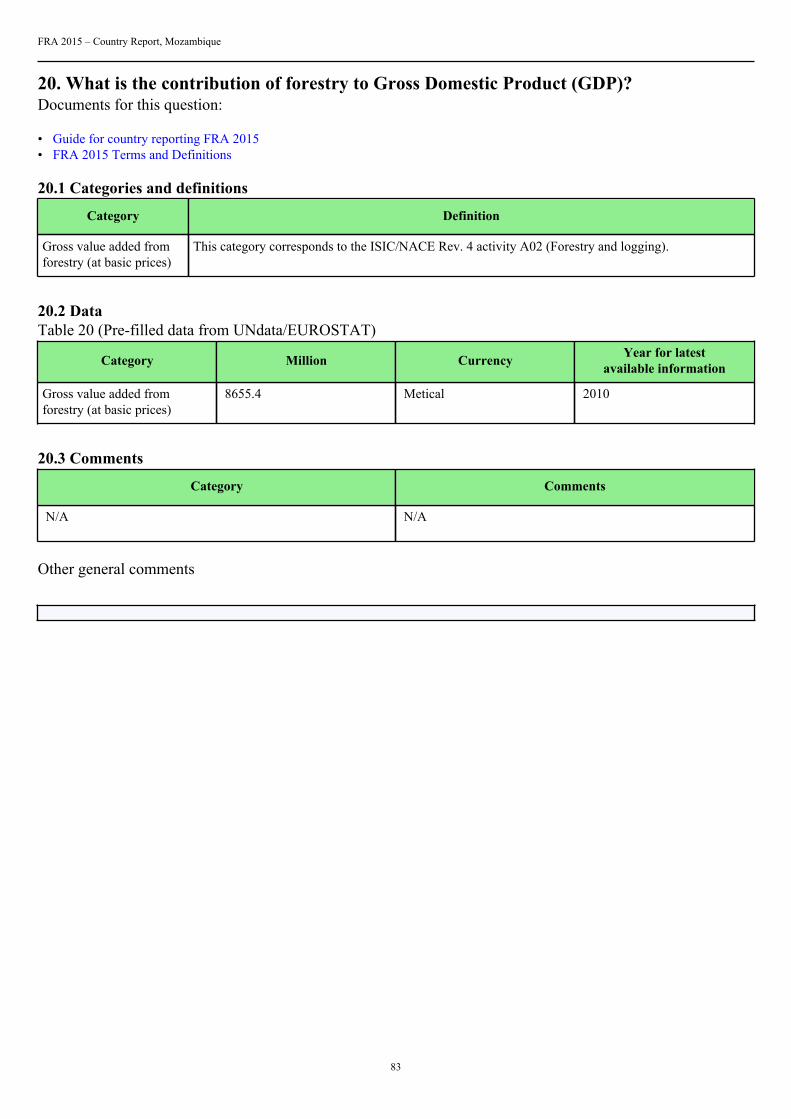
FRA 2015 – Country Report, Mozambique
83
20. What is the contribution of forestry to Gross Domestic Product (GDP)?Documents for this question:
• Guide for country reporting FRA 2015• FRA 2015 Terms and Definitions
20.1 Categories and definitions
Category Definition
Gross value added fromforestry (at basic prices)
This category corresponds to the ISIC/NACE Rev. 4 activity A02 (Forestry and logging).
20.2 DataTable 20 (Pre-filled data from UNdata/EUROSTAT)
Category Million Currency Year for latestavailable information
Gross value added fromforestry (at basic prices)
8655.4 Metical 2010
20.3 Comments
Category Comments
N/A N/A
Other general comments
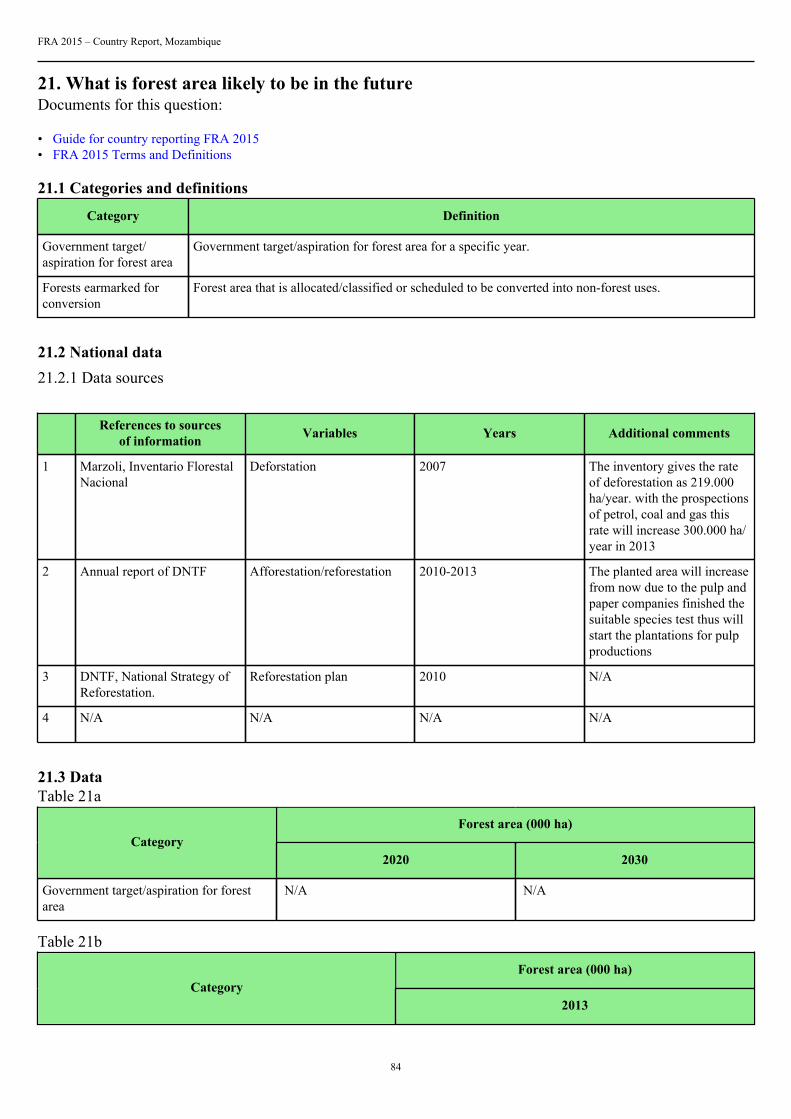
FRA 2015 – Country Report, Mozambique
84
21. What is forest area likely to be in the futureDocuments for this question:
• Guide for country reporting FRA 2015• FRA 2015 Terms and Definitions
21.1 Categories and definitions
Category Definition
Government target/aspiration for forest area
Government target/aspiration for forest area for a specific year.
Forests earmarked forconversion
Forest area that is allocated/classified or scheduled to be converted into non-forest uses.
21.2 National data21.2.1 Data sources
References to sourcesof information Variables Years Additional comments
1 Marzoli, Inventario FlorestalNacional
Deforstation 2007 The inventory gives the rateof deforestation as 219.000ha/year. with the prospectionsof petrol, coal and gas thisrate will increase 300.000 ha/year in 2013
2 Annual report of DNTF Afforestation/reforestation 2010-2013 The planted area will increasefrom now due to the pulp andpaper companies finished thesuitable species test thus willstart the plantations for pulpproductions
3 DNTF, National Strategy ofReforestation.
Reforestation plan 2010 N/A
4 N/A N/A N/A N/A
21.3 DataTable 21a
Forest area (000 ha)Category
2020 2030
Government target/aspiration for forestarea
N/A N/A
Table 21b
Forest area (000 ha)Category
2013
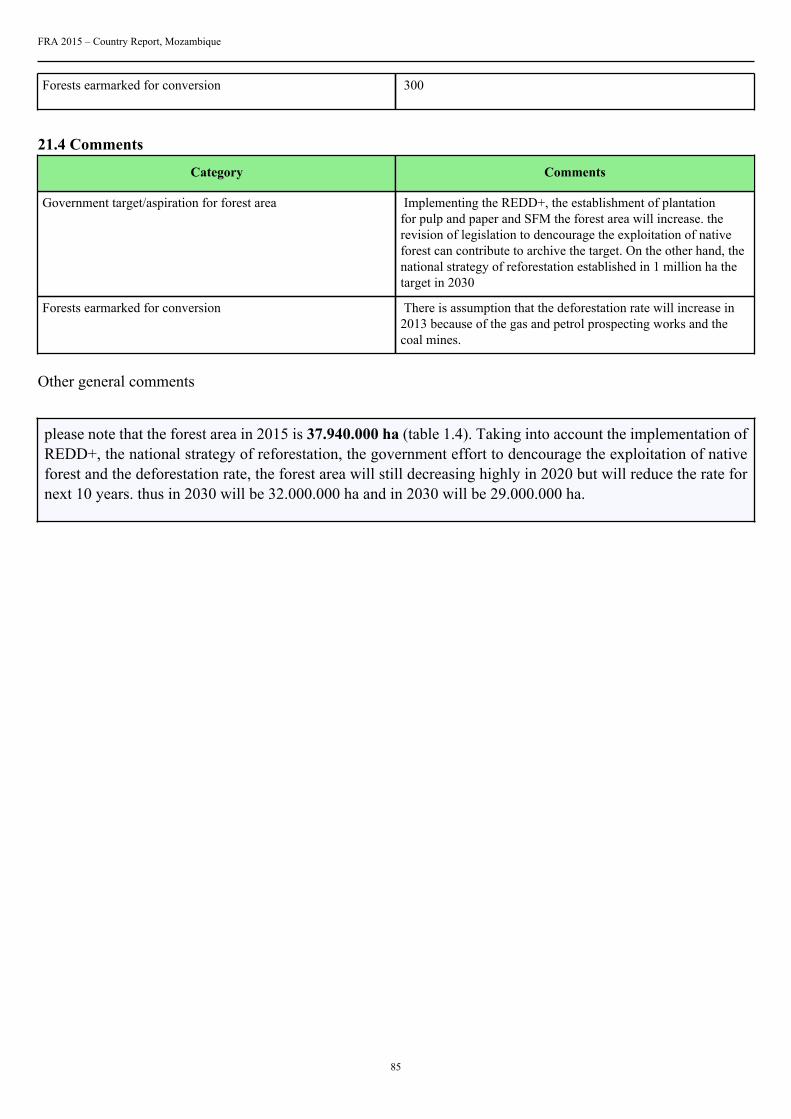
FRA 2015 – Country Report, Mozambique
85
Forests earmarked for conversion 300
21.4 Comments
Category Comments
Government target/aspiration for forest area Implementing the REDD+, the establishment of plantationfor pulp and paper and SFM the forest area will increase. therevision of legislation to dencourage the exploitation of nativeforest can contribute to archive the target. On the other hand, thenational strategy of reforestation established in 1 million ha thetarget in 2030
Forests earmarked for conversion There is assumption that the deforestation rate will increase in2013 because of the gas and petrol prospecting works and thecoal mines.
Other general comments
please note that the forest area in 2015 is 37.940.000 ha (table 1.4). Taking into account the implementation ofREDD+, the national strategy of reforestation, the government effort to dencourage the exploitation of nativeforest and the deforestation rate, the forest area will still decreasing highly in 2020 but will reduce the rate fornext 10 years. thus in 2030 will be 32.000.000 ha and in 2030 will be 29.000.000 ha.