Embed Size (px)
Citation preview

Using Attendance DataUsing Attendance DataStrategies for Analysis, Strategies for Analysis,
Interpretation and School Interpretation and School ImprovementImprovement
Connecticut Consortium on School AttendanceConnecticut Consortium on School Attendance
Gary HoachlanderGary HoachlanderKelly OuelletteKelly Ouellette
April 2005April 2005

MPR Associates2
CLOSING THEACHIEVEMENT
GAP
Albert Einstein said…
“Not everything that counts
can be counted and not
everything that can be
counted counts.”
Using data well depends on knowingthe difference
MPR Associates3
CLOSING THEACHIEVEMENT
GAP
Overview
Consortium data collection and reporting
Some simple analysis strategies
Beyond first impressions— extending your investigation and avoiding misinterpretation
Benchmarking and goal setting
Strategies to improve attendance
MPR Associates4
CLOSING THEACHIEVEMENT
GAP
What Do You Want to Know?
Overall attendance rate
By type of school
By demographic sub-groups
Demographics within levels of school
By grade level
By month
By day of the week
Other
MPR Associates5
CLOSING THEACHIEVEMENT
GAP
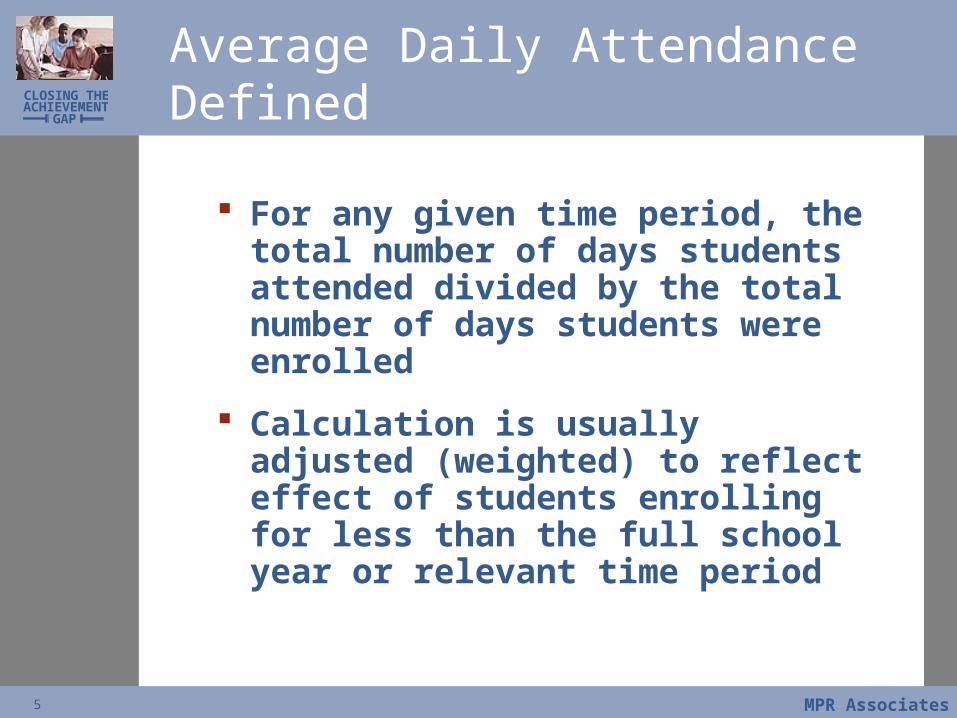
Average Daily Attendance Defined
For any given time period, the total number of days students attended divided by the total number of days students were enrolled
Calculation is usually adjusted (weighted) to reflect effect of students enrolling for less than the full school year or relevant time period
MPR Associates6
CLOSING THEACHIEVEMENT
GAP
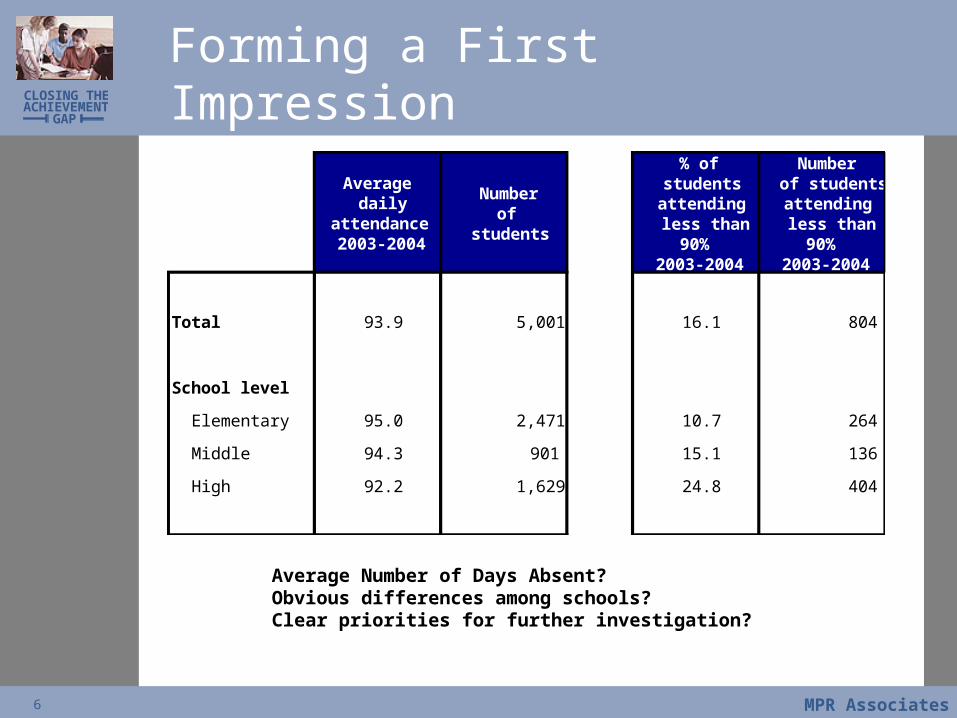
Forming a First Impression
Average daily
attendance 2003-2004
Numberof
students
% of students attending less than
90% 2003-2004
Number of students attending less than
90% 2003-2004
Total 93.9 5,001 16.1 804
School level
Elementary 95.0 2,471 10.7 264
Middle 94.3 901 15.1 136
High 92.2 1,629 24.8 404
Average Number of Days Absent?Obvious differences among schools?Clear priorities for further investigation?
MPR Associates7
CLOSING THEACHIEVEMENT
GAP
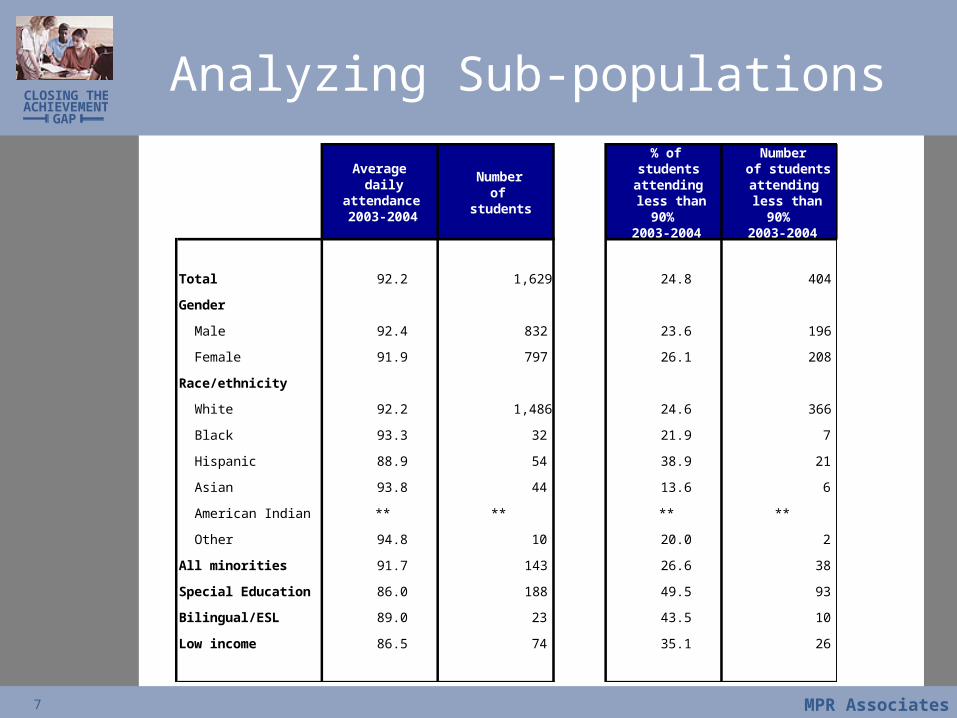
Analyzing Sub-populations
Average daily
attendance 2003-2004
Numberof
students
% of students attending less than
90% 2003-2004
Number of students attending less than
90% 2003-2004
Total 92.2 1,629 24.8 404
Gender
Male 92.4 832 23.6 196
Female 91.9 797 26.1 208
Race/ethnicity
White 92.2 1,486 24.6 366
Black 93.3 32 21.9 7
Hispanic 88.9 54 38.9 21
Asian 93.8 44 13.6 6
American Indian ** ** ** **
Other 94.8 10 20.0 2
All minorities 91.7 143 26.6 38
Special Education 86.0 188 49.5 93
Bilingual/ESL 89.0 23 43.5 10
Low income 86.5 74 35.1 26
MPR Associates8
CLOSING THEACHIEVEMENT
GAP
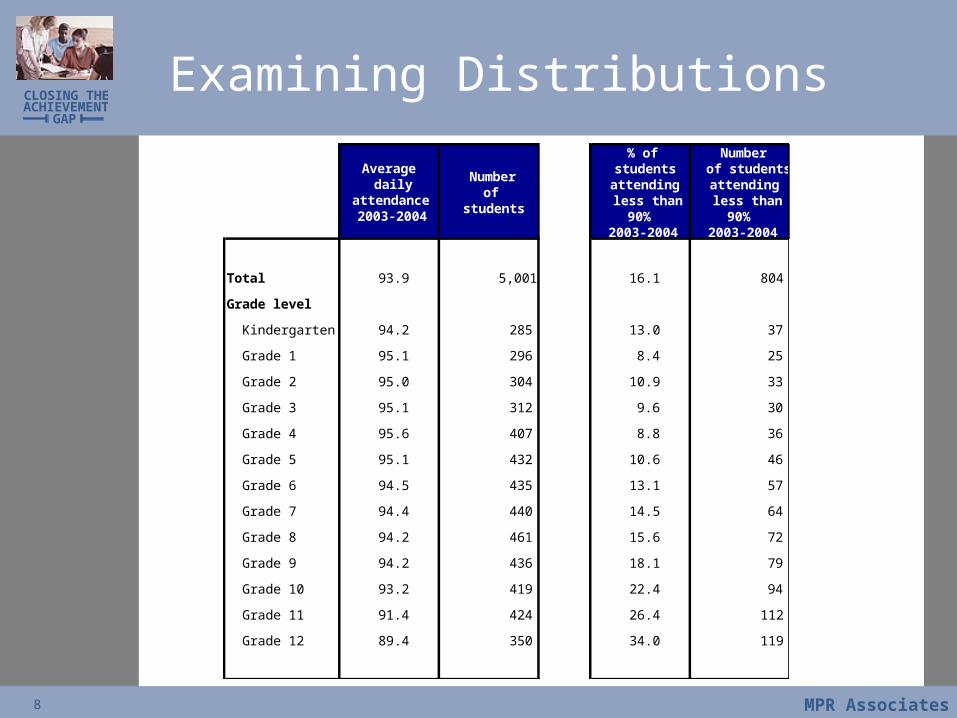
Examining Distributions
Average daily
attendance 2003-2004
Numberof
students
% of students attending less than
90% 2003-2004
Number of students attending less than
90% 2003-2004
Total 93.9 5,001 16.1 804
Grade level
Kindergarten 94.2 285 13.0 37
Grade 1 95.1 296 8.4 25
Grade 2 95.0 304 10.9 33
Grade 3 95.1 312 9.6 30
Grade 4 95.6 407 8.8 36
Grade 5 95.1 432 10.6 46
Grade 6 94.5 435 13.1 57
Grade 7 94.4 440 14.5 64
Grade 8 94.2 461 15.6 72
Grade 9 94.2 436 18.1 79
Grade 10 93.2 419 22.4 94
Grade 11 91.4 424 26.4 112
Grade 12 89.4 350 34.0 119

MPR Associates9
CLOSING THEACHIEVEMENT
GAP
Caveats
Small numbers
Artificial precision
Correlation versus causation
MPR Associates10
CLOSING THEACHIEVEMENT
GAP
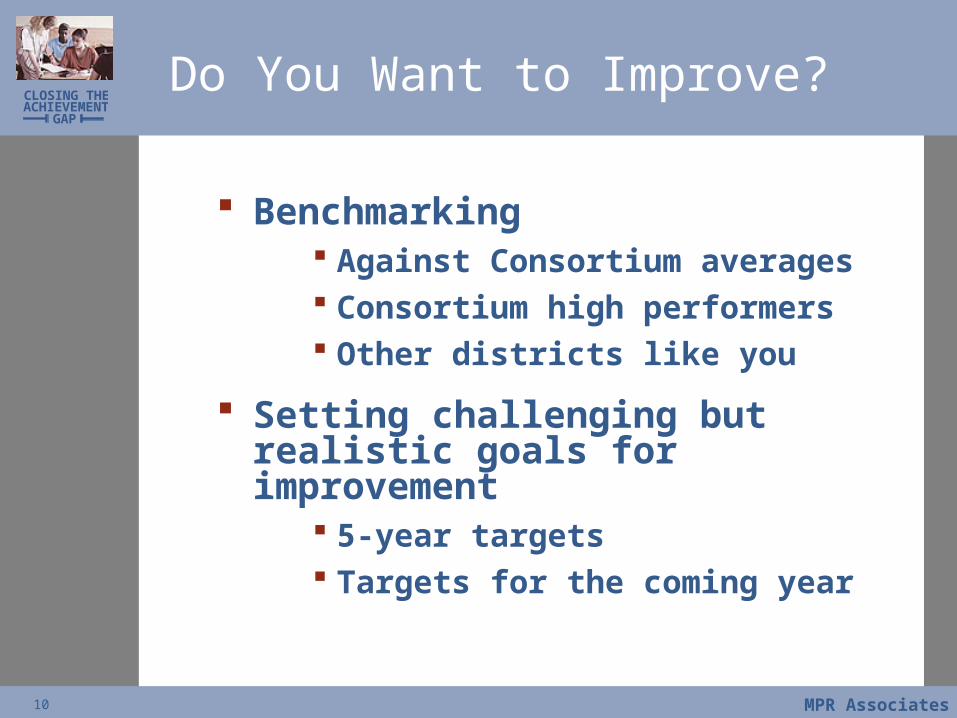
Do You Want to Improve?
Benchmarking Against Consortium
averages Consortium high performers Other districts like you
Setting challenging but realistic goals for improvement
5-year targets Targets for the coming year
MPR Associates11
CLOSING THEACHIEVEMENT
GAP
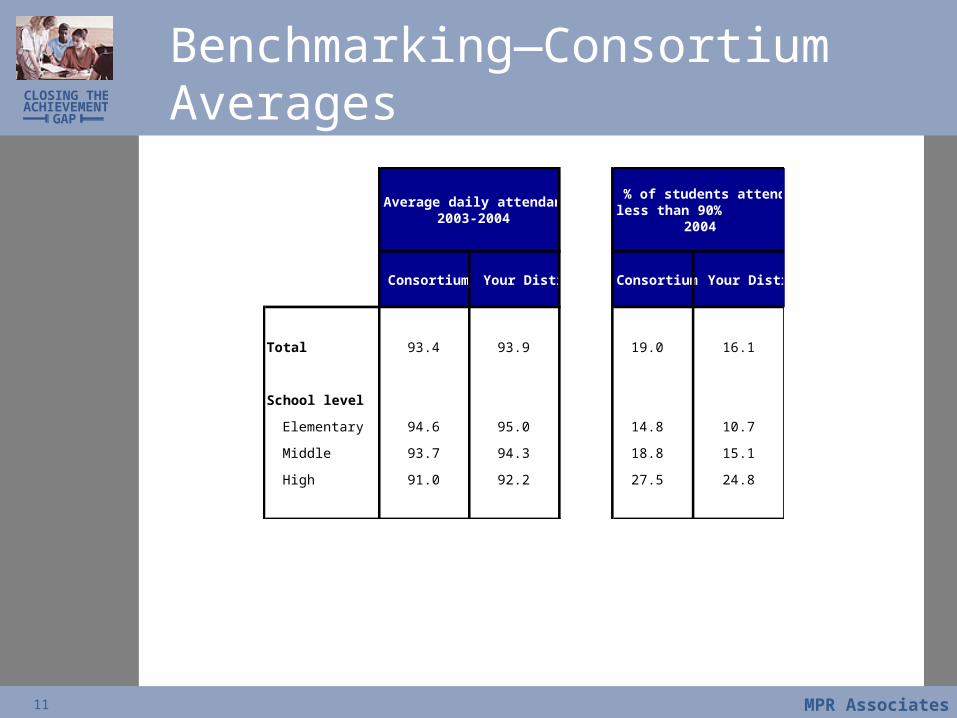
Benchmarking—Consortium Averages
Consortium Your District Consortium Your District
94.3 2,681
Total 93.4 93.9 19.0 16.1
School level
Elementary 94.6 95.0 14.8 10.7
Middle 93.7 94.3 18.8 15.1
High 91.0 92.2 27.5 24.8
Average daily attendance 2003-2004
% of students attending less than 90% 2003-
2004
MPR Associates12
CLOSING THEACHIEVEMENT
GAP
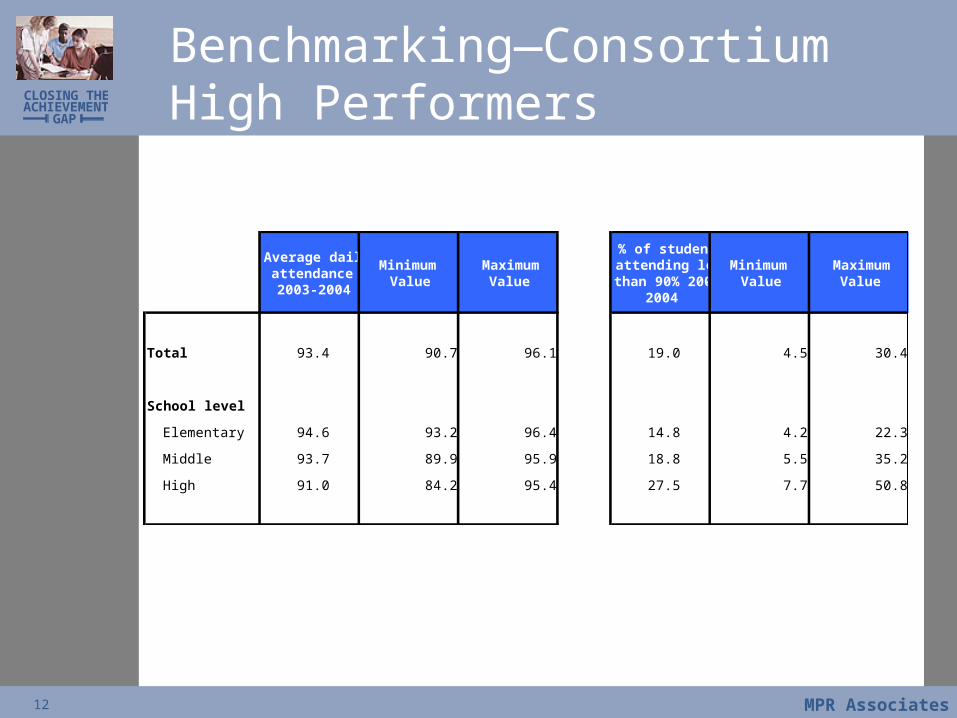
Benchmarking—Consortium High Performers
Average daily attendance 2003-2004
Minimum Value
Maximum Value
% of students attending less than 90% 2003-
2004
Minimum Value
Maximum Value
Total 93.4 90.7 96.1 19.0 4.5 30.4
School level
Elementary 94.6 93.2 96.4 14.8 4.2 22.3
Middle 93.7 89.9 95.9 18.8 5.5 35.2
High 91.0 84.2 95.4 27.5 7.7 50.8

MPR Associates13
CLOSING THEACHIEVEMENT
GAP
How Will You Reach Your Goals?
Linking attendance to specific strategies for improvement
Incentives Targeting particular schools,
grades, or populations of students
Programs Classroom Services Parents

MPR Associates14
CLOSING THEACHIEVEMENT
GAP
Some Simple Analytic Strategies
Develop a first impression—are the numbers credible; what do they seem to say?
Make the statistics concrete
Examine spread or distribution
Examine differences among subgroups
Assess relationship between performance and practice
Pose questions for further analysis
MPR Associates15
CLOSING THEACHIEVEMENT
GAP
Hold Yourselves Accountable: Set Performance Targets
Benchmark against
National and state norms
Other districts/schools like yours
Exemplary schools or districts
Set mid-range goals with incremental targets in between
Keep targets challenging but realistic
MPR Associates16
CLOSING THEACHIEVEMENT
GAP
Make Using Data a Routine
Schedule time for reflection and strategic planning
Make reporting visible and frequent
Encourage mid-course review and correction
Monitor progress, be honest about what is not working, and celebrate success!

MPR Associates17
CLOSING THEACHIEVEMENT
GAP
Strategies to Improve AttendanceSchools and School Districts Improve Attendance by:
Making Attendance a Priority
Establishing Effective Attendance Policies
Collecting and Monitoring Attendance Data
Using Data for Program Planning
Success Factors:
Leadership
Accountability
Good Data
Analysis Skills

MPR Associates18
CLOSING THEACHIEVEMENT
GAP
Make Attendance a Priority
Build awareness and commitment to regular school attendance
In school buildings: Communication, rewards, and consequences Attendance is “on the agenda” Accountability and recognition
In the home: Targeted communication Immediate and consistent follow-up Sensitivity to cultural and language
differences
In the community: Awareness-building Community involvement

MPR Associates19
CLOSING THEACHIEVEMENT
GAP
Establish Effective Policies
Ensure attendance policies are effective and consistently enforced
Commitment of administrative leaders
Absenteeism is a “red flag” issue
Consistent policy enforcement
Within school buildings
District-wide
Defined procedures and interventions
Faculty and staff involvement in policy development and implementation
Students and families are educated on policy changes and expectations
MPR Associates20
CLOSING THEACHIEVEMENT
GAP
Collect and Monitor Data
Ensure intervention occurs when students begin to exhibit patterns of poor attendance Standardized attendance data collection
Useable computer systems and analysis tools
Staff training and support
Teacher involvement in attendance monitoring and intervention
Attendance teams at the district and school building levels
Planned opportunities for data analysis and strategy development

MPR Associates21
CLOSING THEACHIEVEMENT
GAP
Use Data for Program PlanningAttendance improvement strategies are based on analysis of attendance data Quantitative data is a starting point
Qualitative analysis: “What is really going on?”
Intervene on a student-by-student basis
Focus on issue-specific programs
Transitions, levels of schooling
Establish attendance habits early (Kindergarten)
Create incentives that students care about
Address attendance in terms of school climate
Kids go to school when they want to be there