Embed Size (px)
Citation preview
MPR February100210

Figure 1.1. Repo ratePer cent, quarterly averages
-1
0
1
2
3
4
5
6
7
04 05 06 07 08 09 10 11 12 13
-1
0
1
2
3
4
5
6
790%75%50%OutcomeForecast
Source: The Riksbank
Note. The uncertainty band does not take into account the fact that there may be a lower bound for the repo rate. The uncertainty band shows the band within which the repo rate is expected to be with a 50%, 75% and 90% probability. Broken lines represent the Riksbank’s forecast.

Figure 1.2. GDP with uncertainty bandsAnnual percentage change, seasonally-adjusted data
-8
-6
-4
-2
0
2
4
6
04 05 06 07 08 09 10 11 12 13
-8
-6
-4
-2
0
2
4
6
90%
75%
50%
Otcome
Forecast
Sources: Statistics Sweden and the Riksbank
Note.The uncertainty band shows the band within which GDP growth is expected to be with a 50%, 75% and 90% probability. Broken lines represent the Riksbank’s forecast.
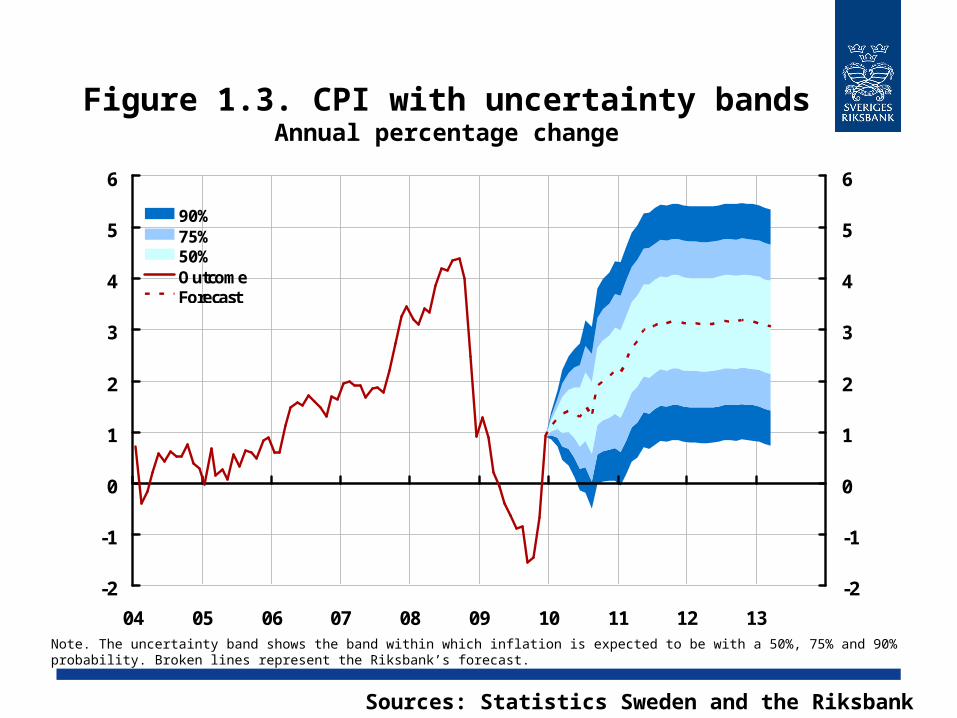
Figure 1.3. CPI with uncertainty bandsAnnual percentage change
-2
-1
0
1
2
3
4
5
6
04 05 06 07 08 09 10 11 12 13
-2
-1
0
1
2
3
4
5
6
90%75%50%OutcomeForecast
Sources: Statistics Sweden and the Riksbank
Note. The uncertainty band shows the band within which inflation is expected to be with a 50%, 75% and 90% probability. Broken lines represent the Riksbank’s forecast.
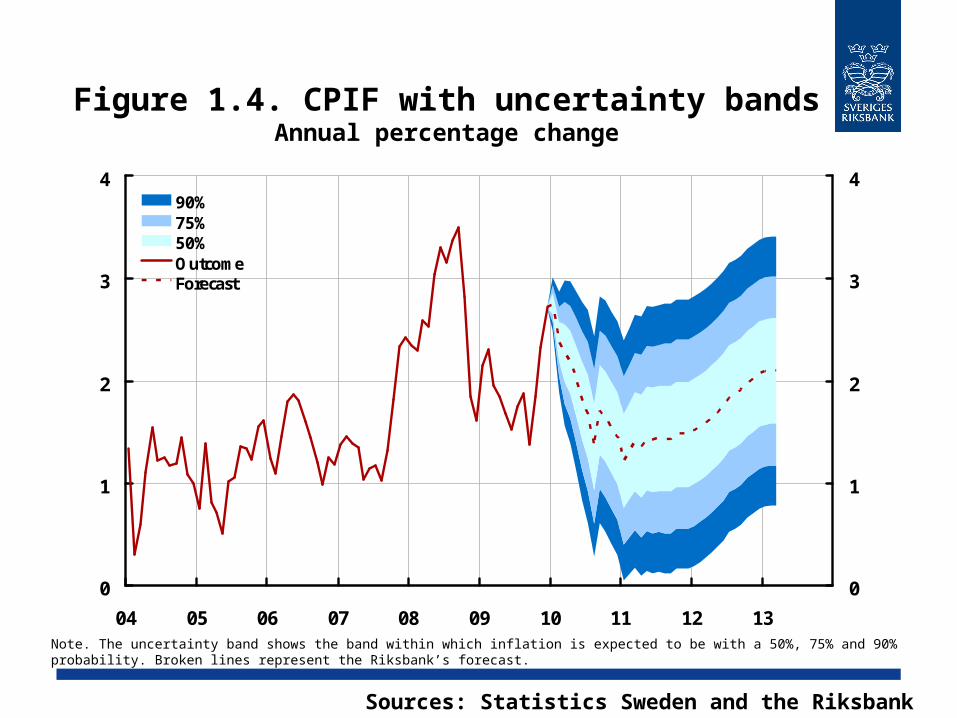
Figure 1.4. CPIF with uncertainty bandsAnnual percentage change
0
1
2
3
4
04 05 06 07 08 09 10 11 12 13
0
1
2
3
490%75%50%OutcomeForecast
Sources: Statistics Sweden and the Riksbank
Note. The uncertainty band shows the band within which inflation is expected to be with a 50%, 75% and 90% probability. Broken lines represent the Riksbank’s forecast.
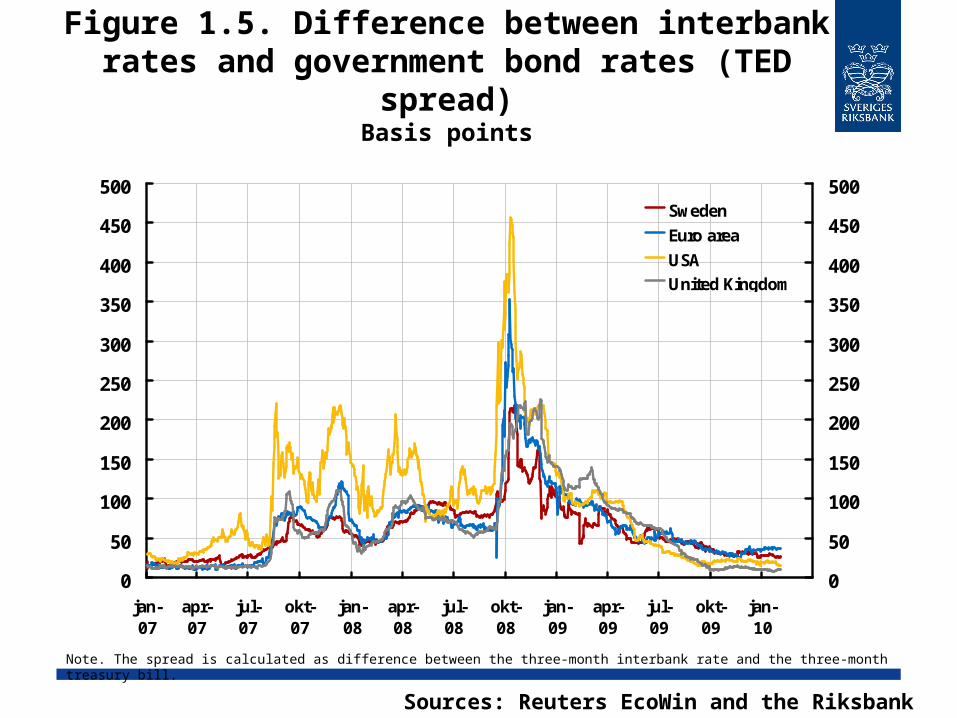
Figure 1.5. Difference between interbank rates and government bond rates (TED
spread)Basis points
0
50
100
150
200
250
300
350
400
450
500
jan-07
apr-07
jul-07
okt-07
jan-08
apr-08
jul-08
okt-08
jan-09
apr-09
jul-09
okt-09
jan-10
0
50
100
150
200
250
300
350
400
450
500Sweden
Euro area
USAUnited Kingdom
Sources: Reuters EcoWin and the Riksbank
Note. The spread is calculated as difference between the three-month interbank rate and the three-month treasury bill.

Figure 1.6. GDP-growth abroadAnnual percentage change
-1
0
1
2
3
4
5
6
7
70 75 80 85 90 95 00 05 10
-1
0
1
2
3
4
5
6
7
Sources: IMF and the RiksbankNote. Striped bars represent the Riksbank’s forecast.
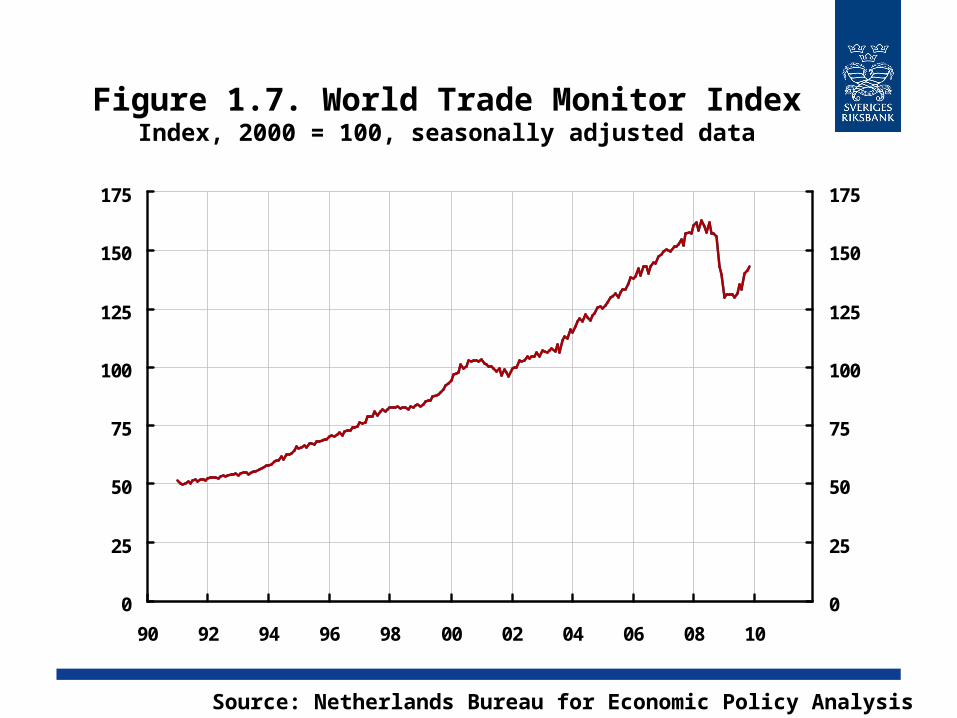
Figure 1.7. World Trade Monitor IndexIndex, 2000 = 100, seasonally adjusted data
0
25
50
75
100
125
150
175
90 92 94 96 98 00 02 04 06 08 10
0
25
50
75
100
125
150
175
Source: Netherlands Bureau for Economic Policy Analysis

Figure 1.8. Oil price, Brent crudeUSD per barrel
0
20
40
60
80
100
120
140
00 01 02 03 04 05 06 07 08 09 10 11 12 13
0
20
40
60
80
100
120
140Outcome
Futures, average up to and including 4 February
Futures, December
Sources: Intercontinental Exchange and the RiksbankNote. Futures are calculated as a 15-day average. Outcomes represent monthly averages of spot prices.
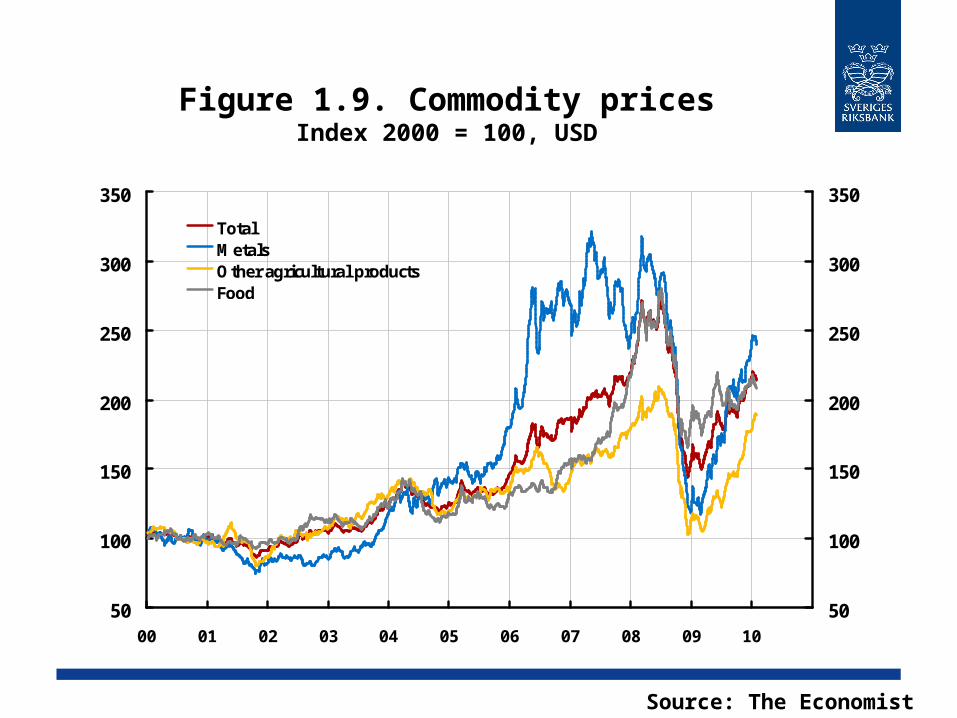
Figure 1.9. Commodity pricesIndex 2000 = 100, USD
50
100
150
200
250
300
350
00 01 02 03 04 05 06 07 08 09 10
50
100
150
200
250
300
350
TotalMetalsOther agricultural productsFood
Source: The Economist

Figure 1.10. Development for GDP in different regions and countries
Quarterly changes in per cent calculated in annualised terms, seasonally-adjusted data
-20
-15
-10
-5
0
5
10
00 01 02 03 04 05 06 07 08 09 10 11 12 13
-20
-15
-10
-5
0
5
10
Sweden
Euro area
USA
Sources: Bureau of Economic Analysis, Eurostat, Statistics Sweden and the RiksbankNote. Broken lines represent the Riksbank’s forecast.

Figure 1.11. Public sector net lendingPercentage of GDP
-20
-15
-10
-5
0
5
10
15
20
Swed
en
Euro ar
eaUS
A
Unite
d King
dom
Germ
any
Fran
ceSp
ain
Norw
ay
Icelan
d
Gree
ce
200720092011
Sources: OECD and the RiksbankNote. Striped bars represent forecasts. The forecast for Sweden is the Riksbank's forecast, while for other countries it is the OECD's forecast, December 2009.

Figure 1.12. Comparison of recovery in Sweden, the euro area and USA
GDP-level, index 2007 quarter 4 = 100
Sources: Bureau of Economic Analysis, Eurostat, Statistics Sweden and the Riksbank.
Note. The quarter prior to the recession breaking out in the USA = 100. Broken lines represent the Riksbank's forecast.
94
96
98
100
102
104
106
108
110
07 08 09 10 11 12 13
94
96
98
100
102
104
106
108
110USA
Euro area
Sweden

Figure 1.13. TCW-weighted exchange rate Index, 18.11.92 = 100
Source: The RiksbankNote. Outcome data are daily rates and forecasts are quarterly averages. Broken lines represent the Riksbank’s forecast.
120
125
130
135
140
145
150
155
160
04 05 06 07 08 09 10 11 12 13
120
125
130
135
140
145
150
155
160
February
December
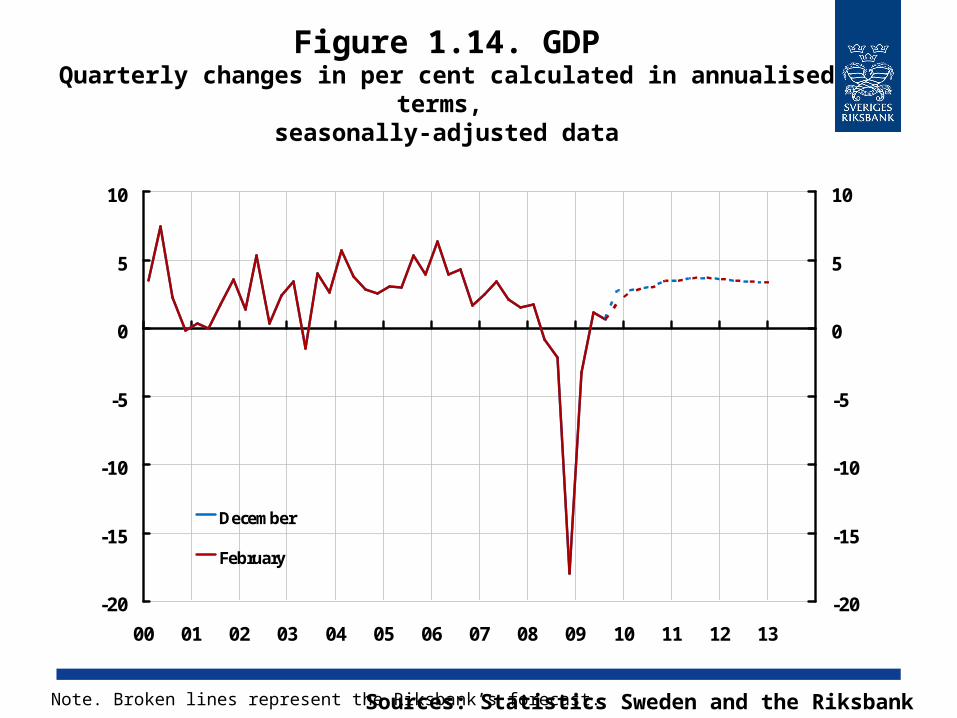
Figure 1.14. GDPQuarterly changes in per cent calculated in annualised
terms, seasonally-adjusted data
-20
-15
-10
-5
0
5
10
00 01 02 03 04 05 06 07 08 09 10 11 12 13
-20
-15
-10
-5
0
5
10
December
February
Sources: Statistics Sweden and the RiksbankNote. Broken lines represent the Riksbank’s forecast.

Figure 1.15. Comparison of recovery following various recessions, GDP Sweden
Index in the quarter preceding the beginning of the recession = 100
92
94
96
98
100
102
104
106
108
110
112
114
116
118
-4 -2 0 2 4 6 8 10 12 14 16 18
92
94
96
98
100
102
104
106
108
110
112
114
116
1181990 Q2
1996 Q1
2000 Q3
2008 Q1
Sources: Statistics Sweden and the Riksbank
Note. Legends denote the quarter in which the index = 100. Broken lines represent the Riksbanks forecast. X-axis relates to quarters.

Figure 1.16. Households’ consumption, disposable incomes
and saving ratio Annual percentage change, fixed prices and percentage of
disposable income
-2
-1
0
1
2
3
4
5
6
7
8
94 95 96 97 98 99 00 01 02 03 04 05 06 07 08 09 10 11 12
-4
-2
0
2
4
6
8
10
12
14
16
Consumption (left scale)Disposable income (left scale)Saving ratio (right scale)
Sources: Statistics Sweden and the RiksbankNote. Broken lines and striped bars represent the Riksbank’s forecast.
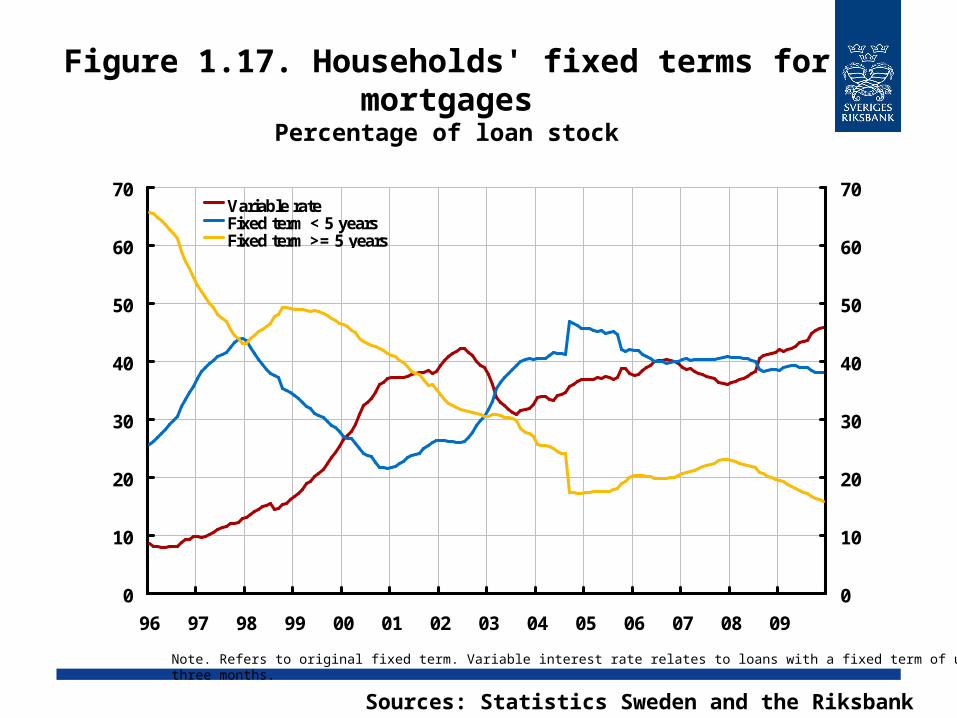
Figure 1.17. Households' fixed terms for mortgages
Percentage of loan stock
Sources: Statistics Sweden and the Riksbank
Note. Refers to original fixed term. Variable interest rate relates to loans with a fixed term of up to three months.
0
10
20
30
40
50
60
70
96 97 98 99 00 01 02 03 04 05 06 07 08 09
0
10
20
30
40
50
60
70Variable rateFixed term < 5 yearsFixed term >= 5 years
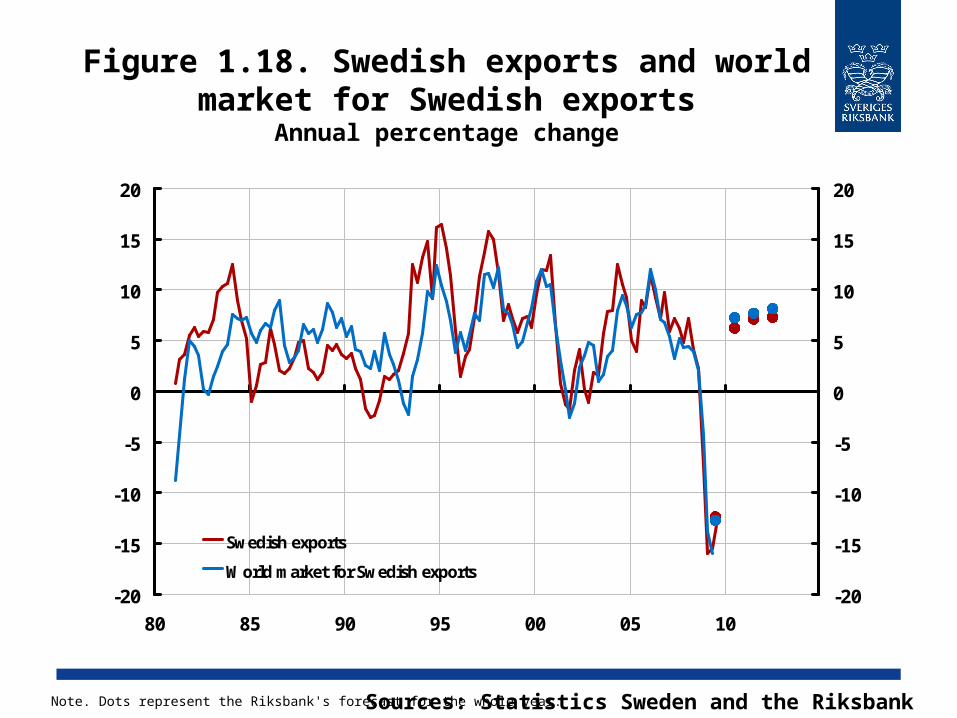
Figure 1.18. Swedish exports and world market for Swedish exports
Annual percentage change
Sources: Statistics Sweden and the RiksbankNote. Dots represent the Riksbank's forecast for the whole year.
-20
-15
-10
-5
0
5
10
15
20
80 85 90 95 00 05 10
-20
-15
-10
-5
0
5
10
15
20
Swedish exports
World market for Swedish exports

Figure 1.19. Gross fixed capital formationQuarterly changes in per cent calculated in annualised
terms, seasonally-adjusted data
-50
-40
-30
-20
-10
0
10
20
04 05 06 07 08 09 10 11 12 13
-50
-40
-30
-20
-10
0
10
20
December
February
Sources: Statistics Sweden and the Riksbank Note. Seasonally adjusted by the Riksbank. Broken lines represent the Riksbank’s forecast.
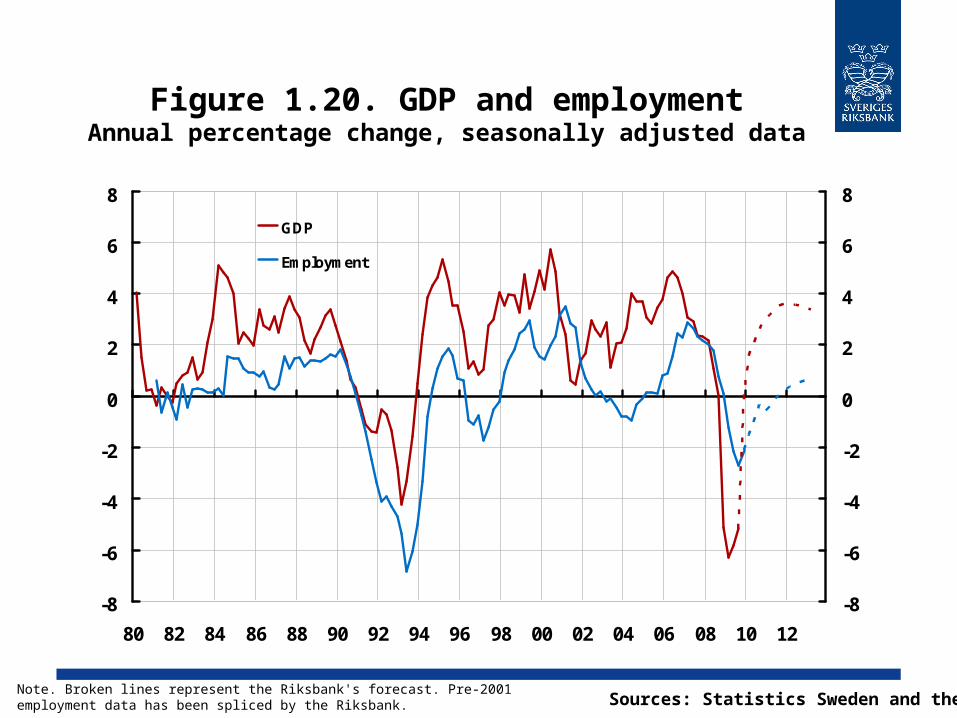
Figure 1.20. GDP and employmentAnnual percentage change, seasonally adjusted data
-8
-6
-4
-2
0
2
4
6
8
80 82 84 86 88 90 92 94 96 98 00 02 04 06 08 10 12
-8
-6
-4
-2
0
2
4
6
8
GDP
Employment
Note. Broken lines represent the Riksbank's forecast. Pre-2001 employment data has been spliced by the Riksbank. Sources: Statistics Sweden and the Riksbank

Figure 1.21. Labour force and number of employed
Thousands, seasonally-adjusted data
3800
4000
4200
4400
4600
4800
5000
80 85 90 95 00 05 10
3800
4000
4200
4400
4600
4800
5000Employed, 16-64 years
Employed, 15-74 years
Labour force, 16-64 years
Labour force, 15-74 years
Sources: Statistics Sweden and the Riksbank
Note. Pre-1993 data has been spliced by the Riksbank. Broken lines represent the Riksbank’s forecast, 15-74 year.
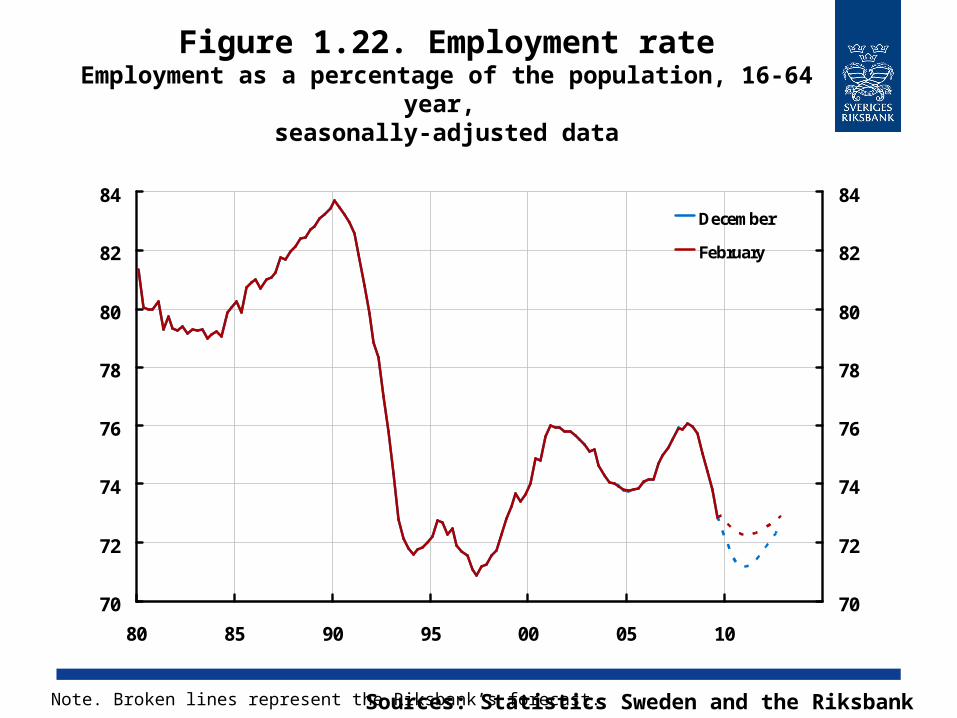
Figure 1.22. Employment rateEmployment as a percentage of the population, 16-64
year, seasonally-adjusted data
70
72
74
76
78
80
82
84
80 85 90 95 00 05 10
70
72
74
76
78
80
82
84December
February
Sources: Statistics Sweden and the RiksbankNote. Broken lines represent the Riksbank’s forecast.

Figure 1.23. UnemploymentPercentage of the labour force, seasonally-adjusted data
0
2
4
6
8
10
12
14
80 85 90 95 00 05 10
0
2
4
6
8
10
12
14
Unemployment, 16-64 years
Unemployment, 15-74 years
February
December
Sources: Statistics Sweden and the Riksbank
Note. Pre-1993 data has been spliced by the Riksbank. Broken lines represent the Riksbank’s forecast, 15-74 years.
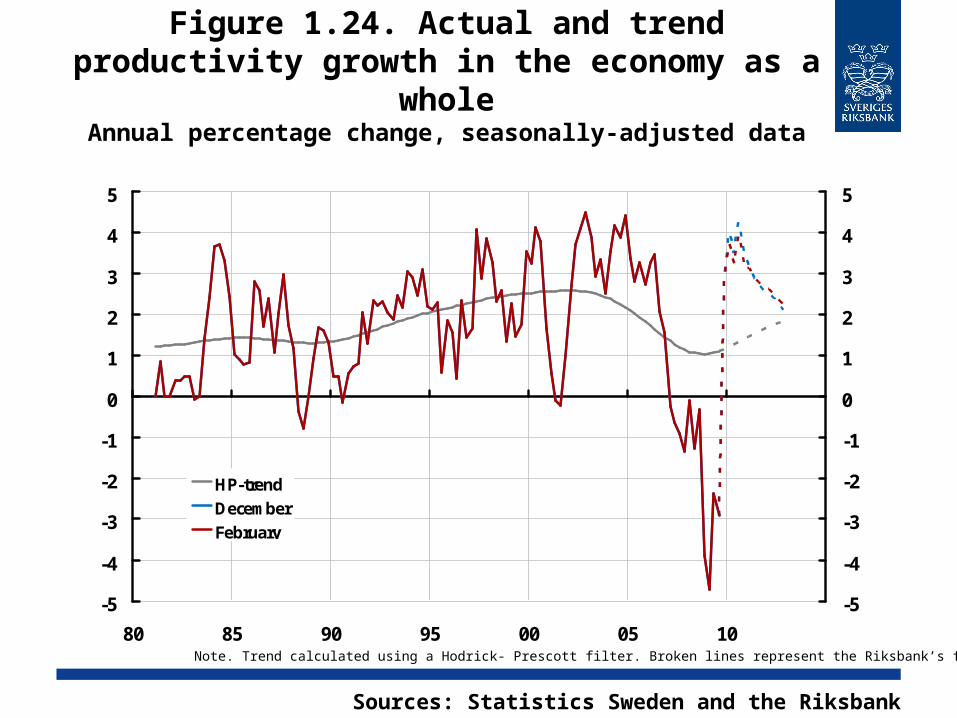
Figure 1.24. Actual and trend productivity growth in the economy as a whole
Annual percentage change, seasonally-adjusted data
-5
-4
-3
-2
-1
0
1
2
3
4
5
80 85 90 95 00 05 10
-5
-4
-3
-2
-1
0
1
2
3
4
5
HP-trendDecemberFebruary
Sources: Statistics Sweden and the Riksbank
Note. Trend calculated using a Hodrick- Prescott filter. Broken lines represent the Riksbank’s forecast.
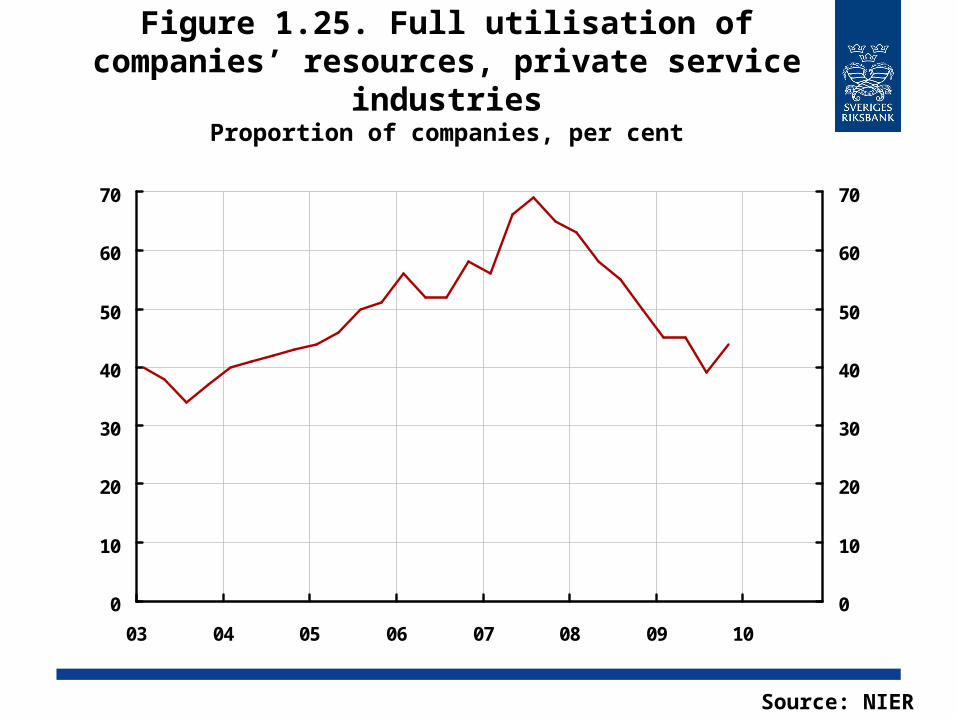
Figure 1.25. Full utilisation of companies’ resources, private service industries
Proportion of companies, per cent
0
10
20
30
40
50
60
70
03 04 05 06 07 08 09 10
0
10
20
30
40
50
60
70
Source: NIER
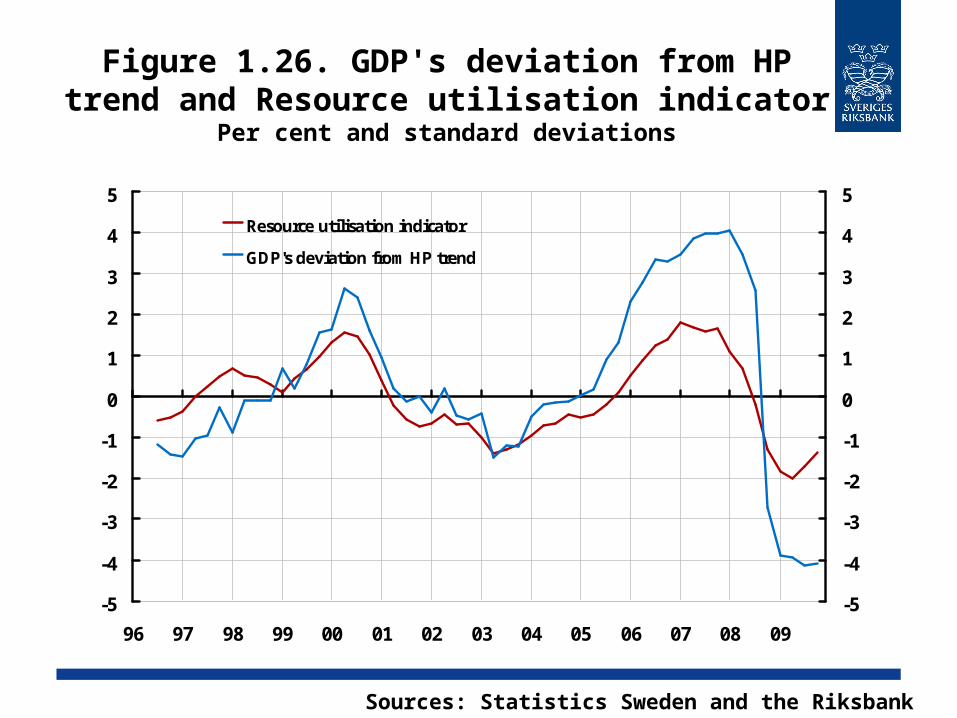
Figure 1.26. GDP's deviation from HP trend and Resource utilisation indicator
Per cent and standard deviations
-5
-4
-3
-2
-1
0
1
2
3
4
5
96 97 98 99 00 01 02 03 04 05 06 07 08 09
-5
-4
-3
-2
-1
0
1
2
3
4
5
Resource utilisation indicator
GDP's deviation from HP trend
Sources: Statistics Sweden and the Riksbank

Figure 1.27. Estimated gapsPercentage deviation from the HP trend
-5
-4
-3
-2
-1
0
1
2
3
4
5
80 85 90 95 00 05 10
-5
-4
-3
-2
-1
0
1
2
3
4
5GDP
Hours worked
Employment
Sources: Statistics Sweden and the Riksbank
Note. These gaps should not necessarily be interpreted as the Riksbank's overall assesment of resource utilisation. Broken lines represent the Riksbank’s forecast.
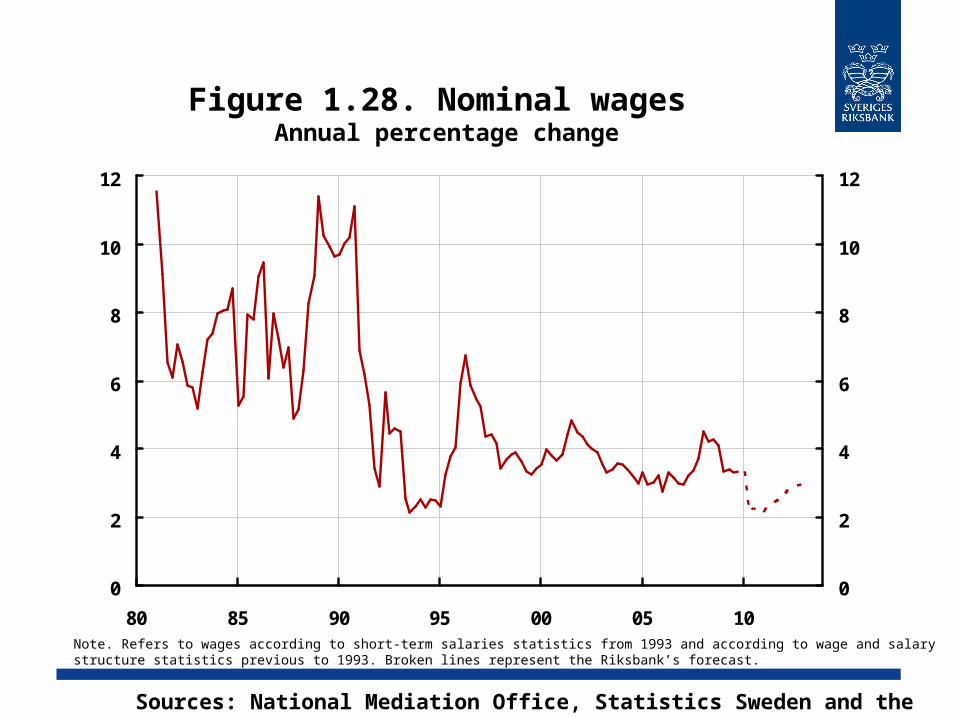
Figure 1.28. Nominal wages Annual percentage change
0
2
4
6
8
10
12
80 85 90 95 00 05 10
0
2
4
6
8
10
12
Sources: National Mediation Office, Statistics Sweden and the Riksbank
Note. Refers to wages according to short-term salaries statistics from 1993 and according to wage and salary structure statistics previous to 1993. Broken lines represent the Riksbank’s forecast.
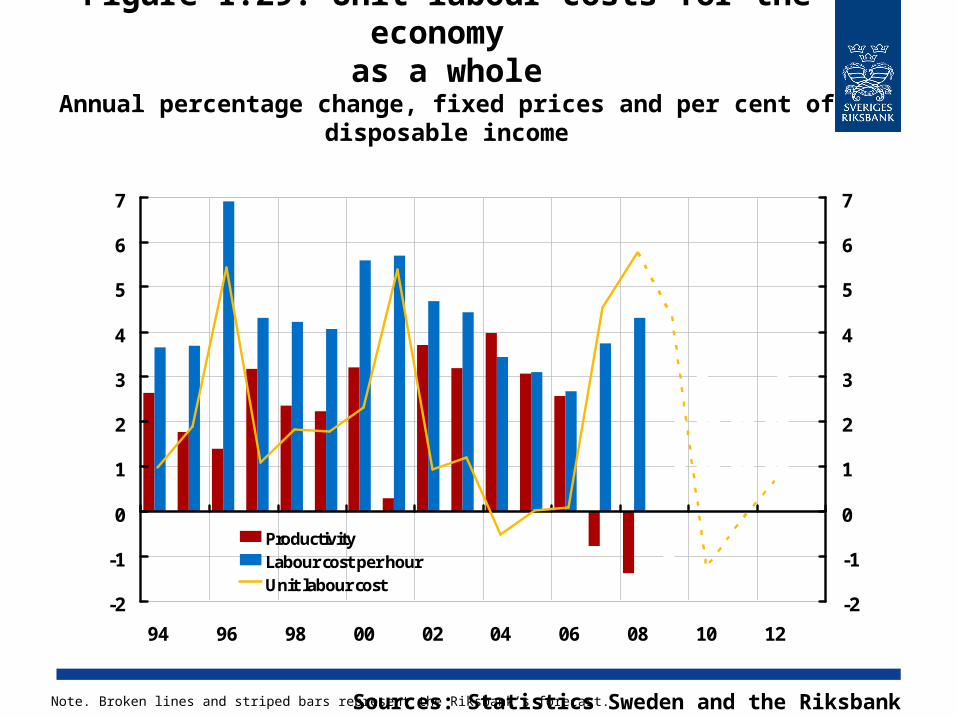
Figure 1.29. Unit labour costs for the economy as a whole
Annual percentage change, fixed prices and per cent of disposable income
-2
-1
0
1
2
3
4
5
6
7
94 96 98 00 02 04 06 08 10 12
-2
-1
0
1
2
3
4
5
6
7
ProductivityLabour cost per hourUnit labour cost
Sources: Statistics Sweden and the Riksbank Note. Broken lines and striped bars represent the Riksbank’s forecast.
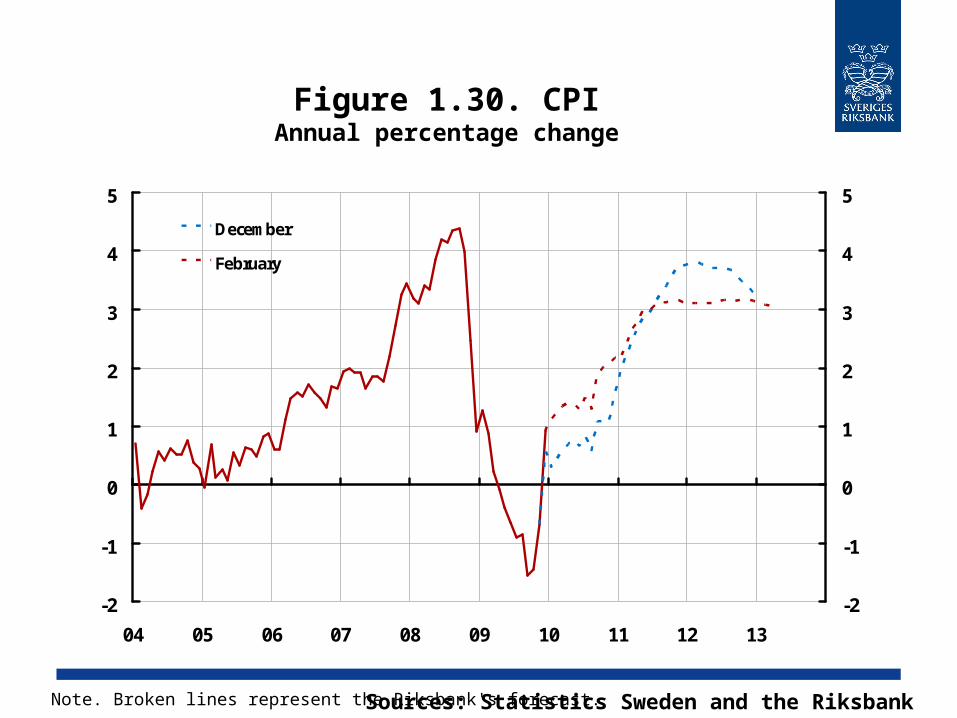
Figure 1.30. CPIAnnual percentage change
-2
-1
0
1
2
3
4
5
04 05 06 07 08 09 10 11 12 13
-2
-1
0
1
2
3
4
5
December
February
Sources: Statistics Sweden and the RiksbankNote. Broken lines represent the Riksbank's forecast.
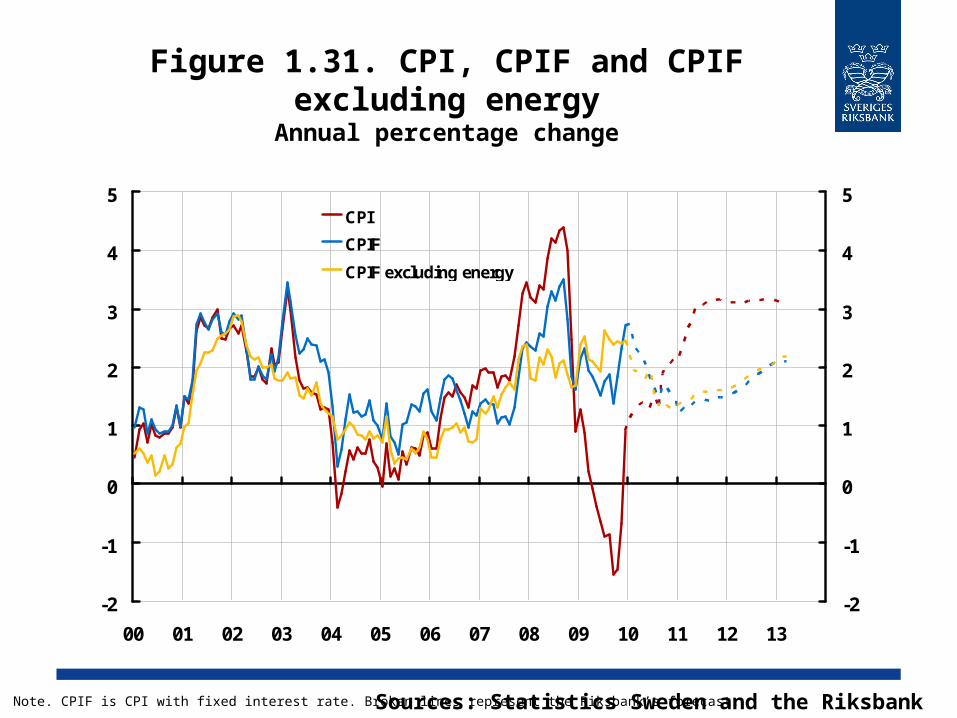
Figure 1.31. CPI, CPIF and CPIF excluding energy
Annual percentage change
-2
-1
0
1
2
3
4
5
00 01 02 03 04 05 06 07 08 09 10 11 12 13
-2
-1
0
1
2
3
4
5CPI
CPIF
CPIF excluding energy
Sources: Statistics Sweden and the Riksbank Note. CPIF is CPI with fixed interest rate. Broken lines represent the Riksbank’s forecast.
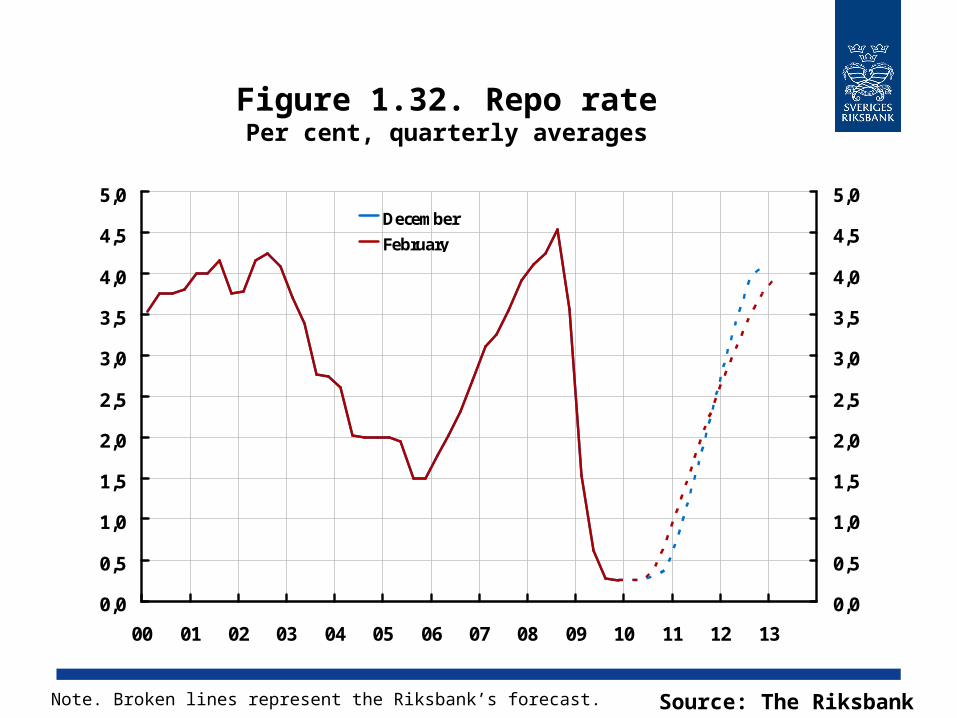
Figure 1.32. Repo ratePer cent, quarterly averages
0,0
0,5
1,0
1,5
2,0
2,5
3,0
3,5
4,0
4,5
5,0
00 01 02 03 04 05 06 07 08 09 10 11 12 13
0,0
0,5
1,0
1,5
2,0
2,5
3,0
3,5
4,0
4,5
5,0December
February
Source: The RiksbankNote. Broken lines represent the Riksbank’s forecast.
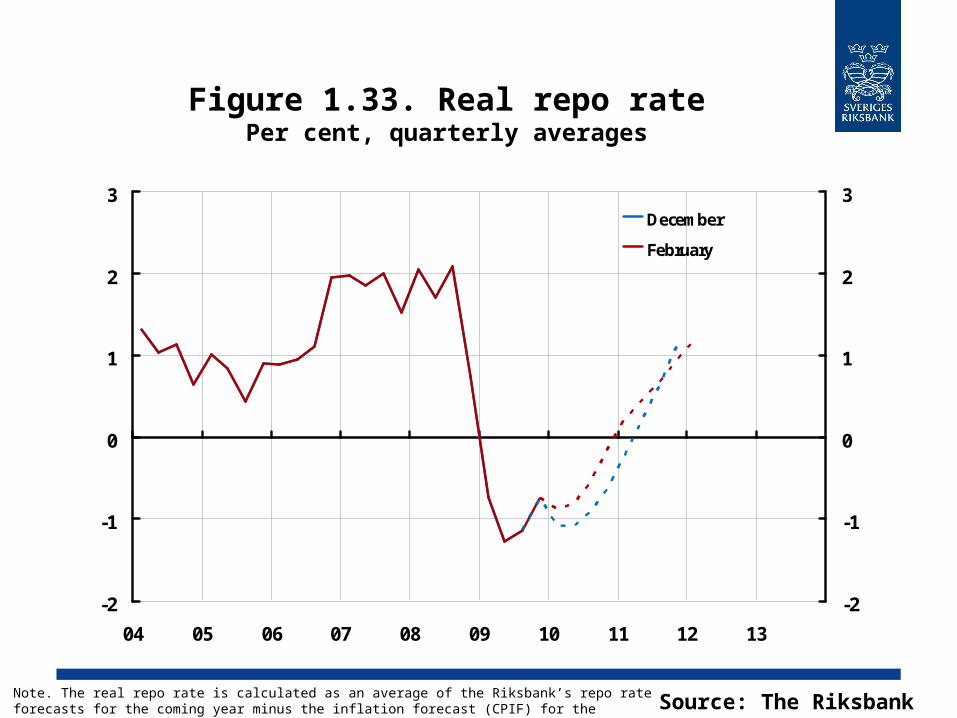
Figure 1.33. Real repo ratePer cent, quarterly averages
-2
-1
0
1
2
3
04 05 06 07 08 09 10 11 12 13
-2
-1
0
1
2
3December
February
Source: The RiksbankNote. The real repo rate is calculated as an average of the Riksbank’s repo rate forecasts for the coming year minus the inflation forecast (CPIF) for the corresponding period. Broken lines represent the Riksbank’s forecast.

Figure 2.1. Hourly labour costAnnual percentage change
0
1
2
3
4
5
04 05 06 07 08 09 10 11 12 13
0
1
2
3
4
5Higher wagesLower wagesMain scenario
Sources: Statistics Sweden and the RiksbankNote. Broken lines represent the Riksbank's forecast.
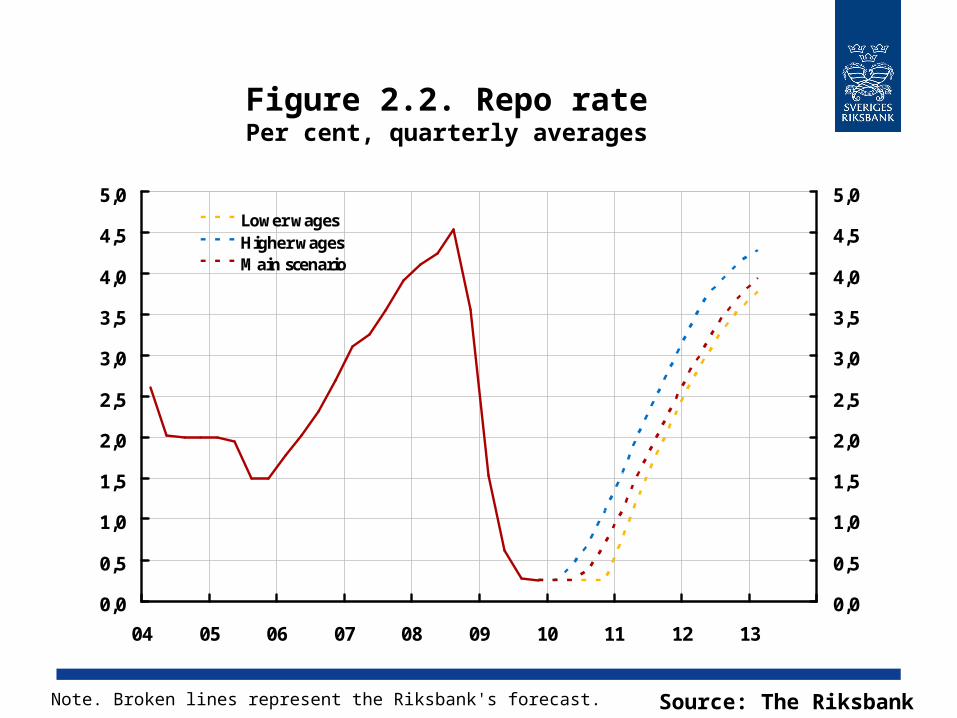
Figure 2.2. Repo ratePer cent, quarterly averages
0,0
0,5
1,0
1,5
2,0
2,5
3,0
3,5
4,0
4,5
5,0
04 05 06 07 08 09 10 11 12 13
0,0
0,5
1,0
1,5
2,0
2,5
3,0
3,5
4,0
4,5
5,0Lower wagesHigher wagesMain scenario
Source: The RiksbankNote. Broken lines represent the Riksbank's forecast.

Figure 2.3. CPIFAnnual percentage change
0,0
0,5
1,0
1,5
2,0
2,5
3,0
3,5
4,0
04 05 06 07 08 09 10 11 12 13
0,0
0,5
1,0
1,5
2,0
2,5
3,0
3,5
4,0Higher wagesLower wagesMain scenario
Sources: Statistics Sweden and the RiksbankNote. Broken lines represent the Riksbank's forecast.

Figure 2.4. Labour market gap (hours worked)
Percentage deviation from the HP trend
-3
-2
-1
0
1
2
3
4
98 99 00 01 02 03 04 05 06 07 08 09 10 11 12 13
-3
-2
-1
0
1
2
3
4
Higher wages
Lower wagesMain scenario
Sources: Statistics Sweden and the RiksbankNote. Broken lines represent the Riksbank's forecast.

Figure 2.5. Hours worked and trendMillions of hours per quarter, seasonally adjusted data
1720
1740
1760
1780
1800
1820
1840
1860
1880
00 01 02 03 04 05 06 07 08 09 10 11 12 13
1720
1740
1760
1780
1800
1820
1840
1860
1880Hours worked
Higher trend
Trend in the main scenario
Gap in main scenario
Gap in alternativescenario
Sources: Statistics Sweden and the RiksbankNote. The last two observations for hours worked refer to the Riksbank's forecast.
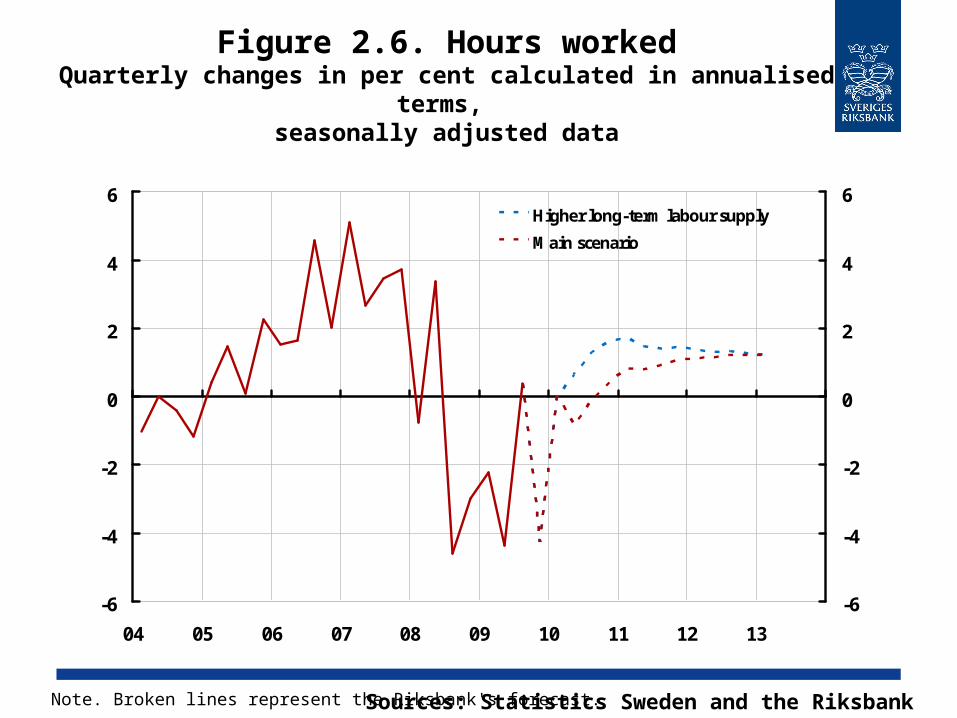
Figure 2.6. Hours workedQuarterly changes in per cent calculated in annualised
terms, seasonally adjusted data
-6
-4
-2
0
2
4
6
04 05 06 07 08 09 10 11 12 13
-6
-4
-2
0
2
4
6Higher long-term labour supply
Main scenario
Sources: Statistics Sweden and the RiksbankNote. Broken lines represent the Riksbank's forecast.

Figure 2.7. Repo ratePer cent, quarterly averages
-0,5
0,0
0,5
1,0
1,5
2,0
2,5
3,0
3,5
4,0
4,5
5,0
04 05 06 07 08 09 10 11 12 13
-0,5
0,0
0,5
1,0
1,5
2,0
2,5
3,0
3,5
4,0
4,5
5,0Main scenarioHigher long-term labour supply
Source: The RiksbankNote. Broken lines represent the Riksbank's forecast.
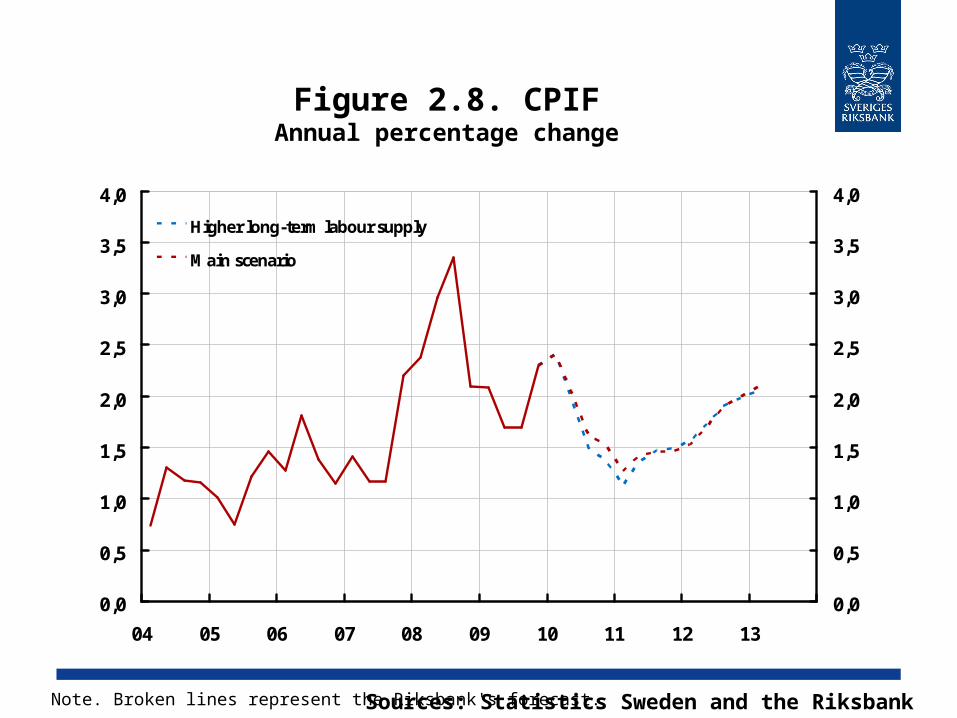
Figure 2.8. CPIFAnnual percentage change
0,0
0,5
1,0
1,5
2,0
2,5
3,0
3,5
4,0
04 05 06 07 08 09 10 11 12 13
0,0
0,5
1,0
1,5
2,0
2,5
3,0
3,5
4,0
Higher long-term labour supply
Main scenario
Sources: Statistics Sweden and the RiksbankNote. Broken lines represent the Riksbank's forecast.
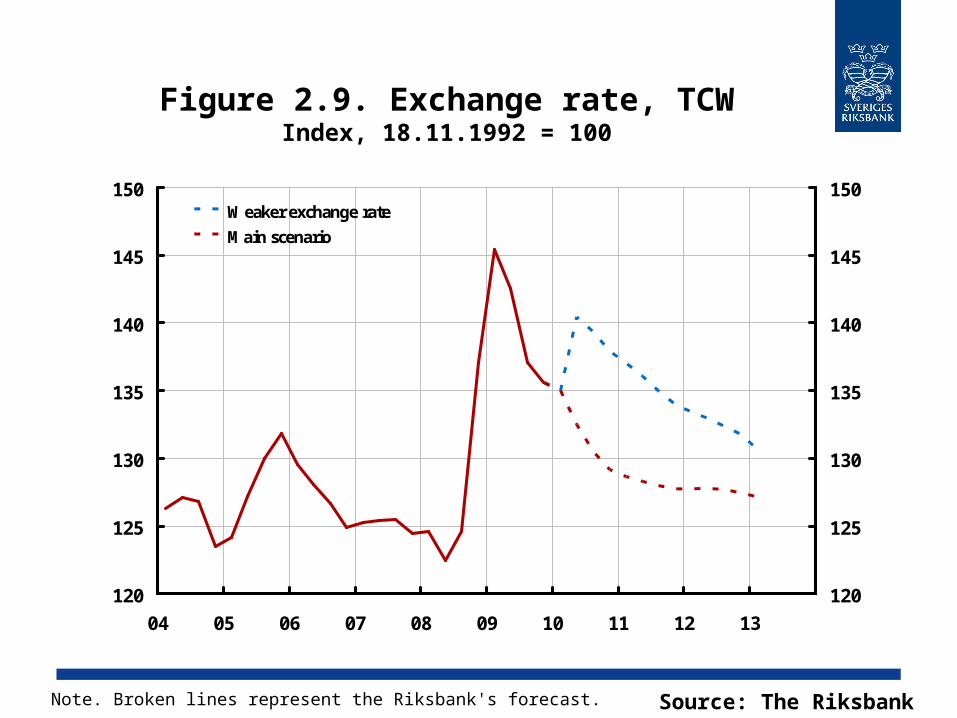
Figure 2.9. Exchange rate, TCWIndex, 18.11.1992 = 100
Source: The RiksbankNote. Broken lines represent the Riksbank's forecast.
120
125
130
135
140
145
150
04 05 06 07 08 09 10 11 12 13
120
125
130
135
140
145
150Weaker exchange rate
Main scenario

Figure 2.10. Labour market gap (hours worked)
Percentage deviation from the HP trend
Sources: Statistics Sweden and the RiksbankNote. Broken lines represent the Riksbank's forecast.
-3
-2
-1
0
1
2
3
4
98 99 00 01 02 03 04 05 06 07 08 09 10 11 12 13
-3
-2
-1
0
1
2
3
4
Weaker exchange rate
Main scenario
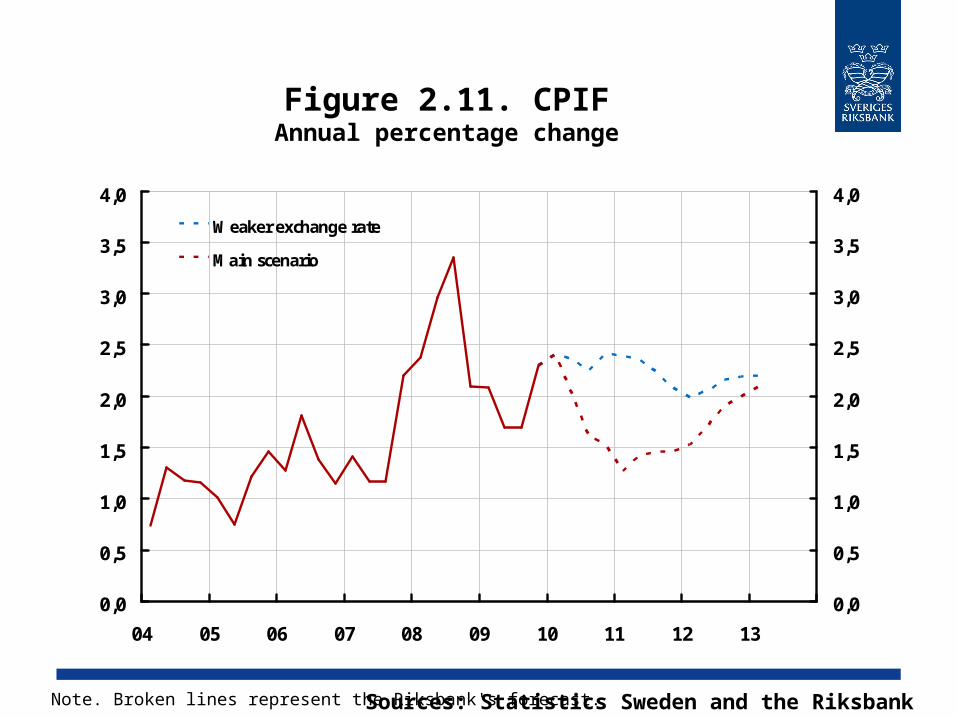
Figure 2.11. CPIFAnnual percentage change
0,0
0,5
1,0
1,5
2,0
2,5
3,0
3,5
4,0
04 05 06 07 08 09 10 11 12 13
0,0
0,5
1,0
1,5
2,0
2,5
3,0
3,5
4,0
Weaker exchange rate
Main scenario
Sources: Statistics Sweden and the RiksbankNote. Broken lines represent the Riksbank's forecast.

Figure 2.12. Repo ratePer cent, quarterly averages
0,0
0,5
1,0
1,5
2,0
2,5
3,0
3,5
4,0
4,5
5,0
04 05 06 07 08 09 10 11 12 13
0,0
0,5
1,0
1,5
2,0
2,5
3,0
3,5
4,0
4,5
5,0Main scenarioWeaker exchange rate
Source: The RiksbankNote. Broken lines represent the Riksbank's forecast.
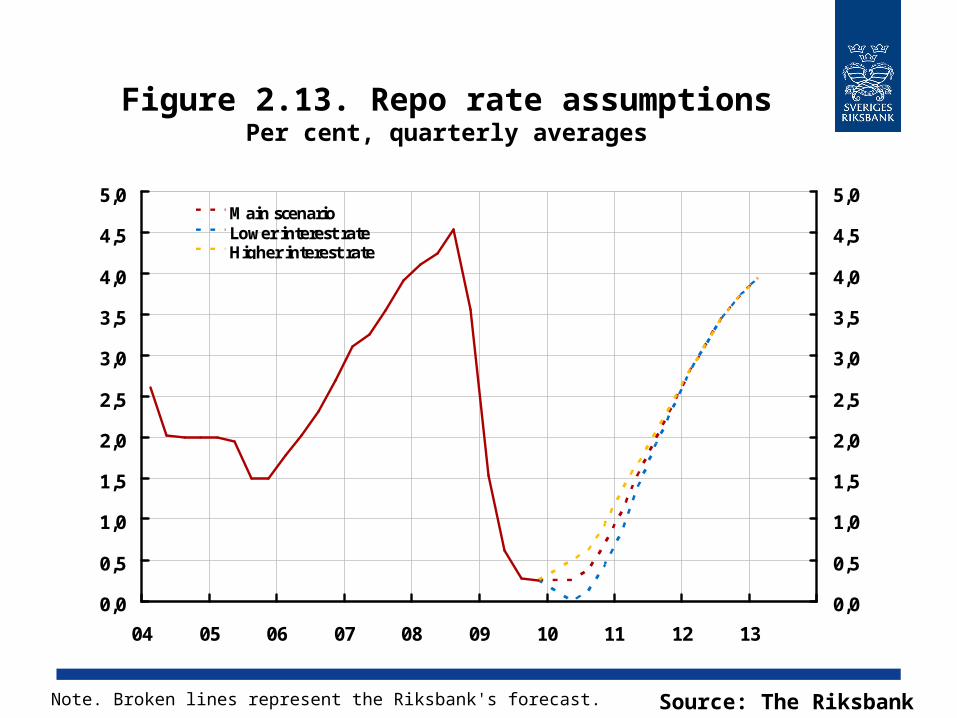
Figure 2.13. Repo rate assumptionsPer cent, quarterly averages
0,0
0,5
1,0
1,5
2,0
2,5
3,0
3,5
4,0
4,5
5,0
04 05 06 07 08 09 10 11 12 13
0,0
0,5
1,0
1,5
2,0
2,5
3,0
3,5
4,0
4,5
5,0Main scenarioLower interest rateHigher interest rate
Source: The RiksbankNote. Broken lines represent the Riksbank's forecast.
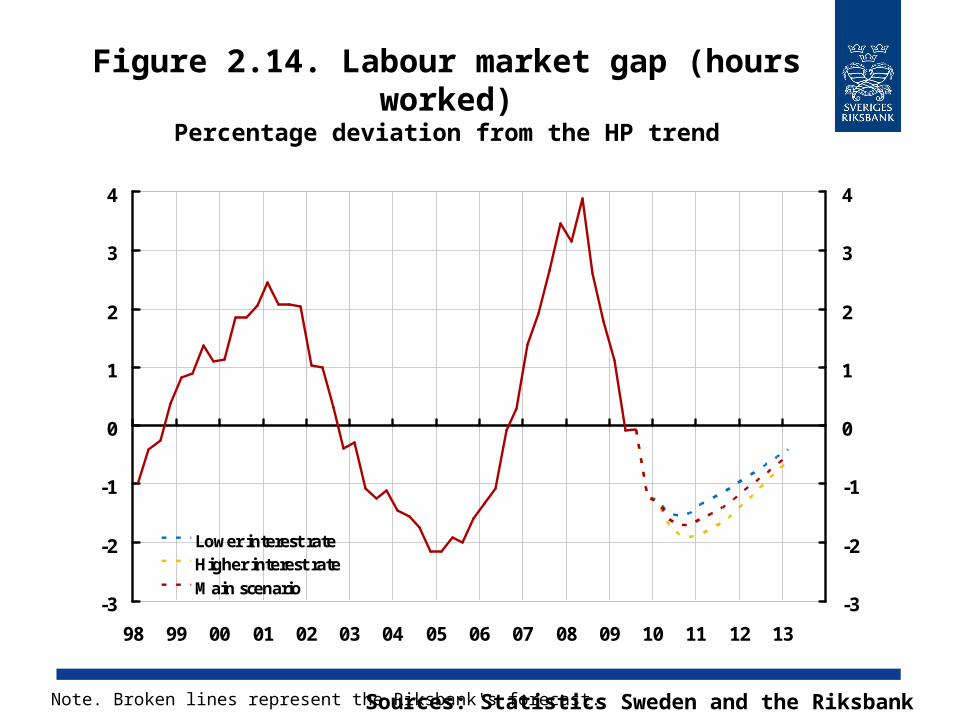
Figure 2.14. Labour market gap (hours worked)
Percentage deviation from the HP trend
-3
-2
-1
0
1
2
3
4
98 99 00 01 02 03 04 05 06 07 08 09 10 11 12 13
-3
-2
-1
0
1
2
3
4
Lower interest rateHigher interest rateMain scenario
Sources: Statistics Sweden and the RiksbankNote. Broken lines represent the Riksbank's forecast.
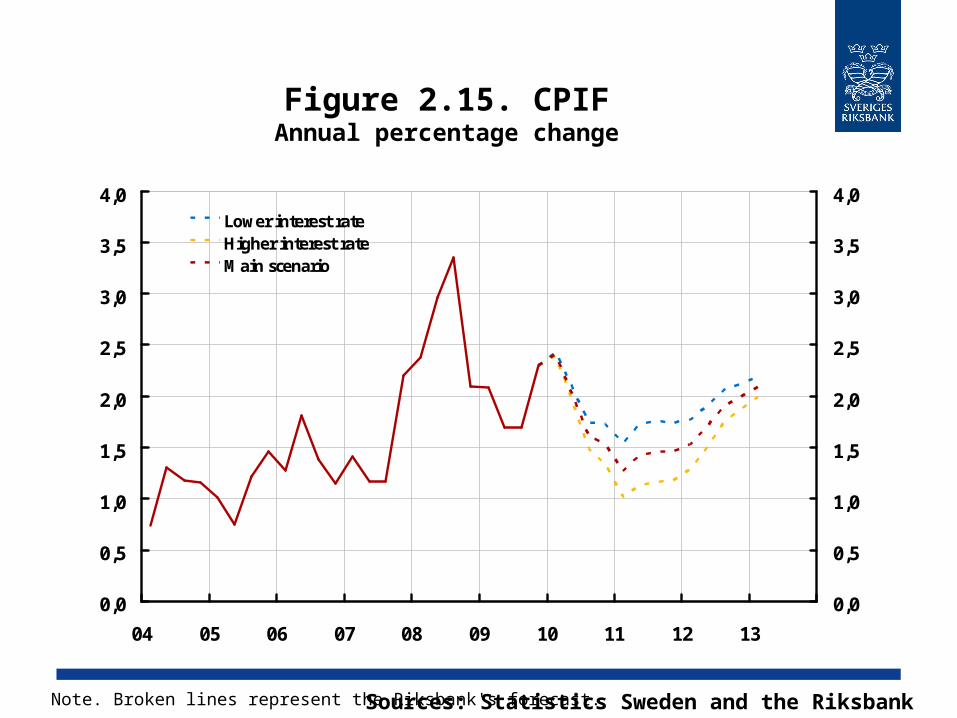
Figure 2.15. CPIFAnnual percentage change
0,0
0,5
1,0
1,5
2,0
2,5
3,0
3,5
4,0
04 05 06 07 08 09 10 11 12 13
0,0
0,5
1,0
1,5
2,0
2,5
3,0
3,5
4,0Lower interest rateHigher interest rateMain scenario
Sources: Statistics Sweden and the RiksbankNote. Broken lines represent the Riksbank's forecast.
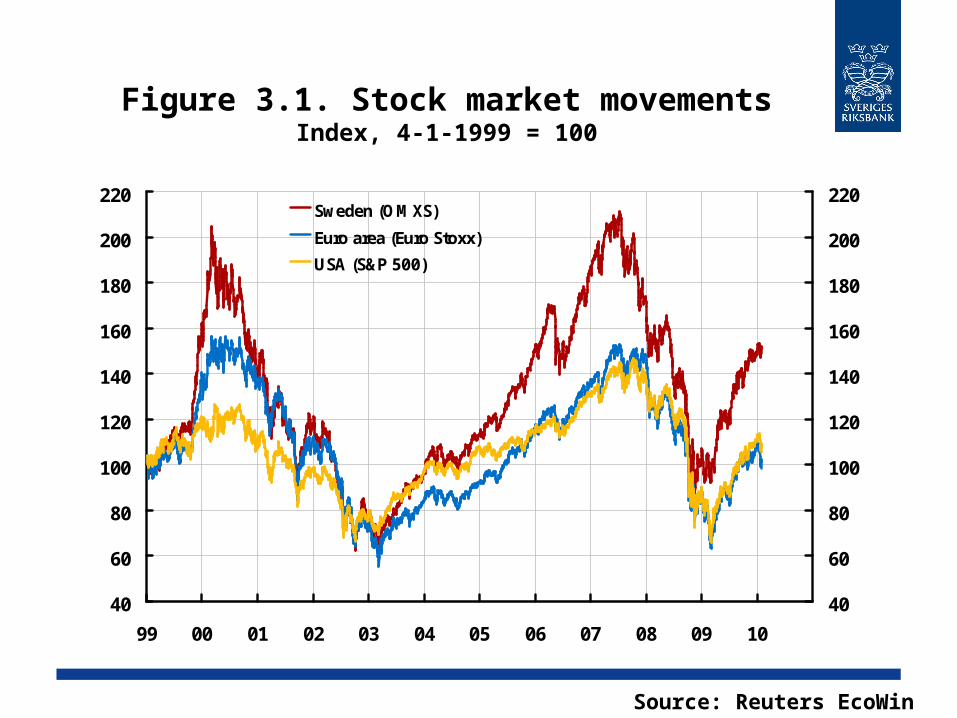
Figure 3.1. Stock market movementsIndex, 4-1-1999 = 100
40
60
80
100
120
140
160
180
200
220
99 00 01 02 03 04 05 06 07 08 09 10
40
60
80
100
120
140
160
180
200
220Sweden (OMXS)
Euro area (Euro Stoxx)
USA (S&P 500)
Source: Reuters EcoWin
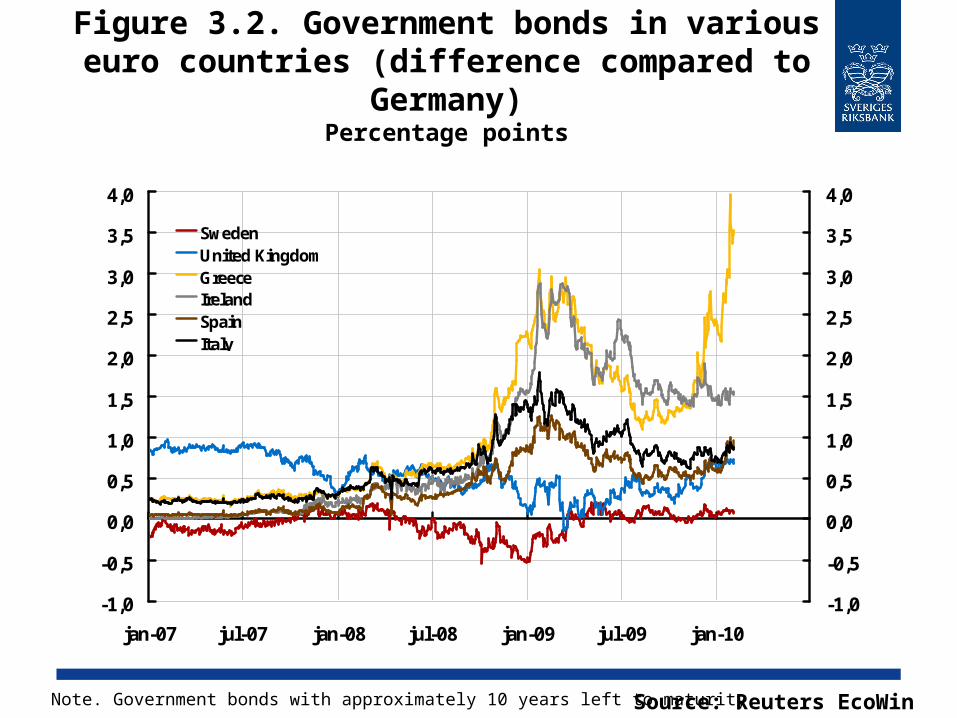
Figure 3.2. Government bonds in various euro countries (difference compared to
Germany)Percentage points
-1,0
-0,5
0,0
0,5
1,0
1,5
2,0
2,5
3,0
3,5
4,0
jan-07 jul-07 jan-08 jul-08 jan-09 jul-09 jan-10
-1,0
-0,5
0,0
0,5
1,0
1,5
2,0
2,5
3,0
3,5
4,0
SwedenUnited KingdomGreeceIrelandSpainItaly
Source: Reuters EcoWinNote. Government bonds with approximately 10 years left to maturity.
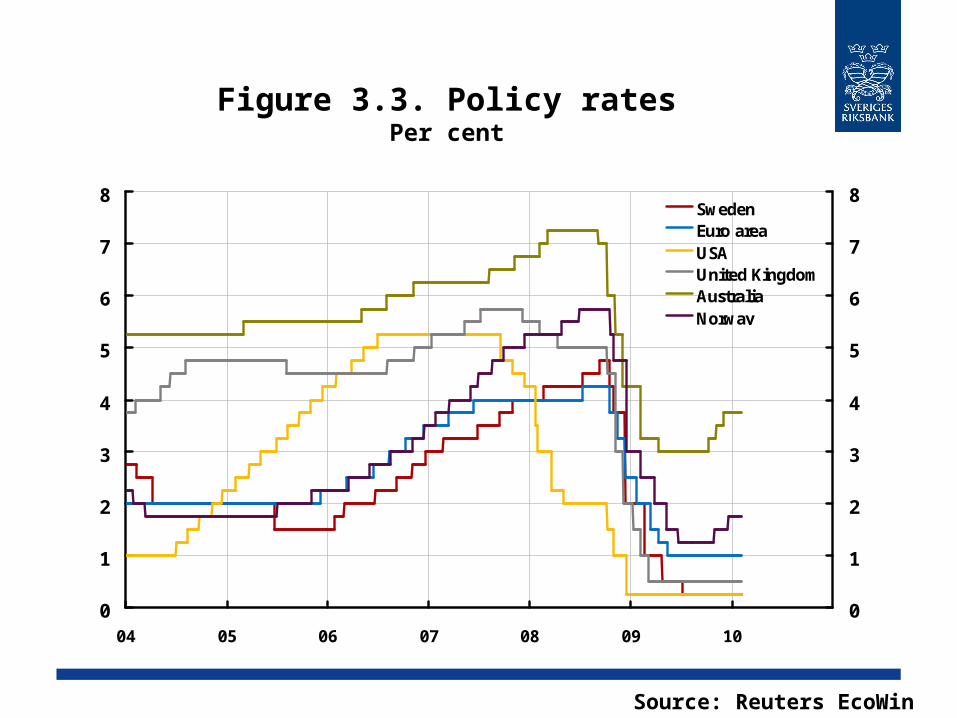
Figure 3.3. Policy ratesPer cent
0
1
2
3
4
5
6
7
8
04 05 06 07 08 09 10
0
1
2
3
4
5
6
7
8SwedenEuro areaUSAUnited KingdomAustraliaNorway
Source: Reuters EcoWin

Figure 3.4. Monetary policy expectations in Sweden according to money market
participants Per cent
0
1
2
3
4
5
6
06 07 08 09 10 11 12 13
0
1
2
3
4
5
6Repo rate
February
Forward rate 2010-02-04
Forward rate 2009-12-16
Survey, Prospera averages, 2010-01-13
Sources: Reuters Ecowin, TNS SIFO Prospera and the Riksbank
Note. Forward rates have been adjusted for risk premiums and describe the expected overnight rate. Broken lines represent the Riksbank's forecast.
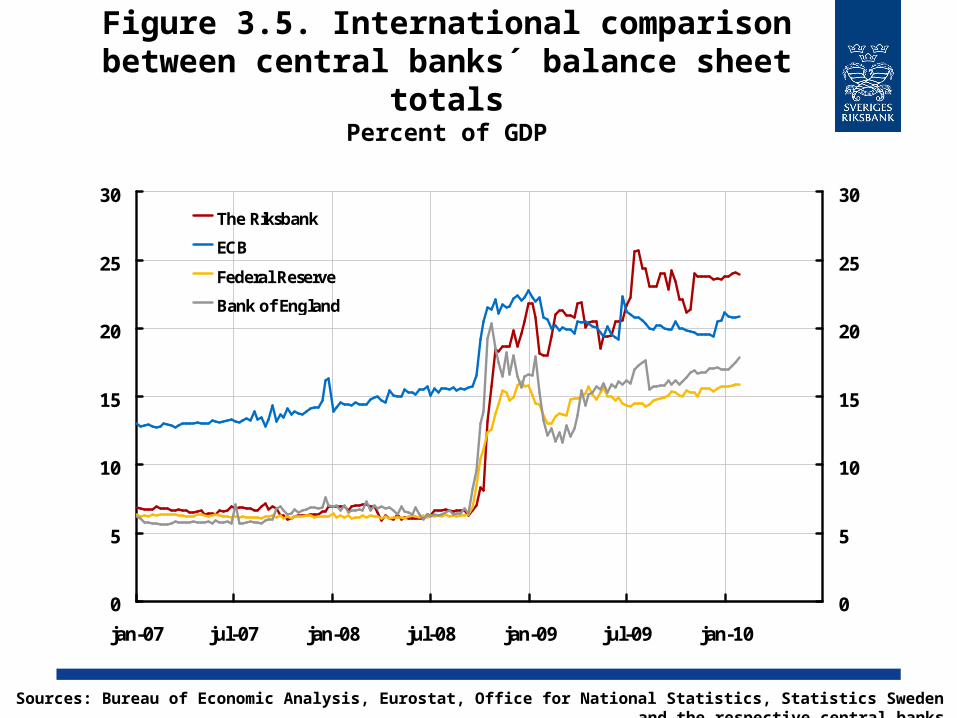
Figure 3.5. International comparison between central banks´ balance sheet
totalsPercent of GDP
0
5
10
15
20
25
30
jan-07 jul-07 jan-08 jul-08 jan-09 jul-09 jan-10
0
5
10
15
20
25
30The Riksbank
ECB
Federal Reserve
Bank of England
Sources: Bureau of Economic Analysis, Eurostat, Office for National Statistics, Statistics Sweden and the respective central banks

Figure 3.6. Housing pricesAnnual percentage change
-6
-4
-2
0
2
4
6
8
10
12
14
00 01 02 03 04 05 06 07 08 09 10
-6
-4
-2
0
2
4
6
8
10
12
14
Property price index
Purchase price coefficient
Source: Statistics SwedenNote. Quarterly observations of property price index and monthly observations of the mean value of the purchase price coefficient (Purchase price/Taxation value).

Figure 3.7. Money SupplyAnnual percentage change
-5
0
5
10
15
20
25
00 01 02 03 04 05 06 07 08 09 10
-5
0
5
10
15
20
25The general public's holding of banknotes and coins
M2
M3
Sources: Statistics Sweden and the Riksbank
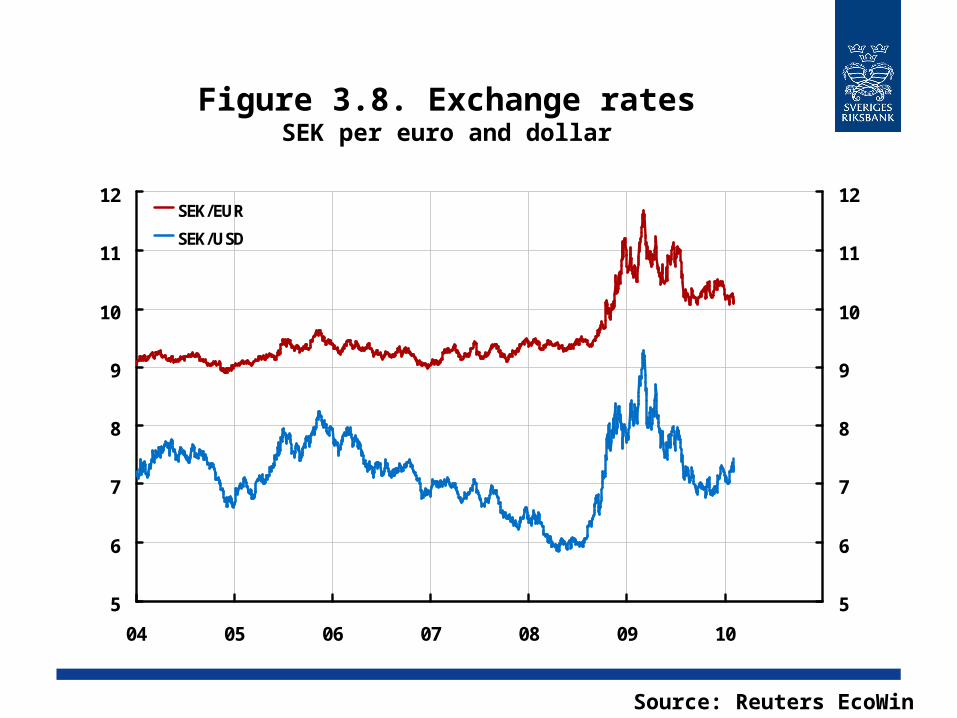
Figure 3.8. Exchange ratesSEK per euro and dollar
5
6
7
8
9
10
11
12
04 05 06 07 08 09 10
5
6
7
8
9
10
11
12SEK/EUR
SEK/USD
Source: Reuters EcoWin
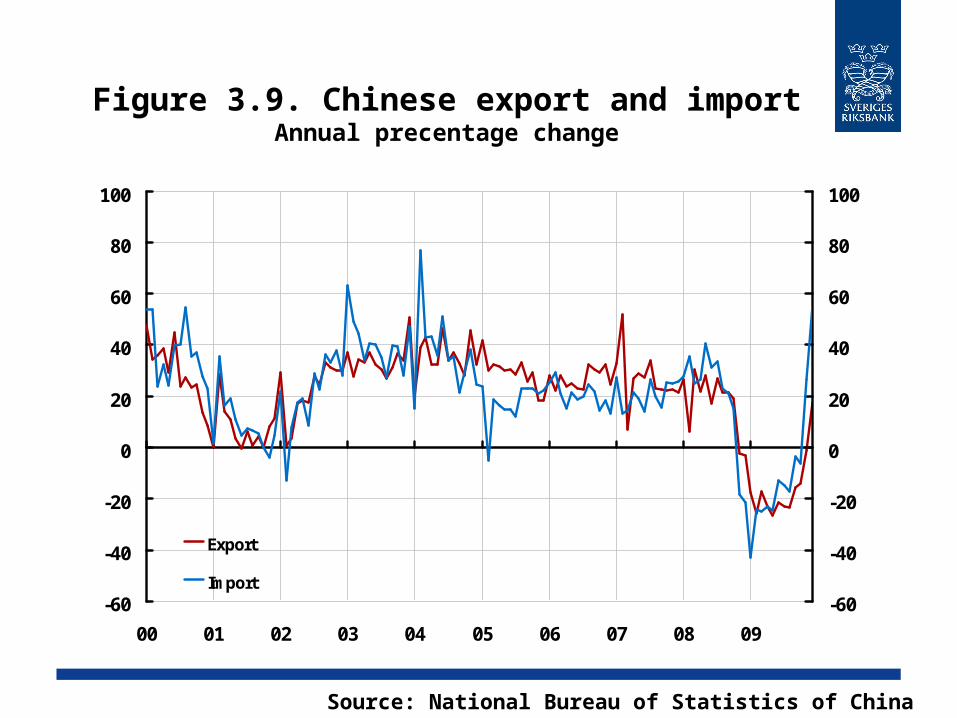
Figure 3.9. Chinese export and importAnnual precentage change
-60
-40
-20
0
20
40
60
80
100
00 01 02 03 04 05 06 07 08 09
-60
-40
-20
0
20
40
60
80
100
Export
Import
Source: National Bureau of Statistics of China
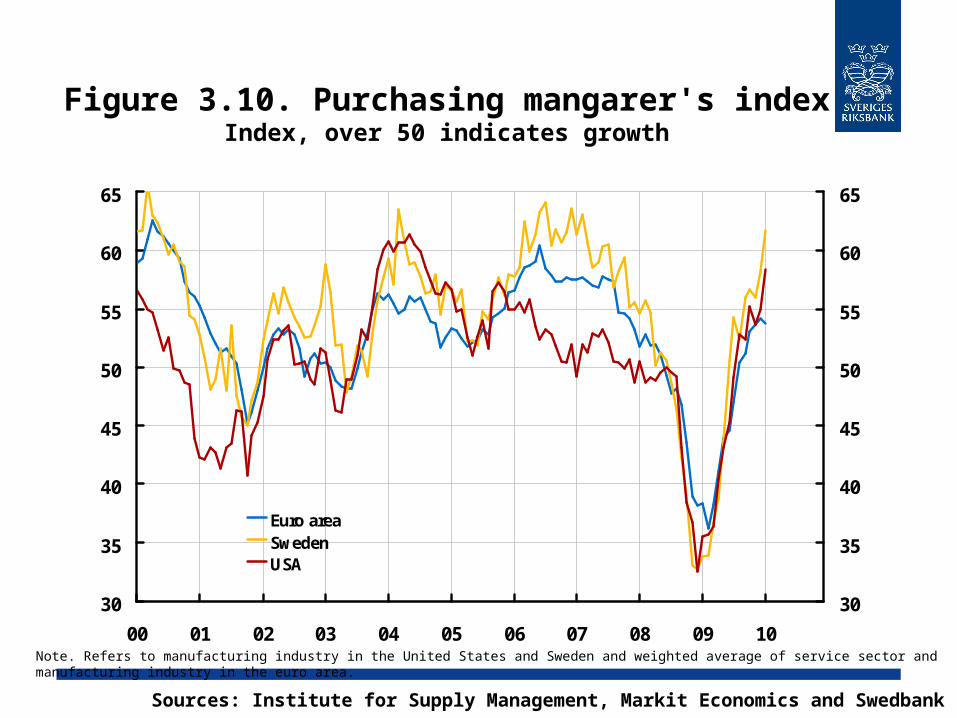
Figure 3.10. Purchasing mangarer's indexIndex, over 50 indicates growth
30
35
40
45
50
55
60
65
00 01 02 03 04 05 06 07 08 09 10
30
35
40
45
50
55
60
65
Euro areaSwedenUSA
Sources: Institute for Supply Management, Markit Economics and Swedbank
Note. Refers to manufacturing industry in the United States and Sweden and weighted average of service sector and manufacturing industry in the euro area.
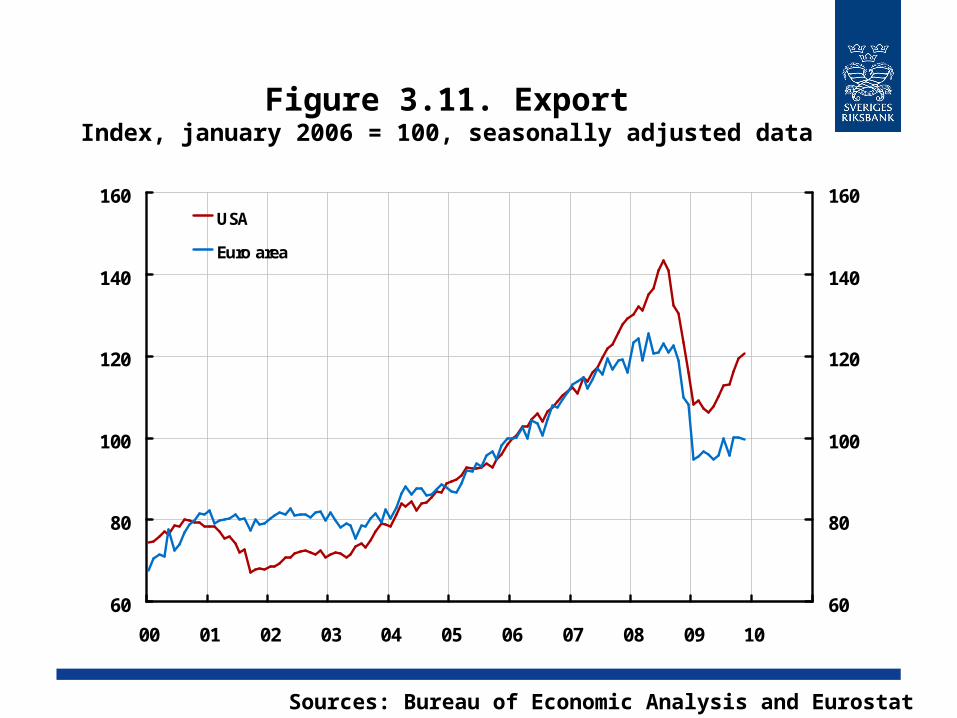
Figure 3.11. ExportIndex, january 2006 = 100, seasonally adjusted data
60
80
100
120
140
160
00 01 02 03 04 05 06 07 08 09 10
60
80
100
120
140
160USA
Euro area
Sources: Bureau of Economic Analysis and Eurostat
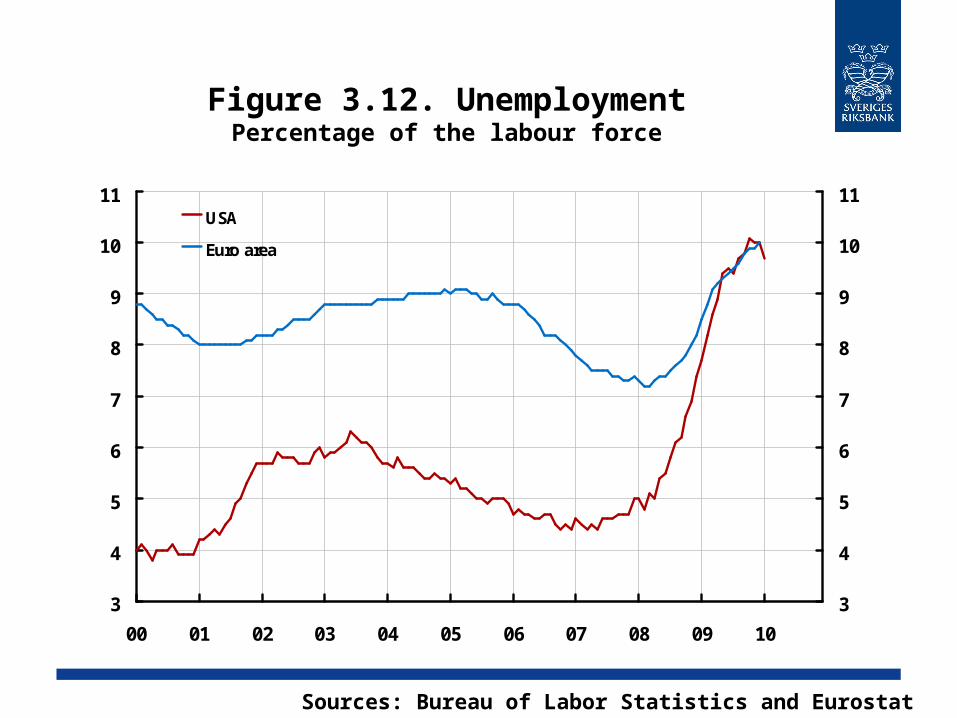
Figure 3.12. UnemploymentPercentage of the labour force
3
4
5
6
7
8
9
10
11
00 01 02 03 04 05 06 07 08 09 10
3
4
5
6
7
8
9
10
11USA
Euro area
Sources: Bureau of Labor Statistics and Eurostat

Figure 3.13. Households confidence indicators
Net values
-40
-35
-30
-25
-20
-15
-10
-5
0
5
10
15
00 01 02 03 04 05 06 07 08 09 10
-40
-35
-30
-25
-20
-15
-10
-5
0
5
10
15
Euro area
Germany
United Kingdom
Source: European Commission

Figure 3.14. HICP for the Euro areaAnnual percentage change
-1
0
1
2
3
4
5
00 01 02 03 04 05 06 07 08 09 10
-1
0
1
2
3
4
5TotalExcluding energy, food, alcohol and tobaccoExcluding energy and unprocessed food
Source: Eurostat

Figure 3.15. The Economic Tendency Indicator
Index, mean = 100
70
75
80
85
90
95
100
105
110
115
120
00 01 02 03 04 05 06 07 08 09 10
70
75
80
85
90
95
100
105
110
115
120The Economic Tendency IndicatorMean+/- one standard deviation
Source: National Institute of Economic Research

Figure 3.16. Industrial production and the production of services
Index, 2005 = 100, seasonally adjusted data
50
60
70
80
90
100
110
120
130
00 01 02 03 04 05 06 07 08 09
50
60
70
80
90
100
110
120
130Industrial production
Production of services
Source: Statistics Sweden
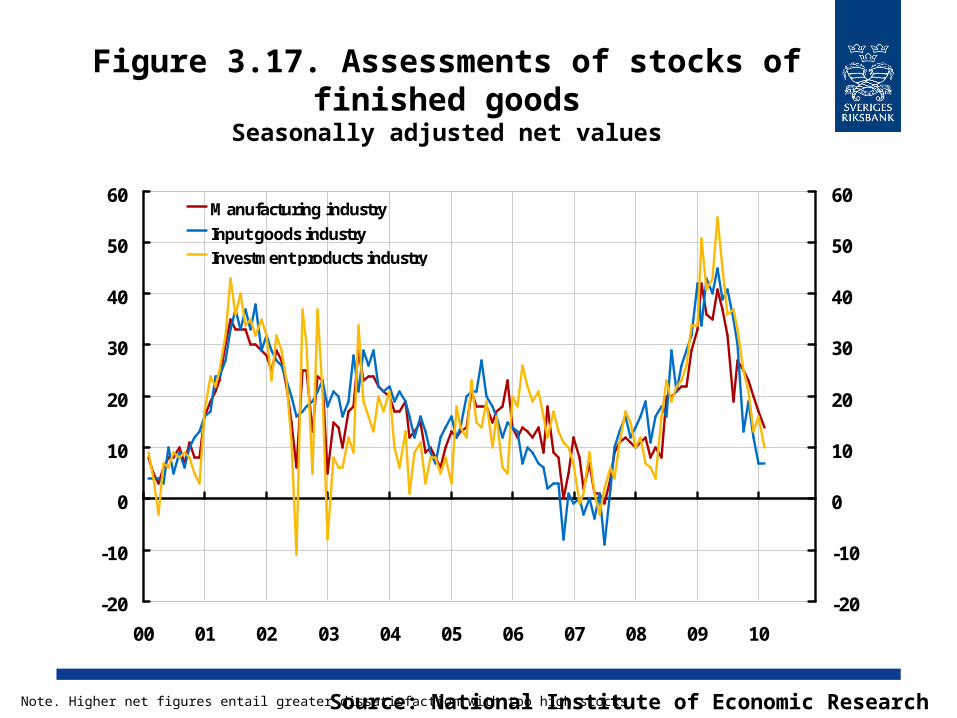
Figure 3.17. Assessments of stocks of finished goods
Seasonally adjusted net values
-20
-10
0
10
20
30
40
50
60
00 01 02 03 04 05 06 07 08 09 10
-20
-10
0
10
20
30
40
50
60Manufacturing industry
Input goods industryInvestment products industry
Source: National Institute of Economic ResearchNote. Higher net figures entail greater dissatisfaction with too high stocks.

Figure 3.18. Households' expectations for the futureNet figures
-90
-75
-60
-45
-30
-15
0
15
30
45
60
75
94 96 98 00 02 04 06 08 10
-90
-75
-60
-45
-30
-15
0
15
30
45
60
75
Unemployment
Confidence Indicator
Source: National Institute of Economic ResearchNote. Unemployment is defined here as the percentage of households that believe unemployment will fall minus the percentage who believe that unemployment will rise.
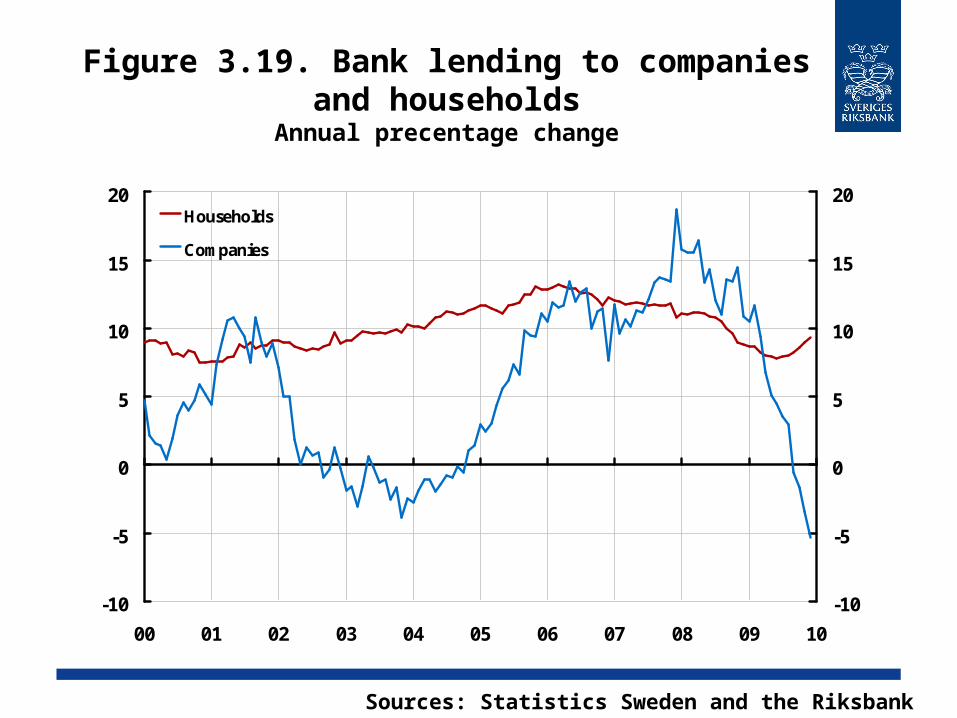
Figure 3.19. Bank lending to companies and households
Annual precentage change
-10
-5
0
5
10
15
20
00 01 02 03 04 05 06 07 08 09 10
-10
-5
0
5
10
15
20Households
Companies
Sources: Statistics Sweden and the Riksbank
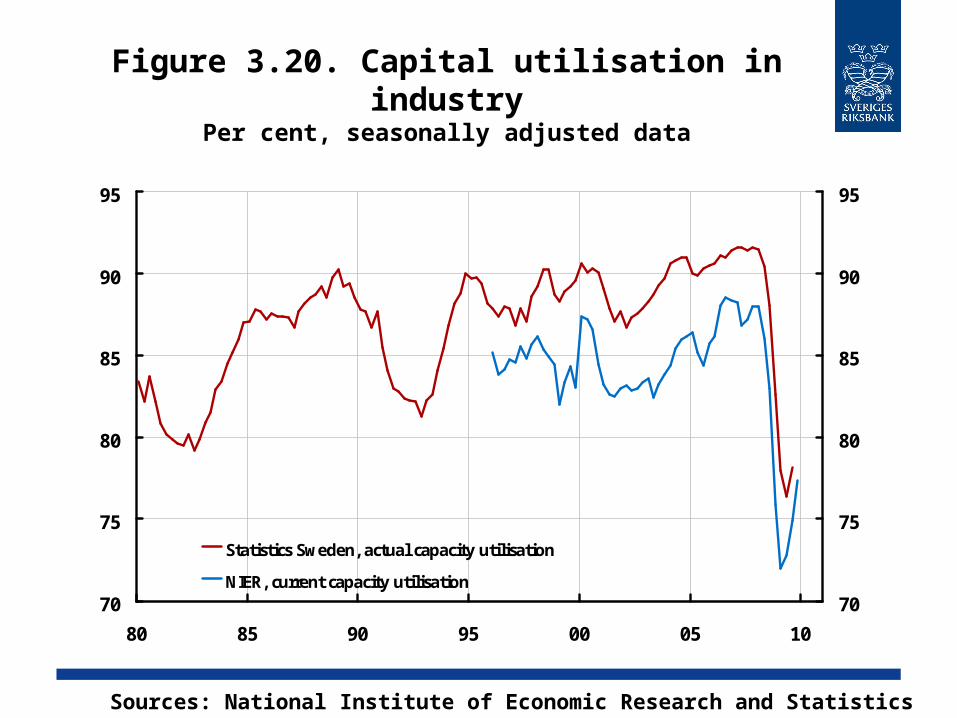
Figure 3.20. Capital utilisation in industryPer cent, seasonally adjusted data
70
75
80
85
90
95
80 85 90 95 00 05 10
70
75
80
85
90
95
Statistics Sweden, actual capacity utilisation
NIER, current capacity utilisation
Sources: National Institute of Economic Research and Statistics Sweden

Figure 3.21. Foreign trade with goods in fixed prices
Index, 2005 = 100, seasonally adjusted data
0
20
40
60
80
100
120
80 82 84 86 88 90 92 94 96 98 00 02 04 06 08 10
0
20
40
60
80
100
120
Export Import
Sources: Statistics Sweden and the RiksbankNote. Three-month moving averages. Fixed prices calculated by the Riksbank.
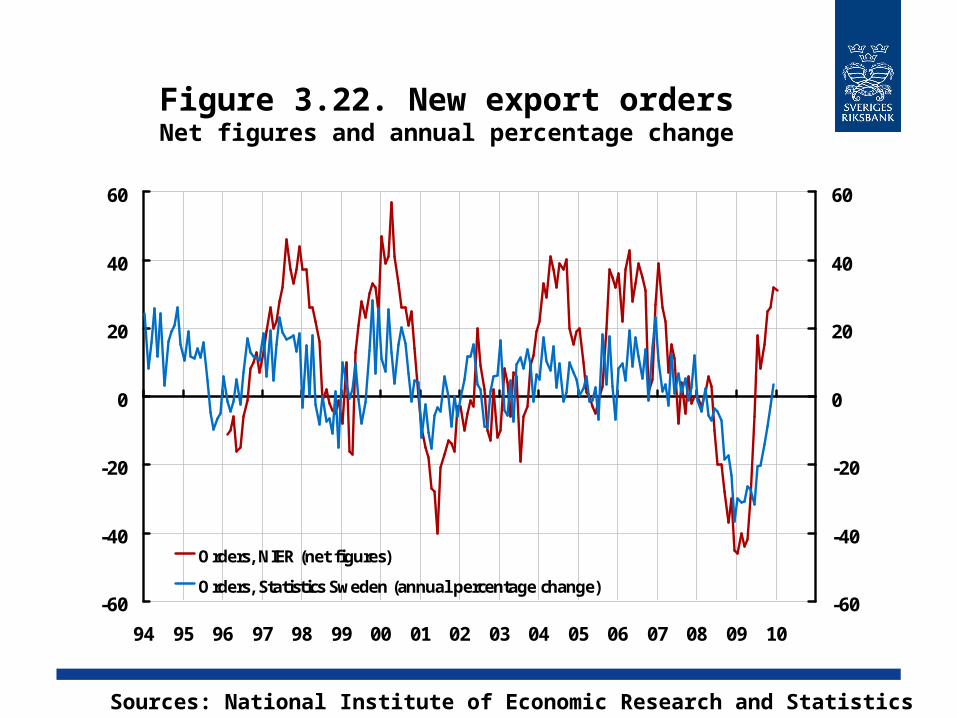
Figure 3.22. New export ordersNet figures and annual percentage change
-60
-40
-20
0
20
40
60
94 95 96 97 98 99 00 01 02 03 04 05 06 07 08 09 10
-60
-40
-20
0
20
40
60
Orders, NIER (net figures)
Orders, Statistics Sweden (annual percentage change)
Sources: National Institute of Economic Research and Statistics Sweden
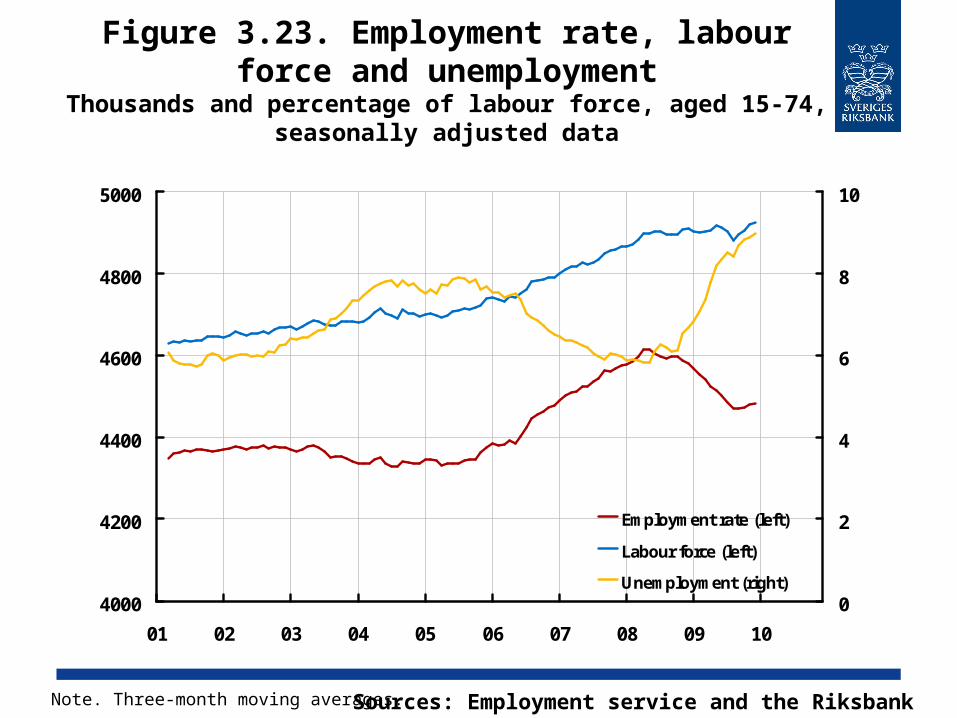
Figure 3.23. Employment rate, labour force and unemployment
Thousands and percentage of labour force, aged 15-74, seasonally adjusted data
4000
4200
4400
4600
4800
5000
01 02 03 04 05 06 07 08 09 10
0
2
4
6
8
10
Employment rate (left)
Labour force (left)
Unemployment (right)
Sources: Employment service and the RiksbankNote. Three-month moving averages.
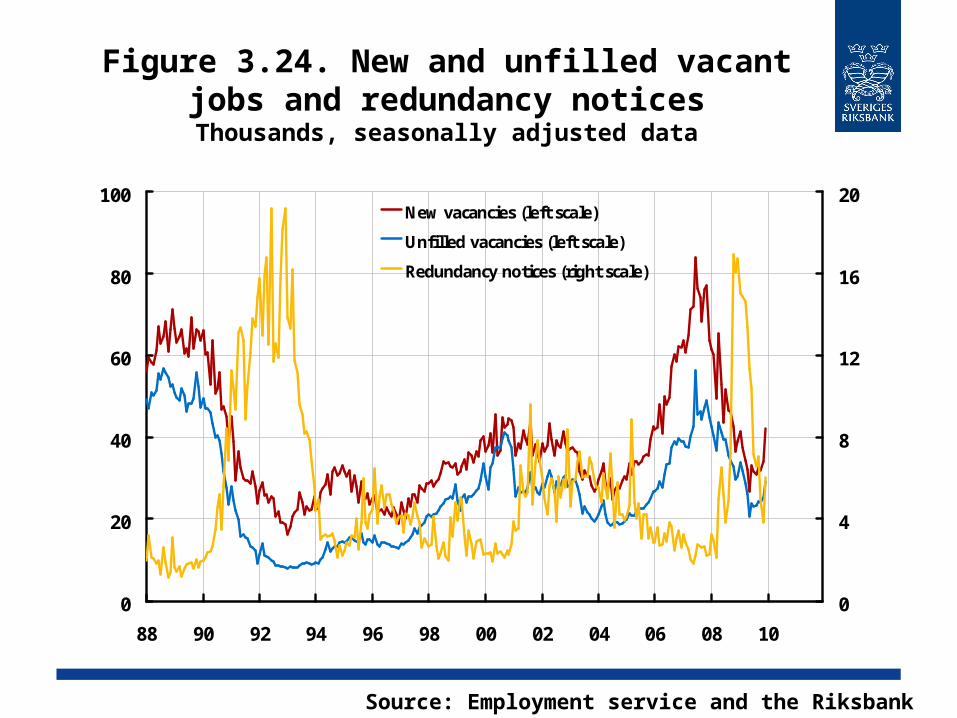
Figure 3.24. New and unfilled vacant jobs and redundancy notices
Thousands, seasonally adjusted data
0
20
40
60
80
100
88 90 92 94 96 98 00 02 04 06 08 10
0
4
8
12
16
20New vacancies (left scale)
Unfilled vacancies (left scale)
Redundancy notices (right scale)
Source: Employment service and the Riksbank
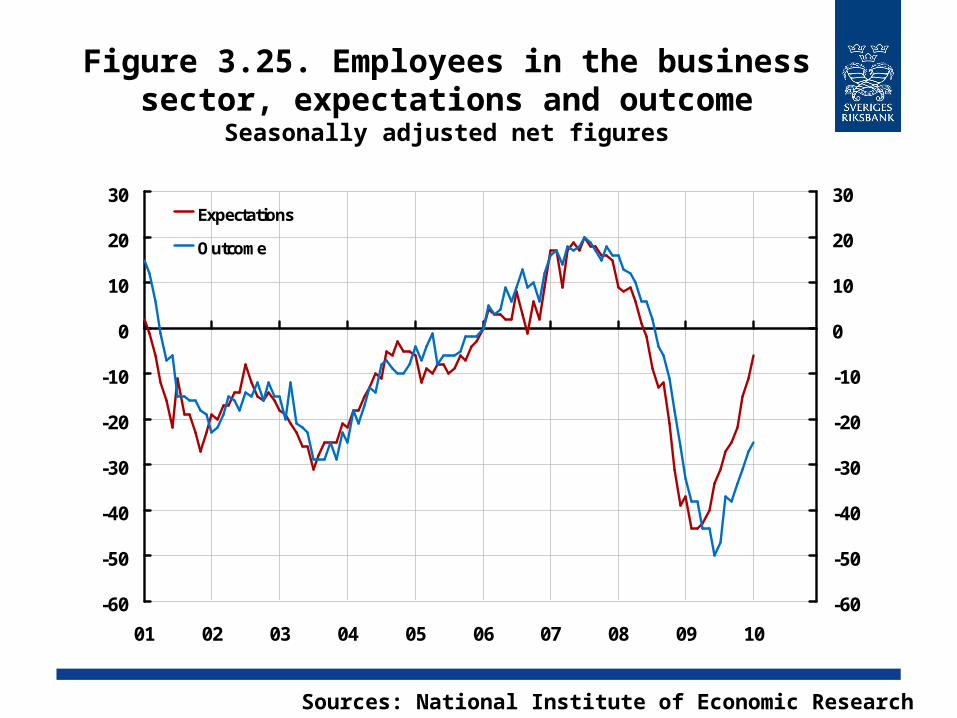
Figure 3.25. Employees in the business sector, expectations and outcome
Seasonally adjusted net figures
-60
-50
-40
-30
-20
-10
0
10
20
30
01 02 03 04 05 06 07 08 09 10
-60
-50
-40
-30
-20
-10
0
10
20
30Expectations
Outcome
Sources: National Institute of Economic Research
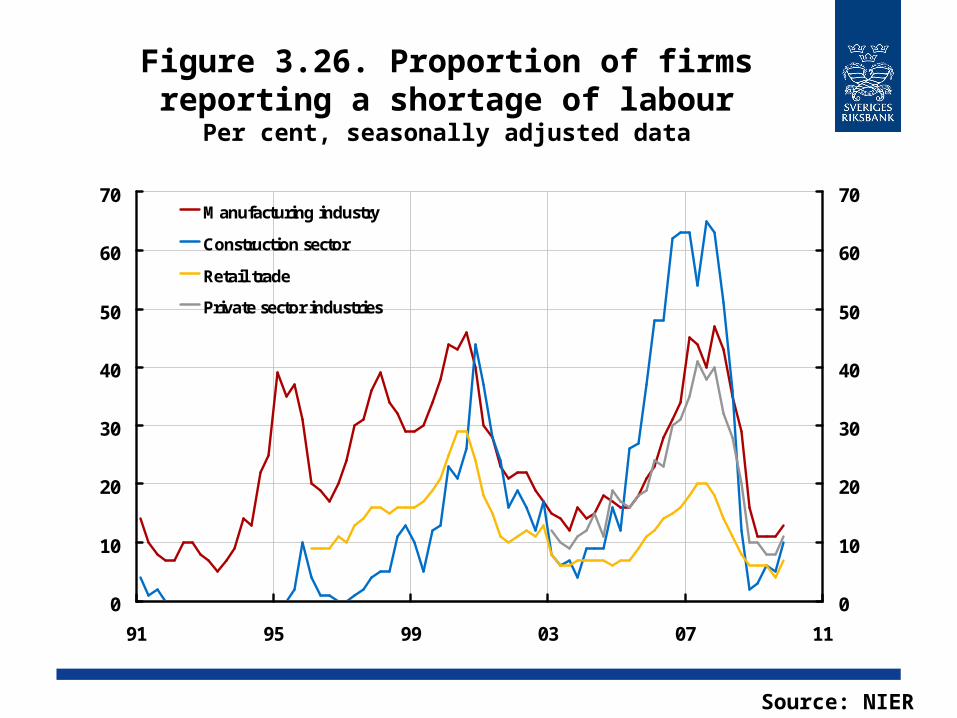
Figure 3.26. Proportion of firms reporting a shortage of labour
Per cent, seasonally adjusted data
0
10
20
30
40
50
60
70
91 95 99 03 07 11
0
10
20
30
40
50
60
70Manufacturing industry
Construction sector
Retail trade
Private sector industries
Source: NIER

Figure 3.27. WagesAnnual percentage change
0
1
2
3
4
5
6
7
8
94 95 96 97 98 99 00 01 02 03 04 05 06 07 08 09 10
0
1
2
3
4
5
6
7
8Public sector
Business sector
Sources: National Mediation Office and the Riksbank
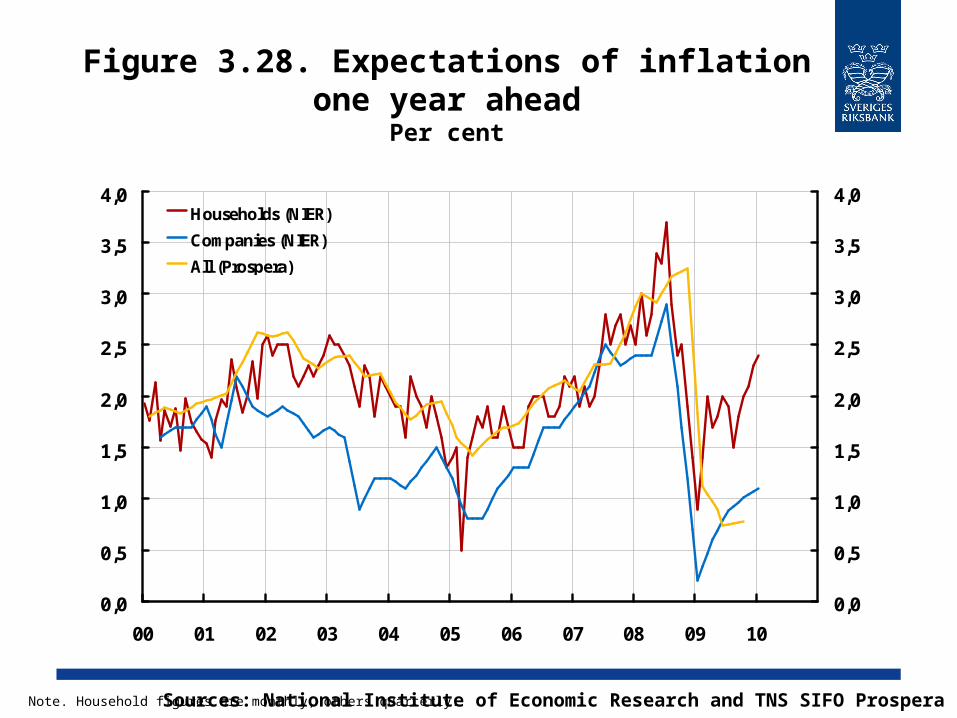
Figure 3.28. Expectations of inflation one year ahead
Per cent
0,0
0,5
1,0
1,5
2,0
2,5
3,0
3,5
4,0
00 01 02 03 04 05 06 07 08 09 10
0,0
0,5
1,0
1,5
2,0
2,5
3,0
3,5
4,0Households (NIER)
Companies (NIER)
All (Prospera)
Sources: National Institute of Economic Research and TNS SIFO ProsperaNote. Household figures are monthly, others quarterly.
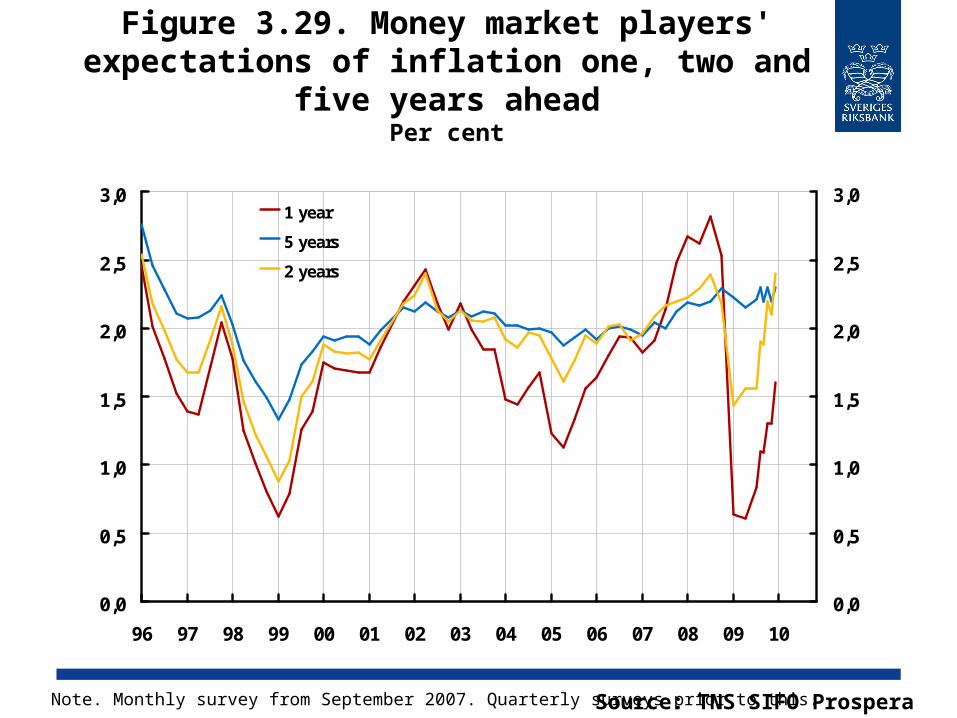
Figure 3.29. Money market players' expectations of inflation one, two and five
years aheadPer cent
0,0
0,5
1,0
1,5
2,0
2,5
3,0
96 97 98 99 00 01 02 03 04 05 06 07 08 09 10
0,0
0,5
1,0
1,5
2,0
2,5
3,01 year
5 years
2 years
Source: TNS SIFO ProsperaNote. Monthly survey from September 2007. Quarterly surveys prior to this.

Figure 3.30. The difference between nominal and real five-year rates (break-
even inflation)Percentage points
0,0
0,5
1,0
1,5
2,0
2,5
3,0
00 01 02 03 04 05 06 07 08 09 10
0,0
0,5
1,0
1,5
2,0
2,5
3,0
Source: The Riksbank
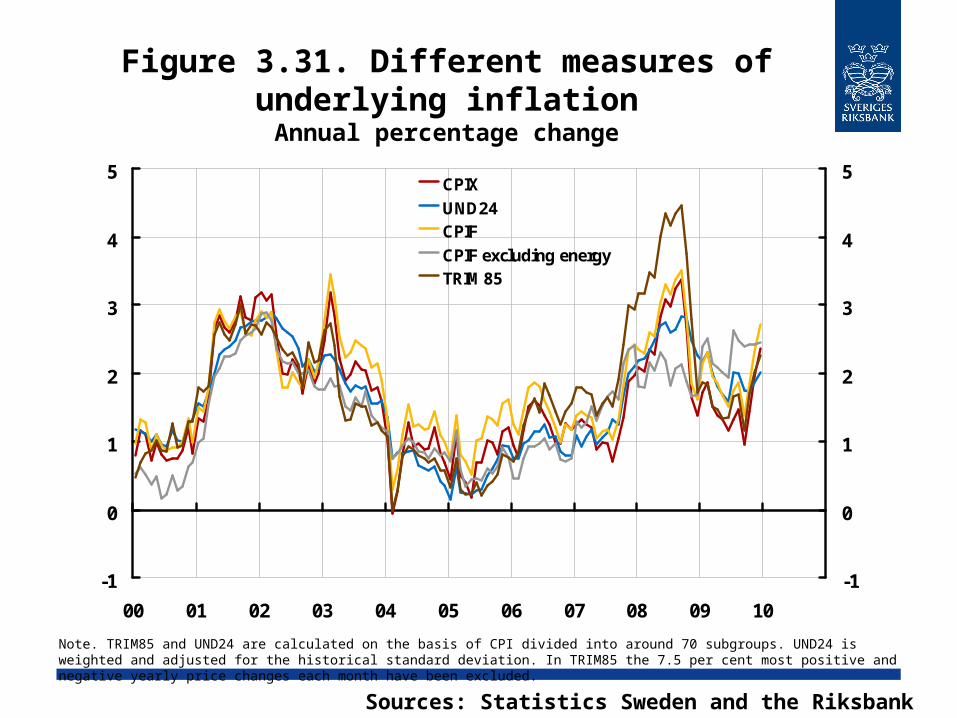
Figure 3.31. Different measures of underlying inflationAnnual percentage change
-1
0
1
2
3
4
5
00 01 02 03 04 05 06 07 08 09 10
-1
0
1
2
3
4
5CPIXUND24CPIFCPIF excluding energyTRIM85
Sources: Statistics Sweden and the Riksbank
Note. TRIM85 and UND24 are calculated on the basis of CPI divided into around 70 subgroups. UND24 is weighted and adjusted for the historical standard deviation. In TRIM85 the 7.5 per cent most positive and negative yearly price changes each month have been excluded.

Figure 3.32. Prices of goods and services in the CPI
Annual percentage change
-3
-2
-1
0
1
2
3
4
00 01 02 03 04 05 06 07 08 09 10
-3
-2
-1
0
1
2
3
4Services (43,5 %)
Goods excluding energy and food (26,3 %)
Source: Statistics SwedenNote. The weight of CPI of the respective components is given in brackets.
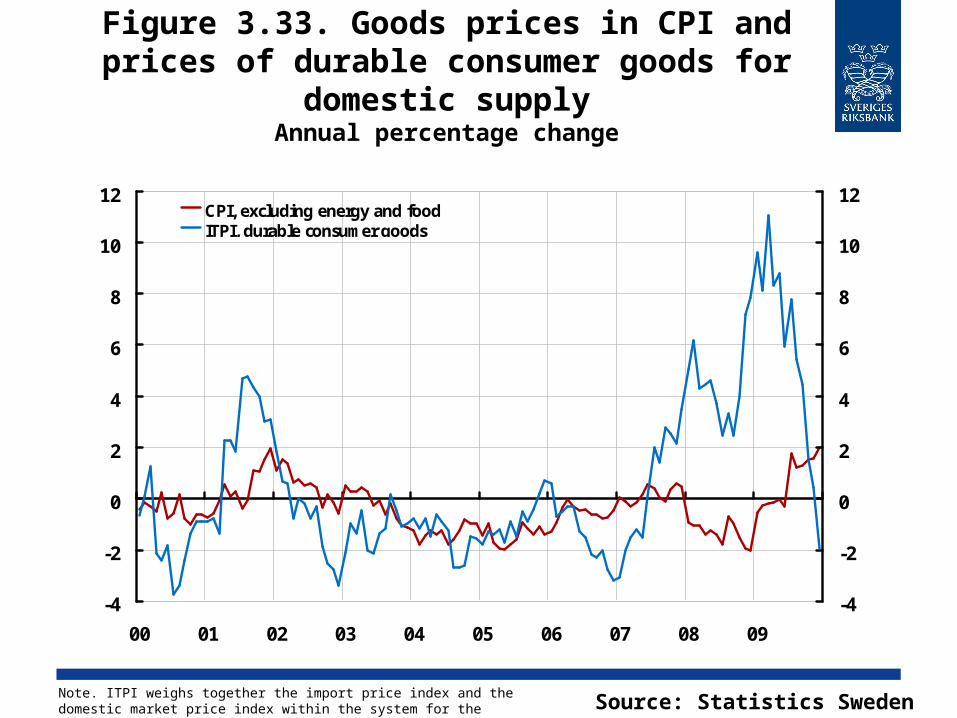
Figure 3.33. Goods prices in CPI and prices of durable consumer goods for domestic
supplyAnnual percentage change
-4
-2
0
2
4
6
8
10
12
00 01 02 03 04 05 06 07 08 09
-4
-2
0
2
4
6
8
10
12CPI, excluding energy and foodITPI, durable consumer goods
Source: Statistics SwedenNote. ITPI weighs together the import price index and the domestic market price index within the system for the producer price index.
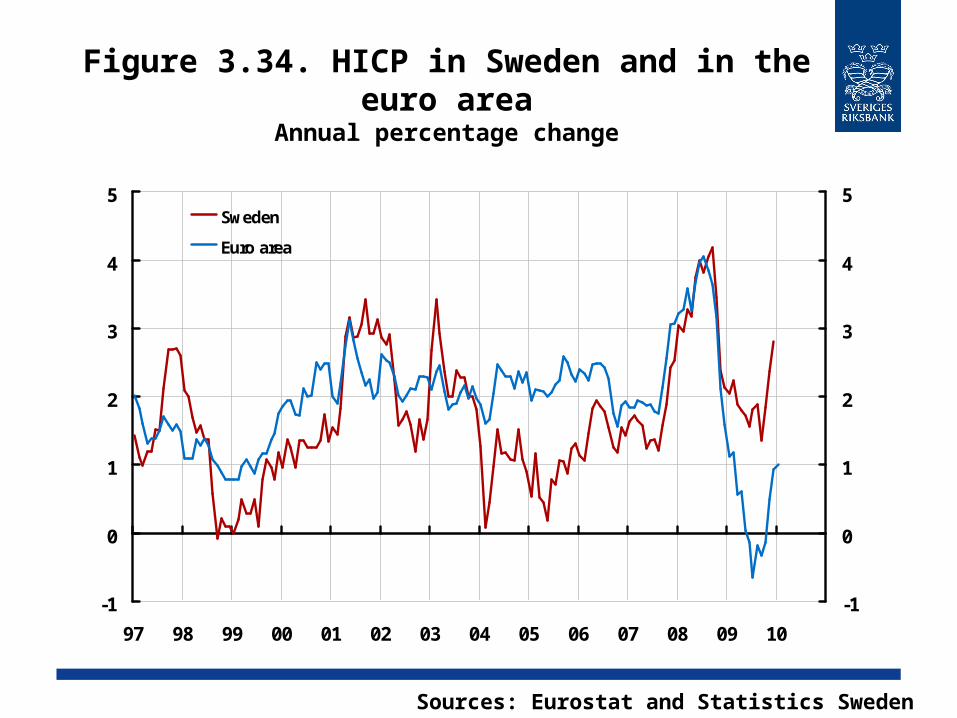
Figure 3.34. HICP in Sweden and in the euro area
Annual percentage change
-1
0
1
2
3
4
5
97 98 99 00 01 02 03 04 05 06 07 08 09 10
-1
0
1
2
3
4
5Sweden
Euro area
Sources: Eurostat and Statistics Sweden

Figure B1. Market agents' expectations of the level of the nominal repo rate in 5 years
Survey responses between June 2005 and end of December 2009, per cent.
0
1
2
3
4
5
6
05 06 07 08 09 10
0
1
2
3
4
5
6
Median
Mean
+- 2 standard deviations
Sources: TNS Prospera AB and the Riksbank
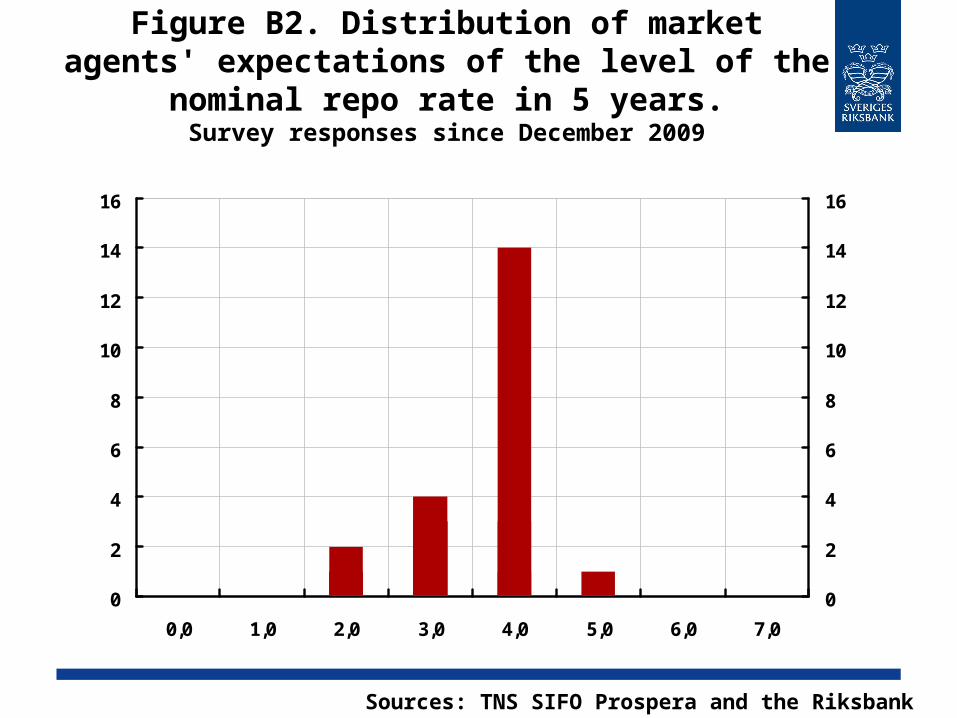
Figure B2. Distribution of market agents' expectations of the level of the nominal
repo rate in 5 years.Survey responses since December 2009
0
2
4
6
8
10
12
14
16
0,0 1,0 2,0 3,0 4,0 5,0 6,0 7,0
0
2
4
6
8
10
12
14
16
Sources: TNS SIFO Prospera and the Riksbank
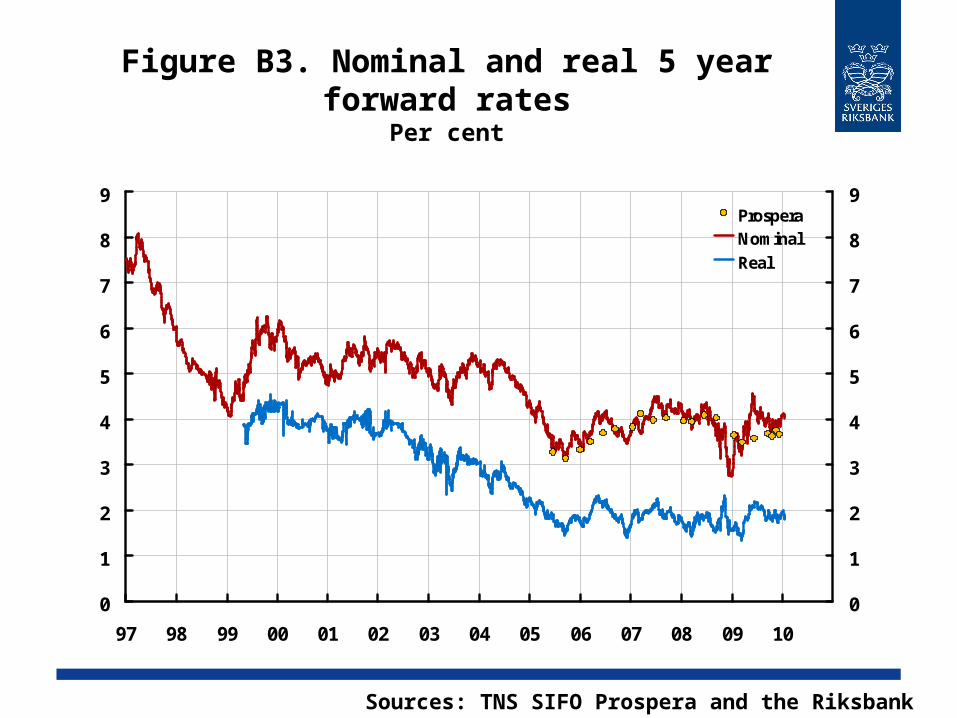
Figure B3. Nominal and real 5 year forward rates
Per cent
0
1
2
3
4
5
6
7
8
9
97 98 99 00 01 02 03 04 05 06 07 08 09 10
0
1
2
3
4
5
6
7
8
9ProsperaNominalReal
Sources: TNS SIFO Prospera and the Riksbank
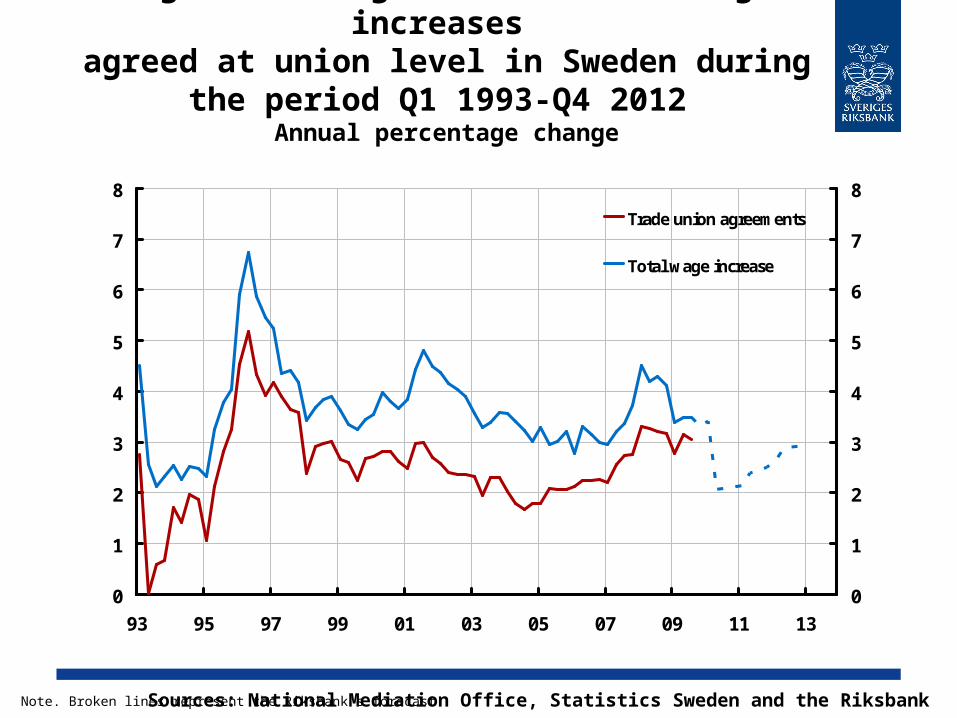
Figure B4. Wage increases and wage increases
agreed at union level in Sweden during the period Q1 1993-Q4 2012
Annual percentage change
Sources: National Mediation Office, Statistics Sweden and the RiksbankNote. Broken lines represent the Riksbank's forecast.
0
1
2
3
4
5
6
7
8
93 95 97 99 01 03 05 07 09 11 13
0
1
2
3
4
5
6
7
8
Trade union agreements
Total wage increase
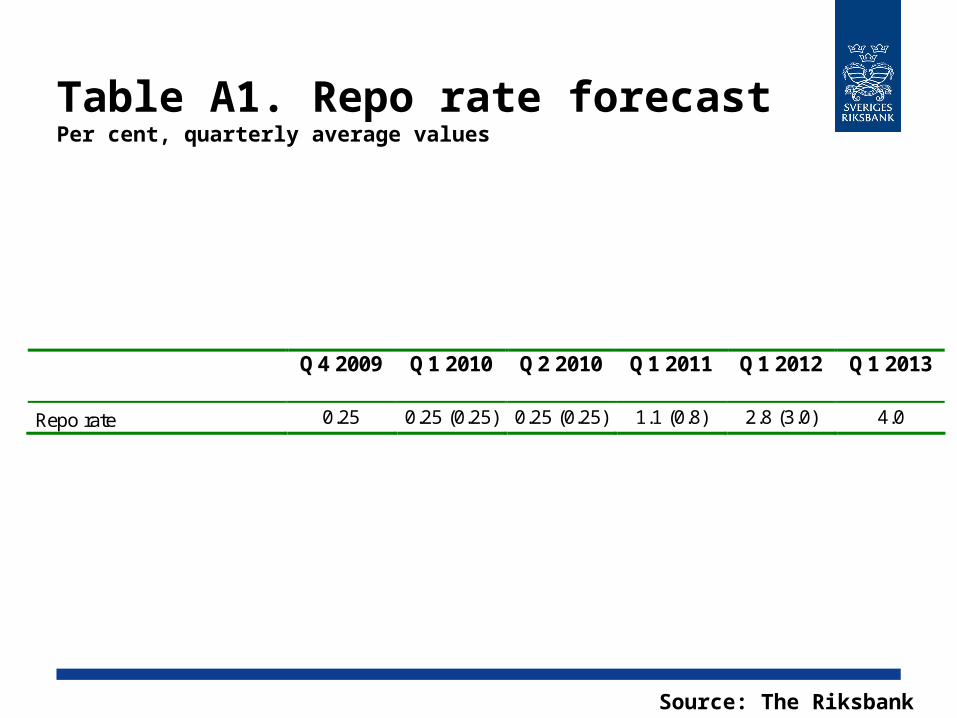
Table A1. Repo rate forecastPer cent, quarterly average values
Source: The Riksbank
Q4 2009 Q1 2010 Q2 2010 Q1 2011 Q1 2012 Q1 2013
Repo rate 0.25 0.25 (0.25) 0.25 (0.25) 1.1 (0.8) 2.8 (3.0) 4.0
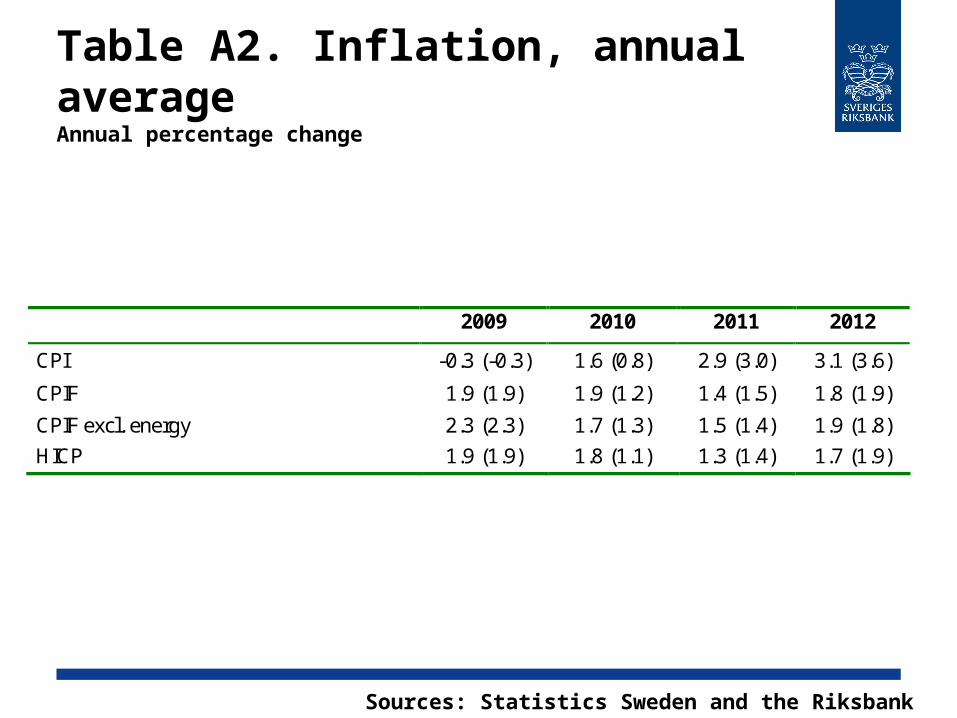
Table A2. Inflation, annual averageAnnual percentage change
Sources: Statistics Sweden and the Riksbank
2009 2010 2011 2012
CPI -0.3 (-0.3) 1.6 (0.8) 2.9 (3.0) 3.1 (3.6)
CPIF 1.9 (1.9) 1.9 (1.2) 1.4 (1.5) 1.8 (1.9)
CPIF excl. energy 2.3 (2.3) 1.7 (1.3) 1.5 (1.4) 1.9 (1.8)
HICP 1.9 (1.9) 1.8 (1.1) 1.3 (1.4) 1.7 (1.9)
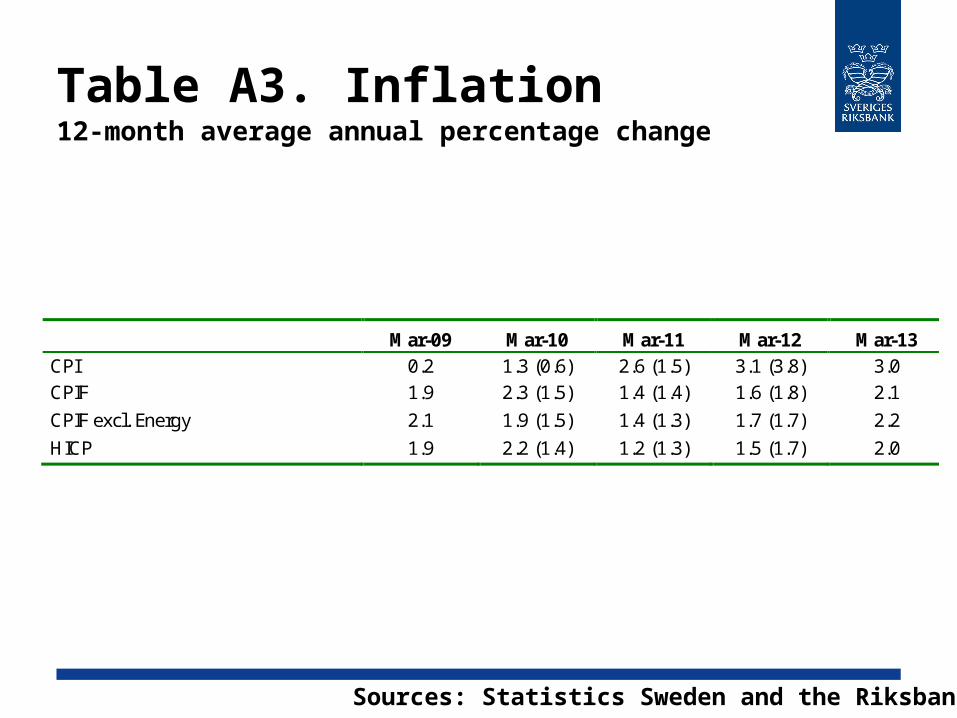
Table A3. Inflation 12-month average annual percentage change
Sources: Statistics Sweden and the Riksbank
Mar-09 Mar-10 Mar-11 Mar-12 Mar-13 CPI 0.2 1.3 (0.6) 2.6 (1.5) 3.1 (3.8) 3.0 CPIF 1.9 2.3 (1.5) 1.4 (1.4) 1.6 (1.8) 2.1
CPIF excl. Energy 2.1 1.9 (1.5) 1.4 (1.3) 1.7 (1.7) 2.2
HICP 1.9 2.2 (1.4) 1.2 (1.3) 1.5 (1.7) 2.0

Table A4. Summary of financial forecasts Annual average, per cent, unless otherwise
specified
Sources: Statistics Sweden and the Riksbank
2009 2010 2011 2012
Repo rate 0.7 (0.7) 0.4 (0.3) 1.8 (1.6) 3.3 (3.6)
10-year rate 3.3 (3.2) 3.6 (3.7) 4.1 (4.2) 4.6 (4.7) Exchange rate, TCW-index, 1992-11-18=100
140.2 (140.0)
131.8 (129.0)
128.2 (127.1)
127.7 (127.3)
General government net lending* -1.5 (-1.9) -1.5 (-2.2) -0.1 (-0.8) 0.7 (0.5)
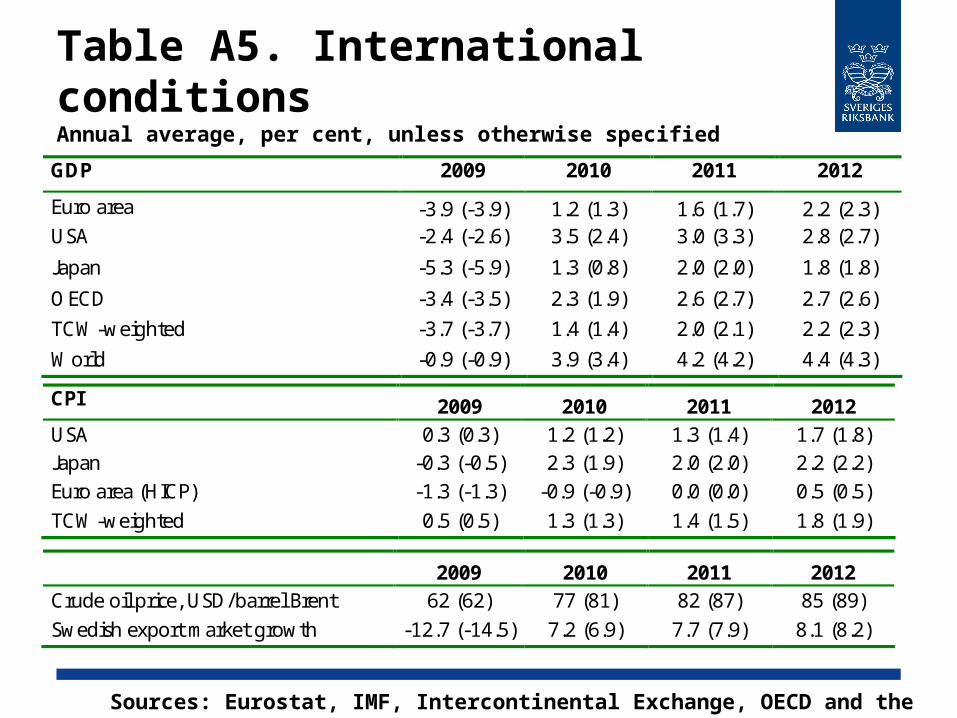
Table A5. International conditions Annual average, per cent, unless otherwise specified
Sources: Eurostat, IMF, Intercontinental Exchange, OECD and the Riksbank
GDP 2009 2010 2011 2012
Euro area -3.9 (-3.9) 1.2 (1.3) 1.6 (1.7) 2.2 (2.3) USA -2.4 (-2.6) 3.5 (2.4) 3.0 (3.3) 2.8 (2.7)
Japan -5.3 (-5.9) 1.3 (0.8) 2.0 (2.0) 1.8 (1.8)
OECD -3.4 (-3.5) 2.3 (1.9) 2.6 (2.7) 2.7 (2.6)
TCW-weighted -3.7 (-3.7) 1.4 (1.4) 2.0 (2.1) 2.2 (2.3)
World -0.9 (-0.9) 3.9 (3.4) 4.2 (4.2) 4.4 (4.3)
CPI 2009 2010 2011 2012 USA 0.3 (0.3) 1.2 (1.2) 1.3 (1.4) 1.7 (1.8) Japan -0.3 (-0.5) 2.3 (1.9) 2.0 (2.0) 2.2 (2.2) Euro area (HICP) -1.3 (-1.3) -0.9 (-0.9) 0.0 (0.0) 0.5 (0.5)
TCW-weighted 0.5 (0.5) 1.3 (1.3) 1.4 (1.5) 1.8 (1.9)
2009 2010 2011 2012 Crude oil price, USD/barrel Brent 62 (62) 77 (81) 82 (87) 85 (89) Swedish export market growth -12.7 (-14.5) 7.2 (6.9) 7.7 (7.9) 8.1 (8.2)
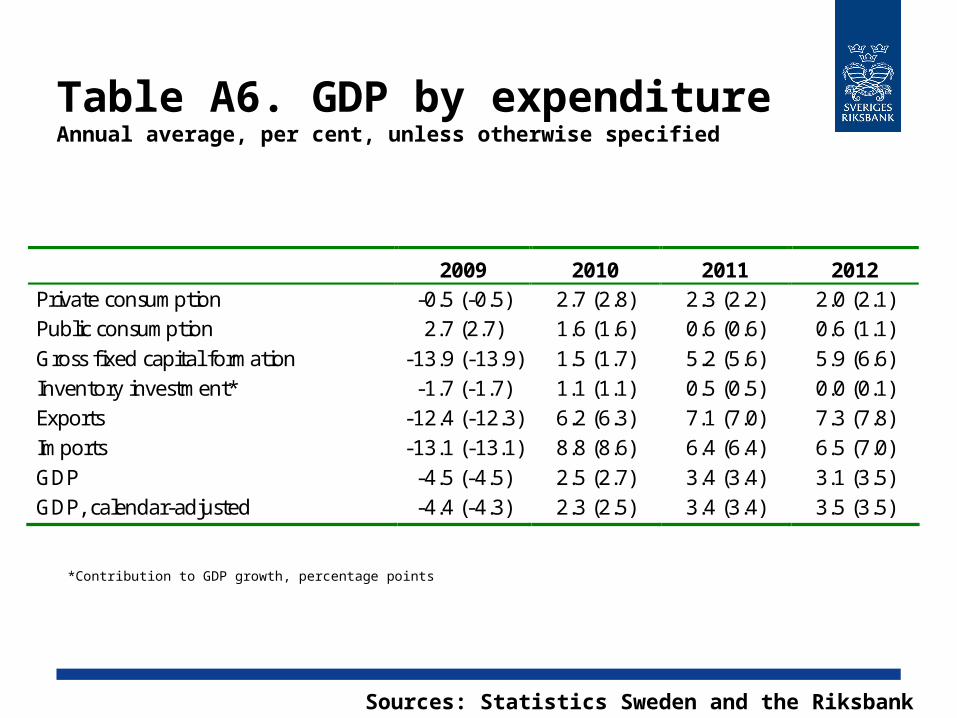
Table A6. GDP by expenditureAnnual average, per cent, unless otherwise specified
Sources: Statistics Sweden and the Riksbank
*Contribution to GDP growth, percentage points
2009 2010 2011 2012 Private consumption -0.5 (-0.5) 2.7 (2.8) 2.3 (2.2) 2.0 (2.1) Public consumption 2.7 (2.7) 1.6 (1.6) 0.6 (0.6) 0.6 (1.1) Gross fixed capital formation -13.9 (-13.9) 1.5 (1.7) 5.2 (5.6) 5.9 (6.6) Inventory investment* -1.7 (-1.7) 1.1 (1.1) 0.5 (0.5) 0.0 (0.1) Exports -12.4 (-12.3) 6.2 (6.3) 7.1 (7.0) 7.3 (7.8) Imports -13.1 (-13.1) 8.8 (8.6) 6.4 (6.4) 6.5 (7.0) GDP -4.5 (-4.5) 2.5 (2.7) 3.4 (3.4) 3.1 (3.5) GDP, calendar-adjusted -4.4 (-4.3) 2.3 (2.5) 3.4 (3.4) 3.5 (3.5)
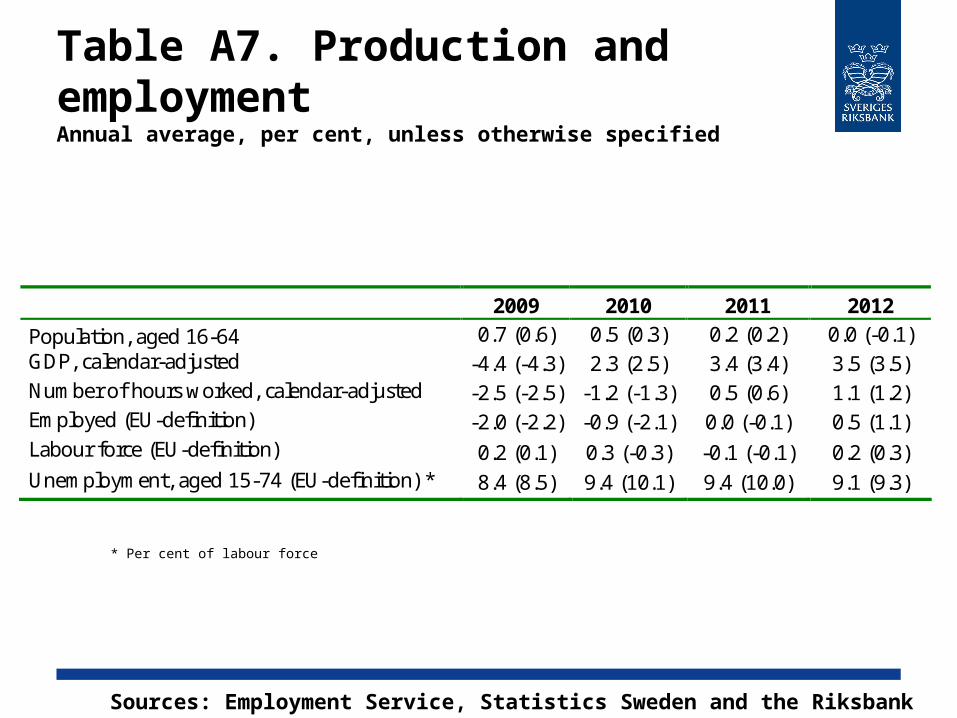
Table A7. Production and employment Annual average, per cent, unless otherwise specified
Sources: Employment Service, Statistics Sweden and the Riksbank
* Per cent of labour force
2009 2010 2011 2012
Population, aged 16-64 0.7 (0.6) 0.5 (0.3) 0.2 (0.2) 0.0 (-0.1) GDP, calendar-adjusted -4.4 (-4.3) 2.3 (2.5) 3.4 (3.4) 3.5 (3.5) Number of hours worked, calendar-adjusted -2.5 (-2.5) -1.2 (-1.3) 0.5 (0.6) 1.1 (1.2) Employed (EU-definition) -2.0 (-2.2) -0.9 (-2.1) 0.0 (-0.1) 0.5 (1.1) Labour force (EU-definition) 0.2 (0.1) 0.3 (-0.3) -0.1 (-0.1) 0.2 (0.3) Unemployment, aged 15-74 (EU-definition) * 8.4 (8.5) 9.4 (10.1) 9.4 (10.0) 9.1 (9.3)
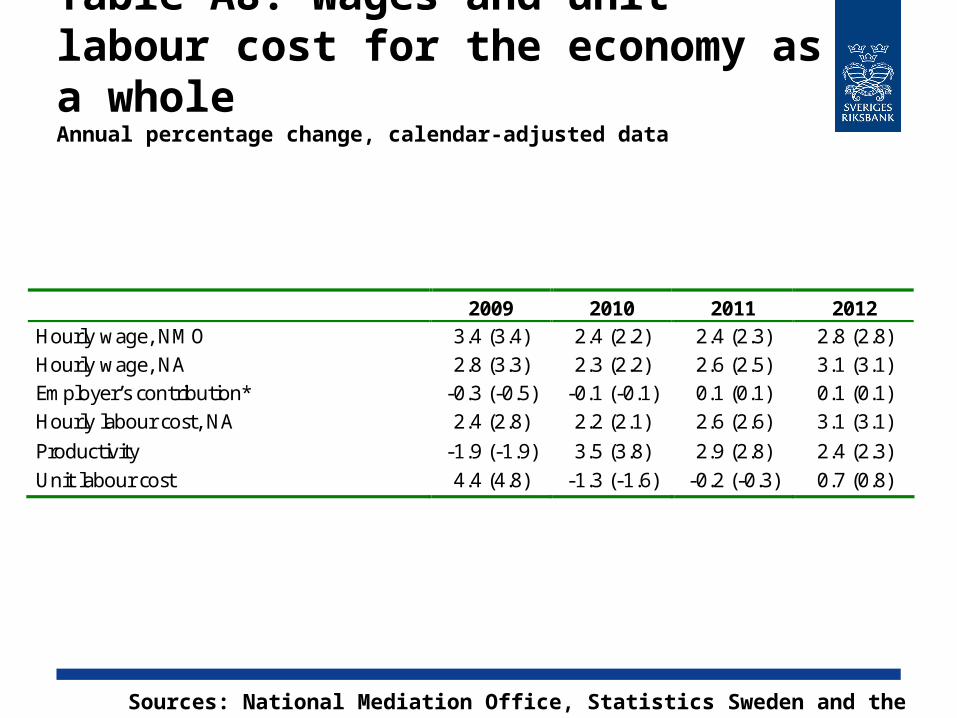
Table A8. Wages and unit labour cost for the economy as a wholeAnnual percentage change, calendar-adjusted data
Sources: National Mediation Office, Statistics Sweden and the Riksbank
2009 2010 2011 2012 Hourly wage, NMO 3.4 (3.4) 2.4 (2.2) 2.4 (2.3) 2.8 (2.8) Hourly wage, NA 2.8 (3.3) 2.3 (2.2) 2.6 (2.5) 3.1 (3.1) Employer’s contribution* -0.3 (-0.5) -0.1 (-0.1) 0.1 (0.1) 0.1 (0.1) Hourly labour cost, NA 2.4 (2.8) 2.2 (2.1) 2.6 (2.6) 3.1 (3.1)
Productivity -1.9 (-1.9) 3.5 (3.8) 2.9 (2.8) 2.4 (2.3) Unit labour cost 4.4 (4.8) -1.3 (-1.6) -0.2 (-0.3) 0.7 (0.8)
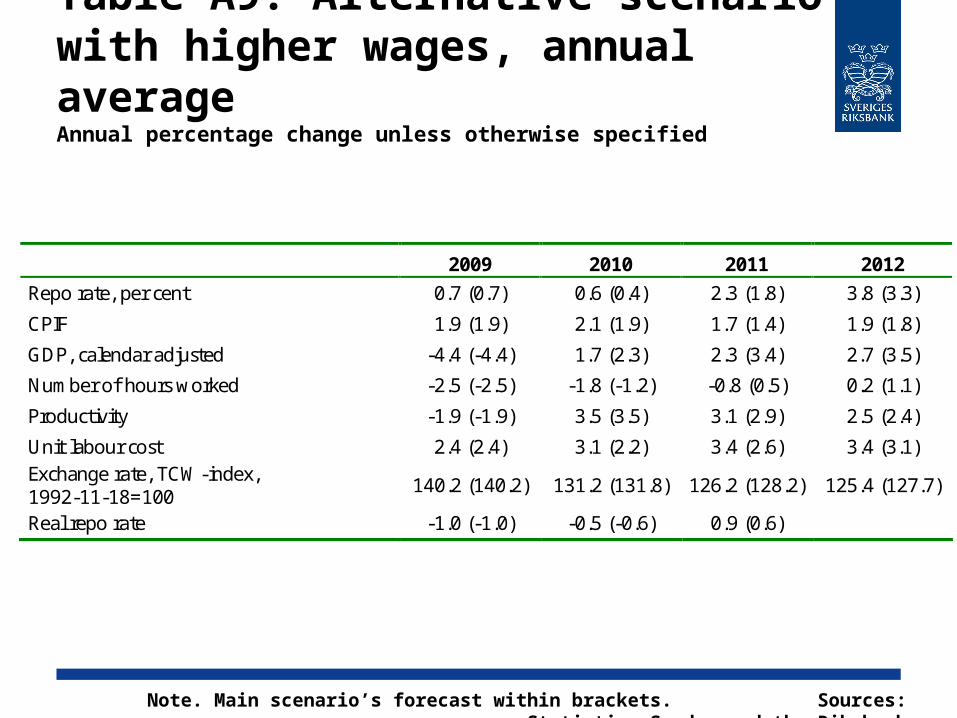
Table A9. Alternative scenario with higher wages, annual averageAnnual percentage change unless otherwise specified
Note. Main scenario’s forecast within brackets. Sources: Statistics Sweden and the Riksbank
2009 2010 2011 2012
Repo rate, per cent 0.7 (0.7) 0.6 (0.4) 2.3 (1.8) 3.8 (3.3)
CPIF 1.9 (1.9) 2.1 (1.9) 1.7 (1.4) 1.9 (1.8)
GDP, calendar adjusted -4.4 (-4.4) 1.7 (2.3) 2.3 (3.4) 2.7 (3.5)
Number of hours worked -2.5 (-2.5) -1.8 (-1.2) -0.8 (0.5) 0.2 (1.1)
Productivity -1.9 (-1.9) 3.5 (3.5) 3.1 (2.9) 2.5 (2.4)
Unit labour cost 2.4 (2.4) 3.1 (2.2) 3.4 (2.6) 3.4 (3.1) Exchange rate, TCW-index, 1992-11-18=100
140.2 (140.2) 131.2 (131.8) 126.2 (128.2) 125.4 (127.7)
Real repo rate -1.0 (-1.0) -0.5 (-0.6) 0.9 (0.6)
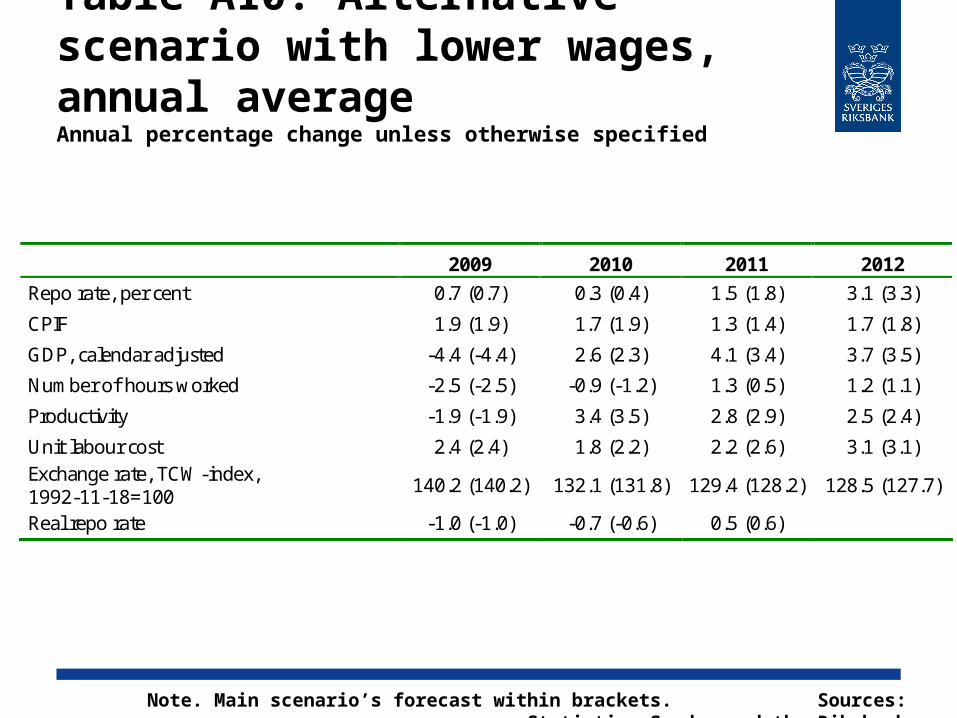
Table A10. Alternative scenario with lower wages, annual averageAnnual percentage change unless otherwise specified
Note. Main scenario’s forecast within brackets. Sources: Statistics Sweden and the Riksbank
2009 2010 2011 2012
Repo rate, per cent 0.7 (0.7) 0.3 (0.4) 1.5 (1.8) 3.1 (3.3)
CPIF 1.9 (1.9) 1.7 (1.9) 1.3 (1.4) 1.7 (1.8)
GDP, calendar adjusted -4.4 (-4.4) 2.6 (2.3) 4.1 (3.4) 3.7 (3.5)
Number of hours worked -2.5 (-2.5) -0.9 (-1.2) 1.3 (0.5) 1.2 (1.1)
Productivity -1.9 (-1.9) 3.4 (3.5) 2.8 (2.9) 2.5 (2.4)
Unit labour cost 2.4 (2.4) 1.8 (2.2) 2.2 (2.6) 3.1 (3.1) Exchange rate, TCW-index, 1992-11-18=100
140.2 (140.2) 132.1 (131.8) 129.4 (128.2) 128.5 (127.7)
Real repo rate -1.0 (-1.0) -0.7 (-0.6) 0.5 (0.6)
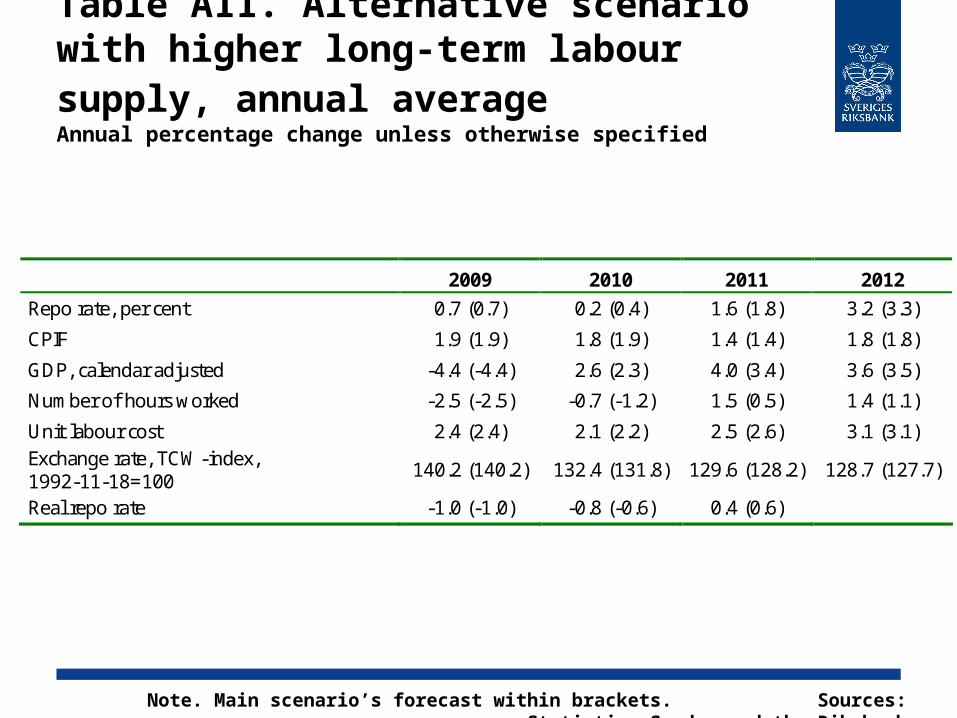
Table A11. Alternative scenario with higher long-term labour supply, annual averageAnnual percentage change unless otherwise specified
Note. Main scenario’s forecast within brackets. Sources: Statistics Sweden and the Riksbank
2009 2010 2011 2012
Repo rate, per cent 0.7 (0.7) 0.2 (0.4) 1.6 (1.8) 3.2 (3.3)
CPIF 1.9 (1.9) 1.8 (1.9) 1.4 (1.4) 1.8 (1.8)
GDP, calendar adjusted -4.4 (-4.4) 2.6 (2.3) 4.0 (3.4) 3.6 (3.5)
Number of hours worked -2.5 (-2.5) -0.7 (-1.2) 1.5 (0.5) 1.4 (1.1)
Unit labour cost 2.4 (2.4) 2.1 (2.2) 2.5 (2.6) 3.1 (3.1) Exchange rate, TCW-index, 1992-11-18=100
140.2 (140.2) 132.4 (131.8) 129.6 (128.2) 128.7 (127.7)
Real repo rate -1.0 (-1.0) -0.8 (-0.6) 0.4 (0.6)

Table A12. Alternative scenario with weaker exchange rate, annual averageAnnual percentage change unless otherwise specified
Note. Main scenario’s forecast within brackets. Sources: Statistics Sweden and the Riksbank
2009 2010 2011 2012
Repo rate, per cent 0.7 (0.7) 0.7 (0.4) 2.3 (1.8) 3.6 (3.3)
CPIF 1.9 (1.9) 2.4 (1.9) 2.3 (1.4) 2.1 (1.8)
GDP, calendar adjusted -4.4 (-4.4) 2.6 (2.3) 3.8 (3.4) 3.6 (3.5)
Number of hours worked -2.5 (-2.5) -0.9 (-1.2) 0.8 (0.5) 1.0 (1.1)
Unit labour cost 2.4 (2.4) 2.3 (2.2) 3.3 (2.6) 3.2 (3.1) Exchange rate, TCW-index, 1992-11-18=100
140.2 (140.2) 138.2 (131.8) 135.5 (128.2) 132.6 (127.7)
Real repo rate -1.0 (-1.0) -0.8 (-0.6) 0.7 (0.6)

Table A13. Alternative scenario with higher repo rate, annual averageAnnual percentage change unless otherwise specified
Note. Main scenario’s forecast within brackets. Sources: Statistics Sweden and the Riksbank
2009 2010 2011 2012
Repo rate, per cent 0.7 (0.7) 0.6 (0.4) 1.9 (1.8) 3.3 (3.3)
CPIF 1.9 (1.9) 1.8 (1.9) 1.1 (1.4) 1.6 (1.8)
GDP, calendar adjusted -4.4 (-4.4) 2.2 (2.3) 3.3 (3.4) 3.6 (3.5)
Labour market gap, per cent -0.1 (-0.1) -1.7 (-1.6) -1.7 (-1.4) -1.0 (-0.9)
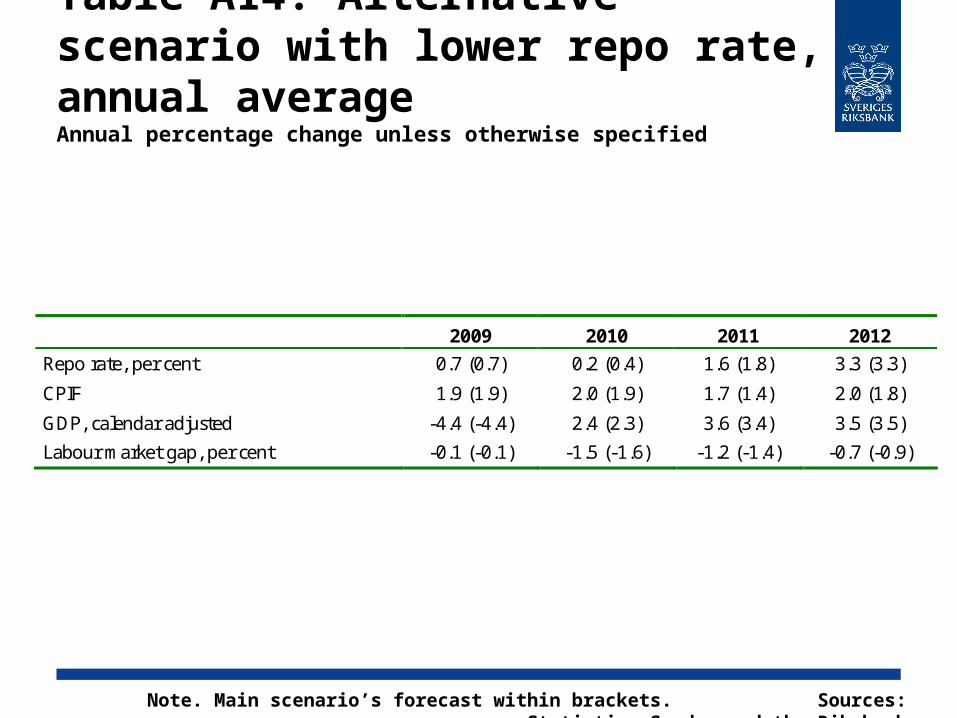
Table A14. Alternative scenario with lower repo rate, annual averageAnnual percentage change unless otherwise specified
Note. Main scenario’s forecast within brackets. Sources: Statistics Sweden and the Riksbank
2009 2010 2011 2012
Repo rate, per cent 0.7 (0.7) 0.2 (0.4) 1.6 (1.8) 3.3 (3.3)
CPIF 1.9 (1.9) 2.0 (1.9) 1.7 (1.4) 2.0 (1.8)
GDP, calendar adjusted -4.4 (-4.4) 2.4 (2.3) 3.6 (3.4) 3.5 (3.5)
Labour market gap, per cent -0.1 (-0.1) -1.5 (-1.6) -1.2 (-1.4) -0.7 (-0.9)
![Cecilia Skingsley: Should the Riksbank issue e-krona? · 1 [10] Should the Riksbank issue e-krona?1 Should the Riksbank issue electronic means of payment in the same way as we now](https://img.pdfslide.net/doc/110x75/5ec82f088662860afc5de461/cecilia-skingsley-should-the-riksbank-issue-e-krona-1-10-should-the-riksbank.jpg)