Embed Size (px)
Citation preview
MPS Research Unit CHEBS Workshop - April 2003 1
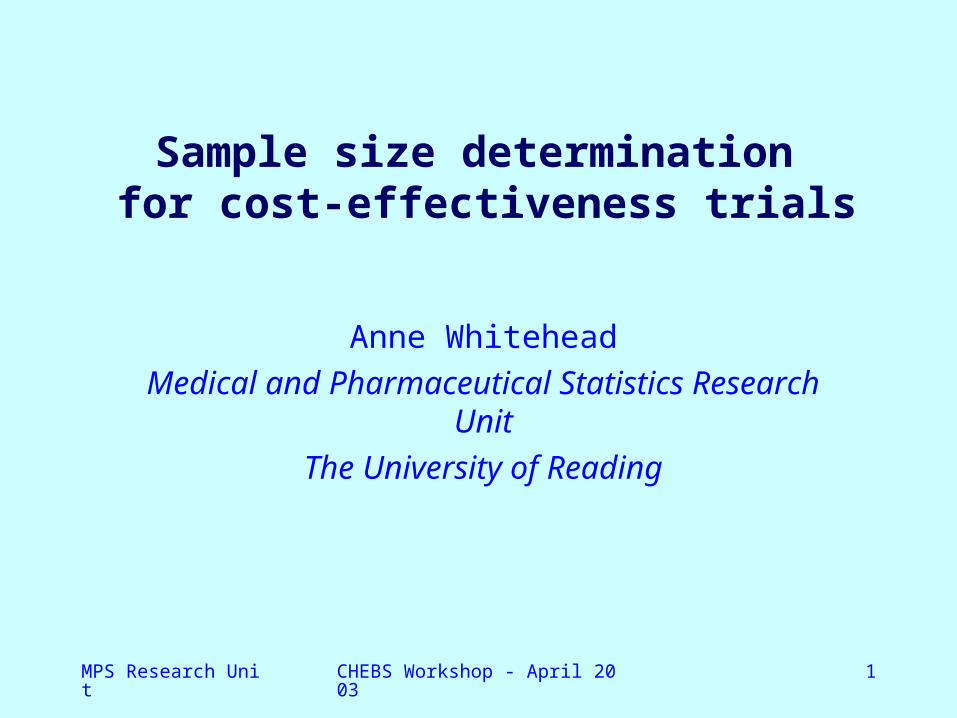
Anne Whitehead
Medical and Pharmaceutical Statistics Research Unit
The University of Reading
Sample size determination for cost-effectiveness trials
MPS Research Unit CHEBS Workshop - April 2003 2
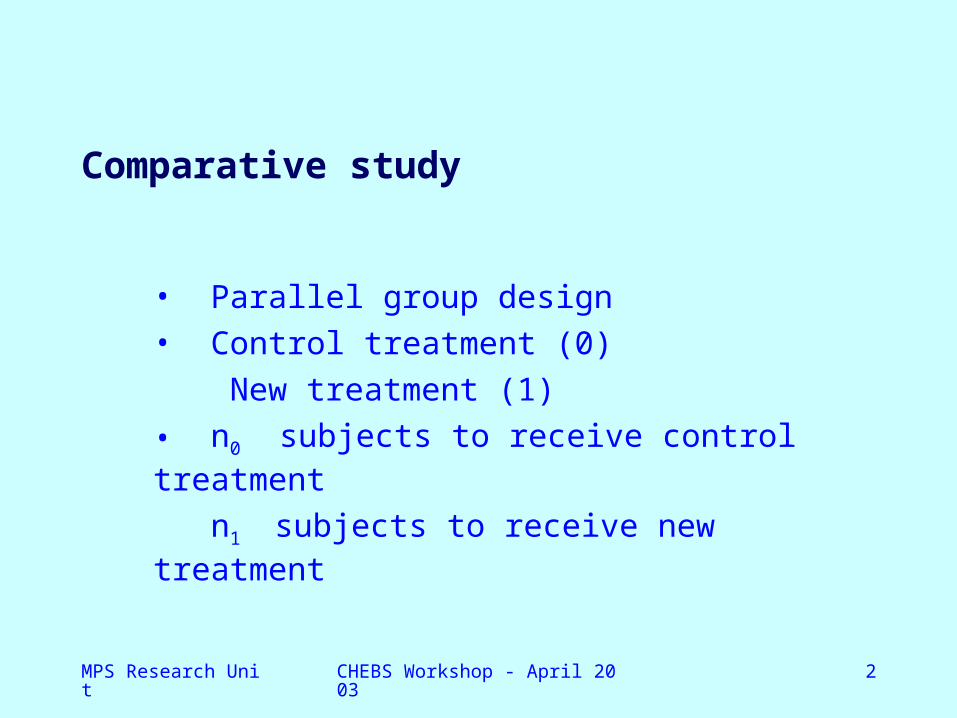
Comparative study
• Parallel group design
• Control treatment (0)
New treatment (1)
• n0 subjects to receive control treatment
n1 subjects to receive new treatment
MPS Research Unit CHEBS Workshop - April 2003 3
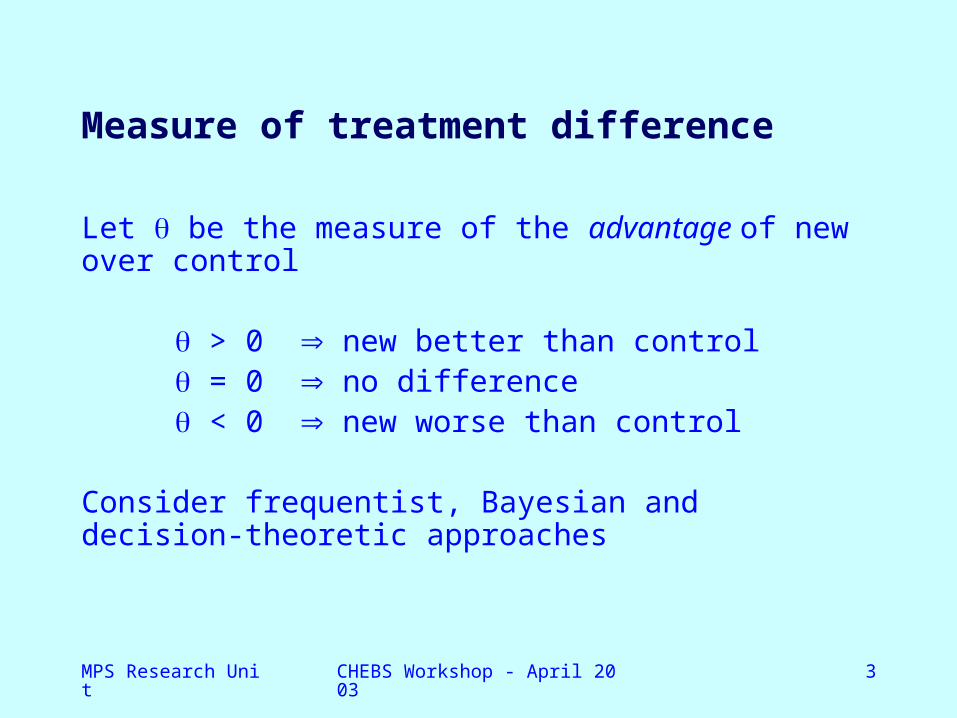
Measure of treatment difference
Let be the measure of the advantage of new over control
> 0 new better than control = 0 no difference < 0 new worse than control
Consider frequentist, Bayesian and decision-theoretic approaches
MPS Research Unit CHEBS Workshop - April 2003 4
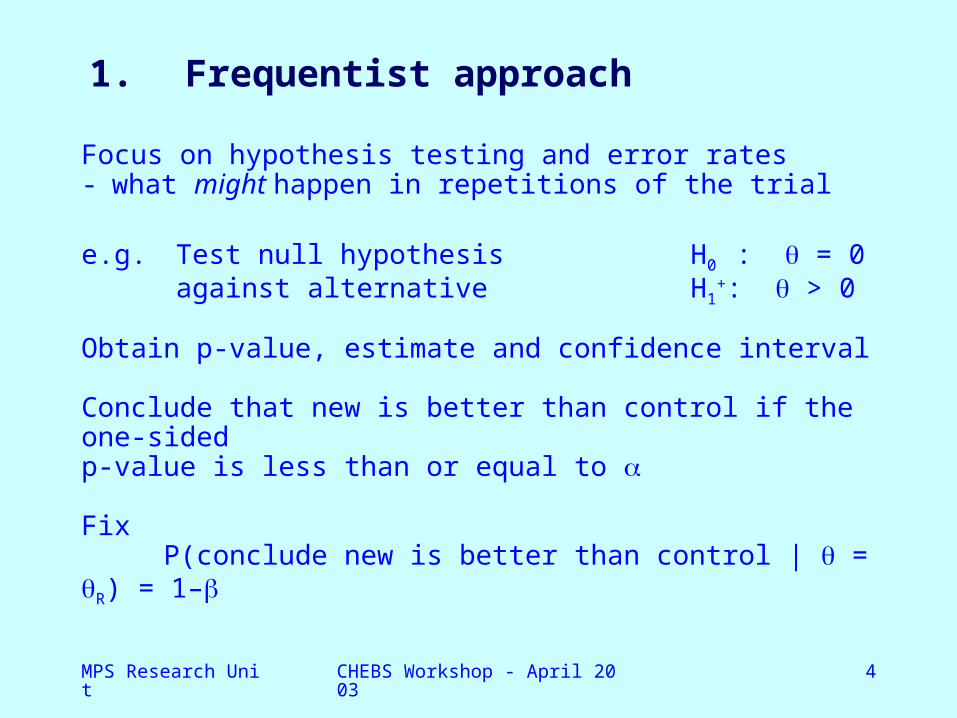
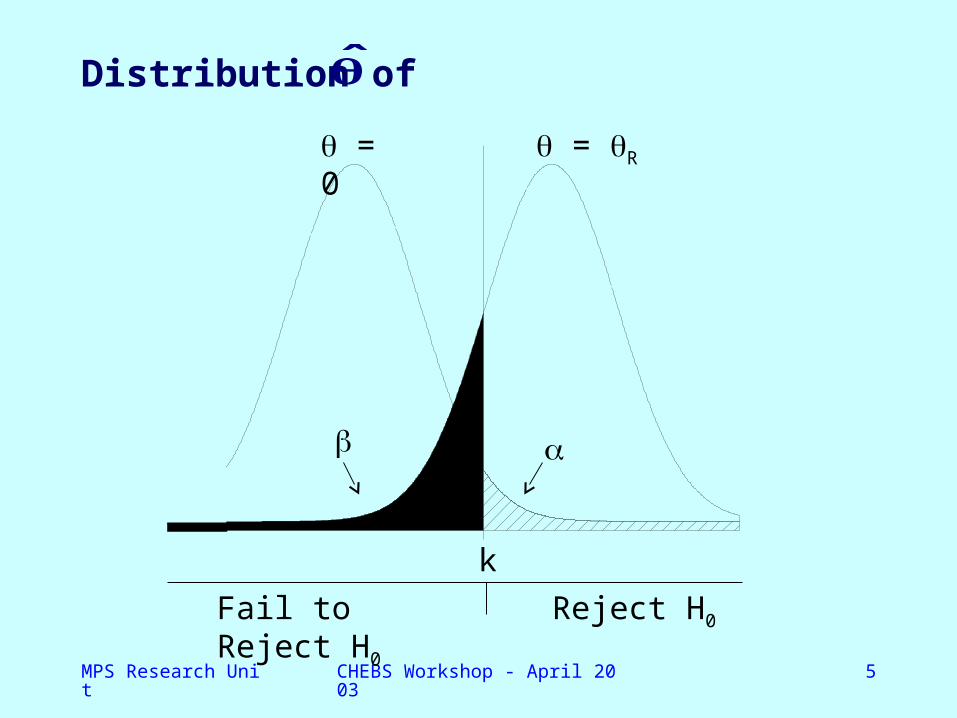
1. Frequentist approach
Focus on hypothesis testing and error rates- what might happen in repetitions of the trial
e.g. Test null hypothesis H0 : = 0against alternative H1
+: > 0
Obtain p-value, estimate and confidence interval
Conclude that new is better than control if the one-sided p-value is less than or equal to
Fix P(conclude new is better than control | = R) = 1–
MPS Research Unit CHEBS Workshop - April 2003 5
Distribution of
= 0 = R
k
Fail to Reject H0 Reject H0
MPS Research Unit CHEBS Workshop - April 2003 6
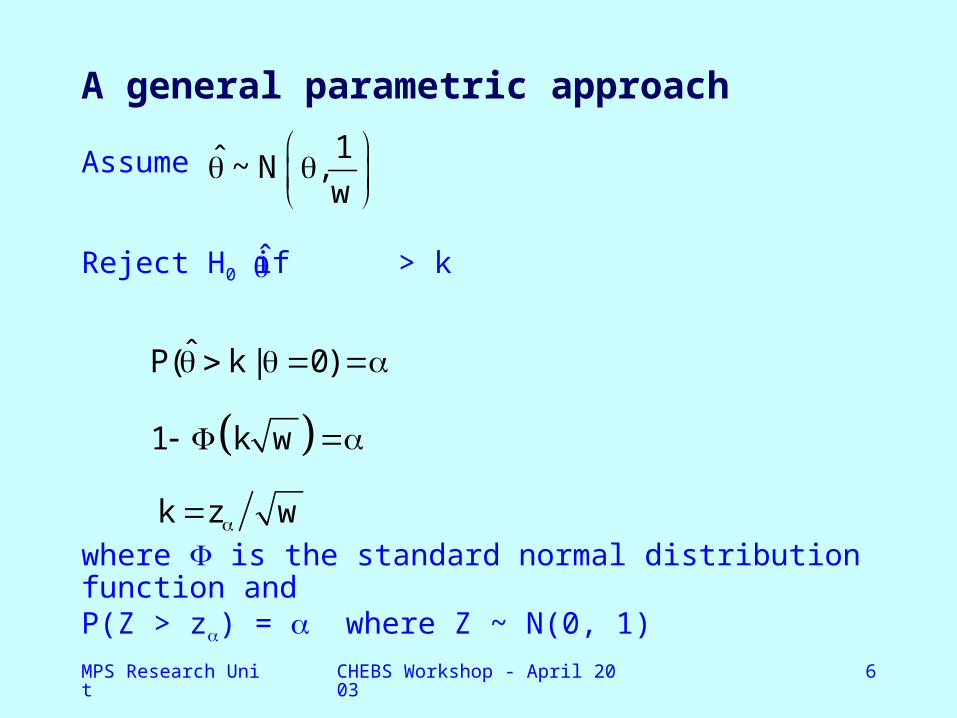
A general parametric approach
Assume
Reject H0 if > k
where is the standard normal distribution function andP(Z > z) = where Z ~ N(0, 1)
1ˆ ~ N ,w
ˆP( k | 0)
1 k w
k z w

MPS Research Unit CHEBS Workshop - April 2003 7
Require
RˆP( k | ) 1
R1 (k ) w 1
R1 k w
R( k) w z
2
R
z zw
MPS Research Unit CHEBS Workshop - April 2003 8
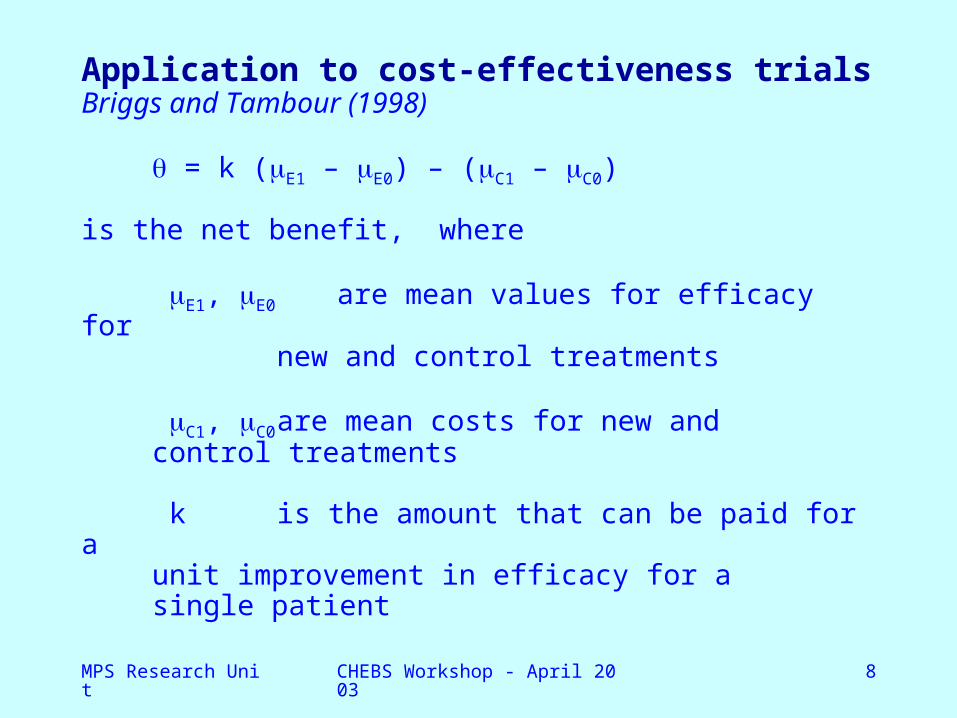
Application to cost-effectiveness trialsBriggs and Tambour (1998)
= k (E1 – E0) – (C1 – C0)
is the net benefit, where
E1, E0 are mean values for efficacy for new and control treatments
C1, C0 are mean costs for new andcontrol treatments
k is the amount that can be paid for aunit improvement in efficacy for asingle patient

MPS Research Unit CHEBS Workshop - April 2003 9
E1 E0 C1 C0
ˆ k(x x ) (x x ) 22
EE 01E1 E0
1 0
22CC 01
C1 C01 0
var(x x )n n
var(x x )n n
E1 E0 C1 C0
E1 E0 C1 C0
cov (x x ),(x x )
var(x x )var(x x )
2
R
z z1w
ˆvar( )
Set
and solve for n0 and n1
MPS Research Unit CHEBS Workshop - April 2003 10
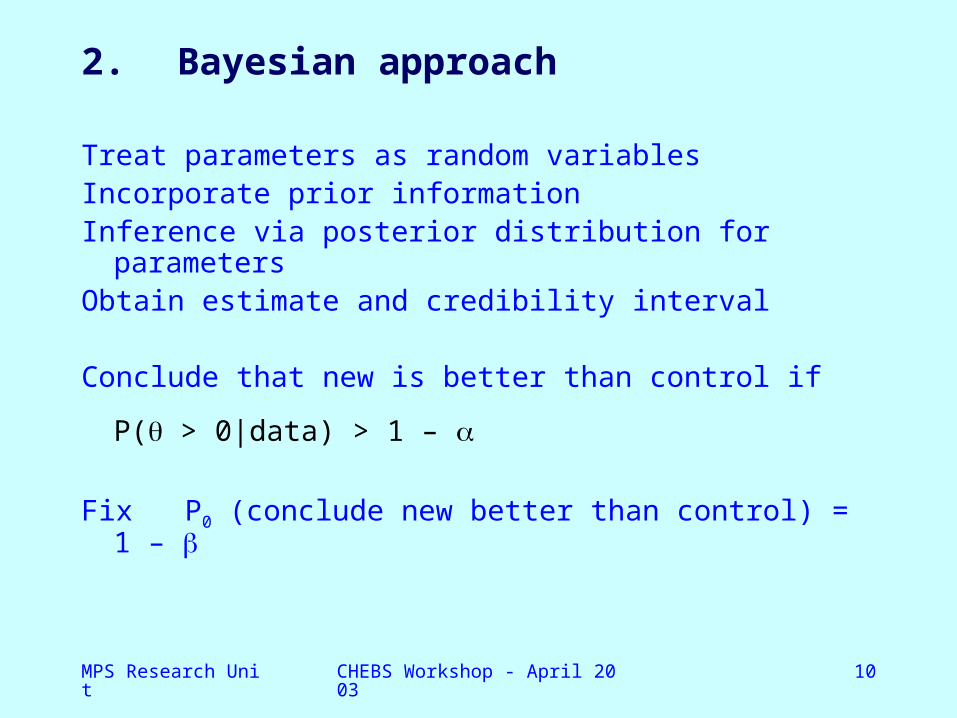
2. Bayesian approach
Treat parameters as random variablesIncorporate prior informationInference via posterior distribution for parametersObtain estimate and credibility interval
Conclude that new is better than control if
P( > 0|data) > 1 –
Fix P0 (conclude new better than control) = 1 –
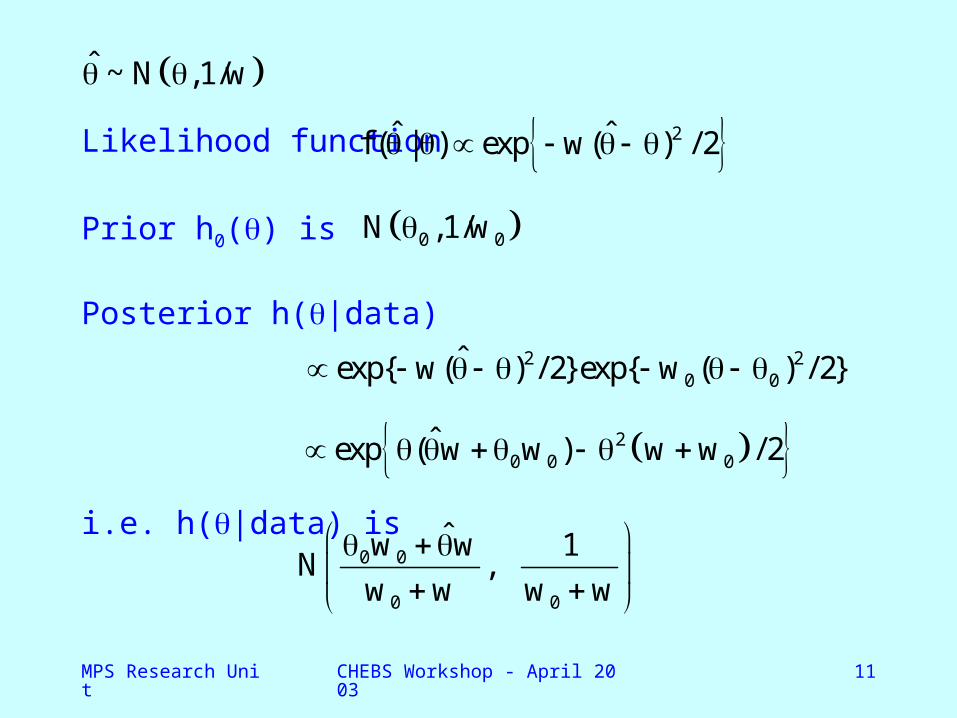
MPS Research Unit CHEBS Workshop - April 2003 11
Likelihood function
Prior h0() is
Posterior h(|data)
i.e. h(|data) is
2ˆ ˆf ( | ) exp w( ) / 2
0 0N ,1/w
2 20 0
ˆexp{ w( ) / 2}exp{ w ( ) / 2}
20 0 0
ˆexp ( w w ) w w / 2
ˆ ~ N ,1/w
0 0
0 0
ˆw w 1N ,
w w w w
MPS Research Unit CHEBS Workshop - April 2003 12
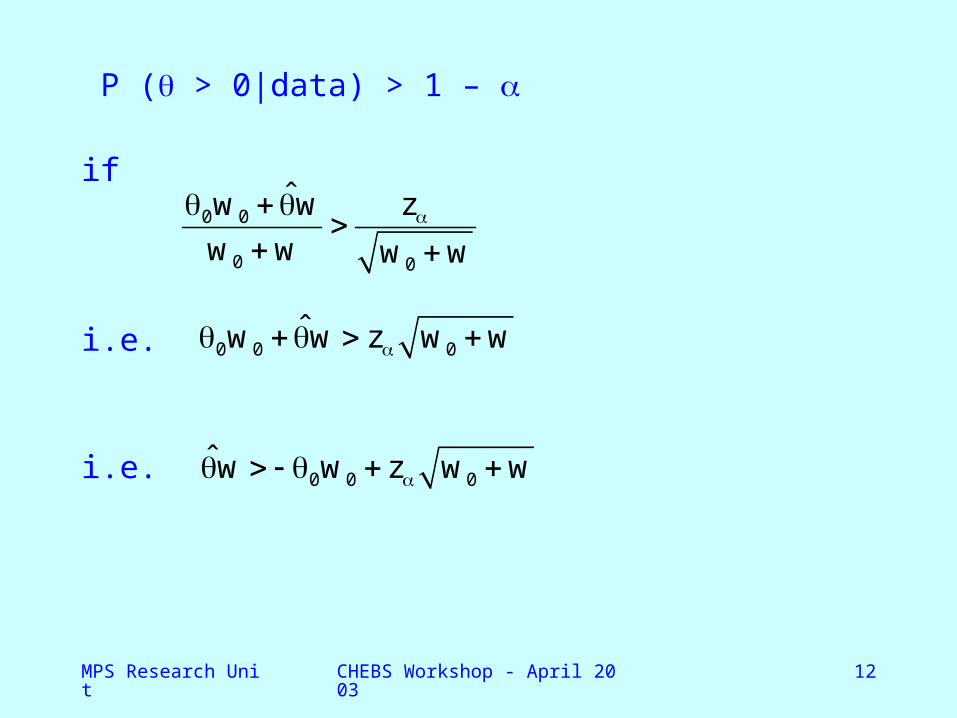
P ( > 0|data) > 1 –
if
i.e.
i.e.
0 0
0 0
ˆw w z
w w w w
0 0 0ˆw w z w w
0 0 0ˆw w z w w

MPS Research Unit CHEBS Workshop - April 2003 13
Prior to conducting the study,
so
1ˆ ~ N ,w
00
1~ N ,
w
00
1 1ˆ ~ ,w w
2
00
wˆw ~ w, ww
MPS Research Unit CHEBS Workshop - April 2003 14
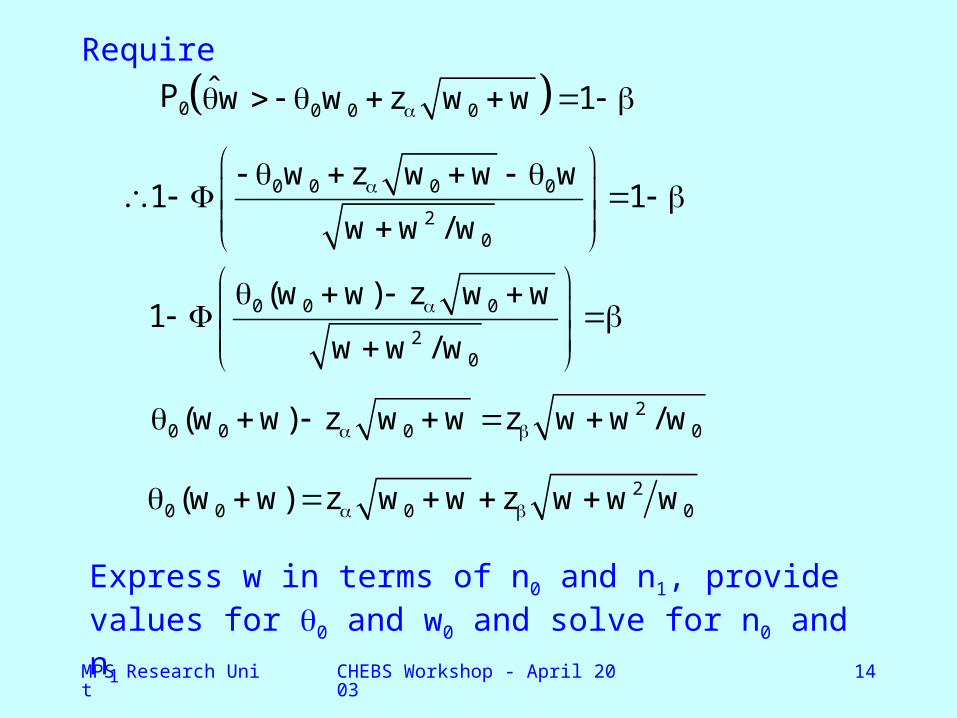
Require
P0 0 0 0ˆw w z w w 1
0 0 0 0
20
w z w w w1 1
w w / w
0 0 0
20
(w w) z w w1
w w / w
20 0 0 0(w w) z w w z w w / w
20 0 0 0(w w) z w w z w w w
Express w in terms of n0 and n1, provide values for 0 and w0 and solve for n0 and n1
MPS Research Unit CHEBS Workshop - April 2003 15
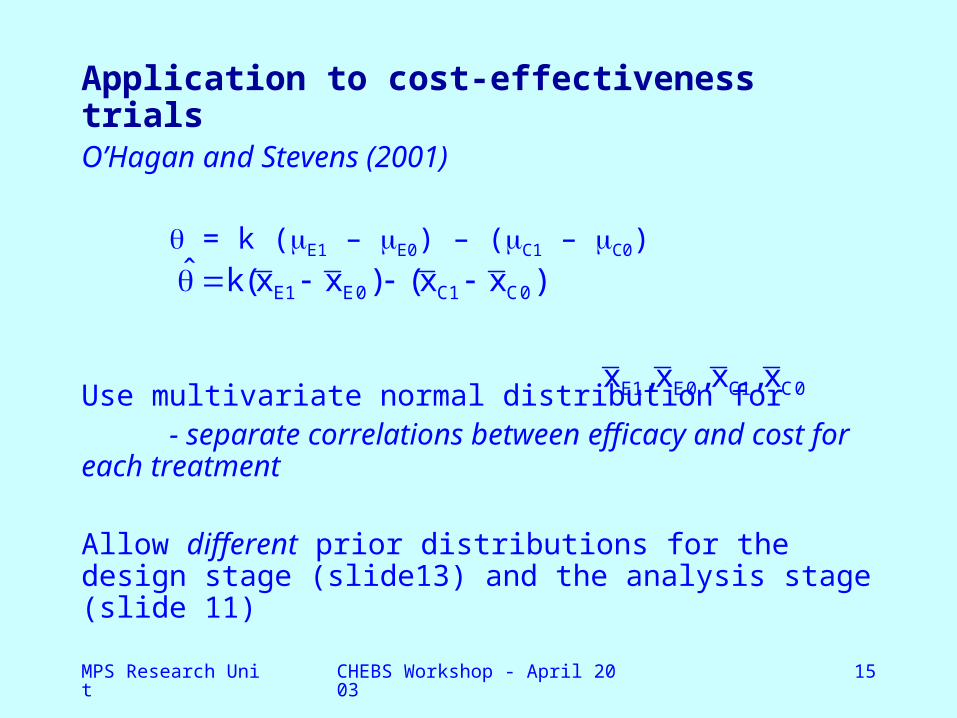
Application to cost-effectiveness trials O’Hagan and Stevens (2001)
= k (E1 – E0) – (C1 – C0)
Use multivariate normal distribution for- separate correlations between efficacy and cost for each treatment
Allow different prior distributions for the design stage (slide13) and the analysis stage (slide 11)
E1 E0 C1 C0ˆ k(x x ) (x x )
E1 E0 C1 C0x ,x ,x ,x
MPS Research Unit CHEBS Workshop - April 2003 16
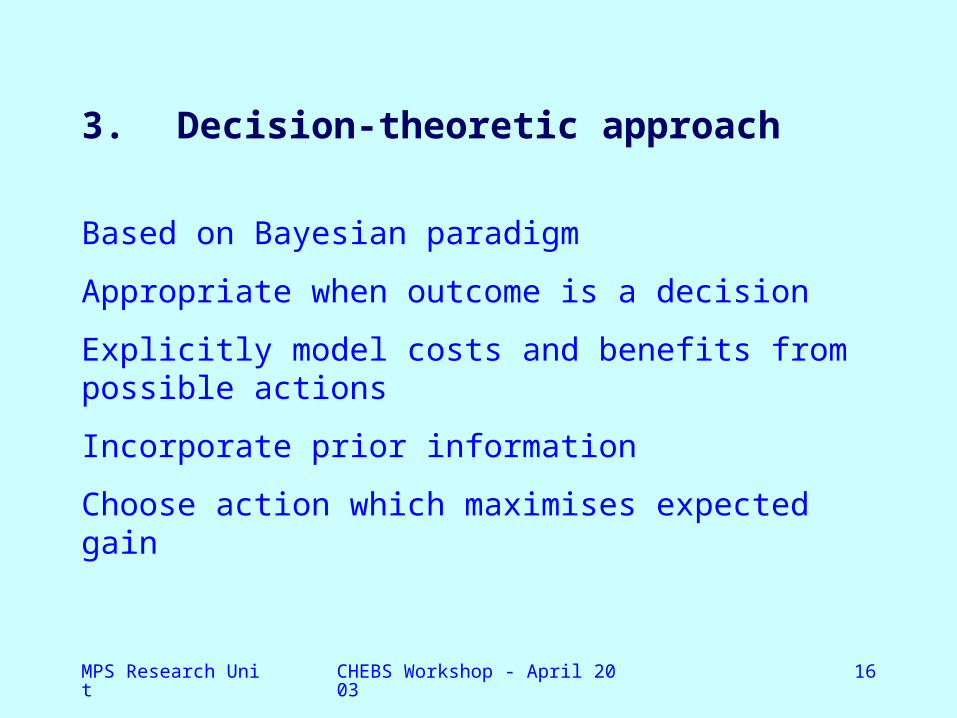
3. Decision-theoretic approach
Based on Bayesian paradigm
Appropriate when outcome is a decision
Explicitly model costs and benefits from possible actions
Incorporate prior information
Choose action which maximises expected gain
MPS Research Unit CHEBS Workshop - April 2003 17
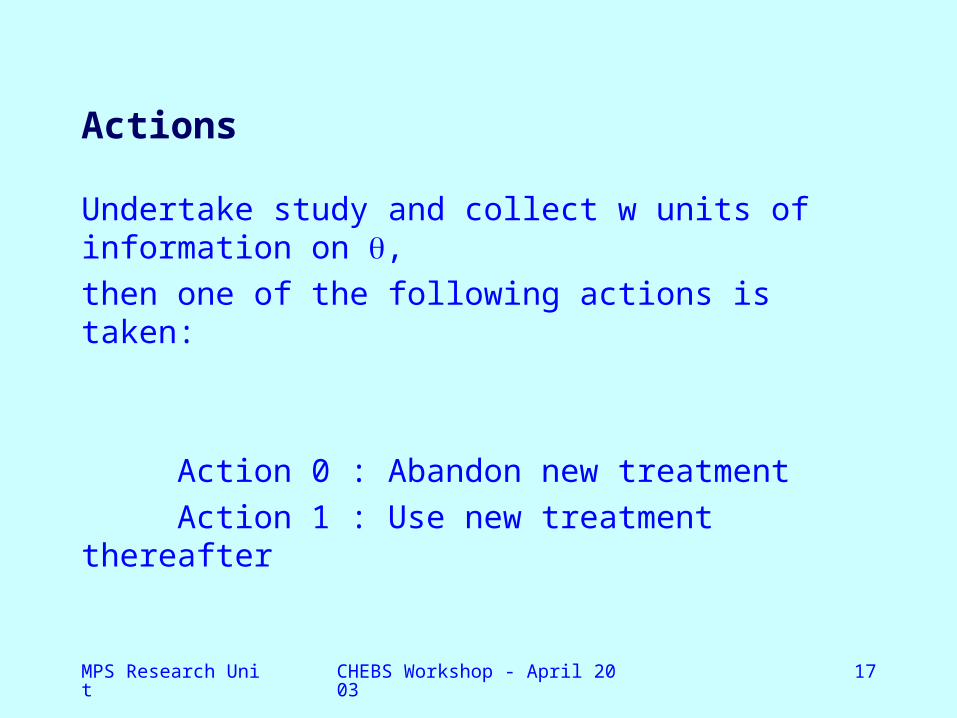
Actions
Undertake study and collect w units of information on ,
then one of the following actions is taken:
Action 0 : Abandon new treatment
Action 1 : Use new treatment thereafter
MPS Research Unit CHEBS Workshop - April 2003 18
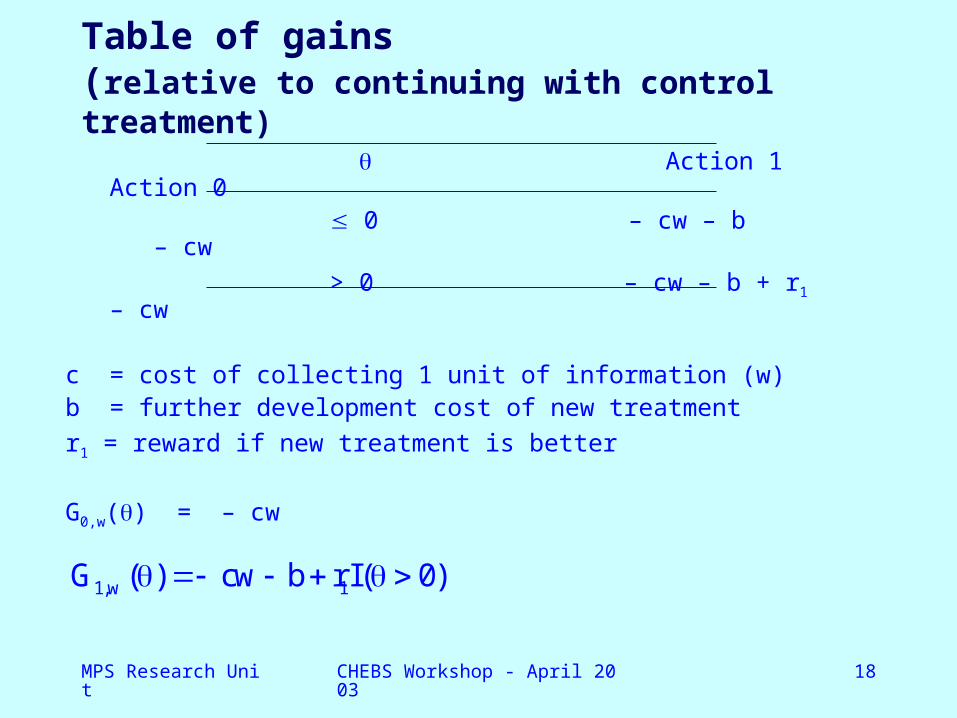
Table of gains (relative to continuing with control treatment)
Action 1 Action 0 0 – cw – b – cw
> 0 – cw – b + r1 – cw
c = cost of collecting 1 unit of information (w) b = further development cost of new treatment
r1 = reward if new treatment is better
G0,w() = – cw
1,w 1G ( ) cw b r I( 0)
MPS Research Unit CHEBS Workshop - April 2003 19
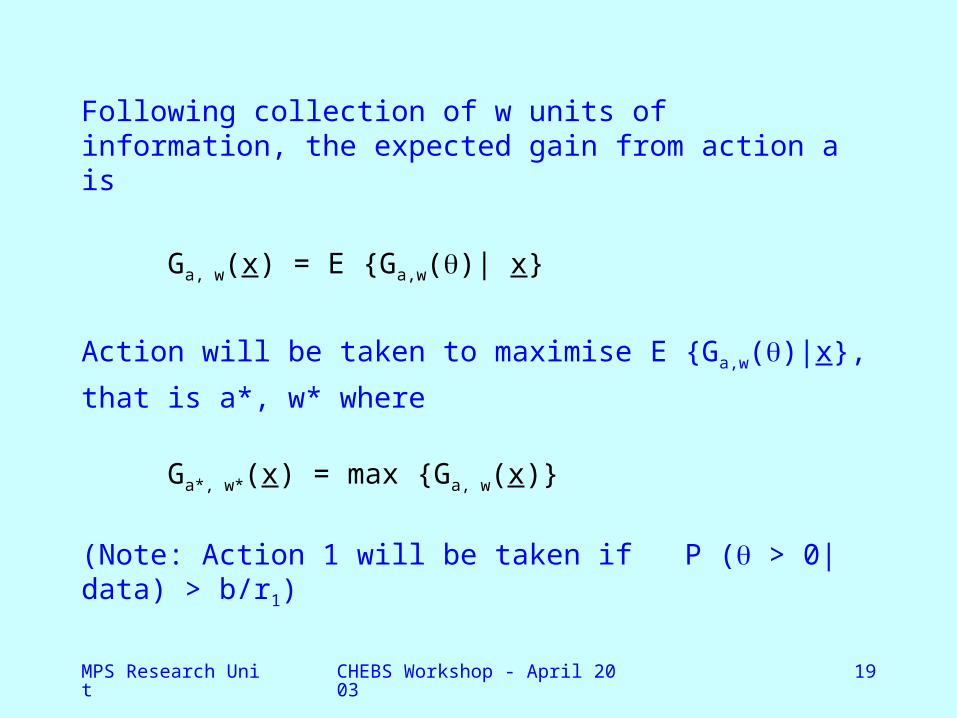
Following collection of w units of information, the expected gain from action a is
Ga, w(x) = E {Ga,w()| x}
Action will be taken to maximise E {Ga,w()|x},
that is a*, w* where
Ga*, w*(x) = max {Ga, w(x)}
(Note: Action 1 will be taken if P ( > 0|data) > b/r1)
MPS Research Unit CHEBS Workshop - April 2003 20
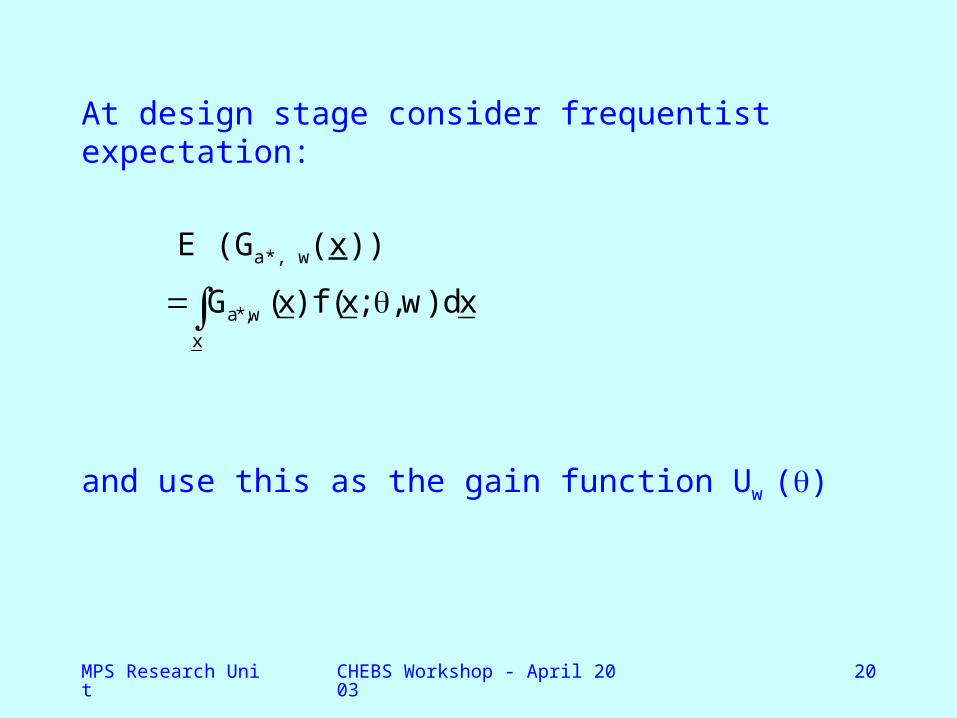
At design stage consider frequentist expectation:
E (Ga*, w(x))
and use this as the gain function Uw ()
a*,w
x
(x) f (x; ,w) dx G
MPS Research Unit CHEBS Workshop - April 2003 21
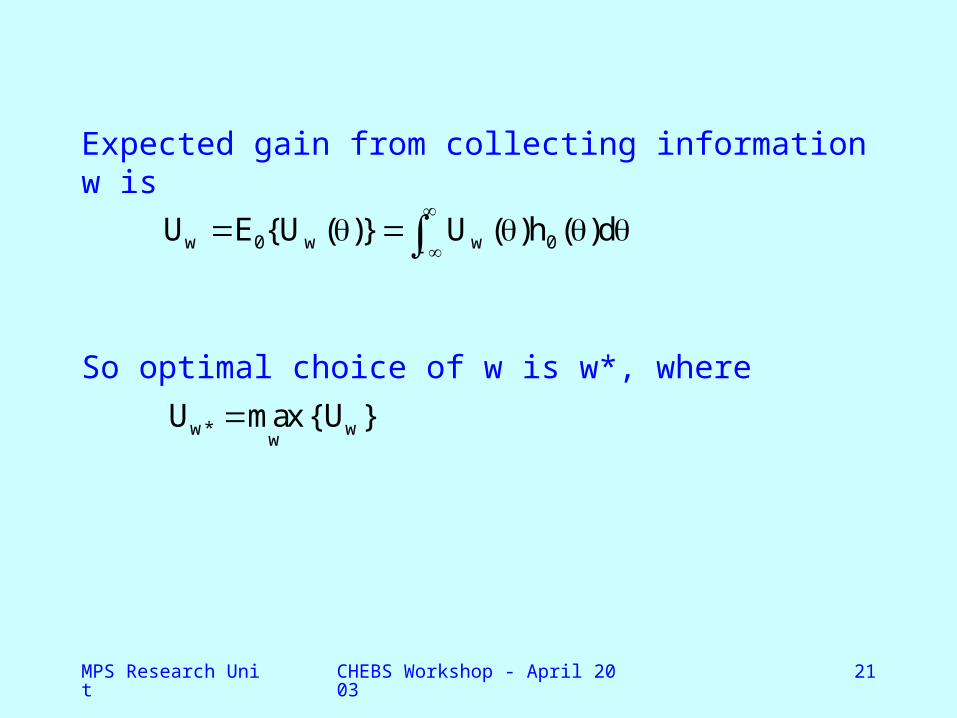
Expected gain from collecting information w is
So optimal choice of w is w*, where
w 0 w w 0{U ( )} U ( )h ( )d
U E
w* ww
max { }U U

MPS Research Unit CHEBS Workshop - April 2003 22
This is the prior expected utility or pre-posterior gain
w* 0 a,ww a
max E max (G ( ) | x) U E E
a,w 0xw amax max G ( )h( | x)d f (x; ,w)dx h ( )d
MPS Research Unit CHEBS Workshop - April 2003 23
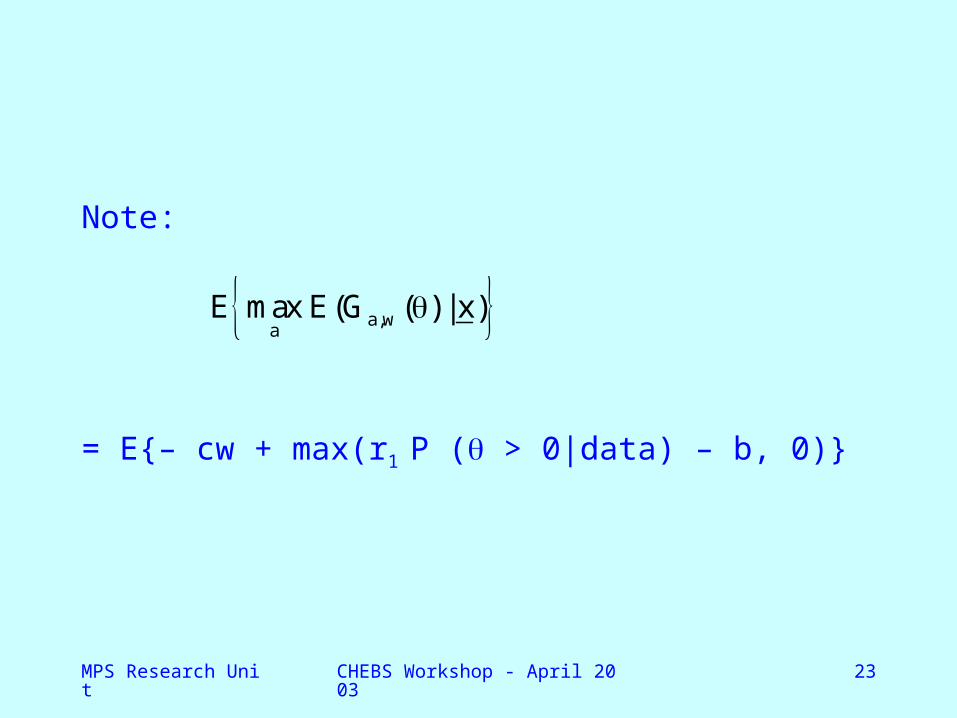
Note:
= E{– cw + max(r1 P ( > 0|data) – b, 0)}
a,wa
E max (G ( ) | x)E
MPS Research Unit CHEBS Workshop - April 2003 24
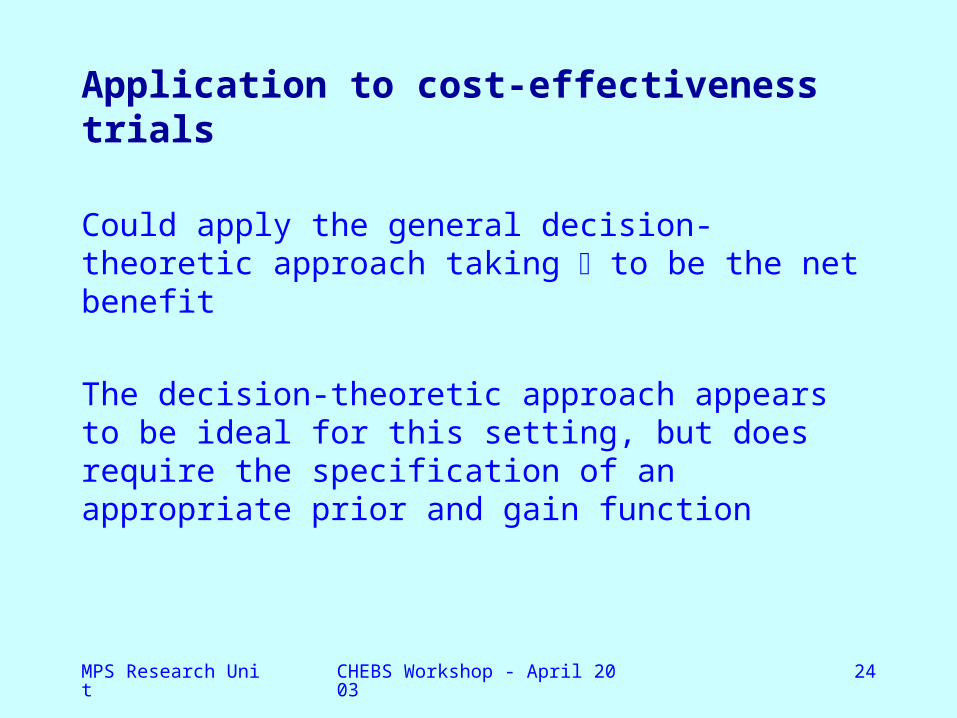
Application to cost-effectiveness trials
Could apply the general decision-theoretic approach taking to be the net benefit
The decision-theoretic approach appears to be ideal for this setting, but does require the specification of an appropriate prior and gain function
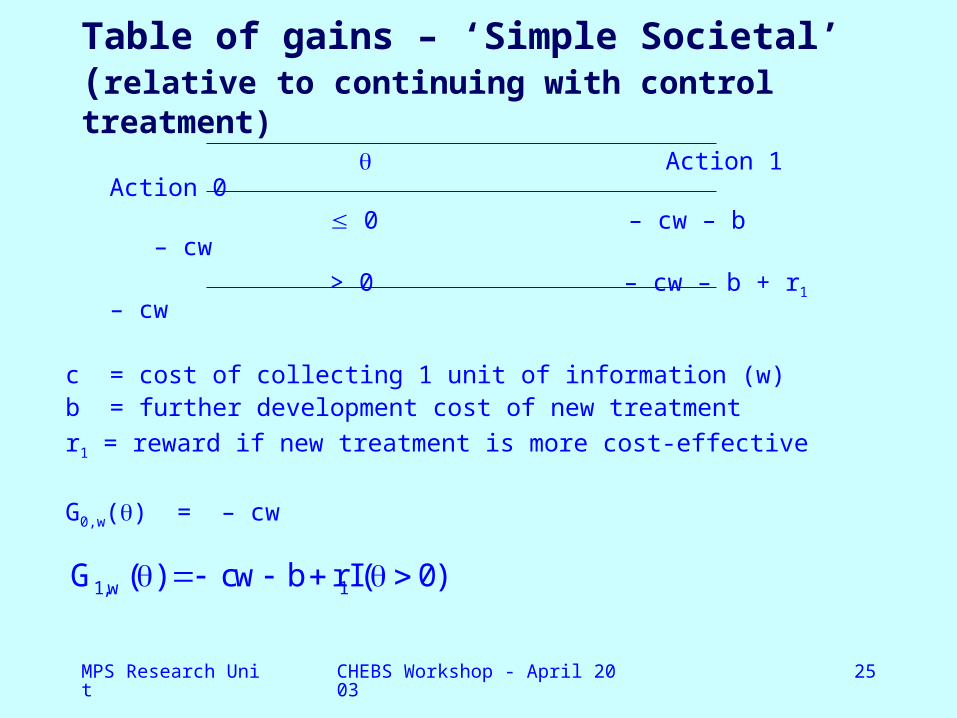
MPS Research Unit CHEBS Workshop - April 2003 25
Table of gains – ‘Simple Societal’(relative to continuing with control treatment)
Action 1 Action 0 0 – cw – b – cw
> 0 – cw – b + r1 – cw
c = cost of collecting 1 unit of information (w) b = further development cost of new treatment
r1 = reward if new treatment is more cost-effective
G0,w() = – cw
1,w 1G ( ) cw b r I( 0)
MPS Research Unit CHEBS Workshop - April 2003 26
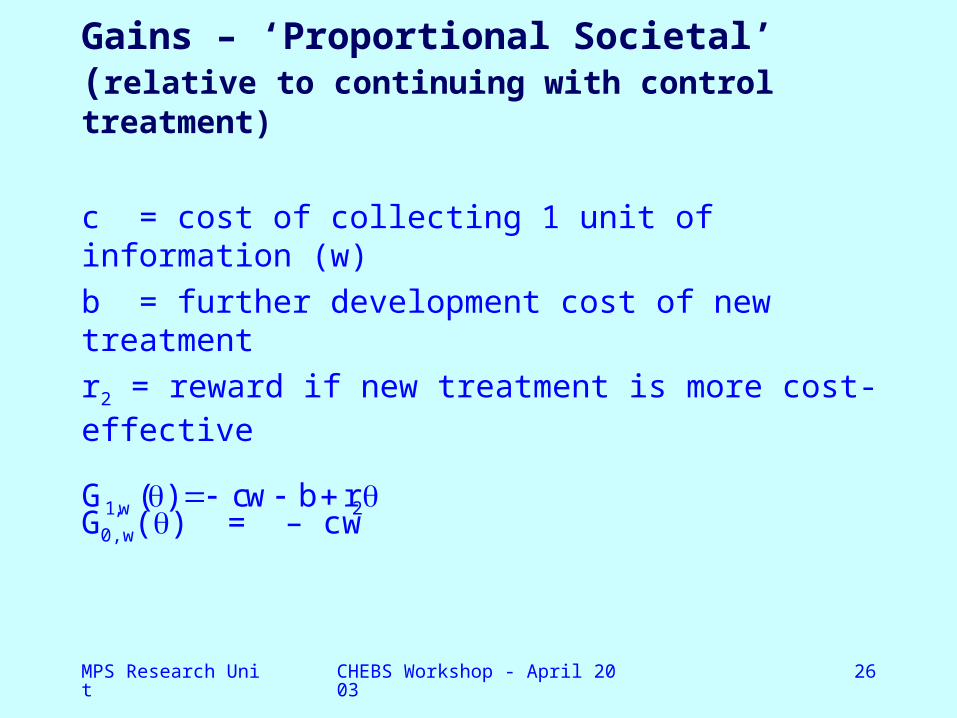
Gains – ‘Proportional Societal’(relative to continuing with control treatment)
c = cost of collecting 1 unit of information (w)
b = further development cost of new treatment
r2 = reward if new treatment is more cost-effective
G0,w() = – cw
1,w 2G ( ) cw b r
MPS Research Unit CHEBS Workshop - April 2003 27
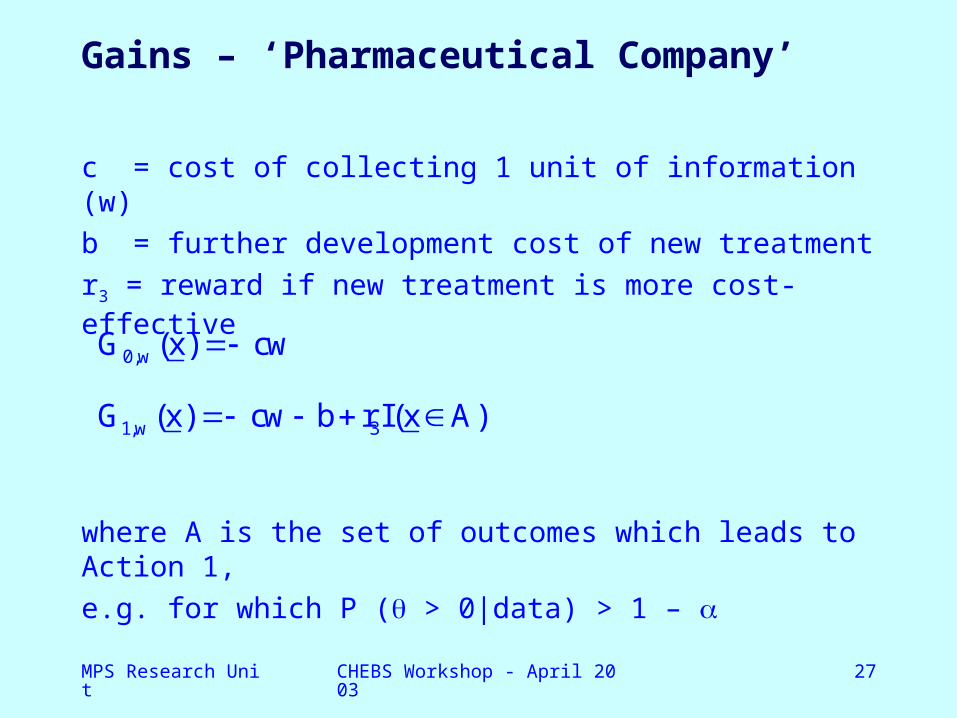
Gains – ‘Pharmaceutical Company’
c = cost of collecting 1 unit of information (w)
b = further development cost of new treatment
r3 = reward if new treatment is more cost-effective
where A is the set of outcomes which leads to Action 1,
e.g. for which P ( > 0|data) > 1 –
1,w 3G (x) cw b r I(x A)
0,wG (x) cw
MPS Research Unit CHEBS Workshop - April 2003 28
References
Briggs, A. and Tambour, M. (1998). The design and analysis of stochastic cost-effectiveness studies for the evaluation of health care interventions (Working Paper series in Economics and Finance No. 234). Stockholm, Sweden: Stockholm School of Economics.
O’Hagan, A. and Stevens, J. W. (2001). Bayesian assessment of sample size for clinical trials of cost-effectiveness. Medical Decision Making, 21, 219-230.


!["Deleuze's Encounter With Whitehead" [Chapter 2 of Whitehead book]](https://img.pdfslide.net/doc/110x75/589d92621a28ab494a8bb804/deleuzes-encounter-with-whitehead-chapter-2-of-whitehead-book.jpg)