Embed Size (px)
Citation preview

1
MQ’14 & FY 2013-14 Results Presentation – April 28, 2014

2
Safe Harbour Statement
This Release / Communication, except for the historical information, may contain statements, including the words or phrases such as ‘expects, anticipates, intends, will, would, undertakes, aims, estimates, contemplates, seeks to, objective, goal, projects, should’ and similar expressions or variations of these expressions or negatives of these terms indicating future performance or results, financial or otherwise, which are forward looking statements. These forward looking statements are based on certain expectations, assumptions, anticipated developments and other factors which are not limited to, risk and uncertainties regarding fluctuations in earnings, market growth, intense competition and the pricing environment in the market, consumption level, ability to maintain and manage key customer relationship and supply chain sources and those factors which may affect our ability to implement business strategies successfully, namely changes in regulatory environments, political instability, change in international oil prices and input costs and new or changed priorities of the trade. The Company, therefore, cannot guarantee that the forward looking statements made herein shall be realized. The Company, based on changes as stated above, may alter, amend, modify or make necessary corrective changes in any manner to any such forward looking statement contained herein or make written or oral forward looking statements as may be required from time to time on the basis of subsequent developments and events. The Company does not undertake any obligation to update forward looking statements that may be made from time to time by or on behalf of the Company to reflect the events or circumstances after the date hereof.

3
Agenda
1
2
3
4
Strategy
Business Context
Current Quarter Performance
Financial Year Performance
5 Looking Ahead
4
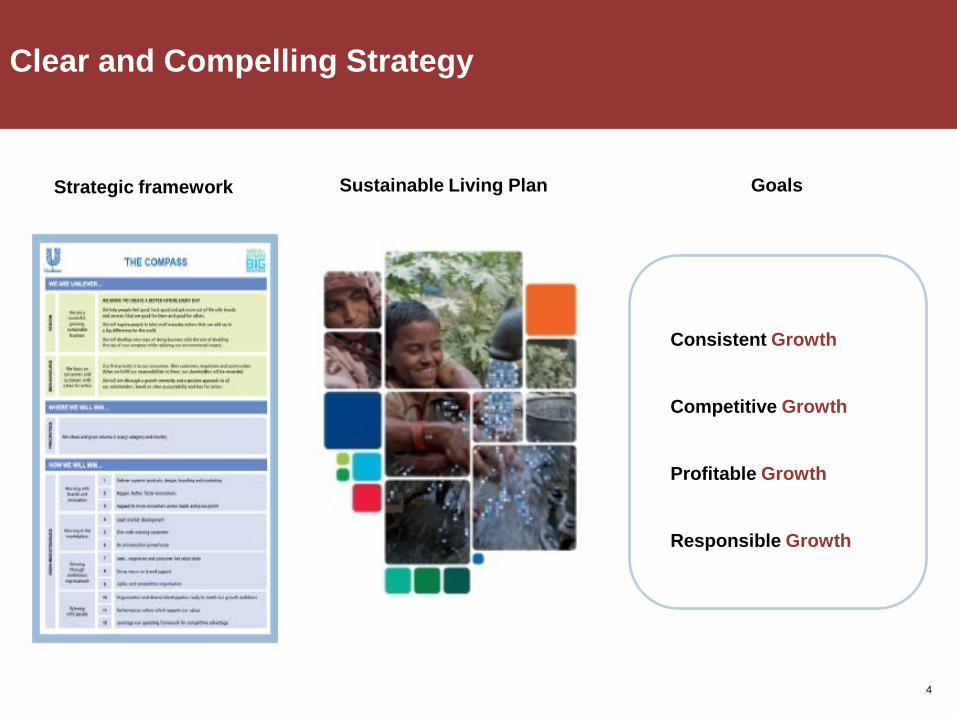
Clear and Compelling Strategy
Consistent Growth Competitive Growth Profitable Growth Responsible Growth
Strategic framework Sustainable Living Plan Goals
5
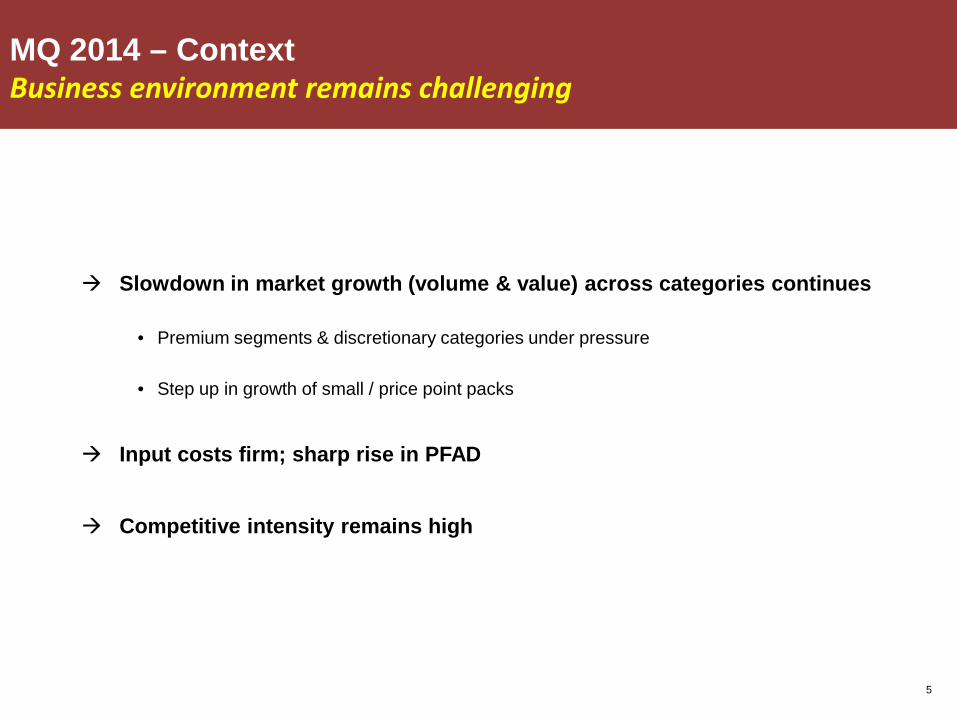
MQ 2014 – Context Business environment remains challenging
Slowdown in market growth (volume & value) across categories continues
• Premium segments & discretionary categories under pressure
• Step up in growth of small / price point packs
Input costs firm; sharp rise in PFAD
Competitive intensity remains high

6 Source: Bloomberg data and internal estimates INR numbers arrived at by applying the average exchange rate of the quarter to the average USD cost of the commodity
Firm Input costs Sharp rise in PFAD
7
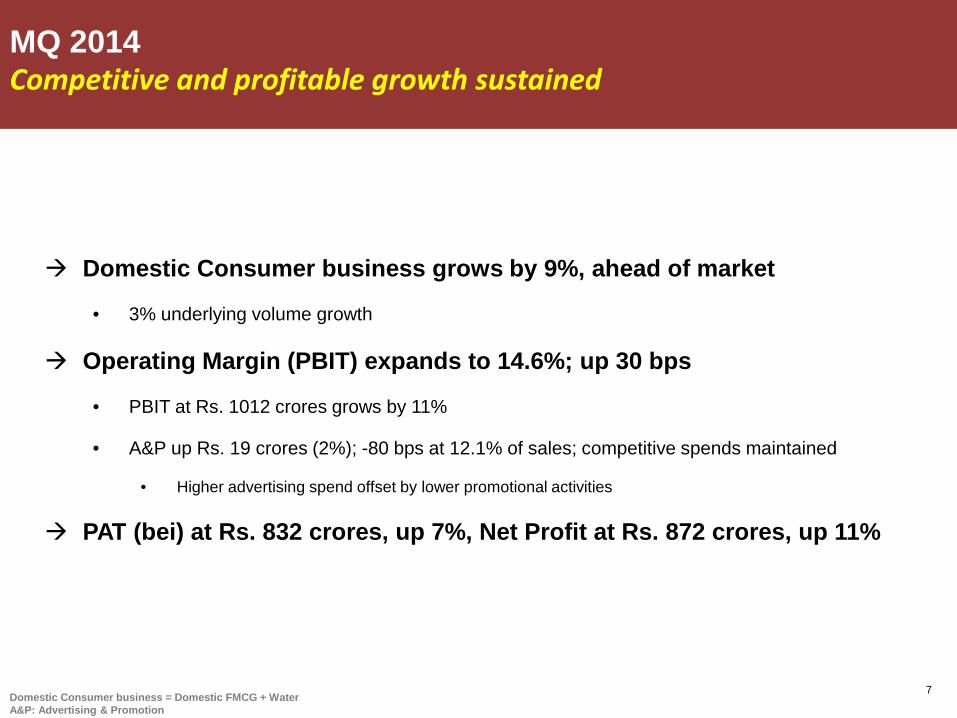
Domestic Consumer business grows by 9%, ahead of market
• 3% underlying volume growth
Operating Margin (PBIT) expands to 14.6%; up 30 bps
• PBIT at Rs. 1012 crores grows by 11%
• A&P up Rs. 19 crores (2%); -80 bps at 12.1% of sales; competitive spends maintained
• Higher advertising spend offset by lower promotional activities
PAT (bei) at Rs. 832 crores, up 7%, Net Profit at Rs. 872 crores, up 11%
Domestic Consumer business = Domestic FMCG + Water A&P: Advertising & Promotion
MQ 2014 Competitive and profitable growth sustained
8
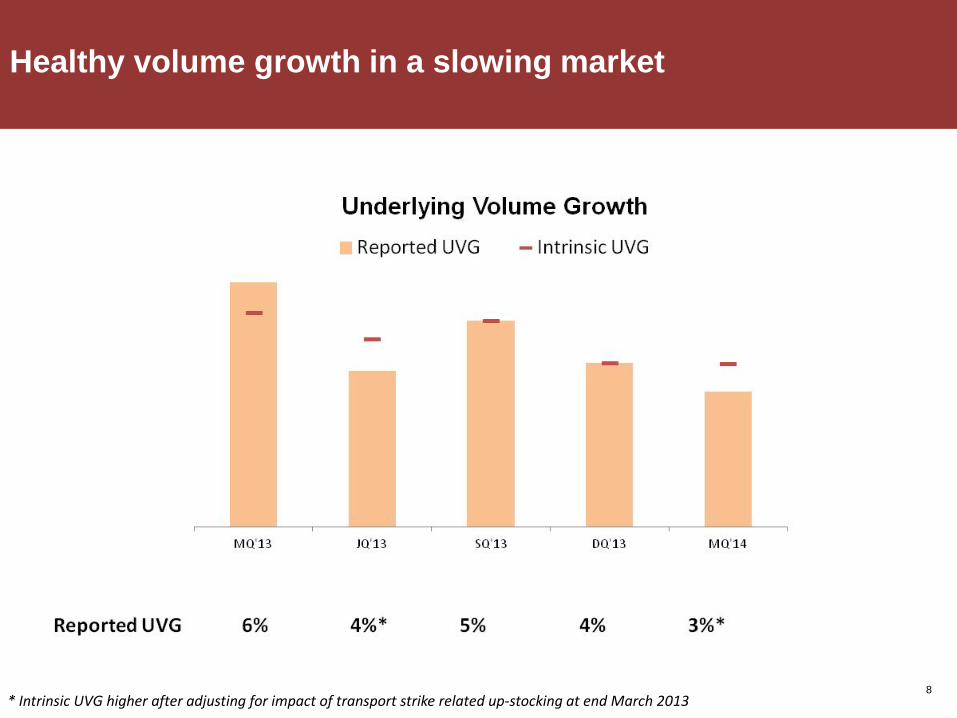
Healthy volume growth in a slowing market
* Intrinsic UVG higher after adjusting for impact of transport strike related up-stocking at end March 2013

9
Winning with Brands Continued focus on innovations

10
Winning with Brands Impactful activation in quarter

11
Broad based growth
Sales growth %
Soaps & Detergents
Personal Products
Beverages
9
8
8
13 Packaged Foods
Domestic Consumer grows at 9%
Sales growth = Segment Turnover growth excluding Other Operational Income

CATEGORY HIGHLIGHTS

13
Skin Cleansing Double digit growth
Dove, Pears, Lifebuoy and Breeze lead category growth
Step up in price growth; judicious pricing and cost savings
to manage inflation
Liquids delivers a strong quarter led by Lifebuoy handwash

14
Home Care Growth led by the premium segment
Laundry
• Strong growth in Surf buoyed by momentum on Easy Wash
• Rin performance led by bars; powders re-launched during quarter
• Wheel growth steps up on back of re-launch last quarter
• Comfort Fabric Conditioners sustain high growth
Household Care
• Vim leads growth through impactful activation
• Vim liquids continue to do well and lead market development

15
Skin Care Good growth in a challenging market
Fair and Lovely re-launch yielding positive results
• Focused activation plan
• Rs. 5 pack extended
Ponds led by top-end; Lakme & Dove sustain robust growth
• Exciting introduction of Lakme 9 to 5 Super Sunscreens
Innovation led broad based growth in facial cleansing

16
Hair Care Volume led double digit growth
Shampoos deliver another strong performance
• Dove leads category growth; Clinic Plus continues to do well
• TRESemmé making good progress; new Split Remedy variant added
• Sachet format grows faster
Conditioners gaining ground; focus on market development
17
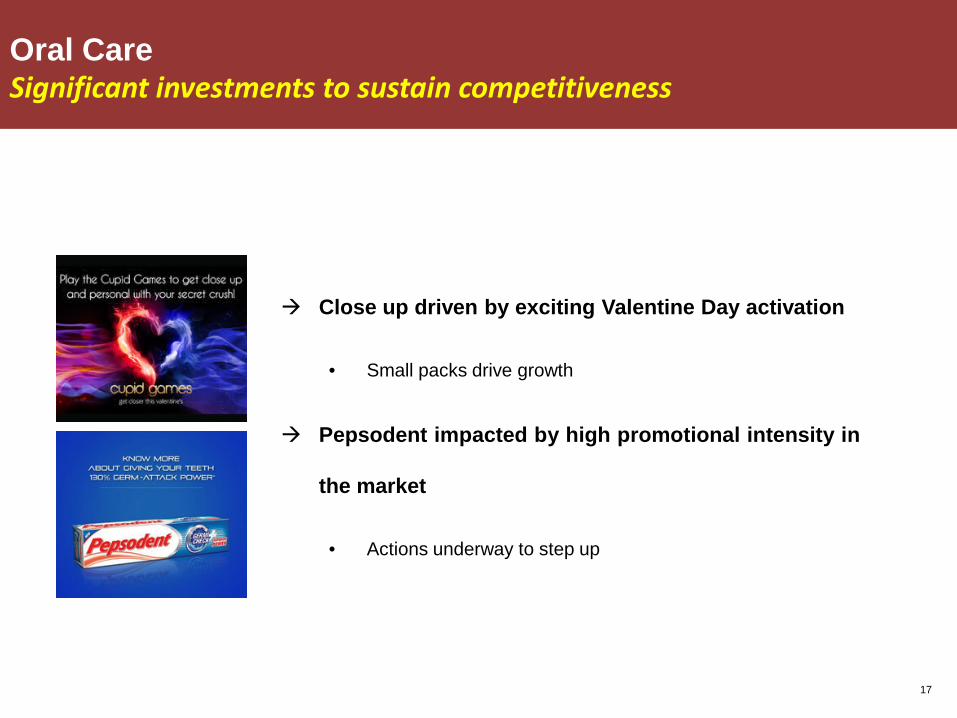
Oral Care Significant investments to sustain competitiveness
Close up driven by exciting Valentine Day activation
• Small packs drive growth
Pepsodent impacted by high promotional intensity in
the market
• Actions underway to step up

18
Color Cosmetics Strong innovation led growth momentum
Lakme continues to strengthen its position in
Premium make-up
• Absolute & 9 to 5 deliver volume led double digit growth
• ‘eyeconic’ doing very well
• Impactful activation around Lakme Fashion Week
• Exciting additions to the Nail & Eye make-up range
Elle 18 sustains robust growth
19
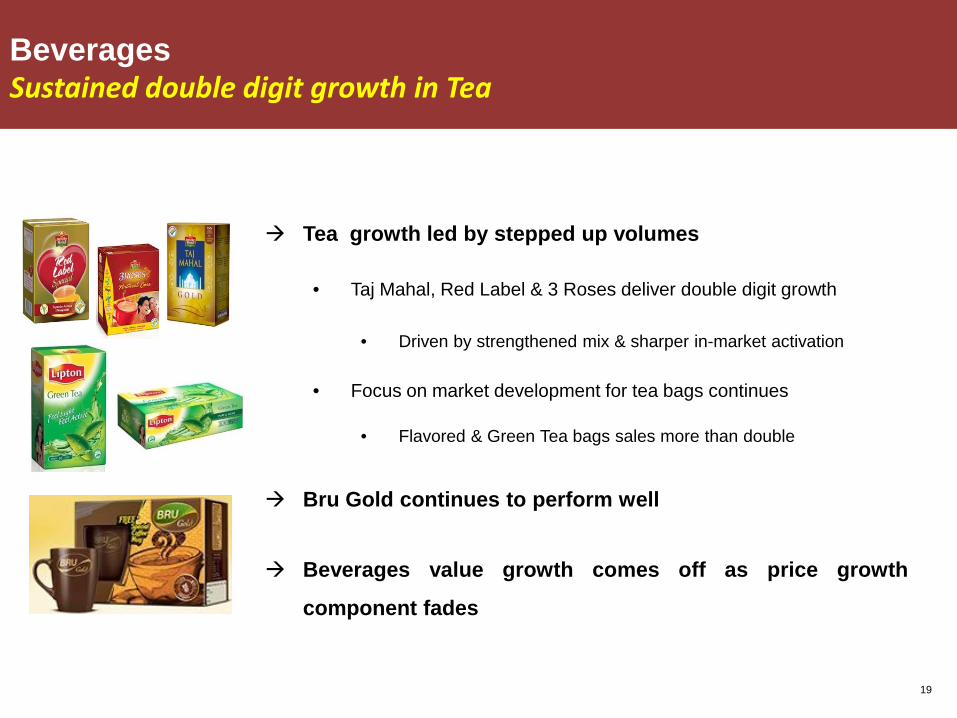
Beverages Sustained double digit growth in Tea
Tea growth led by stepped up volumes
• Taj Mahal, Red Label & 3 Roses deliver double digit growth
• Driven by strengthened mix & sharper in-market activation
• Focus on market development for tea bags continues
• Flavored & Green Tea bags sales more than double
Bru Gold continues to perform well
Beverages value growth comes off as price growth
component fades

20
Packaged Foods Double digit growth
Kissan - robust performance driven by impactful activation
around ‘ unlocking everyday relevance’
• Growth accelerates on Jams & Ketchups
Knorr Instant Soups more than double volumes
• ‘Experience model’ rolled out in Modern Trade to drive trials
Kwality Walls & Magnum deliver a strong quarter
• Magnum rolled out to 4 more cities; good response
• Sharper in-market execution
21
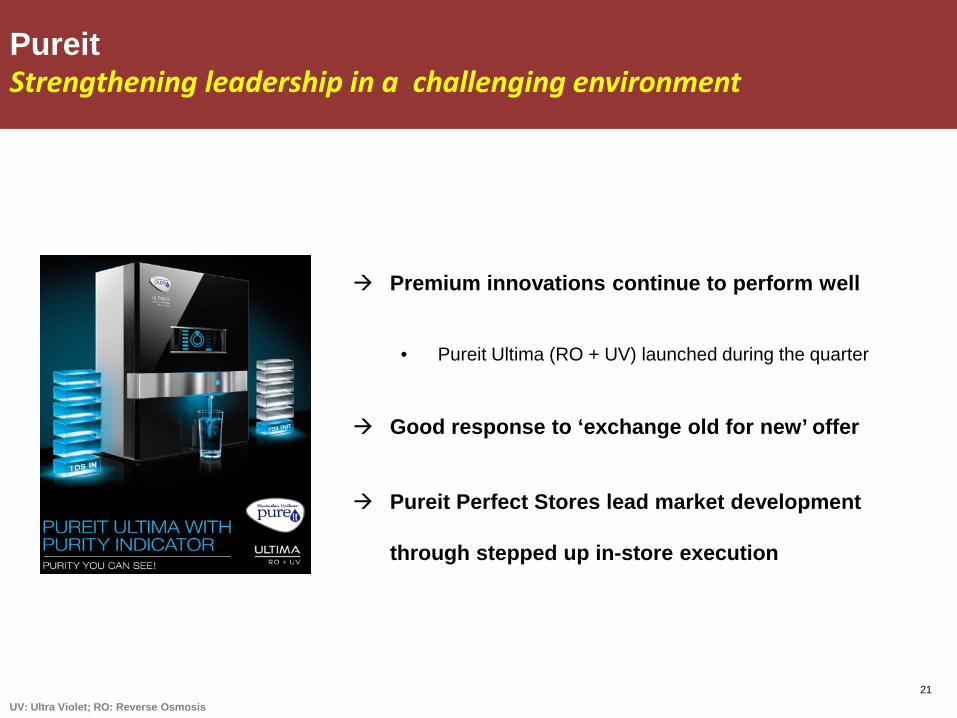
Pureit Strengthening leadership in a challenging environment
Premium innovations continue to perform well
• Pureit Ultima (RO + UV) launched during the quarter
Good response to ‘exchange old for new’ offer
Pureit Perfect Stores lead market development
through stepped up in-store execution
UV: Ultra Violet; RO: Reverse Osmosis

22
Particulars MQ'13 MQ'14 Growth %
Net Sales 6,367 6,936 9
PBITDA 972 1,078 11
PBIT 910 1,012 11
PBIT margin (%) 14.3 14.6 30 bps
PAT bei 781 832 7
Net Profit 787 872 11
Rs Crores
MQ 2014 Results summary
Domestic Consumer grows at 9%
23
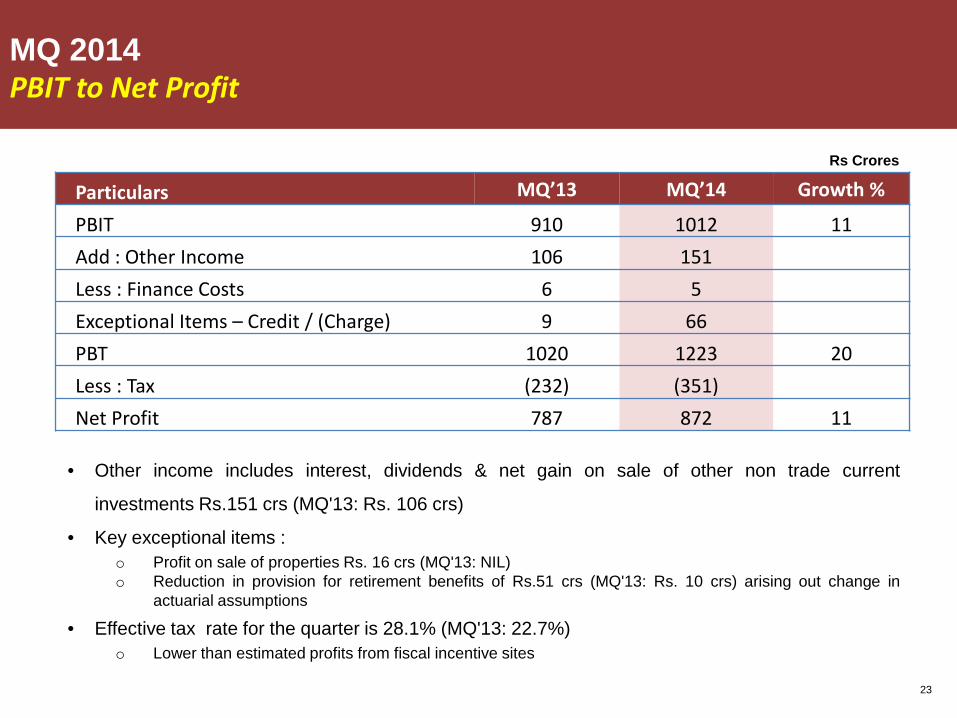
MQ 2014 PBIT to Net Profit
Rs Crores
Particulars MQ’13 MQ’14 Growth %
PBIT 910 1012 11 Add : Other Income 106 151 Less : Finance Costs 6 5 Exceptional Items – Credit / (Charge) 9 66 PBT 1020 1223 20 Less : Tax (232) (351) Net Profit 787 872 11
• Other income includes interest, dividends & net gain on sale of other non trade current
investments Rs.151 crs (MQ'13: Rs. 106 crs)
• Key exceptional items : o Profit on sale of properties Rs. 16 crs (MQ'13: NIL) o Reduction in provision for retirement benefits of Rs.51 crs (MQ'13: Rs. 10 crs) arising out change in
actuarial assumptions
• Effective tax rate for the quarter is 28.1% (MQ'13: 22.7%) o Lower than estimated profits from fiscal incentive sites

24
Competitive and profitable growth sustained
• 9% Domestic Consumer growth, ahead of market
o 3% underlying volume growth (on back of transport strike up-stocking in base)
• PBIT margin expands +30 bps
MQ 2014 Results summary

FINANCIAL YEAR ENDING 31ST MARCH 2014

26
FY 2013-14: Delivered on goals

Whilst making progress on our Sustainability priorities
HUL INDIA UPDATE: 6th MAY 2014
28
Segment Overview FY 2013-14: Soaps and Detergents Healthy performance in a competitive market
Soaps : healthy volume led growth; driven by Dove, Lifebuoy and Breeze
Laundry : Surf continues to lead category premiumization; Wheel relaunched
Household Care : Vim and Domex drive robust growth; Vim now a1000+ crore brand
Value growth comes off due to lower price growth component
Sustained focus on market development: Liquids* portfolio now Rs 500+ crores
Segmental profit up 11%
USG 8% UVG 5% USG: Underlying Sales growth; UVG: Underlying Volume growth; UPG: Underlying Price growth
*Handwash, Bodywash, Laundry and Dishwash Liquids
29
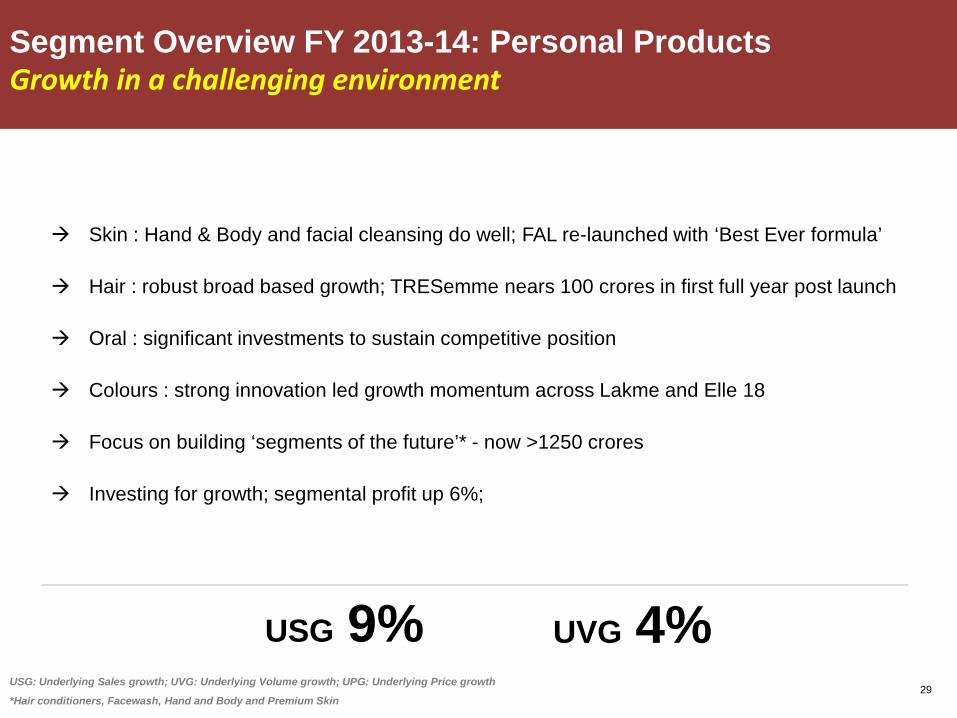
Segment Overview FY 2013-14: Personal Products Growth in a challenging environment
Skin : Hand & Body and facial cleansing do well; FAL re-launched with ‘Best Ever formula’
Hair : robust broad based growth; TRESemme nears 100 crores in first full year post launch
Oral : significant investments to sustain competitive position
Colours : strong innovation led growth momentum across Lakme and Elle 18
Focus on building ‘segments of the future’* - now >1250 crores
Investing for growth; segmental profit up 6%;
USG: Underlying Sales growth; UVG: Underlying Volume growth; UPG: Underlying Price growth
*Hair conditioners, Facewash, Hand and Body and Premium Skin
USG 9% UVG 4%
30
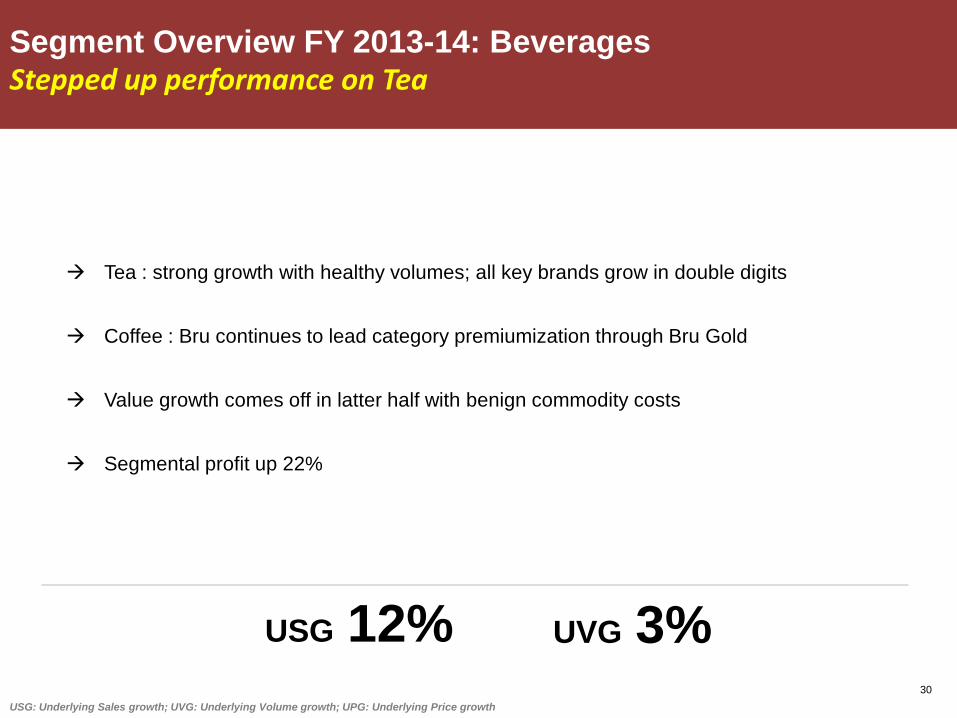
Segment Overview FY 2013-14: Beverages Stepped up performance on Tea
Tea : strong growth with healthy volumes; all key brands grow in double digits
Coffee : Bru continues to lead category premiumization through Bru Gold
Value growth comes off in latter half with benign commodity costs
Segmental profit up 22%
USG: Underlying Sales growth; UVG: Underlying Volume growth; UPG: Underlying Price growth
USG 12% UVG 3%

31
Segment Overview FY 2013-14: Packaged Foods Broad based growth
Kissan : Ketchups and Jams growth accelerates on the back of impactful activation
Knorr : pickup in performance with Instant Soups doing particularly well
Kwality Walls : impacted by a challenging environment; growth picks up in latter half
driven by sharper in-market execution
Magnum receives positive response; extended to 4 other cities
Driving efficiencies and mix while continuing to invest; segmental profit up 65%
USG: Underlying Sales growth; UVG: Underlying Volume growth; UPG: Underlying Price growth
USG 10% UVG 3%

32
• Domestic Consumer grows at 9%; 4% UVG
• Net profit growth impacted by significant property sale in base period
Financial Year ending 31st March 2014 Results summary

33
Rs Crores
Financial Year ending 31st March 2014 Cash flow summary
Cash from Operations > Rs. 5000 crores; up Rs. 462 crores
Particulars FY'13 FY'14Operating profit before working capital changes 4,073 4,529Net working capital movement 473 479Taxes paid (net of refunds) -1,005 -1,279
Net cash generated from operating activities - [A] 3,530 3,724
Purchase of tangible/ intangible assets (net of disposal) -405 -511Cash flow from investments -288 -343Dividend received 83 144Consideration received on disposal of surplus properties 645 197
Net cash generated from/ (used) in investing activities - [B] 34 -513
Dividends paid -3,550 -2,473Dividend distribution tax paid -576 -406
Net cash used in financing activities - [C] -4,160 -2,917
Net increase/(decrease) in cash and cash equivalents - [A+B+C] -597 294
Cash and cash equivalents at the beginning of the year 923 326
Cash and cash equivalents at the end of the year 326 621

34
Financial Year ending 31st March 2014 Dividend
*Final dividend number for FY 2013-14 is subject to approval by the shareholders at the AGM

35
Another year of competitive and profitable growth
• 9%* growth with UVG of 4% in a challenging environment
• Investing for growth; A&P up Rs 382 crores (+40bps)
• PBIT up 12%; margins expand +40 bps
Cash from operations > 5000 crores
Total dividend of Rs 13 per share
* Domestic consumer Business = Domestic FMCG + Water
Financial Year ending 31st March 2014 Summary

36
Looking ahead
Strategy unchanged; continue to manage business for long term growth
• Consistent, Competitive, Profitable, Responsible Growth
Invest to strengthen the core and lead development of emerging categories
Near term concerns
• Uncertain macro environment
• Volatility
Positive on the medium-long term outlook for FMCG
HUL well positioned : Brands, Capabilities, Talent
37
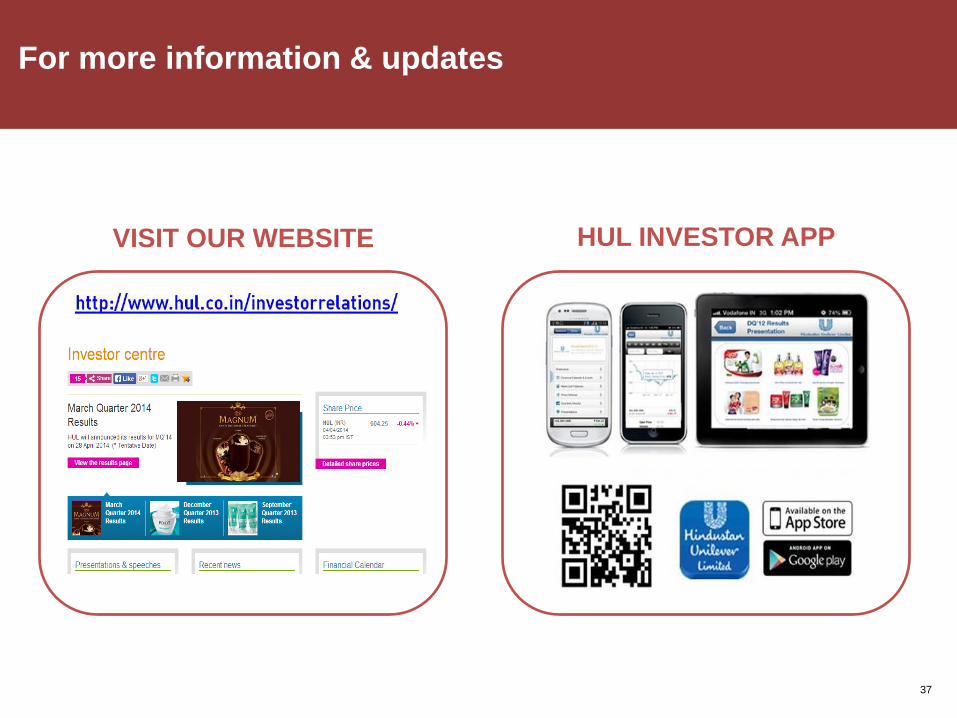
For more information & updates
VISIT OUR WEBSITE HUL INVESTOR APP