Embed Size (px)
Citation preview

Mr. Bryan C. Hanson President and Chief
Nuclear Officer Exelon Nuclear 4300 Wint ield Road Warrenville, IL 60555
UNITED STATES NUCLEAR REGULATORY COMMISSION
WASHINGTON, D.C. 20555-0001
February 7, 2017
SUBJECT: NUCLEAR REGULATORY COMMISSION REPORT FOR THE AUDIT OF EXELON GENERATING COMPANY, LLC'S FLOOD HAZARD REEVALUATION REPORT SUBMITTAL RELATING TO THE NEAR-TERM TASK FORCE RECOMMENDATION 2.1-FLOODING FOR THREE MILE ISLAND NUCLEAR STATION, UNIT 1 (CAC NO. MF1113)
Dear Mr. Hanson:
By letter dated August 26, 2015 (Agencywide Documents Access and Management System (ADAMS) Accession No. ML 15230A273), the U.S. Nuclear Regulatory Commission (NRG) informed you of the staff's plan to conduct a regulatory audit of Exelon Generation Company, LLC's (the licensee) Flood Hazard Reevaluation Report (FHRR) submittal related to the NearTerm Task Force Recommendation 2.1-Flooding for Three Mile Island Nuclear Station, Unit 1 (TMI). The audit was intended to support the NRG staff review of the licensee's FHRR and the subsequent issuance of a staff assessment.
The audits conducted on February 12, 2016, March 4, 2016, March 11, 2016, and June 17, 2016 were performed consistent with NRG Office of Nuclear Reactor Regulation, Office Instruction LIC-111, "Regulatory Audits," dated December 29, 2008, (ADAMS Accession No. ML082900195). Therefore, the purpose of this letter is to provide you with the final audit report which summarizes and documents the NRC's regulatory audit of the licensee's FHRR submittal.

UNITED STATES NUCLEAR REGULATORY COMMISSION
WASHINGTON, D.C. 20555-0001
NUCLEAR REGULATORY COMMISSION AUDIT REPORT
FOR THE AUDIT OF EXELON GENERATING COMPANY. LLC'S
FLOOD HAZARD REEVALUATION REPORT SU BM ITT ALS
RELATING TO THE NEAR-TERM TASK FORCE RECOMMENDATION 2.1-FLOODING FOR
THREE MILE ISLAND. UNIT 1
BACKGROUND AND AUDIT BASIS
By letter dated March 12, 2012, the U.S. Nuclear Regulatory Commission (NRC) issued a request for information to all power reactor licensees and holders of construction permits in active or deferred status, pursuant to Title 1 O of the Code of Federal Regulations (1 O CFR), Section 50.54(f) "Conditions of license" {hereafter referred to as the "50.54(f) letter"). The request was issued in connection with implementing lessons-learned from the 2011 accident at the Fukushima Dai-ichi nuclear power plant, as documented in The Near-Term Task Force Review of Insights from the Fukushima Dai-ichi Accident. Recommendation 2.1 in that document recommended that the NRC staff issue orders to all licensees to reevaluate seismic and flooding for their sites against current NRC requirements and guidance. Subsequent staff requirements memoranda associated with SECY 11-0124 and SECY 11-0137, instructed the NRC staff to issue requests for information to licensees pursuant to 10 CFR 50.54(f).
By letter dated August 13, 2015, Exelon Generation Company, LLC (Exelon, the licensee) submitted its Flood Hazard Reevaluation Report (FHRR) for Three Mile Island Nuclear Station, Unit 1 (TMI) (Agencywide Documents Access and Management System Accession No. ML 15225A266). The NRC is in the process of reviewing the aforementioned submittal and has completed a regulatory audit of the licensee to better understand the development of the submittal, identify any similarities/differences with past work completed and ultimately aid in its review of the licensees' FHRR. This audit summary is being completed in accordance with the guidance set forth in NRC Office of Nuclear Reactor Regulation, Office Instruction LIC-111, "Regulatory Audits," dated December 29, 2008 (ADAMS Accession No. ML082900195).
AUDIT LOCATION AND DATES
The audits were completed by document review via a webinar session in conjunction with the use of the licensee's established electronic reading room (ERR) and teleconference on February 12, 2016, March 4, 2016, March 11, 2016, and June 17, 2016.
Enclosure

- 2 -
AUDIT TEAM Title Team Member Organization Team Leader, NRR/JLD Tekia Govan NRC Technical Monitor Richie Rivera-Lugo NRC Technical Staff Ken See NRC Technical Deputy Division Director Andy Campbell NRC Technical Branch Chief Christopher Cook NRC NRC Contractor Roger Kay US Army Corps of Engineers
(USACE) NRC Contractor Curtis Miller USA CE NRC Contractor John Quinn Argonne National Laboratory
(ANL) NRC Contractor Yuejun (Eugene)Yan ANL
A list of the licensee's participants can be found in Attachment 2.
DOCUMENTS AUDITED
Attachment 1 of this report contains a list which details the documents that were reviewed by the NRC staff, in part or in whole, as part of this audit. The documents were located in an ERR during the NRC staff's review. The documents, or portions thereof, that were used by the NRC staff as part of the technical analysis and/or as reference in the completion of the staff assessment, will be submitted by the licensee and docketed for completeness of information, as necessary.
AUDIT ACTIVITIES
In general, the audit activities consisted mainly of the following actions:
• Review background information on site topography and geographical characteristics of the watershed.
• Review site physical features and plant layout.
• Understand the selection of important assumptions and parameters that would be the basis for evaluating the individual flood causing mechanisms described in the 50.54(f) letter.
• Review model input/output files to computer analyses such as Hydrologic Engineering Center - Hydrologic Modeling System (HEC-HMS) and FL0-2D to have an understanding of how modeling assumptions were programmed and executed.
• Status of the submittal for associated effects and flood event duration.
Table 1 summarizes specific technical topics (and resolution) of important items that were discussed and clarified during the audit. The items discussed in Table 1 may be referenced/mentioned in the staff assessment in more detail.

-3-
The slides presented on June 17, 2016, by the NRC staff to the licensee citing required parameters needed to complete the associated effects and flood event duration reviews for TMI can be found at ADAMS Accession No. ML 16228A051.
This discussion was continued in a public meeting on July 26, 2016, in which the NRC staff and the licensee discussed the status of the associated effects and flood event duration parameter submittals for all Exelon sites (ADAMS Accession No. ML 16228A030).
EXIT MEETING/BRIEFING
On June 17, 2016, the NRC staff closed out the discussion of the technical topics described above.

- 4 -
Table 1: Three Mile Island, Unit 1 Information Needs - Audit/Post-Audit Summary
INFO INFORMATION NEED DESCRIPTION ACTION (POST-AUDIT)
NEED
1 All Flood Causing Mechanisms - Com12arison of In response to the information request, the licensee stated that the Reevaluated Flood Hazard with Current Design Basis current licensing basis (CLB) and the current design basis (COB)
are synomonous, i.e. they have the same meaning. The information Background: Recommendation 2.1 of the 50.54(f) letter provided by the licensee was sufficient to address the information provides instructions for the FHRR. Under Section 1, Hazard need request. Reevaluation Report, Items c and d, licensees are requested to perform:
c. Comparison of current and reevaluated flood causing mechanisms at the site. Provide an assessment of the current design basis flood elevation to the reevaluated flood elevation for each flood causing mechanism. Include how the findings from Enclosure 4 of this letter (i.e., Recommendation 2.3 flooding walkdowns) support this determination. If the current design basis flood bounds the reevaluated hazard for all flood causing mechanisms, include how this finding was determined. d. Interim evaluation and actions taken or planned to address any higher flooding hazards relative to the design basis, prior to completion of the integrated assessment described below, if necessary.
The TMI FHRR appears in the text to inconsistently provide comparison of the reevaluated flood hazards with the current design basis (COB) for each flood hazard mechanism, as requested.
Request: Clarify and where necessary correct the description and/or comparison of the reevaluated flood hazard to the current desian basis for any flood hazard mechanism

- 5 -
INFO INFORMATION NEED DESCRIPTION ACTION (POST-AUDIT) NEED
throughout the report that may have been incorrectly compared with the CLB. Please confirm that this has been verified throughout the FHRR.
2 Local Intense Precipitation The licensee provided a response during the audit that described and illustrated the location of doors (TMl-FG-D2A, -D2B, and -
Background: Figures A-05a, A-07a, and A-10a within Appendix D4A) of the diesel generator building that are listed in the info A of the LIP Evaluation, Calculation C-1101-122-E410-013 Rev. need. The response described them as flood gates that are 0, label exterior building doors within the vicinity of the diesel normally installed and provide passive flood protection to elevation generator building (Door# TMl-FG-D2A, Door# TMl-FG-D4A, 313.5 ft NGVD29 [National Geodetic Vertical Datum of 1929]. Door# TMl-FG-D2B). These doors are not listed in the results These statements are supported in the Updated Final Safety table, Table 3, in the FHRR. Results of the FL0-2D model Analysis Report (UFSAR) (Rev. 21, April 2012). provided by the licensee show that cells adjacent to the doors can be higher than the flood depth listed in the Table 3 for the After the audit, the NRC staff reviewed a copy of the Walkdown diesel generator building. For example, cell 16488, which is Report for TMI and was able to confirm the response provided by adjacent to Door# TMl-FG-D2A, has a maximum water depth of the licensee and determined it to be acceptable. 1.4 ft; the highest recorded value for the diesel generator building is 0.8 ft).
Request: Explain why these doors were not reported in the results table.
3 Local Intense Precipitation During the audit, the licensee showed the locations of all VBS in the model, including a revision to add a VBS extending southwest
Background: The NRC staff noted that there are potentially from the cooling tower. vehicle barrier systems (VBS) or other barriers within the vicinity of the powerblock area at the TMI site that were not included in In response to the supplemental request, the licensee provided the the licensee's LIP model. updated input/output (1/0) files. The NRC staff reviewed the
updated 1/0 files provided by the licensee. The information Original Request: Verify that excluding any potential barriers provided by the licensee was sufficient to address the information from the model is a conservative approach. user need request.
Supplemental Request: Please provide the input/output files associated to the analysis of the VBS as detailed in Table 3 of the Information Need Responses.

- 6 -
INFO INFORMATION NEED DESCRIPTION ACTION (POST-AUDIT)
NEED
4 Flood Related Changes to the Licensing Basis Since In response to this information need request the licensee indicated License Issuance that the flow rate at Harrisburg in 1972 was also assumed to occur
at the plant site due to its proximity to the gage, and that the Background: The NRC staff noticed that different Susquehanna "blending" feature of HEC-HMS v4.0 produced a better peak flow River flowrates are discussed in the TMI FHRR. estimate. The information provided by the licensee was sufficient
to address the information need request. Request: The TMI FHRR discusses using the peak flow rate measured from the 1972 Hurricane Agnes. Please clarify which peak flow(s) were used, as there have been some questions raised to the validity of some Susquehanna River peak flows from the 1972 Agnes flood.
5 Flood Related Changes to the Licensing Basis Since In response to this information need request the licensee indicated License Issuance that a 20 model can capture the flow patterns for complex
bathymetry and both the 10 and 20 produced comparable results. Background: The licensee noted that a 1-0 model would The information provided by the licensee was sufficient to address produce unacceptable errors in flood elevations. the information need request.
Request: Please clarify how a 20 hydraulic model would produce more acceptable results than a 10 model. Discussion of calibration in Calculation Package C-1101-122-E410-003 indicates that only high water marks were used for calibration, so please clarify how uncertainty for the 20 model is less than half of the uncertainty in the 10 model (as indicated on page 48 of C-1101-122-E410-003).
6 Flooding in Streams and Rivers In response to this information need request the licensee indicated that 78 rainfall gages were used. The information provided by the
Background: The NRC staff noticed that the number of sites licensee was sufficient to address the information need request. used for estimating the 100-year and 500-year rainfall values was not specified.

- 7 -
INFO INFORMATION NEED DESCRIPTION ACTION (POST-AUDIT)
NEED
Request: Please provide a precise number for the "limited" sites used for estimating the 100-year and 500-year rainfall values?
7 Flooding in Streams and Rivers In response to this information need request the licensee indicated that the range in subbasin size was from 4.43 to 986.01 square
Background: The NRC staff noticed that the sizes of the sub- miles. The information provided by the licensee was sufficient to basins used for hydrologic modeling was not specified. address the information need request.
Request: Please clarify the range in subbasin sizes, as it is not directly discussed either in the TMI FHRR or in the calculation package C-1101-122-E410-010.
8 Flooding in Streams and Rivers In response to this information need request the licensee indicated that the largest of the calibration storms produces a peak flow
Background: The NRC staff noticed that the unit hydrographs approximately 2/3 of the PMF and that based on engineering were not peaked due to the size of the storms used for model judgement the generic non-linearity adjustments are not calibration. necessary. The licensee stated that because the model over
predicts the smallest of the 3 calibration events in volume and peak Request: flow rate by 20% and 32% respectively, the unit hydrograph Please clarify if the calibrated model was validated against adjustment is not necessary. The information provided by the smaller events to verify this assumption. licensee was sufficient to address the information need request.
9 Flooding in Streams and Rivers In response to this information need request the licensee indicated that the 1969 USACE basin-wide average precipitation values was
Background: The NRC staff noticed that the area-weighted 12. 7 inches, compared to 11.22 inches for the flood hazard precipitation from the PMF [probable maximum flood] analysis reevaluation. The information provided by the licensee was performed by the U.S. Army Corps of Engineers (USACE) was sufficient to address the information need request. not provided for comparison.
Request: The area-weighted precipitation is listed as 11.15 inches for the TMI watershed centroid storm centering. Please clarify how this values compares to the area-weighted precipitation from the 1969 USACE basin-wide PMF analysis.

- 8 -
INFO INFORMATION NEED DESCRIPTION ACTION (POST-AUDIT)
NEED
10 Flooding in Streams and Rivers In response to this information need request the licensee provided a listing of storm orientations used for each storm centering. All
Background: The NRC staff noticed that specific information orientations varied between 191 and 212 degrees. The information regarding the storm centering was not provided in the FHRR. provided by the licensee was sufficient to address the information
need request. Request: Please clarify if the storms centering other than the TMI watershed centroid were oriented any differently than the selected centering and orientation.
11 Flooding in Streams and Rivers In response to this information need request the licensee indicated that the 1996 rain-on-snow event was the only of the 5 listed
Background: The NRC staff noticed that specific information storms to have sufficient snowpack depth and density information regarding recorded snowmelt from rain on snow events used for necessary for the calibration of constant infiltration loss rates. The model calibration was not provided in the FHRR. information provided by the licensee was sufficient to address the
information need request. Request: The TMI FHRR indicates that the January 1996 event had the "record" snowmelt rate across the watershed. Please clarify if this was for all snowmelt events, or just the 5 events listed in Table 6 of the TMI FHRR, and if so, if it is possible that other events not listed had a higher melt rate.
12 Flooding in Streams and Rivers In response to this information need request the licensee indicated that uncertainty was generally addressed by assessing sensitivities
Background: The NRC staff noticed that there were no to variations in key input parameters when possible and that discussions of uncertainty regarding the peak flowrates in Table conservative methods or assumptions were applied in setting key 13 of the TMI FHRR. parameters. The licensee further listed several key conservative
assumptions used in calculation C-1101-122-E410-011. The Request: information provided by the licensee was sufficient to address the Please clarify what uncertainties are associated with the peak information need request. flows listed in Table 13, as this does not appear to be discussed in calculation C-1101-122-E410-010 or other calculation packages.

- 9 -
INFO INFORMATION NEED DESCRIPTION ACTION (POST-AUDIT) NEED
13 Dam Breaches and Failures In response to this information need request the licensee provided a listing of information used to develop structural elevations used in
Background: The NRC staff noticed that in the TMI FHRR some the HEC-RAS [River Analysis System] geometry. The licensee bridge structural elevations were not known and had to be further indicated that the sole structure that did not have available estimated for the analysis. information was a bridge located approximately 1.3 miles
downstream of the nuclear plant site. This bridge was overtopped Request: during the Hurricane Agnes event and does not have a large Please clarify the uncertainty associated with the lack of impact on water surface profiles as it only crosses one channel knowledge of these structures' elevations. (the East channel). The information provided by the licensee was
sufficient to address the information need request.
14 Dam Breaches and Failures In response to this information need request the licensee noted that the rating curve does not account for hysteresis. The licensee
Background: The NRC staff noticed that the rating curve in also noted that the change in flow over time is not expected to Figure 29 of the TMI FHRR did not appear to account for significantly affect the stage-discharge relationship. The hysteresis. information provided by the licensee was sufficient to address the
information need request. Request: Please confirm that rating curve presented is based on steady-flow HEC-RAS model and state weather it accounts for possible hysteresis.
15 Ice Induced Flooding In response to this information need request the licensee indicated that the peak flow associated with the 1996 ice jam event was
Background: The NRC staff noticed that the licensee did not significantly lower than the flood protection design discharge of provide details regarding the effects of ice on the rating curve. 1, 100, 000 cfs, that the 1996 event did not produce water surface
elevations close to the flood protection dike design elevation, and Original Request: that there is no historic evidence for ice jam formation at York Please clarify how the peak discharge listed in Table 20, of the Haven Dams near the TMI nuclear plant. TMI FHRR, takes into account the increased roughness introduced by ice and obstruction to flow, as ice-affected stages In response to the supplemental request, the licensee responded may be several feet higher than an open-water flow of equal that a sensitivity analysis was performed with HEC-RAS to develop discharge. a rating curve at the site assuming an ice jam. The licensee
determined that a flow roughly equivalent to the Hurricane Agnes discharge would be required in conjunction with an ice jam to produce a staqe equivalent to top-of-dike. The licensee further

- 10 -
INFO INFORMATION NEED DESCRIPTION ACTION (POST-AUDIT)
NEED
Supplemental Request: indicated that ice-related flooding mechanisms are completely bounded by other mechanisms and require no further analysis.
Background: A stationary river ice cover, whether an ice sheet The information provided by the licensee was sufficient to address or a jam, introduces an additional boundary and therefore the information need request. increases energy losses. This translates to an increase in stage compared to open-water conditions for the same discharge. Flood stages during an ice jam can increase more rapidly and attain higher levels than those associated with open-water conditions. Ice jam flooding may take place outside the regulatory floodplain, often when the river flow would not otherwise cause problems.
The release of an ice jam several miles downstream of the site and the Marietta gage in 1996 resulted in a peak discharge of 909,000 cfs [cubic feet per second] at the Conowingo gage, as compared to the peak discharge at Marietta of 601,000 cfs, even though the increase in drainage area goes from 25,990 mi2 at Marietta to 27, 100 mi2 at Conowingo. A number of ice jam events have been noted on the Susquehanna River between Harrisburg and Conowingo, some of which may have resulted in higher stages than those associated with the January 1996 flood event at a particular location.
A cursory sensitivity analysis was performed assuming an ice jam located at the west channel York Haven Dam extending upstream approximately 2 miles with the east channel assumed to remain ice-free, with a discharge of 566,000 cfs at the upstream and downstream model boundaries. This resulted in a peak stage approximately 9 feet higher than open water conditions at the site, or a stage roughly equivalent to an open-water discharge of 1, 100,000 cfs.
Request: Please clarify what discharge value may produce a stage equivalent to an open water discharge (no ice jam) of 1, 100,000 cfs, assuming either an ice jam similar to those

- 11 -
INFO INFORMATION NEED DESCRIPTION ACTION (POST-AUDIT)
NEED
historically observed were to occur immediately downstream of the site, or if the release of a large ice jam from upstream of the plant, as has been historically noted, were to occur.
16 Flood Related Changes In response to this information need request the licensee provided additional information on the sources of bathymetry. While some
Background: The NRG staff noticed that the TMI FHRR older bathymetry was used in the middle channel just downstream contained, possibly outdated, bathymetry data (1978) which from the site, it is agreed that any changes in bathymetry would may change the computed water surface elevations. likely have minimal effect on the computed water surface
considering the maximum depths. The information provided by the Request: licensee was sufficient to address the information need request. Please clarify if there was any attempt to verify that the 35+ year old bathymetry is still applicable.
17 Rivers and Streams In response to this information need request the licensee noted that the complex flow conditions in this area were one reason why
Background: The reference document and HEC-RAS model the RiverFlow2D model results superseded the HEC-RAS model files reference an inline structure (IS) (IS 71313.43) results. representing the York Haven West Channel Dam. This IS and its bounding cross sections follow the West Channel Dam then The licensee also noted that the RiverFlow2D model was come back across the east channel (described as "bent" river calibrated and executed independently from the HEC-RAS model. cross section in Figure 17 on page 43/282). The cross section Since the RiverFlow2D model results supersede the HEC-RAS and IS layout results in a water surface top width of over 9300 ft model results, the information provided by the licensee was and a flow area of over 260,000 ft2. The straight line sufficient to address the information need request. measurement across the channel at this location (endpoint to endpoint of transect) is approximately 4300 ft.
Request: Please clarify the assumptions used to justify the cross section layout considering that the West Channel Dam is submerged during the PMF as it is overtopped by about 30 ft. Additionally, please clarify the impact to water surface elevations at TMI as a result of the cross section layout in the vicinity of the York Haven West Channel Dam.

- 12 -
INFO INFORMATION NEED DESCRIPTION ACTION (POST-AUDIT)
NEED
Supplemental Request:
Background: The licensee's response to information need 17 noted that "The complex flow conditions in this area of the Susquehanna River is one of the reasons why the RiverFlow2D model results superseded the HEC-RAS model results." However, in the last paragraph of the response, it is noted that the "Results in Table 1 indicate that the current cross section alignments provide water surface elevations that are comparable to the RiverFlow2D model results." The impact to the HEC-RAS computed water surface due to accounting for over double the top width is not discussed.
A cursory sensitivity analysis was conducted on the width of the lnline Structure. Reducing the width of the lnline Structure and associated cross sections in HEC-RAS to the measured straight line width (approx. 4300 ft) increased the water surface elevation.
Request: Please clarify if the HEC-RAS and RiverFlow2D models were independently run. Additionally, clarify if the HEC-RAS model calibration has any impact on the RiverFlow2D calibration (Figure 29 of the TMI FHRR shows the two models matching}, or if changing the lnline Structure would require further adjustment to the HEC-RAS model only.
Rivers and Streams
18 In response to this information need request the licensee provided Background: The NRC staff noticed that, in the TMI FHRR, the the HEC-RAS river stations and RiverFlow2D nodes used to RiverFlow2D model water surface elevations along the transect develop the rating curves. The information provided by the for HEC-RAS river station 84820.44 shows a variation of over 1 licensee was sufficient to address the information need request. ft.
INFO NEED
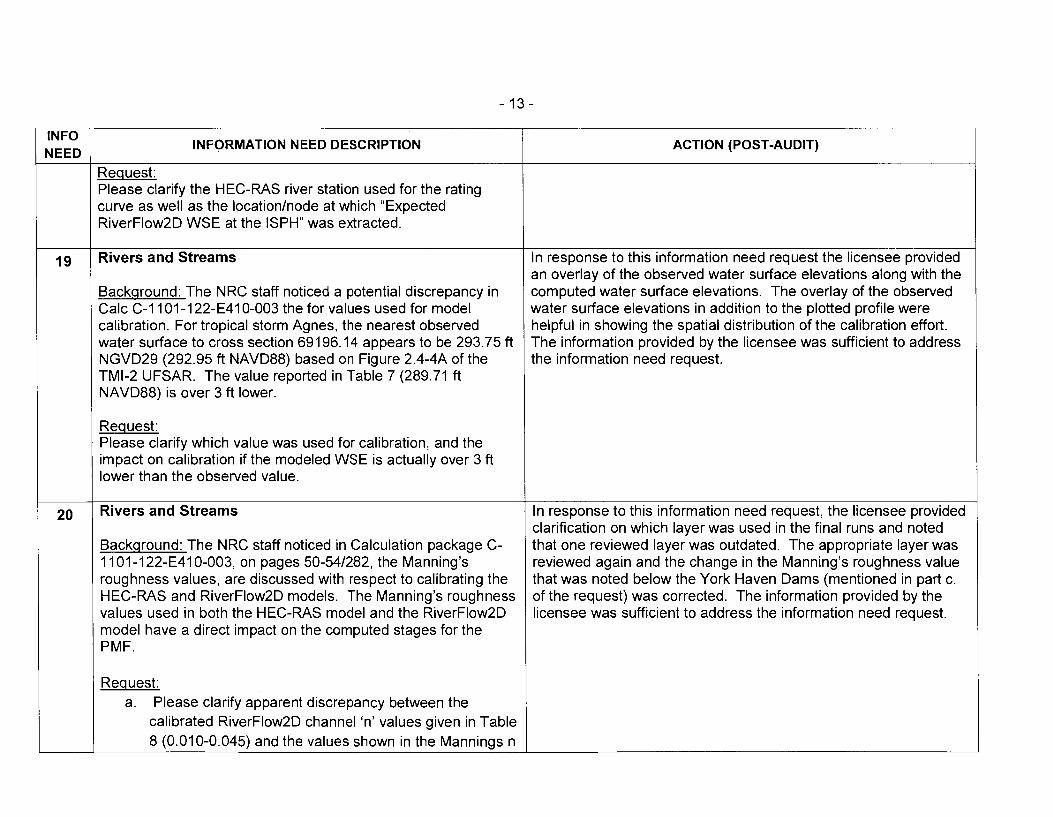
19
20
- 13 -
INFORMATION NEED DESCRIPTION
Request: Please clarify the HEC-RAS river station used for the rating curve as well as the location/node at which "Expected RiverFlow20 WSE at the ISPH" was extracted.
Rivers and Streams
Background: The NRC staff noticed a potential discrepancy in Cale C-1101-122-E410-003 the for values used for model calibration. For tropical storm Agnes, the nearest observed water surface to cross section 69196.14 appears to be 293. 75 ft NGVD29 (292.95 ft NAVD88) based on Figure 2.4-4A of the TMl-2 UFSAR. The value reported in Table 7 (289.71 ft NAVD88) is over 3 ft lower.
Request: Please clarify which value was used for calibration, and the impact on calibration if the modeled WSE is actually over 3 ft lower than the observed value.
Rivers and Streams
Background: The NRC staff noticed in Calculation package C-1101-122-E410-003, on pages 50-54/282, the Manning's roughness values, are discussed with respect to calibrating the HEC-RAS and RiverFlow2D models. The Manning's roughness values used in both the HEC-RAS model and the RiverFlow2D model have a direct impact on the computed stages for the PMF.
Request: a. Please clarify apparent discrepancy between the
calibrated RiverFlow2D channel 'n' values given in Table 8 (0.010-0.045) and the values shown in the Mannings n
ACTION (POST-AUDIT)
In response to this information need request the licensee provided an overlay of the observed water surface elevations along with the computed water surface elevations. The overlay of the observed water surface elevations in addition to the plotted profile were helpful in showing the spatial distribution of the calibration effort. The information provided by the licensee was sufficient to address the information need request.
In response to this information need request, the licensee provided clarification on which layer was used in the final runs and noted that one reviewed layer was outdated. The appropriate layer was reviewed again and the change in the Manning's roughness value that was noted below the York Haven Dams (mentioned in part c. of the request) was corrected. The information provided by the licensee was sufficient to address the information need request.

- 14 -
INFO INFORMATION NEED DESCRIPTION ACTION (POST-AUDIT) NEED
layer in the MESH_SPATIAL_DATA ("TMl_ V45_steady.mmb" Argus ONE file (\Amee Foster Wheeler\16_ TMl-Final-DataRCC\C-1101-122-E410-003\04_Models\01_RiverFlow20\ 04A-TMl_R2D_FV_ 45_Scen_ 1_WDB_Steady\UPDATE) which go as low as 0.006.
b. Reference document: Cale C-1101-122-E410-003, page 51/282, Table 8 - Manning's n value comparison.
While it is understood that some variation in roughness values between 1 D and 20 models is expected, the variation is typically consistent (i.e. all roughness values need to be either raised or lowered). Please clarify justification for range (0.010-0.045) in channel roughness values for 20 model compared to the single roughness from the 1 D model (0.025).
C. Reference document: Cale C-1101-122-E410-003. 20 roughness value variations. Based on the GIS layer (\Amee Foster Wheeler\16_ TMl-Final-DataRCC\C-1101-122-E410-003\01_GIS\7046-GIS files\20Modeling\Manning'sn\mannings_n.shp), channel roughness values appear to abruptly change from 0.010 below Shelly Island to 0.045 in the middle channel (R3.1 in HEC-RAS model). Please clarify if there is a physical change in channel characteristics to justify this change or if the abrupt change was required for calibration of the model to observed water surface elevations. This same comment applies to other locations where abrupt changes in roughness values are used without obvious changes in channel characteristics (based on aerial imagery), e.g. the reach below the York Haven Dams where roughness appears to change from 0.015 on the upstream end to 0.055 on the downstream end.

- 15 -
INFO INFORMATION NEED DESCRIPTION ACTION (POST-AUDIT)
NEED
21 Dam Breach In response to this information need request the licensee acknowledged that the wrong Hr value was inadvertently used in
Background: The NRC staff noticed a potential discrepancy in computations. However, the licensee noted that the error does not the Hr dam breach parameter value that were calculated using affect the breach parameters because they were selected based spreadsheet C-1101-122-E410-012_Dam Breach on other factors, resulting in using a different method. The Parameters1_2.xlsx. The computed dam breach parameters information provided by the licensee was sufficient to address the have a direct impact on discharge at the site. information need request.
Request: Please clarify use of Hr other than 15m (e.g. 19-25m used in failure time calculation for Xu and Zhang - individual dams).
23 Ice Jams In response to this information need request the licensee indicated that the 1996 event did not challenge the flood protection dike at
Background: Ice jams can be very localized in their impact on the plant site. stage and therefore may not necessarily translate from one location to another. It is quite possible that the maximum In response to the supplemental request, the licensee indicated difference between observed stage and rating curve stage for that conditions downstream at Marietta are significantly different the observed discharge may have been significantly greater at a than those upstream of the plant site, making the formation and location other than a USGS [United States Geological Survey] release of an ice jam much less likely upstream at the plant site gage. than downstream near Marietta as occurred in 1996. The licensee
further indicated that historic observations support this assertion. Original Request: Please clarify the conclusion that the most The information provided by the licensee was sufficient to address severe historic ice jam is bounded by the Flood Protection Dike the information need request. design discharge (p. 10 of calculation package C-1101-122-E410-015).
Supplemental Request:
Background: A stationary river ice cover, whether an ice sheet or a jam, introduces an additional boundary and therefore increases energy losses. This translates to an increase in stage compared to open-water conditions for the same discharge. Flood stages during an ice jam can increase more rapidly and attain hiQher levels than those associated with open-water

- 16 -
INFO INFORMATION NEED DESCRIPTION ACTION (POST-AUDIT)
NEED
conditions. Ice jam flooding may take place outside the regulatory floodplain, often when the river flow would not otherwise cause problems (EM 1110-2-1612, U.S. Army Corps of Engineers, 2002).
The release of an ice jam several miles downstream of the NPP site and the Marietta gage in 1996 (Ice Engineering Information Exchange Bulletin, Number 21, U.S. Army Corps of Engineers, April 1999) resulted in a peak discharge of 909,000 cfs at the Conowingo gage, as compared to the peak discharge at Marietta of 601,000 cfs (USGS), even though the increase in drainage area goes from 25,990 mi2 at Marietta to 27, 100 mi2 at Conowingo. A number of ice jam events have been noted on the Susquehanna River between Harrisburg and Conowingo, some of which may have resulted in higher stages than those associated with the January 1996 flood event at a particular location (Ice Engineering Information Exchange Bulletin, Number 21, U.S. Army Corps of Engineers, April 1999).
A cursory sensitivity analysis was performed and resulted in a peak stage higher than open water conditions at the NPP site.
Request: Please clarify what physical limitations exist either upstream or downstream of the site which would preclude either the formation of an ice jam immediately downstream of the site, or the release of a large ice jam from upstream of the site that would produce a stage equivalent to the Flood Protection Dike design discharge of 1, 100,000 cfs.
24 Dam Breaches and Failures In response to this information need request the licensee provided results of a sensitivity analysis with gates open versus gates
Background: The NRC staff noticed that model runs assumed closed, as well as differing starting pools, showing the results that dam gates are open throughout the simulation. By having differed by slightly more than 2%, which is well within the modeling gates open, it may be that individual reservoirs are drawn down uncertainty. The information provided by the licensee was in advance of the peak inflow event, thereby reducing the sufficient to address the information need request.

- 17 -
INFO INFORMATION NEED DESCRIPTION ACTION (POST-AUDIT)
NEED
ultimate peak at the site. It should be noted that this operation may not be consistent with USACE operations, which would tend to hold releases so as to prevent/minimize any downstream flooding at target locations (at least until pools reach surcharge elevations).
Request: Please clarify how sensitive the PMF results are to assumption of gates open for all dams throughout the simulation.
25 Rivers and Streams In response to this information need request the licensee indicated that Atlas 14 was available for Pennsylvania and Maryland, but not
Background: Precipitation depths up to the 500-year event are for New York at the time of analysis. The licensee also indicated presented in the analysis. Derivation of the 500-year depths that the 500-year rainfall depths were significantly greater than presented here may be highly sensitive to the distribution 40% of the PMP, per NUREG/CR-7046. The information provided selected for extending the depth-frequency results as well as by the licensee was sufficient to address the information need the number of gages analyzed, which may have an impact on request. the uncertainty involved in the precipitation depth.
Request: Please clarify if derived 500-year precipitation depths were compared to Atlas 14 numbers, as Atlas 14 results are the most recent available data for precipitation depths in this area.
26 Rivers and Streams In response to this information need request the licensee indicated that the infiltration rates were representative of the 1996 event in
Background: The NRC staff noticed in the TMI FHRR that the the subbasins that experienced the worst event conditions, and infiltration loss rates were not reduced for PMF scenarios 2 and that is was reasonable to extend those conditions to the remaining 3 discussed. Typically, we might expect to see reduced subbasins. infiltration rates during snowmelt events, due to frozen soil conditions. Since all of the calibration events were summer- In response to the supplemental request, the licensee indicated type events, calibrated basin conditions may not be that a sensitivity analysis showed that reducing the infiltration loss representative of a frozen soil condition. rates by 30% resulted in a peak discharge that increased by 8%
but was still more than 8% lower than the governing peak

- 18 -
INFO INFORMATION NEED DESCRIPTION ACTION (POST-AUDIT)
NEED
Original Request: discharge at the plant site. The information provided by the In consideration of PMF scenarios 2 and 3, please provide licensee was sufficient to address the information need request. additional clarification as to why infiltration loss rates were not reduced.
Supplemental Request:
Background: Peak runoff from large snowmelt events is driven by the volume of water available, the rate at which snowpack is converted to liquid water and the volume of, and rate at which liquid water is lost to infiltration (and storage). The infiltration rate of a soil column can be greatly reduced if the soil profile is frozen at the onset of snowmelt. An early, heavy snowpack (such as occurred in 1995-6) may insulate the soil below from becoming completely frozen prior to an early snowmelt. The soil profile may be frozen to a greater depth if snowpack is absent or light at the onset of significantly cold weather, thus greatly reducing infiltration losses later in the season if a heavy snowpack accumulates over frozen soil. Calibration of a model to a rain-on-snow event over a basin with minimal frost penetration may lead to overestimating loss rates for a similar event over a basin with deeper frost penetration, thus underestimating the ultimate discharge estimated.
Supplemental Request: Please clarify if other rain-on-snow or snowmelt events were evaluated to confirm the infiltration loss rates used for the cool season PMF calculations discussed in the TMI FHRR.
27 Rivers and Streams In response to this information need request the licensee indicated that the calibrated model "weighted", rather than "averaged" the
Background: The NRC staff noticed that a combined model was calibrated parameters, so as to give more weight to the more created from the individually calibrated models (Cale C-1101- severe runoff conditions. The licensee also indicated that the 122-E410-010). Even though each of the calibration events was calibrated model appropriately reproduced the two largest events, a relatively significant flood event, the effect of producing a while over predicting the smaller of the 3 calibration events. The

- 19 -
INFO INFORMATION NEED DESCRIPTION ACTION (POST-AUDIT) NEED
"combined" model may be to average the various parameters information provided by the licensee was sufficient to address the for each subbasin and routing reach. This may result in a information need request. watershed model that does not produce a reasonably severe hydrologic condition for the PMP/PMF event.
Request: Please clarify why the combined model (from Calculation C-1101-122-E410-010) is the best representation of basin conditions during a PMF-type event (Calc-C-1101-122-E410-011 ).
- 20 -
ATTACHMENT 1 Three Mile Island, Unit 1 Audit Document List
1. Exelon Generating Company, LLC (Exelon) 2015a, Three Mile Island Flood Hazard Reevaluation Report, Rev. 2, NRC Docket No. 50-289, August 5, 2015.
2. Exelon 2015b, "River Stage Discharge and Discharge Frequency Analysis," Calculation/Analysis No. C-1101-122-E410-003, August 2015.
3. Exelon 2014, "HEC-HMS Susquehanna River Basin Model," Calculation/Analysis No. C-1101-122-E410-010, May 2014.
4. Exelon 2015c, "Precipitation Driven Discharge Calculation Package," Calculation/Analysis No. C-1101-122-E410-011, August 2015.
5. Exelon 2015d, Dam Failure Peak Discharge Calculation Package," Calculation/Analysis No. C-1101-122-E410-012, August 2015.
6. Exelon 2015e, "Ice Induced Flooding Evaluation, "Calculation/Analysis No. C-1101-122-E410-015, August 2015.

- 21 -
ATTACHMENT 2 List of Exelon Audit Participants
Name Organization 1. David Distel Exelon
2. Joe Bellini Aterra Solutions
3. Jesse Lucas Exelon
4. Shaun Kline Exelon
5. Vined Aggarwal Exelon
6. Chuck Behrend Exelon
7. Tom O'Reilly Exelon
8. Kyle Kaminski Exelon Consultant
9. Tim Dean Exelon Consultant
10. James Barbis Exelon Consultant
11. William Mcsorley Exelon

B. Hanson -3-
NUCLEAR REGULATORY COMMISSION REPORT FOR THE AUDIT OF EXELON GENERATING COMPANY LLC'S FLOOD HAZARD REEVALUATION REPORT SUBMITTAL RELATING TO THE NEAR-TERM TASK FORCE RECOMMENDATION 2.1-FLOODING FOR THREE MILE ISLAND NUCLEAR STATION, UNIT 1, DATED February 7, 2017
DISTRIBUTION: PUBLIC TGovan, NRR RidsNrrDorllpl1-2 Resource RidsRgn1 MailCenter Resource RidsOpaMail Resource ACampbell, NRO BHarvey, NRO
JLD R/F LQuinn-Willingham, NRO RidsNrrDorl Resource RidsNrrLASLent RidsAcrsAcnw_MailCtr Resource MWillingham, NRO
RidsNRRJLD Resource RidsNroDsea Resource RidsNrrPMThreeMilelsland Resource RidsOgcMailCenter Resource CCook, NRO KSee, NRO
ADAMS Accession No.: ML 17017A351 *via email
llOFFICE NRR/JLD/JHMB/PM NRR/JLD/JHMB/LA NRR/JLD/JHMB/BC NRO/DSEA/R~ llNAME TGovan Slent GBowman KSee
DATE 02/06/2017 01/19/2017 021 /2017 01/17/2016
OFFICE NRO/DSEA/RHM1/BC* NRR/JLD/JHMB/PM NAME CCook TGovan
DATE 02/03/2017 02/7/2017
OFFICAL RECORD COPY


![Induction andInduction and Augmentation of Labor Basis and Methods for Current Practice.[Review].pdf Augmentation of Labor Basis and Methods for Current Practice.[Review]](https://img.pdfslide.net/doc/110x75/55cf8c6d5503462b138c481e/induction-andinduction-and-augmentation-of-labor-basis-and-methods-for-current.jpg)


![[Lehman Brothers] Trading the Cash-CDS Basis in the Current Environment](https://img.pdfslide.net/doc/110x75/5533a0d85503460f068b4878/lehman-brothers-trading-the-cash-cds-basis-in-the-current-environment.jpg)