Embed Size (px)
Citation preview
Mr. Norio Usui Senior Country Economist Philippines Country Office, Asian Development Bank
Mr. Norio Usui is a senior country economist in the Philippines Country Office of the Asian Development Bank. He previously worked with the Central and West Asia, and Economics and Research departments. Before joining ADB in 2005, he was an associate professor of development economics at Kansai University, Chiba University, and the University of Shizuoka in Japan. He was policy advisor for the Indonesian Government between 1998 and 2000. He obtained his master’s degree and Ph.D. from the University of Tokyo, and completed an executive education program on new thinking on growth and development policy at the Kennedy School of Government in Harvard University. His current research topics in the Philippines Country Office include: structural transformation and long-term growth performance; public support (industrial policy) for industrialization; policy options for tax reforms; impact evaluation of conditional cash transfer; and inter-governmental fiscal relations and local finance. His papers have appeared in economic journals such as World Development, Resources Policy, Singapore Economic Review, and Cambridge Journal of Economics. His latest publication is “Taking the Right Road for Inclusive Growth: Industrial Upgrading and Diversification in the Philippines.”

Norio Usui 15 July 2013 DBP Development Forum
1
Linking Growth with Development
Searching for an Inclusive Growth in the Philippines
DBP Development Forum
Norio Usui
Philippines Country Office, Asian Development Bank
15 July 2013
Surpassing even PRC - A top news on 30 May 2013 -
7.8 7.7
6.0
5.3 4.9
4.1
0
2
4
6
8
10
Philippines PRC Indonesia Thailand Viet Nam Malaysia
GDP growth rate (1st Q, 2013)
The Philippines is shining brilliantly
2012 2013f 2014f
South Asia 5.0 5.7 6.2
India 5.0 6.0 6.5
Pakistan 3.7 3.6 3.5
Sri Lanka 6.4 6.8 7.2
Southeast Asia 5.5 5.4 5.7
Indonesia 6.2 6.4 6.6
Malaysia 5.6 5.3 5.5
Philippines 6.6 6.0 5.9
Singapore 1.3 2.6 3.7
Thailand 6.4 4.9 5.0
Viet Nam 5.0 5.2 5.6
2012 2013f 2014f
Central Asia 5.6 5.5 6.0
Azerbaijan 2.2 3.1 4.8
Kazakhstan 5.0 5.2 5.6
East Asia 6.5 7.1 7.1
China, People’s Rep. of 7.8 8.2 8.0
Hong Kong, China 1.4 3.5 3.8
Korea, Rep. of 2.0 2.8 3.7
Taipei,China 1.3 3.5 3.9
The Pacific 7.3 5.2 5.5
Fiji 2.5 2.0 2.3
Papua New Guinea 9.2 5.5 6.0
f: forecast
It’s more fun in the Philippines
Strong Economic
growth Lower inflation
Improving budget balance
Sound external balances PPP starts
moving
Investment grading
Booming BPOs
Soaring stock prices
Healthy financial
sector
Robust remittances
Improving rankings in
business surveys
Structural FOREX inflows
18,091
23,352
0
5,000
10,000
15,000
20,000
25,000
30,000
35,000
40,000
45,000
1999 2001 2003 2005 2007 2009 2011
$ million
Remittances and Services exports
Services exports OFW Remittances
0
20,000
40,000
60,000
80,000
100,000
0
2
4
6
8
10
12
14
20
00
20
01
20
02
20
03
20
04
20
05
20
06
20
07
20
08
20
09
20
10
20
11
20
12
Ap
r 2
01
3
Gross International Reserves
In $ mn (right axis)
Import cover, no. of months
-6,000
-4,000
-2,000
0
2,000
4,000
6,000
8,000
10,000
-6
-4
-2
0
2
4
6
8
10
19
99
20
00
20
01
20
02
20
03
20
04
20
05
20
06
20
07
20
08
20
09
20
10
20
11
20
12
$mn % of GDP Current Account
in $mn (right axis)
as % of GDP
generate CA surplus and lead to build up in GIR
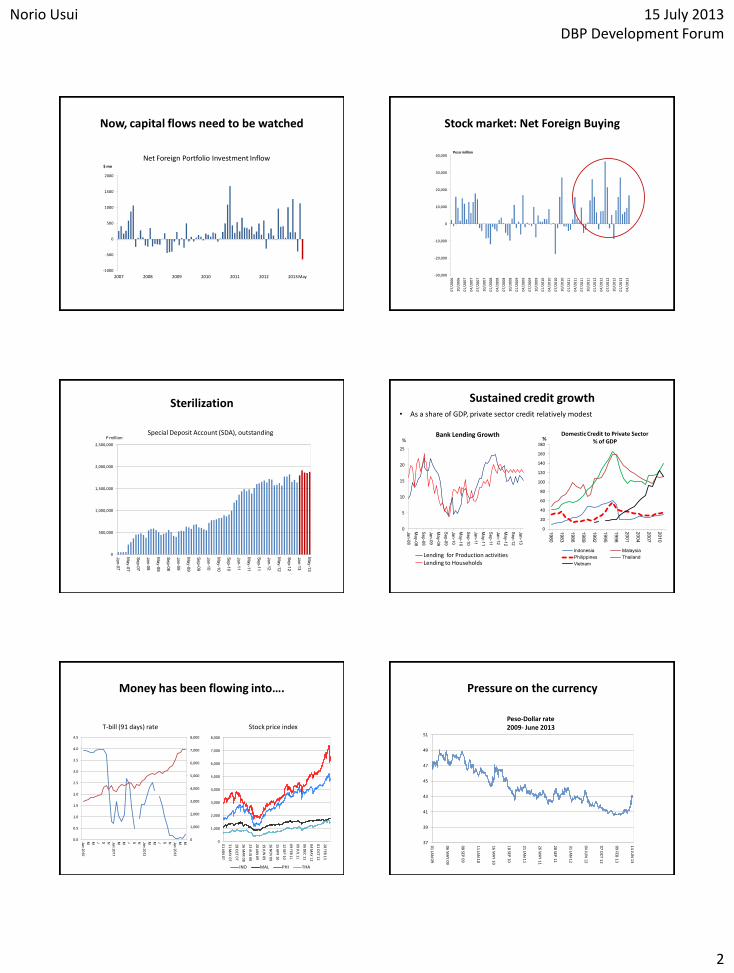
Norio Usui 15 July 2013 DBP Development Forum
2
Now, capital flows need to be watched
-1000
-500
0
500
1000
1500
2000
2007 2008 2009 2010 2011 2012 2013 May
$ mn
Net Foreign Portfolio Investment Inflow
Stock market: Net Foreign Buying
-30,000
-20,000
-10,000
0
10,000
20,000
30,000
40,000
07
/20
06
10
/20
06
01
/20
07
04
/20
07
07
/20
07
10
/20
07
01
/20
08
04
/20
08
07
/20
08
10
/20
08
01
/20
09
04
/20
09
07
/20
09
10
/20
09
01
/20
10
04
/20
10
07
/20
10
10
/20
10
01
/20
11
04
/20
11
07
/20
11
10
/20
11
01
/20
12
04
/20
12
07
/20
12
10
/20
12
01
/20
13
04
/20
13
Peso million
Sterilization
Special Deposit Account (SDA), outstanding
0
500,000
1,000,000
1,500,000
2,000,000
2,500,000
Ja
n-0
7
Ma
y-0
7
Sep-0
7
Ja
n-0
8
Ma
y-0
8
Sep-0
8
Ja
n-0
9
Ma
y-0
9
Sep-0
9
Ja
n-1
0
Ma
y-1
0
Sep-1
0
Ja
n-1
1
Ma
y-1
1
Sep-1
1
Ja
n-1
2
Ma
y-1
2
Sep-1
2
Ja
n-1
3
Ma
y-1
3
P million
Sustained credit growth
0
20
40
60
80
100
120
140
160
180
19
80
19
83
19
86
19
89
19
92
19
95
19
98
20
01
20
04
20
07
20
10
% Domestic Credit to Private Sector
% of GDP
Indonesia Malaysia
Philippines Thailand
Vietnam
• As a share of GDP, private sector credit relatively modest
0
5
10
15
20
25
Ja
n-0
8
Ma
y-0
8
Sep-0
8
Ja
n-0
9
Ma
y-0
9
Sep-0
9
Ja
n-1
0
Ma
y-1
0
Sep-1
0
Ja
n-1
1
Ma
y-1
1
Sep-1
1
Ja
n-1
2
Ma
y-1
2
Sep-1
2
Ja
n-1
3
% Bank Lending Growth
Lending for Production activities Lending to Households
Money has been flowing into….
Stock price index
0
1,000
2,000
3,000
4,000
5,000
6,000
7,000
8,000
01
JAN
07
31
MA
Y 07
28
OC
T 07
26
MA
R 0
8
23
AU
G 0
8
20
JAN
09
19
JUN
09
16
NO
V 0
9
15
AP
R 1
0
12
SEP 1
0
09
FEB 1
1
09
JUL 1
1
06
DEC
11
04
MA
Y 12
01
OC
T 12
28
FEB 1
3
INO MAL PHI THA
0
1,000
2,000
3,000
4,000
5,000
6,000
7,000
8,000
0.0
0.5
1.0
1.5
2.0
2.5
3.0
3.5
4.0
4.5
Jan 2
010
M
M
J
S
N
Jan 2
011
M
M
J
S
N
Jan 2
012
M
M
J
S
N
Jan 2
013
M
M
T-bill (91 days) rate
Pressure on the currency
37
39
41
43
45
47
49
51
01
JAN
09
06
MA
Y 09
08
SEP 0
9
11
JAN
10
16
MA
Y 10
18
SEP 1
0
21
JAN
11
26
MA
Y 11
28
SEP 1
1
31
JAN
12
04
JUN
12
07
OC
T 12
09
FEB 1
3
14
JUN
13
Peso-Dollar rate 2009- June 2013
Norio Usui 15 July 2013 DBP Development Forum
3
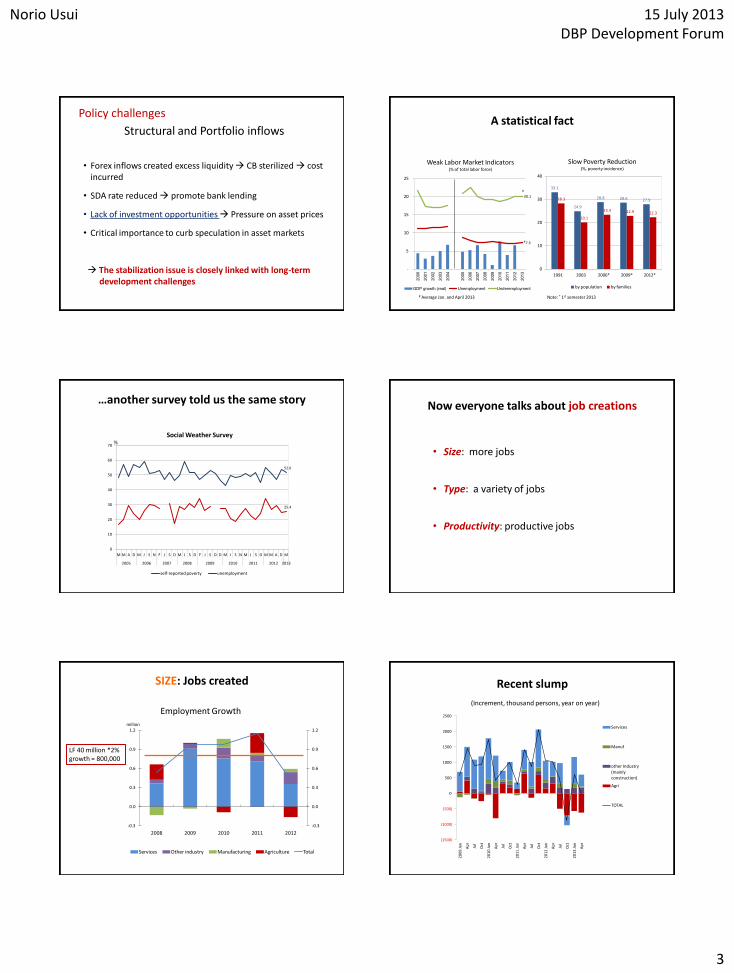
• Forex inflows created excess liquidity CB sterilized cost incurred
• SDA rate reduced promote bank lending
• Lack of investment opportunities Pressure on asset prices
• Critical importance to curb speculation in asset markets
The stabilization issue is closely linked with long-term development challenges
Policy challenges
Structural and Portfolio inflows
33.1
24.9
28.8 28.6 27.9 28.3
20.1
23.4 22.9 22.3
0
10
20
30
40
1991 2003 2006* 2009* 2012*
by population by families
Note: * 1st semester 2013
A statistical fact
7.3
20.1
-
5
10
15
20
25
2000
2001
2002
2003
2004
2005
2006
2007
2008
2009
2010
2011
2012
2013
GDP growth (real) Unemployment Underemployment
# Average Jan. and April 2013
#
#
Slow Poverty Reduction (%, poverty incidence)
Weak Labor Market Indicators (% of total labor force)
…another survey told us the same story
52.0
25.4
0
10
20
30
40
50
60
70
M M A D M J S N F J S D M J S D F J S O D M J S N M J S D M M A D M
2005 2006 2007 2008 2009 2010 2011 2012 2013
self-reported poverty unemployment
Social Weather Survey %
Now everyone talks about job creations
• Size: more jobs
• Type: a variety of jobs
• Productivity: productive jobs
SIZE: Jobs created
-0.3
0.0
0.3
0.6
0.9
1.2
-0.3
0.0
0.3
0.6
0.9
1.2
2008 2009 2010 2011 2012
million
Employment Growth
Services Other industry Manufacturing Agriculture Total
LF 40 million *2% growth = 800,000
Recent slump
(1500)
(1000)
(500)
0
500
1000
1500
2000
2500
20
09
Jan
Ap
r
Jul
Oct
20
10
Jan
Ap
r
Jul
Oct
20
11
Jan
Ap
r
Jul
Oct
20
12
Jan
Ap
r
Jul
Oct
20
13
Jan
Ap
r
Services
Manuf
other Industry (mainly construction)
Agri
TOTAL
(Increment, thousand persons, year on year)
Norio Usui 15 July 2013 DBP Development Forum
4
TYPE: Growing business process outsourcing
777
1,300
1.9
3.0
0.0
1.0
2.0
3.0
4.0
5.0
6.0
0
250
500
750
1,000
1,250
1,500
2006 2007 2008 2009 2010 2011 2012 2013 2014 2015 2016
Employment ('1000) % of total labor force
Business Process Association of the Philippines (BPAP)
BPAP target
Educational attainment of labor force by sector
0
10
20
30
40
50
60
70
80
90
100
Agriculture Industry Services
Non-HS graduate HS graduate College undergraduate College graduate
(%)
skilled workers
unskilled workers
2010 LFSs
Unemployed by educational attainment
14.0 13.1
12.2 11.0
33.7 31.7
8.9
8.4
13.4
14.6
17.9 21.3
0%
10%
20%
30%
40%
50%
60%
70%
80%
90%
100%
April 2012 April 2013
Elementary and less HS not completed HS graduate
Post secondary College undergraduate College graduate
Modern services etc
Where to go?
Structural transformation
50.1 49.4
26.3
48.3
26.5
46.9
38.5 43.5
66.6
43.2
61.9
43.5
11.4 7.2 7.1 8.6 11.7 9.6
0
20
40
60
80
100
INO MAL PHI THA IND PRC
Industry Services Agriculture
-40 -30 -20 -10 0 10 20 30 40
INO
MAL
PHI
THA
PRC
IND
Industry Agriculture Services
Sector contributions to GDP growth (1980-2009, %)
Changes in employment structure (1980-2009, % point)
Implications on productivity growth
0
2,000
4,000
6,000
8,000
10,000
12,000
1980
1982
1984
1986
1988
1990
1992
1994
1996
1998
2000
2002
2004
2006
Agriculture Industry Services Manufacturing
0
2,000
4,000
6,000
8,000
10,000
12,000
1980
1982
1984
1986
1988
1990
1992
1994
1996
1998
2000
2002
2004
2006
Agriculture Industry Services Manufacturing
0
10
20
30
40
50
60
70
80
19
80
19
82
19
84
19
86
19
88
19
90
19
92
19
94
19
96
19
98
20
00
20
02
20
04
20
06
0
10
20
30
40
50
60
70
80
19
80
19
82
19
84
19
86
19
88
19
90
19
92
19
94
19
96
19
98
20
00
20
02
20
04
20
06
0
10
20
30
40
50
60
70
80
1980
1982
1984
1986
1988
1990
1992
1994
1996
1998
2000
2002
2004
2006
0
10
20
30
40
50
60
70
80
19
80
19
82
19
84
19
86
19
88
19
90
19
92
19
94
19
96
19
98
20
00
20
02
20
04
20
06
Employment by sector
Labor productivity by sector
PHI THA MAL INO
-50
0
50
100
150
200
Sectoral productivity growth Structural transfromation
PRODUCTIVITY is everything in the long run
Norio Usui 15 July 2013 DBP Development Forum
5
19,853
10,074
2,797
8,607 8,368
1,557 2,243
0
2,500
5,000
7,500
10,000
12,500
15,000
17,500
20,000
22,500
Indonesia Malaysia Philippines Thailand Viet Nam Cambodia Myanmar
2007
2008
2009
2010
2011
2012
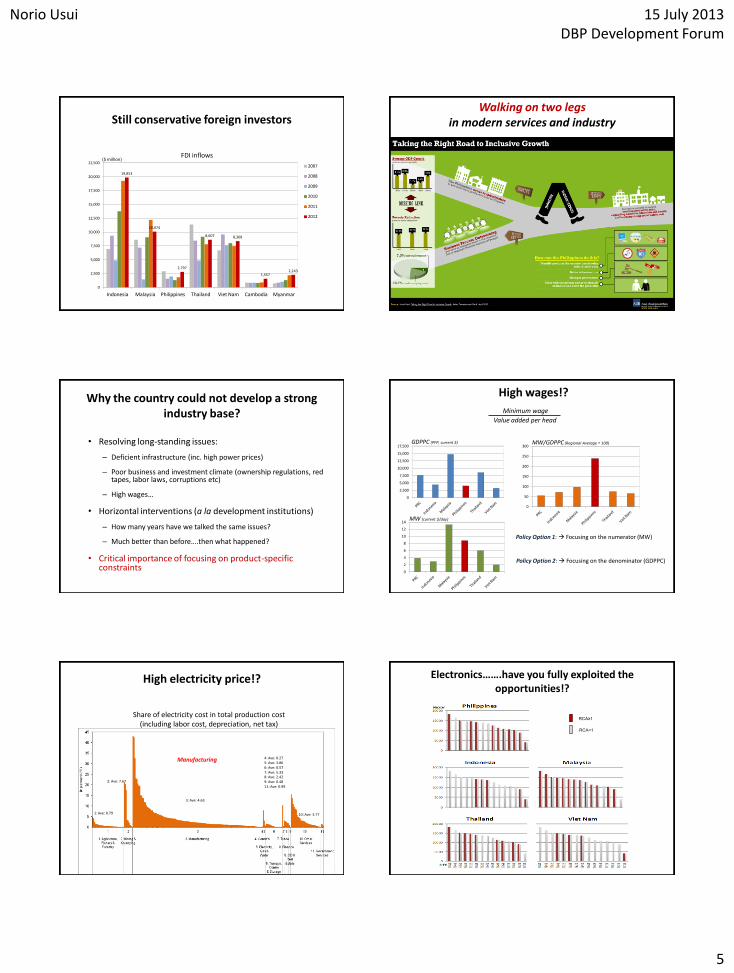
Still conservative foreign investors
($ million) FDI inflows
Walking on two legs in modern services and industry
Why the country could not develop a strong industry base?
• Resolving long-standing issues:
– Deficient infrastructure (inc. high power prices)
– Poor business and investment climate (ownership regulations, red tapes, labor laws, corruptions etc)
– High wages…
• Horizontal interventions (a la development institutions)
– How many years have we talked the same issues?
– Much better than before….then what happened?
• Critical importance of focusing on product-specific constraints
High wages!?
0
2
4
6
8
10
12
14
GDPPC (PPP, current $)
MW (current $/day)
Policy Option 1: Focusing on the numerator (MW)
Policy Option 2: Focusing on the denominator (GDPPC)
Minimum wage
Value added per head
MW/GDPPC (Regional Average = 100)
0
2,500
5,000
7,500
10,000
12,500
15,000
17,500
0
50
100
150
200
250
300
High electricity price!?
Share of electricity cost in total production cost (including labor cost, depreciation, net tax)
1: Ave: 0.79
3: Ave: 4.63
2: Ave: 7.67
4: Ave: 0.27 5: Ave: 3.86 6: Ave: 0.57 7: Ave: 5.33 8: Ave: 2.42 9: Ave: 0.48 11: Ave: 0.99
10: Ave: 3.77
Manufacturing
Electronics…….have you fully exploited the opportunities!?
RCA≥1
RCA<1

Norio Usui 15 July 2013 DBP Development Forum
6
Where are the unexploited products?
Nearby Middle Far away
How can we “choose”?
Key dimensions of product identification
Easiness to jump: Nearby? Middle? Far Away?
– Above average sophistication (direct effect)
– Opportunities for further structural change (spillover effects)
– Capacity to absorb labor (job creation)
– Others such as global demand growth
If your targets are not nearby…… foreign direct investment
42
51
18
71
43
0
10
20
30
40
50
60
70
80
Indonesia Malaysia Philippines Thailand Viet Nam
1970s
1980s
1990s
2000s
($ billion, cumulative)
Targeted public sector support - Two-step Approach -
Step 1: Identifying Products (targeted)
Norio: nearby, middle, far away + policy priorities (job creations etc)
Fita: RCA DTI’s roadmap initiative
Step 2: Diagnosing binding constraints specific to the targeted products
What are key impediments for a specific product?
Then, how can we fix the identified impediments?
Traditional “Industrial Policy”
• Investors lack either money or incentives
• Solution: give them credit or subsidies
• They will buy what they need
• Implementation: line item in the budget of the Ministry of Industry + selection mechanism on who to give the money to
Producing (& exporting) mango requires: • a certain type of soil • mechanized farming equipment • agribusinesses firms that know the market,
etc.,
but also “public goods” such as: • specific property rights • port infrastructure • road system • cold-storage facilities • phytosanitary regulations • market access agreements, etc.
Capabilities
Norio Usui 15 July 2013 DBP Development Forum
7
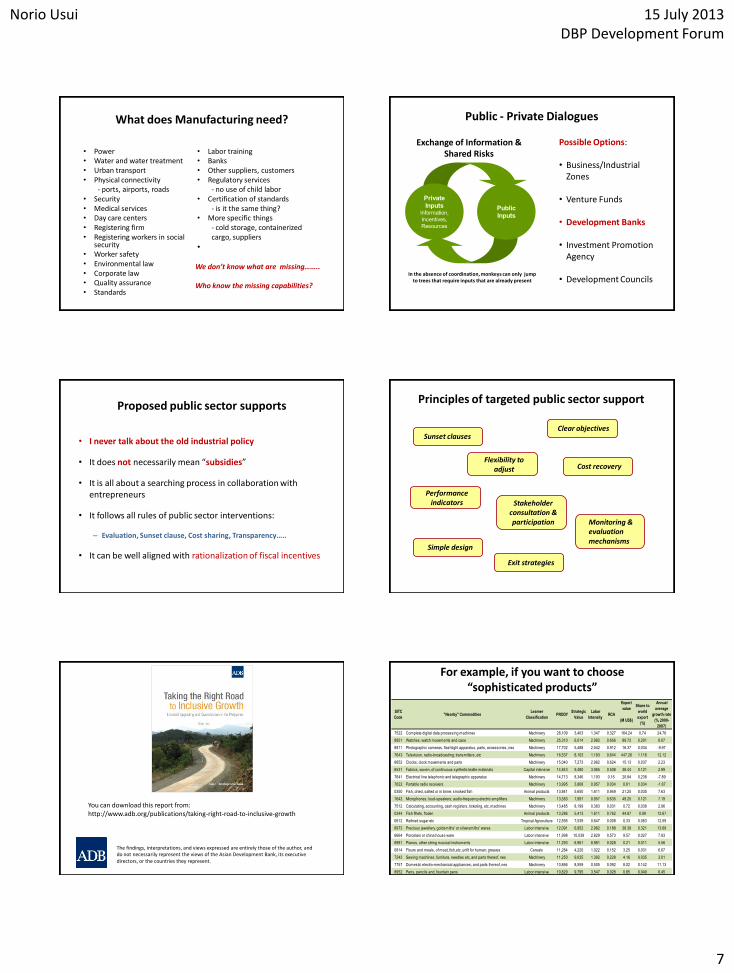
What does Manufacturing need?
• Power • Water and water treatment • Urban transport • Physical connectivity
- ports, airports, roads • Security • Medical services • Day care centers • Registering firm • Registering workers in social
security • Worker safety • Environmental law • Corporate law • Quality assurance • Standards
• Labor training • Banks • Other suppliers, customers • Regulatory services
- no use of child labor • Certification of standards
- is it the same thing? • More specific things
- cold storage, containerized cargo, suppliers
•
We don’t know what are missing…….. Who know the missing capabilities?
Public - Private Dialogues
Private
Inputs Information,
Incentives,
Resources
Public
Inputs
Exchange of Information & Shared Risks
In the absence of coordination, monkeys can only jump to trees that require inputs that are already present
Possible Options: • Business/Industrial
Zones • Venture Funds
• Development Banks
• Investment Promotion
Agency
• Development Councils
Proposed public sector supports
• I never talk about the old industrial policy
• It does not necessarily mean “subsidies”
• It is all about a searching process in collaboration with entrepreneurs
• It follows all rules of public sector interventions:
– Evaluation, Sunset clause, Cost sharing, Transparency…..
• It can be well aligned with rationalization of fiscal incentives
Principles of targeted public sector support
Sunset clauses
Exit strategies
Clear objectives
Cost recovery
Performance indicators
Simple design
Monitoring & evaluation mechanisms
Flexibility to adjust
Stakeholder consultation & participation
The findings, interpretations, and views expressed are entirely those of the author, and do not necessarily represent the views of the Asian Development Bank, its executive directors, or the countries they represent.
You can download this report from: http://www.adb.org/publications/taking-right-road-to-inclusive-growth
For example, if you want to choose “sophisticated products”
Export
value
(M US$)
7522 Complete digital data processing machines Machinery 28,109 3,403 1.347 0.327 164.24 0.74 24.76
8851 Watches, watch movements and case Machinery 25,310 6,014 2.982 0.656 89.72 0.201 8.07
8811 Photographic cameras, flashlight apparatus, parts, accessories, nes Machinery 17,702 5,488 2.042 0.912 16.37 0.034 -9.97
7643 Television, radio-broadcasting; transmitters, etc Machinery 16,537 8,103 1.193 0.644 447.26 1.116 12.12
8852 Clocks, clock movements and parts Machinery 15,040 7,273 2.982 0.624 15.13 0.037 2.23
6531 Fabrics, woven, of continuous synthetic textile materials Capital intensive 14,843 9,480 3.065 0.508 38.44 0.121 2.99
7641 Electrical line telephonic and telegraphic apparatus Machinery 14,713 8,346 1.193 0.16 20.84 0.238 -7.89
7622 Portable radio receivers Machinery 13,995 3,808 0.957 0.034 0.61 0.034 -1.67
0350 Fish, dried, salted or in brine; smoked fish Animal products 13,841 5,650 1.611 0.949 21.25 0.035 7.63
7642 Microphones; loud-speakers; audio-frequency electric amplifiers Machinery 13,583 7,997 0.957 0.635 49.25 0.121 7.19
7512 Calculating, accounting, cash registers, ticketing, etc, machines Machinery 13,485 8,199 0.383 0.031 0.72 0.036 2.96
0344 Fish fillets, frozen Animal products 13,286 5,413 1.611 0.762 44.87 0.09 12.67
0612 Refined sugar etc Tropical Agruculture 12,595 7,539 0.647 0.008 0.33 0.063 12.59
8973 Precious jewellery, goldsmiths' or silversmiths' wares Labor intensive 12,091 6,952 2.982 0.188 38.39 0.321 13.69
6664 Porcelain or china house ware Labor intensive 11,998 10,039 2.829 0.573 9.57 0.027 7.93
8981 Pianos, other string musical instruments Labor intensive 11,293 6,961 8.981 0.028 0.21 0.011 5.56
0814 Flours and meals, of meat, fish,etc, unfit for human; greaves Cereals 11,284 4,220 1.022 0.152 3.25 0.031 6.67
7243 Sewing machines, furniture, needles etc, and parts thereof, nes Machinery 11,250 9,035 1.392 0.228 4.16 0.035 3.01
7757 Domestic electro-mechanical appliances; and parts thereof, nes Machinery 10,866 8,559 0.505 0.092 8.02 0.142 11.13
8952 Pens, pencils and, fountain pens Labor intensive 10,829 9,795 3.547 0.028 0.85 0.049 6.45
RCA
Share to
world
export
(%)
Annual
average
growth rate
(%, 2000-
2007)
SITC
Code"Nearby" Commodities
Leamer
ClassificationPRODY
Strategic
Value
Labor
Intensity
Norio Usui 15 July 2013 DBP Development Forum
8
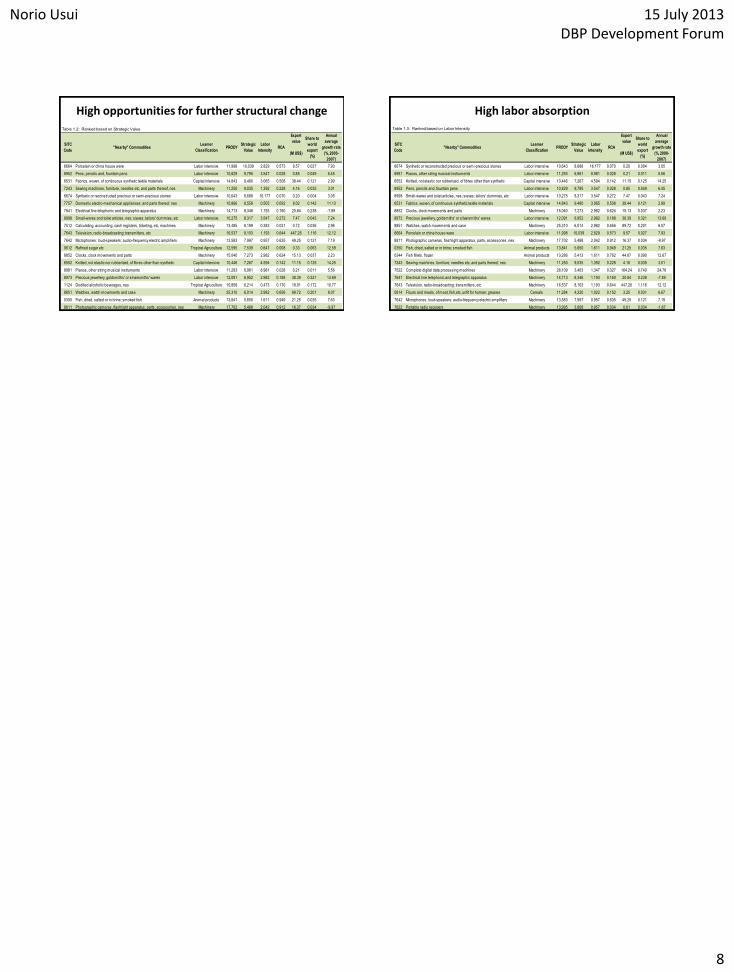
Table 1.2: Ranked based on Strategic Value
Export
value
(M US$)
6664 Porcelain or china house ware Labor intensive 11,998 10,039 2.829 0.573 9.57 0.027 7.93
8952 Pens, pencils and, fountain pens Labor intensive 10,829 9,795 3.547 0.028 0.85 0.049 6.45
6531 Fabrics, woven, of continuous synthetic textile materials Capital intensive 14,843 9,480 3.065 0.508 38.44 0.121 2.99
7243 Sewing machines, furniture, needles etc, and parts thereof, nes Machinery 11,250 9,035 1.392 0.228 4.16 0.035 3.01
6674 Synthetic or reconstructed precious or semi-precious stones Labor intensive 10,643 8,688 16.177 0.070 0.20 0.004 3.05
7757 Domestic electro-mechanical appliances; and parts thereof, nes Machinery 10,866 8,559 0.505 0.092 8.02 0.142 11.13
7641 Electrical line telephonic and telegraphic apparatus Machinery 14,713 8,346 1.193 0.160 20.84 0.238 -7.89
8998 Small-wares and toilet articles, nes; sieves; tailors' dummies, etc Labor intensive 10,275 8,317 3.547 0.272 7.47 0.043 7.24
7512 Calculating, accounting, cash registers, ticketing, etc, machines Machinery 13,485 8,199 0.383 0.031 0.72 0.036 2.96
7643 Television, radio-broadcasting; transmitters, etc Machinery 16,537 8,103 1.193 0.644 447.26 1.116 12.12
7642 Microphones; loud-speakers; audio-frequency electric amplifiers Machinery 13,583 7,997 0.957 0.635 49.25 0.121 7.19
0612 Refined sugar etc Tropical Agruculture 12,595 7,539 0.647 0.008 0.33 0.063 12.59
8852 Clocks, clock movements and parts Machinery 15,040 7,273 2.982 0.624 15.13 0.037 2.23
6552 Knitted, not elastic nor rubberized, of fibres other than synthetic Capital intensive 10,446 7,267 4.594 0.142 11.15 0.125 14.25
8981 Pianos, other string musical instruments Labor intensive 11,293 6,961 8.981 0.028 0.21 0.011 5.56
8973 Precious jewellery, goldsmiths' or silversmiths' wares Labor intensive 12,091 6,952 2.982 0.188 38.39 0.321 13.69
1124 Distilled alcoholic beverages, nes Tropical Agruculture 10,808 6,214 0.473 0.170 18.91 0.172 10.77
8851 Watches, watch movements and case Machinery 25,310 6,014 2.982 0.656 89.72 0.201 8.07
0350 Fish, dried, salted or in brine; smoked fish Animal products 13,841 5,650 1.611 0.949 21.25 0.035 7.63
8811 Photographic cameras, flashlight apparatus, parts, accessories, nes Machinery 17,702 5,488 2.042 0.912 16.37 0.034 -9.97
RCA
Share to
world
export
(%)
Annual
average
growth rate
(%, 2000-
2007)
SITC
Code"Nearby" Commodities
Leamer
ClassificationPRODY
Strategic
Value
Labor
Intensity
High opportunities for further structural change Table 1.3: Ranked based on Labor Intensity
Export
value
(M US$)
6674 Synthetic or reconstructed precious or semi-precious stones Labor intensive 10,643 8,688 16.177 0.070 0.20 0.004 3.05
8981 Pianos, other string musical instruments Labor intensive 11,293 6,961 8.981 0.028 0.21 0.011 5.56
6552 Knitted, not elastic nor rubberized, of fibres other than synthetic Capital intensive 10,446 7,267 4.594 0.142 11.15 0.125 14.25
8952 Pens, pencils and, fountain pens Labor intensive 10,829 9,795 3.547 0.028 0.85 0.049 6.45
8998 Small-wares and toilet articles, nes; sieves; tailors' dummies, etc Labor intensive 10,275 8,317 3.547 0.272 7.47 0.043 7.24
6531 Fabrics, woven, of continuous synthetic textile materials Capital intensive 14,843 9,480 3.065 0.508 38.44 0.121 2.99
8852 Clocks, clock movements and parts Machinery 15,040 7,273 2.982 0.624 15.13 0.037 2.23
8973 Precious jewellery, goldsmiths' or silversmiths' wares Labor intensive 12,091 6,952 2.982 0.188 38.39 0.321 13.69
8851 Watches, watch movements and case Machinery 25,310 6,014 2.982 0.656 89.72 0.201 8.07
6664 Porcelain or china house ware Labor intensive 11,998 10,039 2.829 0.573 9.57 0.027 7.93
8811 Photographic cameras, flashlight apparatus, parts, accessories, nes Machinery 17,702 5,488 2.042 0.912 16.37 0.034 -9.97
0350 Fish, dried, salted or in brine; smoked fish Animal products 13,841 5,650 1.611 0.949 21.25 0.035 7.63
0344 Fish fillets, frozen Animal products 13,286 5,413 1.611 0.762 44.87 0.090 12.67
7243 Sewing machines, furniture, needles etc, and parts thereof, nes Machinery 11,250 9,035 1.392 0.228 4.16 0.035 3.01
7522 Complete digital data processing machines Machinery 28,109 3,403 1.347 0.327 164.24 0.740 24.76
7641 Electrical line telephonic and telegraphic apparatus Machinery 14,713 8,346 1.193 0.160 20.84 0.238 -7.89
7643 Television, radio-broadcasting; transmitters, etc Machinery 16,537 8,103 1.193 0.644 447.26 1.116 12.12
0814 Flours and meals, of meat, fish,etc, unfit for human; greaves Cereals 11,284 4,220 1.022 0.152 3.25 0.031 6.67
7642 Microphones; loud-speakers; audio-frequency electric amplifiers Machinery 13,583 7,997 0.957 0.635 49.25 0.121 7.19
7622 Portable radio receivers Machinery 13,995 3,808 0.957 0.034 0.61 0.034 -1.67
RCA
Share to
world
export
(%)
Annual
average
growth rate
(%, 2000-
2007)
SITC
Code"Nearby" Commodities
Leamer
ClassificationPRODY
Strategic
Value
Labor
Intensity
High labor absorption