Embed Size (px)
Citation preview
MRI-2: Integrated Simulation and Safety
Year 3 Quarterly Report
Submitted by:
Dr. Essam Radwan, P.E. (PI), [email protected]
Dr. Hatem Abou-Senna, P.E. , [email protected]
Dr. Mohamed Abdel-Aty, P.E., [email protected]
Jiawei Wu
Center for Advanced Transportation Systems Simulation (CATSS)
Department of Civil, Environmental & Construction Engineering (CECE)
University of Central Florida
Orlando, FL 32816-2450
(407) 823-4738
April 9th, 2017
2
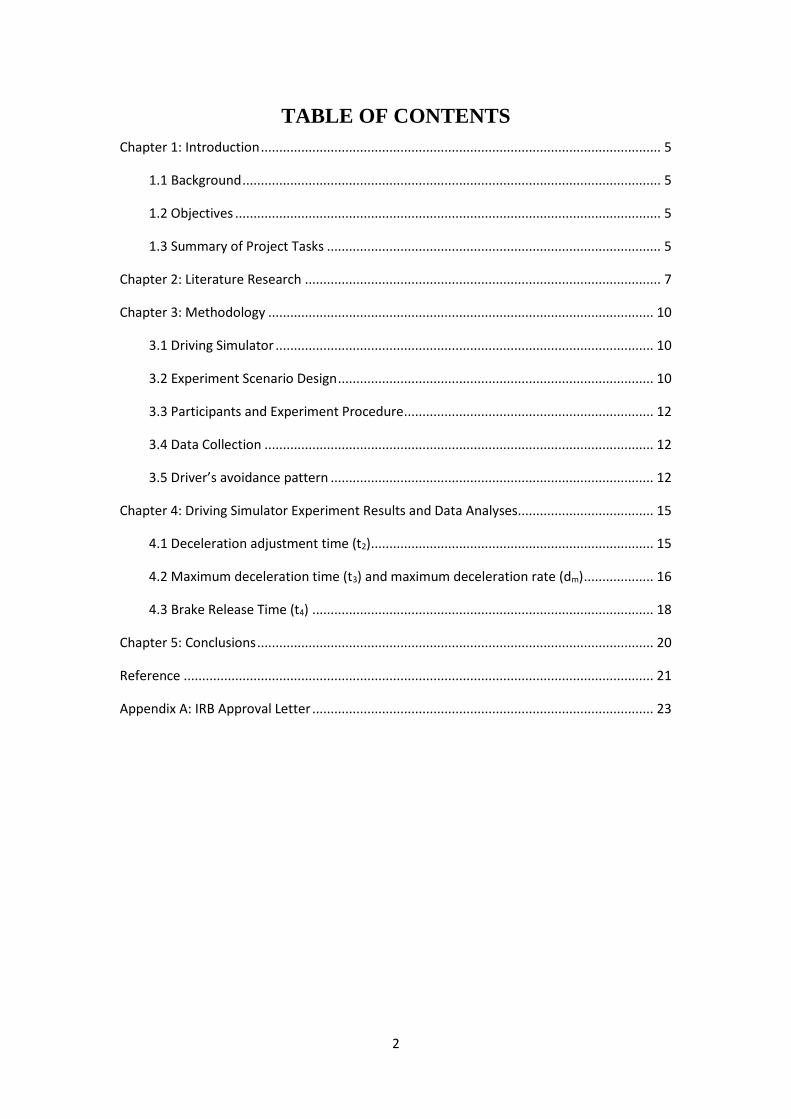
TABLE OF CONTENTS
Chapter 1: Introduction ............................................................................................................. 5
1.1 Background .................................................................................................................. 5
1.2 Objectives .................................................................................................................... 5
1.3 Summary of Project Tasks ........................................................................................... 5
Chapter 2: Literature Research ................................................................................................. 7
Chapter 3: Methodology ......................................................................................................... 10
3.1 Driving Simulator ....................................................................................................... 10
3.2 Experiment Scenario Design ...................................................................................... 10
3.3 Participants and Experiment Procedure .................................................................... 12
3.4 Data Collection .......................................................................................................... 12
3.5 Driver’s avoidance pattern ........................................................................................ 12
Chapter 4: Driving Simulator Experiment Results and Data Analyses..................................... 15
4.1 Deceleration adjustment time (t2) ............................................................................. 15
4.2 Maximum deceleration time (t3) and maximum deceleration rate (dm) ................... 16
4.3 Brake Release Time (t4) ............................................................................................. 18
Chapter 5: Conclusions ............................................................................................................ 20
Reference ................................................................................................................................ 21
Appendix A: IRB Approval Letter ............................................................................................. 23
3
LIST OF TABLES
Figure 1: UCF driving simulator ....................................................................................... 10
Figure 2: Scenario design for each pedestrian-vehicle conflict ....................................... 11
Figure 3: Drivers’ deceleration rate and the distance to crosswalk during the avoidance
period ....................................................................................................................... 13
Figure 4: Drivers’ avoidance pattern during the pedestrian-vehicle conflict .................. 13
Figure 5: Relationship between deceleration adjustment time and significant factors .... 16
Figure 6: Relationship between brake release time and significant factors ..................... 19

4
LIST OF TABLES
Table 1: Analysis of variance (ANOVA) results of deceleration adjustment time (t2) ... 15
Table 2: Descriptive statistics of six factors related to the t3 and dm ............................... 17
Table 3: Analysis of variance (ANOVA) results of maximum deceleration time (t3) and
maximum deceleration rate (dm) .............................................................................. 17
Table 4: Analysis of variance (ANOVA) results of deceleration adjustment time (t4) ... 18
5
Chapter 1: Introduction
1.1 Background
Pedestrian and bicyclist fatalities and injuries are of major concern to transportation engineers,
planners, and the public. In 2011, 4,432 pedestrians were killed and an estimated 69,000 were
injured in traffic crashes in the United States. This fatality rate represents an increase of 3
percent from 2010. For this same year, pedestrian deaths accounted for 14 percent of all traffic
fatalities, and made up 3 percent of all the people injured in traffic crashes. Almost three-fourths
(73%) of pedestrian fatalities occurred in an urban setting versus a rural setting. Over two-thirds
(70%) of pedestrian fatalities occurred at non-intersections versus at intersections.
In 2011, 677 bicyclist deaths and 38,000 injuries were reported (www.nthsa.gov 2013). The
total cost of bicyclist injury and death is over $4 billion per year. In 2009 the average age of
bicyclists killed in crashes with motor vehicles was 41 years. 87 percent of those killed were
male, and 64 percent of those killed were between the ages of 25 and 64. 13 percent of those
killed in 2008 were under age 16. The average age of bicyclists injured in crashes with motor
vehicles was 31 years and 80 percent of those injured were male. 51 percent of those injured
were between the ages of 25 and 64; 20 percent of those injured were under age 16. The bicyclist
fatality rates calculated as fatality per million population were reported to be 6.56, 0.78, and
0.46 for Florida, Tennessee, and Kentucky; respectively. The US average is reported to be 2.17.
1.2 Objectives
The fundamental objective of this research is to simulate the vehicle-pedestrian conflicts
process at midblock crossings in the driving simulator and to assess the vehicle-pedestrian
conflicts. Some potential risk factors were selected as the independent variables and a full
factorial experiment was designed for the pedestrian-vehicle conflicts in the driving simulator.
In order to analyze pedestrian-vehicle conflicts from the driver’s point of view, the surrogate
safety measures were examined to evaluate these pedestrian-vehicle conflicts. Specifically, this
part of the major research initiative #2 (MRI-2), sponsored by the Southeast Transportation
Center at the University of Tennessee as part of the University Transportation Center, is aimed
at exploring the use of simulation and simulator to evaluate vehicular/pedestrian safety
surrogate measures. The third year quarterly report includes the tasks 1-2.
1.3 Summary of Project Tasks
The third year STC project was designed around the following tasks:
Task 1 Literature Search

6
Task 2 Pedestrian-vehicle Prediction Model Development
Task 3 Field Data, Simulator and Microsimulation Association
Task 4 Final Report
7
Chapter 2: Literature Research
Over years, a lot of research has been conducted on identifying the significant factors that affect
the pedestrian safety, including environmental factors, roadway characteristics factors, and
vehicle characteristics factors, and pedestrian characteristic factors. Environmental factors
included time of day, lighting conditions, etc. Chang et al. found that 26% of pedestrian crashes
occurred from 3 p.m. to 6 p.m. in Chicago, which was the period with most occurrences (Chang,
2008). However, NHTSA found that 24.7% percent of pedestrian deaths were between 6 p.m.
and 9 p.m. which was the highest number of pedestrian deaths of the whole day (NHTSA, 2011).
Weather and lighting condition factors were also of common concerns. Other studies showed
that poor lighting conditions lead to increase the likelihood of pedestrian injuries (Clifton et al.,
2009; Mohamed et al., 2013). Roadway characteristic factors include locations, roadway type,
speed limit, pavement marking, etc. Turner et al. investigated roadway factors in an urban area
in New Zealand (Tuner et al., 2006). They found that 56% of accidents occurred at mid-block
locations, which were the highest among urban pedestrian accident locations. Lee and Abdel-
Aty used four years of vehicle-pedestrian crashes data from 1999 to 2002 in Florida to identify
roadway characteristics that were correlated with high pedestrian crashes using a log-linear
model (Lee & Abdel-Aty, 2005). They found that undivided roads with a greater number of
lanes were more dangerous than divided roads with fewer lanes. Ukkusuri et al. developed
pedestrian accident frequency models for New York City and found that more pedestrian
crashes were associated with larger road width and road width was related to operating speeds,
length of crosswalks and traffic volume (Ukkusuri et al., 2012). In addition, some studies
pointed out that certain treatments such as yield pavement marking were effective in improve
the pedestrian safety (Turner et al., 2006; Huybers & Van, 2004). Vehicle characteristics factors
included vehicle type, vehicle speed, etc. 68% of the involved vehicles were passenger cars and
32% were other light vehicles, including light trucks, vans, and utility vehicles (Chidester &
Isenerg, 2001). However, although the truck was not the highest number in vehicle types, the
influence of truck flow at intersections with high pedestrian activity was found to be one of the
crash factors associated with the most severe injuries (Mohamed et al., 2013). Many studies
have focused on the vehicle speed for pedestrian crashes and pedestrian injury severities. Han
et al. used two finite element pedestrian models and four finite element models for vehicles
with different front-end shapes to evaluate pedestrian injury severities (Han et al., 2012). The
authors found that vehicle speed was the significant factor in injury severity and the speed
below 30 km/h can reduce all injury parameters, which is similar to the findings of Pitt et al.
(1990). Pedestrian characteristic factors included age, gender, dressing color. Harrell found that
vehicles were more likely to yield pedestrians with bright color clothes than dark color clothes
(Harrell, 1994). The similar result was found by Porter (2016). In this study, four factors were
selected from the literature above to analyse the drivers’ behavior during the pedestrian-vehicle
conflict period. They are time of day, roadway type, pavement marking, and pedestrian dressing
color.
8
Due to the difficulty of data acquisition and data quality of collision based safety analysis, the
traffic conflicts technique has been widely used for evaluating safety issues (Ismail et sl., 2009).
To do such analysis, the trajectory data are the most important sources (De Blasiis et al, 2017;
Adler & Jenkins, 1993). A number of researchers used simulation models for obtaining the
trajectory data and evaluating the pedestrian safety due to their robustness (Huang et al., 2013;
Wu et al., 2016; Zhou et al., 2010). However, since the interactions between vehicles and
pedestrians are very complicated and some of the factors cannot be reflected in the simulation
model, there is no simulation models that were well developed for pedestrian-vehicle conflicts.
For example, VISSIM and SSAM are widely used in traffic conflict analysis. However, they
only allow users to define the priority rule for pedestrians and vehicle. Some important factors,
such as time of day, pavement marking, pedestrian dressing color, cannot be applied in these
simulation models (Lu et al., 2016). In addition, computer vision technology also made it
possible to apply automated conflict analysis to pedestrian safety evaluation by using the real
videos (Saunier & Sayed, 2007). Although this method could acquire the accurate data, it cannot
obtain the drivers’ information and pedestrian’s information, such as gender, age. Therefore,
this study uses the driving simulator to acquire the pedestrian-vehicle conflicts data. Several
studies addressed vehicle-vehicle conflicts, but there is no research about the pedestrian-vehicle
conflicts by using the driving simulator.
The modern driving simulator is usually built with the simulation software using a sophisticated
driving environment which can give drivers on board impression that drivers feel that they drive
in an actual vehicle. The biggest advantage of the driving simulator is that it has the ability to
simulate dangerous driving situations in a safe environment, which make it easier for
researchers to test driving behaviors (Underwood et al., 2011; Yan et al., 2016; Tu et al., 2015).
Several studies show the high potential and reliability of driving simulator for studying the
pedestrian safety. Chrysler et al. (2015) tested pedestrian crash scenarios for drivers’ behavior
evaluations in the driving simulator. The significant results proved that virtual scenarios in the
driving simulator could serve as safe tool to test drivers’ response to pedestrian crossings. Bella
& Silvestri (2015) conducted a multi-factorial experiment in the driving simulator and test the
three safety countermeasures at pedestrian crossings. They analyzed the drivers’ speed and
came to the conclusion that the curb extension was the best countermeasures, which was
accordance with the questionnaire results. Yuan et al. (2013) combined driving simulator and
computer simulation to reconstruct the process of pedestrian-vehicle crash. The purpose of this
study was to find out the relation between drivers’ various emergency measures and pedestrians’
injury severity. The findings indicated that the most effective way to reduce injury severity was
steering with braking. Boot et al. (2003) invited 63 participants to do the driving simulator
experiment in order to test the new pedestrian marking, which was called special emphasis
marking. All the participants were divided into three different age groups and a 3D model of
an intersection was created in the driving simulator. The results showed that drivers could
recognize the special emphasis marking much more quickly than the normal crosswalk marking.

9
Moreover, when there was a pedestrian crossing the street, drivers were not affected by the
special emphasis marking.
10
Chapter 3: Methodology
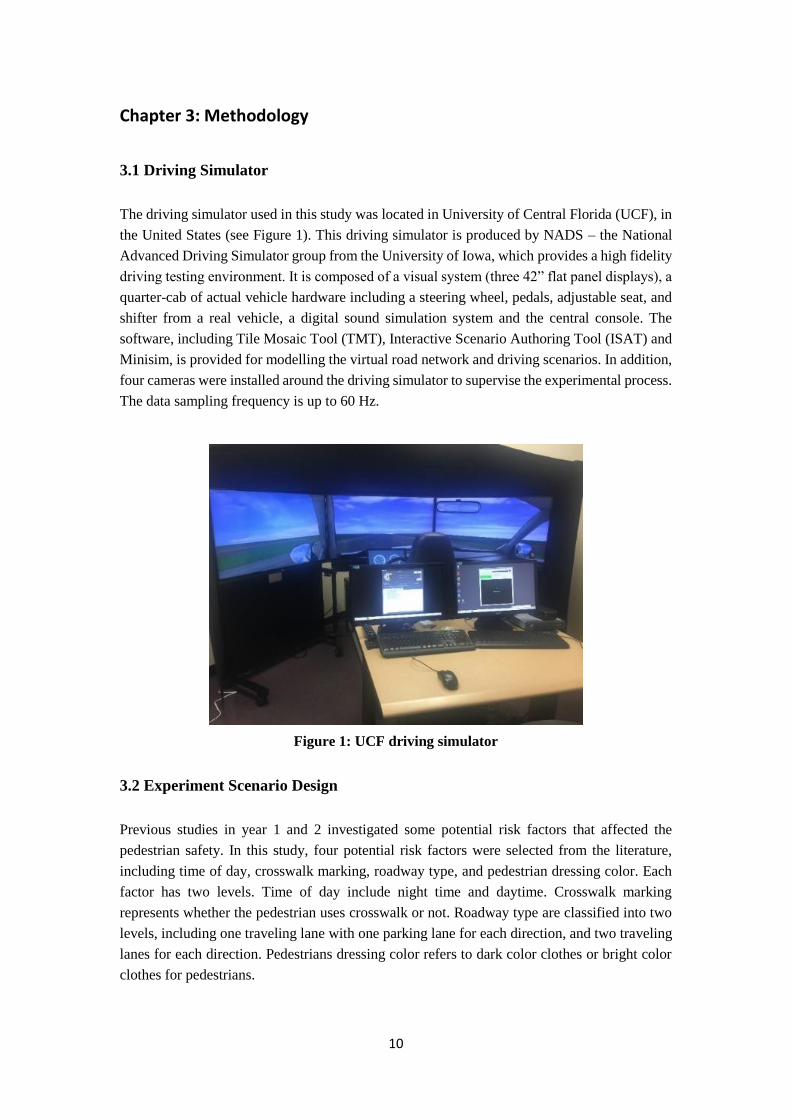
3.1 Driving Simulator
The driving simulator used in this study was located in University of Central Florida (UCF), in
the United States (see Figure 1). This driving simulator is produced by NADS – the National
Advanced Driving Simulator group from the University of Iowa, which provides a high fidelity
driving testing environment. It is composed of a visual system (three 42” flat panel displays), a
quarter-cab of actual vehicle hardware including a steering wheel, pedals, adjustable seat, and
shifter from a real vehicle, a digital sound simulation system and the central console. The
software, including Tile Mosaic Tool (TMT), Interactive Scenario Authoring Tool (ISAT) and
Minisim, is provided for modelling the virtual road network and driving scenarios. In addition,
four cameras were installed around the driving simulator to supervise the experimental process.
The data sampling frequency is up to 60 Hz.
Figure 1: UCF driving simulator
3.2 Experiment Scenario Design
Previous studies in year 1 and 2 investigated some potential risk factors that affected the
pedestrian safety. In this study, four potential risk factors were selected from the literature,
including time of day, crosswalk marking, roadway type, and pedestrian dressing color. Each
factor has two levels. Time of day include night time and daytime. Crosswalk marking
represents whether the pedestrian uses crosswalk or not. Roadway type are classified into two
levels, including one traveling lane with one parking lane for each direction, and two traveling
lanes for each direction. Pedestrians dressing color refers to dark color clothes or bright color
clothes for pedestrians.
11
The road network created for this study was around 3.5 miles long with the speed limit of 40
mph in urban area. The environmental vehicle flow was designed in the roadway network to
make the driving scenario more realistic. In order to exclude the outside interference, there is
no other vehicle in front of the simulator vehicle. This experiment utilized a within-subjects
full factorial design to test four potential risk factors. There were two sub-scenarios, including
daytime driving scenario and night time driving scenario. Each sub-scenario has 8 midblock
crossings and drivers will encounter the pedestrian 8 times for each sub-scenario. To ensure the
same approaching conditions, the distance between each midblock crossing was around 1,500
ft, which allowed drivers to reach a congruous speed for the midblock crossings.
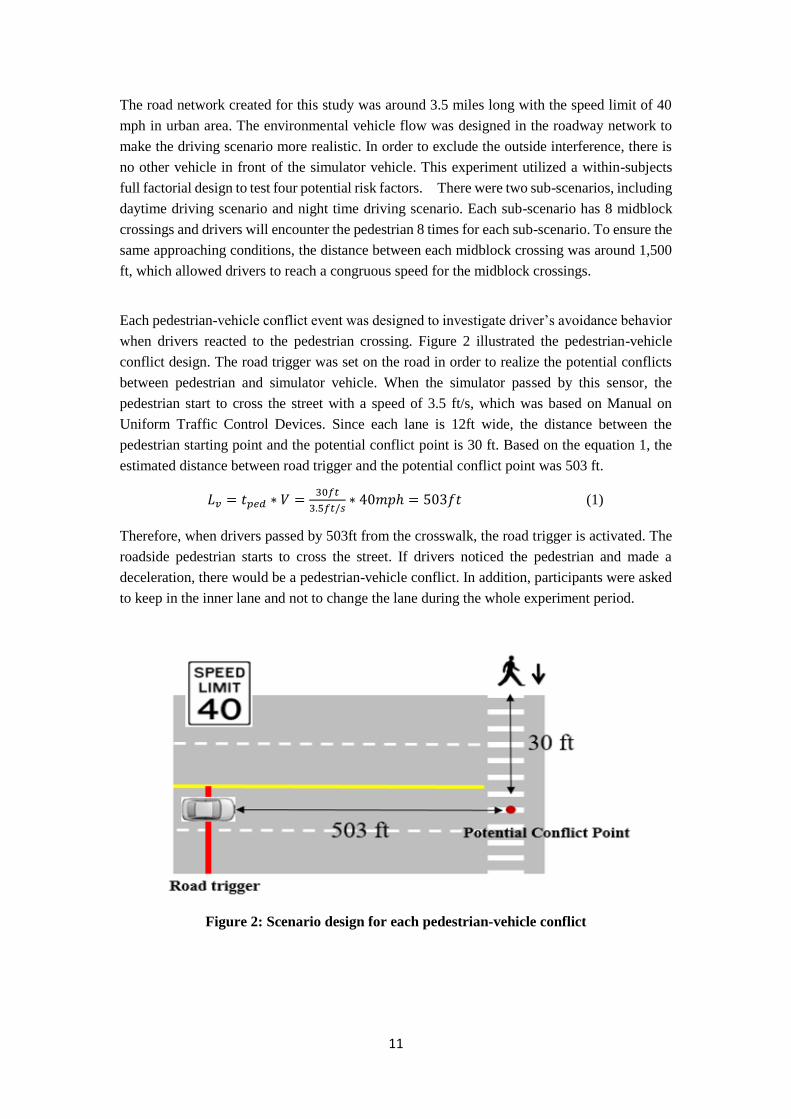
Each pedestrian-vehicle conflict event was designed to investigate driver’s avoidance behavior
when drivers reacted to the pedestrian crossing. Figure 2 illustrated the pedestrian-vehicle
conflict design. The road trigger was set on the road in order to realize the potential conflicts
between pedestrian and simulator vehicle. When the simulator passed by this sensor, the
pedestrian start to cross the street with a speed of 3.5 ft/s, which was based on Manual on
Uniform Traffic Control Devices. Since each lane is 12ft wide, the distance between the
pedestrian starting point and the potential conflict point is 30 ft. Based on the equation 1, the
estimated distance between road trigger and the potential conflict point was 503 ft.
𝐿𝑣 = 𝑡𝑝𝑒𝑑 ∗ 𝑉 =30𝑓𝑡
3.5𝑓𝑡/𝑠∗ 40𝑚𝑝ℎ = 503𝑓𝑡 (1)
Therefore, when drivers passed by 503ft from the crosswalk, the road trigger is activated. The
roadside pedestrian starts to cross the street. If drivers noticed the pedestrian and made a
deceleration, there would be a pedestrian-vehicle conflict. In addition, participants were asked
to keep in the inner lane and not to change the lane during the whole experiment period.
Figure 2: Scenario design for each pedestrian-vehicle conflict
12
3.3 Participants and Experiment Procedure
A total of 67 drivers, who had regular driver licenses, were selected to participate in this
experiment. They were chosen from students, faculty, and staff of the University of Central
Florida and volunteers from outside of the university. Since 8 drivers could not complete the
experiment because of the motion sickness, finally, 59 drivers (28 Males and 31 females)
finished the experiment successfully. In addition, all the participants were divided into two age
groups. The age of the younger group ranges from 20 to 40 years. The age of the older group
ranges from 40 to 60 years. Finally, 36 participants are in the younger group and 23 participants
are in the older group.
Upon arrival, all participants were asked to read and sign an informed consent form (per IRB).
Each participant in this study was asked to take a short training session, including the Traffic
Regulation Education, the Safety Notice and the Familiarity Training. In the Traffic Regulation
Education session, all participants were advised to drive and behave as they normally did and
would also need to follow traffic rules as they did in real-life situations. In the Safety Notice
session, each participant was told that they could quit the experiment at any time if they had
any motion sickness symptoms or any kind of discomfort. In the Familiarity Training session,
each participant was given at least 10 minutes training to familiarize them with the driving
simulator operation, such as straight driving, acceleration, deceleration, left/right turn, and other
basic driving behaviors.
After completing the short training course, participants would start the formal experiment and
test two scenarios in a random sequence so as to eliminate the time order effect. In addition, all
participants were recommended to rest at least 15 minutes between the scenarios.
3.4 Data Collection
To collect the data during the pedestrian-vehicle conflicts, researchers extracted the data from
500 ft in advance of each midblock crossing. There are two conditions that are excluded based
on the pedestrian-vehicle conflict definition. First, drives didn’t yield to the pedestrian and they
accelerated to pass the conflict point before the pedestrian arrived at the conflict point. Second,
there is a crash between vehicle and pedestrian without the deceleration. Therefore, 850
observations were recorded out of 944 conflict events.
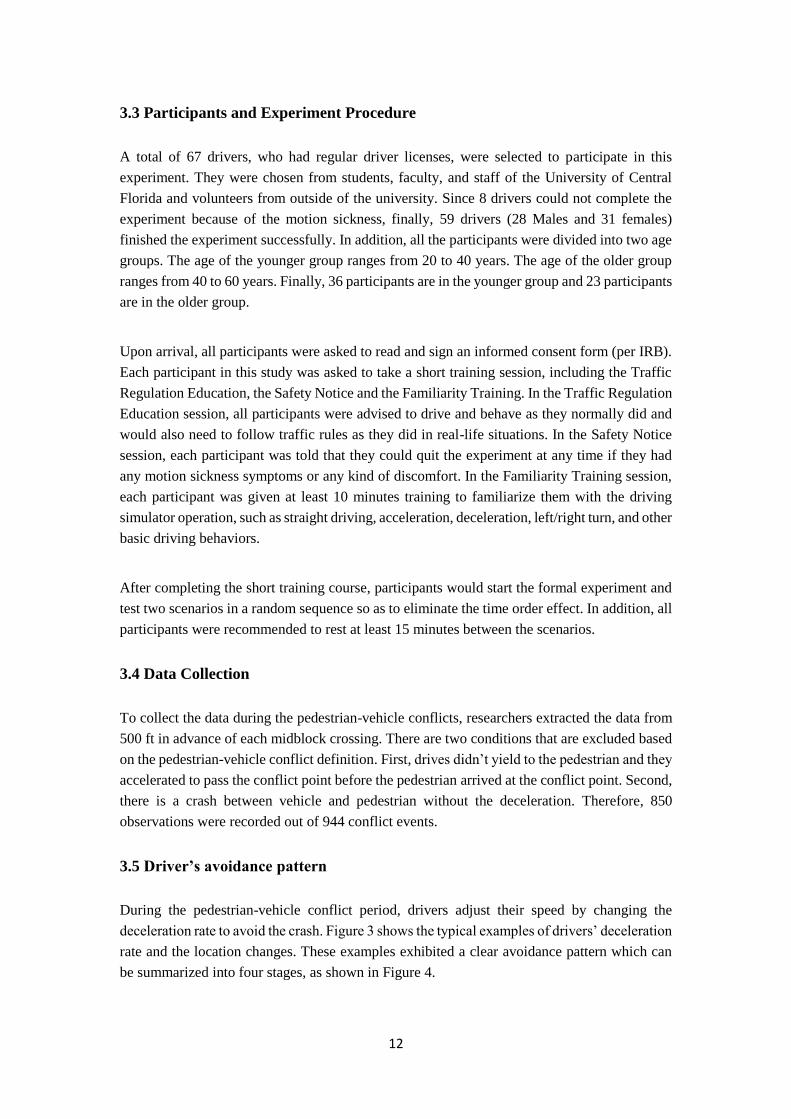
3.5 Driver’s avoidance pattern
During the pedestrian-vehicle conflict period, drivers adjust their speed by changing the
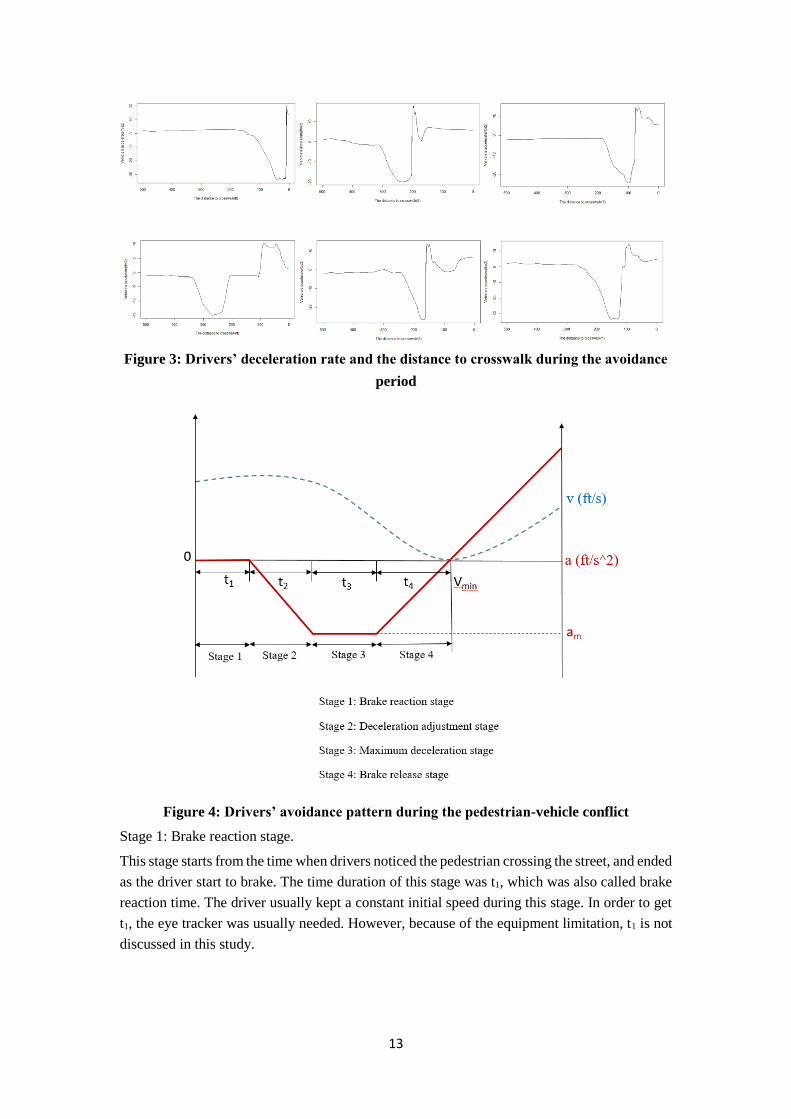
deceleration rate to avoid the crash. Figure 3 shows the typical examples of drivers’ deceleration
rate and the location changes. These examples exhibited a clear avoidance pattern which can
be summarized into four stages, as shown in Figure 4.
13
Figure 3: Drivers’ deceleration rate and the distance to crosswalk during the avoidance
period
Figure 4: Drivers’ avoidance pattern during the pedestrian-vehicle conflict
Stage 1: Brake reaction stage.
This stage starts from the time when drivers noticed the pedestrian crossing the street, and ended
as the driver start to brake. The time duration of this stage was t1, which was also called brake
reaction time. The driver usually kept a constant initial speed during this stage. In order to get
t1, the eye tracker was usually needed. However, because of the equipment limitation, t1 is not
discussed in this study.
14
Stage 2: Deceleration adjustment stage
In this stage, drivers perceived the crash risk because of the sudden pedestrian appearance and
then start to brake until the maximum deceleration. The time duration of this stage was t2. In
addition, the deceleration rate was assumed to be linearly increased.
Stage 3: Maximum deceleration stage
In this stage, drivers reached the maximum deceleration and stayed for a while. Drivers would
release the brake until they could make sure that they won’t hit the pedestrian. The duration
time of this stage was t3 and the maximum deceleration rate was dm.
Stage 4: Break release stage
In this stage, drivers started to release the break. Finally, drivers completely stopped the car or
drivers started to accelerate. The duration time of this stage was t4.
Based on the drivers’ avoidance pattern, the key variables during the pedestrian-vehicle conflict
period were summarized, which include t2 (deceleration adjustment time), t3 (maximum
deceleration time), dm (maximum deceleration rate), and t4 (brake release time).
15
Chapter 4: Driving Simulator Experiment Results and Data Analyses
In this study, analysis of variance (ANOVA) was used to analyse the drivers’ behavior during
the pedestrian-vehicle conflicts period. Two driver’s characteristic (age and gender) and four
potential risk factors were selected as the independent variables and four key variables
summarized above (t2, t3, dm, and t4) are chosen as the dependent variables. The hypothesis
testing in the following analyses are based on a 0.05 significance level.
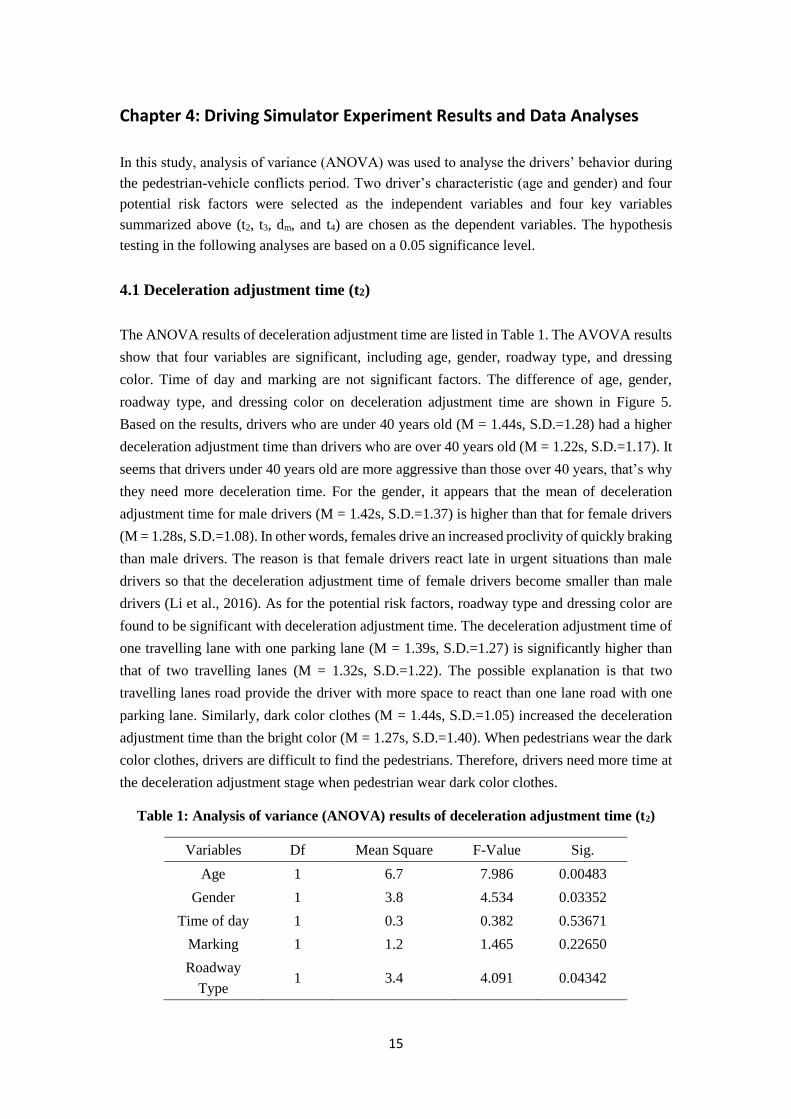
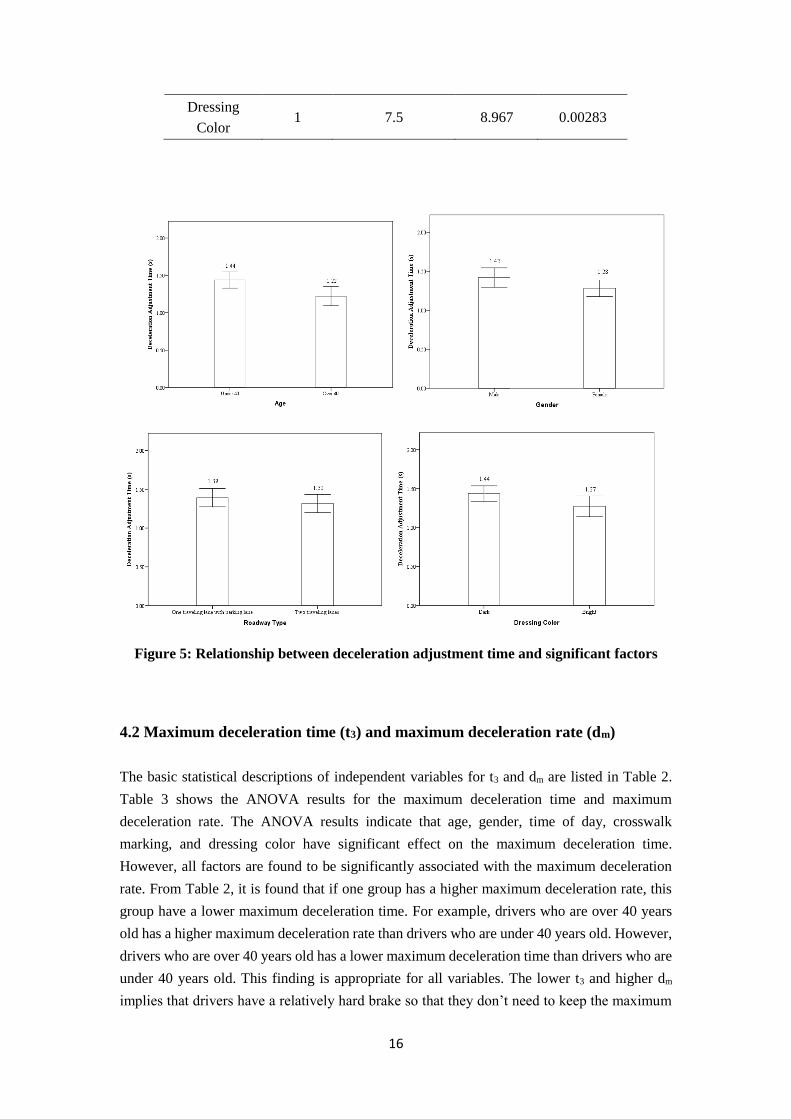
4.1 Deceleration adjustment time (t2)
The ANOVA results of deceleration adjustment time are listed in Table 1. The AVOVA results
show that four variables are significant, including age, gender, roadway type, and dressing
color. Time of day and marking are not significant factors. The difference of age, gender,
roadway type, and dressing color on deceleration adjustment time are shown in Figure 5.
Based on the results, drivers who are under 40 years old (M = 1.44s, S.D.=1.28) had a higher
deceleration adjustment time than drivers who are over 40 years old (M = 1.22s, S.D.=1.17). It
seems that drivers under 40 years old are more aggressive than those over 40 years, that’s why
they need more deceleration time. For the gender, it appears that the mean of deceleration
adjustment time for male drivers (M = 1.42s, S.D.=1.37) is higher than that for female drivers
(M = 1.28s, S.D.=1.08). In other words, females drive an increased proclivity of quickly braking
than male drivers. The reason is that female drivers react late in urgent situations than male
drivers so that the deceleration adjustment time of female drivers become smaller than male
drivers (Li et al., 2016). As for the potential risk factors, roadway type and dressing color are
found to be significant with deceleration adjustment time. The deceleration adjustment time of
one travelling lane with one parking lane (M = 1.39s, S.D.=1.27) is significantly higher than
that of two travelling lanes (M = 1.32s, S.D.=1.22). The possible explanation is that two
travelling lanes road provide the driver with more space to react than one lane road with one
parking lane. Similarly, dark color clothes (M = 1.44s, S.D.=1.05) increased the deceleration
adjustment time than the bright color (M = 1.27s, S.D.=1.40). When pedestrians wear the dark
color clothes, drivers are difficult to find the pedestrians. Therefore, drivers need more time at
the deceleration adjustment stage when pedestrian wear dark color clothes.
Table 1: Analysis of variance (ANOVA) results of deceleration adjustment time (t2)
Variables Df Mean Square F-Value Sig.
Age 1 6.7 7.986 0.00483
Gender 1 3.8 4.534 0.03352
Time of day 1 0.3 0.382 0.53671
Marking 1 1.2 1.465 0.22650
Roadway
Type 1 3.4 4.091 0.04342
16
Dressing
Color 1 7.5 8.967 0.00283
Figure 5: Relationship between deceleration adjustment time and significant factors
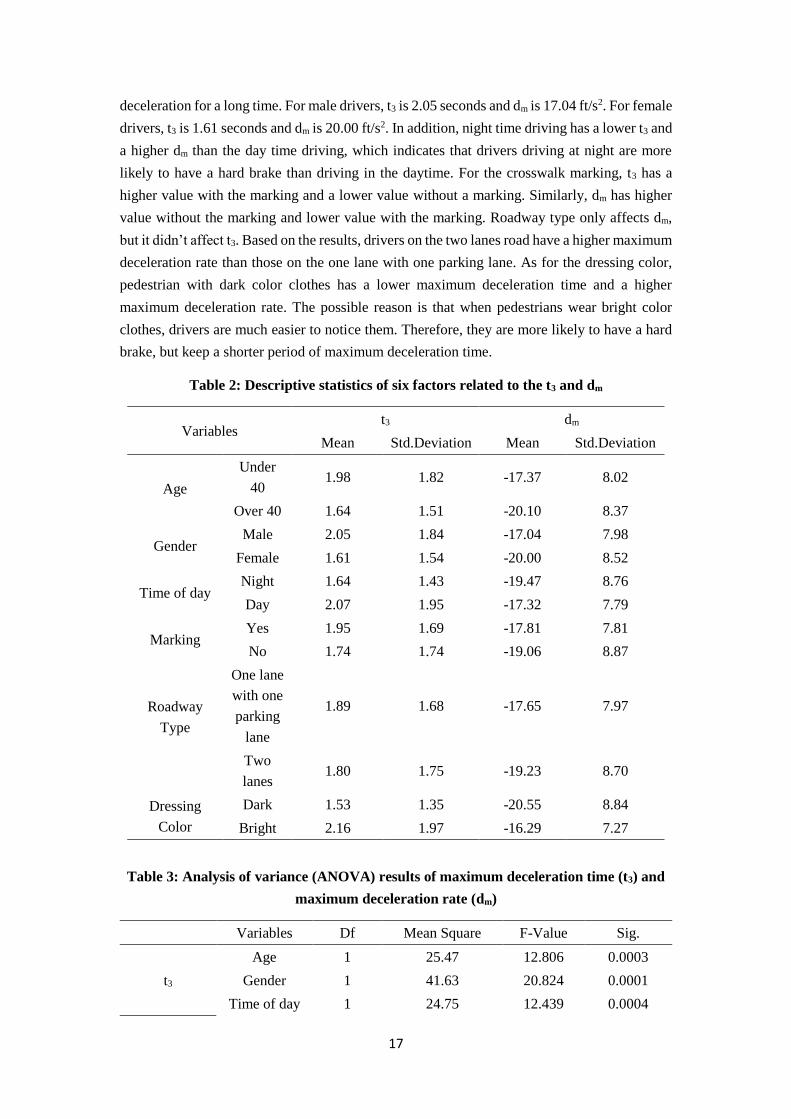
4.2 Maximum deceleration time (t3) and maximum deceleration rate (dm)
The basic statistical descriptions of independent variables for t3 and dm are listed in Table 2.
Table 3 shows the ANOVA results for the maximum deceleration time and maximum
deceleration rate. The ANOVA results indicate that age, gender, time of day, crosswalk
marking, and dressing color have significant effect on the maximum deceleration time.
However, all factors are found to be significantly associated with the maximum deceleration
rate. From Table 2, it is found that if one group has a higher maximum deceleration rate, this
group have a lower maximum deceleration time. For example, drivers who are over 40 years
old has a higher maximum deceleration rate than drivers who are under 40 years old. However,
drivers who are over 40 years old has a lower maximum deceleration time than drivers who are
under 40 years old. This finding is appropriate for all variables. The lower t3 and higher dm
implies that drivers have a relatively hard brake so that they don’t need to keep the maximum
17
deceleration for a long time. For male drivers, t3 is 2.05 seconds and dm is 17.04 ft/s2. For female
drivers, t3 is 1.61 seconds and dm is 20.00 ft/s2. In addition, night time driving has a lower t3 and
a higher dm than the day time driving, which indicates that drivers driving at night are more
likely to have a hard brake than driving in the daytime. For the crosswalk marking, t3 has a
higher value with the marking and a lower value without a marking. Similarly, dm has higher
value without the marking and lower value with the marking. Roadway type only affects dm,
but it didn’t affect t3. Based on the results, drivers on the two lanes road have a higher maximum
deceleration rate than those on the one lane with one parking lane. As for the dressing color,
pedestrian with dark color clothes has a lower maximum deceleration time and a higher
maximum deceleration rate. The possible reason is that when pedestrians wear bright color
clothes, drivers are much easier to notice them. Therefore, they are more likely to have a hard
brake, but keep a shorter period of maximum deceleration time.
Table 2: Descriptive statistics of six factors related to the t3 and dm
Variables t3 dm
Mean Std.Deviation Mean Std.Deviation
Age
Under
40 1.98 1.82 -17.37 8.02
Over 40 1.64 1.51 -20.10 8.37
Gender Male 2.05 1.84 -17.04 7.98
Female 1.61 1.54 -20.00 8.52
Time of day Night 1.64 1.43 -19.47 8.76
Day 2.07 1.95 -17.32 7.79
Marking Yes 1.95 1.69 -17.81 7.81
No 1.74 1.74 -19.06 8.87
Roadway
Type
One lane
with one
parking
lane
1.89 1.68 -17.65 7.97
Two
lanes 1.80 1.75 -19.23 8.70
Dressing
Color
Dark 1.53 1.35 -20.55 8.84
Bright 2.16 1.97 -16.29 7.27
Table 3: Analysis of variance (ANOVA) results of maximum deceleration time (t3) and
maximum deceleration rate (dm)
Variables Df Mean Square F-Value Sig.
t3
Age 1 25.47 12.806 0.0003
Gender 1 41.63 20.824 0.0001
Time of day 1 24.75 12.439 0.0004
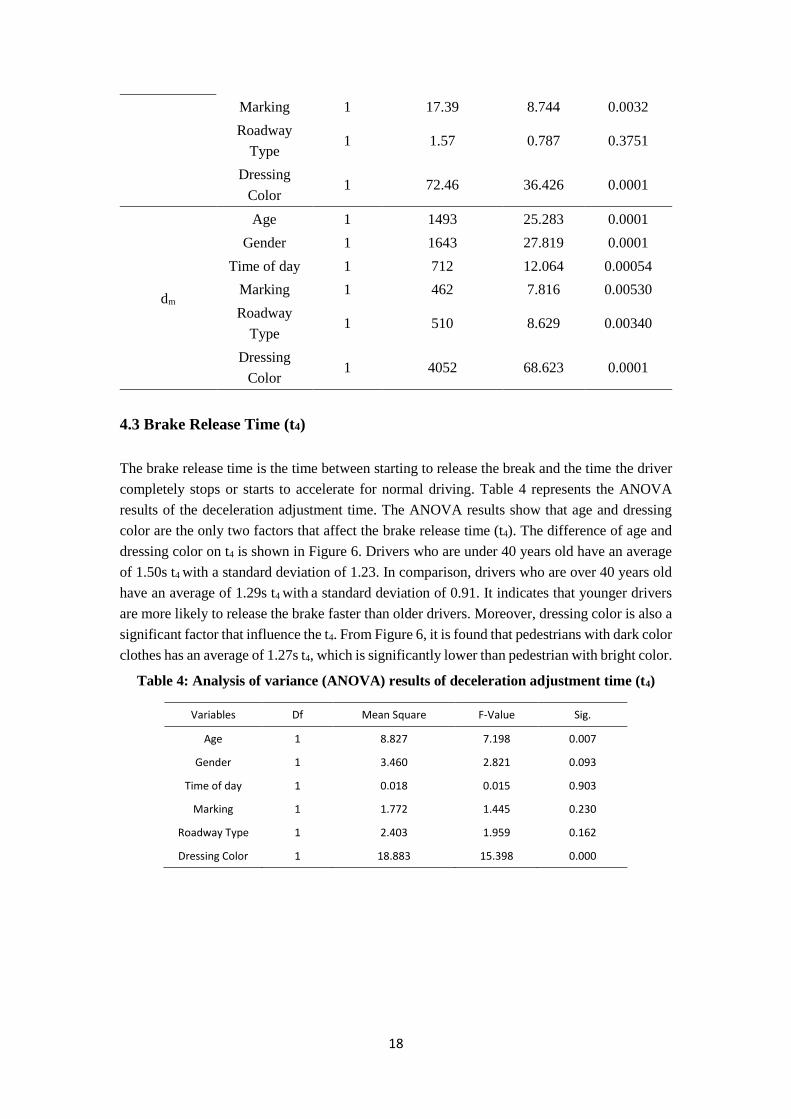
18
Marking 1 17.39 8.744 0.0032
Roadway
Type 1 1.57 0.787 0.3751
Dressing
Color 1 72.46 36.426 0.0001
dm
Age 1 1493 25.283 0.0001
Gender 1 1643 27.819 0.0001
Time of day 1 712 12.064 0.00054
Marking 1 462 7.816 0.00530
Roadway
Type 1 510 8.629 0.00340
Dressing
Color 1 4052 68.623 0.0001
4.3 Brake Release Time (t4)
The brake release time is the time between starting to release the break and the time the driver
completely stops or starts to accelerate for normal driving. Table 4 represents the ANOVA
results of the deceleration adjustment time. The ANOVA results show that age and dressing
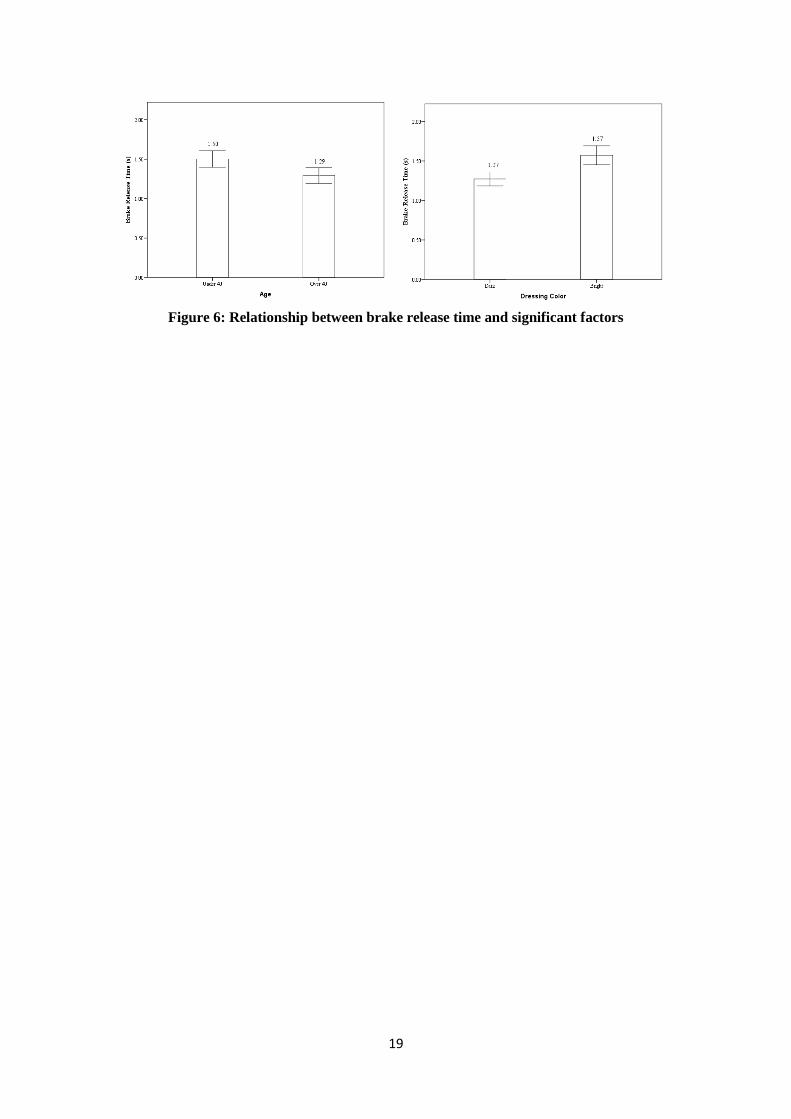
color are the only two factors that affect the brake release time (t4). The difference of age and
dressing color on t4 is shown in Figure 6. Drivers who are under 40 years old have an average
of 1.50s t4 with a standard deviation of 1.23. In comparison, drivers who are over 40 years old
have an average of 1.29s t4 with a standard deviation of 0.91. It indicates that younger drivers
are more likely to release the brake faster than older drivers. Moreover, dressing color is also a
significant factor that influence the t4. From Figure 6, it is found that pedestrians with dark color
clothes has an average of 1.27s t4, which is significantly lower than pedestrian with bright color.
Table 4: Analysis of variance (ANOVA) results of deceleration adjustment time (t4)
Variables Df Mean Square F-Value Sig.
Age 1 8.827 7.198 0.007
Gender 1 3.460 2.821 0.093
Time of day 1 0.018 0.015 0.903
Marking 1 1.772 1.445 0.230
Roadway Type 1 2.403 1.959 0.162
Dressing Color 1 18.883 15.398 0.000
19
Figure 6: Relationship between brake release time and significant factors
20
Chapter 5: Conclusions
Pedestrian-vehicle crashes happen infrequently, so it is hard to capture how pedestrian-vehicle
crash occurs. However, the pedestrian-vehicle conflict methodology is an improved way to
study this phenomenon. Therefore, this study investigated drivers’ behaviors of the pedestrian-
vehicle conflict at midblock crossings in the driving simulator. The scenarios were designed
for the pedestrian-vehicle conflict with different potential risk factors. Finally, 59 subjects
finished the driving simulator experiment and data were collected and analyzed.
First, driver’s avoidance behavior pattern was summarized during the pedestrian-vehicle
conflict. There are four stages showing that how drivers react to the pedestrian conflict,
including brake reaction stage, deceleration adjustment stage, maximum deceleration stage, and
brake release stage. Based on the driver’s avoidance behavior pattern, four key variables are
elected from the data, which include deceleration adjustment time, maximum deceleration rate,
maximum deceleration time, and brake release time. Then, driver’s characteristics variables
(age and gender) and potential risk factors (time of day, marking, roadway type, and dressing
color) were analysed to study their effect on the four key variables using the ANOVA. The
results indicate that age, gender, roadway type, and dressing color have significant effect on the
deceleration adjustment time. However, Time of day, and crosswalk marking has no effect on
the deceleration adjustment time. In addition, age, gender, time of day, marking, and dressing
color impact the maximum deceleration time. Among those, under 40 years old group, male
drivers, daylight driving, crosswalk with marking, and bright color clothes increase the
maximum deceleration time. On the contrary, under 40 years old group, male drivers, daylight
driving, crosswalk with marking, and bright color clothes decreased the maximum deceleration
rate. However, the roadway type only affects the maximum deceleration rate, and doesn’t
influence the maximum deceleration time. One lane with parking lane road has a higher
deceleration rate than two-lane road. Last, age and dressing color are found to be significantly
associated with the brake release time. Drivers who are over 40 years old have a lower brake
release time than drivers who are under 40 years old. In addition, pedestrians with dark color
clothes increased the brake release time than pedestrian with bright color clothes.
21
Reference
Adler, J. L., Recker, W. W., & McNally, M. G. (1993). A conflict model and interactive
simulator (FASTCARS) for predicting enroute driver behavior in response to real-time traffic
condition information. Transportation, 20(2), 83-106.
Boot, W., Charness, N., Stothart, C., Fox, M., Mitchum, A., Lupton, H., & Landbeck, R., 2013.
Final Report: Aging Road User, Bicyclist, and Pedestrian Safety: Effective Bicycling Signs and
Preventing Left-Turn Crashes BDK83 977-15.
Chang, D. (2008). National Pedestrian Crash Report.
Chidester, A. B., & Isenberg, R. A. (2001). Final report: The pedestrian crash data study.
Society of Automotive Engineers.
Chrysler, S. T., Ahmad, O., & Schwarz, C. W., 2015. Creating pedestrian crash scenarios in a
driving simulator environment. Traffic injury prevention,16(sup1), S12-S17.
Clifton, K. J., Burnier, C. V., & Akar, G. (2009). Severity of injury resulting from pedestrian-
vehicle crashes: What can we learn from examining the built environment? Transportation
Research Part D: Transport and Environment, 14(6), 425-436.
De Blasiis, M. R., Ferrante, C., Santilli, A., & Veraldi, V. (2017). Driving Behavior in
Weaving Maneuver: A Driving Simulator Study. In Advances in Human Aspects of
Transportation (pp. 313-325). Springer International Publishing.
Han, Y., Yang, J., Mizuno, K., & Matsui, Y. (2012). Effects of vehicle impact velocity,
vehicle front-end shapes on pedestrian injury risk. Traffic Injury Prevention, 13(5), 507-518.
Harrell, W.A. (1994). Effects of pedestrians’ visibility and signs on motoriests’ yielding.
Percept. Mot. Skills 78 (2),355-362.
Huang, F., Liu, P., Yu, H., & Wang, W. (2013). Identifying if VISSIM simulation model and
SSAM provide reasonable estimates for field measured traffic conflicts at signalized
intersections. Accident Analysis & Prevention, 50, 1014-1024.
Huybers, S., Van Houten Malenfant, R.J.E.L. (2004). Reducing conflicts between motor
vehicles and pedestriansL the separate and combined effects of pavement markings and a sign
prompt. J. Appl. Behav. Anal. 37(4), 445-456.
Ismail, K., Sayed, T., Saunier, N., Lim, C. (2009). Autmated analysis of pedestrian-vehicle
conflicts using video data. Transp. Res. Rec. J. Board 2140, 44-54.
Lee, C., & Abdel-Aty, M. (2005). Comprehensive analysis of vehicle-pedestrian crashes at
intersections in Florida. Accident Analysis and Prevention, 37(4), 775-786.
Li, X., Yan, X., Wu, J., Radwan, E., & Zhang, Y. (2016). A rear-end collision risk
assessment model based on drivers’ collision avoidance process under influences of
cell phone use and gender—A driving simulator based study. Accident Analysis &
Prevention, 97, 1-18.
Lu, L., Ren, G., Wang, W., Chan, C. Y., & Wang, J. (2016). A cellular automaton simulation
model for pedestrian and vehicle interaction behaviors at unsignalized mid-block crosswalks.
Accident Analysis & Prevention, 95, 425-437.
22
Mohamed, M. G., Saunier, N., Miranda-Moreno, L. F., & Ukkusuri, S. V. (2013). A
clustering regression approach: A comprehensive injury severity analysis of pedestrian–
vehicle crashes in New York, US and Montreal, Canada. Safety Science, 54, 27-37.
National Highway Safety Adminstration, N. H. T. S. (2011). Traffic Safety Facts 2011 data.
Pitt, R., Guyer, B., Hsieh, C. & Malekt, M. (1990). The severity of pedestrian injuries in
children: an analysis of the pedestrian injury causation study. Accident Analysis and
Prevention, 22(6), 549-560.
Porter, B. E., Neto, I., Balk, I., & Jenkins, J. K. (2016). Investigating the effects of
Rectangular Rapid Flash Beacons on pedestrian behavior and driver yielding on 25mph
streets: A quasi-experimental field study on a university campus. Transportation Research
Part F: Traffic Psychology and Behaviour.
Refer Bella, F., & Silvestri, M., 2015. Effects of safety measures on driver's speed behavior at
pedestrian crossings. Accident Analysis & Prevention, 83, 111-124.
Saunier, N., & Sayed, T. (2007). Automated analysis of road safety with video data.
Transportation Research Record: Journal of the Transportation Research Board, (2019), 57-
64.
Tu, H., Li, Z., Li, H., Zhang, K., & Sun, L., 2015. Driving Simulator Fidelity and Emergency
Driving Behavior. Transportation Research Record: Journal of the Transportation Research
Board, (2518), 113-121.
Turner, S.A. & Roozenburg, A.P. (2006). Predicting Accident Rates for Cyclists and
Pedestrians.
Turner, S., Fitzpatrick, K., Brewer, M., Park, E. (2006). Motorist Yielding to Pedestrians at
Unsignilzed Intersections: Findings from a National Study on Improving Pedestrian Safety.
Ukkusuri, S., Miranda-Moreno, L. F., Ramadurai, G., & Isa-Tavarez, J. (2012). The role of
built environment on pedestrian crash frequency. Safety Science, 50(4), 1141-1151.
Underwood, G., Crundall, D., & Chapman, P., 2011. Driving simulator validation with hazard
perception. Transportation research part F: traffic psychology and behaviour, 14(6), 435-446.
Wu, J., Radwan, E., & Abou-Senna, H. (2016). Pedestrian-vehicle conflict analysis at
signalized intersections using micro-simulation. In 17th International Conference Road Safety
On Five Continents (RS5C 2016), Rio de Janeiro, Brazil, 17-19 May 2016.. Statens väg-och
transportforskningsinstitut.
Yan, X., Wang, J., & Wu, J., 2016. Effect of In-Vehicle Audio Warning System on Driver’s
Speed Control Performance in Transition Zones from Rural Areas to Urban Areas. International
Journal of Environmental Research and Public Health, 13(7), 634.
Yuan, Q., Li, Y., Liao, Y., & Tang, S., 2013. Study of Correlation between Driver Emergency
Measures and Pedestrian Injury Based on Combined Driving Simulator and Computer
Simulation. Advances in Mechanical Engineering, 5, 171479.
Zhou, S. E., Li, K., Sun, J., & Han, P. (2010). Calibration and validation procedure for
intersection safety simulation using SSAM and VISSIM. In ICCTP 2010: Integrated
Transportation Systems: Green, Intelligent, Reliable (pp. 603-615).
23
Appendix A: IRB Approval Letter

24